the startling differences between hosted by: cmbs 1.0,...
TRANSCRIPT
The Startling Differences Between CMBS 1.0, 2.0 & 3.0
WELCOME TO THIS INFORMATIVE WEBINAR
Hosted by:
The Startling Differences Between CMBS 1.0, 2.0 & 3.0
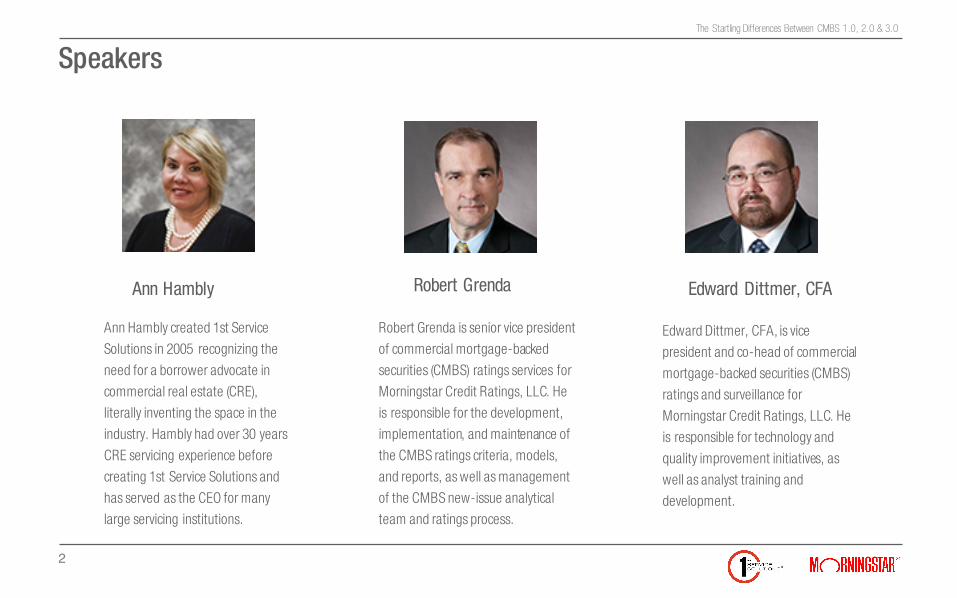
Speakers
Ann Hambly created 1st Service
Solutions in 2005 recognizing the
need for a borrower advocate in
commercial real estate (CRE),
literally inventing the space in the
industry. Hambly had over 30 years
CRE servicing experience before
creating 1st Service Solutions and
has served as the CEO for many
large servicing institutions.
Ann Hambly
2
Robert Grenda Edward Dittmer, CFA
Robert Grenda is senior vice president
of commercial mortgage-backed
securities (CMBS) ratings services for
Morningstar Credit Ratings, LLC. He
is responsible for the development,
implementation, and maintenance of
the CMBS ratings criteria, models,
and reports, as well as management
of the CMBS new-issue analytical
team and ratings process.
Edward Dittmer, CFA, is vice
president and co-head of commercial
mortgage-backed securities (CMBS)
ratings and surveillance for
Morningstar Credit Ratings, LLC. He
is responsible for technology and
quality improvement initiatives, as
well as analyst training and
development.
©2015 Morningstar, Inc. All rights reserved.
The Startling Differences Between CMBS 1.0, 2.0 & 3.0
Robert Grenda, Senior Vice President
Edward P. Dittmer, Vice President
Morningstar Credit Ratings, LLC
CMBS From 1.0 to 3.0: Implications for Today’s Borrower

The Startling Differences Between CMBS 1.0, 2.0 & 3.0
CMBS 1.0 Issuance
$92.60
$166.50
$198.38
$228.56
$12.15 $2.74 $11.63 $6.22 $4.62 $7.41 $3.17 $3.67 $8.70 $26.90
$0.00
$50.00
$100.00
$150.00
$200.00
$250.00
2004 2005 2006 2007 2008 2009 2010
1.0 CMBS Issuance (billions)
CMBS Agency
Source: Commercial Mortgage Alert
4
The Startling Differences Between CMBS 1.0, 2.0 & 3.0
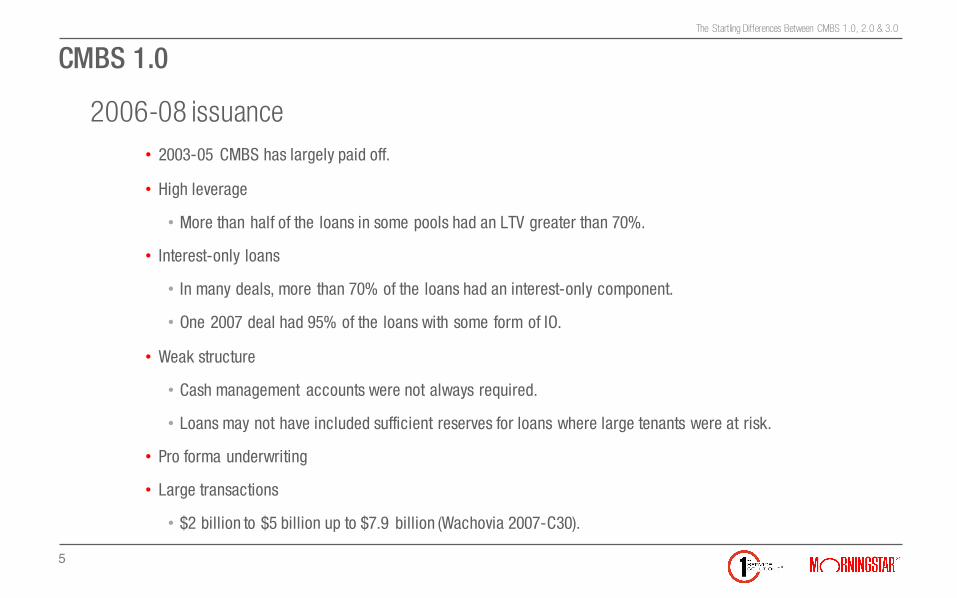
CMBS 1.0
• 2003-05 CMBS has largely paid off.
• High leverage
• More than half of the loans in some pools had an LTV greater than 70%.
• Interest-only loans
• In many deals, more than 70% of the loans had an interest-only component.
• One 2007 deal had 95% of the loans with some form of IO.
• Weak structure
• Cash management accounts were not always required.
• Loans may not have included sufficient reserves for loans where large tenants were at risk.
• Pro forma underwriting
• Large transactions
• $2 billion to $5 billion up to $7.9 billion (Wachovia 2007-C30).
2006-08 issuance
5
The Startling Differences Between CMBS 1.0, 2.0 & 3.0
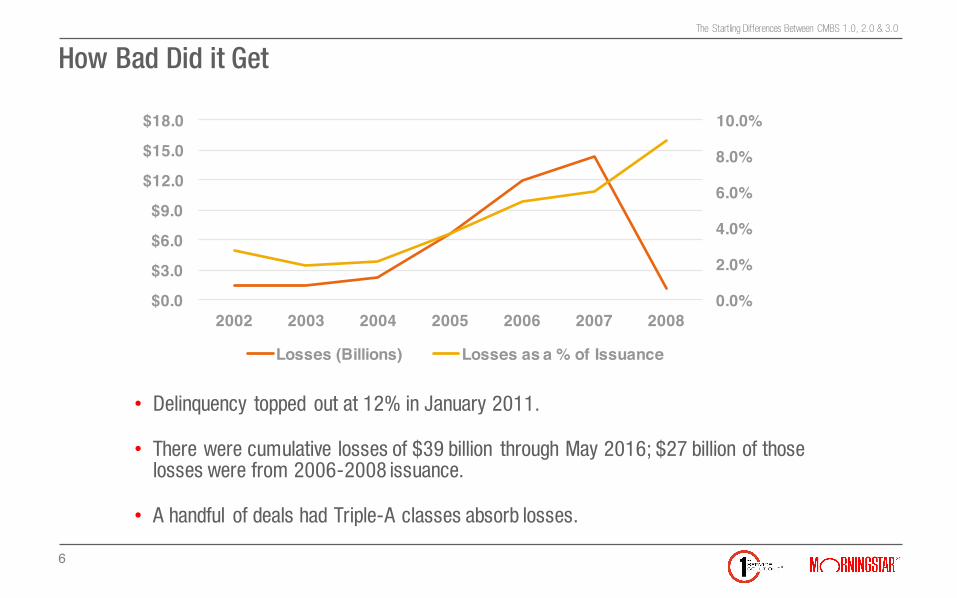
How Bad Did it Get
• Delinquency topped out at 12% in January 2011.
• There were cumulative losses of $39 billion through May 2016; $27 billion of those losses were from 2006-2008 issuance.
• A handful of deals had Triple-A classes absorb losses.
0.0%
2.0%
4.0%
6.0%
8.0%
10.0%
$0.0
$3.0
$6.0
$9.0
$12.0
$15.0
$18.0
2002 2003 2004 2005 2006 2007 2008
Losses (Billions) Losses as a % of Issuance
6
The Startling Differences Between CMBS 1.0, 2.0 & 3.0
There Is Still Pain to Come
• 2016-17 Maturity Wall
• $55 billion in 2016
• $99 billion in 2017
• Morningstar analysis suggests that the payoff rate by the end of 2016 could decrease to as low as 65% from 82% in May 2016.
• In fact, the May 2016 payoff rate was about 66%.
• The payoff rate for 2017 could fall to 60%.
• Loans that were modified during the crisis may still realize losses, as proceeds will not cover B notes.
7
The Startling Differences Between CMBS 1.0, 2.0 & 3.0
What’s Changed in CMBS 2.0/3.0
• New regulatory framework
• Dodd-Frank Act passed in July 2010
• SEC Regulation AB II finalized in September 2014
• Smaller transactions
• Majority of transactions range from $750 million to $1.5 billion
• One single-borrower deal was $3.5 billion
• Greater transparency
• Borrowers must provide more information and have that information become public
• Required cash-management provisions
• Loans are being transferred for failure to establish lockboxes
• Upfront reserves and cash flow sweeps
8
The Startling Differences Between CMBS 1.0, 2.0 & 3.0
CMBS 2.0/3.0 Other Considerations
• Lower leverage
• Fewer loans with additional debt
• Less credit for future or prospective income
• Less allowance for letters of intent
• Fewer full-term interest-only loans
• Started to trend higher in early 2015
• Debt yield has emerged as a constraining factor
• Rating agencies are placing more scrutiny on loans
• Higher credit support levels for deals with high leverage
• B-piece investors are increasingly assertive on “kick-outs”
9
The Startling Differences Between CMBS 1.0, 2.0 & 3.0
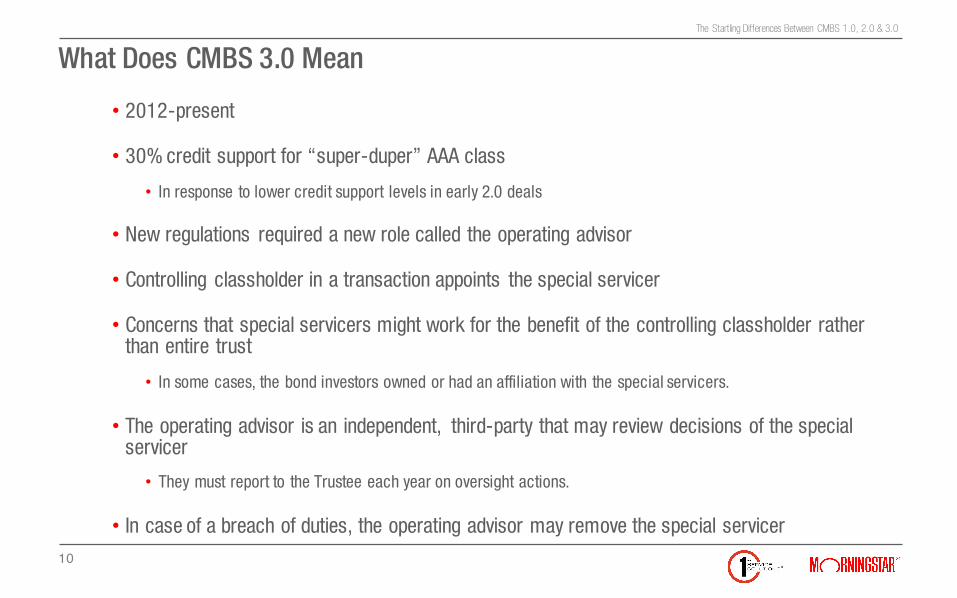
What Does CMBS 3.0 Mean
• 2012-present
• 30% credit support for “super-duper” AAA class
• In response to lower credit support levels in early 2.0 deals
• New regulations required a new role called the operating advisor
• Controlling classholder in a transaction appoints the special servicer
• Concerns that special servicers might work for the benefit of the controlling classholder rather than entire trust
• In some cases, the bond investors owned or had an affiliation with the special servicers.
• The operating advisor is an independent, third-party that may review decisions of the special servicer
• They must report to the Trustee each year on oversight actions.
• In case of a breach of duties, the operating advisor may remove the special servicer
10
The Startling Differences Between CMBS 1.0, 2.0 & 3.0
Regulatory Changes
• Dodd-Frank Act
• Designed to give investors more confidence that they are getting what they thought they were buying.
• Much of the law pertains to the actions of issuers and rating agencies.
• Transparent credit rating methodologies
• Disclosure of ratings history and performance
• Required Internal control structure to ensure that published underwriting methodologies are adhered to
• Reporting and disclosure of any conflicts of interest
• Impact of some rules has resulted in greater scrutiny of loans by both issuers and rating agencies
11
The Startling Differences Between CMBS 1.0, 2.0 & 3.0
Risk Retention
• Rules take effect in December 2016.
• Mandate of Dodd-Frank Act require issuers to retain a 5% slice of a CMBS transaction.
• This new B-piece is larger than historical transactions
• Includes the IO strip in the 5% calculation
• If the risk retention is sold to a third-party investor
• The buyer must hold that piece for a minimum of five years (and possibly 10 years).
• The buyer must finance the risk retention with cash equity rather than debt.
• This could reduce profitability of CMBS issuance and increase the cost of funds.
• Lenders that have to retain the first-loss class on their books may become increasingly wary of loans with concerns, such as near-term lease expiration or exposure to troubled sectors.
• The hope is that this will temper the urge to aggressively underwrite loans.
• Reuters reported in June 2016 that some banks are working on a deal with risk retention to test the regulations.
12
The Startling Differences Between CMBS 1.0, 2.0 & 3.0
Regulation AB II
• Released in September 2014, Took Effect in November 2015
• Designed to Ensure Greater Due Diligence by Issuers
• A top executive of an issuer must certify the accuracy of the information of the offering.
• The certifying executive is liable for civil liabilities.
• Several layers of review to ensure that the CEO can certify the deal.
• Those reviews may increase the time to close transactions, which could increase costs.
• KPMG estimated that banks would have to make “significant investments” in their systems to comply with the rule.
• Some smaller lenders may find the costs too onerous and leave the market.
• Less competition could affect loan pricing.
13
The Startling Differences Between CMBS 1.0, 2.0 & 3.0
Information Requirements
• Loans in the top 20 will be subject to more scrutiny.
• When CMBS deals were $3 billion to $7 billion, a $40 million loan was rare among the 20 largest loans.
• In CMBS 2.0, a $40 million loan is likely to be among the 10 largest and sometimes the five largest loans.
• This will increase the level of review not only by bankers, but also by rating agencies.
• Borrowers will be required to disclose more information publicly.
• Borrowers will be subject to rating agency property visits.
14
The Startling Differences Between CMBS 1.0, 2.0 & 3.0
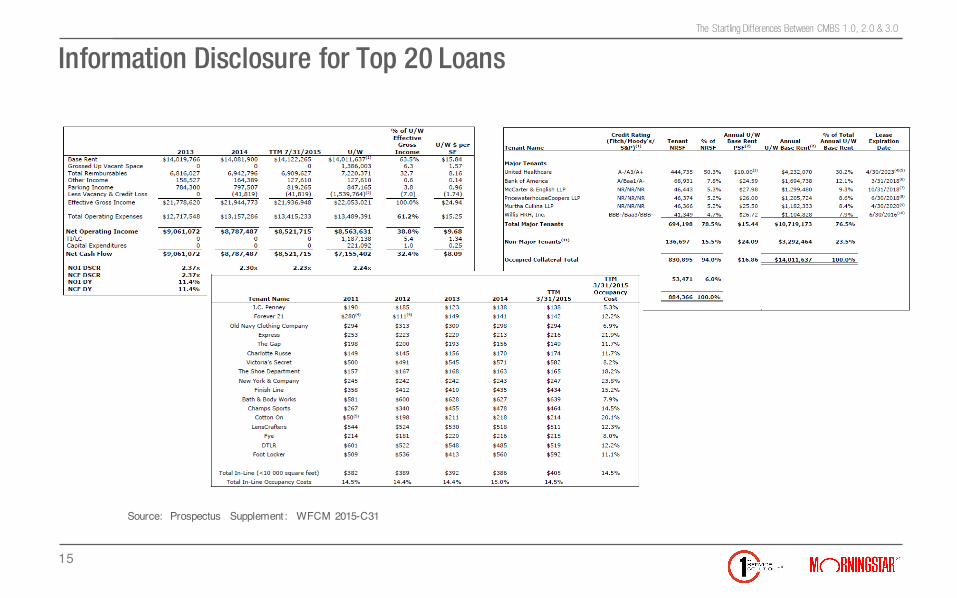
Information Disclosure for Top 20 Loans
Source: Prospectus Supplement: WFCM 2015-C31
15
The Startling Differences Between CMBS 1.0, 2.0 & 3.0
Information Disclosure
• Termination options
• Cotenancy clauses
• Ground lease terms
• Owners of the borrowing entities
• Disclosure of limited partners
• Planned capital expenditure
• Tax abatements
16
The Startling Differences Between CMBS 1.0, 2.0 & 3.0
Information Disclosure of the 21st Largest Loan
• Termination options
• Cotenancy clauses
• Ground lease terms
• Owners of the borrowing entities
• Disclosure of limited partners
• Planned capital expenditure
• Tax abatements
17
The Startling Differences Between CMBS 1.0, 2.0 & 3.0
Information Disclosure of the 21st Largest Loan
18
The Startling Differences Between CMBS 1.0, 2.0 & 3.0
Cash Management
• Lockboxes are not optional
• Upfront reserves
• Leasing costs, property improvement plans
• Cash flow sweeps
• Large tenants with near-term lease expiration
19
The Startling Differences Between CMBS 1.0, 2.0 & 3.0
Fewer Full-Term Interest-Only Loans
• 2007
• 39%, 31%, 55%, 30%, 47%
• 2015
• 30%, 32%, 29%, 21%, 17.5%
• The percentage of IO loans started in increase in 2.0/3.0 until investor concern resulted in an increase in spreads in mid-2015. The lower percentages for 2015 reflect late-2015 issuance.
20
The Startling Differences Between CMBS 1.0, 2.0 & 3.0
Why Did the Rating Agencies Haircut My Loan
• Agencies seek to underwrite a sustainable cash flow
• If rents are above market, then marking rents to market
• If occupancy is above the market, marking occupancy to market in some cases
• Long-term sustainable cap rates
• Cap rates are unlikely to decrease, but could increase
• Tenant concerns
• Credit concerns, large leases expiring, mergers, industry consolidation
• Weak market fundamentals
• Real estate taxes, in particular where abatements are involved
21
The Startling Differences Between CMBS 1.0, 2.0 & 3.0
B-Piece Buyers: Why Did My Loan Get Kicked Out
• Buyers of first-loss classes have become increasingly assertive.
• As many as 30% of the loans were kicked out of deals in 2016.
• These buyers perform a separate analysis to determine the probability of loss on certain loans.
• If they feel that the risk is too high, they can kick a loan from the pool or request a decrease in proceeds.
• Large tenant concentration
• Out-of-favor or potentially troubled property types
• Lenders may have to adjust the loan terms.
22
The Startling Differences Between CMBS 1.0, 2.0 & 3.0
Example of 1.0 Loan Versus 2.0/3.0 Metrics
• Killeen Mall, Texas
• $82 million, interest-only loan, 80% LTV, 1.27x underwritten DSCR
• Underwritten debt yield of 7.5%, 6% implied cap rate on appraised value
• Loan matures in July 2017
• 2015 cash flow is 7% below issuance, 1.17x DSCR, reported occupancy is 100%.
• Of 12 Texas malls securitized in 2.0 deals, average debt yield was 11.3%
• Even at a generous 10% debt yield, the loan sizes to $57 million
• Morningstar forecasts a maturity default with a possible loss
23
The Startling Differences Between CMBS 1.0, 2.0 & 3.0
Once The Deal Closes
• Information requests will continue.
• Rule 17g-5 required deal trustees to establish websites to disseminate information to all rating agencies.
• Rating Agency Q&A section allows agencies to request updates on leasing, tenant status, and sales reports.
• A lender may split the loan to accommodate the structure of some deals.
24
The Startling Differences Between CMBS 1.0, 2.0 & 3.0
How Is CMBS 2.0/3.0 Doing
25
The Startling Differences Between CMBS 1.0, 2.0 & 3.0
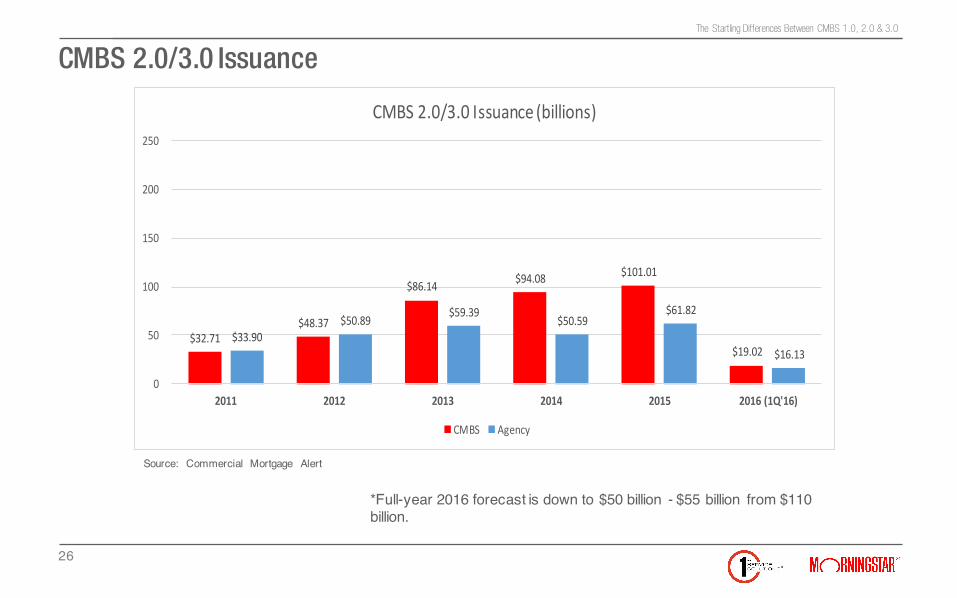
CMBS 2.0/3.0 Issuance
$32.71$48.37
$86.14 $94.08 $101.01
$19.02$33.90
$50.89 $59.39$50.59
$61.82
$16.13
0
50
100
150
200
250
2011 2012 2013 2014 2015 2016(1Q'16)
CMBS2.0/3.0Issuance(billions)
CMBS Agency
*Full-year 2016 forecast is down to $50 billion - $55 billion from $110 billion.
Source: Commercial Mortgage Alert
26
The Startling Differences Between CMBS 1.0, 2.0 & 3.0
Why Did 2016 Issuance Decrease
• Spreads began increasing in mid-2015 as investors became more cautious of fixed income and CMBS.
• AAA spread ranged from 89 to 120 basis points over swaps in summer 2015, but pushed out to 140 to 173 basis points by March 2016.
• Investment-grade BBB- spreads, which were 365 to 440 basis points over swaps in 2015 pushed to 525 to 925.
• Borrower got retraded as originators lost money on early 2016 issuance.
• By June, CMBS spreads came in to 118 to 125 on AAA and 600 on BBB-.
• CMBS lending has picked up again.
27
The Startling Differences Between CMBS 1.0, 2.0 & 3.0
CMBS 2.0/3.0 Delinquency
• As of April 2016, about $1 billion in delinquent or specially serviced loans
• The delinquency rate was 0.18%.
• 2010 and 2011 delinquency rate was 0.58% and 0.48%, respectively.
• 20% of those loans were related to oil prices, 70% of oil patch delinquency is in North Dakota
• 20% of the exposure was nonmonetary
• Lawsuits
• Borrower bankruptcy
• Cash-management violations
28

The Startling Differences Between CMBS 1.0, 2.0 & 3.0
Notable 2.0/3.0 Delinquency
• Matrix Corporate Center, $81 million
• One tenant gave back 125,000 square feet; a second announced that it would vacate to build a new headquarters facility
• Problems exacerbated by death of property owner
• Thanks to 64% LTV loan and planned redevelopment, Morningstar’s value is above the loan balance and no loss is forecast.
• Hudson Valley Mall, $52.3 million
• Two anchors plus several in-line tenants closed
• Cotenancy clauses allowed other tenants to reduce rents or terminate leases
• Possible 60% loss severity
29
The Startling Differences Between CMBS 1.0, 2.0 & 3.0
Honorable Mention
• Gateway Salt Lake
• The loan was issued in 2010, which is post-crisis, but pre Dodd-Frank.
• The loan defaulted not long after a new mall opened in Downtown Salt Lake City and both tenants and shoppers defected.
• The loan was initially modified with a significant reduction in balance, and significant concessions in interest rate.
• In May 2016, the servicer advised that the modification was rescinded with $41 million in losses passed through to the investors.
• More to come …
30
The Startling Differences Between CMBS 1.0, 2.0 & 3.0
Payoff Rates in 2.0/3.0
• Loans have paid off at a higher rate, which suggests that the leverage and underwriting were less aggressive.
• $2.2 billion, or 91% of five-year loans from CMBS 2.0, paid off successfully
• Westport Village, DSCR decreased from loss of major tenant, still paid off
• More than 75% of the 2.0 / 3.0 loans with maturity in 2016 and 2017 have LTVs below 80%, suggesting that they will pay off.
• Compare to 60% or less from 1.0 deals.
31
The Startling Differences Between CMBS 1.0, 2.0 & 3.0
Is The CMBS Market Still Functional
• Yes, it’s just different from the 1.0 days.
• CMBS remains a vital part of the lending infrastructure.
• There is more uncertainty for borrowers over the next year.
• We characterize 2.0/3.0 performance as “so far, so good”.
• Scrutiny is more likely to increase than decrease over the next year.
• The cost of funds may increase.
• Be prepared to have more information become public.
• Reception from B-piece buyers or rating agencies may force a retrade.
32
The Startling Differences Between CMBS 1.0, 2.0 & 3.0
Disclaimer
Copyright © 2016 by Morningstar Credit Ratings, LLC (“Morningstar”). Reproduction or transmission in whole or in part is
prohibited except by permission. All rights reserved. The opinions expressed herein are solely those of the authors as of the date
hereof and do not necessarily represent the opinions of Morningstar or its affiliates. The content and analysis contained herein are
solely statements of opinion and not statements of fact or recommendations to purchase, hold, or sell any securities or make any
other investment decisions. THE CONTENT AND ANALYSIS IS PROVIDED “AS IS” AND NOT SUBJECT TO ANY GUARANTEES OR ANY
WARRANTIES, EXPRESS OR IMPLIED, INCLUDING WARRANTIES OF MERCHANTABILITY OR FITNESS FOR A PARTICULAR PURPOSE
OR USE.
To reprint, translate, or use the data or information other than as provided herein, contact Vanessa Sussman (+1 646 560-4541)
or by email to: vanessa.sussman@morningstar .com.
33