the state of career advancement for diverse hollywood writers
TRANSCRIPT

The State of Career Advancement for Diverse Hollywood Writers: Surveying Pitfalls and Best Practices
Commissioned by the Writers Guild of America, West
Darnell M. Hunt, PhD Dean, UCLA Division of Social Sciences
Professor of Sociology and African American Studies
November 2019

Though decades of statistics from the Writer Guild of America’s Hollywood Writers’ Report series underscore the challenges diverse writers continue to face in film and television,1 much of what we know about industry efforts to address these challenges is anecdotal. How successful have Hollywood diversity and inclusion programs generally been at advancing the careers of aspiring writers from underrepresented groups? What best practices can be gleaned from the most successful programs that might be adopted more widely? There have been few studies geared towards trying to assess the overall impact of these programs,2 particularly with respect to understanding writers’ actual experiences during and after the programs.
The WGA commissioned this study to more systematically consider the experiences that diverse Hollywood writers have had with industry diversity and inclusion programs. Of particular interest is documenting the types of interventions that seem to make a
1 See “2016 Hollywood Writers Report: Renaissance in Reverse?” Writers Guild of America, West, March 2016, https://www.wga.org/uploadedFiles/who_we_are/HWR16.pdf 2 See “By All Means Necessary: Essential Practices for Transforming Hollywood Diversity and Inclusion,” UCLA Division of Social Sciences, September 2019, https://lasocialscience.ucla.edu/2019/09/18/by-all-means-necessary-new-ucla-report-on-hollywood-diversity-and-inclusion-practices/. 3 The survey was hosted by SurveyMonkey.com and was conducted between August 11, 2019 and August 30, 2019. Invitations to participate, which included a link to the survey, were sent by WGA to 3,300 diverse guild members. Of the 1092 respondents (33.1 percent response rate), 617 completed the entire survey. The number of respondents for each survey item is noted throughout this report. 4 WGA members were recruited to the survey if they belonged to one or more of the following
difference in the careers of diverse writers in film and television. The WGA seeks to employ findings from this study to identify best practices associated with the Hollywood diversity and inclusion programs in which its members have participated. The goal is to promote these best practices to studios and networks in order to strengthen existing efforts to advance the careers of diverse Hollywood writers.
Data and Methods The data for this study were collected in two phases: 1) through an on-line survey of 1,0923 “diverse”4 WGA members and 2) through telephone interviews5 with a subset of 28 survey respondents who indicated they had participated in at least one Hollywood diversity and inclusion program. Table 1 presents an overview of some key characteristics of survey respondents. Slightly more than a third of survey
underrepresented groups: women writers, older writers (aged 50+), LGBTQ+ writers, writers of color (i.e., Black, Latino, Asian or other non-White), and writers with disabilities. 5 Telephone interviews were conducted between September 16, 2019 and September 20, 2019. Informants were selected from survey respondents who a) reported they had participated in at least one Hollywood diversity and inclusion program, b) indicated a willingness in the survey to be interviewed by telephone, and c) represented several categories of interest: Black writers (three informants); Latino writers (three informants); Asian writers (two informants); Native writers (two informants); women writers (nine informants); older writers (five respondents); writers with disabilities (two writers); LGBTQ+ writers (two writers). Details about writing assignments are kept to a minimum in this report in order to protect informants’ anonymity.

respondents (35.6 percent) reported participating in at least one Hollywood diversity and inclusion program. With respect to race/ethnicity, White writers comprised nearly half of all respondents6 (49.2 percent), followed by Latino writers (14.8 percent), Black writers (14.3 percent), Asian writers (13.5 percent), Native writers 6 Note that White respondents were necessarily “diverse” in other ways ¾ either they were women,
(2.1 percent), and other race writers (6 percent). Two-thirds of all respondents were women (66.4 percent) and 19.8 percent of respondents were over 50 years of age. One quarter of all respondents (25.1 percent) identified as LGBTQ+ and 5 percent reported having a disability. Most survey respondents reported earning a college degree, 59.3 percent at the bachelors level and 31.2 percent at the masters level. The most common fields of study for the college graduates were those related to film and television production or aesthetics (56.8 percent) and English and/or writing (19.3 percent). Nearly a third of respondents (30.8 percent) reported having to engage in work outside of the Hollywood industry in order to supplement income from their writing careers.
Sector Employment Figure 1 presents a breakdown of sector employment ¾ television versus film ¾ by race and ethnicity. The first finding to emerge from the chart is that respondents from all racial and ethnic groups reported relatively high rates of employment in the television sector: 100 percent of Native respondents, 95.5 percent of Other-race respondents, 94.5 percent of Latino respondents, 93.2 percent of Black respondents, 90 percent of White respondents, and 89.2 percent of Asian respondents. Among all respondents (n=1,092), 85.3 percent reported working in the television sector, a figure that includes respondents who failed to answer the race and ethnicity question.
older writers, writers with disabilities, and/or LGBTQ+ writers.
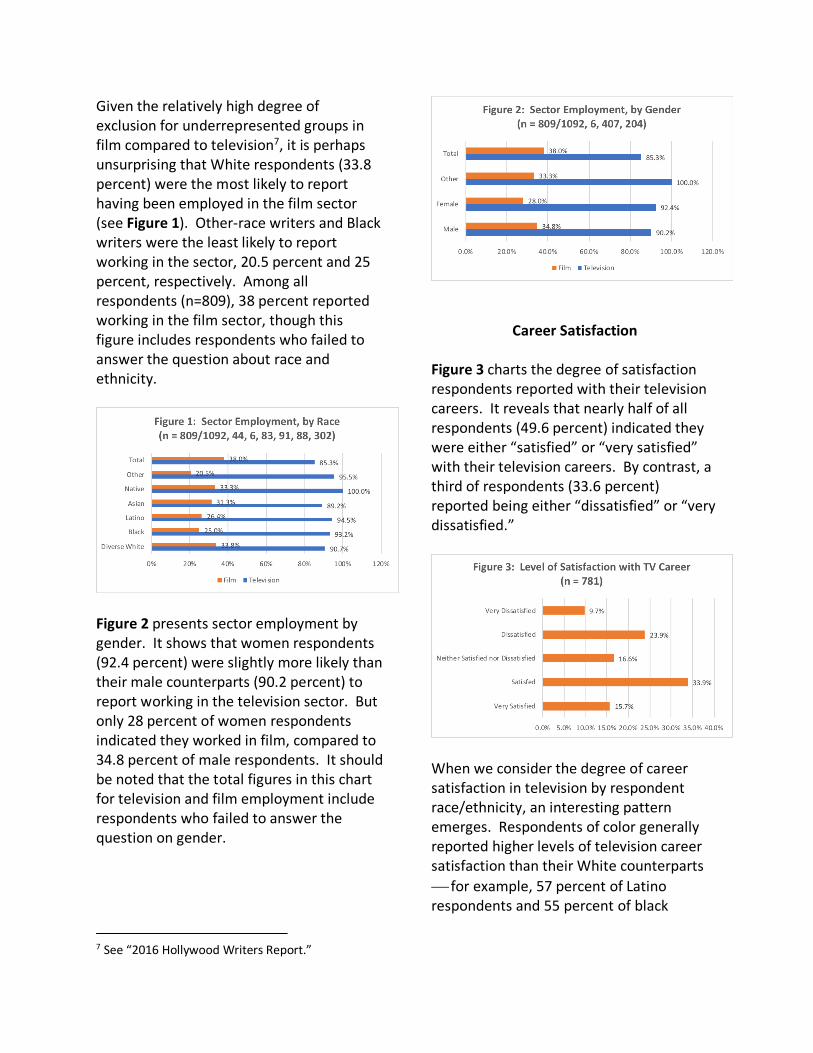
Given the relatively high degree of exclusion for underrepresented groups in film compared to television7, it is perhaps unsurprising that White respondents (33.8 percent) were the most likely to report having been employed in the film sector (see Figure 1). Other-race writers and Black writers were the least likely to report working in the sector, 20.5 percent and 25 percent, respectively. Among all respondents (n=809), 38 percent reported working in the film sector, though this figure includes respondents who failed to answer the question about race and ethnicity.
Figure 2 presents sector employment by gender. It shows that women respondents (92.4 percent) were slightly more likely than their male counterparts (90.2 percent) to report working in the television sector. But only 28 percent of women respondents indicated they worked in film, compared to 34.8 percent of male respondents. It should be noted that the total figures in this chart for television and film employment include respondents who failed to answer the question on gender.
7 See “2016 Hollywood Writers Report.”
Career Satisfaction
Figure 3 charts the degree of satisfaction respondents reported with their television careers. It reveals that nearly half of all respondents (49.6 percent) indicated they were either “satisfied” or “very satisfied” with their television careers. By contrast, a third of respondents (33.6 percent) reported being either “dissatisfied” or “very dissatisfied.”
When we consider the degree of career satisfaction in television by respondent race/ethnicity, an interesting pattern emerges. Respondents of color generally reported higher levels of television career satisfaction than their White counterparts ¾ for example, 57 percent of Latino respondents and 55 percent of black

respondents reported being either “satisfied” or “very satisfied” with their television careers, compared to only 23.3 percent of White male respondents.8 This finding is likely the result of the fact that the white male respondents recruited to the survey were necessarily older writers or LGBTQ+ writers, since white males would otherwise not be considered “diverse” writers. It should be noted that the lone group of minority respondents to report a lower level of television career satisfaction than their white male counterparts was Native respondents, for which two thirds (66.7 percent) indicated they were “dissatisfied” with their television careers.9 Figure 4 presents the degree of satisfaction respondents reported with their film careers. Compared to findings for overall television career satisfaction, the chart reveals that respondents were somewhat less satisfied with their film careers. That is, only a little more than a third of all respondents (38.3 percent) indicated they were “satisfied” or “very satisfied” with their film careers. A comparable share of respondents (36.9 percent) reported being either “dissatisfied” or “very dissatisfied.”
8 For Latino, Black and White male respondents, n=86, n=80, and n=60, respectively. 9 N=6 for Native respondents. 10 See “2016 Hollywood Writers Report.”
As in the television sector, patterns also emerge in the film sector if we consider respondents’ satisfaction with their careers through the lens of race/ethnicity. But here, respondents of color generally report lower levels of satisfaction with their careers than their White counterparts ¾ perhaps a reflection of the film sector’s higher levels of exclusion for writers of color relative to the television sector.10 That is, while 38.4 percent White respondents reported they were either “satisfied” or “very satisfied” with their film careers, only 26.1 percent of Latino respondents and 27.8 percent of East Asian respondents indicated they felt the same way.11 Black respondents were the exception to this pattern among respondents of color, with 45 percent reporting they were either “satisfied” or “very satisfied” with their film careers.12 The numbers of other respondents of color who reported working in the film sector were too small to provide a breakout of their levels of career satisfaction.
Television Career Factors In this section, we consider a number of key factors that likely impact how satisfied television writers are with their careers. These factors include the following: respondents’ satisfaction with their agents and/or managers; the number of staffing jobs they have had over the course of their careers; the number of seasons they worked as a staff writer before being promoted; the highest position they have achieved to date in a writers’ room; how
11 For White, Latino and East Asian respondents, n=99, n=23, and n=18, respectively. 12 N=20 for Black respondents.

inclusive their most recent writers’ room is/was; and how personally included they felt in the room. Figure 5 presents the degree of satisfaction respondents reported with their most recent television agent and/or manager. Nearly equal shares of respondents indicated they were either “satisfied” or “very satisfied,” 30 percent and 28.4 percent of respondents, respectively. Meanwhile, only 25 percent of respondents reported being “dissatisfied” or “very dissatisfied.” If we consider agent and/or manager satisfaction through the lens of gender, women respondents were more likely to report being either “satisfied” or “very satisfied” (60.9 percent) compared to their male counterparts (49.7 percent). There were no significant differences in satisfaction along racial and/or ethnic lines.
Figure 6 charts the number of television staffing jobs respondents reported they had over the course of their careers. The largest single share of respondents (21.3 percent) reported they had had only one staffing job, followed by those who reported they had had two (17.6 percent) and three (13.7 percent), respectively. Nearly three quarters of all respondents (73.8 percent), indicated they had had five or fewer staffing
jobs throughout their careers, including 5.9 percent of respondents who indicated that they had yet to be staffed. By contrast, 8.7 percent of respondents reported they had had more than 10 staffing jobs.
Figure 7 charts the number of seasons respondents indicated they worked as a television staff writer before being promoted to a higher status position in the writers’ room. Most respondents (60.3 percent) were promoted after a single season as staff writer, followed by a quarter of respondents (25.9 percent) who were promoted after two seasons. Only 3.4 percent of respondents reported working as a staff writer for more than three seasons before being promoted. It should be noted that there were no discernable patterns by race/ethnicity, gender, or LGBTQ+ status in

the number of seasons respondents worked as a staff writer. Table 2 presents the highest status position respondents reported they had achieved to date in the writers’ room, by race/ethnicity and gender. The first finding to emerge from the table is that respondents of color were a little more likely than their white counterparts to had risen only to the level of staff writer ¾ 36.4 percent of Native respondents, 32.1 percent of Black respondents, 31.5 percent of Asian respondents, and 29.4 percent of Latino respondents ¾ compared to only 23.6 percent of White respondents. Meanwhile, at the other end of the status spectrum, male respondents were the most likely to report they had achieved the status of showrunner (8.4 percent), followed by Latino respondents (8.2 percent), Black respondents (7.4 percent), and White male
13 Writers’ rooms for which at least half of the staff was reportedly writers of color, LGBTQ+ writers, writers with disabilities and/or women writers were coded as “diverse,” while those with a smaller share
respondents (7.1 percent). Women respondents were considerably less likely than their male counterparts to indicate they had worked as a showrunner (4.6 percent). Figure 8 presents an analysis of the relationship between the kinds of writers’ rooms respondents worked in most recently and the race and gender of the showrunner. Specifically, the chart considers whether respondents reported working in “traditional” or “diverse” writers’ rooms13 and how this distinction might be related to whether or not the showrunner was a White male. The first takeaway from the chart is that respondents described most writers’ rooms as “diverse” ¾ despite what we know about the general lack of diversity across all writers’ rooms.14 This is because survey respondents were all “diverse” in
of writers falling into these categories were coded as “traditional.” 14 See “WGAW 2015 Television Staffing Brief,” https://www.wga.org/uploadedFiles/who_we_are/tvstaffingbrief2015.pdf.

some sense themselves, which increased the odds that they would have worked in a “diverse” room. What is more notable (if not surprising) is the finding that White male showrunners were more likely than other showrunners to manage “traditional” rooms (32.1 percent versus 20.4 percent) and less likely to lead “diverse” rooms (67.9 percent versus 79.6 percent). Figure 9 charts the degree to which respondents felt included or excluded in the writers’ room they worked in most recently. The first takeaway is that the vast majority of respondents who worked in writers’ rooms led by either White males or others reported feeling included as part of the writing team. This said, respondents who worked in writers’ with showrunners who weren’t White males were more likely to report feeling “very included” ¾ 56.4 percent versus 46.3 percent for White-male-led rooms.
Film Career Factors In this section, we consider several factors that likely shape the careers of diverse screenwriters. These factors include the following: the degree of satisfaction respondents reported with their agent(s) and/or manager(s); and whether or not
respondents felt their race, gender or age constrained in any way the types of screenwriting assignments for which they had been considered. Figure 10 charts the level of satisfaction respondents reported with their most recent film agent(s) and/or manager(s). As we observed in the television sector, a little more than half of all respondents indicated they were either “satisfied” (28.7 percent) or “very satisfied” (26.1 percent) with their representation in film. It should be noted that White male respondents (who were necessarily older, LGBTQ+ and/or writers with disabilities) were considerably less likely than other respondents to report they were either “satisfied” or “very satisfied” with their talent representation ¾ just 40.9 percent. Respondents from other groups were more similar to one another on this measure.

Figure 11 charts the differences, by race/ethnicity, in the share of respondents who reported they either “agree” or “strongly agree” that their group status constrained the types of screenwriting assignments for which they had been considered. A couple of findings emerge from this chart that are worth noting. First, with the exception of Native respondents (there were only two of them), more than a third of respondents from all racial/ethnic groups agreed their group status had hindered their careers to some degree. Black respondents were the most likely to feel this way (61.9 percent), followed by nearly half of all White respondents (49.5 percent). Again, it worth underscoring here that White survey respondents were necessarily women (the largest single group of White respondents), older, LGBTQ+, and/or writers with disabilities.
Figure 12 suggests that gender likely played a modest role in respondents’ perceptions regarding the relationship between their group status and career opportunities in film. That is, women respondents were a bit more likely than their male counterparts ¾ 49.5 percent versus 44.8 percent ¾ to “agree” or “strongly agree” that their group status had constrained in some way the screenwriting assignments for which they had been considered.
Finally, Figure 13 charts respondents’ perceptions of their career opportunities in film, by age group. It reveals that respondents 50 and over were considerably more likely than their under-50 counterparts to either “agree” or “strongly agree” their group status had constrained the types of screenwriting assignments for which they had been considered.
Program Participation The core focus of this study is to systematically explore the experiences diverse Hollywood writers have had with industry diversity and inclusion programs, with an eye towards identifying the types of interventions that seem to make a difference in their careers in film and television. This section sets the stage for considering best practices for furthering the careers of diverse writers by first

establishing how common participation in such programs is among survey respondents. Figure 14 charts respondent participation in diversity and inclusion programs sponsored by a television network, Hollywood studio, the WGA, or other industry stakeholder, by gender and race.15 Among all respondents (n=680), 35.6 percent reported participating in at least one inclusion and diversity program. When we break down program participation by gender (n=617), male respondents were more likely to report participating in a program (44.6 percent) than their female counterparts (31.7 percent).
When diversity and inclusion program participation is considered by race (see Figure 14), we see that Asian respondents were the most likely to report participating in at least one program (57.8 percent), followed by Latino respondents (56 percent), Black respondents (47.7 percent), Native respondents (33.3 percent), Other-raced respondents (25 percent), and White respondents (20.9 percent). 15 See Appendix, Table 3 for a list of diversity and inclusion programs commonly mentioned by respondents.
Program Outcomes
One of the most salient criteria for evaluating the effectiveness of Hollywood diversity and inclusion programs is whether or not participants acquired work as a direct result of the program.16 In this section, we explore whether respondents believe participation in their most recent program led to work and/or a development deal in television or film, by gender and race. Focusing exclusively on the film sector, we also examine whether respondents believe their participation in a film festival or screenwriting contest led directly to work, by gender and race.
Figure 15 presents the share of program participants who believe their most recent program directly resulted in work, by gender. It shows that a slight majority of male respondents believed this was the case (51.8 percent), compared to more than a third of female respondents (38.9 percent). Overall, 44.3 percent of respondents believed participation in their most recent program resulted in work (n=210).
16 See “By All Means Necessary.”

Figure 16 breaks down these data by race/ethnicity. It reveals that all Native program participants believed their most recent program directly led to work (though there were only n=2 respondents), compared to 58.3 percent of Asian respondents and other-raced respondents, 46.3 percent of Black respondents, 44.7 percent of Latino respondents, and just 26.7 percent of White respondents.
If we consider the television sector separately, Figure 17 provides evidence that participation in diversity and inclusion programs may provide diverse writers with pathways to more sustained careers. The chart considers the number of television staffing jobs reported by respondents as a function of whether or not they participated in at least one diversity and inclusion program. While it is possible that some writers may have had fewer jobs simply because they were fortunate enough to have staffed longer running shows, the chart nonetheless reveals a pattern that suggests participation in diversity and inclusion programs may lead to a higher number of staff positions. Most notably, 24.9 percent of respondents who did not participate in a program reported having only one staff job, compared to just 15.3 percent of respondents who did.
Meanwhile, at the other end of the distribution, 9.4 percent of respondents who participated in a program reported more than 10 staff jobs, compared to just 6.5 percent of those who did not. Similarly, 11.2 percent of program participants reported five staff jobs, compared to just 6.3 percent of those who did not participate in a program.
In the film sector, several prominent diversity and inclusion programs include film festival and/or screenwriting contest elements in an effort to increase the visibility of talented screenwriters. Considering the film sector separately,

Figure 18 examines whether respondents believe their participation in a film festival or screenwriting contest led directly to work, by gender. It reveals that just 17.2 percent of all respondents (n=192) felt participation in either had directly led to work, while the figures for female and male respondents were very similar ¾ 17.3 percent and 16.7 percent, respectively. When we examine the same question through the lens of race, Figure 19 shows that Native respondents were the most likely to report that participation in a film festival and/or screenwriting contest led directly to work ¾ 50 percent of respondents (though this was based on only n=2 respondents). Notably, Black respondents were the least likely to think this participation paid off for them (4.6 percent). The figures for other racial/ethnic groups were more similar to the overall figure: 17.5 percent for white respondents, 17.4 percent for Latino respondents, 15.4 percent for Asian respondents, and 11.1 percent for other-raced respondents.
Program Satisfaction In this section, we examine respondents’ level of satisfaction with their most recent Hollywood diversity and inclusion program.
We then consider respondents’ level of satisfaction as a function of three key factors: whether respondents believe the program led to directly to work, whether respondents were still being mentored as a result of the program, and the duration of the program.
Figure 20 presents respondents’ level of satisfaction with their most recent industry diversity and inclusion program. It reveals that more than two thirds of respondents (70.4 percent) reported they were either “satisfied” or “very satisfied” with the program. By contrast, only 14.8 percent of respondents reported being either “dissatisfied” or “very dissatisfied.” Meanwhile, an equal share of respondents (14.8 percent) reported they were “neither satisfied nor dissatisfied” with the program. If we drill down into these responses on the basis of two important program factors ¾ whether respondents believe the program led to work or the duration of the program ¾ some notable patterns emerge. First, Figure 21 suggests (not surprisingly) that high levels of respondent satisfaction with
diversity and inclusion programs are associated with respondents’ perceptions of whether a program leads directly to work. That is, 83.7 percent of respondents who believed their most recent program led to work (n=92) reported they were either “satisfied” or “very satisfied” with the program. By contrast, only 58 percent of those who believed the program did not lead to work (n=112) reported being “satisfied” or “very satisfied” with it ¾ a 25 percentage point differential. Meanwhile, 21.4 percent of respondents who believed their program did not lead to work reported they were “dissatisfied” or “very dissatisfied” with it, compared to only 10.8 percent of those who believed it did.
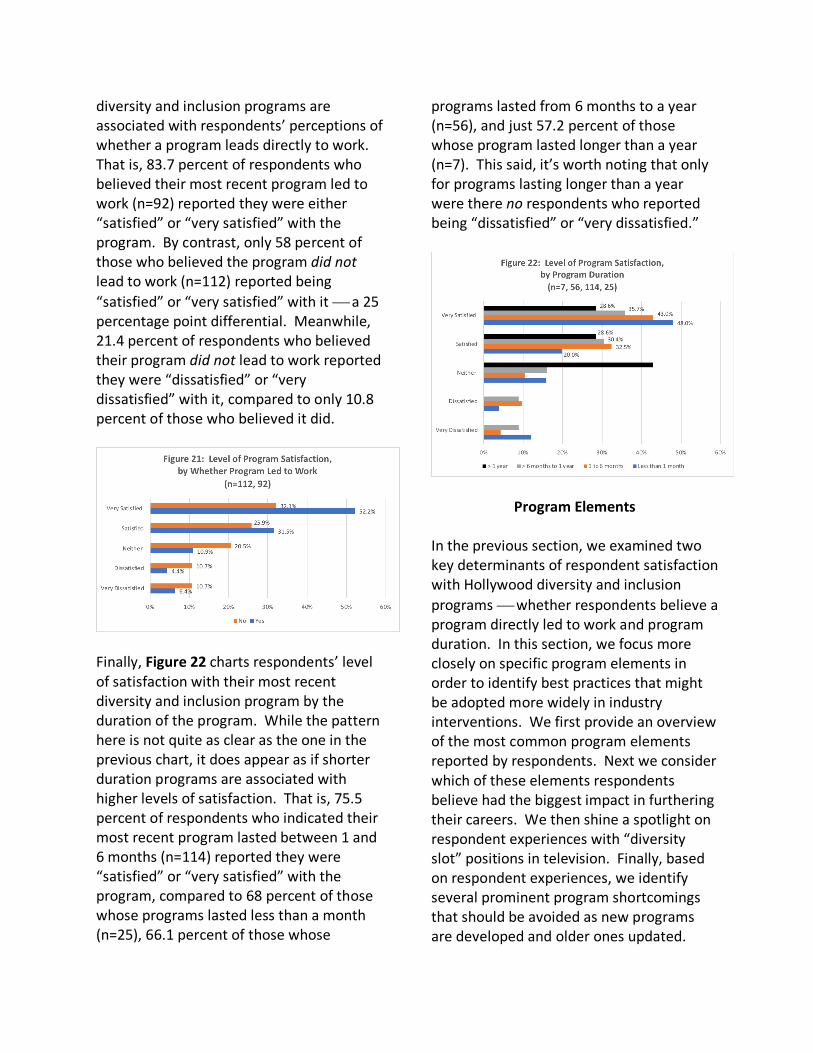
Finally, Figure 22 charts respondents’ level of satisfaction with their most recent diversity and inclusion program by the duration of the program. While the pattern here is not quite as clear as the one in the previous chart, it does appear as if shorter duration programs are associated with higher levels of satisfaction. That is, 75.5 percent of respondents who indicated their most recent program lasted between 1 and 6 months (n=114) reported they were “satisfied” or “very satisfied” with the program, compared to 68 percent of those whose programs lasted less than a month (n=25), 66.1 percent of those whose
programs lasted from 6 months to a year (n=56), and just 57.2 percent of those whose program lasted longer than a year (n=7). This said, it’s worth noting that only for programs lasting longer than a year were there no respondents who reported being “dissatisfied” or “very dissatisfied.”
Program Elements In the previous section, we examined two key determinants of respondent satisfaction with Hollywood diversity and inclusion programs ¾ whether respondents believe a program directly led to work and program duration. In this section, we focus more closely on specific program elements in order to identify best practices that might be adopted more widely in industry interventions. We first provide an overview of the most common program elements reported by respondents. Next we consider which of these elements respondents believe had the biggest impact in furthering their careers. We then shine a spotlight on respondent experiences with “diversity slot” positions in television. Finally, based on respondent experiences, we identify several prominent program shortcomings that should be avoided as new programs are developed and older ones updated.

Figure 23 charts the most common program elements mentioned by respondents (n=209) when they were asked to describe the training provided to them over the course the Hollywood diversity and inclusion program they participated in most recently. How to pitch story ideas ¾ a basic skill required for both television writers and screenwriters ¾ was by far the most common program element, mentioned by 43.1 percent of respondents. The next five program elements, in order of frequency of mention, all pertained to skills considered essential for success as a television writer: navigating the writers’ room (17.2 percent); interviewing (16.3 percent); spec script writing (14.8 percent); how to interact with network executives and showrunners (13.4 percent); and pilot writing (9.6 percent). The next group of program elements included a mix of both skills and actual opportunities to interact with important industry contacts. How to effectively brand yourself and “tell your own personal story” (9.1 percent) was next, followed by the opportunity to actually meet with showrunners and/or network executives,
17 See “By All Means Necessary.”
mentioned by 8.6 percent of respondents. This was followed by how to take notes (8.1 percent) and how to outline and/or rewrite scripts (7.7 percent). The final group of program elements mentioned by respondents included mentorship (6.7 percent), how to structure and develop stories (6.2 percent), and opportunities to network with other writers (5.3 percent). Despite the often-cited importance of mentoring in supporting the careers of up-and-coming diverse writers,17 it’s interesting to note that relatively few respondents cited mentorship as a prominent element of the programs in which they had participated.
Career-Enhancing Program Elements Figure 24 presents the program elements most frequently mentioned by respondents as furthering their careers (n=192). Interestingly, though opportunities to network with other writers was last on the list of the common program elements mentioned by respondents (see previous chart), it was the most frequently mentioned among the program elements respondents believed furthered their careers (17.7 percent). One survey respondent explained the value of networking this way: “I believe the networking and introductions were the most valuable aspect of the program. And relationships I made with fellow writers in the program.” Another respondent concurred:

“My greatest reward were the classmates I had there, some of whom remain close friends. I’ve developed three series with someone I sat next to there.” This finding suggests that programs might be strengthened in the future by efforts to facilitate networking opportunities between alumni of the programs, perhaps through the hosting of alumni events and the maintenance and sharing of alumni databases. The next most frequently mentioned, career-enhancing program element was how to pitch story ideas (11.5 percent), which, you will recall, was the most frequently mentioned among the common program elements (see previous chart). One informant explained that her program exposed her to “examples of how to craft a pitch, [and then] pitching that to a group and industry professionals for feedback.” Many other respondents simply stated “pitching” when asked to discuss program elements that furthered their careers ¾ as if no further explanation was necessary. How to pitch was followed by three program elements that all related, in one way or another, to the psychology of working as a writer: understanding writers’ room etiquette and culture (8.9 percent); how to brand yourself (8.3 percent); and receiving validation and gaining confidence (5.7 percent). One respondent summarized the impact of these elements in this way: “The [program name] truly convinced me that I belong in a writers room, that I could do it, and that I’d thrive.” 18 cite
Another respondent explained further: “Aside from the validation (‘I belong here!’), the program taught me to identify the aspects of my story that distinguish me and become comfortable relating it to others.”
Program elements respondents mentioned less frequently as having a positive impact on their careers included the following: how to take notes (4.7 percent); mentorship (4.2 percent); how to interact with showrunners and/or network and studio executives (3.6 percent); opportunities to actually meet showrunners and/or network and studio executives (3.6 percent); how to write quickly and efficiently (3.1 percent); how Hollywood business culture works (3.1 percent); how to effectively interview (2.6 percent); and how to work with agents and/or managers (2.1 percent). It’s interesting to note here that mentorship ¾ despite the value this program element is commonly assumed to provide for emerging diverse writers18 ¾ was just a “middle-of-the-road” factor for respondents. This appears to be because the mentoring experienced by respondents was quite uneven: some respondents sang the praises of their mentors, while others

felt like the experience was largely a waste of time. Two respondents who agreed to be interviewed described positive experiences with their mentors: “The program had phenomenal mentors who were actual writers, producers and directors. It was amazing to see someone like the DP who worked on a project like [movie title] standing right next to you giving you direction.”
“One of my mentors actually ended up directing my movie. I’ve stayed in contact with all my mentors on a regular basis and it’s been really cool. They’ve been really helpful at coaching me through various genres of the industry. The mentoring component ends at the end of the program so it’s up to you to keep the relationship going.”
By contrast, other respondents either questioned the credentials or commitment of would-be mentors: “The mentors didn’t have a background in comedy for the comedy writers.” “My mentor had limited experience.” “The agents and managers on the panel didn’t return my emails ¾ this after they agreed to come and meet with writers in a diversity-based group.” Meanwhile, though opportunities to meet with showrunners and/or network executives wasn’t at the top of the list for study participants, those who identified this program element as valuable were adamant about its impact. One of the respondents we interviewed explained the impact this way:
“The meet and greet format was very efficient. It allowed me to meet four executives in one night, which is a really good use of time. It also gave me access. Not every writer is going to have it, so this helps level the playing field.”
“Diversity Slot” Positions Over the years, several television networks and studios have subsidized entry-level staff writer positions for promising diverse talent in hopes of providing these writers with a foot in the door in the highly competitive Hollywood industry. Typically, these “diversity slot” positions are subsidized by the network or studio for one or two years in hopes that the writer will prove herself/himself in the writers’ room and be rehired by the showrunner for seasons beyond those initially subsidized. While the showrunner is incentivized to take a risk on this “free” talent in the initial years of the bargain, rehiring means that later years would have to be covered by the show’s budget. Despite this noble goal, a common criticism of these programs is that some showrunners exploit the subsidy by failing to keep talented “diversity slot” writers on staff beyond the “free” years. Indeed, some have described these programs as little more than a revolving door of one-year stints in the writers’ room for diverse talent ¾ where one “free” writer simply replaces another. One respondent described her/his experience this way: “I was not rehired. They considered bringing me back briefly but the [diversity] program would not pay for my salary again, so they did not rehire me.”

Another respondent provided some insights into her/his showrunner’s thinking about the subsidized position: “I was rehired for [show name], then told at the end of that season by the showrunner that they ‘wanted fresh diversity meat’ and I was being let go, even though they had told me during the season they loved my work.” Still another respondent explained how the subsidized position actually worked against him/her securing a staff position on another show:
“I was not hired on season 2 of the show ¾ even though the showrunner held me up from taking another job and insisted that I would be returning, then told me there ‘was not enough money’ for me [after the subsidy expired].”
One of the respondents we interviewed summed up a basic dilemma presented by many “diversity slot” programs:
“As part of the diversity program you’re never a part of the writer’s budget for the project while you’re in the program. The pattern I saw over and over again is if you made a big impact, the showrunner would want you back next season. But then the studio considers you a new hire so you’re paid less than you should be making or the showrunner considers you to be the diversity hire and the whole process just becomes a revolving door of diversity writers. So you’re great because you’re free, but as soon as it’s time to pay you there’s no money in the budget. It becomes difficult for writers of color to rise in the ranks. It takes us a lot longer. You’re incentivized year one. Then you’re on your own year two. The program has your back after the first year and then there were no systems in place to support us afterwards.”
Figure 25 charts respondents’ reports of whether or not they were rehired by a show
on which they occupied a “diversity slot” position, after the subsidy ran out (n=87). It shows that slightly more than half of respondents indicate they were indeed hired for at least one additional season covered by the show’s production budget
(52.9 percent), while a little more than a third reported being let go after the subsidy ran out (34.5 percent). The remainder of respondents (12.6 percent) indicated they did not know because either they were still in their first season as a “diversity slot” hire, the show was canceled after their initial season, or they were not sure that they in fact occupied a subsidized position.
In short, while “diversity slot” programs have succeeded in providing entree to longer term staffing positions for a little more than half of respondents, it appears as if this type of program is abused by a sizable share of showrunners who view it primarily as a source of free, expendable labor. Network and studio sponsors of these programs should track individual showrunner success in integrating the diverse writers who occupy these positions into the writers’ room long term.

Showrunners who have a pattern of failing to do so should be held accountable.
Program Shortcomings A subset of program participants responded to a survey question that asked them to describe any shortcomings of the diversity and inclusion program they participated in most recently. Figure 26 charts the program shortcomings most frequently mentioned by respondents (n=171). Two shortcomings stand out here among the ten most frequently cited by respondents: too little program staffing and/or financial support (16.4 percent) and insufficient follow up after the end of the program (10.5 percent). The first critique ¾ insufficient investment in diversity and inclusion programs ¾ echoes concerns about business-as-usual approaches to Hollywood diversity and inclusion, approaches growing out of organizational cultures that fail to affirm success on this front as a fundamental business imperative. As a result, these approaches typically amount to little more than window dressing incapable of producing real change.19 Indeed, respondents were generally critical of diversity and inclusion programs that seemed disconnected from the larger array of activities within industry organizations. One respondent noted that there was “[n]ot enough focus on inclusion within the rest of the studio/network. [Diversity] still remained an isolated division within the larger company, only called upon when a diversity slot hire was required.”
19 Ibid.
Another respondent expressed an all-too- common measure of cynicism about some programs, concluding that the goal was often more about favorable optics than opening sustained pathways for underrepresented talent: “It feels like the programs are trying to stack the deck to make their numbers look good, rather than doing what the programs were originally designed to do ¾ find underrepresented voices who do not have access to the industry and elevating them.”
Other respondents we interviewed emphasized the failure of their most recent program to adequately follow up with program alumni:
“The network [program sponsor] needs a better follow up program to help the writers’ have a better connection with the network after the program ends.”
A respondent who agreed to be interviewed explained further:
“The program needs more follow up with their alumni. Once you’re out of the program, you never hear from them again. They only help those who are in their current class. They need people committed to mentoring who should sit down with you for the first two years until you

get your sea-legs. It would have also liked to learn more from these programs about how to sustain a career in writing.”
The other program shortcomings cited by respondents were varied but none were nearly as prominent as the two identified above. These less-prominent shortcomings included: little actual contact with showrunners and/or network and studio executives (4.1 percent); ineffective mentoring (4.1 percent); program duration that is too short (2.9 percent); racist/sexist program staff (2.9 percent); program participants stigmatized as “diversity hires” (2.3 percent); lack of program visibility or status among industry decision makers (1.8 percent); unqualified program staff (1.8 percent); and too much focus on spec script writing (1.8 percent). It should be noted that survey respondents were particularly vocal about program staff and instructors who, in their view, weren’t really committed to increasing diversity and inclusion. Wrote one respondent: “I think that the execs treated us like charity cases. They didn’t take us seriously as writers, even though we’d been through a pretty rigorous selection process…The people who ran the program had no idea what to do with us after the program was over. They didn’t advocate for us internally. They didn’t help us get representation.” Another respondent put it this way: “I’ll be completely candid: the [name] writing program was run by executives who wanted to be anywhere else but there. We were barely trained for anything and survived by our own talent.”
Other respondents’ dissatisfaction with their programs was focused more on the program staff’s ignorance about what it takes to provide meaningful pathways for diverse talent: “At the time, the folks running the diversity group seemed a bit limited in their knowledge of the business and how to succeed in both the craft and business aspects of being a film or TV writer. Some of the advice and focal points are rather laughable in retrospect, and they seemed more concerned with optics and grooming candidates for their fellowship program rather than the tools needed to succeed as writers.” A respondent who agreed to be interviewed concurred, underscoring the importance of staffing diversity and inclusion programs with people who both understand how the industry works and are committed to change:
“With these programs they need to have people running them that actually understand the importance of diversity. The studio program I participated in did not. It might be helpful to have people who actually are from diverse backgrounds. It all felt like it was just for show.”
Conclusions Decades of statistics from the WGA’s Hollywood Writers’ Report series shed light on the challenges diverse writers continue to face in film and television. Though the diverse writers considered in this study responded that they were mostly satisfied with their careers, troubling patterns nonetheless emerged in how included they felt in writers’ rooms (by showrunner race/gender and room diversity) and whether they believed their group status had constrained access to work in the film sector. Consistent with what we’ve known

for some time, diverse writers seem to have the steepest hill to climb in their attempts to land work in film. You will recall that a little more than a third of survey respondents reported participating in at least one diversity and inclusion program, and more than three quarters of program participants indicated they were either “very satisfied” or “satisfied” with the program they participated in most recently. Moreover, while further examination is needed to control for other factors, evidence supports the idea that participation in at least one program may increase the likelihood of diverse writers enjoying more sustained careers in the television sector. Though findings from this study generally suggest that existing diversity and inclusion programs have provided real value for diverse writers seeking to either establish or sustain their careers in Hollywood, this study has also revealed a disconnect between the elements most commonly featured in these programs and those respondents actually viewed as the most career-enhancing. Several action items emerge in the wake of this disconnect that address the more prominent program shortcomings cited by respondents. By addressing these shortcomings head on, program sponsors may be better able to build on the value programs appear to provide in their current configurations. We recommend incorporating the following best practices into both new and existing programs aimed at increasing diversity and inclusion in the Hollywood industry.
• Improved Program Staffing. Respondents’ most common criticism of existing diversity and
inclusion programs related to what they viewed as insufficient or unqualified staffing, which they read as lukewarm support among program sponsors for the larger goal of advancing industry diversity and inclusion. Program sponsors should work to ensure that program leadership and instructors are both qualified and committed. Unconscious bias training should be a regular component of the certification process for program staff.
• Better Program Follow Up. Many respondents were also critical of what they viewed as insufficient follow up with program participants after their programs had ended. Program sponsors can address this shortcoming by facilitating networking opportunities between alumni of their programs, perhaps through the hosting of periodic alumni events and the maintenance and sharing of alumni databases.
• Improved Mentor Matching. Respondents report that mentorship can make a significant difference when mentors are both knowledgeable about the areas in which their mentees seek work and committed to following through with the mentor/mentee relationship. Program sponsors should more carefully match mentors to mentees in light of these considerations or dispense with this program element altogether in order to avoid setting unrealistic expectations.

• Enhanced Program Visibility. Several respondents lamented the lack of prestige that participating in the program conferred upon them, despite the rigorous selection process. Sponsors of lesser-known programs should do a better job of promoting their programs so that participants can more effectively deploy their participation as a calling a card for work opportunities.
• “Diversity Slot” Accountability. Network and studio sponsors of “diversity slot” programs should track individual showrunner success in integrating the diverse writers who occupy these positions into the writers’ room long term. Showrunners who have a dismal record in doing so should be held accountable.
• Adjust Program Duration. Shorter
duration programs were generally associated with higher levels of satisfaction among respondents, most likely due to the time demands placed on writers hoping to advance in a highly competitive industry. Program sponsors should (re)design their programs to provide targeted, intensive interventions that ideally last between one and six months.
In the final analysis, it’s important to underscore the point that respondents placed the most value on program elements that provided them with opportunities to network with peer writers, with insights about how to navigate industry culture, and/or with tips for branding themselves as writers in a highly competitive and insular industry. Less prominent among the
program elements respondents believed furthered their careers were those that actually focused on the craft of writing. Perhaps this should not be surprising. After all, the screening processes for participation in the programs described by respondents were all quite rigorous. Respondents’ experiences with these programs and their subsequent career outcomes likely had to do less with talent and more with opportunity ¾ with their respective programs’ success in positioning them to make the most of the voices they had already brought with them to the programs. To the extent that this conclusion is warranted, program sponsors should not be thinking about their programs as primarily providing remedial skills development for diverse participants. Instead, they should be thinking about their programs, first and foremost, as essential interventions for leveling a playing field that has traditionally disadvantaged diverse talent. The selection and implementation of program elements should carefully reflect this understanding. But in order to wholeheartedly embrace this understanding ¾ and to banish any stigma that may have been associated with participation in these programs in the past ¾ program sponsors must affirm the idea that expanding the range of storytellers in a diversifying America is a business imperative of the highest order. The success of Hollywood diversity and inclusion programs, as well as the continued success of Hollywood itself, will rest on this affirmation.

APPENDIX