the state of education 2015-2016 - inspectie van het …€¦ · number of mbo (senior secondary...
TRANSCRIPT

THE STATE OF EDUCATION
2015-2016 12-04-2017

1
FOREWORD
For two hundred years, our inspectorate has been reporting on the state of education in the Netherlands. We examine the quality of Dutch education and the extent to which it provides our children with the knowledge and skills they will need for their future participation in society. We also investigate whether all children have equal opportunities to optimally develop their talents. Looking back over this long period, it is evident that in recent decades, more and more pupils and students are earning high-level diplomas. Nearly half of the pupils in secondary education now obtain a senior general secondary (HAVO) diploma or a pre-university (VWO) diploma, and an increasing number of MBO (senior secondary vocational education) students is earning a level 4 diploma. Furthermore, in the last 20 years, higher-education intake levels have doubled. If you look further back in time, the emancipatory function of education is clear to see. For example, the social position of working-class children and women has improved substantially, a factor that has made the Netherlands stronger. We now live in a knowledge- based society in which independence, information literacy and the ability to anticipate and adapt to change are vital factors. It is therefore of great importance that every child receives the best possible education, regardless of their background or gender. However, in recent times, it has proved difficult to maintain this high level of education across the entire spectrum of pupils and students. The number of high-level VMBO (preparatory secondary vocational education), MBO and special-education diplomas continues to increase, but for the HAVO, VWO and higher-education levels, this trend has started to decline in recent years. The average marks obtained remain high, although they are either stable or in decline, and the group of high achievers has shrunk significantly in the past 10 to 20 years, especially with regard to arithmetic. The percentage of pupils achieving high marks for arithmetic, mathematics and natural sciences is dropping and in 2016, the percentage of primary-school pupils achieving the reference levels for arithmetic also declined. Our pupils are also underperforming with regard to citizenship skills. Although Dutch pupils are the happiest children in the world, their motivation to learn is low. As a result, opportunities are being missed and too much talent is going to waste, not only in the education sector, but also on the future job market. What is causing us to miss out on this talent? One reason – as we reported last year – is that children with less-educated parents have fewer development opportunities. However, this year, we have seen initial improvements in this regard: primary-school recommendations are being adjusted more often and intake levels of MBO students at universities of applied science (HBO level) are on the increase once again. However, the parents’ education levels still have a significant effect on their children’s education and with regard to work-placement and job-market opportunities, the disparity is even greater. Furthermore, students with an ethnic background are increasingly falling behind. Considerable disparity in the quality of schools is another factor causing us to miss out on talent. Imagine you have two girls from the same neighborhood with exactly the same intelligence and skills as well as parents with equal education levels, but one girl goes to a primary school on one side of the road and the other goes to the school on the opposite side. Despite these institutions both being local schools with the same type of pupils, after eight years one of the girls will progress to VMBO while the other will progress to HAVO. You would imagine that children would simply receive the education best suited to their talents and interests, yet it turns out that the school pupils attend has a significant effect on the academic path they take later in life. This disparity between schools applies in all sectors and at all types of school, from urban pre-university academies to rural primary schools. At some primary schools, pupils’ performances are one or two levels lower than similar pupils at different primary schools, and at some secondary schools, pupils are 20% less likely to earn their diploma than similar pupils at other secondary schools. In

2
addition, students taking a particular MBO or higher-education programme may have a 60% chance of success, while similar students in other programmes may have an 80% chance. Freedom of education in the Netherlands has given our country a rich variety of schools, each of which has their own individual style and content. This is a good thing, although it does mean different social groups are less likely to mingle at school. In addition, the Netherlands now has the greatest disparity in levels of secondary education in the world. As well as having a wide variety of perspectives regarding education and pupils/ students, Dutch schools also differ greatly from one another with regard to quality. These differences in level create a problem under the surface whose consequences are not easily apparent. However, when you look at the development of all of the children together it is clear that we are missing out on a great deal of talent. This includes the talents of the ‘excellent’ pupils, the ‘good’ pupils and the ‘average’ pupils. Although these pupils don’t require special attention, they still need somebody to recognise and develop their talents and to get the best out of them, regardless of what type of school they are attending. What makes some schools better than others? For starters, good teachers are extremely important. At schools with better performing pupils, the lessons are of greater quality and there is a greater number of good teachers. We also find that the teams at these schools are more united and that together with a strong school leader and administrator, they take the school forward based on a shared vision and ambition. The school boards also encourage and support their teachers’ professionalisation. Furthermore, those teachers have excellent insight into their pupils’ development. They monitor the pupils’ measurable and notable results, analyse what the pupils need and use this data in their classes to improve the quality of the education they provide. At other schools, such practices are conducted much less frequently, resulting in a lack of attention for and insight into the development of pupils and staff. Vision, team development and professionalisation are lacking. There are also a few dozen schools with so many problems that they have become overburdened, even after investing in school management and the teaching staff. As a result, sick leave is high, staff turnover is growing and an increasing number of underqualified staff are teaching the children. The pupils at these schools are the first to suffer from the worsening national shortage of teachers as underperforming schools are less attractive to teachers who can afford to pick and choose their workplace and the school becomes less attractive to parents with options. This sort of accumulation of problems fuels further disparity between these schools and others situated nearby. To halt a downward spiral such as this, you need a strong school leader and school board, and even then, extra internal and external support may be required. How can we optimally capitalise on the talents of all pupils? The examples provided by the high-performing schools offer a great deal of reference points. Firstly, policymakers must collectively consider how the disadvantages of the Dutch richly diverse education system can be mitigated and how the Dutch education system can continually achieve improvements that exceed the basic requirements. Not every school has to become an elite academy, but every school should be willing to continually learn and improve. Our inspector- ate can also contribute to this process: for example, our new monitoring and supervision methods will encourage schools and school boards to develop a true culture of quality in which they can apply their own insights to boost the quality of their education. We can also provide clearer insight into the disparity between schools. Another issue is how much pupils benefit from the distinct learning tracks offered during the first three years of secondary school, as the results achieved by pupils at different levels show a great deal of overlap. Every school board, school and region can conduct detailed analysis into improvement opportunities. The bedrock of quality education is a combination of good teachers, good school leaders and good administrators, and as such, targeted investment and extensive professionalisation in these areas should result in further improvements. Smart use of data and implementation of this data into everyday lesson practice plays a key role in this regard as it helps bring about visible and noticeable improvement and make the most of the pupils’ talents. Furthermore, those responsible for recruitment and advice must be made more aware of the unconscious prejudices prevalent in the education sector and on the job market in particular. It would be useful to investigate how collaboration between the education sector and the job market can help remedy this situation.

3
Finally, the school boards, municipalities and national government must collectively intervene in the
event that schools run the risk of becoming overburdened by problems, as this always has a negative
effect on the pupils.
We must all work together to ensure that no talents go to waste and that the education system does
justice to every child. This doesn’t mean that Anna and Isa, or Mehmet and Milan all have to become
elite students, but we owe them our support in becoming the best Anna, Isa, Mehmet and Milan that
they can be, regardless of who their parents are and what school they attend. After all, even ordinary
pupils need special attention.
Monique Vogelzang
Inspector-General of Education
Utrecht, 12 April 2017

5
1 Level and performance
Increase in higher-level diplomas ● In the past two decades, pupils and students have been earning increasingly high-level diplomas, a trend visible in all sectors. Within secondary education, more pupils are earning diplomas at the HAVO and VWO level and less at the VMBO level than was the case twenty years ago. Within special secondary education (VSO), more and more pupils are passing their exams, while at the MBO level, an increasing number of students is earning a level 3 or 4 diploma. Furthermore, in the last 20 years, higher-education intake levels have doubled. In recent years, the increase in the level of diplomas has halted in two areas: the percentage of VWO diplomas is declining and higher-education intake rate waned until 2016, at which point it rose again slightly. Dutch performance ranked among the sub-top ● Compared to other countries, the performance of Dutch pupils ranks among the sub-top. There are relatively few low-performing pupils, and in this respect we are doing well compared to other countries. However, our low number of high-performing pupils leaves us trailing our fellow nations in this regard. Another notable factor is that Dutch pupils’ marks have been either stable or slightly declining over the last 10 to 20 years compared to an improvement in results in many other countries. Decline in arithmetic/mathematics until 2015 ● In the period up until 2015, we observed declining performance in arithmetic and natural sciences at the primary level (TIMSS) and in mathematics and natural sciences at the secondary level (PISA), particularly among the good and high-performing pupils. The results in 2016 were a mixed bag. At the primary level, fewer pupils achieved the reference levels than in 2015. For the arithmetic tests, we saw that MBO performance remained stable and that the performance of secondary and special secondary pupils was higher in 2016 than in the previous year. Citizenship and motivation ● Pupils receive citizenship education at most schools, although it is not always equally effective and the schools have little insight into what the pupils actually learn. Furthermore, recent international studies have repeatedly shown that Dutch pupils are less motivated than pupils in other countries.
1a Educational level and performance More high-level diplomas Education level significantly increased in recent years ● In the past few decades, Dutch students have been earning diplomas at increasingly higher levels. For example, the percentage of university graduates has nearly doubled in the last 20 years and more MBO students now earn level 3 or 4 diplomas. Within secondary education, the proportion of HAVO/VWO diplomas to VMBO diplomas rose from 1 to 2 in 1990 to 1 to 1 in 2012. This means that Dutch students today have a higher level of education than in the past. Higher-level MBO diplomas, more VSO exams passed ● At the MBO level, the rising trend continued in 2016, with more and more students obtaining level 3 or 4 diplomas instead of level 1 or 2. The introduction of the entry-level programme has resulted in a significant drop in the number of level 1 diplomas and the percentage of MBO students who drop out of school continues to fall. At the VSO level, more and more pupils are passing their exams. Fewer VWO diplomas and lower higher- education intake rates Fewer VWO diplomas ● The rise in secondary-school diplomas halted in 2011 and the percentage of VWO diplomas has been declining in recent years. In 2012, 19.5% of secondary-school diplomas were VWO diplomas, but by 2016 this figure had dropped to 17.9%. At the VMBO level, the diploma level continues to rise. More and more pupils are earning a diploma at the VMBO C or T level or in the VMBO Advanced vocational track, and the percentage of pupils obtaining a VMBO Basic diploma has been steadily falling. Higher-education intake rate no longer in decline ● The intake percentages for higher education had been falling in recent years, due mainly to fewer MBO students progressing to HBO programmes. In 2016, more MBO students progressed to the HBO level, which arrested this decline, although the intake levels of HAVO and VWO students declined slightly. In absolute figures, higher-education institutions barely noticed this decline, as demographic trends and increased numbers of international students meant overall student numbers increased.

6
1b Learning performance 2015 performance among the international sub-top, but falling Pupils above average in arithmetic, mathematics and natural sciences ● In 2015, Dutch pupils once again performed well compared to pupils from other countries, with primary-school children achieving marks way above the international average for both arithmetic and natural sciences.11 Dutch secondary- school pupils also performed well, particularly in mathematics22. The Netherlands is currently in 6th place in the international rankings of OECD countries. Our country is also performing well in reading skills, occupying a respectable 12th place. Dutch pupils are also among the sub-top of OECD countries for natural sciences, achieving 11th place. Fewer low-performing and high-performing pupils ● Compared to other countries, the Netherlands has a relatively high percentage of pupils that achieve the basic level. In this regard, we are performing well compared to other countries. At the same time, a relatively low proportion of pupils are reaching the advanced level, with other countries achieving higher percentages in both primary (TIMSS) and secondary education (PISA). Decline mainly in arithmetic and mathematics ● In previous studies published by both TIMSS and PISA, pupils’ performances have declined compared to a few years ago. Reading performance has not fallen significantly, although over the last 10 to 20 years, Dutch pupils’ performance in arithmetic, mathematics and natural sciences has steadily declined, as can be seen in the infographics on page 16. The most significant decline in performance is in natural sciences at the primary-school level. The Netherlands is part of a small group of five countries whose test results were lower in 2015 than in 2011 (compared to 21 countries whose results were higher). The PISA study also shows declining Dutch performance in secondary maths and natural sciences. Particular decline among high-performing pupils ● The main decline in Dutch results is due to the lower number of high-performing pupils (see the bottom-left infographic on page 14), particularly in primary-school arithmetic. The percentage of high-performing pupils in arithmetic has declined from 50% to 37% in the past 20 years, with the percentage of pupils achieving the advanced level dropping from 12% to 4%. A similar decline is evident for mathematics at the secondary level, where over the course of 12 years, the percentage of high-level pupils has fallen from 25% to 15% and the percentage of advanced-level pupils has dropped from 7.3% in 2003 to 3.2% in 2016. Despite the greater focus on top talent, there has been no increase in the number of high-performing pupils in arithmetic and mathematics. Arithmetic test results in 2016 Fewer primary-school children achieve the reference levels for arithmetic ● In 2016, the percentage of primary-school children achieving the reference levels also fell (see infographic on the right-hand side of page 15). Although most primary-school pupils achieve the basic level for arithmetic, the percentage of children failing to reach this level has increased from 9% to 13% in the past year (approximately 17,500 pupils). The percentage of pupils achieving the target level last year was 44%, which was also lower than the 2015 figure (48%). The desired level of 50% was therefore not achieved in 2016. Relatively low results for MBO arithmetic test ● In the 2015-16 academic year, just one-third of MBO pupils at levels 2 and 4 achieved a passing grade on the arithmetic test, while just over half of the MBO 3 pupils passed the test. This is comparable to the situation one year earlier. In general, MBO students are satisfied with the explanations provided by teachers, but also mentioned several issues. For example, they found it demotivating that arithmetic does not count towards their diploma, they sometimes feel they are not challenged enough, behaviour in class is sometimes disruptive and pupils often do not know what material they need to know for the exams.
1 Meelissen, M.R.M. & Punter, R.A. (2016). 20 years of TIMSS: Development of primary-school children’s performance in the natural sciences
(1995-2015). Enschede: University of Twente 2 Feskens, R., Kuhlemeier, H. & Limpens, G. (2016). An overview of the 2015 PISA results. Practical knowledge and competencies of 15-year-
olds. Summary of the Dutch results of the Programme for International Student Assessment (PISA) in the field of natural sciences, reading skills and mathematics in 2015. Arnhem: Cito

7
Arithmetic results for VSO and secondary-school pupils ● In 2016, pupils at both special and regular secondary schools performed better in arithmetic than they did in 2015. One notable factor is that the arithmetic skills of VSO exam candidates were comparable to those of exam candidates at regular secondary schools. VSO pupils who take the exam are therefore performing equally as well as regular pupils. Of these regular pupils, HAVO pupils were the most likely to fail arithmetic (40%). At the VMBO C or T level, this percentage is just 12% and only 5% of VWO pupils receive a failing mark. Another notable factor is that at the secondary level, the quality of arithmetic varies greatly between different schools and departments. This disparity in quality is amplified by the difference in qualification levels of the staff teaching arithmetic. Furthermore, school leaders report that 40% of the teachers have never taken a course or additional training in teaching arithmetic. Significant overlap in results for different levels of secondary education Significant performance overlap between different levels of secondary education ● There is notably large variation in the performance of secondary-school pupils at the same educational level, and as a con- sequence, a lot of pupils at different levels are achieving similar results. This becomes clear when you compare the PISA scores between the different levels. The infographic in the bottom-right corner of page 15 displays the performance levels of 15-year-old pupils. In all cases, there is a great deal of overlap between the results of pupils at different levels. The infographic clearly shows that the top 50% of VMBO Basic pupils achieve the same results as the average VMBO C or T pupil and that the top 50% of HAVO pupils achieve similar results to the average VWO pupil. The results of the other tests display the same level of overlap. This begs the question of whether a lot of pupils are at a level that is either too high or too low for them. Similar pupils in different transition classes ● As early as the first year of secondary education, there is already great disparity in the cognitive performance of pupils at the same level, and significant overlap exists between the performances of pupils at different levels. One reason for this is the process of advice, school selection and placement during the transition from primary education to secondary education. For example, at some schools, pupils with a score of 541 on the Central Attainment Test (CAT) are placed in a homogeneous VWO class, while at other schools, pupils with the same score are regularly placed in a VMBO C or T or a HAVO transition class. In addition, pupils and their parents often pick specific transition classes. Both pupils and schools make a diverse range of decisions, resulting in major variation in first-year levels selected for cognitively similar pupils.

8
Results declining on the international stage Dutch pupils in the fourth year of primary school perform above the international average in arithmetic and natural sciences, although the results display a negative trend. In 2015, Dutch 15 year-olds performed less well in international tests in natural sciences and mathematics than in 2012, although the results in reading skills did not decline significantly. The drop in performance level was caused mainly by the lower number of high-performing pupils.

9
Fewer VWO and VMBO Basic diplomas The percentage of both VWO and VMBO Basic diplomas has fallen in the past five years, while the percentage of HAVO and VMBO Advanced diplomas has risen.

10
Poorer arithmetic results at the end of primary school In 2016, more primary-school children failed to reach the 1F level and fewer pupils achieved the Target level 1Sl. However, more pupils in secondary education and special secondary education achieved passing marks in the arithmetic tests. In 2016, the MBO pupils achieved arithmetic scores comparable to those in 2015.
Significant overlap in secondary-school results The results of the top 50% of HAVO pupils are the same as those of the average VWO pupil and the results of the top 50% of VMBO Advanced pupils are the same as those of the average VMBO C/T pupil.

11
Level and performance Results declining on the international stage ● Dutch pupils in the fourth year of primary school perform above the international average in arithmetic and natural sciences, although the results display a negative trend. In 2015, Dutch 15-year-olds performed less well in international tests in natural sciences and mathematics than in 2012. Although the results in reading skills did not decline significantly. The drop in performance level was caused mainly by the lower number of high-performing pupils.
1c Citizenship education and motivation to learn Citizenship skills leave much to be desired Citizenship skills average, citizenship knowledge lagging behind ● No recent international studies into pupils’ citizenship skills exist. In a 2009 study of secondary-school pupils, Dutch pupils were rated as average on the international stage,3 although they had relatively little knowledge of good citizenship, particularly compared to pupils from other European countries. The proportion of pupils in the lowest category for knowledge of good citizenship (43%) was relatively high compared to other European countries. Nearly a quarter (24%) of pupils were in the highest category for knowledge of good citizenship. Knowledge of good citizenship differs at each level ● There is major variance in knowledge of good citizenship between VMBO pupils and HAVO/VWO pupils, a factor that is evident as soon as they begin secondary education. The differences in citizenship knowledge between the various social groups are found in all countries with selective education systems, including the Netherlands. Attitude regarding citizenship ● The majority of Dutch schoolchildren support social equality and equal political rights for citizens. If we compare the attitude of Dutch schoolchildren to those in other nations, the Netherlands has a comparatively larger proportion who reject the principle of equal rights. This difference with other countries does not apply to other social themes such as confidence in the government and support for freedom of speech.4 Improvement in citizenship education needed • Recently, we reported that citizenship development in primary and secondary education has been stagnating.5 There is little coherence and goal-orientation regarding citizenship education and there is no insight into what it teaches the pupils. Although reinforcement of the conditions for citizenship education is required, there are definitely reference points to improve the situation. For example, the schools collaborating in the Alliantie Burgerschap (Citizenship Alliance) show that it is perfectly possible to monitor results, and many schools think that despite beliefs to the contrary, citizenship education does not have to be ‘complicated’ or ‘sensitive’ regarding differences of opinion on standards and values.6 Motivation to learn lagging behind
3 Schulz, W., Ainley, J., Fraillon, J., Kerr, D. & Losito, B. (2010). Initial findings from the IEA international civic and
citizenship education study. Amsterdam: IEA.
4 M.M. (2012). Pupils’ citizenship skills in the lower years of secondary education. Final Report by the International
Civic and Citizenship Education Study (ICCS) in the Netherlands. Groningen: GION, University of Groningen.
Maslowski, R., Werf, M. P.C.V.D., Oonk, G.H., Naayer, H.M. & Isac,
5 Inspectorate of Education (2016). Citizenship at school: a description of citizenship education and socially-oriented
work placements. Utrecht: The Inspectorate of Education.
6 Nieuwelink, H., Boogaard, M., Dijkstra, A.B., Kuiper, E.J. & Ledoux, G. (2016). Citizenship education: what schools
can do. Theoretical and practical lessons. Amsterdam: Kohnstamm Institute.

12
Secondary-school pupils unmotivated • The recent PISA study repeatedly shows that compared to pupils in other countries, Dutch pupils have less motivation to learn. Within secondary education, a very low proportion of pupils find mathematics and physics interesting. In a previous study, PISA showed that 50% of Dutch pupils do not read for fun and only 20% of pupils read every day. Compared to other countries, Dutch pupils are also less prepared to work hard and do their utmost to solve the most difficult problems. They are more likely to avoid complex problems and lose interest in the subject matter sooner. One particularly notable factor is that the parents’ education levels make little difference to the pupils’ motivation levels: in the Netherlands, pupils with highly-educated parents have much the same motivation levels as pupils with less-educated parents. The motivation of secondaryschool pupils appears low across the board, and not particularly among the children of less-educated parents.7 Primary-school children also less motivated • Dutch primary-school pupils are also less motivated than pupils in other countries. Just one-third of Dutch pupils in the fourth year of primary school say they enjoy arithmetic a lot, while the international average is 46%. For natural sciences, the Dutch figure is 46% compared to the international average of 56%. Pupils in only 6 of the 49 countries enjoy arithmetic less than Dutch pupils. Dutch schoolchildren also appear to be less result-oriented than in other countries. Greater motivation towards the end of primary school Recent studies also show that pupils’ attitudes change in the last two years of primary school, with more pupils displaying a positive attitude towards schoolwork.8 This increase suggests that pupils work harder towards the end of primary school and are aware of the importance of the final year. Although the pupils in the sixth year of primary school have a more positive attitude towards their work, their motivation does not necessarily show a similar increase. It is likely that parents and teachers encourage the pupils to do their best in this year and pupils may well work harder to gain admission to the highest possible level of secondary education.
7 OECD (2013). PISA 2012 results. Ready to learn: students’ engagement, drive and self-beliefs. Volume III. Paris: OECD. 8 Hornstra, T.E. (2013). Motivational developments in primary school: group-specific differences in varying learning contexts.
Amsterdam: University of Amsterdam (thesis).

13
2 Equal opportunities?
Growing inequality • Last year, we reported on the increasing inequality within the education system, with increasing gaps in educational opportunities between pupils with less-educated parents and pupils with highly-educated parents. By this, we mean that pupils with less-educated parents are less likely to earn a high-level diploma than pupils with highly-educated parents. This increasing inequality was particularly evident in the recommendations issued to primary-school leavers, the early years of secondary education and the intake levels for higher education. In general, this situation remains unchanged, although a couple of initial improvements have been made: within primary education, recommendations are now more frequently adjusted and more students with MBO level 4 diplomas are progressing to the HBO level. These are encouraging developments. Transition from primary to secondary school remains problematic • The progression of pupils from primary to secondary education remains a problem area with regard to equal opportunities. One positive development is that in 2016, higher test results generated twice as many recommendations being adjusted, although this failed to reduce the disparity between recommendations for pupils with less-educated parents and highly-educated parents. In fact, this disparity actually increased slightly, as the adjustments were more often made for pupils with highly-educated parents, due in part to the fact that these parents were more insistent. In addition, there are major differences within year 1 of secondary education. Pupils with less- educated parents are more likely to select a broader or lower-level transition class, while pupils with highly-educated parents more frequently choose a homogeneous transition class at the highest possible level. Pupils with less-educated parents are more frequently offered lower-level education and are more likely to drop down half a level or even a full level in the initial years of secondary school. The rising trend in the level of pupils with highly-educated parents has caused the disparity between the two groups to increase in the lower years of secondary education. Labour-market alignment • The transition from education to the job market is another problem area with regard to equal opportunities. In relation to the transition from MBO and HBO to the job market, huge differences exist between graduates from different backgrounds. Graduates with a non-Western migrant background are more likely to be unemployed than other graduates with similar diplomas. These differences have increased substantially in the past 20 years, although they seem to have decreased over the past year. The difference in job-market opportunities is also reflected by how easily students find work placements during their course.
2a Early childhood education (ECE)
ECE is good for quality, yet separates groups even more Programmes effective for target-group children ● Most municipalities offer ECE programmes for children who are or are at risk of lagging behind (referred to as target-group children). An estimated 35% of children of preschool age are issued with an ECE recommendation. In recent years, the range and scope of ECE has increased considerably,9 although the number of target-group children actually participating in an ECE programme varies between the different municipalities. In particular, children from the poorest families are less likely to attend ECE programmes or nursery. The target-group children who do attend ECE do not catch up entirely, although they do reduce the learning deficit somewhat.10 Their vocabularies catch up to a degree and
9 Inspectorate of Education (2017). Investment pays off! Final report of the 2015-16 quality monitor for early childhood education in the 37 major towns and cities. Utrecht: The Inspectorate of Education. 10 Leseman, P. & Veen, A. (ed.) (2016). Child development and the quality of preschool institutions. Results from the pre-COOL cohort study. Amsterdam: Kohnstamm Institute.

14
their attention levels also improve. However, this does not apply to their arithmetic skills. The CPB also shows that children who attend ECE are less likely to be held back a year.11 Different groups: non-ECE, playgroup and nursery ● Before starting school at the age of four, 90% of Dutch children attend playgroup or nursery. Children from the highest income groups mainly attend nursery and children from the lowest income groups attend playgroup. The majority of children who do not attend ECE are in the lowest income groups.
Higher quality of ECE programmes ● Playgroups make the most use of ECE programmes, although nurseries are also making greater use of ECE. In general, the quality of playgroups/nurseries that offer ECE programmes is better than that of those institutions that do not.10
2b Transition from primary to secondary education Equal opportunities and recommendation trends Growing inequality regarding recommendations ● Last year, we showed how children with highly-educated parents are not only more likely to be given a higher recommendation than children of less-educated parents, but that this gap has widened in recent years. The disparity also applies when you take into account the children’s cognitive abilities. More adjustments in 2016 ● The increasing inequality in recommendations has been the focus of much attention in the education sector. It seems that in reaction to this issue, teachers have become more likely to adjust the recommendations, as in 2016, twice as many recommendations were adjusted. Also, in 2015, 17% of pupils were issued a recommendation that was one level lower than their test results, while this figure dropped to 15% in 2016. Slightly higher recommendations in 2016 ● The average recommendation level increased very slightly in 2016. Due to the decline in test results and greater reluctance to issue lower recommendations, the percentage of pupils with a relatively high recommendation increased. In 2015, an average of 12% of pupils were issued with a recommendation that was one or more levels higher than their Central Attainment Test results would suggest. In 2016, this figure rose to 14%. No decrease in inequality ● The different recommendation practices in 2016 did not result in a decrease in inequality. Although pupils with less-educated parents (MBO level 1 or below) are now considerably less likely to be issued with a lower recommendation, the main beneficiaries of the new practices in 2016 were the children of highly-educated parents. Their recommendations were more frequently increased following the CAT, and in 2016, they were more likely to be issued with a higher-than-expected recommendation based on their test results, partly due to their parents’ insistence. Teachers often have difficulty withstanding this kind of pressure from parents. As a result of these developments, the gap between pupils with less-educated parents and those with highly-educated parents widened. Over-recommendations and under-recommendations for high achievers ● One example clarifies the scale of the recommendation gap: you would expect pupils who score highly on the attainment test to receive a VWO recommendation. However, this is often not the case. Pupils with less-educated parents are much more likely to receive a lower recommendation than pupils whose parents went to university. The teachers of 25% of the pupils with less-educated parents who scored 549 did not believe the child would be suitable for the VWO level, making them five times more likely to be issued with a lower recommendation than pupils whose parents went to university. Higher recommendations in urban areas ● The recommendations also differ strongly from region to region. Certain regions, such as Haarlem, the Zaan district, Greater Amsterdam, Delft and Westland, tend to issue
11 CPB (2016). Promising education policy. The Hague: CPB Netherlands Bureau for Economic Policy Analysis.

15
relatively higher recommendations, while others, such as East Groningen, North Limburg, Delfzijl and district and South-East Drenthe, issue relatively lower recommendations. The town, city or village in which pupils live also has a significant impact on the recommendations (in relation to the test results). Pupils in urban areas are more likely to receive a higher recommendation based on their CAT score and less likely to receive an under-recommendation. The influence of urbanity on the recommendations has increased since 2014. Equal opportunities in school selection and secondary-school placement Equal test scores, yet different transition/regular classes ● There is a great deal of variance in the type of transition class or regular class to which pupils with equal test scores are assigned, as can be seen in the infographic in the bottom-left corner of page 23. This shows the recommendations issued to pupils in year 1 of secondary school in 2014-15 and the CAT scores they achieved in the 2013-14 academic year. A relatively large proportion of the children were placed half a level or more below what would have been expected based on their CAT score. This is particularly noticeable forhigh-scoring VWO pupils (the dark-blue bars). 30% of the pupils with the highest CAT scores were placed in a HAVO/VWO transition class. The infographic also shows that a substantial percentage of pupils in year 1 are at a higher level than would be expected based on their CAT score. At least 20% of pupils with a score that would suggest a VMBO C or T recommendation are actually in a HAVO/VWO transition class: these are mainly pupils with highly-educated parents. Gap widened by choice of transition class ● In addition, it has been found that children of highly- educated parents who receive a particular CAT score and are issued with the same recommendation as a fellow pupil with less-educated parents are more likely to be assigned to a higher education level in year 1 of secondary school. This is because children of highly- educated parents are more likely to be placed in a higher type of transition class than children of less- educated parents. On page 23, you can see that the education level of the parents also has an impact on the percentage of pupils with a CAT score of 545 who are placed in a homogeneous VWO transition class at secondary school. This is the case for half of the children of highly-educated parents, but only a quarter of the children of less-educated parents. Pupils with highly-educated parents are more frequently placed in different types of transition classes and at different schools from pupils with less-educated parents. Increasing diversity in the classrooms More variety in class levels at the secondary level ● In the past two years, the pupils’ learning performance has become a less decisive factor in the recommendation and placement process for year 1. This has had two consequences: Children of highly-educated parents with low test scores are more frequently assigned to the HAVO and VWO level due to a relatively ‘high’ recommendation and their choice of a certain school or transition class. Children of less-educated parents with high test scores are more frequently assigned to lower education levels due to a relatively ‘low’ recommendation and their choice of a certain school or transition class. This means that at secondary schools, there is greater variety in the education levels of the pupils in each class: a difference that has been increasing over the years. In the most heavily urbanised areas, this variance has increased more significantly than in more rural areas. Level transfers in the early years Lots of level changes in the lower years of SE ● Many pupils switch levels during the first years of secondary school. By year 3, one-quarter of the pupils are one whole level higher or lower than the level of the transition class to which they were originally assigned. Just half of the pupils remain at the same level as their original transition class.

16
Increased inequality upon entering the job market In recent years, the unemployment percentages for graduates and people with migrant backgrounds have differed more significantly than in the past. This is particularly the case for MBO graduates.

17
Lots of level transfer in thelower years of SE A great deal of pupils change levels in the first years of secondary school. Between years 1 and 3, pupils with less-educated parents more frequently transfer down than pupils with highly-educated parents.

18
Higher-education intake opportunities In recent years, higher-education intake rates have fallen for nearly all groups. This decline was most significant for prospective students whose parents hold an MBO level 2 diploma or lower. However, this decline halted in 2016.
Inequality regarding level transfers ● The transfers during the lower years of secondary education are disadvantageous to children of less-educated parents. This group is more likely to transfer to a lower level (known as transferring down) than pupils with highly- educated parents, as can be seen in the infographic in the top-left corner of page 23. It shows that children of highly-educated parents are far less likely to transfer down and the likelihood of transferring up is greater. The same pattern is reflected by the data on the recommendations and the results of the attainment tests. Type of transition class decisive factor in transfers during lower years of SE ● The level transfers during the first years of SE are closely related to the type of transition class that the pupils are in. We have already seen that high-achieving pupils with university-educated parents are more frequently assigned to homoge- neous VWO transition classes and that high-achieving pupils whose parents are not university educated are more frequently placed in a HAVO/VWO transition class. This can affect the level of the curriculum they are offered. By year 3, pupils assigned to a VWO transition class are more frequently at the VWO level than those beginning in a HAVO/VWO transition class, as can be seen in the infographic in the bottom-right of page 23. The same pattern is evident for pupils of VMBO T and HAVO transition classes. In all cases, the type of transition class was specifically chosen and this decision amplifies the gap between pupils with highly-educated parents and pupils with less-educated parents. More transfers following discrepancies between recommendations and test results ● Pupils whose recommendations were relatively high or low compared to their test results transfer significantly more often. As expected, pupils issued with a lower-than- expected recommendation based on their CAT score more often move

19
to a higher level (transferring up) and pupils issued with a higher-than-expected recommendation more frequently drop down a level (transferring down). The pupils in both groups transfer far more often than pupils whose recommendations matched their test results. Only a few percent of this latter group transfer up, and only a few percent transfer down. By contrast, only a few percent of the pupils with a relatively higher or lower recommendation remain at the level at which they started, with the majority of these pupils transferring to a higher or lower level. If their recommendation was relatively low, then they are more likely to transfer up, although surprisingly enough, they are also more likely to transfer down. The reverse is also true: the pupils whose recommendations were relatively low are both more likely to transfer up and more likely to transfer down. Therefore, pupils whose recommendations and test results do not match change levels more frequently during the lower years of secondary school. Consequences for the education levels in year 3 ● Level transfers during the lower years of SE are closely related to the composition of the transition class. For example, pupils with similar test scores who are placed in a VWO class rather than a broad transition class are twice as likely on average to remain at the VWO level in year 3. The same correlation applies to pupils assigned to a VMBO T/HAVO transition class or in a HAVO transition class. For all pupils, the higher the level they are assigned, the more likely they are to reach a higher level. Relatively high number of pupils staying back a class ● In the Netherlands, a relatively high number of pupils switch classes, levels and schools. To prevent them from having to transfer down, a relatively high number of children in the Netherlands are kept back a year, a percentage that is also high in comparison with other countries.
2c Equal opportunities at the MBO level and in higher education
Inequality at the MBO level Inequality in academic careers at the MBO level ● At the MBO level – just like in secondary education – we see differences relating to the parents’ academic background. Students with less-educated parents more often fail to earn a diploma than students with highly-educated parents, and the level of the diploma is also affected by the parents’ education level. The higher the qualifications of the parents, the less likely a student is to earn a lower-than-expected diploma and the more likely they are to obtain a higher-than-expected diploma (expectations based on their entry level). Migrant backgrounds ● Students with a migrant background are also more likely to drop out, although on average, those that do not are more likely to earn a diploma at a higher (than expected) level than students without a migrant background. Their admission levels to higher education have not decreased further. Higher-education intake opportunities ● Since 2008, prospective students with less-educated parents have had increasingly diminishing chances of being admitted to a higher-education programme. In 2016-17, opportunities for this group increased for the first time in years, as shown by the infographic in the top-right corner of page 23. It shows the intake percentages in recent years broken down according to the education level of the parents of prospective students (HAVO, VWO and MBO level 4 graduates). Slight improvement in intake levels ● In 2016, there was a slight improvement in higher-education intake opportunities, particularly for prospective students with less-educated parents. This is certainly a positive development. This increase is mainly due to the higher numbers of MBO level 4 graduates being admitted to HBO programmes, and as a result, the difference in intake opportunities between children of less-educated parents and highly-educated parents dropped from 28% to 27%.
2d Inequality on the job market Job market ● Coherence between education and the job market is improving. For MBO, HBO and WO graduates, the likelihood of finding a job (at the appropriate level) has been increasing in recent years.12 Graduates find a job appropriate to their education level sooner. However, this increase does not apply equally
20
to all types of graduate: in recent years, the gap in job opportunities between holders of different types of diploma has increased more significantly than in previous years. Inequality on the job market is there- fore on the rise. Inequality on the job market for MBO graduates Inequality of job opportunities affects MBO graduates most ● Graduates with a non-Western migrant background – especially MBO graduates – have more difficulty finding a job than the other groups of graduates. 6% of native Dutch graduates of the school-based vocational track (BOL) are still unemployed one year after graduating, compared to 20% of BOL graduates with a non-Western migrant background. Having a migrant background is a much greater cause of inequality than the parents’ education level, and the inequality has been increasing in recent years. This is clearly reflected by the infographic at the bottom of page 22, which displays the difference in unemployment rates between graduates with and without a migrant background (equal-opportunities infographic). In 2001, the difference in the unemployment rates of native Dutch and non-Western MBO graduates was 5 percentage points, compared to 12 percentage points in 2015: a clear increase. However, this difference decreased slightly in 2015. Opportunities differ between sectors ● There is also inequality between the sectors in which students earn their diplomas. The Behaviour & Society sector and the Economics sector in particular display the greatest inequality of job opportunities. This inequality has also increased substantially since 2008. According to the ROA research centre, the differences in job opportunities are greatest in the private sector and among professions involving a great deal of customer contact.12 Inequality in work-placement opportunities ● Some MBO students are able to find a work placement more easily than others. This is another instance in which students with a non-Western migrant background are significantly disadvantaged. 31% of BOL students with a migrant background say they have difficulty finding a work placement compared to 22% of students with a native Dutch background. The percentage of students that have difficulty finding a work placement is highest among students with a Moroccan migrant background. MBO programme staff report that employers some- times prefer native Dutch students but the program- mes don’t actually say anything about this for fear of losing good-quality work placements. Inequality on the job market for HBO graduates Inequality in job opportunities for HBO graduates ● With regard to progression from HBO to the job market, the pattern is similar to that of the MBO level: graduates’ job opportunities have improved but the gap between native Dutch graduates and graduates with a migrant background has also increased. 4% of the 2015 graduates without a migrant background were still unemployed one year later, compared to over 11% of graduates with a non-Western migrant background. This gap has been increasing since 2001 (also the case for MBO graduates), as displayed by the infographic at the bottom of page 22 in which the yellow lines highlight the difference in unemployment rates for HBO graduates. In 2001, the difference between native Dutch graduates and graduates with a non-Western migrant background was two percentage points, while by 2015, this gap had increased to over six percentage points. Just like in the MBO sector, the difference in job opportunities is largest in the Behaviour & Society sector and the Economics sector, although this gap has closed slightly over the past two years.
12 ROA (2016). School leavers between education and the job market 2015. Maastricht: Research Centre for
Education and the Labour Market (ROA).

21
3 Disparity between schools
Major disparity in learning performance ● There is a great deal of variation in the learning performance of Dutch schools. The level of disparity between Dutch secondary schools is greater than in other countries and there are also major differences between institutions and programmes with similar pupils/students. The school or university these pupils/students attend and the programme they choose has an effect on the development of their talent. Variety and disparity of quality ● The variety of schools is a very positive factor that increases diversity, giving parents, schoolchildren and students a rich selection of educational institutions and programmes and enabling them to choose the one that suits them best. However, there is also great disparity in the quality of the education provided by these schools, and the basic conditions – such as the available budget and teaching staff – also differ from institution to institution. Specialisation and segregation ● Nowadays, different schools and programmes are more likely to specifically focus on a particular concept or profile, which means they attract more specific groups of pupils/students. Specialisations such as these sometimes amplify the disparity between different institutions or programmes in the same school, region or municipality. Overburdened schools ● It can sometimes occur that schools are hit by a variety of social problems such as difficult pupil populations and significant divides between the pupils and teaching staff. As a result, these institutions are forced to perform extra social functions. This can sometimes result in a downward spiral that can only be halted by an effective school board and a strong school leader, and sometimes extra external support is also required.
3a Major disparities in performance between different schools/ programmes Noticeable disparities between institutions and programmes Greater disparity between institutions than in other countries ● In the Netherlands, the performances of secondary schools are more varied than in other countries,13 as can be seen in the infographic on the right-hand side of page 31. This infographic displays the scale of the disparity in secondary schools’ PISA natural-sciences scores. No other country has a higher degree of disparity than the Netherlands. To a great extent, the variation in the PISA scores is explained by the fact that different secondary schools each offer a different level of education. However, the disparity in performance remains high in the Netherlands even when compared to countries with similar systems such as Switzerland, Germany and Belgium. Furthermore, the much higher disparity in performance between Dutch schools can be explained by aspects of the individual institutions such as the learning climate, teacher quality or the subject matter that the children learn.14 Disparity in performance between similar populations ● The variety in different schools’ performances is also noticeable when we compare schools with similar pupil populations, as can be seen on page 30. The left-hand infographic displays the pupil weighting of the different primary schools compared to the average score on the CAT (averages taken over three years). It is clearly apparent that the average scores on the attainment test differ greatly among both schools with a high number of weighted pupils and schools with few weighted pupils. Some schools with an average number of weighted pupils achieve an average score of below 530 while others score above 540. The same disparity is apparent between schools with few weighted pupils. In addition, some schools with lots of weighted pupils achieve average scores of below 525 while others exceed 535. The test results of schools with equal numbers of weighted pupils differ between 10 and 20 points, which amounts to a difference of one or more education levels when applied to primary-school recommendations.
13 OECD (2016). Reviews of national policies for education. Netherlands 2016. Foundations for the future. Paris:
OECD. 14 OECD (2013). PISA 2012 results. Ready to learn: students’ engagement, drive and self-beliefs. Paris: OECD.

22
These huge disparities in average test results even exist between schools in the same district. We also see equally significant disparities when we compare primary schools with pupils from different backgrounds (parents’ education level, income, ethnic background, Statistics Netherlands pupil weighting). Major disparities in secondary education ● Similar disparities are also evident in secondary education. The infographic on the right-hand side of page 30 displays the correlation between the percentage of weighted pupils at each school and the pass rates of VMBO C or T pupils (averages taken over three years). These figures also show substantial disparity between the schools. Some schools achieve a 75% pass rate, while other schools whose pupil populations have similar backgrounds achieve 100% pass rates. This disparity is also evident when we compare schools based on all categories of pupil backgrounds and on different performance criteria. In all cases, the disparity between schools with similar pupil populations is conspicuously large. MBO and HE diploma rates for individual programmes ● MBO and HBO students enrolled in particular programmes are more likely to graduate than students of other programmes. The performance rates between different programmes differ greatly. The disparity between all of the different MBO and HBO sectors is reflected by the infographic on page 31, which displays the programmes’ success rates in relation to the students’ social status (determined by the district status score). The greater the status score, the richer and more educated the district is. The infographic shows the considerable disparities between programmes, including those with reasonably similar student populations. Some programmes have a 40% graduation rate, while others are as high as 90%. Is talent going to waste? Disparity in schools’ talent development ● The considerable disparity between different schools seem to indicate differences in the ability to develop talent. At particular institutions and within particular programmes, pupils and students are more likely to pass than in others. It seems that some of the schools are better at getting the most out of their pupils’ talents than others, which can have significant consequences for their future academic career. Underperforming primary schools produce underperforming pupils ● When you examine the academic careers of pupils who attended underperforming primary schools, it is clear to see that some schools offer their pupils greater opportunities than others. Attending an underperforming primary school creates a gap that pupils are unable to close during secondary school. By year 3 of secondary school, these pupils are nearly half a level lower than pupils who attended good-quality primary schools. Pupils from weak primary schools who go on to study at the VMBO level would probably have been capable of the HAVO level if they had attended a better primary school.
3b Quality of the educational process and basic conditions Differences in quality Disparity in educational quality ● There are also significant differences in the quality of the schools’ education and educational processes, as has been observed by inspectors visiting the schools. This variety applies to all sectors in the Dutch education system, from primary school to higher education. Characteristics of a good primary or secondary school ● There are a number of factors that enable schools to get the most out of their pupils, the most important of which is the quality of the lessons. To ensure good quality, you need a task-focused working climate, active pupil involvement and clear explanation. A pupil-monitoring system, structural pupil care and extra material for pupils that need it (e.g. children with language deficits) also contribute to better performance. In addition, good and excellent-quality schools frequently have strong teams, focus a great deal of attention on professionalisation and improvement and have a strong school leader.

23
Good-quality lessons ● The importance of high-quality lessons is clearly evident at primary schools with lots of pupils with less-educated parents. Schools like these where the pupils achieve good or excellent results usually give very high-quality lessons. The schools that achieve lesser results often give lower quality lessons. The main distinctive factors in lesson quality are a task-focused working climate and clear explanation during the lessons. MBO success factors ● At the MBO level, programmes often have good insight into the quality of the education, including within teams. In these teams, targeted effort is devoted to ensuring students receive high-quality education, and lecturers and staff actively work on quality control. The more intensively employees focus on quality control, the more significant the improvement in quality. This strong team focus is usually combined with higher quality in other aspects of the education process. It is also often the case that educational leadership helps ensure everyone within the programme is on the same page when it comes to the quality and optimisation of education and exams. Relevance of HBO satisfaction ● The disparities in graduation rates between comparable student populations are also evident at the HBO level. Within programmes with a relatively high number of students from poorer areas, a noticeable factor is that higher graduation rates often correlate with higher student- satisfaction scores. Programmes with high graduation rates have 11% higher scores for student satisfaction than other programmes (77% compared to 66%). Effect of basic conditions (teaching staff, finances) Teacher shortages affect every school differently ● The basic conditions that affect schools and programmes differ greatly. For example, some schools and programmes have no difficulty whatsoever in attracting high-quality teachers. How easily schools fill vacancies and the quality of the applicants differs considerably between individual schools and programmes. These differences are sometimes regional, although the basic conditions within these regions also differ greatly. For example, it may be true that the shortage of primary- school teachers is mainly a problem affecting the Randstad conurbation, but even in the big cities schools often differ from each other. For example, teachers looking for a job are more likely to choose schools with an easier pupil population, so vacancies at schools with a more challenging pupil population are harder to fill. At the secondary level, the shortage of German teachers and teachers of technical subjects also hits some schools harder than others. Qualified and unqualified teachers ● As the pool of available qualified teachers differs for each school, the percentages of unqualified teachers working in the secondary-school sector also differ. At 15% of the schools, all of the lessons are given by qualified teachers, while at 25% of the schools, more than 10% of the lessons are given by unqualified teachers. At 2% of the schools, unqualified teachers conduct more than a quarter of the lessons. Sometimes this is a conscious decision by the school, and at other times they simply don’t have enough qualified teachers. At schools with more children of less-educated parents, the percentage of lessons conducted by an unqualified teacher is much higher than at other schools. We also see similar patterns with regard to sick leave: the more pupils with less-educated parents a school has, the greater the variation and the higher the sickness-absence rate.

24
Major differences between schools in the same street When two or more schools share a postal code, they sometimes have considerably different pupil populations: this is so in nearly 10% of cases.
• Less-educated parents with anon-Western migrant background • Higher-educated parents with a Western or no migrant background • Higher-educated parents with a non-Western migrant background • Less-educated parents with a Western or no migrant background
Major disparity in learning performance and success rates Schools with comparable pupil populations differ greatly with regard to test scores and success rates, a disparity that is also evident between MBO and higher-education programmes with similar student populations.

25
The Netherlands has the highest level of disparity between schools of all OECD countries. However, within the individual schools, there is little variation in performance.

26

27
Pupil backgrounds at primary schools in the same neighbourhood
Budget inequalities ● Spending power also differs greatly between schools and programmes. Some schools or programmes have extensive resources, others do not. Exact figures on the spending power of each school and programme and the distribution of resources within these schools/programmes are not available.
3c School profiles School profiles and recruitment of pupils More distinctive profiles ● In all sectors, schools and programmes compete with each other for the best pupils and students. Schools mainly establish reputations by offering high quality or by focusing on specific concepts or working methods, a process that boosts the quality and diversity of our education system. Inspectors have observed a trend for schools to distinguish themselves by focusing on specific concepts and working methods, and this trend is reflected in the increase in schools with a specific profile. In addition, more and more schools are offering special programmes, e.g. for gifted children, children who speak English/other languages, autistic children etc. We have also noticed an increase in the number of pupils at Islamic schools. As mentioned before, the specialistion of these schools results in greater educational diversity and more choice. Differences in pupil populations ● School profiles in combination with differences in pupils’ and parents’ school choices means that schools are more likely to attract pupils and students from similar backgrounds. This factor is particularly noticeable in schools that share a postal code. Such schools are often situated next door to each other and sometimes share playgrounds, yet these neighbouring schools some- times have very different pupil populations. The infographic at the bottom of page 31 show the pupil populations of three primary schools that share a postcode. Despite being situated next door to one another, their pupil populations differ greatly. Segregation ● In Section 1a, we raised the issue that primary and secondary schools are becoming more heterogeneous with regard to the pupils’ cognitive abilities: at each level, the pupils’ results differ greatly. However, when we examine the education level and income of the pupils’ parents, then primary-school classes become more homogeneous. In this respect, not much has changed within secondary education. At the same time, ethnic segregation is declining at both the primary and secondary levels. Segregation trends are difficult to determine because of their tendency to fluctuate and their relationship to demo- graphic trends (such as housing segregation and increasing numbers of pupils with a migrant back- ground). Social segregation in the education system is noticeably an urban phenomenon. The outliers in this regard are schools populated almost exclusively by pupils with university-educated parents and schools populated mainly by pupils from problem areas and/or pupils unable to gain admission to other schools. Major learning deficits at a number of schools in disadvantaged areas ● Although on average, the Netherlands achieved high scores for pupil performance in the PISA study, pupils at schools with a high proportion of children from a lower socioeconomic status have a relatively above-average learning deficit. The

28
pupils at the most socioeconomically disadvantaged schools achieve considerably lower marks than pupils at similar schools in other OECD countries.
3d Overburdened schools Downward spirals Sociocultural distance between pupils and schools ● Some groups of pupils are socioculturally distant from the school they attend. This can be the case if young people grow up in an environment characterised by intolerance, mistrust of society and public institutions, rejection of the principles of a free and open society, and a feeling that they don’t belong. When social integration fails, the school’s relevance and legitimacy are diminished and pupils don’t identify with democratic society and the values it embodies. Sometimes, a rift opens up between teachers and pupils.15 This removes the school’s moral authority and can result in pupils viewing school as an instrument of a dominant culture or in the education being restricted to the transfer of subcultural values. As a result, these schools lose their ability to function as a bridge to higher education and the job market. Some schools overstrained ● Schools with a lot of pupils from socioeconomically deprived areas and pupils with significant sociocultural distance to society face significant challenges and can become overs- trained as a result. Inspectors have often seen these schools struggle to achieve good results, create a pleasant learning climate and social safety, motivate their pupils and, in essence, to offer a hopeful and unifying perspective for the future. Causes of downward spirals ● Sometimes schools lose their grip on the situation. For example, they may be unable to satisfy their pupils’ educational needs, incapable of motivating their pupils to learn or teaching them to take responsibility for their actions, unable to communicate with pupils, and/or incapable of creating a positive learning climate. This sets off a downward spiral, causing teachers to become overburdened.16 Social safety at school declines, learning performance falls, the school gets a bad name and the number of pupils drops. Children in the area choose to go to different schools and the school becomes populated by children who are strangers to the region. Sick leave and staff turnover increase. And in serious cases, the situation can deteriorate even further and information in the media or on social networks make things even harder for the school. Measures and opportunities Safe and positive learning environment ● The inspectors have also witnessed schools successfully halting downward spirals such as these. The school leaders and boards who managed this often implemented a combination of measures, and one of these schools even improved to the point of excellence. They were able to break the pattern of chaos and unmanageability by setting and enforcing codes of conduct and promoting them via clear communication, closely involving the pupils and sharing responsibilities. They also frequently promoted straightforward pedagogical skills for all (both teachers and non-teaching staff), as a result of which pupils no longer feel that teachers were treating them unequally or unfairly. This created a safe and positive learning environment. Supporting teacher quality ● Schools that break out of such downward spirals often go on to provide lessons that are of high pedagogic and didactic quality. They also monitor the quality of the lessons and teachers, often via intervision, supervision, guidance, training and a supportive personnel policy. This is regularly combined with school-wide discussions regarding the educational focus of the school. A vision is created and implemented into concrete agreements and the school leader ensures a firm basis of support for this vision. Often, a new school leader is appointed to usher in a fresh start or the school building is renovated to give new energy to the school.
15 Kleijwegt, M. (2016). 2 worlds 2 realities. How do teachers deal with this? The Hague: Ministry of Education,
Culture and Science (OCW). 16 Paulle, B. (2013). Toxic Schools. High-poverty education in New York and Amsterdam. Chicago: University of
Chicago Press.

29
Good teamwork ● Successful schools are more likely to have a higher level of teamwork amongst the staff. The teams have an excellent sense of joint responsibility, mutual trust and involvement, and friendly consulta- tion and support between colleagues usually comes naturally to them. In order to achieve this, external expertise and support is often called in. Additional measures in complex situations Combating street culture ● Sometimes, schools are faced with pupils who do not accept the authority of schools or consider education to be useless due to influence from street culture, learning/behavioural disorders, problems at home or conflicting values. Pupils who have a negative attitude towards learning or do not recognise the school’s authority cause disruption to classes and generate a group dynamic that teachers have little to no control over. Pupil populations such as these place even higher demands on the school. The schools that meet these demands are able to open up communication with the pupils via a consultation process. By listening, reflecting, coaching and guiding during these discussions, greater understanding of the pupils’ situation is gained and pupils trust the school more. Many schools that successfully deal with these problems also boost parental involvement via home visits and clear, regular reports of their children’s results. Collective adjustment of curriculum ● Successful schools are also more effective at adjusting the curriculum to suit the pupil population. This ensures that the subject matter and level match the pupils’ opportunities and the curriculum is meaningful, stimulating and challenging. Often, teams collectively design and arrange the classes, scheduling and organisation as well as monitoring learning success and tackling problems. We also see that moments of success for individual pupils often have an intrinsically motivational effect on their learning. Expertise ● So how can schools fulfil their duty of integrating pupils into society, even if they have a difficult pupil population? The schools that have most success are the ones that have highly involved teachers, form teams to develop series of lessons and projects, understand their pupils and expect results from them. They often enlist professional support and guidance to do this, such as experts (both internal and external) in the field of learning and behavioural disorders. They also frequently invest in training individual teachers with regard to learning and behavioural disorders. Focusing on learning attitudes, including socioemotional development ● Attention to pupils’ learning attitudes and motivation often means more attention is paid to pupils’ socioemotional, personal and social development. Teachers are increasingly giving pupils more responsibility for their own learning process, stimulating their thinking skills and learning to see things from their pupils’ perspective. This process helps to proactively tackle intolerance, radicalisation, xenophobia, discrimination, radical ideologies and social exclusion. This is particularly important in schools with pupils who do not automatically accept democratic values or do not feel a connection to their school or society as a result of socioeconomic deprivation. Time and resources sometimes limited ● Successful schools are characterised by good school leaders, a sufficient number of good teachers, a high level of involvement and commitment, good pedagogic and didactic skills and sufficient opportunities for discus- sion and reflection. Energy, synergy, effective administration and targeted professionalisation are key features in this regard. All of these efforts require time and resources that are not always available.

30
4 Teachers
Teachers provide good explanation, some offer too little challenge ● Pupils indicate that their teachers are good at explaining things and offering clear structure. The pedagogical climate is also good as was observed by the inspectors: in the vast majority of lessons, the teachers’ pedagogical and general didactic skills were sufficient. Points for improvement include coordination/differentiation and sufficiently challenging pupils: both pupils and inspectors reported room for improvement in these areas. Quality of teachers differs within schools ● The different schools have teachers of varying levels of quality. It appears that good teachers are not evenly distributed across the schools, and we have also found that schools do not have the same basic conditions for education. For example, some schools have a wealth of available candidates for vacancies, while other schools have few to none. Sick leave is high at some schools and low at others. Professionalisation and staff policy ● Teachers, schools and school boards differ greatly regarding the amount of time and attention they devote to professionalisation. At some schools, the teachers do not seem to have the time for professionalisation, while other schools or programmes conduct intensive and targeted professionalisation activities. In general, it is mainly the good teachers that work on their professionalisation. A great deal of professionalisation activities have very little focus on effective conduct and often have no relation to the school’s strategic policy. More good teachers needed ● To give good lessons, you need good teachers. But are there enough of them? The significant drop in the intake levels of teacher-training (PABO) programmes is a worrying development. In addition, there is little diversity in the group of entrants: few men, few students with a migrant back-ground and few graduates of natural sciences and/or technical subjects.
4a Lesson quality Structured lessons, but too little differentiation Clear and structured lessons ● Compared to teachers in other European countries, Dutch teachers are very skilled in a number of areas. They plan the lessons well, the content of the lessons is good and the teachers clearly explain to pupils what is expected of them and what the goals of the lesson are. Most of the teachers also ask the pupils questions to ensure they understand the material and invite pupils to express their thoughts, reasoning and presentation skills.17 Dutch pupils report that their teachers do this often (see infographic on page 40). Too little differentiation and challenge ● Dutch teachers are considerably less adept at differentiating between individual pupils than teachers in other high-performing countries. They provide too little challenge to high-achieving pupils, which means these pupils do not reach the highest levels possible. Out-of-the-box thinking and higher-order thinking is encouraged less frequently than in other countries (see the infographic on page 40). Similar conclusions from the inspections ● The inspectors reported that the lessons they attended in general, teachers were good in general didactic skills such as providing explanation. However, the inspectors also observed that teachers are significantly less adept at actively involving pupils in the lesson and adjusting their teaching to meet the specific needs of individual pupils (known as differentiation). The basic conditions for differentiation and special education are increasingly improving, yet there is little to no increase in differentiation in the lessons. There is more differentiation in primary education and in vocationally oriented MBO courses than
17 OECD (2013). PISA 2012 results. Ready to learn: students’ engage- ment, drive and self-beliefs. Paris: OECD.

31
there is at secondary schools, with no differentiation in more than half of secondary-school lessons. One exception to this rule is the exam classes within secondary education. Here, the work is much more goal-oriented, and differentiation seems to be a natural consequence of this. In all sectors, we are seeing more and more extra-curricular differentiation: pupils who need extra help or greater challenges are increasingly being offered extra activi-ties/programmes. Quality of teachers differs within schools ● As well as varying within schools, teacher quality also varies between schools. Some schools have more good or mediocre teachers than others. We have also observed major discrepancy between schools with regard to the extent of sick leave, the percentage of qualified teachers, and the basic conditions for education. When vacancies open up, some schools can choose from a wide variety of applicants while others have little or no choice of candidates for the job.
4b Professionalisation of teachers Professionalisation mainly informal, more assessments by colleagues Mainly informal activities ● Dutch teachers work on professionalisation as much as their colleagues in other countries, although a notable factor is that the professionalisation activities are often informal. Teachers study professional literature, carry out development work with colleagues, take courses as a team, consult each other and ask for feedback. A huge range of other professionalisation activities are conducted, many of which are often not targeted towards the specific points for development of the teacher and/or team in question. More feedback and reviews by colleagues ● Teachers are more frequently observing the lessons given by their colleagues: two-thirds of secondary-school teachers visit a colleague’s lesson at least once a year. However, this is still not a systematic occurrence and there are also major differences between schools in this regard.18 A proportion of teachers in primary, secondary and special education has never observed a class taken by one of their colleagues at the same school. Within higher education, lecturers say that intervision and feedback is important, although one-third of lecturers at universities of applied sciences never receives feedback.19 In addition, the responses to a survey conducted by the inspectorate showed that lecturers rarely make use of the feedback provided. New teachers, unqualified teachers and good teachers professionalise more More training, observations and feedback for new and unqualified teachers ● New teachers and teachers who are not yet qualified participate in more professionalisation activities than more experienced teachers. Within secondary education, new teachers receive more lesson visits from colleagues at their school than more experienced teachers and more frequently receive feedback from visits by more senior colleagues. The same applies to teachers who do not yet hold a teaching qualification. Good teachers actively professionalise ● The best teachers more frequently receive visits from other teachers at their school, as well as more frequently visiting and receiving visits from colleagues at different schools. Teachers who are less skilled are less likely to participate in these kinds of professionalisation activities. It therefore appears that the teachers that need professionalisation the most are the ones that do not participate in such activities. It is possible that good teachers take more initiative. However, another explanation could be that good teachers more frequently work at schools that offer lots of professionalisation activities and/or encourage professionalisation of teachers. Lesson visits and feedback from the school leader
18 See also: Education Council (2016) A different perspective on professional space in the education sector. The
Hague: Education Council. 19Witteman-van Leenen, H., Van Bergen, C.T.A. & Dekker, B. (2014). Education works! Report of a survey among
teaching staff in primary, secondary, vocational and higher education. Measurement 2014. Amsterdam: Regional plan.

32
Lesson visits by the school leader ● Within primary education, around 80% of teachers have at least one of their lessons observed by the school leader each year. This figure is lower within secondary education. School leaders more frequently visit new teachers, while the percentage of visits received by teachers aged 55 and over is much lower. When compared to other countries, Dutch school leaders give noticeably less feedback on the quality of the lessons, with just 40% of school leaders saying they observe lessons often or very often, compared to rates of 60-90% in other countries.20 Feedback not yet sufficient ● Teachers are still not receiving enough feedback on their teaching, although during the inspections, we noticed that the percentage of teachers who receive feedback is increasing. We found that nearly 9% of secondary teachers never receive feedback and 25% receive feedback less than once a year. These percentages are even higher for teachers over the age of 55. No connection between activities and ambitions ● In general, teachers’ professionalisation activities seem to have no link with everyday practice and the strategic vision of the school in question. For example, we found that only two out of every five schools have formulated a concrete educational vision and measurable standards of conduct for both inside and outside the classroom. At a quarter of secondary schools, the school administrators do not optimally utilise their personnel policy in order to achieve the school’s goals. Educational plans often top-down ● At most secondary schools, the school leaders have developed an educational plan in order to achieve the objectives of the school in collaboration with the teaching staff. At most schools, it is the school leader that takes the initiative and the plans are mostly top-down. This approach usually goes hand-in-hand with soft management activities, such as providing information to teachers via team meetings, making funds available for educational activities, and boosting staff morale (see the infographic at the top-right of page 41). At a minority of the schools, the teachers took the initiative to formulate training goals. Diversity between staff and administrators ● At some secondary schools, the staff and administrators have different ideas when it comes to school development. In such cases, the school’s educational vision is not always clear and not always effectively communicated. The teachers and school leader are often not on the same page with regard to important issues such as differentiation. In addition, when school leaders are critical of some aspects of their teachers’ methods and try to provide management based on specific frame- works, the teachers respond by saying the basic conditions for good-quality education are lacking. Furthermore, a proportion of school leaders believe the teachers who insufficiently prepare for their lessons are reluctant to change. Example ● The different opinion between school administrators and staff is clearly reflected by issues such as the development of differentiation within secondary education. Teachers say that differentiation is very important, yet a quarter of them say they are given insufficient opportunities to develop differentiation skills. Teachers also report that the basic conditions for education – such as preparation time per pupil, opportunities available in the classroom, the teaching material and knowledge of the pupils’ levels and learning styles – sometimes make differentiation difficult. School administrators often blame the lack of differentiation on the teachers’ professionalism, saying that teachers should learn to differentiate more effectively, formulate a clearer vision and take extra training.
20 OECD (2016). School leadership for learning. Insights from TALIS 2013. Paris: OECD Publishing.

33
What do teachers do or not do in class? ● Compared internationally, Dutch children more often say that their teachers give clear explanations and structure. However, they less frequently report that teachers differentiate between pupils, teach them to solve complex problems or challenge them enough.

34
Fewer and fewer new primary-school teachers ● The PABO intake levels have declined considerably over the years and the number of qualified teachers is now lower than the number of vacancies.
How can school leaders (SE) promote differentiation? ● Some school leaders do not promote differentiation at all, and those that do mostly promote it via soft management techniques.

35
PABO intake level ● The groups most likely to train as teachers are HAVO students of Economics & Society and Culture & Society. Very few men or students backgrounds enter the PABO.
Different action taken by school boards ● The type of professionalisation activities offered to teachers differs greatly, and the range of professionalisation activities is extremely diverse. Some school boards have their own training academy while others have far fewer opportunities at their disposal. The inspectors have also observed that different school boards have different opinions regarding their professionalisation duties: some are very involved in ensuring the basic conditions for staff policy, while others are not. We also see that some school boards make targeted investment decisions while others distribute the resources evenly or proportionally across the entire school.
4c Enough teachers? Developments of the teacher shortage Increasing shortage ● In the years to come, we expect the shortage of primary, secondary and MBO teachers to increase further, although the scale of the shortages will vary from sector to sector. For example, the greatest shortages are expected in primary education, with certain regions being hit particularly hard. At the secondary level, it is expected that specific subjects – such as sciences and modern languages – will have difficulty filling vacancies. Decline in PABO students until 2015 ● Since 2006, the number of PABO students has been steadily declining. PABO intake levels in 2006 were at 11,500, yet by 2015 this number had dropped to 5,500. Although there has been a decline in HBO students across the board, the PABO intake level has declined more significantly

36
than those of other HBO programmes. This decline – particularly in the number of MBO students progressing to the PABO – also corresponds to the introduction of entry requirements and arithmetic tests at the PABO level. This decline means that the number of PABO graduates can no longer keep up with the number of new teachers required, as can be seen in the infographic in the top-left corner of page 41. More PABO students from 2016 onwards ● In 2016, the intake of PABO students increased for the first time in ten years: 10% more than in 2015. Compared to 2015, 14% more MBO students, 11% more HAVO students and 4% more VWO students entered the PABO. Indirect intake increased by 13% while direct intake increased by 8%. Quality of incoming students remains the same ● The exam results of the students entering the PABO in the 2006-2015 period has remained stable. The HAVO pupils seem to be getting better results in English, although their Dutch and mathematics results have slightly declined. The quality of incoming HAVO students appears reasonably stable, although the absolute number of students registering has declined. This is mainly due to fewer MBO graduates entering the PABO. No decline in incoming students to second-level and university teacher-training programmes ● For second-level and university teacher-training programmes, the intake levels have remained more or less the same, as has the proportion of MBO, HAVO and VWO students entering second-level programmes. Most of the incoming students progress to the PABO from the HAVO (30%) and MBO (20%) levels. The number of VWO pupils is very low (approx. 5%). 35% of the students of second-level programmes are doing this in combination with another programme or have already graduated from a different programme. Group of incoming students relatively homogeneous High levels of native Dutch women ● Approximately 75% of incoming PABO students are women and 10% has a migrant (Western or non-Western) background. This is lower than the average figure for HBO entrants (17.5%) (see the infographic at the bottom of page 41). The intake levels of the second-level teacher-training programmes are more diverse: approximately 55% of entrants are female and there is a higher proportion (18%) of students with a Western or non-Western migrant background than in the PABO. When you look back further in time, the intake levels of teacher-training programmes are relatively stable with regard to gender and ethnicity. Incoming students mainly homogeneous ● Students entering the PABO rarely progress from technical programmes (see the infographic at the bottom of page 41). Incoming students to the second-level teacher- training programmes are also predominantly students with a ‘Culture & Society’ profile. For many years, very few science students have gone on to enrol in teacher training. This is a cause for concern given the shortage of teachers with scientific backgrounds and the declining performance in arithmetic at both the primary and secondary levels. However, the proportion of science students enrolling in second-level teacher- training programmes is higher than for incoming PABO students. Another noticeable factor is that the men who enrol in teacher-training programmes have more frequently a scientific background than the women. Fewer first-year drop-outs in 2016 Drop-out rates ● In the 2015-16 academic year, 30% of students decided not to continue their PABO programme after the first year. In the second-level teacher-training programmes, this proportion increases to 50%. The PABO drop-out rate has declined significantly from 39% in 2015 to 30% in 2016: the lowest it has ever been. The drop-out rate of MBO graduates has also substantially declined from 45% in 2014 to 27% in 2015. Furthermore, a higher proportion of male students drop out than female students (44% compared to 25%), and although the female drop-out rate has declined, the male drop-out rate has not. Success rates for teacher-training programmes ● The success rate for second-level teacher-training programmes is very low: just 35% of the students successfully complete the programme within five years while the average success rate for other HBO programmes is 60%. The PABO success rate is above the HBO average (65%), although the success rates of both programmes are declining: 39% of students who enrolled in the

37
second-level teacher-training programme in 2006 successfully completed the programme within five years, yet by 2010, this proportion had fallen to 35%. The figures for PABO students are 69% and 65% respectively.

38
5 Special education
More pupils attending regular education ● Since the introduction of special education, the number of pupils has slightly declined. Pupils who have special educational needs remain in regular classes for longer and more special education pupils are progressing back into regular education. However, these developments in the past two years were only minor, meaning that few to no additional pupils per school transferred from special education to regular education. Training needs of teachers in regular education ● It appears that teachers and school leaders have adopted a new approach to pupils requiring extra educational needs. They are actively seeking special education for these pupils and school leaders report that teachers require a great deal of training and support. Teachers also report that class sizes and heavy workloads represent unfavourable conditions for special education. Successful interventions for stay-at-home children ● A proportion of pupils do not attend school and do not receive special education. This is unacceptable, as all young people in the Netherlands are entitled to education – special or otherwise. Partnerships that organise overriding authority seem to have the greatest success in preventing children from undergoing long periods of non-attendance, and other interventions have been conducted in order to organise special education for these pupils. Partnerships get results ● The 152 partnerships are increasingly creating the basic conditions to support special educational needs within schools, although the different partnerships deliver varied results. Partnerships that focus on collaboration between schools and municipal youth policy are particularly successful: they seem to be most effective in reducing the number of stay-at-home children, getting them into regular education and keeping them there.
5a Slightly fewer pupils entering special education at the primary or secondary level Minor developments, slightly fewer pupils in special education Further decline in the number of pupils in Special Needs Education ● The number of pupils in special education has declined at both the primary level (31,000 in 2014 to 29,000 in 2016) and the secondary level (just under 40,000 in 2014 to 38,000 in 2016). This means that since special education was introduced, the number of pupils in special education has fallen by 4,000. However, as you can see from the infographic on page 48 that displays the participation rates over the past six academic years, these relatively minor shifts are barely noticeable in the participation rates. Over the years, the participation rate has remained stable. Particularly lower intake into special primary education ● Regular primary schools in particular are referring fewer pupils to special education or special primary education,21 although the referral policies of the various partnerships – and therefore of the different regions – differ greatly. Transferring from special to regular education ● We have observed that pupils in special education are more frequently progressing to regular secondary education. The pupils who are making this transition are mainly pupils with a cluster 2 referral who have a language- development disorder or an autistic-spectrum disorder. Pupils referred to the former cluster 4 are also more frequently progressing to regular schools (due also to the fact that the number of pupils in residential institutions is falling). The number of cluster 1 pupils within special education is also in decline, despite the funding system for these pupils remaining unchanged.
21 Koopman, P.N.J. & Ledoux, G. (2016). Factsheet 1. Pupils in special and regular education. Update for the 2015-16 academic year Amsterdam:
Kohnstamm Institute.
39
With regard to all of these developments, there is a great deal of disparity between the partnerships’ performances. Relatively few pupils progress to regular education Few to no pupils progress to each individual school ● The trend for more inclusive education has had a visible effect, but it still only works out to a small number of pupils. In 2016, the number of pupils in special education was 4,000 lower than in 2014, partly because pupils progressed from special education to regular education. In total, 18% of primary schools and 72% of secondary schools admitted pupils from the special- education system, with the majority of regular schools admitting zero, one or two of these pupils. This distribution can be seen in the infographic in the top-right corner of page 49.
5b Teachers and school leaders’ views on special education Demand for development and professionalisation New development needs for teachers ● Nearly half of all primary-school teachers say that as a result of special education, they would like to professionalise in new areas, particularly with regard to behavioural and socioemotional issues. Within special secondary education, a lower percentage of teachers believe their development needs have changed since the introduction of special education. According to two-thirds of primary-school teachers, the current and planned training activities are enough to meet these development needs. Primary-school school leaders’ thoughts on special education ● Two-thirds of school leaders indicate that the range of care that their school provides has changed since the implementation of special education. In addition, three-quarters of school leaders believe teachers’ development needs have changed. They want to know and understand more about the pupils’ cognition, behaviour and social/emotional development. The majority of school leaders also indicate that in the past two years, teachers have participated in more training activities and that in the next two years, the school has scheduled more training activities to enable optimum teaching of pupils who require extra support. These training activities focus mainly on pupils’ cognitive, behavioural and social/emotional support needs. Two-thirds of school leaders feel that the partnerships support them in their professionalisation activities. Less bureaucracy, though the problem still exists ● Directors, coordinators, allocators, internal guidance counsellors and care coordinators say there is less bureaucracy now than before the implementation of special education.22 However, they still think there is a lot of bureaucracy, particularly when coordinating matters with youth-care centres, requesting admissibility statements and determining pupils’ development potential.
5c Stay-at-home children Less short-term, more long-term Number of stay-at-home children ● Every child in the Netherlands is entitled to education, a right laid down by law. However, not all children have a place at school. In the 2015-16 academic year, this was the case for 9,388 pupils, of whom 4,194 had not attended school in over three months.23 Less absolute, more long-term ● Recently, we have observed two different trends in the number of stay-at-home children. The number of children not registered at a school (absolute non-attendance) is in decline (see the infographic on the right-hand side of page 49): in the 2015-16 academic year, there were 5,101 stay-
22 Heim, M., Ledoux, G., Elshof, D. & Karssen, M. (2016). Beaten paths: Tailored Education partnerships and the
new procedures for allocating educational support. Amsterdam: Kohnstamm Institute. 23Statistical supplement to the 2015-2016 Non-Attendance Monitor. Appendix to OCW (2016). Tenth progress
report for tailored education. Letter to the President of the House of Representatives, 6 December 2016. The Hague: The Ministry of Education, Culture and Science.

40
at-home children compared to 5,956 in 2014-15. At the same time, the number of registered pupils failing to attend school increased, especially in the number of pupils who have not attended school in over three months (increase in long-term relative non- attendance). In the 2015-16 academic year, this figure was 2,592: an increase of 16% compared to 2014-15. This high and increasing long-term non-attendance rate is unacceptable, and a variety of measures are being taken to combat it, such as arranging overriding authority, the ‘Truancy Pact’, the intervention team and better registration of non-attendance. More exemptions also cause for concern Increase in the number of exemptions ● The number of exemptions granted in accordance with Article 5(a) of the Compulsory Education Act 1969 (Leerplichtwet) has increased substantially in the past five years.24 This is due in part to better registration of non-attendance, although it also shows that there may not be appropri- ate school places for all children. In some municipalities, opportunities for education and care programmes are not being optimally realised and too little is known about children and adolescents with an exemption: this situation is undesirable and a cause for concern. Exemptions mainly granted to young children and 16 to 17-year-olds ● Exemptions are often granted to children aged 5 years or above who attend medical day-care centres. In addition, many 16 and 17-year-olds are granted an exemption on psychological grounds. When applying for an exemption, a certificate from an independent specialist is an important factor and the processes for issuing exemptions are different in each municipality. Policy and interventions regarding stay-at-home children Registration still not perfect ● The partnerships are increasingly gaining insight into stay-at-home children, although the data is of low quality and is often inaccurate. For nearly half of registered stay-at-home children, it is not clear which interventions the partnership in question has conducted and how successful they were. Nearly half of the partnerships organise overriding authority ● 65 of the 152 partnerships has authorised a person or institution to impose a solution in the event a child is not registered at school. In such cases, school boards and municipalities comply with the decision made by this person/institution. This is known as overriding authority. 23 other partnerships said that they are going to organise overriding authority in future. Inspectors have found overriding authority to be effective, often resulting in a suitable school placement being found for long-term stay-at-home children. To organise overriding authority, collaboration with the municipality, truant officers and youth-care centres is crucial. The partnerships that have not and will not arrange overriding authority say they do not consider it necessary in their region or prefer solutions based on mutual trust and consensus.
24Bertling, L., Lubberman, J. & Witteman-van Leenen, H. (2016). Study into the increase of ‘5(a) exemptions’.
Final Report. Amsterdam: Regional plan.

41
Minor shift in pupil transfers, fewer admitted to special education Since the implementation of special education, a slightly higher number of pupils have transferred to regular education, though these developments are only minor.
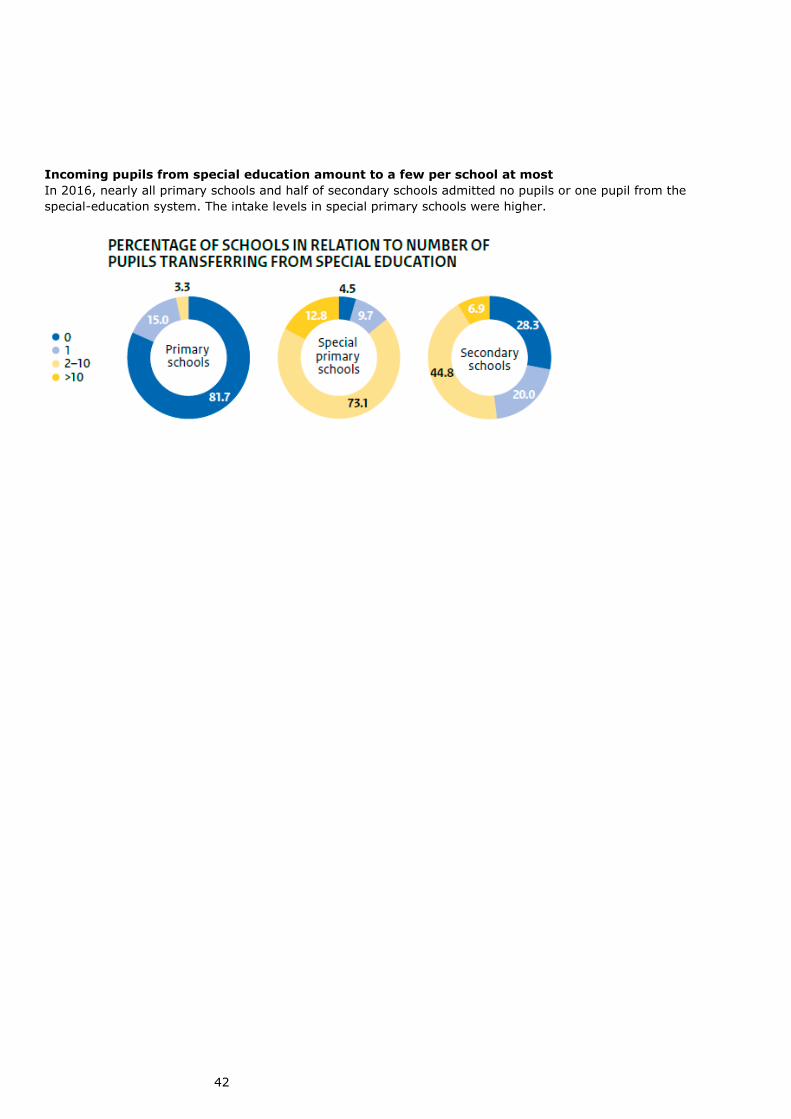
42
Incoming pupils from special education amount to a few per school at most In 2016, nearly all primary schools and half of secondary schools admitted no pupils or one pupil from the special-education system. The intake levels in special primary schools were higher.

43
Less absolute non-attendance yet more long-term relative non-attendance NUMBER OF STAY-AT-HOME CHILDREN IN RELATION TO TYPE/DURATION OF NON-ATTENDANCE

44
Partnerships improving yet quality control lagging behind The main improvements have been the tackling of non-attendance and the allocation of extra support, although there is plenty of room for improvement regarding the embedding of these measures. TRENDS IN INSPECTORS' ASSESSMENTS OF PARTNERSHIPS (%)
Effective interventions ● Solutions are frequently possible, as has been shown by the solutions devised by school boards and/or partnerships upon being informed of reports or called to account by the inspectorate regarding their responsibilities. For example, thirty reports of breaches of the duty of care were made and the school boards were addressed each time. In all thirty cases, a solution was found. Furthermore, solutions were found to 71% of the 316 reports made in October-November 2016. In these cases, the inspectorate advised the parents regarding their options, informed other parties involved regarding what was and what was not possible, and if necessary, called schools and partnerships to account regarding their duties and powers.
5d Partnerships Developments and challenges relating to partnerships Better organisation of partnerships ● In recent years, the partnerships have improved their organisational affairs with regard to nearly all quality indicators assessed by the inspectorate. The most progress has been made in tackling of non-attendance and the allocation of extra support (see the infographic at the bottom-left of page 49). In addition, accountability for quality has improved in comparison to 2013-14: a vital development. The improvements have not yet been sufficiently embedded and improvement is required regarding satisfaction surveys and standardisation of results. Although progress has been made, it is frequently not embedded. It remains to be seen how much pupils will actually benefit from the partnerships’ activities, as results for the pupils can not yet be determined. Strengths of partnerships ● The partnerships have improved in relation to a number of aspects: major progress has been made in the organisation of appropriate support facilities and procedures and the allocation of extra support. In addition, most partnerships now have an effective consultation structure and have formulated a clear mission and vision.

45
Room for improvement regarding coordination with youth-care centres ● An important point for improvement is coordination of partnerships with municipalities. Progress is being made, although for half of the partnerships visited by inspectors in 2015-16, this progress is not yet sufficient. Coordination with regard to youth-care centres and social support is particularly important for stay-at-home children, pupils at risk of non-attendance and pupils exempted from compulsory education. Furthermore, in the Allocation Monitor, partnerships and schools say they are looking for more and better-quality collaboration with regard to the procurement of care and support.25 Attention to internal supervision and quality control required ● In some partnerships, the independence and resources of the internal supervisors are not sufficiently guaranteed. It is important that this internal supervision is properly organised, and significant improvements are required in areas such as quality control. The inspectors have witnessed improvements, although not enough progress has been made: partnerships still do not always document all of their results, meaning they cannot always account for the results and effectiveness of deployed resources. The first annual accounts are seriously lacking in vital content, reflecting the fact that quality control is insufficient. It is therefore very positive that the partnerships are devoting a lot of attention to this issue. Partnership finances ● On 1 July 2016, all partnerships submitted annual accounts for the first time. Analysis of the content of 36 randomly selected annual accounts (18 primary schools and 18 secondary schools) found that nearly all partnerships strive to accrue a certain level of financial reserves. Only ten partnerships reported losses in 2015. In the past two years, around 10% of the funds for special education (80 million euros) have not been spent by partnerships in both primary and secondary education.26 In nearly all cases, the partnerships’ policy was the reason for this, although the amounts have not been substantiated. The amount of the financial reserves also differs greatly between partnerships. In this regard, we have observed no difference between partnerships with positive equalisation and partnerships with negative equalisation. A number of the partnerships that have not spent a significant proportion of the funds are unable to provide a good explanation for this. In conclusion ● In recent years, the partnerships for special education have undergone considerable development. It is clear that they are now much better organised and the partnerships are now mostly operational. However, much more work remains to be done. The partnerships still need to significantly improve these initial organisational gains over the years to come and many difficult questions remain about the effectiveness of partnerships. For example, why are there still pupils sitting at home who haven not been allocated a special school placement for over three months? And are the special school placements truly meeting the needs of pupils who require extra attention? These are difficult yet vital questions to which no answer has yet been given. The development and evaluation processes for special education have been postponed until 2020, so there is still time to determine the results of the stay-at-home-children policy (e.g. the Non-Attendance Pact) and to complete the evaluation programmes for special education as a whole (NRO). In the years to come, it remains to be seen if more pupils with extra educational needs actually benefit from special education. Naturally, a school placement at a regular school is not enough to ensure this: the education provided must be suited to their extra needs to a much greater extent than before.
25 Heim, M., Ledoux, G., Elshof, D. & Karssen, M. (2016). Beaten paths: Tailored Education partnerships and the
new procedures for allocating educational support. 2016 measurement. Amsterdam: Kohnstamm Institute. 26Inspectorate of Education (2016). Financial situation in the education sector, 2015. Utrecht: The Inspectorate of
Education.