the state of food and agriculture, 1986 · the state of food and agriculture in 1986 gives rise to...
TRANSCRIPT

Worm oan regional reviews, , ,
*nancing agricultural development
r I
I " I 1
' 1
r, r
1
r
o 9 1 FlOODIAINIJDI AGR*ULTURE ÒIZGANIZIATIÓN ÓF THE UNITED NATIOIN'.<., i
1
1 r 1
1 /-1 r e t'..`1.r
rr
r
r
r
r
rr
r
i
Special Chapters
In addition to the usual review of the recent world food and agriculturesituation, each issue of this report from 1957 has included one or more specialstudies of problems of longer-term interest. Special chapters in earlier issueshave covered the following subjects:
1957Factors influencing the trend of food consump-tionPostwar changes in some institut onal factorsaffecting agriculture
1958Food and agricultural developments in Africasouth of the SaharaThe growth of forest industries and their impacton the world's forests
1959Agricultural incomes and levels of living in
countries at different stages of economic devel-opmentSome general problems of agricultural develop-ment in less-developed countries in the light ofpostwar experience
1960Progra ming for agricultural development
1961Land reform and institutional changeAgricultural extension, education and researchin Africa, Asia and Latin America
1962The role of forest industries in the attack oneconomic underdevelopmentThe livestock industry in less developed coun-tries
1963Basic factors affecting the growth of produc-tivity in agricultureFertilizer use: spearhead of agricultural develop-ment
1964Protein nutrition: needs and prospectsSynthetics and their effects on agricultural trade
1966Agriculture and industrializationRice in the world food economy
1967Incentives and disincentives for farmers indeveloping countriesThe management of fishery resources
1968Raising agricultural productivity in developingcountries through technological improvementImproved storage and its contribution to worldfood supplies
1969Agricultural marketing improvement program-mes: some lessons from recent experienceModernizing of institutions to promote forestrydevelopment
1970Agriculture at the threshold of the SecondDevelopment Decade
1971
Water pollution and its effects on living aquaticresources and fisheries
1972Education and tra ning for developmentAccelerating agricultural research in thedeveloping countries
1973Agricultural employment in developing coun-tries
1974Population, "food supply and agricultural devel-opment
1975The Second United Nations DevelopmentDecade: mid-term review and appraisal
1976Energy and agriculture
1977The state of natural resources and the humanenvironment for food and agriculture
1978Problems and strategies in developing regions
1979Forestry and rural development
1980Marine fisheries in the new era of nationaljurisdiction
1981
Rural poverty in developing countries andmeans of poverty alleviation
1982Livestock production: a world perspective
1983Women in developing agriculture
1984Urbanization, agriculture and food systems
1985Energy use in agricultural productionEnvironmental trends in food and agricultureAgricultural marketing and development

THE STATE OF FOOD AND AGRICULTURE 1986

FAO Agriculture Series No. 20
-
FOOD AND AGRICULTURE ORGANIZATION OF THE UNITED NATIONSRome, 1987

The statistical material in this publication hasbeen prepared from the information available toFAO up to March 1987.
The designations employed and thepresentation of the material in this publicationdo not imply the expression of any opinionwhatsoever on the part of the Food andAgriculture Organization of the United Nationsconcerning the legal status of any country,territory, city or area, or of its authorities, orconcerning the delimitation of its frontiers orboundaries. In some tables, the designations"developed" and "developing" economies areintended for statistical convenience and do notnecessarily express a judgement about thestage reached by a particular country or areain the development process.
Chapter III, Financing Agricultural Development,was prepared by the Policy Analysis Division incollaboration with the Agricultural ServicesDivision, FAO, and was based on the work of DaleW. Adams, D. Diakosavvas, R. Roberts, J. Sharpleyand M. Spinedi, consultants.
David Lubin Memorial Library Cataloguing inPublication Data
FAO, Rome (Italy)The state of food and agriculture 1986.(FAO Agriculture Series, no. 20)
1. Agriculture. 2. Food production. 3. Trade.
I. Title II. Series
FAO code: 70 AGRIS: E16 E70 1987ISBN 92-5-102595-9ISSN 0081-4539
ISBN 92-5-102595-9ISSN 0081-4539© FAO 1987
Printed in Italy

Foreword
In hindsight, 1986 could be regarded as agenerally favourable year for agriculturalproduction, but also as a year tarnished byuncertainties in the overall economicenvironment and increasing problems in thearea of food and agricultural trade.
It was a year of solid agriculturalachievement in many developing countries,where a single good or bad crop year canmake the difference between starvation orsurvival for millions of human beings. This wasnotably the case in Africa, where the recoveryfrom the recent drought was widely sustainedand contributed to the alleviation of the foodsupply situation in many countries. Even moresignificant in a global perspective, given thelarge populations involved, several Asiancountries further improved their record ofrecent performances in food supply.
Welcome as these achievements were, theyshould not conceal the fragility of the currentworld economic and agricultural situation.Despite overall slow but steady long-termprogress in global nutritional status, hunger andmalnutrition still affect hundreds of millions ofpeople. The long-term guarantee of adequateaccess to food is contingent upon sustainedeconomic growth and a more equitabledistribution of its benefits.
The continuing lethargy of the worldeconomy and its pervasive negative effects onglobal demand, and policies toward trade andinternational cooperation, remained a matter ofprofound concern in 1986. For reasons largelybeyond their control, many developingcountries saw their chances recede fromreturning to strong economic growth. The fall in
their export earnings was further aggravated bya resurgence of protectionism in the industrialcountries. Yet, in order to honour their debtobligations, many of these developing countrieswere pressed to generate trade surpluses at anycost. The trade situation offered them littleoption but to reduce imports, investment, andeven subsistence consumption levels, thusprotracting a situation of economic and socialregression. The circumstances of severa! LatinAmerican and Caribbean countries, which wereforced into recessive adjustments, should berecalled. The gravity of the economic andfinancial problems in many Latin American andCaribbean countries prompted the request thatFAO undertake a major study on the obstaclesto agricultural and rural development andfeasible actions to enhance development,reduce poverty and improve nutritional status.The study will offer a Plan of Action to helpsolve the major food and agricultural problems
of the region. It will be presented at the nextFAO Regional Conference for Latin America andthe Caribbean in October 1988.
For many countries, current economicdifficulties are both a cause and an effect ofagricultural difficulties. The year 1986 witnessedthe continuation of an often decriedphenomenon the paradoxical coexistence offood shortages in some developing countriesand surpluses in other countries, especially thedeveloped countries. Despite the need toreduce budgetary imbalances and restoreequilibrium in world markets, most industrialcountries largely failed in their attempts toreconcile measures to control surpluses andpreserve farm incomes.
Despite a slowdown in the growth ofagricultural output in 1986, worldstocks particularly cereals soared, agriculturalprices plummeted to their lowest levels in halfa century, and competition in world agriculturalmarkets led to mounting conflicts amongtrading areas and a growing disregard for thefundamental principle of comparativeadvantage.
Developing country economies saw thepurchasing power of their agricultural exportssuffer sharp losses in 1985 and 1986, largelycancelling the gains of the two previous years.In some of these countries, good harvestsgenerated unmarketable surpluses, createdserious storage and financial problems and,ultimately, proved almost as harmful to farmerincomes as bad harvests.
The problem of abnormal food shortagespersisting in several other countries could notbe ignored. Nor could we underrate thedangers posed to Africa by the recurrence ofgrasshopper and locust infestations. Althoughthe response of the international community in1986 to FAO's warnings and appeals forassistance can be regarded as successful, largeareas in sub-Saharan Africa remain underthreat, requiring continuing vigilance andpreparedness.
This brief review of some of the highlights ofthe state of food and agriculture in 1986 givesrise to a number of reflections. In particular, I
must point to the need to improve theagricultural terms of trade of developingcountries, assure them stable prices for theirexports, free access to international markets,and the means to diversify and increase theprocessing of their products. We, at FAO, sharethe frustration of those countries that havedevoted much effort and resources toimproving their agricultural production andproductivity, only to discover that the fruits of

vi
such labour were unmarketable, costly to storeand, ultimately, unwanted.
FAO has taken decisive action to helpchannel cereal surpluses toward deficit areasthus avoiding driving down prices. To thiseffect, I urged donorsactual and potentialtoprovide maximum help in financing suchtriangular transactions and barter agreements.
The recent improvement in the food supplysituation in Africa should not allow us to relaxour vigilance on the immediate food problemsof the region. There is now a general consensusthat sustained economic and social progress inAfrica can only be through an integratedapproach to its agricultural and food problems.In the FAO study, African Agriculture: The Next25 Years, I made a number of concreteproposals for policy action, and FAO remainsready to assist African countries in theimmense amount of work required to translatethese proposals into programmes, andprogram mes into effective, practical action.
In the area of trade negotiations, I amlooking forward to the forthcoming negotiationsby GATT contracting parties to take a positivestep toward instituting a sounder basis foragricultural trade. I have earlier referred toanother basic ingredientfinancial resources foragricultural developmentwhich is the subjectof. the special chapter in this year's The Stateof Food and Agriculture.
It is important that countries mobilizeresources both domestic and external forinvestment. External commitments to agriculturehave stagnated since the early 1980s, and thosegranted on favourable terms have tended evento decline. Short-term prospects are also poor,as official development assistance is expected toincrease by barely 2% a year, in real terms, forthe rest of the decade.
I must once again underline the need formore external aid to the agricultural sector.Given the scarcity of aid, ways also have to befound for its more efficient allocation, bearingin mind the actual needs of farmers. I haveemphasized, more particularly in the context ofAfrica, the case for considerably expandinginput aid to developing countries. Inputs suchas agricultural equipment, tools, means oftransport, spare parts, and fertilizers could easilyand abundantly be made available by industrialcountries.
In making proposals for policy action, I amdeeply aware of the magnitude of the problemsand challenges facing us. There are recentexamples from developing countries, includingsome from the most populous ones, whichhave undertaken sound policy reforms and
measures to deal with the problems ofwidespread hunger and malnutrition. The firststep toward the adoption of sound policyaction is an adequate knowledge andunderstanding of the facts and issuessurrounding the current state of food andagriculture.. It is my hope that this documentwill contribute to this objective.
Edouard SaoumaDIRECTOR-GENERAL

Contents
GlossaryExplanatory noteIntroduction
PART ONEWORLD REVIEW
ECONOMIC, FINANCIAL ANDTRADE ENVIRONMENT
Overview
Output Growth and Patterns
Trade Growth and Patterns
Domestic Prices and Interest Rates
WORLD FOOD ANDAGRICULTURAL SITUATION ANDPROSPECTS
Food and Agricultural Production 12
The Outlook for Cereals
Prices and Consumption ofFertilizers
FISHERIES
Fish Production
International Trade in Fish andFishery Products
Prospects for 1986
Major Issues
xiiixiv FORESTRY 21
1
Forestry Production and Trade in1985 21
Price Developments of ForestProducts during 1970-85 23
7 The Tropical Forestry Action Plan 24
AGRICULTURAL TRADE
16Overview
17 Terms of Trade
18 EXTERNAL ASSISTANCE
18 Resource Flows to Agriculture
Food Aid18
ANNEX 1.1. Recent Economic,20 Financial and Institutional Events
Related to Agriculture21
vii
29
29
34
37
37
39
40
7SOME TRENDS IN THE EARLY 1980s
7 IN FOOD AND AGRICULTURE 25
9 Food Availability 25
10 Land and Labour Productivity 27
Changes in Input Use During the1970s and Early 1980s 28
12 Agricultural Exports and Incomes 28

Causes of Retarded AgriculturalGrowth
Recent Policy Reforms
Food and Agricultural Situation in1986 and the Early 1980s
LATIN AMERICA
Recent Food and AgriculturalPerformance
Characteristics of AgriculturalPolicies
Adjustment Policies and theAgricultural Sector in the 1980s 56
48 CENTRALLY PLANNED ECONOMIES 72
49 Eastern Europe and the USSR 72
Overall economic performance in52 1985 72
54 Recent developments in agriculture 72
Some characteristics of agricultural54 policy in Hungary 75
ANNEX 2.1. List of Countries Used56 in the Regional Review Tables 78
DEVELOPED MARKET ECONOMIES 67
The United States 67
The European EconomicCommunity (EEC) 69
Canada, Oceania and Japan 69
FAR EAST 59
Recent Food and AgriculturalPerformance 59
Emerging Issues and Problems 59
NEAR EAST 63
Recent Economic and AgriculturalPerformance 63
Emerging Issues and Problems 66
PART TWOREGIONAL REVIEW
AFRICA 45
Political Commitment to Food andAgricultural Growth 45

AGRICULTURAL PERFORMANCE 88
Growth of Agricultural ValueAdded
Agriculture and the CurrentAccount Deficit 88
Agricultural Investment and theInvestment-Savings Gap 89
ANNEX 3.1. Features of SelectedSavings Schemes in Rural Areas of
88 Developing Countries, 1985
AGENDA FOR FUTURE RESEARCH 129
131
ix
PART THREE THE PRIVATE SECTOR 115FINANCING AGRICULTURALDEVELOPMENT Overview 115
INTRODUCTION 81 Rural Financial Markets (RFMs) 118
Foreign Direct Investment (FDI) inMACRO-ECONOMIC OVERVIEW 82 Developing Countries 126
External Adjustment 82 Transnational Corporations:Evolution and Characteristics 128
Domestic Adjustment 86
THE FISCAL BUDGET 92
Introduction 92
Overview of the Fiscal Budget 92
Agricultural Expenditure by thePublic Sector 93
Vulnerability of AgriculturalExpenditure 95
External Sources of Finance toAgriculture 97
Government Revenue andAgricultural Taxation 107
Some Conclusions and PolicyIssues 112

TABLES
WORLD REVIEW
1.1 Annual Changes in SelectedEconomic and Financial Indicators,1980-86
1.2 UN World Export Price Indices, ByQuarter, 1984-86
1.3 Food and Non-Food Production,1984-86
1.4 Agricultural Production, byCommodity, 1985-86
1.5 Percentage Rate of Change in PerCaput Food Production, 1985-86
1.6 Fertilizer Consumption, by MajorNutrients, 1982-85
1.7 Catch of Fish, Crustaceans andMolluscs, Including all AquaticOrganisms except Whales andSeaweeds, by Region, 1983-85
1.8 FAO Index Numbers of Volume,Value and Unit Value of Exports ofFish and Fishery Products, 1983-85
1.9 Output of Main Forest Products,Total Developing and DevelopedCountries and World, 1983-85
1.10 Volume of Exports of Main ForestProducts, Total Developing andDeveloped Countries, 1983-85
1.12 Annual Rates of Change in Land andLabour Productivity, by Region,1971-80 and 1980-84
1.13 Annual Rates of Change in SelectedAgricultural Inputs, by Region,1971-80 and 1980-83
1.14 Value of World Exports ofAgricultural (Crops and Livestock),Fishery and Forest Products, atCurrent Prices, 1983-85
1.15 FAO Index Numbers of Volume,Value and Unit Value of WorldExports of Crop and LivestockProducts, by Major CommodityGroups, 1983-85
13
1.16 Value of World Agricultural Trade(Crops and Livestock), at CurrentPrices, by Region, 1983-85
REGIONAL REVIEW
14 2.1 Africa: Selected Growth Rates
2.2 Latin America: Selected Growth Rates15
2.3 Far East: Selected Growth Rates
16 2.4 Near East: Selected Growth Rates
2.5 Developed Market Economies:Annual Rates of Change inProduction of Agricultural and Food
19 Products, 1984-86 and 1980-86
2.6 Eastern Europe and USSR: AnnualChanges in Selected EconomicIndicators, 1981-85
2.7 Eastern Europe and USSR: AnnualChanges in Food and AgriculturalOutput, 1983-86
23 FINANCING AGRICULTURAL DEVELOPMENT
3.2 Debt-Service Payments as aPercentage of Total Exports of Goodsand Services, by Region, 1975,
27 1980-84
3.3 Foreign Exchange Reserves as aPercentage of Total Imports of
28 Goods and Services, by Region, 1975,1980-84
3.4 Average Annual Growth Rate of TotalGDP, Agricultural GDP and
29 Population, by Region, 1974-84
3.5 Agricultural Merchandise Exports andImports, by Region, 1974-84
3.6 Annual Average Central Government30 Agricultural Expenditure, by Region,
1974-83
31
46
55
60
64
68
73
74
86
86
89
89
94
1.11 Changes in Per Caput Dietary Energy 3.1 Total External Merchandise Trade, bySupplies (DES) and Related Factors, Region, 1974-84 85
102 Developing Countries, 1980-84 26
1.17 Net Barter and Income Terms ofTrade of Agricultural Exports forManufactured Goods and Crude
8 Petroleum, 1981-85 32
1.18 Commitments of External Assistance
9to Agriculture (Broad Definition),1983-85 38
19
22

3.7 Growth in Real AgriculturalExpenditure and Agricultural LabourForce, by Region, 1974-83
3.8 Instability of Real AgriculturalExpenditure, by Region, 1974-83
3.9 Overall Trends in OfficialCommitments to Agriculture (OCA),(Including Technical AssistanceGrants), 1974-84
3.10 Percentage Distribution of OCA, byPurpose, Developing Countries,Mid-1970s and Early 1980s
3.11 OCA Per Caput AgriculturalPopulation and Regional Shares ofAgricultural Population, and OCA1974-76 and 1982-84
3.12 Annual Average Value and Shares ofExternal Private Commitments toAgriculture, by Region and Type ofCreditor, 1974-84
3.13 Estimates of Value in Current Pricesof Bilateral and Multilateral FoodAid, 1974-84
3.14 Average Annual Disbursements ofExternal Loans to Agriculture, byRegion, 1980-84
3.15 Major Recipients of Disbursements toAgriculture, Selected Countries,1980-84
3.16 Annual Average ExternalDisbursements to All Sectors, byRegion, 1980-84
3.17 Cereal Food Aid, by Region, 1980-84Average
3.18 Major Recipients of Cereal Food Aid,1980-84 Annual Average
3.19 Agricultural Export Taxation andExpenditure, Selected Countries,1975-77 and 1981-83
3.20 Financing of the Fiscal Deficit inSelected Countries, 1983
3.21 Percentage of Overdue AgriculturalLoans to Farmers in Asian Countriesin Recent Years
3.22 Borrowing Transaction Costs at theFarm Level in Selected Countries, byLoan Size
3.23 Difference Between Rate of Intereston Deposits and Rate of Inflation,
94 Selected Developing Countries,1976-84 125
97 3.24 Foreign Direct Investment (FDI) inDeveloping Countries, 1974-84 126
FIGURES100
104 BOXES
xi
1.1 Export Prices of Fertilizers, 1980-1986 17
101 1.2 International Prices of SelectedAgricultural Commodities, 1981-86 34
1.3 Shipments of Food Aid, Cereals,1974/75-1986/87 37
1023.1 External and Domestic Adjustment,
by Region, 1974-84 84
3.2 Agricultural GDP, Exports and102 Imports as a Share of Total GDP, by
Region, 1974-84 90
3.3 Central Government Expenditure and103 Revenue as a Share of Total GDP,
All Regions, 1974-83 93
3.4 Monetary Survey: Domestic Credit to103 Private Sector and Government, by
Region, 1974-84 116
/./ The Chernobyl Nuclear Accident 11
1051.2 The International Tropical Timber
Agreement 33
1051.3 Agriculture in the GATT: The
Uruguay Round 35
1082.1 FAO's In-Depth Study on Food and
Agricultural Problems in Africa 51
109 2.2 Locust and Grasshopper Attacks inAfrica and the Near East 53
117 2.3 FAO's In-Depth Study on Agriculturein Latin America and the Caribbean 58
2.4 Growth, Equity and Poverty in the
123 Far East 62
2.5 Labour Mobility in the Near East 65
124 2.6 US/EEC Agricultural Trade Relations:Some Success, ContinuingDifferences and Third-Party Reactions 70

ANNEX TABLES
A.4 Volume of Exports of MajorAgricultural, Fishery and ForestProducts
A.5 World Average Export Unit Values ofSelected Agricultural, Fishery andForest Products
A.6 Volume of Imports of MajorAgricultural, Fishery and ForestProducts
A.7 Indices of Value of Exports ofAgricultural, Fishery and ForestProducts
A.8 Indices of Volume of Exports ofAgricultural, Fishery and ForestProducts
A.9 Indices of Value of Imports ofAgricultural, Fishery and ForestProducts
A.10 Indices of Volume of Imports ofAgricultural, Fishery and ForestProducts
A.11 The Importance of Agriculture inthe Economy
A.12a Resources and Their Use inAgriculture
76 A.12b Resources and Their Use inAgriculture
83
A.13 Measures of Output and Productivity87 in Agriculture
98 A.14 Carry-Over Stocks of SelectedAgricultural Products
110A.15 Annual Changes in Consumer Prices:
111 All Items and Food
114 A.16 Per Caput Dietary Energy Supplies inSelected Developed and DevelopingCountries
119
A.17 Annual Agricultural Shares of TotalOfficial Commitments to all Sectors
120 (Broad Definition), by Multilateraland Bilateral Sources, 1978-85 187
166
168
170
172
174
176
A.18 Percentage Distribution of OfficialCommitments to Agriculture (BroadDefinition), by Multilateral andBilateral Sources, 1978-85
A.19 DAC Countries: Bilateral ODACommitments from Individual
145 Countries and Proportion toAgriculture (Broad Definition)
A.20 Percentage Distribution of OfficialCommitments to Agriculture,(Excluding Technical Assistance
149 Grants), by Purpose, 1978-85
A.21 Distribution of Official Commitmentsto Agriculture, Excluding Technical
157 Assistance Grants (Broad Definition),from all Sources, by Region andEconomic Groups, 1978-85
158
178
180
182
183
185
188
189
190
191
A.1 Volume of Production of MajorAgricultural, Fishery and ForestProducts 137
A.2 Indices of Food Production
A.3 Indices of Agricultural Production 147
xii
2.7 Agriculture in Poland in the 1980s
3.1 The 35-Country Sample
3.2 Agriculture's Share of Investment
3.3 The Recurrent Cost Problem
3.4 External Assistance to Fisheries
3.5 Financing Forestry Development
3.6 Agricultural Export Taxes
3.7 Mobilizing Rural Savings: Indonesiaand the Dominican Republic
3.8 Innovative Financial Intermediaries inZimbabwe

Glossary
ACPE Asian centrally plannedeconomies
AFPLAN Regional Food Plan forAfrica (FAO)
APK Agro-Industrial Complex,USSR
APPER Africa's Priority Programmefor Economic Recovery
CFDT Committee on ForestDevelopment in theTropics (FAO)
CGIAR Consultative Group onInternational AgriculturalResearch(FAO/UNDP/World Bank)
CMEA Council for MutualEconomic Assistance
CRP Conservation ReserveProgramme
DES Dietary energy suppliesECU European Currency UnitEEC European Economic
CommunityFDI Foreign direct investmentGA I I General Agreement on
Tariffs and TradeGCF Gross capital formationGEA Government expenditure
on agricultureGDP Gross domestic productGDR German Democratic
RepublicGIEWS Global Information and
Early Warning System forFood and Agriculture (FAO)
IBRD International Bank forReconstruction andDevelopment
ICOR Incremental capital outputratios
IDA International DevelopmentAssociation
IEFR International EmergencyFood Reserve (WFP)
IFAD International Fund forAgricultural Development
IFC International FinanceCorporation
IMF International MonetaryFund
ITTO International TropicalTimber Organization
LDCs Least-developed countriesLIFDC Low-income food-deficit
countriesMIGA Multilateral Investment
Guarantee Agency (WorldBank)
MTN Multilateral TradeNegotiations
NAMBOARD National AgriculturalMarketing Board, Zambia
OAU Organization of AfricanUnity
OCA Official Commitments toAgriculture
ODA Official DevelopmentAssistance (DAC)
OECD Organisation for EconomicCooperation andDevelopment
OPEC Organization of PetroleumExporting Countries
RFMs Rural financial marketsSDR Special drawing rightsTFAP Tropical Forestry Action
PlanTF/TCP Trust Funds/Technical
Cooperation Programme(FAO)
TNCs Transnational corporationsUNCTAD United Nations Conference
on Trade and DevelopmentUNDP United Nations
Development ProgrammeUSAID United States Agency for
International DevelopmentUSDA United States Department
of AgricultureWCARRD World Conference on
Agrarian Reform and RuralDevelopment

xiv
Explanatory note
The following symbols are used in thestatistical tables:
= none or negligible.= not available.
"1985/86" signifies a crop, marketingor fiscal year running from one calendaryear to the next; "1984-86" signifies theaverage for three calendar years.
Figures in statistical tables may notadd up because of rounding. Annualchanges and rates of change have beencalculated from unrounded figures.Unless otherwise indicated, the metricsystem is used throughout. The dollarsign ($) refers to US dollars.
Production Index NumbersThe FAO index numbers have 1979-81as the base period. The production datarefer to primary commodities (e.g.,sugarcane and sugarbeet instead ofsugar) and national average producerprices are used as weights. The indicesfor food products exclude tobacco,coffee, tea, inedible oilseeds, animal andvegetable fibres and rubber. They arebased on production data presented ona calendar-year basis.'
Trade Index NumbersThe indices of trade in agriculturalproducts also are based on 1979-81.They include all the commodities andcountries shown in the F110 TradeYearbook 1985. Indices of total foodproducts include those edible productsgenerally classified as "food."
All indices represent changes incurrent values of exports (f.o.b.) andimports (c.i.f.), all expressed in USdollars. If some countries report importsvalued at f.o.b. (free on board), theseare adjusted to approximate c.i.f. (cost,insurance, freight) values. This methodof estimation shows a discrepancy
whenever the trend of insurance andfreight diverges from that of thecommodity unit values.
Volume and unit value indicesrepresent the changes in theprice-weighted sum of quantities and ofthe quantity-weighted unit values ofproducts traded between countries. Theweights are respectively the price andquantity averages of 1979-81, which isthe base reference period used for allthe index number series currentlycomputed by FAO. The Laspeyresformula is used in the construction ofthe index numbers.2
Definitions of "Narrow" and "Broad"The OECD definitions of agriculture aregenerally used in reporting on externalassistance to agriculture. The narrowdefinition of agriculture, now referred toas "directly to the sector" includes thefollowing items:
Appraisal of natural resourcesDevelopment and management ofnatural resourcesResearchSupply of production inputsFertilizersAgricultural servicesTraining and extensionCrop productionLivestock developmentFisheriesAgriculture (subsector unallocated)
The broad definition includes, inaddition to the above items, activitiesthat are defined as "indirectly to thesector." These activities are:
ForestryManufacturing of inputsAgro-industriesRural infrastructureRural developmentRegional developmentRiver development
For full details, see FAO Production Yearbook 1985, Rome, 2 For full details, see FAO Trade Yearbook 1985, Rome,1986. 1985.

Regional Coverage"Developing countries" include: (i)Developing market economies (Africa,Latin America, Near East 3, Far East andOther) and (ii) Asian centrally plannedeconomies or ACPE (China, DemocraticKampuchea, Democratic People'sRepublic of Korea, Mongolia and VietNam).
"Developed countries" include 4: (i)
Developed market economies (NorthAmerica, Western Europe, includingYugoslavia, Oceania, Israel, Japan andSouth Africa) and (ii) Centrally plannedeconomies of Eastern Europe and theUSSR (Bulgaria, Czechoslovakia, GermanDemocratic Republic, Hungary, Poland,Romania and USSR).5
3 The Near East includes: Egypt, Libyan Arab Jamahiriya, the
Sudan, Afghanistan, Bahrain, Cyprus, Islamic Republic ofIran, Iraq, Jordan, Kuwait, Lebanon, Oman, Qatar, Kingdom
of Saudi Arabia, Syrian Arab Republic, Turkey, United Arab
Emirates, Yemen Arab Republic and Democratic Yemen.
Note that "industrial countries", as defined by the Interna-
tional Monetary Fund (IMF) (see Table 1.11, include: Aus-
tralia, Austria, Belgium, Canada, Denmark, Finland, France,
Germany (Fed. Rep. of), Iceland, Ireland, Italy, Japan, Luxem-
bourg, the Netherlands, New Zealand, Norway, Spain,Sweden, Switzerland, United Kingdom and United States.(They do not include Yugoslavia, Greece, Israel, South
Africa, the centrally planned economies and some smallerother countries).
5 Albania is omitted in this report for lack of sufficient data.
XV

Introduction
While showing a wide variety of regional andcountry experiences, the world food andagricultural situation in 1986 was broadlyframed by two opposing features. On the onehand, there was a marked improvement insome important aspects of food security: moredeveloping countries achieved gains in percaput food output than in the preceding fiveyears, several heavily populated countriesconsolidated their food supply situations, andfood supply conditions also eased in somecritical areas, notably in Africa. On the otherhand, for some industrial countries, expandedavailability of food and agricultural productswas a mixed blessing in the context of anoversupply of many agricultural commodities,mounting stocks, depressed prices, deterioratingfarm incomes, despite rising costs of agriculturalprogrammes, and increasing protectionism inagricultural trade.
In this present period of transition betweeneconomic recession and full recovery, the reliefbrought about by the improvement inagricultural output has constituted, for manypoor countries, a badly needed stimulus for aneconomic revival. The first chapter of thisreport shows that domestic efforts of thesecountries to overcome the crisis have not metwith a favourable overall economicenvironment. Many of the problems currentlyfacing agriculture are closely related to theinconsistencies and weaknesses of the presenteconomic climate: (i) failure by the industrialcountries to significantly resume and transmitthe momentum of economic growth, despitelower inflation and interest rates and generallymore realistic patterns of exchange rates; (ii)disappointing trade performances, with exportvolumes failing to respond to low internationalcommodity prices; and (iii) a worsening debtsituation for many developing countries, despitereduced capital inflows, lower interest rates andadjustment efforts, which have been costly interms of human welfare.
As regards agriculture, the current situationof ample food supplies, while theoreticallywelcome in the context of global food security,also presents perverse aspects. Despite aslowdown in the growth of food production in1986, sluggish global demand continued to lagbehind output. As a consequence, the problemof global oversupply of many agriculturalproducts did not subside, unmarketable stocks,especially of cereals, dairy products and beef,continued to accumulate in several industrial
countries and some developing onesandinternational prices plummeted. Agriculturalmarkets became distorted by fierce competition,export subsidies and by other marketincentives, which vitiated comparativeadvantage relationships and undermined theefficiency of markets.
However, some progress was made in 1986in controlling the oversupply of agriculturalproducts in industrial countries. While amajority of these countries increased their foodoutput in per caput terms (some substantially)during 1980-85, only a minority of themcontinued to do so in 1986. Conversely, agreater number of developing countries werecredited with encouraging results in foodproduction in 1986. Moreover, some of themost significant gains occurred where they wereneeded most: in heavily populated countriesand in Africa where severe food shortages hadpersisted in prior years.
While such opposing trends in food outputwere, on balance, favourable,regional and country experiences differedwidely. The generally high rate of growth infood and agricultural output exacerbated thedifficulties in some agricultural commoditymarkets, as some countries became moreself-sufficient in food and others becamepotential exporters and faced problems ofsurplus disposal.
Africa achieved a cumulative growth of over8% in food production in 1985 and 1986. Thisremarkable recovery should not conceal,however, the persistence of abnormal foodshortages in five African countries. Also, thesudden emergence of localized surpluses andthe difficulty in marketing them, underlined theprecariously poised equilibrium of Africa's foodchain. This report shows the unfortunate,incongruous situation of such countrieseconomically dependent on agriculture, whichsucceeded in improving their outputperformances, yet were deprived of marketopportunities that would have permitted themto benefit from their successes.
The threat of major food losses in Africa,from grasshopper and locust infestations, whicharose in late 1985 and into 1986, receded,although the persisting danger of new upsurgesin some areas still required continuing controlefforts. Nevertheless, one year after FAO's firstwarning of a grasshopper and locust upsurge,

2
the massive efforts mobilized have alreadyyielded encouraging results.
In Latin America, the moderate recoveryachieved in 1984 and 1985 failed to consolidatein 1986. Despite slower inflationary pressures,economic activity slowed down and thesituation in the external sector deterioratedmarkedly. The difficulties in surmounting thegrave economic crisis were compounded by aseries of setbacks in the agricultural sector:food and agricultural output stagnated andexport earnings were affected by a dramaticdeterioration in the terms of trade. A sharpworsening in the debt-servicing situationbrought again the problem of indebtedness tothe forefront of the region's economicconcerns.
A generally more favourable turn of eventsoccurred in the Far East. For many Asiancountries, 1986 was a good agricultural yearand several of the most populous of themcontinued to achieve sustained growth.Paradoxically, the success in boosting agriculturecreated, in some countries, increased difficultiesin marketing and in adjusting supply todemand.
Many of the main problems and issuessurrounding agriculture in the Near East in 1986were linked to the fall in export earnings fromoil, and the consequent reduction of economicactivity and employment opportunities. Foodand agriculture in both oil-exporting and non-oilcountries were affected by cutbacks ininvestment, production and consumer subsidies,and by massive movements of migratoryworkers.
It is in the area of trade that the agriculturalsituation appeared the least encouraging. Thesituation of oversupply of many agriculturalproducts, together with depressed importdemand from industrial, oil-exporting anddebt-burdened countries, contributed to astagnation in the volume of agricultural exportsand a fall in their value. The collapse in theprices of agricultural products and a strongdeterioration in agricultural terms of traderesulted in a heavy setback for the exportearnings of many developing countries. Whileagricultural trade balances tended to improve indeveloping countries, for many of them thiswas only the consequence of a depressedcapacity to pay and, hence, an inability to takeadvantage of low international prices to importfood.
Although complete data on fishery andforestry performances in 1986 are not yetavailable, both sectors recorded substantialgains in output in 1985. Fish output expandedfor the eighth consecutive year, mainly owingto larger catches in South American waters.Being largely confined to fishmeal manufacture,such catches were, however, less significant fordirect food consumption than their largevolumes might suggest. The stagnation in fishoutput in Africa, despite the rich marineresources off West Africa especially, continuedto be a cause for concern. The volume ofworld fish trade expanded in 1985, twice as fastas output. Indeed, in 1985, fisheries appeared asthe only bright spot in a generally depressedfood and agricultural trade environment.
Forestry production also continued to expandin 1985 for the third consecutive year andexceeded previous peaks in all product areas.While trade in forest products had expandedconsiderably over the past 15 years, itstagnated in 1985, however, and actually fell indeveloping countries. Recent institutionaldevelopments of considerable potentialimportance for forestry were: the establishmentin mid-1986 of the International Tropical TimberAgreement, the support for FAO's ForestryAction Plan by the Ninth World ForestryCongress, and the International Conference onForests and Trees, along with its approval bythe FAO Committee on Forestry.
This report also reviews trends in selectedareas related to food and agriculture in theearly 1980s. This period of serious economicstress was reflected in declining nutritionallevels in nearly a half of the 100 or socountries reviewed, while a third showed onlymodest gains in per caput calorie intake. Mostregrettably, countries whose populations alreadyhad the lowest average nutritional levelssuffered the most pronounced losses in percaput calorie intake. The greatest losses werefound in Africa and Latin America, whilecountries in the Near East achieved some gainsin calorie consumption only through increasedfood imports. On the other hand, improvementin food availability in some Asian countries,which account for a major share of the totalpopulation of developing countries, can beregarded as a major accomplishment.
The crisis of the early 1980s had varyingeffects on agricultural productivity and inputusage in the different regions. This report showsthat both land and labour productivity declined
significantly in Africa and Latin America, butimproved in Asia and the Near East. Fertilizerconsumption, tractor usage and irrigationavailability were, in many cases, severelyconstrained by the economic recession. It wasalso observed that the early 1980s heightenedthe divergence in the source of agriculturalincomes of the different countries: thoserelatively more export-dependent becameincreasingly so, while for others, the domesticmarket assumed increasing importance.
The second chapter of this report focuses onthe agricultural performances of the differentregions, including the developed countries,against the background of the economic crisisof the 1980s.
Apart from greatly improved weatherconditions in 1985 and 1986, a shift in policystance was noted in Africa, conferring greaterpriority to the agricultural sector to lead to theresumption of economic growth. In LatinAmerica, agriculture was a leading sector inimplementing adjustment policies necessitatedby the economic crisis, particularly in the driveto prdmote exports and reduce imports.
Agricultural incomes are still low in Asiaand, while some countries in the region,including China and India, experiencedimpressive agricultural performances in recentyears, they face problems of adjusting outputto market demand. The potential size of China,both as an agricultural market and as a majorexporter of agricultural products, hasimplications not only for the trading countriesof Asia, but for the world as a whole.
Agriculture played a widely varying role inthe economies of the Near East region. In bothoil-exporting and oil-importing countries,however, the sector had to adjust to theconsequences of declining oil revenues. Largeagricultural subsidies for producers andconsumers were cut as part of austeritymeasures in some countries, and decliningremittances affected others, which alsowitnessed a return of migratory labourers.
Questions of agricultural adjustment werevery much to the fore in the developed marketeconomies, although the concerns were mainlyabout the need to restore farm incomes andthe size of farm supports, programmes andbudgets. The small, exporting countries of thisgroup found it difficult to maintain their marketshares in the face of fierce competition, and
their agricultural sectors suffered as aconsequence.
The agricultural sectors of Eastern Europe andthe USSR had some success in adapting to theharsh economic climate of the 1980s. In somecountries, the higher costs of energy andinputs, the declining willingness of states toapply large subsidies, and reduced levels ofimported inputs and supplies, had to beabsorbed. By and large, this was achieved andoutput growth accelerated.
This year's special chapter in The State ofFood and Agriculture reviews agriculturalfinancing in developing countries, identifying itsmain sources and uses, and examining anumber of issues it raises. Recent experiencesshared by many developingcountriesadjustment of their economies dueto balance of payment difficulties, theworsening external debt situation and excessivefiscal deficitshave led to a reappraisal of therole of agriculture during this period ofadjustment. The sector's contribution toexternal and domestic adjustments areexamined from the perspective of agriculture asa recipient and a generator of financialresources. This discussion also provides thebackground for a review of public and privatesources of funds for agricultural development,among other development objectives and theiruses.
In many developing countries, agriculturalfinancing is seriously constrained by budgetarydifficulties, the levelling off in the growth inflows of external assistance, a reluctance toincur further debts from additional externalborrowings if these are available and theunwillingness to raise domestic budgetarycommitments. As a consequence, only twofeasible broad lines of policy action remainopen to increase resource flows for agriculturaldevelopment.
The first approach is to promote foreigndirect investment (FDI) in the sector. Yetthis is particularly difficult for poorercountries whose structure of agriculture isunlikely to attract much foreign investment.Furthermore, such flows to agriculture havebeen relatively small in the past, except for alimited number of countries, and although FDI,strictly speaking, is not regarded as debt beingequity investment, it has costs andcommitments for the recipient country thatmust be considered.
3
4
The second approach is the adoption ofpolicies to strengthen rural financial markets, toenable them to stimulate and mobilize domesticsavings and intermediate more effectivelybetween savers and borrowers. Althoughlow-income rural people may not be able tosave much, there is evidence to show that theirpropensity to save is surprisingly high. Givenadequate financial incentives, rural savings couldattain large volumes mainly by the numbers ofrural people in most developing countries.Previous policies, based on parastatal financialinstitutions and subsidized credit programmes,have inhibited the development of ruralfinancial markets. Nevertheless, policy reformsmay not be uniformly easy to introduce, ifinterest rates are allowed to become seriouslydistorted. The path of adjustment may be adifficult one.
This brief review of sources and uses ofagricultural finance, during a period of profoundmacro-economic adjustment, shows the needfor further work and research. Concepts oftenare inconsistent and reliable data are lacking.The need for further improving availability andanalysis of data on public expenditure, as wellas on rural private savings and investment,cannot be overemphasized. The dearth ofinformation is particularly acute for componentsof public expenditure on agriculture, not onlythrough the government budget, but throughagricultural parastatals and quasi-governmentagencies. The potential for rural savings, theamounts saved, and in what form, need to bethoroughly assessed. The amount and nature ofprivate investment in agriculture need to bemore accurately quantified. Explicit taxation ofthe agricultural sector needs further study andanalysis.

PART ONEWORLD REVIEW
ECONOMIC, FINANCIAL ANDTRADE ENVIEGNMENT
OverviewEconomic and trade performances in 1985 andthe first half of 1986 present a mixed picture ofaccomplishments and uncertainties. Severalfactors, which would generally supporteconomic growth and trade expansion, tendedto consolidate: inflation receded in mostcountries, largely as a result of sharply fallingprices of oil and other commodities; nominalinterest rates fell to their lowest levels since theearly 1980s; and the US dollar depreciatedsteeply, though in a relatively orderly way.Despite such stimulus to economic activity,estimates for 1985 and the first half of 1986indicated a slowdown in growth in industrialcountries more pronounced than had beenexpected, particularly in the United States. Atthe same time, world trade stagnated,protectionist pressures intensified and manydeveloping countries, already severely burdenedby their external debt and related austeritymeasures, faced a continuing fall in the pricesof their commodity exports.
Capital-importing countries significantlyconstrained imports and improved their tradebalances from a deficit of $67 200 million in1981 to a surplus of $10 000 million in 1985,although a deficit of $6 600 million was againexpected in 1986. Despite this improvementand a restructuring of their debt, external debtremained a major obstacle to a resumption ofgrowth in many developing countries. Thedebt-service ratio of capital-importing countriesworsened in 1985 to 24%, a little higher thanthe previous peak of 1982, and was expectedto worsen further to 25.5% in 1986 (Table 1.1).
Prospects for the medium term were for aresumption of momentum in economic activityand a generally more balanced pattern ofgrowth. These expectations are uncertainhowever, as economic prospects are contingentupon such unpredictable factors as movementsin exchange and interest rates, future trends inprices of oil and other commodities, and theability by developing countries to benefit fromthe momentum of growth in industrialcountries. It is also uncertain whether privateand official creditors will adequately increasetheir lending to heavily indebted countries, soas to enable them to reabsorb their debt andresume growth, and whether governments ofmajor importing countries will succeed incontaining protectionist pressures.
The beneficial effects for agriculture of a
continued economic recovery should not beunderestimated. As shown by the experience ofrecent years, the overall economic environmentcan exert an influence on food and agriculturalproduction, trade and consumption comparableto that of policies and factors specificallyrelated to agriculture.
Progress in international economiccooperation has been uneven. Some broadareas of disagreement remain among industrialcountries on such issues as exchange andinterest rates, and the ways to tackle thecurrent account imbalances in differentcountries. In the area of international trade, amajor event was the decision to launnpch 3t5h)e.eighth round of multilateral trade negotiations(the Uruguay Round) (see Box 1.3
Output Growth and PatternsAccording to International Monetary Fund (IMF)estimates, world output of goods and servicesrose 3.1% in 1985, considerably below theexpansion of 4.4% recorded in 1984. Theslowdown was particularly pronounced inindustrial countries (3% in 1985, down from4.8% the previous year). This resulted largelyfrom a tapering off in the economic expansionof the United States, although growth was alsosmaller in Japan and Europe.
In the first half of 1986, the pace ofeconomic activity in industrial countries sloweddown substantially reflecting, among othercountry-specific factors, reduced stockbuildingand lower net exports by the United States,and the negative impact of currencyre-evaluations in Japan and the Federal Republicof Germany. Although there were signs of astrengthening in domestic demand andeconomic activity later in the year, the overallgrowth in real GDP in 1986 in industrialcountries was not expected to have reachedthe previous year's level.
Prospects for 1987 were for a modeststrengthening of economic activity in industrialcountries fostered by successful efforts ofbudgetary consolidation, declining inflation andinterest rates and improved terms of trade.These factors should more than offsetgovernment spending restraint and weak exportopportunities in developing-country markets.
Developing countries as a whole experienceda decline in output growth from slightly over4% in 1984 to 3.2% in 1985. Latin Americawas the only developing region whereeconomic growth in real terms acceleratedsignificantly in the latter year. Although some ofthe largest developing countries, namely India
7

TABLE 1.1. Annual changes in selected economic and financial indicators, 1980-86
(Percentages)
Preliminary.b Payments (interests, amortization or both) as percentage of exports of goods and services.Source: IMF, World Economic Outlook, October 1986.
Item 1980 1981 1982 1983 1984 1985 1986'
OUTPUT
Industrial countries 1.2 1.4 -0.4 2.6 4.8 3.0 2.7
Developing countries 3.5 2.2 1.6 1.4 4.1 3.2 2.7
Africa 3.7 1.8 0.8 -1.7 1.7 2.0 1.4
Asia 5.4 5.5 5.0 7.6 7.9 6.0 4.6
Near East -2.2 -1.8 -0.1 0.1 0.9 -1.2 -Latin America 5.3 0.9 - 1.0 -3.1 3.2 3.7 2.7
CONSUMER PRICES
Industrial countries 11.8 9.9 7.3 4.9 4.7 4.0 2.2
Developing countries 27.1 26.1 24.4 33.0 37.9 39.6 28.4
Africa 16.4 22.0 11.4 19.3 20.0 13.1 12.6
Asia 13.1 10.6 6.3 6.6 7.2 7.4 5.8
Near East 16.8 15.2 12.7 12.3 14.7 11.7 11.2
Latin America 54.2 59.0 66.4 102.7 123.4 145.7 86.5
EXPORT VOLUMES
Industrial countries 4.0 3.6 -2.1 2.7 9.6 4.3 3.0
Developing countries -4.1 -5.9 -8.2 3.1 6.7 0.7 5.8
Africa -0.6 -15.8 -7.5 3.1 4.8 3.7 5.0
Asia 9.0 8.2 0.8 10.8 13.8 3.8 6.9
Near East -15.2 -17.6 -19.7 -9.2 -5.4 -5.4 12.8
Latin America 1.2 6.1 -2.5 8.5 8.6 -1.7 -0.1
IMPORT VOLUMES
Industrial countries -1.7 -2.2 0.6 4.6 12.5 4.8 7.5
Developing countries 8.5 6.7 -4.1 -2.7 1.7 -1.1 -3.7Africa 8.7 10.9 -8.3 -10.3 0.2 -7.0 -9.8Asia 10.2 3.4 -0.3 8.1 5.5 5.6 1.7
Near East 9.4 16.0 5.9 -2.9 -7.0 -14.0 -18.7Latin America 9.8 2.5 -17.7 -22.3 3.0 -0.6 -
TERMS OF TRADE
Industrial countries -7.2 -2.0 1.9 1.5 0.5 0.9 8.0
Developing countries 16.8 3.0 -0.9 -3.8 1.4 -2.2 -16.3Africa 15.5 2.4 -3.2 -2.7 2.8 -1.2 -24.2Asia -1.7 -4.4 -0.7 -0.5 1.3 -1.8 -3.9Near East 41.3 13.3 2.2 -8.8 0.1 -3.6 -44.0Latin America 7.1 -4.3 -5.4 -3.0 3.5 -2.6 -12.4
DEBT-SERVICE RATIO"
Capital-importing countries 17.3 20.7 24.7 22.3 23.9 24.0 25.5Africa 13.8 15.4 20.6 23.0 25.8 28.4 33.5
Asia 8.2 9.6 11.3 10.9 11.9 12.7 13.1
Non-oil Near East 17.3 21.1 26.4 26.5 28.9 31.7 34.6
Latin America 33.7 41.2 50.6 41.9 41.1 40.3 46.0
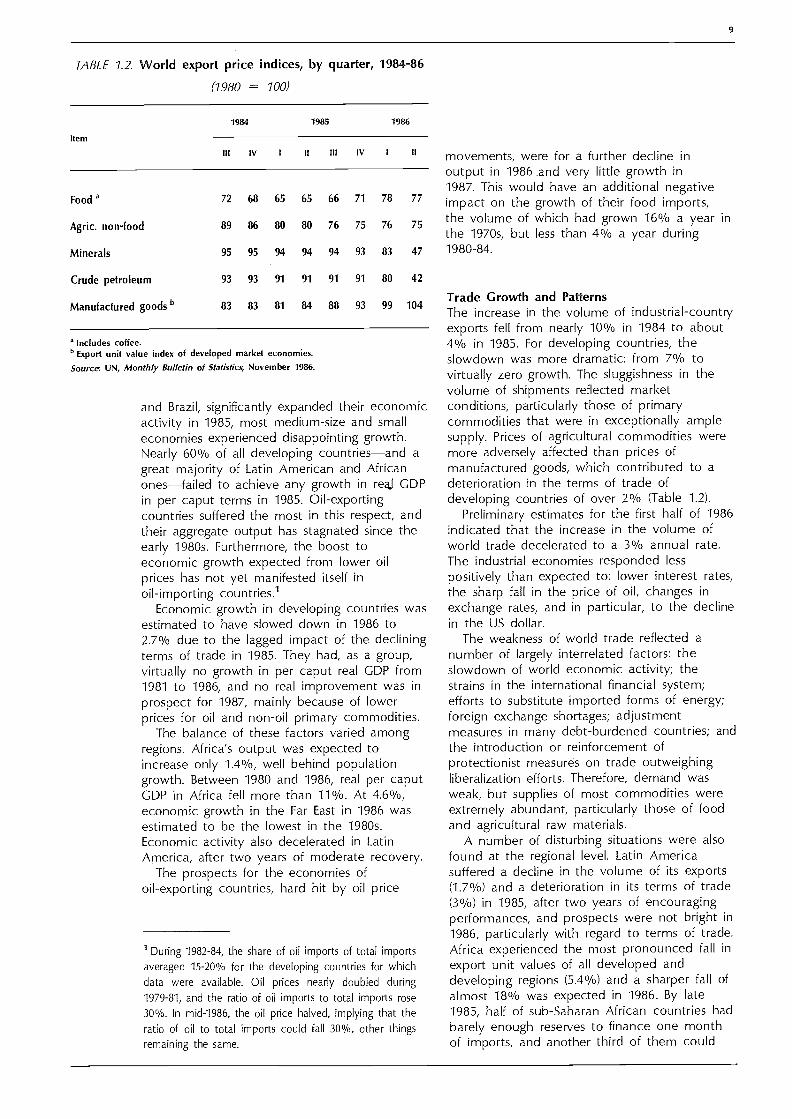
TABLE 1.2. World export price indices, by quarter, 1984-86
includes coffee.Export unit value index of developed market economies.
Source: UN, Monthly Bulletin of Statistics, November 1986.
and Brazil, significantly expanded their economicactivity in 1985, most medium-size and smalleconomies experienced disappointing growth.Nearly 60% of all developing countriesand agreat majority of Latin American and Africanonesfailed to achieve any growth in rea.1 GDPin per caput terms in 1985. Oil-exportingcountries suffered the most in this respect, andtheir aggregate output has stagnated since theearly 1980s. Furthermore, the boost toeconomic growth expected from lower oilprices has not yet manifested itself inoil-importing countries.'
Economic growth in developing countries wasestimated to have slowed down in 1986 to2.7% due to the lagged impact of the decliningterms of trade in 1985. They had, as a group,virtually no growth in per caput real GDP from1981 to 1986, and no real improvement was inprospect for 1987, mainly because of lowerprices for oil and non-oil primary commodities.
The balance of these factors varied amongregions. Africa's output was expected toincrease only 1.4%, well behind populationgrowth. Between 1980 and 1986, real per caputGDP in Africa fell more than 11%. At 4.6%,economic growth in the Far East in 1986 wasestimated to be the lowest in the 1980s.Economic activity also decelerated in LatinAmerica, after two years of moderate recovery.
The prospects for the economies ofoil-exporting countries, hard hit by oil price
1 During 1982-84, the share of oil imports of total importsaveraged 15-20% for the developing countries for whichdata were available. Oil prices nearly doubled during1979-81, and the ratio of oil imports to total imports rose30%. In mid-1986, the oil price halved, implying that theratio of oil to total imports could fall 30%, other thingsremaining the same.
movements, were for a further decline inoutput in 1986 and very little growth in1987. This would have an additional negativeimpact on the growth of their food imports,the volume of which had grown 16% a year inthe 1970s, but less than 4% a year during1980-84.
Trade Growth and PatternsThe increase in the volume of industrial-countryexports fell from nearly 10% in 1984 to about4% in 1985. For developing countries, theslowdown was more dramatic: from 7% tovirtually zero growth. The sluggishness in thevolume of shipments reflected marketconditions, particularly those of primarycommodities that were in exceptionally amplesupply. Prices of agricultural commodities weremore adversely affected than prices ofmanufactured goods, which contributed to adeterioration in the terms of trade ofdeveloping countries of over 2% (Table 1.2).
Preliminary estimates for the first half of 1986indicated that the increase in the volume ofworld trade decelerated to a 3% annual rate.The industrial economies responded lesspositively than expected to: lower interest rates,the sharp fall in the price of oil, changes inexchange rates, and in particular, to the declinein the US dollar.
The weakness of world trade reflected anumber of largely interrelated factors: theslowdown of world economic activity; thestrains in the international financial system;efforts to substitute imported forms of energy;foreign exchange shortages; adjustmentmeasures in many debt-burdened countries; andthe introduction or reinforcement ofprotectionist measures on trade outweighingliberalization efforts. Therefore, demand wasweak, but supplies of most commodities wereextremely abundant, particularly those of foodand agricultural raw materials.
A number of disturbing situations were alsofound at the regional level. Latin Americasuffered a decline in the volume of its exports(1.7%) and a deterioration in its terms of trade(3%) in 1985, after two years of encouragingperformances, and prospects were not bright in1986, particularly with regard to terms of trade.Africa experienced the most pronounced fall inexport unit values of all developed anddeveloping regions (5.4%) and a sharper fall ofalmost 18% was expected in 1986. By late1985, half of sub-Saharan African countries hadbarely enough reserves to finance one monthof imports, and another third of them could
9
(1980 = 100)
item
1984 1985 1986
III IV II III IV
Food a 72 68 65 65 66 71 78 77
Agric. non-food 89 86 80 80 76 75 76 75
Minerals 95 95 94 94 94 93 83 47
Crude petroleum 93 93 91 91 91 91 80 42
Manufactured goods b 83 83 81 84 88 93 99 104

10
only finance two months of imports. Asia alsowas affected by sluggish growth in trade, withexport volumes increasing only 3.8% in 1985,well below the average of the 1980s. Its termsof trade also deteriorated and were expected toworsen further in 1986, but export volumesshould improve.
The combination of low export earnings andhigh debt-service costs imposed severecontraints on imports. Imports declinedconsiderably in volume in all developing regionsexcept Asia, and adversely affected sectorsproducing tradable goods, particularly thosedependent on imported inputs.
Estimates for 1986 provided littleencouragement for most developing countries.According to the IMF, the continuing fall in
commodity prices was expected to cause a16% deterioration in their terms of trade, morethan offsetting a 6% expansion in exportvolumes. The resulting fall in export earningswill inevitably depress the import- anddebt-payment capacity of many developingcountries and retard their resumption ofeconomic growth. On the other hand,oil-importing countries will benefit from loweroil prices, particularly as regards their tradebalances, but also on the side of theirproduction costs. Indeed, the group of netoil-importing developing countries was expectedto reduce its deficit of current accounts, froman aggregated $21 400 million in 1985 to $12900 million in 1986.
Domestic Prices and Interest RatesA number of developments combined in 1985and 1986 to ease inflation in and narrowinflation rate differentials among industrialcountries. These developments were: the lowercost of imported oil, food and raw materials; agenerally cautious attitude of governments andcentral banks in implementing their monetaryand fiscal policies; a restrained "cost push" fromwages reflecting the persistence of highunemployment; and exchange rate factors,including the depreciation of the US dollarsince the second quarter of 1985, whichcontributed to hold down costs and pricesoutside the United States.
The result was a further decline in averageinflation rates of developed countries, from4.2% in 1984 to 3.8% in 1985. IMF forecastsyearly increases of barely over 3% in consumerprices in industrial countries for the whole of1986 and 1987, figures last seen in the 1960s.But inflationary fears remain as may bewitnessed by the rise in the price of gold and
sudden declines in stock markets that occurredin the third quarter of 1986.
For developing countries, price inflation was amajor problem during the past decade.Abatement in inflationary pressures, however,appears to have taken place in a majority ofthem since 1985. Furthermore, radicaladjustment measures taken in recent monthsby several of the countries most severelyaffected by inflation already have resulted indramatic falls in month-to-month increases indomestic prices.
For developing countries as a whole,consumer prices in 1986 were expected toincrease by about 28%, a low figure in thecontext of the 1980s. This was due mainly to asharp reduction in the inflation rate in LatinAmerica, from 146% in 1985 to 86% in 1986.
One consequence of the overall decline ininflation rates in developed countries has beena decline in nominal interest rates, althoughthey remain high by historic standards. ByNovember 1986, the average short-term interestrate in seven major industrial countries wasabout 6%, down from 8.5% in 1985, and anaverage long-term rate. of 7% compared with9.8% in 1985.
The balance among the various regions andgroupings of countries of the various factorscontributing to economic growth lead todifferent conclusions depending on theperspective taken. Low commodity prices,particularly for oil, will promote globaleconomic growth and, combined with lowerinflationary expectations, should cause nominalinterest rates to fall. Yet these same low priceswill reduce export earnings in some indebtedcountries and worsen their debt situation,despite lower interest rates.
There are two main areas of disagreementamong various observers of economic trends,which can be summarized as follows. The firstrelates to the ability of industrial countries toact as an engine of growth and pull along theeconomies of developing countries at anadequate pace. It is argued that concerns forbudgetary restraint in the industrial countrieswill not allow for sufficiently high rates ofeconomic growth, despite recent welcomemoves on their part to coordinate economicpolicies so as to remove distortions in exchangeand interest rates. Furthermore, despite movestoward negotiations aimed at achieving greatertrade liberalization, protectionist pressures seemlikely to remain a powerful force hampering theresumption of former growth rates in worldtrade. In addition, structural changes have takenplace in the demand of industrial countries for

BOX 1.1
The Chernobyl nuclearaccident
primary commodities, which further hamperexport prospects of developing countries.
Even assuming a favourable turn of events ininternational economic and trade relationships,the ability of developing countries to positivelyreact to external stimuli to growth would alsodepend on their own efforts to establish stablemonetary and fiscal policies, reduce pricedistortions and introduce more flexibility intolabour markets.
The second area of disagreement concernsthe adequacy of resource flows to restoresocially acceptable rates of economic growth indeveloping countries. Between 1981 and 1984,the capital-importing countries improved theirtrade balances mostly by reducing theirimports. Their net capital flows (net external
borrowing plus non-debt creating flows plusasset transactions) fell from $128 000 million to$49 000 million during 1981-85. Their netinvestment income turned more negative at thesame time ( $42 000 million to $60 000million). Hence, net resource transfers fellsharply from $86 000 million in 1981 to
$11 000 in 1985. Therefore, although thesecountries had a trade surplus and were stillmajor importers of capital, they suffered a netoutflow of resources in 1985. The argument isfor an increase in resource flows tocapital-importing countries to enable them toresume growth.
A number of recent initiatives andsuggestions centre on this argument. InSeptember 1985, an initiative was announced
This accident, which took place on26 April 1986 and releasedsignificant quantities of radioactiveisotopes into the atmosphere,underlined the susceptibility ofagriculture to disasters of this kind.
Although the reactor damagedby the accident is located in theUkraine, which accounts for about20% of the USSR's output ofcereals, the area of worstcontamination was limited to aradius of approximately 30 kmaround the reactor. The impact oncereal production may, therefore,be relatively limited. Nevertheless,winds spread the radioactivitywidely throughout Eastern andWestern Europe and into parts ofAsia. The resulting contaminationof fruit, vegetable and livestockproducts caused serious disruptionsto domestic and internationaltrade. A ban was imposed by theEEC until the end of May 1986 onimports of these products fromareas within a radius of 1 000 kmof Chernobyl.
The long-term environmentalimpact of this accident cannot yetbe assessed. However, it hasshown a clear need forinternational action that will leadto acceptable limits forradionuclide contamination offoods, since such limits did notexist at the time of the accident.
Activities leading torecommended international limitswould involve the CodexAlimentarius and the jointFAO/International Atomic EnergyAgency (IAEA) Division.' As a firststep, FAO convened an expertconsultation, held 1-5 December1986, that recommendedinternational limits for radionuclidecontamination in all foods. Theselimits will be widely publicized andwill be submitted also to theCodex Alimentarius Commission forconsideration. Uniform adoptionand application of these limits byregulatory authorities will preventtrade disruptions such as occurredafter the Chernobyl accident.
1 Of Isotope and Radiation Applications of
Atomic Energy for Food and Agricultural
Development (AGE).
11

12
(the Baker Plan) to form a partnership amongdebtor countries, multilateral agencies andcommercial banks to lend $29 000 million tothe 15 most heavily indebted countries-overthree years, subject to some policy changes inthe indebted countries. Other recentsuggestions, which encompass both the needfor new lending and some form of debt releasefor debtor countries, hinge on the activeparticipation of commercial banks. A suggestionof particular interest made in July was for thecreation of special financing facilities fromrecycled Japanese and northern Europeancurrent-account surpluses in favour of thedebtor countries.
The case for Africa, specifically for agricultureand for sectors directly supporting agriculture,was presented to the UN General AssemblySpecial Session on Africa's Economic and SocialCrisis, in May 1986 (see Regional Reviewchapter on Africa).
The difficulties that some of these recentinitiatives encountered to overcome the debtproblems were clearly linked to thedeterioration in the debt-export earnings ratioand the severity of adjustment programmesinvolved. The July 1986 agreement betweenMexico and the IMF provided, however, anexample of how flexibility could be introducedinto adjustment measures that take account ofspecific needs and circumstances of a debtorcountry.
WORLD FOOD ANDAGRICULTURAL SITUATION ANDPROSPECTS
Food and Agricultural Production 2World agricultural production increased 1.3% in1986 as a net result of 2% growth in food and7.3% decline in non-food production (Table 1.3).The latter was the most significant decline since1970.
These results showed a fall back in overallagricultural performances if compared with 1985or indeed the average for 1980-86. Theyconcealed, however, substantial variationsamong regions and country groups.
Food output growth in developing countriesin 1986 was at a similar rate as that of 1980-86(3.7% and 3.5% a year respectively). Growth inAfrica (3.1%) was substantially lower than in1985, when a 7% increase was achieved; itwas, however, above the average growth ratefor 1980-86. Food output in the Far Eastmarginally increased and the growth was belowthe average for the 1980s. Also, in LatinAmerica the rise was limited in 1986 to 0.4%,thus much less than the 2.2% a year for1980-86, which was just below the populationgrowth rate of around 2.3% a year. Theincrease in food output in the Near East was5.8%, following the 5.1% increase in 1985. Thepace of food output growth in the Asiancentrally planned economies (AGPE)mainlyChina which slowed in 1985, accelerated againin 1986, to 6.6%.
In the developed countries, 1986 food outputbarely changed as a net result of a 1.6% fall inthe countries with market economies and a4.3% increase in East European countries andthe USSR. Output of the 12-member countriesof the European Economic Community (EEC) didnot change as a group.
In developing countries, growth in output ofnon-food products, which are major sources ofincome and foreign exchange, fell in 1986 by7.6%. Output of the main non-foodcommodities such as cotton, tobacco, coffeeand tea declined (Table 1.4).
As regards changes in food production at theindividual country level, 1986 was on the whole
fdvoui able yea'. Out of 97 developingcountries, 40, mostly in Asia and Africa,increased their food output in per caput terms.
This general review is complemented by a more detaileddiscussion in the Regional Review.

Item
TABLE 1.3. Food and non-food production, 1984-86
Index Annuale
(1979-81=100)Chang
ratesof change
1984 1985 1986 1984-85 1985-86 1980-86(%) (8ó)
Source: FAO, Statistics Division.
13
FOOD PRODUCTION
Developing market economies 111 115 118 3.6 2.4 2.7
Africa 104 112 115 6.9 3.1 2.1
Far East 116 119 122 2.4 2.7 3.5
Latin America 109 113 114 3.4 0.4 2.2
Near East 106 111 118 5.1 5.8 2.1
Asian centrally planned economies 125 126 135 0.8 6.6 5.4
Total developing countries 115 119 123 2.7 3.7 3.5
Developed market economies 106 107 105 1.1 -1.6 1.1
North America 103 108 104 5.6 -3.5 1.0
Oceania 105 107 105 1.0 -1.5 2.0
Western Europe 110 107 107 -3.4 0.2 1.1
Eastern Europe and the USSR 110 110 115 -0.1 4.3 2.6
Total developed countries 107 108 108 0.8 0.1 1.5
WORLD 111 113 115 1.8 2.0 2.5
NON-FOOD PRODUCTION
Developing market economies 105 115 105 9.6 -9.1 1.9
Africa 110 123 125 12.1 2.0 3.9
Far East 109 120 110 10.1 -8.0 2.7
Latin America 99 110 92 10.8 -16.9 0.3
Near East 107 108 106 0.9 -1.8 1.4
Asian centrally planned economies 178 153 148 -14.1 -3.6 7.6
Total developing countries 121 124 114 1.8 -7.6 3.3
Developed market economies 100 105 92 4.6 -11.5 -0.1
North America 95 96 75 0.6 -22.0 -2.6
Oceanía 106 119 118 12.8 -0.9 2.8
Western Europe 116 124 121 6.7 -2.0 4.0
Eastern Europe and USSR 98 103 104 5.0 0.9 0.2
Total developed countries 99 104 97 4.8 -6.8
WORLD 114 117 108 2.7 -7.3 2.2

Pre
limin
ary.
Incl
udin
g ric
e as
pad
dy.
'Tot
al h
arve
sted
pro
duct
ion.
Sou
rce.
FA
O, S
tatis
tics
Div
isio
n.
TA
BLE
1.4
. Agr
icui
tUra
l pro
duct
ion,
by
com
mod
ity, 1
985-
86
Item
1985
(Mill
ion
tons
)
1986
'
Cha
nge
1985 to 1986
(%)
1985
1986
'
(Mill
ion
tons
)
Cha
nge
1985 to
1986
(96)
1985
1986
'
(Mill
ion
tons
)
Cha
nge
1985 to
1986
(%)
Tot
al c
erea
ls b
918.
690
7.1
-1.3
925.
095
3.0
3.0
1 84
3.6
1 86
0.0
0.9
Whe
at30
1.8
308.
22.
120
3.6
216.
36.
250
5.4
524.
53.
8
Ric
e26
.325
.9-1
.544
6.4
454.
21.
847
2.7
480.
21.
6
Coa
rse
grai
ns59
0.5
572.
9-3
.027
5.0
282.
42.
786
5.5
855.
4-
1.2
Roo
t cro
ps21
5.8
212.
4-1
.636
9.3
373.
51.
158
5.1
585.
901
Pul
ses
17.1
18.5
8.2
34.3
35.9
4.5
51.4
54.4
5.8
Oil-
bear
ing
crop
s
Oil
cont
ent
24.1
23.4
-3.0
40.6
42.6
4.8
64.7
66.0
1.9
01/c
ake
cont
ent
67.5
65.2
-3.3
67.7
65.7
-2.8
135.
113
1.0
-3.1
Sug
ar, c
entr
ifuga
l (ra
w)
41.9
41.0
-2.1
79.6
81.5
2.3
121.
512
2.5
0.8
Coc
oa b
eans
--
-2.
02.
02.
02.
0
Cof
fee
--
-6.
05.
2-1
3.8
6.0
5.2
-13.
8T
ea0.
30.
3-4
.02.
12.
0-1
.72.
32.
3-1
.1
Cot
ton
lint
6.2
5.4
-12.
511
.010
.2-7
.317
.215
.7-9
.2T
obac
co2.
12.
0-6
.84.
44.
3-2
.66.
66.
3-4
.0
Tot
al m
eat
95.3
97.0
1.8
54.8
57.9
5.7
150.
115
4.9
3.2
Tot
al m
ilk38
6.2
391.
21.
312
5.1
128.
12.
451
1.3
519.
31.
6
Hen
egg
s18
.819
.11.
411
.812
.34.
730
.631
.42.
7
Dev
elop
ed c
ount
ries
Dev
elop
ing
coun
trie
sW
orld

Percentagerate of change
5.01 to 10.00
3.01 to 5.00
1.01 to 3.00
2.01 to 1.00
0.01 to 1.00
1.00 to 3.00
3.01 to 5.00
5.01 to 10.00
Source: FAO, Policy Analysis Division.
TABLE 1.5. Percentage rate of change in per caput food production, 1985-86
Developing countries
Chile, Syrian Arab Republic, Yemen Arab Republic,
Mauritania, Mali, Guinea-Bissau, Mauritius, Malaysia,
Lebanon, China
The Sudan, Swaziland, Burundi, Ghana, Chad
Turkey, Burkina Faso, Pakistan, Burma, Jordan, India,
Indonesia, Haiti
Colombia, Egypt, Republic of Korea, Argentina, Rwanda,
Ethiopia, Gabon, Jamaica, Cameroon, Philippines, Trinidad
and Tobago, Uruguay, Bhutan
Kuwait, Oman, United Arab Emirates, Kenya,
Mozambique, Nepal, Brunei, Islamic Republic of Iran,
Singapore, Guatemala, United Republic of Tanzania,
Somalia, Congo, Cyprus, Zaire
Sierra Leone, Bangladesh, Panama, Namibia, Madagascar,
Venezuela, Botswana, Papua New Guinea, Costa Rica,
Zambia, Zimbabwe, Mexico, Malawi, Honduras, Nigeria,
Brazil, Central African Republic, Angola, DominicanRepublic, Benin, Nicaragua
Developed countries
Yugoslavia, Canada, Bulgaria
USSR, Poland, Federal Republic of Germany
German Democratic Republic, Spain
The Netherlands, Denmark
United Kingdom, Romania, Japan,
Switzerland, Norway
Italy, Finland, Australia, Belgium,
Luxembourg, France, Iceland, Ireland
Peru, Guinea, Ecuador, Niger, Democratic Yemen, Cuba, Greece, Austria, Czechoslovakia, HungarySri Lanka
El Salvador, Thailand, Togo, Côte d'Ivoire, Algeria, United States, South Africa, New Zealand,Paraguay, Afghanistan, Bolivia, Guyana, Lesotho, Liberia Sweden
Below 10.00 Tunisia, the Gambia, Senegal, Libyan Arab Jamahiriya Israel
This group, which includes such heavilypopulated countries as China, India, Pakistan,Indonesia and Egypt, accounts for a majorshare of the total population of developingcountries (Table 1.5). By comparison, only 33countries achieved gains in per caput foodproduction on an average annual basis during1980-85.
An opposite trend was found in industrialcountries: during 1980-85, per caput foodoutput expanded in all but four of them,namely South Africa, Iceland, Greece andYugoslavia. Several of the major food producingand exporting countries experienced substantialincreases, in the average range of 1.50/0 to4.8% a year, during this period. These included
Denmark, Australia, Japan, Federal Republic ofGermany, the United Kingdom, and most EastEuropean countries. In 1986, however, theirfood production growth slowed. In onlyone-third of all developed countries did outputgrowth still exceed population increase.
Such opposing broad trends in developedand developing countries were, paradoxically,equally welcome. In developing countries,higher food production growth in 1986contributed to alleviate food shortages andoverall economic conditions in many criticalareas, particularly in Africa. On the other hand,the slowdown in food output growth was apositive development for many industrialcountries, in the context of the complex
15
More than 10.00 Uganda, Kingdom of Saudi Arabia, Iraq, Morocco

16
Item
Source: FAO, Land and Water Development Division.
TABLE 1.6. Fertilizer consumption, by major nutrients, 1982-85
1982/83
Consumption
1983/84
(Million tons)
problem of their growing food surpluses. Asreviewed in the Regional Review chapter of thisdocument, however, the problem of foodsurpluses also emerged, or became more acute,in some developing countries facing the viciouscircle of limited domestic absorption capacity inmarket conditions, insufficient storage andmarketing facilities, and difficult access tointernational markets.
The Outlook for CerealsThe world cereal situation in 1986/87 was notexpected to change substantially from recentyears: supply surpluses had led to new recordlevels of stocks, and imports and pricesremained depressed.
World cereal harvests increased slightly in1986, mainly because of reduced harvests ofrice and coarse grains in developed countries(down 1.5% and 3% respectively) and a rise inall cereals in developing countries, whereproduction of wheat expanded by more than6%.
1984/851982/83
to1983/84
Change
(%)
1983/84to
1984/85
Annual rateof change
1980/81to
1984/85(%)
The forecast of stocks at the end of the1986/87 season, was estimated at a record levelof around 450 million tons, which wouldrepresent 27% of world consumption.Compared with the previous season, theincrease would be over 40 million tons forcoarse grains and 7 million tons for wheat.Stocks of rice, however, were expected todecline by about 4 million tons.
FAO's forecast of cereal imports in 1986/87,was close to the low level, 182 million tons,obtained in the previous marketing season.Reduced imports of grain by the USSR wereexpected as a result of the favourable outcomeof the 1986 harvest. Cereal imports bydeveloping countries, many of which benefitedfrom particularly favourable domestic supplyconditions, would rise only 2%.
The United States lowered price supportlevels for cereals for the 1986 crop and this,together with larger stocks and supplies, led tofurther declines in world market prices: morethan $30 per ton less for both US Hard Winterwheat and for maize by December 1986
DEVELOPED COUNTRIES
Nitrogen 34.57 38.09 38.69 10.2 1.6 2.4
Phosphate 20.79 22.42 22.34 7.8 -0.4 0.7
Potash 19.20 21.48 21.25 11.9 -1.1 1.8
TOTAL 74.56 81.98 82.29 10.0 0.4 1.8
DEVELOPING COUNTRIES
Nitrogen 26.48 29.04 31.81 9.7 9.5 6.5
Phosphate 9.79 10.47 11.93 6.9 13.9 5.9
Potash 3.69 3.94 4.64 6.8 17.8 3.3
TOTAL
of which:
39.96 43.45 48.38 8.7 11.3 6.0
Africa 1.33 1.47 1.47 10.5 0.5
Far East 11.24 12.41 14.30 10.4 15.1 8.7
Latin America 6.45 5.73 7.39 -11.2 28.8 -1.4Near East 3.82 4.37 4.24 14.4 -3.0 8.4
Asian centrally planned economies 17.10 19.45 20.98 13.8 7.8 7.1
WORLD
Nitrogen 61.05 67.13 70.51 10.0 5.0 4.2
Phosphate 30.58 32.88 34.27 7.5 4.2 2.3
Potash 22.88 25.41 25.89 11.1 1.9 2.0
TOTAL 114.51 125.43 130.67 9.5 4.2 3.2

compared with the previous year. Amongcereals, only prices of better quality riceremained relatively stable.
Prices and Consumption of FertilizersAs a consequence of generally weak demandand abundant world market supplies, exportprices of major fertilizer products declined, inmany cases dramatically (Fig. 1.1). Thus, towardthe end of 1986, the price of ammoniumsulphate was more than 40% lower than a yearbefore, although by the end of the year, it hadrecovered. The price of potassium chloride fellmore than 20% during the same period, andthose of other fertilizer materials, between 20%and 27%, depending on sources of supply.Such price changes tended to reflectmovements in international prices of cereals.
World consumption of the three primarynutrients combined rose 4.2% in 1984/85 andthus remained above the trend for the 1980s(Table 1.6). The growth was mostly due toincreased fertilizer use in developing countries,which accelerated their aggregate consumptionin the last two years. Nevertheless, fertilizerconsumption declined in the Near East andremained unchanged in Africa, possiblyreflecting the lagged effect of the drought inthe latter. Growth of consumption acceleratedstrongly in Latin America, following the sharpdecline of the previous year, but fertilizer usefell back in this region in the 1980s, a sign of
the austerity programmes undertaken. Growthof fertilizer use also quickened significantly inthe Far East region.
The recovery in demand that had takenplace in developed countries in 1983/84 wasfollowed by a marginal increase in 1984/85,which brought consumption to more than 82million tons, equivalent to almost 122 kg perhectare of arable and permanent crop land.
Data for fertilizer consumption in 1985/86 arestill fragmentary, but first estimates indicatemoderate declines in developed countries.While the prevailing low prices may haveoffered better market opportunities to importingdeveloping countries, they have alsodiscouraged production. Thus, producers inseveral countries limited production by reducingutilization rates or idling plants to control stocklevels.
17
Figure 1.1 EXPORT PRICES OF FERTILIZERS, 1980-86
US $/ton
250ANNUAL MONTHLY
200
150
100
50
0'11111[111[1mm! I III80 85J FMAMJJASONDJFMAMJJASOND
1985 I 1986
Urea Ammonium sulphate Triple superphosphate Potassium chloride Diammonium phosphatef.o.b. Western Europe f.o.b. Western Europe f.o.b. U.S. Gulf f.o.b. Western Europe f.o.b. U.S. Gulf
Source: FAO. Land and Water Development Division
18
FISHERIES
Fish ProductionTotal world fish production in 1985, the latestyear for which complete data were available,was estimated to have increased 3.2% toalmost 86 million tons (Table 1.7). While not asmarked as the 'dramatic growth of almost 5.8million tons in 1984, this was the eighthconsecutive annual expansion in world outputof fish, which is now 30% greater than in 1975.
In addition, 3.7 million tons of aquatic plantsand seaweeds were harvested from marine andinland waters. Three-quarters of these vegetableproducts were produced by aquaculturalactivities. Aquaculture also contributed some5.5 million tons of fin-fish, crustaceans andmolluscs to the total world fish production.Although practised in an increasing number ofcountries, the impact of aquaculture on foodsupplies is particularly important in Asia,especially in China, Japan, the Republic ofKorea and the Philippines.
As in 1984, a major factor underlying theincrease in production in 1985 was the furthersubstantial rise in catches by South Americancountries bordering the Pacific Ocean. Thecombined growth in production by Ecuador(39%), Peru (15%) and Chile (7%) accounted forthe greater part of the net increase in worldoutput. This further rise in catches in thesouth-eastern Pacific consisted mainly of smallpelagic species such as South Americanpilchard off Chile (a growth of 12%) andanchoveta off Peru (from 23 000 tons in 1984 tomore than 800 000 tons in 1985). Historically,the catches of these small shoaling specieshave fluctuated considerably under theinfluence of the "El Niño" phenomenon and, inmany cases, their use has been confined largelyto fishmeal manufacture. Thus, their impact onthe supplies of fish available for direct humanconsumption is less significant than the annualvariations in total catch might suggest.
The other major influence on the rise in thetotal world catch was a further substantialincrease in production by China, by 850 000tons to 6.8 million tons. In aggregate, fishproduction by other developing countries in theFar East showed a marginal increase. Theperformances of individual countries, however,differed markedly. For example, output rose inBurma (6%), the Republic of Korea (7%),Pakistan (3%), India and the Philippines (each1%). Catches by other major producers fell,notably Thailand (6%) and Malaysia (5%).
Catches by African countries again showed
an overall decline. The fall can be partlyattributed to a significant revision in the systemof collecting production statistics by Nigeria, amajor producer. However, the long-termstagnation in fish output by African countriesclearly continues. On the one hand, thecapacity to exploit more fully marineresources especially the substantial stocks offWest Africa remains to be acquired; and onthe other, drought continued to affectimportant inland fisheries in 1985.
The world's two major producers offish Japan and the USSR both failed toexpand output in 1985. The catch of Japandecreased some 4%, while production by theUSSR fell some 70 000 tons short of its recordcatch in 1984. Canada achieved an 11%recovery from its disappointing results in 1984.The catch by the United States suffered a slightdecline after having shown a consistent growthin production of nearly two-thirds over the lastdecade.
In Western Europe, the relative stability since1979 in total production at between 11-11.5million tons annually was maintained. Norwaysuffered a substantial decline (16%) for thesecond successive year; output from industrialfisheries falling particularly sharply as a result ofa drop of 300 000 tons in the catch of capelin.In the Federal Republic of Germany, catchescollapsed by nearly one-third, with decreases inall species, except crustaceans. On the otherhand, Iceland continued its substantial recoveryfrom the trough of 1982, good fisheries forcapelin and, to a lesser extent, for codcontributing to an overall increase in landingsof 90/o. Output by another major producer,Spain, showed virtually no change from theapproximately 1.3 million tons caught annuallyin recent years.
East European countries succeeded inmaintaining their levels of production, with theexception of the German Democratic Republicwhose catches fell 11%.
International Trade in Fish and Fishery ProductsIn 1985, the total volume of fishery productsentering international trade increased about 60/o(Table 1.8). As a result of a decline in fishmealprices, the total value rose only 5.3%. However,the long-term growth in the value ofinternational trade in fishery products remainsremarkable; it is now close to $17 000 millionannually, compared with $1 300 million in 1961,a rate of expansion exceeding that of mostagricultural products.
Trade in food-fish products expanded involume and value in 1985, a major influence
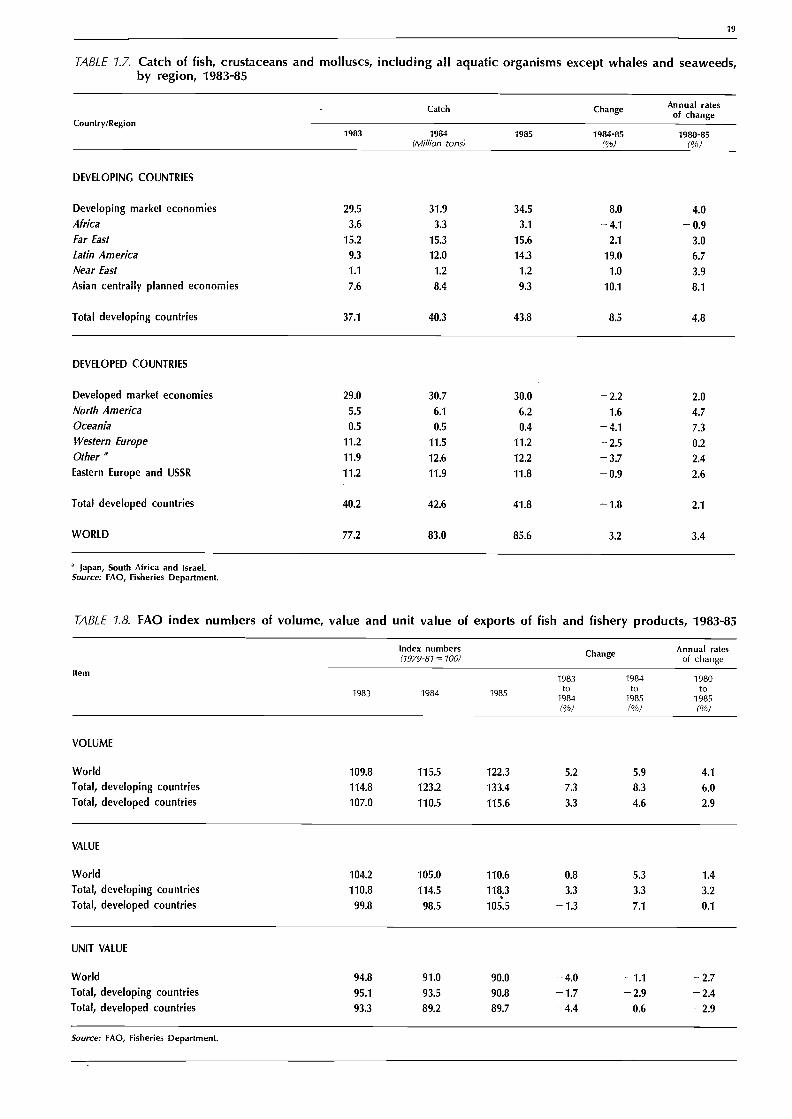
TABLE 1.7. Catch of fish, crustaceans and molluscs, including all aquatic organisms except whales and seaweeds,by region, 1983-85
a Japan, South Africa and Israel.Source: FAO, Fisheries Department
TABLE 1.8. FAO index numbers of volume, value and unit value of exports of fish and fishery products, 1983-85
Item
1983
Index numbers(1979-81=100)
1984 1985
Annual ratesChange of change
1983 1984 1980to to to
1984 1985 1985(96) (:36) (96)
Source: FAO, Fisheries Department.
19
Country/Region
Catch Change Annual ratesof change
1983 1984(Million tons)
1985 1984-85(%)
1980-85(%)
DEVELOPING COUNTRIES
Developing market economies 29.5 31.9 34.5 8.0 4.0
Africa 3.6 3.3 3.1 -4.1 -0.9Far East 15.2 15.3 15.6 2.1 3.0
Latin America 9.3 12.0 14.3 19.0 6.7
Near East 1.1 1.2 1.2 1.0 3.9
Asian centrally planned economies 7.6 8.4 9.3 10.1 8.1
Total developing countries 37.1 40.3 43.8 8.5 4.8
DEVELOPED COUNTRIES
Developed market economies 29.0 30.7 30.0 -2.2 2.0
North America 5.5 6.1 6.2 1.6 4.7
Oceania 0.5 0.5 0.4 -4.1 7.3
Western Europe 11.2 11.5 11.2 -2.5 0.2
Other a 11.9 12.6 12.2 -3.7 2.4
Eastern Europe and USSR 11.2 11.9 11.8 -0.9 2.6
Total developed countries 40.2 42.6 41.8 -1.8 2.1
WORLD 77.2 83.0 85.6 3.2 3.4
VOLUME
World 109.8 115.5 122.3 5.2 5.9 4.1
Total, developing countries 114.8 123.2 133.4 7.3 8.3 6.0
Total, developed countries 107.0 110.5 115.6 3.3 4.6 2.9
VALUE
World 104.2 105.0 110.6 0.8 5.3 1.4
Total, developing countries 110.8 114.5 118.3 3.3 3.3 3.2
Total, developed countries 99.8 98.5 105.5 -1.3 7.1 0.1
UNIT VALUE
World 94.8 91.0 90.0 -4.0 -1.1 -2.7Total, developing countries 95.1 93.5 90.8 -1.7 -2.9 -2.4Total, developed countries 93.3 89.2 89.7 -4.4 0.6 -2.9

20
being the continuing strong demand in somemajor markets for demersal fish, especially codand haddock, which led to a considerable risein prices. Canada remained the largest worldexporter of fish and increased its export sales7%. The value of fishery exports also increasedin most other major exporting countries suchas Iceland (21%) the United States (15%),Norway (2%) and Denmark (6%). Japan was theexception: its exports decreased 7% mainlybecause of reduced sales of frozen and cannedskipjack tuna. The steady growth of fish andfishery product exports by developing countrieshas continued. In total, it now accounts forsome 44% of the value of world tradecompared with 24% twenty years ago.
One-half of fishery products enteringinternational trade in 1985 were destined forJapanese and US markets. The continuedpredominance of Japanese demand forhigh-value fishery products resulted in a 13%increase, in both volume and value terms, in itsimports. In the United States, a substantial risein fishmeal imports was the major factor behindits 6% increase in the total volume of importsof fishery products. Imports of food-fishproducts also rose significantly, both in volumeand value. The EEC countries, which togetheraccount for over one-quarter of world importsof fish products, in value terms, also continuedto expand their heavy reliance on othercountries' products. In particular, the cost ofimports by France and Italy, the major marketswithin the Community in 1985, rose about11°/o.
Contrasting experiences were found in thetrade of fish and fishery commodities,characterized above all by its heterogeneity andmany product forms. The sellers' market in fishand frozen demersal fish has already beennoted. As regards frozen tuna, world tradecontinued to be depressed with prices generallybelow 1984 levels. On the other hand, 1985was notable for the expansion of imports oflow-cost canned tuna. Thailand was the majorbeneficiary, supplying more than 60% ofgrowing imports by the United States of thiscommodity. In most other markets for cannedfish products, with the exception of shrimp,world trade remained depressed; cannedmackerel was especially affected by thecontinued closure of the Nigerian market andlower imports by Near East countries.
International trade in frozen shrimpmaintained the level achieved in 1984, with atotal market value representing almost one-fifthof total trade in fishery products, the highest ofany seafood category. Around 500 000 tons of
shrimp were imported in 1985 by the threemajor consuming markets: Japan, the UnitedStates and Europe. Demand for cephalopodproducts (squid, octopus and cuttlefish)remained strong, with favourable and improvedmarkets in Japan and Europe; world imports ofthese products increased 14% in value and 8%in volume.
While the production of cured fish hasshown little change, the importance of thisproduct in international trade has declinedconsiderably over the past 25 years; its share ofworld fish trade has now dropped to 6% invalue, compared with 14% in 1960. However, in1985, supplies of dried and salted fish weregenerally well below demand, and prices rose inthe major European markets, that is, Portugal,Spain and Italy.
World fishmeal production in 1985 surpassedeven the excellent results of 1984. Demand wasstimulated by competitive prices for fishmealcompared with other oil meals, and the volumeof trade expanded considerably in 1985, importsincreasing by nearly 30%, to reach over 2.9million tons. Receipts from exports, however,decreased 9% compared with the previousyear.
Prospects for 1986It seems unlikely that the world catch of fish in1986 will significantly exceed that of 1985.Lower landings were reported in Latin Americancountries; the catch by Japan and the USSR ofAlaskan pollack, which in recent years has beenthe major species exploited in volume terms,fell. Other major fisheries, particularly in theNorth Atlantic, continued to be controlled byquotas.
International trade in fish and fisheryproducts in 1986 was greatly influenced bychanges in the value of the US dollar.Countries with strong currencies such as Japan,increased their imports; in other countries,notably the United States, total importsdeclined. In general, prices for fishery productsrose in terms of the US dollar, with theexception of tuna and fish oil.
At the level of specific products, trendsvaried in 1986. The tight supply situation withregard to cod and haddock continued, withhake increasingly making ground as asubstitute. The boom in canned tuna from lowlabour-cost countries was also maintained in1986. Prices for shrimp continued to strengthen,both in the United States and Japan, butdemand remained at a high level. The Europeanmarket for dried fish similarly maintained its

buoyancy, with prices continuing their risingtrend. Notwithstanding pressures on pricesbecause of high production levels and abundantstocks of alternative sources of oil meals,fishmeal prices strengthened under the influenceof the changes in the value of the US dollar.
Major IssuesIn the long run, the major challenge remainsthat of expanding supplies of fish for directhuman consumption so as to satisfy theconsistent increase in demand. This demand isbeing boosted by the growing populations andrising needs for basic foods on the part ofdeveloping nations, and by the renewed interestof more affluent societies in fish as a healthy aswell as an attractive food.
There is a need therefore not only toincrease overall supplies of food fish, but alsoto make better use of the resources once theyare harvested and bring a valuable food tomarket at acceptable prices. Such economiesmay be achieved through the reduction of theheavy losses often incurred as a result ofspoilage or from the discarding of incidentallycaught lower-valued species, and by thedevelopment of new product forms.
To obtain such an increase in supplies,continued efforts will be required to helpdeveloping countries enhance their owncapacities to manage, harvest, process andmarket the often substantial resources whichhave come within their national jurisdictions asa result of the new legal regime of the seas.They need greater access to skills, technologiesand financial resources. In this respect,collaborative efforts between countries withlong experience in fisheries and those withuntapped potentials will continue to be animportant factor. Bilateral arrangements, throughjoint ventures in harvesting, processing andmarketing, are likely to play a key role in thistransfer of skills, reinforced by multilateralsupport for collaboration in fisheriesdevelopment at the regional level.
FORESTRY
The forestry sector in 1985 continued its growthfor the third consecutive year, reachingproduction levels exceeding previous peak yearsin all product areas (Table 1.9). The expansionof the economies of the developed countriescontinued, and demand for forest productsmaintained very high levels in North America.Although growth of the forestry sector indeveloping countries was marginal, it continuedits slow upward trend.
Forestry Production and Trade in 1985Removals of roundwood in 1985 grew moreslowly than the average during 1980-85, butfuelwood consumption in developing countriescontinued to increase 2% a year, contributing20% to their total energy supply needs andsome 80% to their total roundwoodproduction. The incentive to expand the use offuelwood and charcoal as an energy source hasdiminished for developed countries with the fallin commercial energy prices, and theirconsumption of these products has levelled offsince 1981. This is in contrast with the yearsimmediately following the second oil shock in1979 when the annual rate of growth offuelwood consumption in developed countriesreached 13%.
Output of mechanically processed woodproducts in 1985 was particularly vigorous inNorth America, where new dwellingconstruction reached 1.9 million units, closeto the very high level of 1984. Lower interestrates on mortgages favoured the sustainedlevel of activity in the North American housingsector. As a result, consumption of sawnwoodand wood-based panels increased some 15% inthe United States. Its imports of these productsalso grew considerably, mainly because ofthe strengthening of the US dollar until early1985.
For Europe and Japan the situation was fairlystatic, as the housing industry continued to bea weak sector of many economies. Lowinvestment in the construction sector reflectedcontinued restraints on public sectorexpenditure and the structural problems of thehousing industry in some developed countries.The situation was one of supply tending toexceed demand, with a consequent downwardpressure on prices. Indeed, Finland and Austriahad to close down some sawmills because ofexcess capacity. Early estimates for 1986indicate construction activity increasing further
21

22
TABLE 1.9. Output of main forest products, developing and developed countries, 1983-85
Source: FAO, Forestry Department.
in North America, as well as someimprovement in Europe.
Production of tropical timber in 1985increased 2%. While production of tropical logsfor export declined slightly, and only marginalincreases were registered for tropical sawnwoodexports, there were significant rises in tropicalplywood production and exports. In 1985, Japanincreased its imports of tropical wood products,replacing imports formerly made as logs. Thus,its imports of tropical sawnwood and plywoodgrew 50% and 150% respectively. Asmentioned above, high levels of imports oftropical plywood were also reached in NorthAmerica, favoured by the vigorous growth ofthe housing sector. Further export growth ofthe tropical plywood industry is foreseenbecause Japan reduces its tariff on importedplywood in 1987.
The pulp and paper sector continued tòexpand, reaching a new all time peak. The
Change Annual rates1984 to of change
1985 1985 1980 to 1985(%) (%)
increase in 1985, however, was marginalcompared with the strong growth whichoccurred in both 1983 and 1984, and which inturn, followed the slump of 1980-82. Whileproduction in the developed countriesstagnated, increases in production andconsumption were marked in some developingcountries, but particularly in China and Brazil.China's production of paper increased by over1 million tons and is expected to growconsiderably in the future. Growth inconsumption in South America resulted fromincreased production, but also from a reductionof exports.
The total value of forest product trade in1985, which was $50 000 million, equivalent toabout 2.7% of all merchandise trade, decreasedmarginally in current terms. Developingcountries suffered a decrease of some 4%,while the value of developed-country traderemained unchanged. This picture of generally
ROUNDWOOD 3 053 3 127 5 165 1.2 1.7
Total, developing countries 1 687 1 728 1 760 1.9 2.1
Total, developed countries 1 366 1 399 1 405 0.4 1.2
Fuelwood and charcoal 1 575 1 632 1 663 1.9 2.1
Total, developing countries 1 351 1 378 1 408 2.2 2.2
Total, developed countries 253 254 255 0.4 1.3
Industrial roundwood 1 449 1 495 1 502 0.5 1.3
Total, developing countries 336 350 351 0.3 1.7
Total, developed countries 1 113 1 145 1 151 0.5 1.1
PROCESSED WOOD PRODUCTS
Sawnwood and sleepers 448 461 465 0.9 1.3
Total, developing countries 97 103 105 1.9 3.6
Total, developed countries 351 359 360 0.3 0.7
Wood-based panels 102 106 109 2.8 1.8
Total, developing countries 17 18 19 5.6 6.3
Total, developed countries 84 88 89 1.1 0.8
(Million tons) (%) (%)
Pulp for paper 132 140 141 0.7 2.3
Total, developing countries 15 16 18 12.5 7.1
Total, developed countries 117 123 123 1.6
Paper and paperboard 177 190 193 1.6 3.0
Total, developing countries 22 25 27 8.0 7.9
Total, developed countries 155 165 166 0.6 2.3
Output
Ilem1983 1984
(Million m3)

Item
TABLE 1.70. Volume of exports of main forest products, developing and developed countries, 1983-85
Source: FAO, Forestry Department.
Exports
1983 1984
(Million m3)
stagnating growth was also shown in volume ofexports of main forest products, with someexceptions (Table 1.10). Thoughdeveloping-country exports of roundwood andsawnwood tended to decline, exports ofwood-based panels showed considerablegrowth. Their pulp and paper exports, thoughonly a small proportion of the world total, grewfaster than those of the developed countries.
Price Developments of Forest Products during1970-85After a long period of relative stability, lastingfrom the mid-1950s to the end of the 1960s,prices of forest products entered into a newphase in the 1970s, marked by two steep priceincreases that occurred in 1973-74 and 1979-80.
Most forest products experienced ashort-lived price explosion in 1973-74, whichwas particularly remarkable in the case of realprices of unprocessed raw materials such asconiferous and tropical logs. Prices of bothproducts, in real terms, increased in 1973-74 bysome 40-45% above the level in 1970.
In the four years following, real prices offorest products declined from this peak, but
1985 1983 to 1984 to1984 1985
(9'o)
Change Annual rateof change
1980 to1985
23
maintained levels slightly higher than thoseexperienced before 1973. Notable exceptionswere the prices of wood-based panels and ofwood-pulp, which both decreased to levelsbelow those of 1970. Improved technology,coupled with an excessive capacity of theindustry, contributed to greater supplies andreduced costs and prices of panels, particularlyin the case of particleboard. The real price ofwood-pulp fell in 1978-79 below its level of1970. Major increases in production in previousyears were not coupled with a sustaineddemand, and large unsold stocks, held mainlyby Scandinavian producers, kept prices at verylow levels.
The second steep increase in real pricesoccurred in 1979-80 and had some differentfeatures to the increase in 1973-74. First, realprices did not increase as sharply as they didduring the previous peak year, with the notableexception of the price of Asian tropical logs,which increased by over 50%. Second, theincreases were mainly in the prices of productsof tropical origin, but prices of Asian productsrose much faster than those of Africanproducts. Also the downward adjustmentfollowing this period resulted in a much
Industrial roundwood 99 102 105 2.4 5.9 -1.0
All developing countries 32 28 29 - 11.0 2.9 -6.1All developed countries 67 73 76 8.7 3.7 1.5
Sawnwood and sleepers 84 86 86 2.8 -0.3 3.0
All developing countries 10 10 10 - 3.1 -4.4 -1.0All developed countries 74 76 76 3.7 0.3 3.6
Wood-based panels 17 18 19 3.3 5.3 3.1
All developing countries 7 7 7 1.3 8.4 8.7
All developed countries 11 11 12 4.5 3.5 0.3
(Million tons)
Pulp 20 20 21 2.6 1.5 1.6
All developing countries 2 2 2 -1.1 -1.3 2.1
All developed countries 18 18 19 3.0 1.7 1.6
Paper and paperboard 37 40 40 8.3 1.2 3.3
All developing countries 1 1 1 38.8 -5.3 10.7
All developed countries 36 38 39 7.4 1.5 3.1

24
smoother trend, with real prices maintaininghigher levels than those reached in the troughfollowing the 1973-74 peak. Since 1981, realprices of tropical products, while showingannual variations, have trended downwardgradually.
Real prices of wood-based panels have beencontinuing the downward trend, while realprices of pulp and paper have been steadilyrecovering, after the decline experienced in thelate 1970s. The high level of growth of worldconsumption of paper products coupled with abetter balance between supply and demand,explain these rises.
The real prices of other widely tradedproducts of developed countries, such asconiferous logs and sawnwood, declined fromthe peak period of 1973-74. In 1985, the realprice of coniferous logs was some 3% abovethe corresponding price of 1970, while the realprice of coniferous sawnwood was 4% belowthe 1970 level.
During this period, developing countriesbenefited mostly from price increases of tropicalforest products, which contributed significantlyin improving the terms of trade of developingcountry exports.
The Tropical Forestry Action PlanThe Tropical Forestry Action Plan (TFAP) is anew initiative within the internationalcommunity, designed to halt deforestation andsecure sustainable development of tropicalforest resources by bringing increased humanand financial resources to bear on the problemwithin a harmonized, long-range programme ofaction.
Tropical forests cover approximately 40% ofthe total land area of the tropical regions ofthe world. They have the potential to make asubstantial contribution to development bymeeting some of the most basic needs of ruralpopulations: contributing to food security,supporting industrial growth and maintainingenvironmental quality. They are the biologicallyrichest and most diverse habitats in the world.
Tragic situations of drought, poverty andhunger in many tropical regions haverepeatedly caught the attention of the world inrecent years. Over 2 000 million people live inthe tropics and the great majority of them arerural people. It is now generally recognized thatthe main cause of deforestation in the tropicsis the poverty of the people who live in andaround tropical forests and depend on itsresources for their basic needs: food, shelter,energy and income. The problem of tropical
deforestation is therefore a developmental issueto be resolved by making the conservation andrational use of tropical forests more beneficialand attractive to rural people than theliquidation and destruction of these resources.
To this end, profound changes in presentforestry policies, programmes and attitudes arerequired. Moreover, it will be necessary toincrease substantially the level of national andinternational efforts and resources devoted totropical forestry. Therefore, a strategy for actionwas urgently required that would enjoy thewidest public and political support and thatwould mobilize human and financial resourcesfor action.
The FAO Committee on Forest Developmentin the Tropics (CFDT) recognized the need forproviding the international donor communitywith such a clearly defined developmentstrategy and recommended that FAO prepareproposals for an Action Plan at the global level.The Plan was presented to and adopted by theCommittee at its Seventh Session in Rome inJune 1985.
The Plan subsequently received support fromthe Ninth World Forestry Congress in MexicoCity in July 1985, from an internationalconsultation of forestry advisers held in TheHague in November 1985 and from theInternational Conference on Forests and Treesheld in Paris in Feburary 1986.
The FAO Committee on Forestry (C0F0), atits Eighth Session in April 1986, approved theAction Plan and recommended its acceptanceby interested countries and agencies as aframework for harmonized international action.It further recommended that FAO play thecentral coordinating role in the implementationof the Action Plan.
The Action Plan covers five closelyinterrelated priority areas:
The Action Programme on Forestry and LandUse focuses on the cooperation betweenforestry and agriculture and the directcontribution of forestry to food security. Fourmain lines of action are indicated: (i)agro-silopastoral development; (ii) integratedwatershed management; (iii) arid zone anddesertification control; and (iv) land-useplanning.
The Action Programme on Forest-BasedIndustrial Development aims at promotingappropriate forest industries to fully use thewide range of wood and non-wood products oftropical forests. Five strategic lines of action areidentified: (i) intensification of resourcemanagement; (ii) efficient harvesting; (iii)development of appropriate forest industries; (iv)

recuperation of waste; and (v) development ofmarketing capabilities. It aims to associate theforest with industry and local people foreconomic development.
The Action Programme on Fuelwood andEnergy aims at restoring fuelwood supplies incountries most affected by deficits. Three majorlines of action are identified: (i) increasing thesupply of wood by improved management ofexisting resources and by massive increases offast-growing multi-purpose trees in land-usesystems outside the forest; (ii) more efficient useof wood energy through improved conversiontechnologies; and (iii) replacing domestic woodenergy with other forms of energy wherepossible and using wood energy for ruralindustries where a surplus of wood exists.
The Action Programme on Conservation ofTropical Forest Ecosystems addresses the needto prevent the degradation of tropical forestplant and animal species and to promote theintegrated management of wildlife and othernon-wood products. The goal is to protectecosystems and genetic resources in such away that suitable development opportunities areat the same time offered to local people.
The Action Programme on Institutionsfocuses on strengthening the institutionalframework within which sustainable tropicalforest development takes place. Strategiesinclude: (i) strengthening the financial andoperational effectiveness of public forestryagencies; (ii) building education and trainingprogrammes to meet professional, technical andvocational manpower requirements; (iii)establishing strong research and extensioncapabilities; and (iv) strengthening theinstitutional capabilities of local people forself-sustained action.
SOME TRENDS IN THE EARLY1980s IN FOOD ANDACRliCULTURE
The 1980s has been a period of serious financialand economic stress for many developingcountries. What has been the impact on foodsupplies, agricultural incomes and productivityat the country level?
Food AvailabilityThis first section examines changes in foodavailability in developing countries during1980-84, as measured by recent FAO data onper caput dietary energy supplies (DES).
A group of 102 developing countries, forwhich data were available, was divided into fivesubgroups, according to changes in their percaput DES during 1980-84. Changes in DESwere then examined in relation to some generalcharacteristics of the individual groups andselected factors (Table 1.11).
For many developing countries, 1980-84 wasa disappointing period with regard to nutritionalstatus. Per caput calorie intake declined in 46out of the 102 countries, and only one-third ofthem achieved gains of 0.5% a year or more.Considerable gains, however, were achieved bysome Asian countries accounting for a majorshare of the total population of developingcountries.
A widening nutritional gap was observedbetween the groups of countries with higherand lower levels of per caput calorieconsumption. Countries with already relativelyhigh levels of DES were those where the mostsignificant progress was achieved during1980-84. Conversely, the sharpest reductions inper caput calorie intake were suffered bycountries with the lowest levels of DES.
There was a strong concentration of Africanand, to a lesser extent, Latin Americancountries among those showing particularlypoor performances during 1980-84. Countries inthe Near East achieved some gains onlythrough increased food imports. On the otherhand, most countries in the Far East achievedsignificant increases in per caput calorieconsumption.
Changes in DES were different according tothe origin of the food products. For LatinAmerican countries, poor performances weremostly observed for products of animal origin,therefore affecting also the quality of the diets,especially for families where roots and tubers
25

26
TABLE 1.11. Changes in per caput dietary energy supplies (DES) and related factors, 102 developing countries,1980-84
item GROUP 1
-6.9% to-1.0%
The ratio of calories derived from domestic production to total calorie supplies.Sources: FAO, Statistics Division and Policy Analysis Division.
are the staple foods. The worsening of thequality of the diet (as underlined by the fall ofproducts of animal origin), combined with adecrease of the quantity of food consumed,was also affecting most of the Africancountries. On the other hand, an improvementof DES in the Far East countries is chieflyobserved for products of animal origin.
An issue of particular relevance is the extentto which the nutritional status of countries wasaffected by income factors. On the supply side,a close relationship is to be expected in thegroup of chiefly agricultural-based economiesexamined, among GDP growth and agriculturaland DES performances. On the side of demand,changes in income affected the ability ofconsumers to buy food and the capacity ofcountries to finance food imports.
GROUP 2
-0.9% to-0.2% 0.3%
Percentage of change in DES
GROUP 3
- 0.1./0 to
GROUP 4
0.4% to1.0
GROUP 5
1.1./0 to4.5%
Table 1.11 confirms the correspondencebetween changes in aggregate income andcalorie supply. In the three groups of countrieswith declining or stagnating DES during 1980-84,per caput GDP also fell or stagnated, while inthe other two groups where DES rose, GDP alsorose. The first group of countries presented aconsistently negative picture of low yet fallingincomes, coupled with sharp declines in calorieconsumption from already inadequate levels.This group, however, was predominantlycomposed of African countries, where otherunfavourable factors, particularly the incidenceof drought, were more directly responsible fordeclines in DES.
Production performance was the obviousmain factor behinci changes in DES for manycountries. This was clearly so in the two
Population (mil/ion) 287 403 227 342 2 175
Regional distribution (no. of countries)Africa 18 7 7 6 9
Far East 2 5 5 7
Latin America 1 10 4 5 2
Near East 1 4 5 4
1984 level of DES and composition
(kcal/caput/day)TOTAL DES 1 970 2 389 2 469 2 574 2 635
Vegetal origin 1 805 2 039 2 125 2 225 2 345
Animal origin 165 350 344 350 290
Annual changes, 1980-84 OW
TOTAL DES -3.1 -0.8 0.6 2.9
Vegetal origin - 3.2 -0.5 0.6 2.9
Animal origin -1.8 -2.5 0.2 - 0.2 3.7
Annual changes in related factors, 1980-84 (A)
Production -5.0 -0.1 -0.5 4.1
Food exports -2.6 4.5 2.0 11.3 1.4
Food imports -1.8 -1.5 0.9 4.1 10.2
GDP per caput -4.3 -1.4 -0.6 0.8 5.0
Food self-sufficiency ratio a
1978-80 91 105 116 86 96
1982-84 89 109 122 84 95
GDP per caput, 1982 (US$) 728 1 315 1 086 1 205 382

TABLE 1.12. Annual rates of change in land and labourproductivity, by region, 1971-80 and 1980-84
(Percentages)
Source: FAO, Policy Analysis Division.
Labour LandRegion
extreme cases of groups 1 and 5, where foodproduction and DES fell in the former andexpanded in the latter. In the other threegroups, changes in food production did notcorrespond with those in DES, the impact ofproduction having been more than offset bycounteracting movements, particularly in foreigntrade. In groups 2 and 3, where a number ofcountries, including Argentina, Uruguay, Côted'Ivoire and Malaysia, export one-third totwo-thirds of all calories produced, a sizeableincrease in food exports was a majorcontributing factor to reduced DES.
Food imports also played a key role in bothpositive and negative changes in total foodsupply. Group 1 countries with declining DES,were squeezed between their high dependenceon food importsas shown by their low anddeclining self-sufficiency ratioand an inabilityto finance the food imports needed. In thisgroup of countries, imported calories declinedin per caput terms nearly 2% a year during1980-84. With even larger falls in caloriesdomestically produced, the importedfood-supply ratio nevertheless continued toincrease in all countries of this group. In groups4 and 5, countries where DES rose significantly,it did so mainly because of larger imports. Thiswas particularly the case in group 4, whichincluded several industrializing and oil-exportingcountries with relatively high per caputincomes, low self-sufficiency ratios and decliningper caput calorie supplies from domesticproduction.
The features and performances of group 5were much influenced by the presence ofChina, India and, to a lesser extent, Indonesia.The improvement in nutritional standardsachieved by those countries during 1980-84 wasa major accomplishment. It involved an averageincrease of nearly 3% in daily calorie intake forover half of the entire population of developingcountries. Moreover, this improvement wasachieved with a minimum recourse to foodimports, these countries having achievedself-sufficiency ratios close to 100%.Furthermore, a considerable qualitative
improvement took place in these countries'diets, as shown by the marked increase in theanimal component of their DES.
The situation in group 5 is still positive ifChina and India are excluded. Per caput calorieproduction rose 1.5% a year and total caloriesupplies, 1.7%. Other countries in this group,however, presented an entirely different picturewith regard to the origin of their gains in DES.The group includes a number of large foodimportersEgypt, the Syrian Arab Republic, theIslamic Republic of Iran, Saudi Arabia andAlgeria where a traditional reliance on foodimports was dramatically increased in the caseof several countries during 1980-84.
Land and Labour ProductivityDid this period of economic crisis have anymeasurable effect on agricultural productivity?'Indeed, growth in labour and land productivitydeclined significantly in Africa and LatinAmerica during the early 1980s compared with1971-80, and became even negative for labourin Africa, mainly because of widespread drought(Table 1.12). Labour productivity growthdeclined sharply in many African countries inthe early 1980s, including Tanzania, Côted'Ivoire, the Niger and Zimbabwe.
In Latin America, growth in labour and landproductivity declined significantly in Mexico andBrazil but remained positive, while the formerlyhigh growth rates in productivity of both labourand land became negative in some CentralAmerican countries affected by civil strife andhostilities.
On the other hand, the Far East and theNear East had relatively high and acceleratinggrowth rates in labour and land productivity,particularly in the former region. In China,agricultural productivity growth increased toabove 7% a year in labour and land in theearly 1980s, while in India, it increased to 4°/o ayear for labour and nearly 5% a year for land.Productivity levels dropped sharply for bothcategories in the Philippines and barelyremained positive, while in Sri Lanka it becamenegative for both labour and land. These werethe exceptions, however.
3 As measured by the value of output per caput (1979-81prices) of the agricultural labour force or one hectare ofarable and permanently cropped land.
27
1971-80 1980-84 1971-80 1980-84
Africa 0.6 0.2 1.1 0.7
far East 2.2 3.3 2.6 4.1
China 2.9 7.8 3.6 7.1
Latin America 2.7 1.3 1.9 0.7
Near East 2.3 2.4 3.7 4.5

28
TABLE 1.13. Annual rates of change in selected agriculturalinputs, by region, 1971-80 and 1980-83
(Percentages)
Source FAO, Policy Analysis Division.
Changes in Input Use During the 1970s andEarly 1980sChanges in agricultural productivity wereassociated also with changes in input use. Therecession in the early 1980s and the continuedeconomic stagnation, along with lowcommodity prices, debt problems and highinterest rates, contributed to declining growthrates of fertilizer consumption in developingcountries. The annual growth rate slowed fromnearly 110/o during the 1970s to 3% during1980-83, and consumption declined in Africaand Latin America (Table 1.13). Growth rates oftractor use and irrigation availability alsoslowed, with the exception of Latin America(tractor use) and the Near East (irrigationavailability). Low growth in tractor use in Africain the 1970s was accompanied by an evenlower growth rate in the 1980s.
The relatively more economically developedcountries, such as Algeria, Morocco, Nigeria, theRepublic of Korea, Malaysia, Brazil andVenezuela, seem to have been moreconstrained by budgetary difficulties and currentaccount imbalances. They registered sharpdeclines in fertilizer consumption in the early1980s. The increase in tractor use in the 1980sin Latin America was largely due to relativelyhigh growth rates of use in Mexico and Brazil(9% and 7.5% respectively) both of whichpossess important domestic tractormanufacturing and assembly capacity.
Agricultural Exports and IncomesOne of the remarkable features of the early1980s was the slowing down in growth ofagricultural trade. The value of agriculturalexports of developing countries increased 14%a year during 1971-80, but slightly declinedduring 1980-84. Were there any effects onagricultural incomes as measured by agriculturalGDP?
Developing countries were selected on the basisof the availability of data for 1980-84. Only 39
countries had data for both agricultural GDPand exports. Twenty countries with relativelyhigh export/GDP ratios were then chosen torepresent the group relatively dependent onexports for agricultural income (GDP). The rangewas from 86% for Costa Rica to 16% for theSudan, and the group average was 36%. Thesecond group comprised 19 countries with theirratio of agricultural exports/GDP ranging fromaround 13% for Peru to 1% for Venezuela, andthe group average was only 5%. Theagricultural sector was equally important forboth groups, as the share of agriculture of totalGDP was 18% for each. However, the firstgroup's total agricultural GDP was one-thirdthat of the second group; that is, theagricultural exporters were much smallereconomies.
The average annual increase in the dollarvalue of agricultural exports of the firstgroup-the agricultural exporters-drastically fellfrom 16.% during 1971-80 to -l.5% during1980-84. The annual growth rate of theiragricultural GDP was 20% during 1971-80 and-4.4% during 1980-84, in US dollars. However,the average annual growth rate was 3.5%during 1971-80 compared with 1.9% during1980-84, in terms of real local currency!'
The average annual increase in the dollarvalue of agricultural exports of the secondgroup of 19 countries, for which agriculturalexports accounted for 5% of agricultural GDP,also collapsed from 11.8o/o during 1971-80 to-4.4% during 1980-84. They had an annualgrowth rate of agricultural GDP of 12% for the1970s and 2.7% during 1980-84, in US dollars.These growth rates were 2.4% for the 1970sand 2.6% for the early 1980s, in terms of reallocal currency, however.
One conclusion is that the group ofcountries relatively more dependent on exportshad a significant slowing down in growth ofreal agricultural incomes, but not an actualdecline, while the agricultural sectors of thosecountries relatively less dependent on exportsactually fared slightly better between the 1970sand the early 1980s. This is the outcome notonly of varying fortunes of export markets, butalso domestic policies.
With the decline in commodity prices during1980-84, the first group, which was more
4 Agricultural GDP in local currency deflated by the totalGDP deflator to reflect the agricultural sector's real dom-estic purchasing power. The group averages were weighted
by the component countries' shares of group agriculturalGDP in 1980 US dollars.
1971-80 1980-83 1971-80 1980-83 1971-80 1980-83
Africa 4.5 -0.3 2.0 1.3 7.9 5.1
Far East 8.6 4.7 12.9 10.2 1.2 1.0
Latin America 8.1 -9.3 45 5.8 1.6 0.6
Near East 10.9 12.7 14.5 6.2 0.5
ALL REGIONS 10.7 3.0 8.1 5.4 1.1 0.2
Fertilizer per Tractors per Irrigation per
Item arable land arable land arable land

TABLE 1.14. Value of world exports of agricultural (crops and livestock), fishery and forest products, at currentprices, 1983-85
Source: FAO, Statistics Division.
dependent on exports, increased the volume ofits agricultural exports by 3.7% annually. Theagricultural exports of the second group ofcountries declined 1% annually, in volumeterms, during this period. Another conclusion isthat the group more dependent on exportsincreased their ratio of agricultural exports toagricultural GDP on average by 3% annually,while the ratio for the group less dependent onexports declined nearly 7% a year. Therefore,the early 1980s heightened the divergencebetween countries in terms of the source oftheir agricultural growth. The agriculturalexporters are becoming still more exportdependent, but for the remainder, the exportmarket has assumed decreasing importance.
Annual rateof change
1980to
1985(0ó)
AGRICULTURAL TRADE
OverviewWithin an overall sluggish world tradeenvironment, agricultural trade in 1985 and thefirst half of 1986 was generally more depressedthan other sectors. While the volume of worldmerchandise trade in 1985 rose about 3%, thatof agricultural trade stagnated at the level of1984. Furthermore, a continued fall in the dollarunit value of agricultural commodities (-8% in1985 compared with -1.7% for allmerchandise trade), brought about an overalldeterioration in the agricultural terms of tradeand contributed to a sharp fall in the value ofagricultural exports.
At $272 700 million in 1985, world exports ofagricultural, fishery and forest products declinednearly 5% from the previous year, thusreturning close to the levels of 1983 (Table1.14). The most pronounced fall was in cropand livestock exports, although trade in forestproducts also declined. Fishery trade, whichexpanded over 5% in 1985 in developedcountries, was the only agricultural subsectorshowing a positive, though modest, growth rateduring 1980-85.
Among crops and livestock products, trade infood and raw materials changed little in volumefrom the levels of 1984, but fell 7-8% in unitvalue and hence, value (Table 1.15). The value
29
Agricultural products 208.6 219.8 206.6 5.4 -6.0 -2.2Total developing countries 66.4 73.7 69.1 10.9 -6.2 -0.2Total developed countries 142.2 146.2 137.5 2.8 -5.9 -3.2
Fishery products 15.8 15.9 16.4 1.1 2.7 1.2
Total developing countries 6.8 7.1 7.1 4.6 3.2
Total developed countries 9.0 8.8 9.3 - 1.6 5.4 -0.2
Forest products 47.7 50.5 49.8 5.9 -1.4 -1.7Total developing countries 7.4 7.3 7.2 -1.3 -1.6 -3.6Total developed countries 40.2 43.1 42.5 7.2 -1.4 -1.4
TOTAL 272.1 286.2 272.7 5.2 -4.7 - 2.0
Total developing countries 80.7 88.1 83.4 9.2 - 5.3 -0.2Total developed countries 191.4 198.1 189.3 3.5 -4.4 -2.7
Share of developing countries 30 31 31
Value Change
1983to
1984
1984to
1985
Item19851983 1984
(.15$ '000 million) (%)
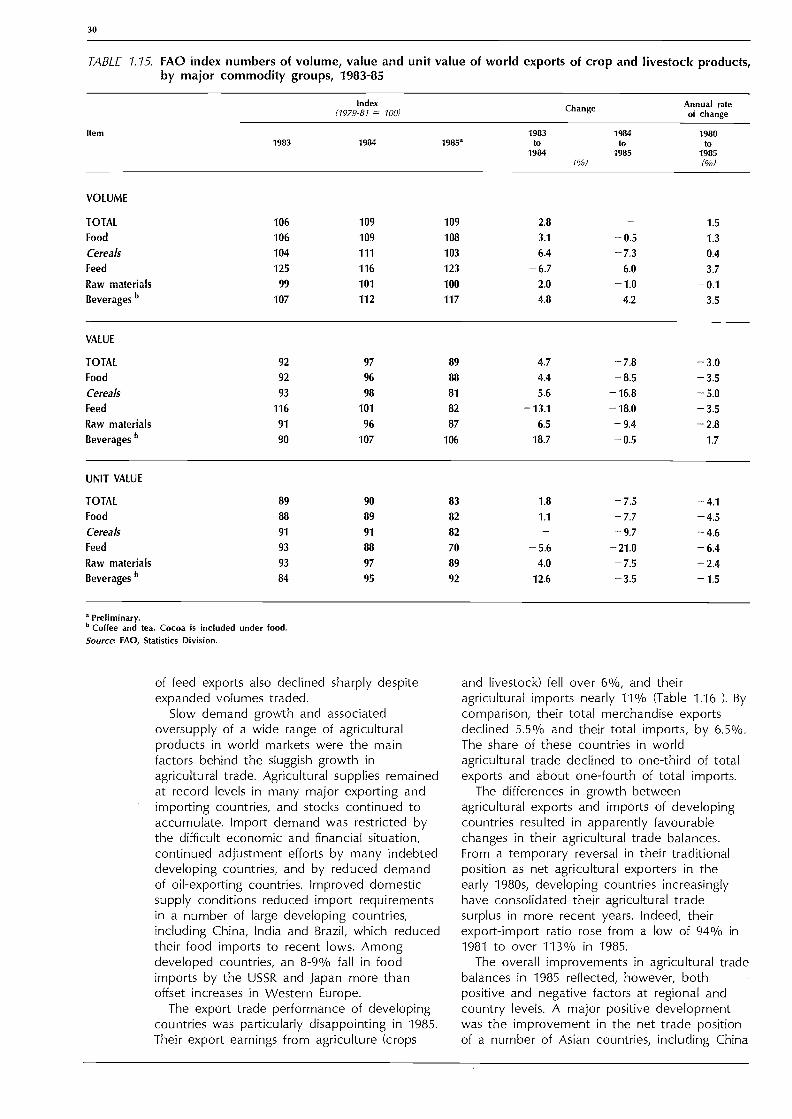
30
TABLE 7.15. FAO index numbers of volume, value and unit value of world exports of crop and livestock products,by major commodity groups, 1983-85
Item
Preliminary.b Coffee and tea. Cocoa is included under food.Source FAO, Statistics Division.
Index(1979-81 100)
1983 1984
of feed exports also declined sharply despiteexpanded volumes traded.
Slow demand growth and associatedoversupply of a wide range of agriculturalproducts in world markets were the mainfactors behind the sluggish growth inagricultural trade. Agricultural supplies remainedat record levels in many major exporting andimporting countries, and stocks continued toaccumulate. Import demand was restricted bythe difficult economic and financial situation,continued adjustment efforts by many indebteddeveloping countries, and by reduced demandof oil-exporting countries. Improved domesticsupply conditions reduced import requirementsin a number of large developing countries,including China, India and Brazil, which reducedtheir food imports to recent lows. Amongdeveloped countries, an 8-9% fall in foodimports by the USSR and Japan more thanoffset increases in Western Europe.
The export trade performance of developingcountries was particularly disappointing in 1985.Their export earnings from agriculture (crops
1985g1983
to
Change
1984to
Annual rateof change
1980to
and livestock) fell over 6%, and theiragricultural imports nearly 11')/0 (Table 1.16 ). Bycomparison, their total merchandise exportsdeclined 5.5% and their total imports, by 6.5%.The share of these countries in worldagricultural trade declined to one-third of totalexports and about one-fourth of total imports.
The differences in growth betweenagricultural exports and imports of developingcountries resulted in apparently favourablechanges in their agricultural trade balances.From a temporary reversal in their traditionalposition as net agricultural exporters in theearly 1980s, developing countries increasinglyhave consolidated their agricultural tradesurplus in more recent years. Indeed, theirexport-import ratio rose from a low of 94% in1981 to over 113% in 1985.
The overall improvements in agricultural tradebalances in 1985 reflected, however, bothpositive and negative factors at regional andcountry levels. A major positive developmentwas the improvement in the net trade positionof a number of Asian countries, including China
1984 1985(8b)
1985(%)
VOLUME
TOTAL 106 109 109 2.8 1.5
Food 106 109 108 3.1 -0.5 1.3
Cereals 104 111 103 6.4 -7.3 0.4
Feed 125 116 123 -6.7 6.0 3.7
Raw materials 99 101 100 2.0 -1.0 -0.1Beverages b 107 112 117 4.8 4.2 3.5
VALUE
TOTAL 92 97 89 4.7 -7.8 -3.0Food 92 96 88 4.4 -8.5 -3.5Cereals 93 98 81 5.6 -16.8 -5.0Feed 116 101 82 -13.1 -18.0 -3.5Raw materials 91 96 87 6.5 -9.4 -2.8Beverages b 90 107 106 18.7 -0.5 1.7
UNIT VALUE
TOTAL 89 90 83 1.8 -7.5 -4.1Food 88 89 82 1.1 -7.7 -4.5Cereals 91 91 82 - -9.7 -4.6Feed 93 88 70 -5.6 -21.0 -6.4Raw materials 93 97 89 4.0 -7.5 -2.4Beverages b 84 95 92 12.6 -3.5 -1.5

TABLE 1.16. Value of world agricultural trade (crops and livestock), at current prices, by region, 1983-85
(US$ '000 million)
Change Annual rateof change
1983 1984 1980 to 19851985 to to Current
1984 1985 prices Volume'(%) (%)
Obtained by deflating current value of trade with the indices (1979-81=100) of export and import unit values of agricultural products.Source: FAO, Statistics Division.
31
DEVELOPING MARKET ECONOMIES
Export 61.6 68.2 62.9 10.8 -7.8 -0.7 2.9
Import 58.4 62.4 56.0 6.8 -10.2 -1.4 2.4
Africa
Export 7.8 8.9 8.8 14.1 -0.3 -2.6 -0.4Import 9.3 9.4 9.2 0.5 -2.1 -3.2 2.5
Far East
Export 17.9 21.1 18.4 17.8 -12.8 -0.2 3.5
Import 16.7 18.3 16.3 9.9 -11.0 0.5 3.1
Latin America
Export 30.1 32.1 30.7 6.7 -4.4 -0.1 3.9
Import 11.2 11.3 10.1 1.6 -10.6 -7.0 - 2.8
Near East
Export 5.4 5.5 4.5 3.5 -18.3 -2.2 - 0.2Import 20.5 22.7 19.8 10.6 -12.8 1.5 5.5
ASIAN CENTRALLY PLANNED
ECONOMIES
Export 4.9 5.4 6.2 11.7 14.2 6.6 11.1
Import 6.9 6.0 4.9 -12.8 -18.1 -11.2 -6.2
TOTAL DEVELOPING COUNTRIES
Export 66.4 73.7 69.1 10.9 -6.2 -0.2 3.4
Import 65.3 68.4 60.9 4.8 -10.9 -2.5 1.6
DEVELOPED MARKET ECONOMIES
Export 133.8 138.1 129.6 3.2 -6.1 -3.1 1.3
Import 137.2 144.6 144.5 5.4 -0.1 -1.4 2.5
EASTERN EUROPE AND USSR
Export 8.4 8.1 7.9 -4.0 -2.3 -5.3 -0.2Import 26.5 27.0 25.0 1.6 -7.1 -3.5 0.1
TOTAL DEVELOPED COUNTRIES
Export 142.2 146.2 137.5 2.8 -5.9 -3.2 1.4
Import 163.7 171.6 169.5 4.8 -1.2 -1.8 2.2
WORLD
Export 208.6 219.8 206.6 5.4 -6.0 -2.2 1.9
Import 229.1 240.0 230.4 4.8 -4.0 -2.0 2.0
Share of developing countries inworld agricultural trade OMExport 32 34 33
Import 28 28 26
Value
1984
Country/Region
1983
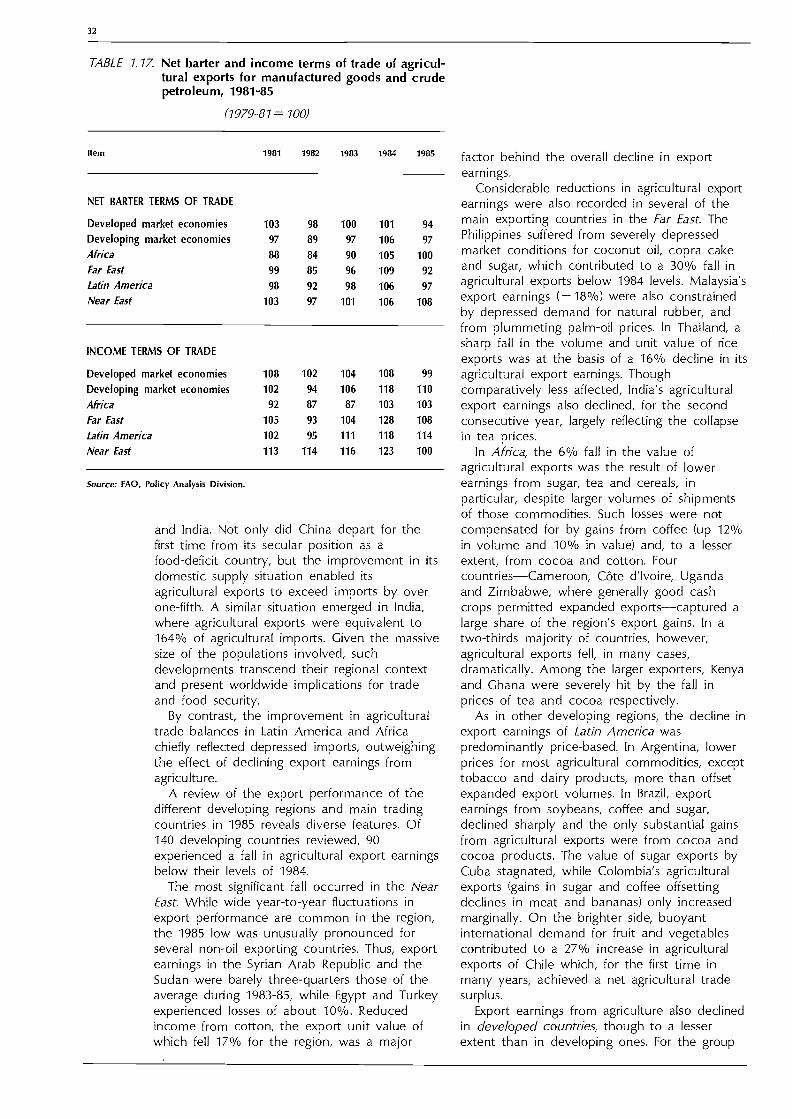
32
TABLE 1.17. Net barter and income terms of trade of agricul-tural exports for manufactured goods and crudepetroleum, 1981-85
(1979-81=100)
Source: FAO, Policy Analysis Division.
and India. Not only did China depart for thefirst time from its secular position as afood-deficit country, but the improvement in itsdomestic supply situation enabled itsagricultural exports to exceed imports by overone-fifth. A similar situation emerged in India,where agricultural exports were equivalent to164% of agricultural imports. Given the massivesize of the populations involved, suchdevelopments transcend their regional contextand present worldwide implications for tradeand food security.
By contrast, the improvement in agriculturaltrade balances in Latin America and Africachiefly reflected depressed imports, outweighingthe effect of declining export earnings fromagriculture.
A review of the export performance of thedifferent developing regions and main tradingcountries in 1985 reveals diverse features. Of140 developing countries reviewed, 90experienced a fall in agricultural export earningsbelow their levels of 1984.
The most significant fall occurred in the NearEast While wide year-to-year fluctuations inexport performance are common in the region,the 1985 low was unusually pronounced forseveral non-oil exporting countries. Thus, exportearnings in the Syrian Arab Republic and theSudan were barely three-quarters those of theaverage during 1983-85, while Egypt and Turkeyexperienced losses of about 10%. Reducedincome from cotton, the export unit value ofwhich fell 17% for the region, was a major
factor behind the overall decline in exportearnings.
Considerable reductions in agricultural exportearnings were also recorded in several of themain exporting countries in the Far East. ThePhilippines suffered from severely depressedmarket conditions for coconut oil, copra cakeand sugar, which contributed to a 30% fall inagricultural exports below 1984 levels. Malaysia'sexport earnings ( 18%) were also constrainedby depressed demand for natural rubber, andfrom plummeting palm-oil prices. In Thailand, asharp fall in the volume and unit value of riceexports was at the basis of a 16% decline in itsagricultural export earnings. Thoughcomparatively less affected, India's agriculturalexport earnings also declined, for the secondconsecutive year, largely reflecting the collapsein tea prices.
In Africa, the 6% fall in the value ofagricultural exports was the result of lowerearnings from sugar, tea and cereals, inparticular, despite larger volumes of shipmentsof those commodities. Such losses were notcompensated for by gains from coffee (up 12%in volume and 10% in value) and, to a lesserextent, from cocoa and cotton. FourcountriesCameroon, Côte d'Ivoire, Ugandaand Zimbabwe, where generally good cashcrops permitted expanded exportscaptured alarge share of the region's export gains. In atwo-thirds majority of countries, however,agricultural exports fell, in many cases,dramatically. Among the larger exporters, Kenyaand Ghana were severely hit by the fall inprices of tea and cocoa respectively.
As in other developing regions, the decline inexport earnings of Latin America waspredominantly price-based. In Argentina, lowerprices for most agricultural commodities, excepttobacco and dairy products, more than offsetexpanded export volumes. In Brazil, exportearnings from soybeans, coffee and sugar,declined sharply and the only substantial gainsfrom agricultural exports were from cocoa andcocoa products. The value of sugar exports byCuba stagnated, while Colombia's agriculturalexports (gains in sugar and coffee offsettingdeclines in meat and bananas) only increasedmarginally. On the brighter side, buoyantinternational demand for fruit and vegetablescontributed to a 27% increase in agriculturalexports of Chile which, for the first time inmany years, achieved a net agricultural tradesurplus.
Export earnings from agriculture also declinedin developed countries, though to a lesserextent than in developing ones. For the group
Item 1981 1982 1983 1904 1985
NET BARTER TERMS OF TRADE
Developed market economies 103 98 100 101 94
Developing market economies 97 89 97 106 97Africa 88 84 90 105 100
Far East 99 85 96 109 92
Latin America 98 92 98 106 97
Near East 103 97 101 106 108
INCOME TERMS OF TRADE
Developed market economies 108 102 104 108 99
Developing market economies 102 94 106 118 110
Africa 92 87 87 103 103
Far East 105 93 104 128 108
Latin America 102 95 111 118 114
Near East 113 114 116 123 100
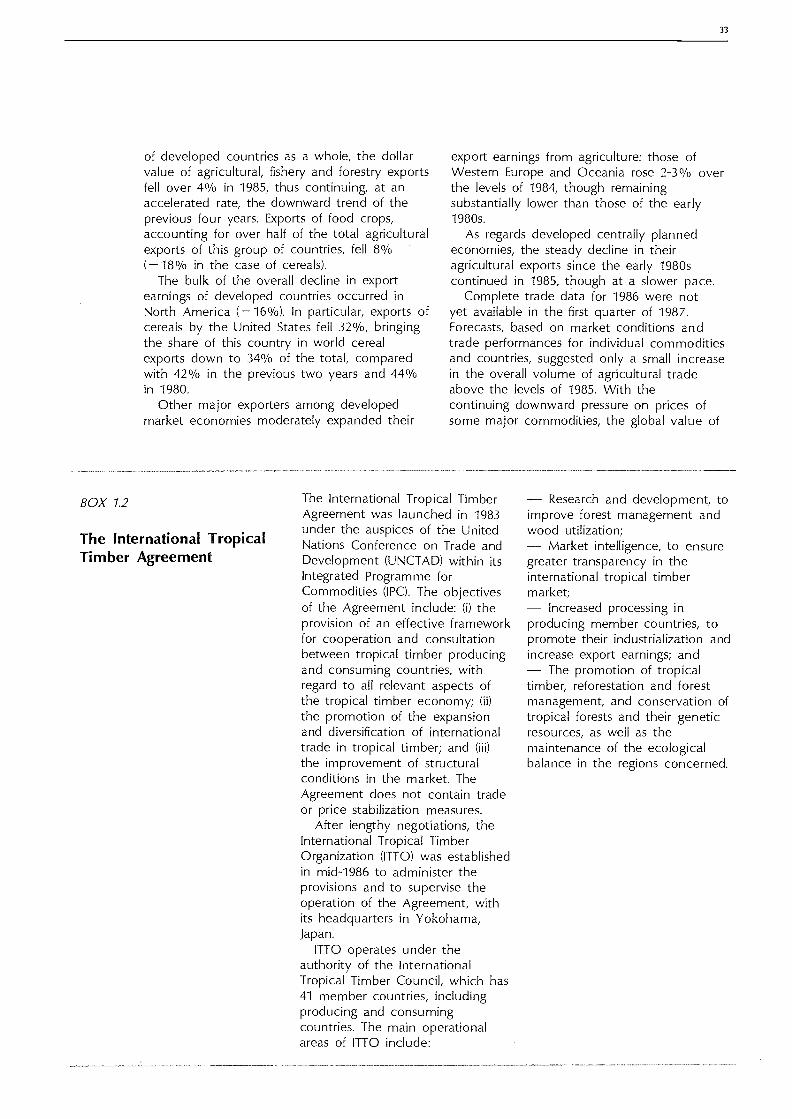
BOX 1.2
The International TropicalTimber Agreement
of developed countries as a whole, the dollarvalue of agricultural, fishery and forestry exportsfell over 4% in 1985, thus continuing, at anaccelerated rate, the downward trend of theprevious four years. Exports of food crops,accounting for over half of the total agriculturalexports of this group of countries, fell 8%( 18% in the case of cereals).
The bulk of the overall decline in exportearnings of developed countries occurred inNorth America ( 16%). In particular, exports ofcereals by the United States fell 32%, bringingthe share of this country in world cerealexports down to 34% of the total, comparedwith 42% in the previous two years and 44%in 1980.
Other major exporters among developedmarket economies moderately expanded their
The International Tropical TimberAgreement was launched in 1983under the auspices of the UnitedNations Conference on Trade andDevelopment (UNCTAD) within itsIntegrated Programme forCommodities (IPC). The objectivesof the Agreement include: (i) theprovision of an effective frameworkfor cooperation and consultationbetween tropical timber producingand consuming countries, withregard to all relevant aspects ofthe tropical timber economy; (ii)the promotion of the expansionand diversification of internationaltrade in tropical timber; and (iii)the improvement of structuralconditions in the market. TheAgreement does not contain tradeor price stabilization measures.
After lengthy negotiations, theInternational Tropical TimberOrganization (ITTO) was establishedin mid-1986 to administer theprovisions and to supervise theoperation of the Agreement, withits headquarters in Yokohama,Japan.
ITTO operates under theauthority of the InternationalTropical Timber Council, which has41 member countries, includingproducing and consumingcountries. The main operationalareas of 1110 include:
33
export earnings from agriculture: those ofWestern Europe and Oceania rose 2-3% overthe levels of 1984, though remainingsubstantially lower than those of the early1980s.
As regards developed centrally plannedeconomies, the steady decline in theiragricultural exports since the early 1980scontinued in 1985, though at a slower pace.
Complete trade data for 1986 were notyet available in the first quarter of 1987.Forecasts, based on market conditions andtrade performances for individual commoditiesand countries, suggested only a small increasein the overall volume of agricultural tradeabove the levels of 1985. With thecontinuing downward pressure on prices ofsome major commodities, the global value of
Research and development, toimprove forest management andwood utilization;
Market intelligence, to ensuregreater transparency in theinternational tropical timbermarket;
Increased processing inproducing member countries, topromote their industrialization andincrease export earnings; and
The promotion of tropicaltimber, reforestation and forestmanagement, and conservation oftropical forests and their geneticresources, as well as themaintenance of the ecologicalbalance in the regions concerned.

34
agricultural exports was not expected to changesignificantly in 1986.
Terms of TradeInternational prices of virtually all mainagricultural commodities suffered sharp losses in1985 and in the first three-quarters of 1986. TheUN's world export price index for food productsfell 9% and that for non-food agriculturalproducts, 14% in 1985. Against this, prices ofmanufactured goods increased 1%, crudepetroleum declined 8% and minerals (excludingpetroleum) rose 3%. Using the composite priceindex of manufactured goods and crudepetroleum as a deflator, the net barter terms oftrade of agricultural products therefore fell 7%in developed and 8% in developing marketeconomies in 1985 (Table 1.17). This fall largely
US/ton177
102136
66489
210371
624602
25552556
17363496
15641967
832860
300
811 I
WHEAT, Hard Winter No 2, ordinary protein, f.o.b. Gulf, U.S.A.MAIZE, No 2 yellow, f.o.b., Gulf, U.S.A.RICE, milled, Thailand 100%, II grade.SUGAR, raw, ISO Daily, f.o.b. and stowed Caribbean ports, bulk.COFFEE, green 1979 International Coffee Agreement, composite price.
cancelled the gains of the two previous yearsand marked a return to a deterioration in termsof trade that began in 1977. Among developingregions, the Far East, in particular, was severelyaffected by adverse movements in agriculturalterms of trade in 1985.
A similar trend is observed in income termsof trade, which represent changes in thepurchasing capacity of agricultural exports. In ahistorical perspective, the sharpest losses wereexperienced by developed-market economies: at9%, the fall in their agricultural income termsof trade in 1985 was the most pronouncedyear-to-year decline since the first oil crisis in1973-74.
Developing-market economies suffered adecline of 8% in income terms of trade ofagricultural exports in 1985. While Africa andLatin America partially compensated for the fall
t/t tit86 J F MAMJJ AS J FMAM1JJ6 ASOND
1985
COCOA, U.K. export, London Spot.TEA, London Auction, weighted average, all origins.COTTON, lint, Memphis Territory MI-3/32.JUTE, Bangladesh Chittagong, f.o.b., BWC.
Source: FAO. Statistics Divis on
Figure 1.2 INTERNATIONAL PRICES OF SELECTED AGRICULTURAL COMMODITIES, 1981-86
WHEAT
MAIZE
RICE
SUGAR
COFFEE
COCOA
TEA
COTTON
JUTE

BOX 1.3
Agriculture in the GATT: theUruguay Round
At a Special Session of contractingparties to the General Agreementon Tariffs and Trade (GATT), heldat Punta del Este in September'1986, Ministers decided to launcha new round of Multilateral TradeNegotiations (MTNs), the UruguayRound.
For the first time in a GATTround of MTNs, special prominenceis given to agriculture. In the partof the Ministerial Declaration whichcovers negotations on trade ingoods, the contracting parties haveagreed that "there is an urgentneed to bring more discipline andpredictability to world agriculturaltrade by correcting and preventingrestrictions and distortionsincluding those related to structuralsurpluses so as to reduce theuncertainty, imbalances andinstability in world agriculturalmarkets". Indeed, in recent yearsmany of the long-standingdistortions of world agricultureoccasioned by protectionist policieshave been aggravated at bothinternational and domestic levels.
Tensions among agriculturaltrading partners have intensified, inparticular over the use of exportsubsidies and similar practices, andresort to bilateral agreements hasbeen in the ascendancy, at theexpense of an open, multilateralsystem for trade in agriculture.
Domestic problems resultingfrom protectionist policies havealso been mounting. Domesticprices have become stronglyisolated from world prices. Budgetexpenditure on farm supportprogrammes has reached recordlevels in many industrial countries.Yet farm incomes lag behindnon-farm incomes, compounded bya dramatic increase in bankruptciesin some countries.
The aim of the GATTnegotiations on agriculture is,according to the MinisterialDeclaration, "to achieve greaterliberalization of trade in agricultureand bring all measures affectingimport access and exportcompetition under strengthenedand more operationally effectiveGATT rules and disciplines". Tothese ends, the negotiations shallaim at "improving market accessthrough, inter alia, the reduction ofimport barriers; improving thecompetitive enviionment byincreasing discipline on the use ofall direct and indirect subsidies andother measures affecting directly orindirectly agricultural trade,including the phased reduction oftheir negative effects and dealingwith their causes; (and) minimizingthe adverse effects that sanitaryand phytosanitary regulations andbarriers can have on trade inagriculture, taking into account therelevant international agreements".
The agreement thus covers bothtariff and non-tariff bordermeasures and subsidies whichdirectly affect import and exporttrade. It also implicitly recognizesthat distortions in agricultural tradearise from the implementation ofsubsidy measures which are gearedmainly to the achievement ofdomestic objectives, such as farmincome and price support, andwhich affect trade indirectlythrough their impact on domesticproduction or consumption.
Negotiations will includeagriculture as well as tropicalproducts and naturalresource-based products, includingforestry and fishery products andwill be carried out throughdifferent groups. The negotiationson agriculture will proceed in twoprincipal phases.
Activities to be undertaken in
35
the initial phase to be completedby end of 1987, include"identification of major problemsand their causes; including allmeasures affecting directly orindirectly agricultural trade";"concurrent submission ofsupplementary information onmeasures and policies affectingtrade"; "consideration of basicprinciples to govern world trade inagriculture"; and "submission andinitial examination of proposals byparticipants aimed at achieving theNegotiating Objective". The secondphase will deal with furtherexamination of proposals, initiationof negotiations, and will covernegotiations proper, with a view tofulfilling the objectives of theMinisterial Declaration.
With respect to tropical andnatural resource-based products,the aim will be to achieve thefullest liberalization of trade,including their processed andsemi-processed forms. Emphasis isgiven to the interests of developingcountries and the particularsituation and problems of leastdeveloped countries.
36
in prices by increasing their export volumes, theFar East failed to do so, and export volumes inthe Near East declined sharply.
Available data on trade volumes and pricesdo not yet allow agricultural terms of trade for1986 to be fully assessed. However, with thecontinuing decline in international prices ofmost major traded agricultural products inrecent months, coupled with firmer prices ofother products, in particular manufactures, afurther fall in agricultural terms of trade isexpected in 1986. A notable exception may becoffee, the prices of which strengthened in late1985 following drought in Brazil, butexpectations of supply shortages later in 1986failed to materialize and prices weakened again.Sugar prices also rose in mid-1986, but the rallywas not sustained (Fig. 1.2).
The above discussion on changes in prices,values and terms of trade of agricultural exportsshould be assessed in the light of changes inexchange rates that took place during theperiod considered, in particular, the depreciationof the US dollar since the second quarter of1985. Taking special drawing rights (SDRs) as areference parity, the US dollar appreciated 4%during 1984, a further net 1% in 1985, butdepreciated 6% during the first half of 1986.
Other things remaining equal, a depreciationof the US dollar, in relation to other currencies,would lead to lower returns for non-US exportsand lower costs for non-US imports, than thetrade figures based on the US dollar wouldsuggest. Obviously, the impact of changes inthe dollar's exchange rate on a country'scompetitiveness, of different countries'production cost-price relationships andagricultural and overall trade policies, dependon specific circumstances. For many countrieswhere more flexible exchange rates and tradingpolicies have been introduced recently, often aspart of comprehensive adjustment programmes,national currencies have weakened vis-A-vis theUS dollar. Conversely, currencies of othercountries (e.g., African countries belonging tothe CFA franc zone, pegged to the Frenchfranc) have appreciated against the US dollarsince early 1985. Many of these countries haveexperienced higher costs of production indollars as a consequence, less competitiveagricultural exports and, as the local currencycosts of food imports have fallen, downwardpressure on domestic market prices. At thesame time, producer prices, even if unchangedin terms of local currencies, have risen in dollarterms.
What has been the influence of the recentdepreciation of the US dollar on commodity
prices? It was often assumed that thestrengthening of the dollar, until early 1985, waslargely responsible forand contributed tooffsetthe weakness of agricultural pricesdenominated in dollars. Vice versa, adepreciation of the dollar was expected toboost prices. Recent experience has shown,however, such an expectation to be wrong, atleast in the short run, because commodityprices in many cases continued their downwardtrend throughout 1985 and most of 1986,underlining the far more important role ofcommodity-specific supply and demand factorsin determining prices. The decline in dollarprices of commodities appears more significantwhen expressed in SDRs. For example, wheatprices in dollars fell about 20% during the firsthalf of 1986; in SDR terms, the fall was 26%.

EXTERNAL ASSISTANCE
Resource Flows to AgricultureIn 1984, total official commitments of externalassistance to agriculture (OCA) fell 9% incurrent prices but by less (5%) in 1980 prices,because of the strengthening US dollar, whichdid not reach its peak value until late February1985 (Table 1.18). The decline was entirely inmultilateral non-concessional commitments,which fell almost 28% in current prices, butwhich had increased by half between 1980 and1983. In contrast, concessional commitmentsrose 3% in current prices and nearly 7% in1980 prices because of a rise in bilateralcommitments. Multilateral concessionalcommitments fell back, however.
Estimates of total commitments for 1985showed a modest recovery of 2-3% in currentprices, which equalled a rise of only 1.4% in1980 prices, because of the weakening USdollar from March 1985. Concessionalcommitments levelled off, but non-concessionalcommitments rose more than 9%. Thesechanges reflected shifts in the flows of bilateraland multilateral commitments. The former wasvirtually all concessional, while more than 50%of the latter was on non-concessional terms.During each of the three years, 1983-85, thechanges in these bilateral and multilateral flowswere in opposite directions, which served tostabilize the total flows somewhat. Within the
Thousand tons
Cereals
multilateral totals, commitments by theInternational Development Association (IDA) toagriculture continued to increase, butcommitments by the International Bank forReconstruction and Development (IBRD) wereerratic.
Some recent events have taken place thathave a bearing on future resource flows toagriculture, particularly for low-income countriesqualifying for concessional assistance:
A welcome event was the successfulconclusion of negotiations in December 1986,for the eighth replenishment of IDA. Donorcountries agreed to provide $12 400 million forthe 1987-90 three-year period, thus substantiallyexceeding the $10 500 to $12 000 million targetthey had set themselves in January 1986, andthe $9 000 million achieved for IDA VII.Between 45% and 50% of IDA loans will bechannelled to sub-Saharan Africa, reflectingrecognition of the grave problems of the region.A substantial part of the loans (between $3 000million and $3 500 million) will also be devotedto supporting adjustment measures byborrowing countries.
In early 1986, the second replenishment ofthe International Fund for AgriculturalDevelopment (IFAD) was agreed to at $500million for a three-year period, backdated tobegin in January 1985. This is less than IFAD'sfirst replenishment of $1 100 million, which
74/75 75/76 76/77 77/78 78/79 79/80 80/81 81/82 82/83 83/84 84/85 85/86 86/87
Percent of cereal imports of low-incomefood-deficit countries covered by food aid
Source: FAO. Commodities and Trade Division.
37
15000 30
25
10000
20
5000
15
o 10
Figure 1.3 SHIPMENTS OF FOOD AID, CEREALS, 1974/75 TO 1986/87

TA
BLE
1.1
8. C
omm
itmen
ts o
f ext
erna
l ass
ista
nce
to a
gric
ultu
re (
broa
d de
finiti
on),
198
3-85
(U..5
.$ m
illio
n)
' Def
lato
r us
ed: I
JN in
dex
of u
nit v
alue
of e
xpor
ts o
f man
ufac
ture
d go
ods,
198
0=10
0.S
ourc
es: F
AO
, Pol
icy
Ana
lysi
s D
ivis
ion,
and
OE
CD
.
Item
Tot
al c
omm
itmen
tsC
once
ssio
nal c
omm
itmen
tsN
on-c
once
ssio
nal c
omm
itmen
ts
1983
1984
1985
1983
1984
1985
1983
1984
1985
AT
CU
RR
EN
T P
RIC
ES
TO
TA
L12
115
11 0
7511
363
7 36
47
603
7 56
44
751
3 47
23
799
Bila
tera
l4
537
4 98
44
446
4 38
44
840
4 32
015
314
412
6
Mul
tilat
eral
7 57
86
091
6 91
72
980
2 76
33
244
4 59
83
328
3 67
3
Wor
ld B
ank
5 28
03
261
4 23
51
334
1 48
71
862
3 94
61
774
2 37
3
IBR
D3
946
1 77
42
373
3 94
61
774
2 37
3
IDA
1 33
41
487
1 86
21
334
1 48
71
862
!FA
D25
818
818
225
815
915
929
23
Reg
iona
l dev
elop
men
t ban
ks1
339
1 91
11
737
786
476
567
553
1 43
51
170
OP
EC
mul
tilat
eral
224
253
266
125
163
159
9990
107
UN
DP
169
142
150
169
142
150
FA
O (
TP
TC
P)
143
161
175
143
161
175
CG
IAR
165
175
172
165
175
172
AT
CO
NS
TA
NT
198
0 P
RIC
ES
'
TO
TA
L13
767
13 0
2913
213
8 36
88
045
8 79
55
399
4 08
44
417
Bila
tera
l5
516
5 86
35
170
4 98
25
694
5 02
353
416
914
6
Mul
tilat
eral
8 61
17
166
8 04
33
386
3 25
13
772
5 22
53
915
4 27
1

covered a four-year period, 1981-84. IFAD alsois mobilizing donor resources for a $300 millionSpecial Programme for Sub-Saharan AfricanCountries Affected by Drought andDesertification. At the Tenth Session of IFAD'sGoverning Council, held in December 1986,new contributions were announced for thisProgramme, which covers 22 countries, bringingthe total of firm pledges and payments to $197million.
The recognition at the UN GeneralAssembly's Special Session on Africa, held 27May-1 June 1986, of the substantial amounts ofresources needed to support the efforts ofAfrican governments to achieve economicrecovery and development. Additional externalresource needs of about $5 000 million a yearhave been identified for 1986-90. This isdiscussed in greater detail in the RegionalReview chapter on Africa.
The expansion of input availability being akey factor in improving the food situation inAfrica, the Fourteenth FAO Regional Conferencefor Africa, held in September 1986, proposedthat FAO undertake a feasibility study onstepping up aid-in-kind, particularly fertilizer aid.The final report of the study, due forpresentation to the FAO Conference fordecision in November 1987, should have twoprincipal objectives: to determine likely inputneeds for the next five years; and to assess thepotential role of aid-in-kind to meet them andthe possible modalities for doing so. The studywill focus on Africa.
The IMF has recently announced a newlending facility for balance of paymentsassistance to low-income countries onconcessional terms, the Structural AdjustmentFacility. It consists of SDR 2 700 million (about$3 100 million, at current exchange rates) inTrust Fund reflows already received or expectedduring 1985-91. Sixty countries are currentlyeligible for the facility, but the two largest ofthese, China and India, have announced thatthey will not avail themselves of it. It is
expected that a large share of the facility willbe used to support agricultural activities.
Food AidFAO forecast total food aid in cereals in1986/87 at 10.2 million tons, 7% above theestimates for 1985/86, but 18% less than thosein 1984/85, when record levels of food aid wereprovided in response to the African food
39
emergency (Fig. 1.3). About 8.6 million tons (or84% of the total food aid shipments in1986/87) were expected to be channelled tolow-income food-deficit countries. This would be6% more than the previous season and wouldaccount for about one-fifth of these countries'total cereal imports. At 2.5 million tons,shipments from multilateral sources wereexpected to be 8% larger than in 1985/86.
As of early December 1986, 47 FAO/WorldFood Programme (WFP) emergency operationshad been approved (24 in Africa, 13 in the FarEast, 2 in the Near East and 8 in LatinAmerica). By comparison, the number ofemergency operations in 1984 and 1985 hadbeen 63 and 55 respectively. The operationsapproved in 1986 involved 392 619 tons ofcereals and 54 848 tons of other foods, for atotal value of $145.2 million. Of these, $119.7million were from the International EmergencyFood Reserve (IEFR) and $25.5 million from theWFP's annual emergency allocation of $45million.
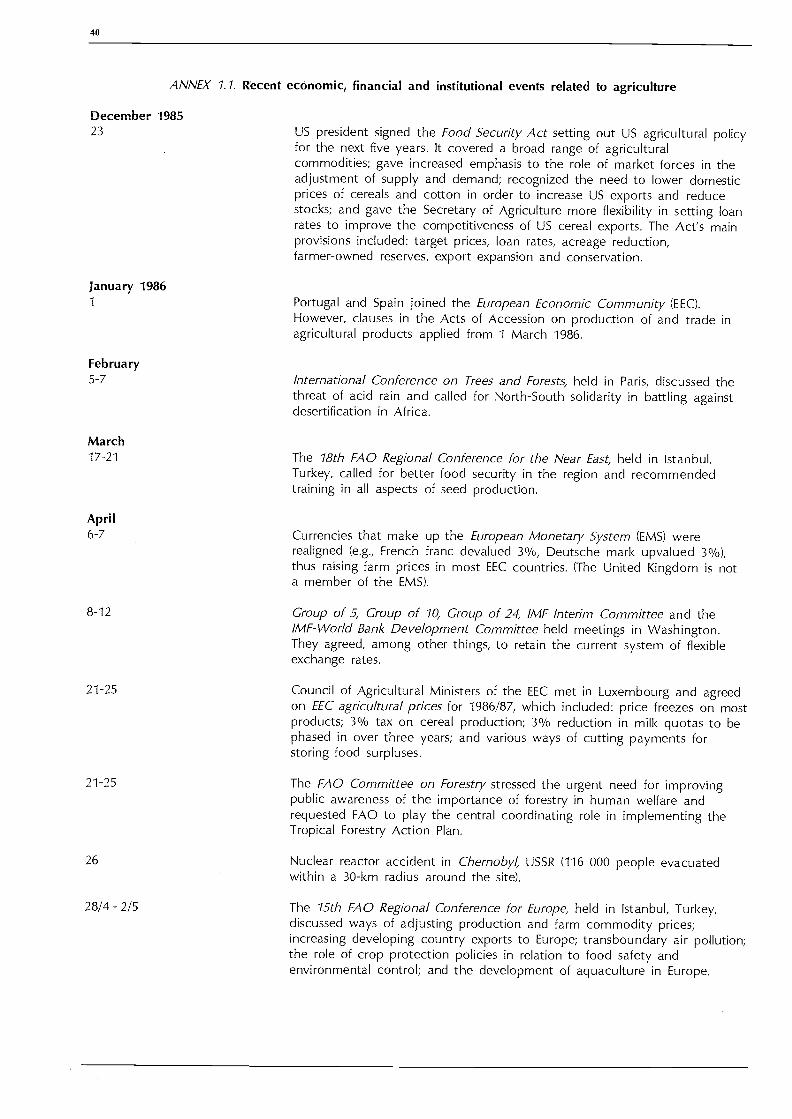
40
December 198523
28/4 - 2/5
ANNEX 1.1. Recent economic, financial and institutional events related to agriculture
US president signed the Food Security Act setting out US agricultural policyfor the next five years. It covered a broad range of agriculturalcommodities; gave increased emphasis to the role of market forces in theadjustment of supply and demand; recognized the need to lower domesticprices of cereals and cotton in order to increase US exports and reducestocks; and gave the Secretary of Agriculture more flexibility in setting loanrates to improve the competitiveness of US cereal exports. The Act's mainprovisions included: target prices, loan rates, acreage reduction,farmer-owned reserves, export expansion and conservation.
The 15th FAO Regional Conference for Europe, held in Istanbul, Turkey,discussed ways of adjusting production and farm commodity prices;increasing developing country exports to Europe; transboundary air pollution;the role of crop protection policies in relation to food safety andenvironmental control; and the development of aquaculture in Europe.
January 19861 Portugal and Spain joined the European Economic Community (EEC).
However, clauses in the Acts of Accession on production of and trade inagricultural products applied from 1 March 1986.
February5-7 International Conference on Trees and Forests, held in Paris, discussed the
threat of acid rain and called for North-South solidarity in battling againstdesertification in Africa.
March17-21 The 18th FAO Regional Conference for the Near East, held in Istanbul,
Turkey, called for better food security in the region and recommendedtraining in all aspects of seed production.
April6-7 Currencies that make up the European Monetary System (EMS) were
realigned (e.g., French franc devalued 3%, Deutsche mark upvalued 3%),thus raising farm prices in most EEC countries. (The United Kingdom is nota member of the EMS).
8-12 Group of 5, Group of 10, Group of 24, IMF Interim Committee and theIMF-World Bank Development Committee held meetings in Washington.They agreed, among other things, to retain the current system of flexibleexchange rates.
21-25 Council of Agricultural Ministers of the EEC met in Luxembourg and agreedon EEC agricultural prices for 1986/87, which included: price freezes on mostproducts; 3% tax on cereal production; 3% reduction in milk quotas to bephased in over three years; and various ways of cutting payments forstoring food surpluses.
21-25 The FAO Committee on Forestry stressed the urgent need for improvingpublic awareness of the importance of forestry in human welfare andrequested FAO to play the central coordinating role in implementing theTropical Forestry Action Plan.
26 Nuclear reactor accident in Chernobyl USSR (116 000 people evacuatedwithin a 30-km radius around the site).

May4-6 Leaders of seven major industrialized countries met in Tokyo for their 12th
Annual Economic Summit. They agreed to the "close and continuouscoordination" of their national economic policies; expressed concern over a"global structural surplus" for some important agricultural commodities andthat such surpluses required action to redirect policies and adjust thestructure of agricultural production in respect to world demand; andendorsed the use of indicators in multilateral surveillance.
7 At two donor meetings, held in May and July, FAO launched aninternationally financed campaign to save African food production fromplagues of grasshoppers and locusts. By December, pledges approximated$50 million, and latest estimates indicated that over 90% of crops in Westand East Africa had been saved, but southern Africa remained a "dangerzone".
9-25 Brasilia meeting of trade ministers of member countries of the Group of 77launched the first round of negotiations for a Global System of TradePreferences (GSTP) among developing countries.
12-22 The EEC banned the importation of food from Eastern Europe (excluding theGerman Democratic Republic) following radioactive contamination from theChernobyl accident. This was replaced (end May 1986) by a Communityregulation governing the maximum permissible concentration ofradio-nuclides in agricultural produce.
27/5 - 1/6
July8-17 The 18th FAO Conference for Asia and the Pacific, held in Rome,
concluded that while the re-gion had made noticeable progress in raisingagricultural production and increasing stability of food supplies, around 300million people in the region were still affected by mass poverty andmalnutrition.
16-26 Agreement was reached on a new three-year international CocoaAgreement, which replaced the one that expired 30 September 1986, andwas intended to stabilize cocoa prices that had fallen 16% since January1986.
28-30 The Organization of African Unity (OAU) held its 22nd Annual Conferencein Addis Ababa and elected President Denis Sasson-Nguesso of the Congoto chair the organization for the forthcoming year.
The United Nations Conference on Olive Oil adopted a fourth InternationalOlive Oil and Table Olive Agreement, replacing the accord, which did notinclude table olives, that expired at the end of 1986.
28 The International Tropical Timber Council chose Yokohama, Japan for theheadquarters of the International Tropical Timber Organization (ITTO) andelected Mr Bin Chem Yeong of Malaysia as its first Executive Director.
30 A new international Wheat Agreement only marginally changed from itspredecessor replaced the one that expired 30 June; it is comprised ofthe Wheat Trade Convention and the Food Aid Convention.
The price of oil fell from $28 a barrel in January to well below $10 in July,but recovered to about $15 after OPEC agreed on production curbs.
41
United Nations Special Session on Economic Problems of Africa, held inNew York, adopted a five-year development programme (the UN Programmeof Action for African Economic Recovery and Development, 1986-1990), torehabilitate agriculture and ease the regions's debt burden. The programmewas estimated to cost around $128 000 million, one-third from externalsources, and $82 500 million from African countries themselves.

42
August1 The Multifibre Arrangement was renewed. It was more restrictive than its
predecessor; its coverage was extended to cover all vegetable fibres; itsduration lengthened to five years; it offered more favourable treatment toless-developed countries; gave special consideration to cotton-producingcountries; and reinforced action on circumvention.
5-13 The 19th FAO Regional Conference for Latin America and the Caribbean,held in Bridgetown, Barbados, asked FAO to carry out a comprehensivestudy on the potential and long-term prospects for agricultural developmentin the region (see Box 2.3).
FAO established the Emergency Centre for Locust Operations (ECLO).
September2-11 The 14th FAO Regional Conference for Africa, held in Yamoussoukro, Côte
d'Ivoire, was presented with FAO's in-depth study, African Agriculture: theNext 25 Years (see Box 2.1).
15-21 Ministerial meeting of Contracting Parties to the GATT, held at Punta delEste, Uruguay, agreed to launch the eighth round of multilateral tradenegotiations, which were scheduled to begin officially October 31, 1986 inGeneva and to be concluded within four years. Negotiations will be held onservices as well as goods and include agriculture, tropical products andnatural resource-based products such as fishery and forestry products (seeBox 1.3).
30/9 - 3/10 The 41st Annual Meetings of the World Bank and IMF, held in Washington,agreed that more widespread support for more effective coordination ofmacro-economic policies was needed and to use economic indicators inIMF's surveillance of members' policies.
October3 UNCTAD's Trade and Development Board agreed on the venue dates and
the provisional agenda of UNCTAD VII, scheduled to be held in Geneva on6-31 July 1987, and include issues relating to resources for development,commodities, international trade and problems of LDCs.
16 World Food Day was celebrated and had as its major theme the role andwelfare of artisanal fishermen and small-scale fishing communities.
November17-28 The 90th Session of the FAO Council, held in Rome, adopted, among other
things, a resolution on migratory pest control (locusts and grasshoppers) inAfrica.
20-21 The International Sugar Council decided to extend the 1984 InternationalSugar Agreement for one year to 31 December 1987. The Agreement hasno regulatory clauses and is intended to enable the International SugarOrganization (ISO) to remain operative.
December16 EEC farm ministers approved some measures to cut dairy and beef surpluses
(e.g., quotas on milk production were to be reduced 9.5% over the nexttwo years and the support price paid by the EEC to beef farmers was todecline 11%).

PART TWOREGIONAL REVIEW
This chapter reviews food and agricultural performances, policies and other factors in developingand developed regions in recent years. The regions and countries covered are listed in Annex 2.1.The review of the situation in developing countries focuses more particularly on the monitoring ofrecent developments affecting African agriculture.
The section on developed regions includes a discussion on selected issues related toagriculture in Hungary and Poland, based on contributions provided by official East Europeaninstitutions.
AFRICA
The 1980s has been a period of deepeningeconomic and agricultural crisis for Africa. Forthe region as a whole, growth of total andagricultural GDP during 1980-84 was close tozero or even declined, implying declining rateson a per caput basis of up to 3% a year. Totalmerchandise and agricultural trade also fell inmost subregions (Table 2.1).
Several factors, including the cessation ofdrought, the forecast economic growth inindustrial countries (the principal tradingpartners of African countries), and the fall inthe cost of oil-based energy, have helped toraise expectations somewhat of improvedprospects for most African economies between1986 and 1990.1 The IMF forecasts forsub-Saharan Africa an annual per caput realGDP growth rate of 2.6% in 1986 and 1.1% in1987 compared with an average annual declineof 1.3% during 1980-85.2 The anticipatedrecovery in the region, however, is unlikely tobe achieved without a marked and continuingimprovement in the performance of theagricultural sector.
Political Commitment to Food and AgriculturalGrowthSince the early 1970s per caput annual foodproduction in Africa has declined, as the annualincrease in production has been less than 2%,while that of population approximately 3%. Thedecline in agricultural production has been acause of great concern to African governmentsas well as to the international community.Efforts have included the formulation of theRegional Food Plan for Africa (AFPLAN), whichwas endorsed by Africa's Ministers ofAgriculture in 1978. Political awareness and
The majority of African countries are oil importers, someof which spend as much as 30% of their annual foreignexchange earnings on oil imports.
2 Excluding Nigeria and South Africa.
concern for the disturbing deterioration in theperformance of the agricultural sector wasenhanced by the incorporation of the AFPLANinto the Lagos Plan of Action, which wasendorsed by African Heads of State in 1980.3
These declarations of intent, however, wereovertaken by events in the early 1980s, asfurther economic and financial difficultiescoincided with a widespread and disastrousdrought.
Food production growth rates declined evenmore during 1980-84, when only two subregionsrecorded per caput gains. This furtherdeterioration, which led to serious foodshortages and famine in 25 African countriesbetween 1983 and 1985, not only brought fortha notable upsurge in worldwide sympathy andassistance, but also goaded governments tostrive to evolve an "African strategy" fordevelopment, with food and agriculture as focalpoints.
Notable among these expressions of policyintent were the Harare Declaration of 1984,which emerged from the Thirteenth FAORegional Conference for Africa held inZimbabwe, and the Organization of AfricanUnity's (OAU) Africa Priority Programme forEconomic Recovery (APPER), 1986-1990 of 1985.Both documents spelled out basic strategies forthe management of African economies, givingpriority to the food and agricultural sectors,particularly the small-scale farm sector, in termsof allocation of resources and the formulationof policies. These strategies became theprincipal items in documents submitted byAfrican governments to the UN GeneralAssembly's Special Session on Africa, held 27May-1 June 1986.
The Special Session adopted a declarationthat was similar to the text prepared by theOAU in presenting Africa's case, but whichreflected reservations by the donor communityabout the amount of additional aid available,the rescheduling of African debt and tradeissues.
3 OAU, "Lagos Plan of Action for the Economic Develop-ment of Africa", 1980-2000, Geneva, 1981.
45
TA
BLE
2.1
. Afr
ica:
sel
ecte
d gr
owth
rat
es
(Per
cent
ages
)
Cou
ntry
/C
ount
ry g
roup
Pop
ulat
ion
1980
-86
Agr
icul
tura
lla
bour
1980
-86
Tot
al G
DP
1980
-84
Agr
icul
tura
lG
DP
1980
-84
Tot
al$
valu
e of
expo
rts
1980
-85
Tot
al$
valu
e of
impo
rts
1980
-85
$va
lue
ofag
ricul
tura
lex
port
s19
80-8
5
$va
lue
ofag
ricul
tura
lim
port
s19
80-8
5
Agr
icul
tura
lpr
oduc
tion
1980
-86
Foo
dpr
oduc
tion
1980
-86
Tun
isia
2.08
1.65
3.73
1.12
-6.4
0-5
.18
-5.1
1-3
.54
3.71
3.76
Alg
eria
3.09
5.01
5.51
1.79
-5.3
0-0
.96
-17.
82-1
.31
2.39
2.24
Mor
occo
2.49
2.87
2.90
-0.7
7-4
.89
-3.8
2-1
5.76
-5.1
15.
195.
20
NO
RT
H-W
ES
T2.
693.
544.
810.
71-5
.39
-2.3
7-1
3.68
-2.4
73.
783.
72
Sen
egal
2.60
1.21
5.01
2.69
0.28
-2.4
81.
57-1
.03
2.30
2.14
The
Gam
bia
1.99
0.67
-0.4
321
.14
6.01
-7.5
52.
442.
142.
983.
17
The
Nig
er2.
891.
78-3
.67
1.24
-11.
22-1
1.51
-4.5
2-2
.42
-0.4
5-0
.46
Mau
ritan
ia2.
993.
290.
412.
8811
.80
-4.3
4-2
.41
2.65
0.52
0.52
Bur
kina
Fas
o2.
451.
13-0
.87
1.41
-0.2
5-7
.73
0.50
0.75
5.86
5.67
Mal
i2.
862.
411.
083.
030.
26-3
.08
0.76
7.93
2.35
2.13
Cha
d2.
331.
21-9
.04
0.96
7.76
9.23
6.27
43.9
33.
523.
25
SA
HE
L2.
651.
681.
252.
24-0
.17
-4.7
81.
162.
402.
462.
35
Tog
o3.
011.
27-3
.87
-1.2
1-9
.34
-14.
250.
534.
510.
650.
29
Ben
in3.
01-2
.92
3.07
0.94
13.4
35.
7220
.65
2.53
7.82
7.17
Gui
nea-
Bis
sau
1.83
1.24
4.60
7.67
-4.1
7-1
3.22
1.55
-11.
267.
637.
63
Sie
rra
Leon
e1.
820.
020.
23-2
.55
-5.7
1-1
7.64
5.00
-11.
780.
900.
91
Gui
nea
2.37
0.40
1.58
0.37
-3.7
7-1
.64
-11.
52-4
.66
1.84
1.89
Gha
na3.
300.
96-2
.07
-1.3
2-1
0.76
-7.8
0-1
1.42
-4.3
04.
614.
78
WE
ST
, LO
W-I
NC
OM
E2.
830.
28-
1.83
- 1.
24-6
.99
-4.3
3-6
.89
-3.8
74.
053.
93
Côt
e d'
Ivoi
re3.
704.
55-2
.61
-2.5
3-1
.35
-11.
801.
70-1
0.61
2.89
3.85
The
Con
go2.
64-5
.27
10.1
1-7
.28
8.74
9.13
5.21
7.31
0.89
0.87
Gab
on1.
631.
140.
00.
00.
17-0
.14
-13.
882.
390.
980.
96
Libe
ria3.
211.
69-2
.08
-1.9
5-7
.24
-5.6
9-2
.46
-2.9
02.
732.
99
Nig
eria
3.41
-0.6
1-4
.64
1.41
-12.
24-1
3.64
-3.2
7-1
1.00
2.97
3.01
Cam
eroo
n2.
752.
795.
940.
27-4
.12
-8.2
1-3
.43
-0.0
02.
112.
24
WE
ST
, MID
-IN
CO
ME
3.35
0.27
-3.1
70.
85-8
.75
-11.
80-0
.10
-9.2
72.
112.
36

TA
BLE
2.1
.(c
ont.)
Afr
ica:
sel
ecte
d gr
owth
rat
es
(Per
cent
ages
)
Not
e: C
ount
ries
are
rank
ed w
ithin
cou
ntry
gro
ups
acco
rdin
g to
die
tary
ene
rgy
supp
ly (
DE
S)
leve
ls in
198
1-83
.
Cou
ntry
/C
ount
ry g
roup
Pop
ulat
ion
1980
-86
Agr
icul
tura
lla
bour
1980
-86
Tot
al G
DP
1980
-84
Agr
icul
tura
lG
DP
1980
-84
Tot
al$
valu
e of
expo
rts
1980
-85
Tot
al$
valu
e of
impo
rts
1980
-85
$va
lue
ofag
ricul
tura
lex
port
s19
80-8
5
$va
lue
ofag
ricul
tura
lim
port
s19
80-8
5
Agr
icul
tura
lpr
oduc
tion
1980
-86
Foo
dpr
oduc
tion
1980
-86
Bur
undi
2.86
1.00
2.50
1.84
11.9
32.
949.
38-1
.06
2.36
2.33
Zai
re2.
993.
520.
291.
84-0
.55
-0.4
3-2
.40
1.48
2.81
2.76
Rw
anda
3.37
2.67
6.40
8.30
3.24
0.14
1.71
7.31
0.70
0.26
Cen
tral
Afr
ican
Rep
.2.
333.
24-0
.27
1.57
0.52
3.18
4.08
2.37
1.22
1.01
CE
NT
RA
L2.
993.
081.
521.
77-0
.05
0.24
1.37
1.95
1.76
1.61
Uga
nda
3.40
2.22
6.62
9.07
9.79
-0.7
07.
65-1
9.17
6.26
5.98
Tan
zani
a3.
602.
22-2
.47
-8.4
8-5
.93
-6.1
9-4
.50
-7.9
01.
802.
28
Som
alia
2.88
4.79
6.43
13.4
0-0
.41
2.12
-11.
05-1
.14
0.65
0.66
Ken
ya4.
223.
072.
943.
20-6
.07
-10.
732.
671.
293.
212.
22
Eth
iopi
a2.
52-0
.25
2.76
1.47
0.67
6.55
-5.4
928
.98
0.39
-0.1
1E
AS
T3.
211.
542.
862.
24-2
.53
-4.7
70.
063.
842.
572.
31
Mad
agas
car
2.85
2.36
-5.3
0-0
.32
-4.1
5-7
.76
-2.8
0-9
.94
2.18
2.20
Mal
awi
3.16
2.31
2.38
4.40
0.34
-8.1
21.
76-1
3.90
1.79
1.23
Nam
ibia
2.84
2.40
0.0
0.0
0.0
0.0
-13.
420.
08-1
.18
-0.8
6M
ozam
biqu
e2.
85-1
.13
-3.6
3-6
.56
-17.
76-1
.67
-19.
634.
93-0
.49
-0.3
0T
he C
omor
os3.
11-0
.06
0.0
0.0
8.99
3.45
28.6
8-8
.22
2.38
2.34
SO
UT
H, L
OW
-IN
CO
ME
2.92
0.91
-2.4
0-6
.56
-4.9
0-5
.55
-3.7
1-2
.83
0.98
0.96
Reu
nion
0.89
1.23
0.0
0.0
-11.
26-1
.11
-10.
07-3
.15
0.78
0.96
Mau
ritiu
s1.
87-0
.07
3.74
5.69
3.33
-2.2
1-4
.44
-7.2
63.
813.
50
Sw
azila
nd3.
101.
484.
513.
88-8
.45
-7.9
2-1
1.45
3.00
2.04
2.32
Leso
tho
2.58
1.42
6.17
6.62
-14.
69-0
.32
-1.8
72.
760.
160.
08
Bot
swan
a3.
873.
1313
.25
-9.4
712
.03
-2.3
7-0
.78
1.40
0.36
0.36
Ang
ola
2.53
-1.0
7-2
.62
0.69
-12.
62-1
1.96
-13.
871.
500.
160.
22
Zam
bia
3.39
1.49
-0.5
12.
13-1
2.38
-8.8
44.
07-1
2.35
2.62
2.42
Zim
babw
e3.
570.
323.
09-2
.79
-3.6
2-6
.38
-0.8
62.
334.
102.
64
SO
UT
H, M
ID-I
NC
OM
E3.
040.
420.
900.
40-5
.98
-5.7
9-5
.22
-1.8
01.
791.
56
AF
RIC
A3.
061.
38-0
.03
-0.2
1-6
.55
-6.3
8-2
.32
-3.4
02.
392.
30

A consensus, however, was reached on thefollowing:
A frank analysis of the causes of Africa'seconomic crisis as presented in the documents;
The need to assign absolute top priority toaccelerating agricultural development and itssupporting sectors with emphasis on small-scaleand/or women farmers;
The need for substantial amounts ofresources to help restructure and developAfrican economies so as to promote a"pro-agricultural" development strategy;
The need for African governments tosignificantly improve their economic andresource management, in particular, land use,price policies and the economic role of thestate;
No new structures or mechanisms forfollowing up the Special Session would benecessary; and
The need to replenish IDA up to $12 000million. (As discussed in the World Reviewchapter of this report, this target in fact wasexceeded, as donor countries agreed to provide12 400 million for the 1987-90 period.)
According to the submission, the fullimplementation of APPER would require$128 100 million over the five-year period(1986-90). African countries have committedthemselves to mobilize $82 500 million (64.4%),leaving $45 600 million (35.6%) from externalsources. This comes to about $9 000 millionannually from the international community. Itwas claimed, however, that $19 000 million wasalready available or pledged from externalsources, leaving $27 000 million, or $5 400million a year of additional resources. This lattersum is equivalent to about 14% of total officialdevelopment assistance (ODA) to developingcountries in 1984, and about 46% of theaverage yearly government planned investmentin agriculture in Africa during 1986-90.
The World Bank, focusing on the 29 poorestcountries of sub-Saharan Africa, with per caputincomes of less than $550 in 1984, assessed theneed for additional resource flows (taking intoaccount "known and foreseen" commitments) tobe $2 500 million a year of concessional flowsand debt relief. This would permit the volumeof per caput imports during 1986-90 to regainthe level of 1980-82, and to achieve themodest objective of a real GDP gr.owth of3-4%, which would barely keep pace withpopulation growth.
The OAU's submission to the Session claimedthat debt-service payments would total about$24000 million a year during 1986-90, of which$6 800 million a year would be accounted for
by low-income sub-Saharan countries. Therescheduling or cancelling of this debt was partof the additional aid required, but the majorcreditor countries were not prepared tonegotiate on this issue at the session for fear ofcreating a precedent. Aid and debt negotiationswere to take place on a country-by-countrybasis and not as a generalized approachbetween Africa as a "block" and donor/creditorcountries.
Trade issues, particularly protectionism, accessto markets and commodity prices, weredeferred to the multilateral trade negotiationsunder the GATT, which officially got under wayin Geneva in October 1986.
The UN Programme of Action, which arosefrom the Special Session, consists of: (i) thecommitment of African governments to launcheconomic development programmes accordingto APPER; and (ii) the commitment of theinternational community to support Africa'sown efforts. Several countries, including Canada,the Netherlands and some Scandinaviancountries, announced during the Sessioninitiatives involving higher levels of aid and amoratorium on or the cancellation of debts ofcertain African countries.
Causes of Retarded Agricultural GrowthAlthough specific causes of poor agriculturalperformance vary in each country, there havebeen a number of common internal andexternal features.' Internal policy factors includethe following:
The lack of political commitment of Africangovernments toward agriculture and the ruralsector;
Inadequate management of resources; poorformulation of development strategies andpolicies; inefficient pricing systems, includingexchange rates; high cost of state-operatedproduction, marketing and agricultural financeinstitutions; and ineffective research andextension services;
Inadequate physical infrastructure fortransport and communications, and inadequateallocation of financial resources to theagricultural sector or to supporting sectors; and
The region's rapid population growth rate ofmore than 3% a year coupled with an even
4 These are discussed in greater detail in FAO's AfricanAgriculture: The Next 25 Years, presented to the Fourteenth
FAO Regional Conference for Africa, Yamoussoukro, Côted'Ivoire, 2-11 September 1986.

faster urbanization growth rate and the absencein most countries of a coherent populationpolicy designed to support development policy.
The adverse effects of these policyconstraints were aggravated by periods ofdevastating drought, particularly in the Sahelianzone in the early 1970s and throughout allAfrica from late 1982 to early 1985.
There were two related external factorscontributing to Africa's economic crisis. The firstconcerned the export sector, where agriculturalcommodities play an important role and, inparticular, the deteriorating terms of tradesuffered by most African countries since theearly 1980s. During 1981-83, Africa's terms oftrade deteriorated by nearly 6%. Thedeterioration in terms of trade was worse insub-Saharan Africa (18%), where agriculturalcommodities have a relatively greater weight inexports. Sub-Saharan countries, excludingNigeria, suffered an estimated loss of $15 000million through the deterioration in terms oftrade during the early 1980s, an amountroughly equivalent to the increase in theirexternal debt.
The second factor is Africa's total debt,which was estimated by the IMF to beapproximately $140 000 million in 1986, havingvirtually doubled in eight years. IMF alsoestimated sub-Saharan Africa's debt at about$66 500 million, excluding Nigeria. Africa'scurrent debt-service ratio is between 30-32%,having risen from around 15-17% in 1978.
Since the early 1980s, Africa in general and,sub-Saharan countries in particular, have beenfaced with a dilemma. Net external borrowinghas been falling (from $8 400 million in 1981 to$3 900 million in 1985), while net investmentincome has become increasingly negative( $2 000 million in 1981 to $3 400 in 1985),mainly because of rising interest payments ondebt. Export earnings have also declined (from$24 200 million in 1980 to $20 400 million in1985). Therefore, imports had to be severely cutback (from $27 400 million in 1980 to $20 300million in 1985), at a time when manydrought-affected countries required largerimports of food and economic sectors,including agriculture, were badly in need ofimported inputs, spare parts and fuel. The valueof total merchandise imports fell more than 6°/oa year during 1980-85, while that of agriculturalimports, including inputs and food, also fellmore than 3% a year during the same period.
To enable agriculture to recover from thedrought, exploit the return of more normalrains in 1985-86 and implement the APPER,more financial resources are required at a time
when, paradoxically, external flows arecontinuing to diminish. It was on this basis thatfinancial proposals for the UN GeneralAssembly's Special Session on Africa were puttogether, involving a commitment on the partof African countries to mobilize domesticresources and make policy reforms, along withinjections of additional external resources, eitheras capital flows or as debt relief.
Recent Policy ReformsWith the gathering appreciation of the gravityof the economic crisis in Africa, policy reformshave been widely introduced since 1980.5 Forexample, during 1980-84, 26 sub-Saharan non-oilexporting countries were involved inIMF-supported structural adjustmentarrangements, the peak year being 1981, with19 countries participating.
The most striking macro-policy reforms havebeen the numerous devaluations of currencies.Between mid-1984 and early 1986, out of 43African countries for which data were available,the exchange rates of currencies against theSDR remained unchanged for four countries,increased in 15 othersthe majority being inthe Communaute Financière d'Afrique (CFA)Franc zonc and declined in 24 others. Someof the devaluations were substantial: 372% forthe Ugandan shilling; 311% for the Zambiankwacha and 274% for the Somali shilling. Theunweighted average decline was nearly 39%from mid-1984 to mid-1986. Such major effortsto realign currency values in the light ofeconomic realities often have been made inconjunction with other structural adjustmentmeasures.
Far-reaching reforms in domestic policiestoward the agricultural sector have frequentlyaccompanied these adjustments in exchangerates. These reforms focus on: (i) institutionalchanges, particularly with regard to agriculturalmarketing boards, with a view to increasingefficiency and reducing costs; (ii) increasingproducer prices, facilitated in the case of exportcrops by the devaluations that have takenplace; and (iii) reducing subsidies on food andagricultural inputs. Some selected countryexamples follow.
5 A report published by the World Bank in 1986, Financing
Adjustment with Growth in Sub-Saharan Africa, 1986-90,highlights some success stories and underlines how deeper
policy reforms have been introduced, particularly since1983.
49

50
Ghana recently announced its AgriculturalPolicy Action Plan, 1986-88, which supports thecountry's Economic Recovery Programme, givingagriculture a high priority. The drasticdevaluation of the cedi has permitted increasesin producer prices, although not comparable tothe devaluation. For example, prices announcedfor 1985/86 were 367% and 100% higher forcocoa and maize respectively than thoseannounced in April 1983.
Plans have been announced to privatizesome parastatal functions that are non-viableunder their existing management, and the theMinistry of Agriculture also is being reorganized.
Food production growth during 1980-85averaged 4% a year (including the disastrousyear 1983), compared with an average declineof nearly 2% a year during 1971-80. Theincrease in 1986 over 1985 was more than10%.
Nigeria has not devalued the naira, but hasfocused its attention instead on reforms ininstitutional arrangements and trade policy.According to a Nigerian governmentannouncement in April 1986, seven parastatalmarketing boards for grains and other crops(cocoa, palm-oil, rubber, groundnuts, cotton,and roots and tubers) were to stop trading on30 June 1986, and to cease functioningaltogether by the end of the year (they owed637 million nairas at the end of 1984). Much ofthe trade in these products was already inprivate hands, but now government interventionin agricultural marketing is limited to being a"buyer of last resort" through the stateadministration. State subsidies on fertilizer pricesalso have been reduced, from 80% to 20%.
In the area of trade policy, the major reformwas the banning of imports of rice and maize,in effect from 1 October 1985, and vegetableoil from 1 January 1986. It is believed thatNigeria can be self-sufficient in these products;it once was a major exporter of vegetable oils.
Food production increased 4% in 1985compared with an average growth rate of lessthan 1% during 1980-84 and less than 3%during 1971-80, while the population growthrate in 1985 exceeded 3% a year. Progress wasmaintained in 1986, with per caput foodproduction increasing 1.3%.
In contrast, Zambia is relying more on priceincentives than institutional reforms to expandagricultural output. Policy changes, however,also centre on the need to improve theefficiency of agricultural marketing and servicinginstitutions and to fund increased supportprogrammes for agriculture.
The kwacha was formally devalued at
intervals during the early 1980s, but in October1985 the government introduced a system ofauctioning foreign exchange on a weekly basisrather than setting a fixed rate. Within twoweeks the kwacha had devalued 200% againstthe US dollar, and by the end of 1985, hadsettled to- around 145%, but later on fellfurther. This decline necessitated considerableincreases in producer prices, as import andexport prices, in terms of the kwacha, roseproportionally. Producer prices rose 125% formaize and 103% for wheat between the1983/84 crop year and November 1985.
The fertilizer subsidy was reduced 63% in1983. Subsequent adjustments were made inthe light of the exchange rate and the need toreduce the government budget. Fertilizer pricesrose about 220% between 1983 and 1986. As aresult, fertilizer consumption fell 18% in1984/85, but was reportedly up again in 1986.Although the price of fertilizer is uniformthroughout the country and is applicable forany kind of fertilizer, this leads to inefficiency inits distribution and use.
In 1985, food production in Zambia increased5% (compared with an average rate of only1.5% a year during 1980-84 and 2.8% during1971-80), and maize output rose 13%. In 1986,food production again increased about 5%.
The radical agricultural policy reformsundertaken by African governments in recentyears, often associated with changes in otherareas, particularly macro-economic policy, haveinvolved, at times, substantial costs to somesectors of the community. In particular, urbanpopulations have faced increased costs in foodand imported consumer goods, and job lossesresulting from the restructuring or closure ofvarious parastatals. The political cost of suchsacrifices should not be underestimated.
Although these policy reforms will take timeto implement and fully yield results, they havealready contributed, together with improvedweather conditions in 1985, to achievesignificantly higher levels of food andagricultural output. For Africa as a whole, theincrease in 1985 was about 7% for bothcategories, compared with an annual averageincrease of less than 2% during 1980-84 andabout 2% during 1971-80.
Such welcome improvements also carry someaccompanying problems. Difficulties from lackof transport and storage facilities have beenwidely reported with a consequent collapse ofmarket prices. In other cases, bags have beenin short supply, and problems of financing theexpected crop, coupled with higher prices, havearisen. For example, in Zambia in 1984/85, it

BOX 2.1
FAO's in-depth study on foodand agricultural problems inAfrica
Conscious of the continent'sdeepening food production crisis,African Ministers of Agriculture atthe Thirteenth FAO RegionalConference for Africa in July 1984,requested the Director-General toundertake an in-depth study ofagriculture and food problems inthe region and to proposeconcrete measures to overcomethem. The study's findings,published in African Agriculture:The Next 25 Years (ARC/86/3), werepresented to the Fourteenth FAORegional Conference, held inYamoussoukro, Côte d'Ivoire, 2-11September 1986.
Although the study focusedmainly on staple food production,it also emphasized livestockproduction, inland fisheries andforestry. Its five main conclusionswere:
Africa's present food supplysituation is not only inadequatebut, in some instances,unsustainable. If present trendswere to continue, the cost ofcereal imports would rise sixfold in25 years, many countries wouldlack the means to import sufficientquantities of food, and somewould hover on the brink ofsurvival.
Africa can feed itself providedthe potential of doing so isproperly mobilized andsafeguarded. Land resources aresufficient to meet future needs, butmany of them are fragile and needgreater care. With a minimumaverage growth of agriculturalproduction of 3% a year as arealistic objective, staple cropyields can double over the next 25years.
Crop land is beingoverexploited, rangelandsoverstocked and forests destroyed.Desert encroachment and soilerosion are causing large areas ofagricultural land to be lost ordegraded. Proven measures exist toallow conservation-baseddevelopment, but finance andinstitutional mechanisms arelacking.
Four factors currently hold backagricultural development:inadequate incentives for farmersto produce for the market; lack ofinputs; inappropriate institutions;and poor infrastructure. (These
51
factors have become known as thefour "i"s of agriculturaldevelopment.)
Greater priority to agricultureshould be given in nationalbudgets; improvement in Africa'sexternal economic environment iscalled for; and changes are neededin financial and technicalassistance.
In the light of the aboveconclusions, a Programme ofAction for African agriculture waspresented to the Conference. Itconsists of two parts: (i) afour-point strategy to raise foodproduction; and (ii) a specificinitiative to greatly expandaid-in-kind to raise productionquickly.
The four-point strategy concernsfour interdependent actions: (i)internal reforms in nationaleconomies to give greater priorityto agriculture; (ii) improvements inthe four "i"s (incentives, inputs,institutions and infrastructure)outlined above; (iii) implementationof strategies for conservation ofnatural resources; (iv) improvementof the external economicenvironment (e.g., to help increasetrade, reduce Africa's debt burdenand higher levels of financialassistance to the region).
The aid-in-kind initiative is basedon the fact that: (i) a rapidincrease in production demandsgreater use of inputs (fertilizers,pesticides, seeds, implements andspare parts); (H) many countriescannot afford to import suchinputs; (iii) input shortages preventfarmers from fully responding toimproved production incentives;and (iv) a better balance is neededbetween food aid and aid toproduce food. The modalities foran expanded aid-in-kindprogramme, however, have to beexplored for different inputs andcountry situations.

52
was estimated that financing the 1984/85 maizecrop through the National AgriculturalMarketing Board (NAMBOARD) required 210million kwachas, and the Board already had anoutstanding debt of 70 million kwachas.
This experience underlines the wisdom of theAPPER in focusing, not only on measures toincrease agricultural production directly and toimprove the policy environment for agriculture,but on allocating resources to those sectorssupporting agriculture, such as transport andcommunications. The danger is that theopportunity to exploit a rather more favourableeconomic environment will be lost because ofan inability to finance the required levels ofimports and investment.
In early September 1986, at the FourteenthFAO Regional Conference for Africa, theDirector-General of FAO introduced FAO'sstrategy for Africa's agricultural progress basedon a four-point Programme of Action (see Box2.1).
Food and Agricultural Situation in 1986 and theEarly 1980sAfrica's agricultural sector showed a goodrecovery in 1985 and 1986 from the scourge ofdrought that had afflicted the early 1980s.Growth in food production in 1985 and 1986combined was more than 8%. As aconsequence, by early 1987, ten Africancountries had exportable surpluses of coarsegrains from the 1985/86 crop and eightcountries had exceptional local surpluses.6 Thissituation also underlined the low pricesprevailing in world markets, indeed the difficultyin obtaining any markets at all, the lack ofpurchasing power and the inadequacy ofinfrastructure to move supplies to deficit areas.
At the same time, however, five Africancountries were still facing abnormal foodshortages.' Despite a marked overallimprovement, localized but nevertheless seriousfood problems remain in Africa. The region'sannual growth rate in food production during1980-86 was only 2.3% compared to populationgrowth of 3.1%. The value of its agriculturalexports during 1980-85 declined 2% a year,
6 Exportable surpluses: Benin, Burkina Faso, Côte d'Ivoire,
Kenya, Malawi, Mali, Niger, Sudan, Uganda and Zimbabwe.
Exceptional localized surpluses: Burkina Faso, Chad, Mal-
awi, Mali, Senegal, Sudan, Uganda, and Zimbabwe.
7 Angola, Botswana, Ethiopia, Lesotho and Mozambique.
while its agricultura! GDP stagnated (see Table2.1).
In North-West Africa, food production failedto increase in 1986, but this followed theexceptional gain recorded in 1985 and wasmainly the result of a 30% reduction in thecereal harvest in Tunisia, compared with therecord of the previous year. In Morocco,however, food production increased 14% in1986. During 1980-86, the subregion's growth infood production increased 3.6% a year, nearlyone percentage point above the rate ofpopulation growth; but agricultural exportsslumped badly.
Cereal production in the Sahel was expectedto attain a record level in 1986, although foodproduction as a whole fell back in somecountries such as Senegal. Both Mauritania andMali recorded increases in food and agriculturalproduction of between 11% and 12%. Growthin food production for the subregion during1980-86, at only 1% a year, was below that ofpopulation (2.6%). Annual growth in agriculturalexports during 1980-85 was modest (1.2%), butat least positive, while real growth ofagricultural GDP was better than that of totalGDP.
For West Africa, 1986 was, on the whole, afavourable year for agriculture, althoughexperiences varied among countries. Productionfell back in Côte d'Ivoire, Liberia and Togo, butother countries, Ghana and Cameroon inparticular, recorded significant gains. Theincrease in food production of the low-incomecountries of the subregion during 1980-86, atnearly 3% a year, was a little better than thatof the medium-income countries (2.7%). Theformer countries' agricultural exports, however,declined much more rapidly during 1980-85 (bynearly 7% a year) than the latter's, largelybecause of increased exports by Côte d'Ivoireand the Congo, both mid-income countries.
Growing conditions in 1986 in Central Africawere normal, although food production in theCentral African Republic failed to increase.Nevertheless, the increase for the subregion asa group was nearly 3.5% in 1986, although thisgood performance served to pull up theregion's average growth of food production toonly 2% during 1980-86, nearly one percentagepoint less than population growth. There wasmodest annual growth (1.4%) in agriculturalexports during this period.
In East Africa, above average crops wereharvested in most countries of the subregion,although conditions were not so favourable inSomalia, and food production has not attainedits pre-drought level in Ethiopia. The short rains

BOX 2.2
Locust and grasshopperattacks in Africa and theNear East
of late 1986 were also favourable, again withSomalia as an exception, so that the outlookwas good for the secondary food crops comingonto the market in early 1987. The subregion'sannual average growth in food production (2%)during 1980-86 was severely depressed bydrought compared to a population growth rateof over 3%. The value of agricultural exportsremained virtually unchanged during 1980-85,but there were wide differences amongcountries in East Africa.
The situation in southern Africa for 1986crops was also mixed, although food productionactually declined only in Lesotho, with verylittle growth in Angola. In 1986 most countries,however, consolidated the major and, in somecases, record increases of 1985, and notablegains in particular were recorded in Mauritius
The return to near normal rains inAfrica during 1985 createdfavourable conditions for locustand grasshopper infestations. Inlate summer 1985, there werewidespread infestations in someSahelian countries of West Africa,and FAO warned the internationalcommunity that this posed animminent threat of majorproportions for food crops in largeareas of the continent.
In 1986, intensive aerial andground control operations,supported by FAO, UNDP, EEC andUSAID, helped avert major foodlosses in western and easternAfrica. The Director-General ofFAO launched an appeal at adonor meeting in Rome on 7 May1986 for contributions to meet thecosts of this campaign. Thesecosts, estimated by FAO at almost$50 million in December 1986,were fully covered by bilateral andmultilateral donors. Thus, a littlemore than one year after FAO'sfirst warning of grasshopper andlocust upsurge, the promptresponse of African governmentsand the international communitycould be credited as largelysuccessful.
The danger however, still existsin 1987, of an upsurge of theDesert Locust in the Sudan and on
and Swaziland. The rains began toward the endof the calendar year in this subregion, and sofar, with some exceptions, the rains of 1986-87have been well distributed. Nevertheless,internal disorders continue to adversely affectfood and agricultural production inMozambique and Angola. During 1980-86, foodproduction increased less than 1% a year inthe low-income countries of the subregion andby 1.9% in the medium-income countries,whereas population grew by about 3% a yearin both of them. Agricultural exports during1980-85 declined 3.7% and 5.2% for low- andmedium-income countries respectively, and onlythe Comoros, Zambia and Malawi increased thevalue of their agricultural exports.
The relatively abundant rains of the last twoyears have brought in their wake another
the Arabian peninsula. By thebeginning of the year, at no timeduring the last 20 years, has thesituation along the Red Sea coastbeen so serious. The Brown Locustalso remains a threat in southernAfrica, thus requiring continuingcontrol efforts. Furthermore, thegrasshopper problem in thewestern Sahel is as potentiallydangerous in 1987 as it was in1986. Eggs have been deposited inthe soil and await the comingrains in mid-1987. If weatherconditions are favourable, largeswarms of grasshoppers andlocusts are inevitable. A meeting ofdonors and affected countries inDecember 1986 in Rome drewpromising reactions, so it appearsthat the international community isprepared to cope with such aneventuality. The main concern is inmonitoring and managing theproblem where so many factorsare unpredictable across a widegeographic area, spanning manycountries.
53

sa
age-old threat to African food supplies, that oflocusts and grasshoppers, a menace whichthreatens to assume disastrous proportions insome areas. Since October 1985, FAO hasincreased its efforts to counter the locustthreat, and the Emergency Centre for LocustOperations was established in August 1986 tohelp mobilize funds and equipment andcoordinate action. Over 1 million hectares ofripening crops in the Sahelian countries ofWest Africa were protected by an aerialspraying campaign (see Box 2.2).
Therefore, the food supply situation of the1985/86 crop year was generally satisfactory inmost African countries. By early 1987, however,there were still problems that required urgentattention. They can be summarized as follows:
Priority to implement emergency controlprogrammes against grasshoppers and locusts,and the need for donors to provide additionalassistance at short notice;
Swap arrangements, triangular transactionsand local purchases to dispose of unutilizedsurpluses of cereals from 1985 harvests;
New food aid allocation needs in 1986/87.For 30 countries, still uncovered needs wereestimated at 1.2 million tons of cereals; theseinclude nearly 800 000 tons of emergencyassistance needed by five countries facingexceptional food emergencies (Angola,Botswana, Ethiopia, Lesotho and Mozambique);
Careful scheduling of the arrival ofundelivered food aid pledges; and
National and regional early warning and foodinformation systems to be established orstrengthened in many of the drought-proneareas.
LATIN AMERICA
Recent Food and Agricultural PerformanceFor the region as a whole, annual increases inagricultural output in the 1980s were markedlylower than during the 1970s. In per caputterms, recent food and agricultural growth rateseven turned negative, with only a few majorcropsnamely sugar, oilcrops andfruits showing any gains. Nearly all LatinAmerican countries experienced declininggrowth rates. Central American, Caribbean andAndean countries, however, were particularlyhard hit; their agricultural output during 1980-85increasing at barely half the average rate of the1970s.
Nevertheless, compared with non-agriculturalsectors, agriculture did relatively well. Totalagricultural production grew 1.4% a year during1980-86, while total GDP (measured in constantlocal currencies) declined 0.3% during 1980-84(Table 2.2). Apart from its inherent resilience inrelation to other sectors, agriculture escapedthe worst effects of the general economic crisispartly due to previous large-scale investmentsthat matured during the early 1980s.
Several countries, including Brazil, Argentina,Chile, Venezuela and Uruguay, appear to havereached the point in their development processwhere their agricultural labour force has slowlystarted to decline, pointing to an increase inlabour productivity.
The value of agricultural imports fellsignificantly, although by less than total imports,as a consequence of nearly equal declines inunit values and import volumes. The former fellbecause of the 1980-82 world recession, thelatter because of reduced import demand andcurrency devaluations, which reflected theregion's economic crisis and the policies thatwere combating it. The reduction in agriculturalimports was especially noticeable in Argentina,Brazil, Costa Rica, Guatemala, Honduras,Uruguay and Chile, though in the lattercountry, this was mainly due to greater levelsof self-sufficiency in wheat.
The value of agricultural exports also fell, butmuch less than imports. Export values fell, notbecause of decreasing export volumes, whichincreased at a rate similar to that of totalagricultural output, but because of falling unitvalues of export commodities. The reduction ofagricultural export revenue was particularlysevere in Bolivia, El Salvador and Trinidad andTobago.
As regards recent performance, food andagricultural production increased substantially in

Not
e: C
ount
ries
are
rank
ed w
ithin
cou
ntry
gro
ups
acco
rdin
g to
die
tary
ene
rgy
supp
ly (
DE
S)
leve
ls in
198
1-83
.
TA
BLE
2.2
. Lat
in A
mer
ica:
sel
ecte
d gr
owth
rat
es
(Per
cent
ages
)
Cou
ntry
/C
ount
ry g
roup
Pop
ulat
ion
1980
-86
Agr
icul
tura
lla
bour
1980
-86
Tot
al G
DP
1980
-84
Agr
icul
tura
lG
DP
1980
-84
Tot
al$
valu
e of
expo
rts
1980
-85
Tot
al$
valu
e of
impo
rts
1980
-85
$va
lue
ofag
ricul
tura
lex
port
s19
80-8
5
$va
lue
ofag
ricul
tura
lim
port
s19
80-8
5
Agr
icul
tura
lpr
oduc
tion
1980
-86
Foo
dpr
oduc
tion
1980
-86
Mex
ico
2.59
0.09
0.43
2.36
7.29
-11.
91-0
.60
-8.0
31.
331.
59
Bra
zil
2.23
1.52
-0.1
31.
955.
08-1
2.06
0.00
-12.
462.
973.
20
Trin
idad
&T
obag
o1.
602.
485.
19-1
.20
-13.
56-1
4.56
-9.6
8-0
.37
0.06
0.20
Cub
a0.
66-2
.35
0.0
0.0
2.83
5.91
2.19
-0.8
32.
652.
48
Jam
aica
1.46
-5.5
71.
312.
00-9
.98
-2.3
02.
44-1
.24
3.18
3.18
Cos
ta R
ica
2.63
1.42
-0.8
02.
05-0
.80
-4,9
6-1
.13
-8.4
31.
530.
57
Dom
inic
an R
epub
lic2.
343.
212.
233.
33-6
.21
-3.1
7-5
.58
-1.3
22.
442.
58
Guy
ana
1.94
-2.7
2-5
.18
-2.5
8-1
3.63
8.15
-14.
75-1
4.19
-1.7
7-1
.74
Pan
ama
2.18
0.68
3.56
3.47
-3.9
2-1
.51
-2.8
90.
361.
130.
45
Nic
arag
ua3.
400.
692.
184.
67-7
.01
-2.6
1-6
.64
-2.0
50.
611.
14
Gua
tem
ala
2.86
1.99
-1.7
3-1
.49
-3.5
3-6
.46
-4.7
3-6
.63
0.00
1.53
Hon
dura
s3.
403.
070.
232.
03-0
.04
1.23
-1.6
3-1
0.18
1.75
0.93
El S
alva
dor
2.99
2.80
-2.8
9-3
.43
-2.8
40.
88-7
.46
-3.3
9-1
.06
0.78
Hai
ti2.
560.
91-1
.12
-1.6
4-0
.61
5.95
-1.3
2-1
.89
1.37
1.19
CE
NT
RA
L C
AR
IBB
EA
N2.
271.
381.
931.
84-3
.60
-0.7
6-0
.86
-2.0
51.
031.
13
Ven
ezue
la2.
860.
44-
1.93
0.83
-5.4
1-1
2.09
19.1
8-4
.08
1.04
0.73
Chi
le1.
58-0
.16
-2.6
90.
92-2
.76
-13.
134.
75-1
9.29
2.08
2.10
Col
ombi
a2.
16-2
.81
1.67
1.05
-0.3
0-4
.35
-2.7
9-3
.80
0.90
1.49
Per
u2.
62-0
.01
-1.6
41.
863.
07-7
.81
1.09
-12.
862.
582.
91
Bol
ivia
2.73
2.33
-5.8
4-
4.35
- 7.
56-2
.56
-21.
98-3
.02
0.60
0.78
Ecu
ador
2.91
2.37
0.72
-1.5
01.
83-2
.67
-1.1
02.
942.
802.
33
AN
DE
AN
2.42
-0.2
2-1
.11
0.37
-3.1
3-9
.12
-1.4
8-7
.00
1.69
1.73
Arg
entin
a1.
58-0
,77
-1.6
73.
90-0
.13
-17.
970.
95-1
7.37
1.30
1.31
Par
agua
y3.
012.
270.
48-0
.76
0.35
- 1.
205.
64-9
.27
3.08
2.55
Uru
guay
0.71
- 4.
59-4
.40
-3.0
2-5
.95
-18.
25-7
.11
-12.
820.
600.
06
SO
UT
HE
RN
CO
NE
1.65
-0.1
5-1
.66
3.47
-0.7
1-1
7.05
0.53
-15.
961.
681.
30
LAT
IN A
ME
RIC
A2.
300.
77-0
.34
1.79
0.88
-9.2
3-0
.41
-7.4
41.
391.
43

1984 and 1985, the increase in the latter yearbeing significantly higher than the average rateof the 1980s. Brazil, Ecuador and Venezuela hadparticularly high growth rates, while Peru, Haiti,Nicaragua and Costa Rica suffered declines.However, 1986 was another disappointing yearfor Latin American agriculture. After theencouraging performance of the previous twoyears, agricultural output fell again,approximately 1.50/0 below the level of 1985.Food output declined nearly 2% in per caputterms, reflecting poor harvests in most majorstaples, with the notable exception of roots andtubers. Food production kept pace withpopulation growth in only four countries: Chile,Colombia, Argentina and Uruguay. On theother hand several countries, already affectedby severe food supply and nutritional problems,experienced losses of 30/e to 8% in per caputfood output (Bolivia, Ecuador, Nicaragua and ElSalvador). Non-food crops showed even morepronounced losses: oilcrops, 11%; fibre crops,
21%; and primary stimulants, 21%.Natural factors played an important role in
the overall poor agricultural performance ofLatin America during 1980-86. An unusuallyunfortunate period of climatic and other naturaldisasters affected the region in the early 1980s,followed more recently by prolonged dry spellsin Brazil, floods in Argentina, and food supplydisruptions caused by the Mexican earthquakeand the volcanic eruption of Nevado del Ruizin Colombia. Such events, however, onlypartially explain the shortcomings. Various formsof government intervention in agriculturaldevelopment, played an equally important rolealong with policy changes imposed by theeconomic crisis.
Characteristics of Agricultural PoliciesPublic policies influencing agriculture during thisperiod were traditionally characterized by anurban-industrial bias that placed the agriculturalsector in a secondary position. There was atendency to favour commercial agriculturalproduction and exports of agro-industrialproducts (e.g., feed-grains, oilseeds and foodcommodities) destined for urban markets.
Public policies also favoured "cheap" foodsupplies, while stimulating economic activity inurban areas, and allowed food imports, whichoften competed with domestically growntraditional foods. Industries were, at times,excessively protected, and national currenciesovervalued in order to promote industrialgrowth, seen as the "engine" of development.With inadequate links between domestic
agriculture and other sectors, a considerablepart of the domestic demand for agriculturalproducts was met by food imports.
Within agriculture, the bias toward large- andmedium-scale enterprises was evident in publicinvestments, pricing, resource allocations for thedevelopment of science and technology,mechanization and allocation of credit. Theneglect of the small, traditional farmer resultedin imbalanced patterns of agriculturalproduction and income distribution. These wereonly partially compensated by land reformmeasures, which in any event lost momentum,and by rural development and credit schemes.
Adjustment Policies and the Agricultural Sectorin the 1980sMacro-economic measures, including monetary,fiscal, exchange rate, commercial and wagepolicies, have had an impact on agriculturalperformance comparable to policies specificallydesigned for the sector. In fact, agriculturalpolicies were often attempts to correct theundesired effects of macro-economic policies.This clearly has been the case since the early1980s, a period dominated by acute internaland external disequilibria.
Agricultural policy adjustments tended to beproduct-specific and did not fit any definitepattern. They were often applied within theframework of overall economic strategies thatwere increasingly market-oriented (price andinterest rate liberalization, cuts in subsidies,privatization of marketing enterprises, etc.). Incountries where a liberal economic policy wasmore rigorously followed, the need for moreflexibility and pragmatism eventually becameevident. Also, many traditional forms of stateintervention were re-established.
Specific measures included a significantdecrease in the availability of credit and adrastic increase in its cost. Interest ratedifferentials in favour of agriculture often wereabandoned, except for certain products,producers or areas. For example, since 1981,Brazil has gradually reduced subsidies, curtailedcredit allocations to agriculture, and in 1984,indexed interest rates at 3% above the full rateof inflation. In Argentina, Uruguay and Chile,public credit was reduced in the late 1970s andcommercial, short-term credit became moreimportant. Interest rates were deregulated andthus became extremely high in real terms.
Adjustment measures included budgetaryrestraint. For example, in Mexico, the publicsector deficit was reduced from 17.6% of GDPin 1982 to 8.9% in 1983, and to 6.9% in 1984,

although it rose again to 9.9% in 1985.Similarly, Brazil reduced its public sector deficitfrom 6.2% of GDP in 1982 to 2.7% in 1983and achieved a surplus of 0.2% in 1984.
Apart from a few countries that increasedpublic revenues, reductions in the public deficitresulted from sharp cuts in current and capitalpublic expenditures, including long-terminvestment of crucial importance for agriculture.While the effects of the crisis were initiallylessened by investment and technologyintroduced during the 1970s, recent investmentcuts will inevitably reduce the momentum ofagricultural development in the near future.
Savings in public sector expenditure onsalaries and numbers of employees contributedto the deterioration of the quality of technical,educational and health services to ruralpopulations, although programmes that weretied to external financing tended to bemaintained. There was also a widespreadreduction or abolishment of subsidies on staplefoods and agricultural inputs.
Although measures to increase tax revenuesdid not have important direct effects onagriculture, higher prices of public or parastatalservices did raise agricultural production costs.
In most countries, income policies resulted indecreases in employment and wages, increasesin inflation and consequently, large reductionsin the purchasing power of wage-earners. Thenegative impact on food production of lowerreal incomes and higher food prices whilesmaller than in other sectors with higher priceand income elasticitieswas neverthelessconsiderable. Agricultural and particularlyoccasional workers, who have become soimportant in the region's agriculture, sufferedgreatly from falling real wages and intensifiedcompetition in the labour market.
Massive devaluations, the main instrument toincrease the prices of imports and stimulateexports, were major factors behind the large fallin imports of food, fertilizers, pesticides andagricultural machinery. The reduction ofimported inputs had significant negative effectson agricultural productivity.
Devaluations also combined with specificexport promotion policies to favour agriculturalexports. In some countries, exports ofagricultural goods increased because of reducedinternal demand, as in the case of meat.
Although increases in the relative prices ofimports sometimes led to import-substitution, itis too early to assess the long-term viability ofthis process.
The social pressures emerging from the crisiscontributed to a growing recognition of the
need for food security policies. In some cases,these consisted of food distribution programmesfor needy groups. In others, they took the formof interrelated rural development and nationalfood and nutrition plans.
Although the crisis has prompted cancellationor reduction of many of these programmes,interest in them has recently re-emerged.Examples are the Brazilian and Peruviandevelopment plans, the Mexican national foodprogramme (PRONAU, and the distributionprogrammes to help low-income families inArgentina, the Dominican Republic, Jamaica andUruguay.
57

58
BOX 2.3
FAO's in-depth study onagriculture in Latin Americaand the Caribbean
One of the main outcomes of theNineteenth FAO RegionalConference for Latin America andthe Caribbean, held in Bridgetown,Barbados, 5-13 August 1986, wasthe request made to theOrganization to carry out anin-depth study on the potentialand long-term prospects foragricultural development in theregion.
The request emerged from thecritical economic situation facingmany countries in the region sincethe early 1980s, the deteriorationin their food and agriculturalsituations, and the perceived needfor a plan of action coveringnational efforts as well as the roleof the international community.
A number of factors in therecent evolution of the region'sagricultural sector have underlinedthe need for such a study. First,the sharp deceleration ofagricultural output growth in theearly 1980s after more than twodecades of sustained growth.
Second, the persistence ofstructural problems andimbalances, which modernizationof the sector has not overcome.Paramount among these are: anincreased dualism between modernand traditional agriculture; thecontinuation of severe poverty inmany rural areas; persistentmalnutrition; rapid environmentaldegradation of the ecologicallyfragile rain-forest areas; andincreased food dependency thatonly the drastic macro-economicadjustment measures of recentyears have been able to reduce,albeit at a high cost.
Third, the difficulties faced byagricultural exports of the region inworld markets. These derive mainlyfrom widespread protectionistpolicies, and the use of subsidiesand other means to promoteexports, together with thetechnological advantages ofdeveloped country producers. Therapid growth of substitutes hasalso reduced market opportunities.The short-term prospects in mostworld agricultural markets ofinterest to the region are bleak.
Fourth, the urbanizationexplosion has created newfood-marketing needs, contributingto the reshaping of food markets,
the greater importance of foodindustries, the growth of foodimports, the change in overall foodconsumption patterns and a movetoward more product specializationboth at farm and subregionallevels.
Finally, the current economicand financial crisis. The constraintson developmental publicexpenditure, foreign exchangerestrictions for importing food andagricultural inputs, stagnation ofdomestic demand for food and avirtual halt of foreign capitalinflows, brought about by thecrisis, have set back agriculturaldevelopment and nutritionalimprovements.
Against this background, thepurpose of the study/plan is toprovide an assessment of thecurrent agricultural situation, topresent possible scenarios up tothe year 2000, and to offer a planof action for solving the majorfood and agricultural developmentproblems of the region. In doingso, the study will highlight theimportance of these problems andoptions for remedying them for theinternational community, andhence, help to attract additionaltechnical and financial assistanceto the region.
The study will be formallypresented at the next FAORegional Conference for LatinAmerica and the Caribbean, to beheld in October 1988.

FAR EAST
Recent Food and Agricultural PerformanceFood production in the region, including China,rose almost 4% a year, and per caputproduction by 2.7% a year during 1980-86.China recorded spectacular annual gainsapproaching 6% a year or 4.4% abovepopulation growth (Table 2.3). A considerableexpansion in food and agricultural output wasalso achieved in India (about 4% a year),resulting in plentiful supplies of cereals, cottonand tea, and a substantial increase in theproduction of edible oils. Nevertheless, thevalue of agricultural exports stagnated despiterapid growth for China.
Food production did not grow as fast aspopulation in only a few countries, includingBangladesh, Sri Lanka and the Philippines,mainly because of floods, typhoons andunfavourable monsoon conditions. Anothernegative factor, particularly in the case of thePhilippines, was the disruption imposed byeconomic difficulties on farm credit, imports ofinputs and consumer demand. The slowdown infood production in these countries during theearly 1980s should be considered, however,against their generally successful long-termperformances. Conversely, the relatively stronggrowth in food output in Nepal should notconceal the fact that this country, togetherwith Democratic Kampuchea, is still amongthose facing the most serious food shortages inAsia.
In the region as a whole (excluding China),agricultural GDP increased 3.7% a year during1980-84, or approximately two-thirds that oftotal GDP. The agricultural labour forceexpanded only moderately (0.8-1.8% a year inthe subregions), implying an increase inagricultural value added per caput more than1% to over 3% a year. The growth of labourproductivity in Southeast Asia appeared to besubstantially faster in agriculture than in therest of the economy, while the opposite heldtrue in South Asia. China and the Republic ofKorea showed extremely fast increases inagricultural GDP among the fastest in theworld during 1980-84coupled with actualdeclines in the number of people employed inagriculture in the latter country.
Variations in these productivity and incomelevels reflected changes in the terms of trade ofagriculture compared with the rest of theeconomy, which were strongly influenced bypolicy interventions in support of agriculture or,vice versa, by the amount of resource transfers
from agriculture to the rest of the economy.The impact of such factors can only beadequately observed in a longer time periodthan that covered in this review. Nevertheless,it appears that in South Asian countries andChina, efforts to shift terms of trade in favourof agriculture, particularly through more flexibleproducer price policies, have been fairlysuccessful since the late 1970s.
For a large majority of countries in the FarEast, 1986 was another good agricultural year,which consolidated the remarkableimprovement in food supply achieved by manyof them since the early 1980s. All countries inthe region recorded further gains in per caputfood production except Sri Lanka, Bangladesh,Nepal and Brunei. On the other hand, severalof the most populated countries (China,Malaysia, Pakistan and India) achieved gains of2% to nearly 6%, the latter being among thehighest of all developing countries.
The overall growth in agricultural productionin 1986 (1.8%) resulted from gains in foodcrops (2.7%) and livestock products (3.8%),more than outweighing a fall of nearly 8% innon-food products. In particular, output of fibrecrops, of considerable importance for exportearnings of some countries in South Asia, fell16%.
Emerging Issues and ProblemsAlthough the recent progress of agriculture hasbeen impressive, internal conditions in thesector and its relative position in the economycontinue to create problems. In severalcountries, progress in both output and incomein agriculture remain relatively slow. Also,several countries are experiencing difficultieswith the intricate problem of adjusting supplyto demand.
Grain surplusesa welcome development ina food security context have emerged as aproblem in countries like China, India, theRepublic of Korea and Indonesia. In thedepressed price situation currently prevailing inworld agricultural markets, these surpluses canneither be exported without subsidies, nordisposed of internally without reductions inmarket and support prices, or through costly,difficult to administer, targeted distributionprogrammes.
Furthermore, the persistance in some of thesecountries of massive pockets of malnutritionamong low-income groups indicate thatagricultural surpluses persist because of a lackof effective market demand. In India, financialand administrative constraints limit the use of
59

TA
BLE
2.3
. Far
Eas
t: se
lect
ed g
row
th r
ates
(Per
cent
ages
)
Not
e: C
ount
ries
are
rank
ed w
ithin
cou
ntry
gro
ups
acco
rdin
g to
die
tary
ene
rgy
supp
ly (
DE
S)
leve
ls in
198
1-83
.
Cou
ntry
/C
ount
ry g
roup
Pop
ulat
ion
1980
-86
Agr
icul
tura
lla
bour
1980
-86
Tot
al G
DP
1980
-84
Agr
icul
tura
lG
DP
1980
-84
Tot
al$
valu
e of
expo
rts
1980
-85
Tot
al$
valu
e of
impo
rts
1980
-85
$va
lue
ofag
ricul
tura
lex
port
s19
80-8
5
$va
lue
ofag
ricul
tura
lim
port
s19
80-8
5
Agr
icul
tura
lpr
oduc
tion
1980
-86
Foo
dpr
oduc
tion
1980
-86
Bru
nei
4.53
-17.
710.
00.
0-8
.81
0.75
-32.
445.
182.
342.
34
Fiji
1.86
-1.3
80.
480.
79-8
.77
-6.4
0-1
3.78
-0.9
61.
521.
55
Kor
ea R
ep.
1.60
-1.2
77.
467.
7911
.50
6.56
-10.
69-5
.09
4.07
4.30
Hon
g K
ong
1.92
-2.0
76.
16-1
.21
8.81
5.46
14.1
6-0
.09
0.16
0.16
Sin
gapo
re1.
16-0
.99
7.89
-0.6
03.
741.
655.
024.
391.
231.
31
Mal
aysi
a2.
451.
736.
353.
285.
884.
122.
652.
523.
244.
25
Indo
nesi
a1.
950.
614.
704.
05-5
.28
-1.5
71.
34-1
1.27
3.28
3.33
The
Phi
lippi
nes
2.42
-0.0
71.
011.
21-3
.71
-5.8
2-1
0.15
-2.8
61.
011.
02
Tha
iland
1.98
1.70
5.44
3.47
1.54
0.49
-2.3
7-1
.66
3.50
3.35
Pap
ua N
ew G
uine
a2.
593.
180.
643.
15-0
.92
-2.9
43.
54-7
.76
2.13
2.43
Mac
ao4.
06-2
4.32
0.0
0.0
8.14
6.17
26.1
03.
20-0
.63
0.63
EA
ST
+S
OU
TH
-EA
ST
AS
IA2.
010.
665.
494.
153.
842.
89-0
.50
-2.1
63.
934.
08
Bur
ma
1.96
1.08
5.65
6.05
-9.3
0-7
.57
-11.
80-8
.91
5.96
6.04
Sri
Lank
a1.
771.
455.
184.
177.
12-0
.04
5.23
-3.9
0-0
.37
-1.0
0P
akis
tan
3.01
1.97
5.84
1.56
0.41
3.53
-9.6
711
.91
3.90
3.40
Nep
al2.
352.
173.
824.
008.
308.
03-1
9.57
1.51
2.79
2.92
Ban
glad
esh
2.75
3.34
3.28
2.44
6.60
3.75
4.19
2.64
2.21
2.11
Bhu
tan
2.04
2.01
0.0
0.0
0.0
0.0
1.31
6.56
2.35
2.39
SO
UT
H A
SIA
2.65
2.48
5.12
2.86
2.44
2.66
-3.6
05.
262.
872.
74
Indi
a1.
93-0
.02
4.66
2.82
-1.0
0-2
.85
-3.9
73.
994.
084.
20
Chi
na1.
23-2
.06
8.94
10.0
96.
3010
.32
10.7
2-1
9.99
5.87
5.66
FA
R E
AS
T1.
72-0
.58
6.48
6.28
3.87
3.48
0.54
-4.9
33.
653.
67

surpluses in subsidized distribution programmesto alleviate malnutrition, although -major effortshave been made in this area. In the case ofChina, while the problem of malnutrition hasbeen largely overcome, the burden of grainsurpluses mainly derives from limitations instorage capacity, congested internal transportsystems and inadequate processing facilities.
Policy-makers are being faced with anextremely difficult dilemma. On the one hand,they have to confront immediate concerns forfood security, remunerative returns to farmersand alleviation of poverty, many of which canonly be answered in the short run byprotectionism and subsidy programmes. On theother hand, it is evident that lasting solutionscall for reforms aimed at structural adjustment,particularly in countries that have not yetreached the stage of food self-sufficiency. Theawareness of this need has supported varyingdegrees of boldness in policy action. In China,the new stage of agricultural reforms includeattempts to improve the marketing system bylimiting the government's role in pricing andprocurement, and by liberalizing farmgate andretail prices.
While no comprehensive package of reformshave been implemented in other surpluscountries, budgeting pressures and the need toreduce burdensome stocks have imposedreduced public involvement in food marketingand distribution. In the Republic of Koreasupport is shifting from staple foods towardvegetables and forage crops involvingreductions in price support for wheat andpossibly rice. A similar situation has developedin Indonesia. The production intensificationprogrammesthe basis of generating thecountry's rice surpluses are now being shiftedto secondary crops. In India, measures toreduce stocks include an expansion of targeteddistribution such as food-for-work programmesand a gradual liberalization in cereal trading,which may eventually reduce the share ofproduction handled by the government.
In general, however, policy-makers have notalways been able to adapt their policies to arapidly changing internal and externalenvironment. This has accounted for anon-integrated policy approach, with agriculturalpolicy measures not always complemented bywider and coordinated action. At the sametime, policy measures have not been sufficientlydifferentiated according to the problems ofagriculture- in different areas and localities, noraccording to available technology.
In the coming years, agricultural developmentand adjustment policy measures will be severely
61
constrained by financial difficulties. Inadequatesavings mobilization, budgetary deficits,precarious balance-of-payments positions anddeclining concessional financing are placingincreasing pressure on investment budgets.Although agriculture is a priority area in mostcountries, and other sectors may be moreaffected by stringency, cuts may also provenecessary in agricultural financing, raisingquestions on the region's ability to sustain theremarkable production achievements of thepast decade.
Budget constraints in Indonesia reduced thenumber of its agricultural development projectsfrom 458 in 1985-86 to only 273 in 1986-87.Public sector allocations for agriculture in 1985rose only slightly in Pakistan, where badweather has contributed to this countryencountering difficulties in meeting its 1984-88production targets for some food commodities.A negative climate for savings-investment alsoprevails in Bangladesh due to the country's veryweak export, savings and tax bases, while theneed to incur large debts to financecommercial food imports in recent years is alsoimposing austerity.
Liquidity problems are affecting evencountries with the highest regionalsavings-investment ratios. In the case of India,only limited incremental gains in savings can beexpected, while investment from alternativesources such as exports and external borrowingare constrained by the economic and financialenvironment. At the same time, efforts toliberalize trade have had the short-term effectof adding to the import bill.

62
BOX 2.4
Growth, equity and povertyin the Far East
Any inter-country comparison ofsocio-economic performance issubject to major conceptual,statistical and definition problems.Even in limited geographical areas,widely varying country situationscan be found with regard toresources, constraints and policiesaffecting performance. Inter-countrypeformances can also greatlydiverge according to the sectorsand time periods studied.
Bearing these limitations in mind,a recent FAO study compared theexperiences of 11 countries in Asiaduring the last 23 years.' Sixteenindicators of performance relatedto economic growth, incomedistribution and social welfare wereexamined.
Although the study reviewedsocio-economic performances in abroad sense, agriculture was acentral element of the analysis.The sector, which remains a majorcomponent of the economies ofmost countries in the region, hasseveral growth indicators related toit, such as agricultural GDP, foodand cereal output, etc. Similarly,the analyses of distributionindicators, such as incomeinequality and the incidence ofpoverty, are largely based onfactors related to agriculture, suchas expenditures on food anddistribution of landholdings. Socialindicators include an analysis ofthe nutritional levels of thepopulations.
The performance ranking of thecountries reviewed, according to astandard system of weighting thedifferent indicators, was as follows(composite index numbersindicating quantitative differencesare shown in parentheses):
Highest performance:Republic of Korea (160),Malaysia (145);
Above average:Thailand (112), China (109);
AveragePhilippines (99), Indonesia (98);
Below average:Sri Lanka (91), Pakistan (85),India (78);
Lowest.Bangladesh: (62), Nepal (61).
It was observed that poorperformers were predominantlyagricultural countries (Nepal, 59%and Bangladesh, 47%), as thecontribution of agriculture to totalGDP was highest for them.Conversely, the share of agriculturewas lowest, and that of industryhighest, for the best performers(Republic of Korea, 14% andMalaysia, 21°/o).
A very strong relationship wasfound between GDP growth rateand performance, and per caputGDP and performance. Therelationship between performanceand social indicators was also high,but less so for distributionindicators.
The very close relationshipbetween GDP and performanceconfirmed the importance ofadequate growth, not only ingenerating income and investment,but also, in many cases, increating conditions for reducinginequality and improving socialwelfare. This is subject to somequalification, however, in view ofthe variety of country situationswith regard to the consistency oftheir performances. These rangedfrom:(a) all-around poor performance(Nepal and Bangladesh both hadthe lowest ranking in nearly allcomponent indices); (b) relativelybalanced development, but below
average performance (Sri Lanka,Pakistan and India); (c) imbalancedaverage performance, with higherinequality and population growthrate and better social measures(the Philippines) or with higherlevels of growth, but lesserachievements in social aspects andequity (Indonesia); and (d) balancedpositive performance (Republic ofKorea, Malaysia, Thailand andChina, countries with widelydifferent ideological and policyorientations, but an equally strongcommitment to public sectorpolicy). The Republic of Koreaachieved the highest degree ofperformance, followed by Malaysiaand Thailand, all developing marketeconomies; while China, a centrallyplanned economy, despite startingfrom a lower level of development,was able to attain fourth rankingoverall in performance.
1 FAO, Growth, Equity and Poverty in Asia:
Comparative Country Performances, ESP
(1987).

NEAR EAST
Recent Economic and Agricultural PerformanceExtremely varying country situations are foundin the Near East with regard to economic andagricultural performances, as can be expectedfrom the region's wide disparity in resources,production systems and policy stances. Themost striking recent economic developmentsoccurred in oil-exporting countries, which faceda precipitous fall in export earnings from oilcaused by a collapse in international fuel prices.Nearly all oil-exporting countries experienced amarked fall in GDP. With export earnings falling19% annually, oil exporters resorted to stringenttrade adjustment measures. After a buoyantgrowth during the 1970s, merchandise importsdeclined nearly 2% annually in value termsduring 1980-85 (Table 2.4).
Reduced economic activity and employmentactivities in oil-exporting countries caused amassive reversal in the migratory labour flowsamong countries in the region. Since the early1980s, more than a million people wereestimated to have repatriated from Saudi Arabiaand about 70 000 from the Libyan ArabJamahiriya (see Box 2.5).
In non-oil exporting countries, the economicsituation was also largely linked todevelopments in the oil market. While lowerfuel bills provided financial relief and economicstimulus, an important source of gain forlabour-surplus countriesremittances fromexpatriateswere drastically cut. For a countrylike Egypt, relying on oil-linked revenues fromthe Suez Canal, another source of foreignexchange was heavily reduced. Furthermore,financial flows from abroad, in particular newloans from regional bilateral/multilateralfinancing agencies, became rarer, and severalcountries faced increasing problems of liquidityand indebtedness. On the whole, however, thegrowth in economic activity during 1980-84 wasrelatively sustained in non-oil-exportingcountries, except in several where theeconomic difficulties were aggravated by armedconflicts and civil unrest such as in Lebanon,the Syrian Arab Republic, the Sudan andAfghanistan.
As regards agriculture, productionperformances presented opposing features inoil-exporting and low-income countries. In theformer, agricultural GDP and food output roseparticularly fastin sharp contrast with the fallin total GDPreflecting highly subsidized policyaction to increase levels of food self-sufficiency.Between 1980 and 1984, agricultural GDP
63
expanded 22% in Kuwait, 9.3% in theUnited Arab Emirates and 8.3% in Saudi Arabia.Such results were achieved against harshnatural impediments to agriculture throughheavy infrastructural investment and massiverecourse to imported inputs and moderntechnology.
Agricultural performances, far more crucial inthe group of low-income countries, werenonetheless generally disappointing during1980-84, with only a few countries succeedingin expanding food output faster than populationgrowth. In this notoriously weather-dependentgroup of countries, where about 70% ofcultivated land is rainfed, performances wereerratic and suffered in particular from severedrought conditions in 1984.
In the region as a whole, 1985 witnessedgreatly improved weather and a remarkablerecovery in agricultural output. In Egypt,agriculture was one of the few bright spots inan overall depressed economy, as food outputrose 4.2% and expanded cotton output andexports provided relief to a difficult foreignexchange situation. Dramatic increases in foodoutput were also achieved by Iraq, the SyrianArab Republic, Jordan and the Sudan. SaudiArabia achieved several successive bumperwheat crops, generating exportable supplies aswell as problems of surplus disposal.
Recent estimates for 1986 point to a furthersubstantial rise in agricultural output in themain producing countries of the region. At5.8%, the estimated rise in food output in 1986would exceed that achieved in 1985, resultingin a cumulative gain of over 5% in per caputterms over the two years. Particularly dramaticwas the performance of Saudi Arabia whichachieved an annual average increase in foodproduction of 17.5% during 1980-86. Sizeableincreases in food output were also achieved inIraq and the Syrian Arab Republic in 1986,although in the latter country these onlypartially offset the losses in per caput foodproduction incurred during 1980-85.
The region's gains in agricultural output weremost pronounced in cereals, pulses and oil-crops. On the other hand, growth in livestockoutput fell well below long-term trends.
As regards agricultural trade, the wideninggap between food supply and demand in theregion caused imports to expand further,though at markedly lower rates than during the1970s. Cereal imports peaked in 1984 andaccounted for half of the region's totalrequirements. A moderate decline in cerealimports took place in 1985, but these mayagain rise in 1986.

TA
BLE
2.4
. Nea
r E
ast:
sele
cted
gro
wth
rat
es
(Per
cent
ages
)
Not
e: C
ount
ries
are
rank
ed w
ithin
cou
ntry
gro
ups
acco
rdin
g to
die
tary
ene
rgy
supp
ly (
DE
S)
leve
ls is
198
1-83
.
Cou
ntry
/C
ount
ry g
roup
Pop
ulat
ion
Agr
icul
tura
lla
bour
Tot
al G
DP
Agr
icul
tura
lG
DP
Tot
al$
valu
e of
expo
rts
Tot
al$
valu
e of
impo
rts
$va
lue
ofag
ricul
tura
lex
port
s
$va
lue
ofag
ricul
tura
lim
port
s
Agr
icul
tura
lpr
oduc
tion
Foo
dpr
oduc
tion
1980
-86
1980
-86
1980
-84
1980
-84
1980
-85
1980
-85
1980
-85
1980
-85
1980
-86
1980
-86
UA
E5.
9633
.47
-3.7
29.
25-8
.11
-6.5
9-1
7.60
-2.9
80.
00.
0
Kuw
ait
5.51
4.20
-2.5
422
.06
-11.
222.
60-9
.02
-1.0
80.
00.
0
Om
an4.
605.
660.
00.
03.
8410
.42
14.8
611
.00
0.0
0.0
HIG
H-I
NC
OM
E5.
3812
.71
-3.2
212
.78
-8.1
0-0
.70
-11.
73-0
.12
0.0
0.0
Liby
a3.
90-4
.69
-6.9
31.
72-1
2.61
-0.1
90.
0-3
.91
9.78
9.84
Sau
di A
rabi
a4.
224.
28-1
.20
8.32
-25.
32-0
.58
-1.3
9-1
.84
17.3
617
.52
Iran
2.91
1.62
0.0
0.0
0.46
-0.6
5-8
.87
2.73
1.38
1.26
Iraq
3.62
3.57
0.0
0.0
-11.
06-6
.66
-4.8
6-0
.04
4.69
4.57
OIL
-EX
PO
RT
ER
S3.
302.
47-2
.38
6.85
-18.
97-1
.84
-5.4
8-0
.47
8.87
8.89
Cyp
rus
1.22
1.75
3.60
-0.5
1-1
.68
1.90
-0.9
40.
30-1
.00
-1.0
0T
urke
y2.
08-1
.19
4.65
2.57
19.6
47.
11-0
.15
14.8
32.
172.
28
Syr
ia3.
625.
502.
37-2
.14
-4.7
3-2
.00
1.51
5.97
1.38
0.97
Leba
non
0.28
-9.2
70.
00.
0-5
.59
-0.3
3-1
5.70
-5.8
33.
263.
46
Jord
an3.
798.
005.
986.
844.
910.
33-1
1.82
1.15
2.44
2.61
MID
-IN
CO
ME
2.32
-0.2
24.
111.
268.
692.
80-1
.47
3.42
1.70
1.72
Egy
pt2.
452.
485.
661.
822.
7113
.08
0.50
6.68
2.59
3.42
Dem
ocra
tic Y
emen
2.83
5.07
-0.7
8-1
3.98
-2.5
31.
28-9
.22
-0.2
60.
630.
28
Afg
hani
stan
1.02
1.63
0.0
0.0
5.15
8.08
-9.0
4-7
.32
0.08
0.03
Yem
en A
rab
Rep
.2.
772.
2810
.10
0.59
-0.9
5-8
.31
-35.
14-1
.02
4.45
4.57
Sud
an2.
892.
881.
23-0
.54
0.40
-7.0
2-4
.51
-5.0
32.
842.
43
LOW
-IN
CO
ME
2.32
2.45
5.31
1.10
2.00
6.07
-2.7
04.
152.
172.
23
NE
AR
EA
ST
2.67
1.79
0.09
2.02
-14.
400.
05-2
.52
1.26
4.08
4.11

BOX 2.5
Labour mobility in the NearEast
International labour migration, acommon and long standingphenomenon in countries of theNear East region, has increasedsignificantly since the early 1970s.Migration, largely from non-oil tooil-exporting countries, intensifiedby the end of the 1970s and intothe 1980s. With the end of the oilboom, however, it reversedabruptly and large-scalerepatriations have taken place.
During the first phase, theeconomic boom enjoyed byoil-exporting countries broughtabout a massive increase in theirinvestment programmes andassociated labour requirements. Forneighbouring low-income countries,such demand for additionalmanpower was both a source ofbadly needed foreign exchange, inthe form of remittances, and anopportunity for their surplus labourto be absorbed.
The growing flow of thisexpatriate workforce ended upassuming major proportions.Although estimates differ on thenumber of expatriate workers inoil-exporting countries, those fromother Near East countries mayhave reached over 4.5 million bythe early 1980s. About 70% ofthese were temporary workers. Amajor movement of South Asianimmigrants also took placc Indianand Pakistani nationals accountingfor about 23% of the total labourforce.
In recipient countries, thenumber of expatriates reachedconsiderable numbers in relation tothe local labour force and, in somecases, to the country's totalpopulation. For example, in theearly 1980s, as much as 90% ofthe total population in the UnitedArab Emirates was expatriate, and70% in the Gulf states of Kuwaitand Qatar. Although theproportion was smaller in otherrecipient states, expatriates stillaccounted for half of the domesticlabour force in Oman andone-third in Saudi Arabia.
The phenomenon of labourmigration, and the remittances itcreated yielded unquestionableeconomic and social benefits forlabour-surplus countries. Itimproved current accountbalances, boosted savings andinvestment in domesticconstruction, and improved accessto foreign technology. However, italso had a negative impact onagriculture in some respects, as asubstantial part of the agriculturallabour force of these countries wasinvolved. For instance, it is
estimated that farmer migrantsfrom the Yemen Arab Republictotalled 14% of the totalagricultural labour force, and thosefrom Jordan one-third of the total.
For these countries which,together with Egypt, contributedmore than 75% of the migrantworkers within the Near East,migration caused severe labourshortages in agriculture and, insome cases, transformed thepatterns of production. Forexample, production oflabour-intensive crops, such aswinter wheat, declined in Oman;unusual scarcities of labour duringthe harvest season affected cottonpicking in the Sudan; "Qat"narcotic leaf increasingly replacedcoffee, with a virtual collapse ofthe terrace system in the YemenArab Republic. At the same time,migration also resulted indistortions in the labour market, astrained workers tended to migratein relatively larger numbers thanunskilled workers.
The fall in oil prices, combiningwith the completion of a largenumber of infrastructural projectslaunched during the 1970s and
65
early 1980s, resulted in a sharp fallin labour needs. Since 1984 about150 major contracts with foreigncompanies have been cancelled inthe Libyan Arab Jamahiriya and70 000 expatriates have returnedhome. A more large-scalerepatriationover a millionworkers has begun in SaudiArabia. Other oil-exportingcountries are preparing themselvesfor similar movements ofrepatriation.
It is still too early to assess thenet effect of these movements onlabour-surplus countries. On theone hand, the influx of new skillsand experience and privateinvestment in foreign currency byrepatriates, are boosting theireconomic activity. On the other,the suddeness and massive scaleof the repatriation prevents anearly, complete and orderlyreabsorption of even skilled labourinto the domestic work force.

66
Emerging Issues and ProblemsThe economic and financial difficulties that havedeveloped during the 1980s have requiredmajor economic adjustments. Most oil-exportingcountries, notably Saudi Arabia and the LibyanArab Jamahiriya, are gearing themselves forausterity measures which are bound to havewider repercussions throughout the region. Inthese countries, there has been a massivedecrease in public expenditure to reconcilebudget deficits, while the declining trend in theconstruction industry, which emerged in theearly 1980s, has been sharply accentuated sincethe recent decline in oil prices.
In the short run, however, the need foradjustment is likely to affect more the extentthan the nature of the government'sinvolvement in food and agriculture. In order tostimulate production and achieve higher levelsof self-sufficiency, the oil-exporting countries willcontinue to provide subsidized inputs, albeit atgradually reduced levels, as well as incentiveproducer prices. In the near future, consumersin high-income countries will continue tobenefit from large food price subsidies, throughvarious food-import and distribution systems.The maintenance of food subsidies will be moreof a challenge for low-income countries, manyof which are facing overwhelming budgetaryproblems.
As government policy options are constrainedby the region's tradition of providing readyaccess to cheap food, shifts in consumersubsidy policy can only be implementedgradually to avoid widespread publicdisapproval, as has occurred in the past insome countries. For instance, while Egypt hasrecently allowed price increases for wheat flourand bread, social pressures have preventedsharp increases in prices. A closerre-examination and rationalization of consumerfood subsidies appears however inevitable, inview of the drain on resources represented bythese subsidies, which comprise a largeproportion of public expenditure.'
With regard to measures affectingproduction, the recent crisis has increasedawareness among policy-makers that agriculture,which is not a depletable resource like oil, mayoffer the best long-term guarantees ofdevelopment and social welfare.
The region's agricultural production potential
8 Budgetary expenditure on consumer food subsidies in the
late 1970s accounted for about 7% of total public expen-diture in Saudi Arabia and 1 7 % in Egypt.
has yet to be fully utilized. Since most of theregion's agriculture is rainfed, efforts to increasefood production entail reducing the level of riskand uncertainty that arise from unfavourableagro-climatic conditions. In most countries ofthe region, quicker returns are being sought byrevamping and strengthening present irrigationschemes and streamlining ongoing projects, soas to avoid the high costs of new investmentprojects.
In view of the variability in production in thedifferent subregions, an effective early warningsystem has yet to be set up, which wouldprovide reliable information and forecasts offood requirements and availability. Food securitywill also necessitate further establishment andmaintenance of strategic reserve stocks as inthe Syrian Arab Republic and Iraq.
Price policies, a major factor behind recentagricultural performances and consumer welfare,have become an extremely difficult issue, inview of increasing pressure on scarce financialand management resources. Whatever thechanges in the nature and extent ofgovernment intervention, it remains essentialthat the continuity and credibility of supportprice measures be preserved. The need forausterity and rationalization constitutes achallenge, but also an opportunity to improvecoordination of institutions involved in domesticprice policy formulation.
The attainment of self-sufficiency in foodremains a difficult objective in the Near East,even in countries with high agriculturalpotential. Despite the decline in exportearnings, the growth in food imports in severalof the main agricultural producing countries inthe region still exceeds that of food productionduring the early 1980s. In volume terms, foodand agricultural imports have not beencurtailed significantly except for a few countrieslike the Sudan.
Although the growth in food imports inoil-exporting countries has generally deceleratedin recent years, it is unlikely to be significantlyreduced in the short-medium term. Foodimports in these countries only account for amodest share of total imports (about 15%) andtheir reserves (which declined in early 1986 forthe first time since the oil boom), remainsufficiently ample to sustain import needs. Inaddition, investment cuts, and the resultingsavings in labour and machinery imports, willcreate alternative sources for financing foodimports.
The maintenance of high imports of food willpresent far greater difficulties in low-incomecountries and those dependent on foreign

exchange remittances and other transfers (e.g.,Egypt, Jordan and the Yemen Arab Republic).Recent austerity measures in Egypt included asharp cut in imports of commodities deemednon-essential, such as frozen beef and poultry.It has only been through food aid that Egypt'sfood imports have been maintained at highlevels in recent years.
Agricultural policies have tended toemphasize one food commodity, wheat, to thedetriment of coarse grain and other staples.However, the income benefits that spreadthroughout the region during the oil boom,brought about a significant shift in foodconsumption patterns, especially towardlivestock products. This new demand widenedthe gap between supply and requirements offeed grain and became a financial burden thatmay assume considerable proportions in themedium/long term. Although the response ofdomestic livestock production to the newdemand has been, in some cases, encouraging(e.g., Saudi Arabia, Iraq and the Syrian ArabRepublic), such expansion has often beenachieved through heavy imports of feed,veterinary equipment and technology,underscoring the region's deficiency in theseinputs.
DEVELOPED MARKET ECONOMIES
Performances in food and agriculturalproduction in the main groups of developedmarket economies are shown in Table 2.5. Withthe major exception of Japan, almost alldeveloped market economies experiencedsurpluses in agricultural production in the 1980sand were vigorously competing in worldmarkets. The result has been lower worldcommodity prices, yet because of a slowdownin demand growth, stocks have accumulated tohistorically high levels. Budget expenditure onagriculture has soared, particularly in the twomajor protagonists: the United States and theEEC. Until recently, it has been the UnitedStates that has reacted most strongly to thegrowing crisis. Other major agriculturalexporters, particularly Australia, New Zealandand Canada, also have seen export revenuesand farm incomes decline.
The United StatesThe US farm sector continued to producesurpluses in 1985 and 1986 despite a financialcrisis that saw farm prices of crops fall sharplyand the largest number of farmers and ruralbankers forced out of business since thedepression of the 1930s. One indication of theseverity of the crisis was the $240 000 milliondecline in the value of US farmland during1981-85.
Since the early 1980s, a number of factorshave combined to turn the financial andeconomic tide against US farmers. Theseinclude:
The combination of US monetary restraintand fiscal stimulus in macro-economic policiesthat raised interest rates. These, in turn,increased both farmers' costs and the value ofthe dollar, which slowed export demand for USfarm products. In addition, phased deregulationof US financial institutions, begun in 1980, hashad the effect of integrating farm and nationalfinance, thus making the farm sector morevulnerable to financial instability.
The 1981 Farm Bill was written during aperiod of high inflation, low real interest rates,rapid economic growth, expanding agriculturaland world trade, and widespread hunger inmany countries, with projections for thesituation to worsen. Cereal and cotton loanprices were set at sufficiently high levels thateffectively placed a floor under world pricesafter the world recession slowed demandgrowth. Domestic and foreign demand was not
67

68
TABLE 2.5. Developed market economies: annual rates of change in production of agricultural and food products,1984-86, and 1980-86
(Percentages)
United States and Canadab Australia and New ZealandSource: FAO, Statistics Division.
sufficient to absorb production, especially sinceUS prices were no longer competitive in worldmarkets. In addition, some agriculture-importingcountries became relatively more self-sufficientor became net exporters of agriculturalproducts.- World economic growth was sluggish andgrowth markets for US exports were hit by debtproblems depressing import demand in generaland demand for US farm products in particular.In 1985, US agricultural exports totalled $29 000million compared with $43 300 million in 1981.In fact, the United States had a monthlyagricultural trade deficit in May 1986 for thefirst time in 15 years.
The US Farm Security Act of 1985, whichcame into force in 1986, was discussed anddebated amid wide public concern over thefinancial position of farmers and the sharpdecline in exports. Its main purpose is to makeUS cereals and cotton more competitive inworld markets while protecting farm revenues.This is to be done mainly by lowering marketprice supports to a competitive level ininternational markets and increasing directincome transfers to producers. Farmers areencouraged to place land in a "long-termreserve" and are required to "set aside" landannually to be eligible for farm programmebenefits. The Secretary of Agriculture hasconsiderable flexibility in implementing the Act'sprovisions. This discretionary power will likelyresult in an intensification of domestic andforeign lobbying efforts to influence USdecisions on prices.
Besides competitive prices, the Act seeks toimprove US export quality, counter allegedunfair trading practices, remove foreign policy
constraints, reduce trade barriers throughGATT's multilateral trade negotiations, and makedecision-makers in the United States aware ofthe farmers' dilemmas brought about by fiscaland monetary policies outside their control.
Another feature of the 1985 Act is a policyon food aid, which involves promotion ofprivate enterprise in recipient countries throughPublic Law (PL)480. The minimum food aiddonation under Title ll of PL480 was raised from1.8 to 1.9 million tons.
Agricultural production in 1985 was abovetrend, mostly due to a record maize crop.While agricultural production in 1986 wasestimated to be 4% less than in 1985, stockswould continue to accumulate, particularly ofmaize which was expected to be the secondlargest crop in history. Maize stocks wereforecast to triple from 58 million tons in1984/85 to 171.5 million tons in 1986/87; whilewheat stocks were forecast to rise to 53 milliontons in 1986/87.
Total net farm income was $30 500 million in1985, over $2 000 million lower than theprevious year, while the figure for 1986 wasexpected to be somewhat lower than 1985,from $25 000 to $29 000 million. Nearlyone-quarter of 1986 farm income is expectedto come from government sources, accordingto US Department of Agriculture (USDA)estimates.
Nevertheless, USDA also forecasts thatconditions may improve for financially pressedfarmers in the country. During 1983-86, therewas a decrease of $20 000-22 000 million infarm debt. The USDA expects the debt/assetratio to stabilize and possibly even decline in1987-88, along with the interest cost/income
ItemNorth America a EEC
(12 countries) Oceania b JapanWestern Europe(excluding EEC)
1984-85 1985-86 1980-86 1984-85 1985-86 1980-86 1984-85 1985-86 1980-86 1984-85 1985-86 1980-86 1984-85 1985-86 1980-86
Agriculture 5.3 -4.3 0.9 -2.7 1.2 3.0 -1.4 2.1 0.2 0.2 2.3 -7.0 1.9 1.1
Food 5.6 -3.5 1.0 -2.8 1.1 1.1 -1.5 2.0 0.7 0.2 2.7 -7.2 1.9 1.1
Non-food 0.6 -22.0 -2.6 7.1 -2.6 4.0 12.8 -0.9 2.8 -7.4 1.6 -3.7 4.0 2.9 4.0
Cereals 10.2 -6.6 1.8 -8.1 -4.6 2.6 -10.5 -5.6 7.6 -1.2 -0.3 3.5 -9.5 4.0 2.6
Oil crops 10.3 -4.7 1.7 4.3 0.3 4.2 56.8 -14.4 13.0 -0.6 4.7 3.3 1.2 4.0 4.2
Livestock
products 2.4 0.5 1.2 -0.6 0.7 0.8 4.9 -0.4 0.5 3.4 1.2 2.5 -2.0 -0.5 0.8
Meat 1.8 0.3 1.2 -0.1 1.1 1.1 4.8 -0.2 -0.8 5.0 1.1 3.4 -2.1 -2.8 1.1

ratio, thus giving greater financial stability tothe farm sector.
Soil conservation has become an importantissue in the United States and is a majorprovision in the 1985 Farm Bill. It has beenestimated that 84 million farmland acres in thecountry are eroding at a rate faster than thatof regeneration. Forty-nine million of theseacres are eroding at a rate three times theirregeneration rate and are eligible for theConservation Reserve Programme (CRP). ByAugust 1986, 8.4 million of these acres hadbeen accepted into the CRP. It was anticipatedthat an additional 10 million acres (4 million ha)would be idled in 1987 after the October 1986announcement of what was expected to be thelargest acreage reduction programme in UShistory.
The European Economic Community (EEC)The continuing growth of many commoditysurpluses, which were the result of annualproduction increases of 2-3% up until 1984,and annual consumption increases, which haveaveraged less than 1%, have contributed tocreating agricultural stocks that are financiallyintolerable in the EEC. A decline in agriculturalproduction in 1985 and no growth in 1986,may signal, however, a tendency to lowerproduction. Nevertheless, depressed worldmarkets, a falling US dollar and threats ofincreasing competition in agncultural marketshave worsened the outlook for farm incomes inthe EEC and for the Common AgriculturalPolicy (CAP) budget, despite lower production.
The EEC faces some additional difficulties asSpain and Portugal become more integratedinto the Community. Spain began its seven-yeartransition period into the CAP 1 March 1986,while Portugal began a two-stage transitionperiod on the same date, but to last 10 years.Spain is a major producer of both olive oil andwine, of which the EEC has surpluses. There hasbeen international concern about Spain's andPortugal's adoption of EEC rules, particularlythose concerning grains. This fear was wellfounded, as in March 1986, the levy on Spanishmaize imports jumped from 20% to nearly100%. The United States engaged in someintensive discussions with the EEC on this issueand a "trade war" was narrowly averted in lateJanuary 1987 (see Box 2.6).
The more or less permanent budget crisis hasbeen exacerbated by the falling value of the USdollar, which means that export subsidies areexpected to have cost $1 500 million more thanexpected for this reason alone in 1986. Also,
international commodity prices for major grainshave plummeted, which has been costly for theEEC budget because of its variable levies, exportrestitutions and high book value of stocks.
The 1986/87 EEC price agreement representsthe third consecutive year of a freeze on prices,although France, Italy and Greece will registerslight positive changes in their nationalcurrencies. In addition, cereal farmers will pay a3% co-responsibility levy to help pay forstorage costs and export subsidies, and therewill be a 5% price penalty for low-qualitycereals.
The EEC Commission had forecast a shortfallof 4 000 million European currency units (ECUs)in the 1987 budget, which was rejected by theEuropean Parliament. This, combined withinternational pressure to decrease production,and rapidly accumulating stocks of grain, dairyproducts, beef, wine and olive oil, promptedthe EEC Council to take action inmid-December 1986 to cut milk production9.5% by 1989 and to reduce the guaranteedbeef price an average 11% in 1987. Theserevisions are the most significant ever achievedin the CAP and should set the stage for furthercuts in production of wheat, wine and olive oil.However, each of these subsectors is uniqueand production of wine and olive oil by theMediterranean members of the EEC will beespecially difficult because farms producingthese products generally have the lowestincomes in the Community.
Non-EEC member countries in WesternEurope fared better than the EEC in 1986, butare having to review their agricultural policiesin view of difficult world supply problems. Mostof these countries are mountainous and haveenacted special legislation in the past to protecttheir mountain farms. This legislation hasrecently been broadened to cover farms invalleys and plains in order to make farms morefinancially viable and to serve agriculture in thelong term. A central goal of this legislation is toallow farmers to leave farming, either throughearly retirement or conversion of farmland intonational parks.
Canada, Oceania and JapanCanada has been able to avoid a majorcatastrophe in its agricultural sector despitedrought in 1984 and 1985, low grain prices andextreme competition in the export market.Farmers have been helped by financial supportreceived from federal and provincial budgets, adepreciating Canadian dollar, relatively lowinterest rates and a good wheat crop in 1986.
69

70
Net farm incomes have not fallen drastically,although over 10% of the farmers appear to bein financial difficulty.
A Farm Debt Review Act was passed inAugust 1986, which established a Farm ReviewBoard in each province to aid farmers in severefinancial difficulty. This followed a moratoriumin September 1985 on farm foreclosures whichinvolved debt to government agencies. Inaddition, a special Canadian Grains Programmewas announced in December 1986, which willmake available C$1 000 million to grain andvegetable oil producers adversely affected byEEC and US trade actions.
Low world prices have reduced the value ofCanada's agricultural exports, although theexport market for its high quality spring wheathas remained relatively firm. Because of the1984-85 drought and efforts to maintain exportvolumes, Canadian grain stocks are at theirlowest level in 30 years, and cattle inventory, atits lowest level since 1960.
There is very real concern in Canadianagricultural circles about the financial health ofits agricultural sector, given the fiercecompetition for export markets, the low worldcommodity prices and the fact that about 50%of Canadian farm income comes from exports.As a result, the Canadian government hasapplied a severe countervailing duty on importsof US maize and EEC beef to protect itsdomestic industry from what it feels to beunfair subsidization.
Both Australian and New Zealand farmershave been hit very hard by low commodityprices and increased competition for theirprincipal export products, as well as highinterest rates and rising production costs. It is
estimated that 12 000 Australian farmers werethreatened by bankruptcy in 1986. Becauseneither Australia nor New Zealand can matchthe subsidies given to producers of other majorexporting countries, they have been forced tosqueeze even harder what are already seen as"technically efficient" farm sectors.
Australian wheat farmers have also seen theguaranteed minimum price for wheat decline13% in 1986. Nevertheless, because of a fallingAustralian dollar and a strong export drive,wheat exports will probably reach a record 16million tons in 1986 and livestock exports alsoincreased substantially. However, net real valueof farm production is expected to be down byover 20% in 1986 because of low prices.
New Zealand farmers have been affected bya new farm programme that reduces support tofarmers and by an appreciation of the NewZealand dollar that has held down exports.
Interest rates continue to be high in thecountry and net real value of farm productionis down by over 20%.
In 1986, the Rural Bank of New Zealand, agovernment agency, reported that 80% of itsfarmer clients were in financial trouble. Sheepand beef farm incomes were down 52% in1985-86 compared with one year earlier, andthe overall situation has been compared to thepreviously unparalleled 1930s.
In contrast, Japan's cereal and livestockproduction continued to increase in 1985-1986,and an appreciating yen cut importedagricultural input costs, further enhancing netfarm incomes. Farming increasingly has becomea part-time business in Japan and it wasestimated that in 1984, about 86% of thefarming families were involved in non-farmeconomic activities during the farming season.
Japanese agricultural policy has emphasized adiversion programme for rice production toforage, wheat and soybeans. In 1986, 610 000ha of rice land were diverted to production ofthese crops. Despite this programme, ricecontinues to be protected from imports andJapanese officials are very concerned about theconsequences of its rice market being openedto imports as a result of the GATT negotiations.Other markets such as beef and oranges havebeen recently liberalized somewhat. Japanremains around 50% self-sufficient in foodproduction.

BOX 2.6
US/EEC agricultural traderelations: some success,continuing differences andthird-party reactions
The United States and the EECfigured prominently in thepreliminaries to the multilateraltrade negotiations (MTN), as manyof the GATT cases have beenconcerned with disagreementsinvolving these two importanttrading partners. In 1986, somelong-standing differences betweenthe two were settled, while othersremain unsolved.
In February 1986, the UnitedStates and the EEC reached amutually satisfactory settlementconcerning EEC production aid forcanned peaches, canned peas,canned fruit cocktail and driedgrapes. The agreement wassignificant in that it was the firsttime domestic production subsidieswere found by a GATT panel tointerfere with international trade. InAugust, the so-called "pasta war"was defused temporarily when theUnited States lowered its tariffs onEEC exports of pasta, and the EECdid the same for US exports ofcitrus and walnuts.
Another dispute, resulting fromthe EEC enlargement, involved theadoption of EEC rules andregulations by Spain and Portugal.As a consequence, US exports ofmaize were subjected to new tradebarriers for which the UnitedStates demanded appropriatecompensation. Under EEC rules,Spain and Portugal had to raisetheir tariffs on maize and sorghumproducts imported from the United
States. The US government claimedit would cost US farmers about$430 million a year. A temporaryresolution of the conflict for sixmonths was agreed to so that theMTN could proceed normally, buton 1 January 1987, the USannounced that a 200% duty on anumber of EEC imports would beimposed at the end of January onimports such as Gouda and Edamcheeses, canned ham, carrots,olives in brine, gin, brandy andlow-quality white wines. OnJanuary 29, 1987 an accord wasreached between the two partiesover grain sales to Spain. Thefour-year agreement calls for theEEC to allow annual exports of2 million tons of maize and3 000 000 tons of sorghum intoSpain at low tariffs. It also requiresPortugal to lift the year-oldpractice of buying 15% of its grainimports from the EEC. The UnitedStates is expected to gain abouttwo-thirds of Spanish andPortuguese quotas.
While the bilateral agreementsbetween the United States and theEEC have produced some positiveresults, the effects on othercountries have been largelyignored. Both the United Statesand the EEC have domesticagricultural policies that attempt tosupport farm income throughvarious methods that have resultedin large surpluses and low worldprices. In a period of shrinkingexport markets, both the UnitedStates and EEC have attempted tomaintain market shares throughunilateral and bilateral actionswhich, in some cases, have led toalleged incursions in traditionalmarkets of other trading countries.Many of these countries arerelatively more exposedeconomically to trade fluctuationsand have been hurt significantly byshrinking markets and increasedcompetitiveness.
Fourteen of these countriesformed a new alliance in 1986 andheld meetings in Thailand and inCairns, Australia. The so-called"Cairns group" of countriesaccount for 20-25% of worldagricultural trade.' It has alreadyexerted pressure at the UruguayRound in Punta del Este to includeagricultural export subsidies on the
'These countries include Argentina, Aus-
tralia, Brazil, Canada, Chile, Colombia,
Hungary, Fiji, Indonesia, Malaysia, New
Zealand, the Philippines, Thailand and
Uruguay.
2 At the GATT MTN in January, at a broad
range of trade talks beginning February 9,
the Wheat Exporters' meeting in February,
the Trade Ministers' meeting in March, the
OECD Ministerial meeting in May, and the
World Food Council meeting and Western
Economic Summit in June.
71
negotiating agenda and is preparedto continue this pressure in future.
While none of these countriesalone has a budget that cancompete with the United States orthe EEC, as a group they hope toexert sufficient pressure ininternational fora to affectfair-trading practices. Even actingindividually, some of thesecountries can exert pressure on theimport side, as shown by Canada'srecent imposition of stiff duties onUS maize and EEC beef.
Also, Australia, Canada and NewZealand are members of the OECDCommittee for Agriculture, whichcould play a role in alleviatingproblems in agricultural trade inthe near future.
At its meeting in December1986, the Committee agreed inprinciple to prepare a basis fornegotiating "arrangements" thatwould alleviate short- andmedium-term trade problems inagriculture. These understandingswould presumably conform toGATT principles and would parallelthe long-term negotiations of theGATT. Discussions along these linesare also expected to take place atother international fora in early1987.2

72
CENTRALLY PLANNED ECONOMIES
Eastern Europe and the USSR9
Overall economic performance in 1985Economic growth in Eastern Europe and theUSSR, which had accelerated in 1982 and 1983,slowed slightly in 1984 and again in 1985 (Table2.6). The regional performance concealed,however, substantial differences among theseven countries as regards policies, plan targetsand actual achievements.
Economic regional performance in 1985 canbe assessed through an analysis ofdevelopments in supply and demand factors.On the supply side, an unusually harsh winterin early 1985 and a prolonged drought in thesummer had a considerable negative impact onkey sectors such as energy, and hence, onindustry, transport and agriculture in mostcountries of the region. Agricultural output fellbetween 4.8% and 13.1% in Bulgaria, Hungaryand Romania; did not significantly change inPoland; and modestly increased in theremaining countries, including the USSR.Overall, energy production rose only marginallyor declined; in the case of the USSR, oilproduction fell 3%.
The region's export volume growth rate wasreduced from 6% in 1984 to around 1% in1985, while the import growth rate slightlyslowed from 5% in 1984 to 4.7% in 1985. As aconsequence, the regional trade surplus wasreduced by $7 000 million in 1984-85.
On the demand side, the slowdown in worldtrade and in the import demand of developedmarket economies in particular, adverselyaffected export opportunities for most EastEuropean countries and the USSR. However, thelong-standing deficit (based in rubles) of EastEuropean countries in their trade with the USSRshifted to a surplus in 1985.
The still positive resultsthough considerablyreduced of most East European countries intheir external financial situations, were obtainedthrough strict import controls and constraineddomestic demand. In some countries, theseausterity measures resulted in food shortages,rationing of foodstuffs and increases inconsumer prices.
9 Bulgaria, Czechoslovakia, the German Democratic
Republic (GDR), Hungary, Poland, Romania, and the USSR.
(Albania is not included for lack of data.)
Recent developments in agricultureIn the last few years, several countries in theregion introduced policy changes affecting themanagement and planning of the agriculturalsector. A review of these changes focusesmainly on Hungary, Poland and the USSR, forwhich more complete information was available.
In 1985, the growth rate of agriculturalproduction in Hungary fell from its record ofthe previous year (Table 2-7). Crop productiondropped 6.9% mainly due to adverse weatherconditions, and livestock production fell 8.3%because of declining profitability; this wasaccompanied by worsening economicconditions in the sector. Increases in producerprices of agricultural commodities in 1985 werelower than those of input prices, as in previousyears. As a result of falling incomes andincreasing fertilizer prices, which rose 8.6%,fertilizer consumption declined almost 12% in1985. Taxes paid by large-scale farms increasedand a 20% tax on investment was imposed,with the exception of investment in newplantations, land reclamation and agriculturalmachinery. Also, taxes to local governmentstrebled between 1984 and 1985, albeit fromvery low levels, and as a result, growth inagricultural investment slowed.10
In view of the difficulties facing the sector bymid-1985, the Government of Hungaryincreased producer prices and reduced taxesimposed on the sector. Despite these measures,agricultural production continued to fall in 1986,owing, in part, to a drought which was in itssecond year and a fall in demand for traditionalexports.
In 1985, agricultural output did notsignificantly change in Poland after havingexpanded almost 6% in 1984, when recordyields of major crops were achieved. Cropproduction fell, but livestock output rose,particularly meat, a traditional Polish export.The increase in meat production made itpossible to raise domestic consumption andexports. The latter, in turn, eased the country'sproblems with its negative trade balance inconvertible currencies, as did new policiesintroduced in 1983, by which Polish agriculturestrongly reduced its former heavy dependenceon imported feedstuffs.
Changes in price policy were instrumental inincreasing production of grains, rapeseed,livestock and meat. While the declared policy
10 See also the following section on "Some characteristics of
agricultural policy in Hungary".

TABLE 2.6. Eastern Europe and USSR: annual changes in selected economic indicators, 1981-85
(Percentages)
Source: UN, Economic Commission for Europe, Geneva.
target of parity of incomes between peasantfarmers and non-agricultural workers was notentirely achieved, profitability, together withpolitical guarantees for "stability" in peasantfarming, were strong incentives for farmers toincrease output, sales and investment. Statefarms were given full autonomy in managementand their operations placed on a strictlyeconomic basis, eliminating the former extensivesystem of state subsidies.
The success of these policy measures for
agriculture, however, requires an increasedsupply of inputs from industry, if the recordlevels of crop output of 1983-84 are to bemaintained and livestock numbers to increase.There was concern that the industrial sectorwould be incapable of sustaining theproduction of such imports in 1986;nevertheless, agricultural output, favou red bygood weather conditions, increased around 4%in 1986.
In the USSR, in view of the wide fluctuations
73
Item 1981 1982 1983 1984 1985
NET MATERIAL PRODUCT
Bulgaria 5.0 4.2 3.0 4.6 1.8
Czechoslovakia -0.1 0.2 2.3 3.5 3.2
German Dem. Rep. 4.8 2.6 4.6 5.5 5.2
Hungary 2.5 2.6 0.3 2.5 1.4
Poland -12.0 -5.5 6.0 5.6 3.2
Romania 2.2 2.7 3.7 7.7 5.9
USSR 3.3 3.9 4.2 3.2 3.5
Eastern Europe and USSR 1.7 2.8 4.1 3.8 3.5
RETAIL PRICES
Bulgaria 0.5 0.3 1.4 0.7 0.9
Czechoslovakia 0.8 5.1 0.9 0.9 2.5
German Dem. Rep. 0.2
Hungary 4.0 6.6 7.2 8.5 6.3
Poland 18.4 109.4 21.9 14.5 14.1
Romania 2.1 16.9 5.2 1.1 0.4
USSR 1.0 2.8 0.7 -1.3 0.7
Eastern Europe and USSR
EXPORT VOLUMES
Bulgaria 8.4 11.3 4.4 11.6 2.2
Czechoslovakia 0.5 6.1 5.7 8.5 2.6
German Dem. Rep. 8.4 5.4 10.6 3.7 1.7
Hungary 2.6 7.3 9.4 5.8 -0.3Poland -19.0 8.7 10.3 9.5 1.6
Romania 13.6 -7.6 0.9 15.0 1.6
USSR 1.9 4.5 3.3 2.5 -4.3Eastern Europe and USSR 1.5 5.1 5.7 6.0 -0.6
IMPORT VOLUMES
Bulgaria 9.3 3.2 5.2 5.6 10.9
Czechoslovakia -6.9 2.9 2.0 4.8 4.6
German Dem. Rep. - 1.3 - 4.7 5.3 5.7 2.3
Hungary 0.1 - 0.1 3.9 0.1 1.1
Poland -16.9 -13.7 5.2 8.6 7.2
Romania - 7.2 -22.8 -5.0 9.9 10.3
USSR 6.4 9.7 4.0 4.4 4.0
Eastern Europe and USSR - 0.1 1.5 3.7 5.0 4.7

74
TABLE 2.7. Eastern Europe and USSR: annual changes in foodand agricultural output, 1983-86
(Percentages)
Including AlbaniaSource: FAO, Statistics Division.
in crop output caused by the weather, theachievement of sustained and steady outputincreases, particularly of grain remains a basicgoal. Continuing growth in grain production isneeded to fill the still large gap betweendomestic availability and feed requirements oflivestock. Therefore, the 1986 Agricultural Plan,announced in 1985, stipulated an increase of6% in crop production, but a 1-2% in livestockoutput. Shortcomings in agriculturalinfrastructure, which have resulted in largeproduction losses, are an additional basicproblem still to be overcome.
1985 also marked the finalization of the1986-90 Plan and the introduction of somefar-reaching new strategies and policies. InNovember 1985, the State Agro-IndustrialCommittee of the USSR (GOSAGROPROM) wasestablished as the central managerial body forthe Agro-Industrial Complex (APK) withresponsibilities for increasing production, fulfillingfarm produce procurement plans, providingstorage facilities, creating farm-productprocessing capacity and increasing the varietyof farm products available. This new StateCommittee replaced the former Ministries ofAgriculture, Fruit and Vegetables, Meat and MilkIndustry, Food Industry, Rural Construction, andthe State Committee of Material and TechnicalSupplies for Agriculture.
Major reforms were also introduced in March1986 to further improve management andplanning of the agricultural sector:
A 50% price bonus on production abovethe average 1981-85 targets for grain, meat,milk, cotton, soya, sugarbeet, tea, wool, etc.The previous incentive system had tied bonusesto current plan targets that were oftenunrealistic. For example, grain plan productiontargets during 1981-85 averaged 239 milliontons compared with an actual output of 180million tons.
State and collective farms are nowauthorized to sell to local shops and markets30% of the state procurement target of fruitand vegetables produced. This new flexibilitycould increase consumption of these products,not only because of output increases, butbecause of more efficient means of distribution.
Local authorities can also fix the retail pricesof fruit and vegetables in local state shops.Prices will therefore vary so as to respondbetter to local market conditions and providemore flexibility for changes in output. In 1980,production of fruit and vegetables fromhousehold and auxiliary farms represented 42%and 33% respectively of total output. In May1986, however, the government decided tointroduce more controls on prices in theso-called kolkhoz markets.
Gross agricultural production increasedmoderately in 1985. Grain output, however, wasestimated at about 192 million tons, or 110/0more than in 1984 when it was abnormally low.Grain imports exceeded 55 million tons duringthe 1984/85 season, a record level.
In 1986, as a result of a bumper crop ofUSSR grains, officially estimated at about 210million tons (including pulses), agricultural andfood production of the USSR increased 5.5%and 5.9% respectively. Output of grains wasabout 18 million tons more than the 1985harvest and almost 27 million tons higher thanthe average for the previous five years, leadingto a reduction in cereal imports. Also thedecline that took place in 1986 in world pricesof oil-somewhat reversed more recently
reduced hard currency earnings from energyexports and contributed to a reduction ofagricultural imports.
Bulgaria was affected by a severe winter anda prolonged dry summer in 1985. Agriculturaloutput-particularly grain-and consequentlyexports, drastically fell, and thus grain importsincreased to meet domestic requirements. Whileproduction recovered in 1986, it was notenough to offset the previous year's decline.
In Czechoslovakia, 1985 crop production fell2.7%, although grain harvests were quite goodand almost equalled the record 12 million tonsin 1984. Self-sufficiency in cereals was almost
Item 1983 1984 1985 1986
AGRICULTURAL OUTPUT
Bulgaria -9.6 8.3 -13.1 8.7
Czechoslovakia 4.3 5.6 1.0 3.7
German Dem. Rep. 2.4 8.3 1.2 2.3
Hungary -2.8 6.2 -7.7 4.7
Poland 4.7 3.1 0.2 3.9
Romania -1.7 11.8 -4.8 0.5
USSR 5.2 -0.6 0.7 5.5
Eastern Europe and USSR a 3.7 0.9 0.2 4.1
FOOD
Bulgaria -8.3 7.0 -13.3 7.4
Czechoslovakia 4.3 5.6 0.9 -3.8German Dem. Rep. 2.5 7.9 1.2 2.3
Hungary -2.7 6.2 -7.8 -4.6Poland 4.7 3.0 -0.1 4.3
Romania -1.7 11.6 -4.8 0.4
USSR 5.7 0.3 5.9
Eastern Europe and USSR a 4.0 1.3 -0.1 4.3

reached in 1984-85. At the same time thecountry managed to satisfy domestic demandfor meat and dairy products and produceexportable surpluses for some agriculturalcommodities. Nevertheless, agriculturalproduction fell back by nearly 4% in 1986,mainly because of drought.
In the German Democratic Republic,agricultural output increased moderately in1985, after the exceptionally favourable resultsin 1984. Grain harvests reached about 12million tons and plan targets were exceeded.Such good harvest results made it possible tomaintain livestock numbers and output, andmeat production rose 5.2%. In 1986, agriculturaland food production grew by another 2.3%.
In Romania, agricultural output in 1985 fellby 4.8% over the previbus year, which hadrecorded exceptionally high growth. At the endof 1985, a special programme onself-management and self-sufficiency inagriculture was adopted to ensure adequatesupplies of agricultural products. Productiongains, however, were modest in 1986.
Some characteristics of agricultural policy inHungarySince the mid-1960s and the introduction of anew economic mechanism into agriculture andother sectors, state intervention in agriculturehas become increasingly focused on pricepolicies, subsidies and taxes.
Prices are determined primarily by directstate regulation, but also, in some cases, bymarket forces. During 1980-85, about 60-63% ofagricultural output was transacted throughofficial prices, compared with about 33% forthe output of all sectors.
Prices for agricultural products can beclassified as follows:
Fixed official prices for cereals, beef andpork;
Maximum prices for the main inputs,including mixed feeds of agricultural origin;
Orientation prices, fixed within maximumand minimum limits, for important seasonalproducts such as potatoes and apples; in thesetting of limits, the size of the harvest is takeninto consideration:
Protective prices for seasonal products forfood processing, such as vegetables and fruit;
Free market prices, determined betweenbuyer and seller for products traded without aproduction contract.
Official [prices, announced each autumn for aone-year period, apply only when productioncontracts are concluded between agricultural
producers and the food industry or wholesaleenterprises.
The setting of official agricultural prices isbased on estimated average production costsand on actual or expected developments inmarket conditions. The development of worldmarket prices has no direct influence ondomestic prices in the short term. In the foodindustry, the majority of producer pricesbelongs to the so-called "free price category".Industrial enterprises cannot freely set prices,however. Their profit margins are severelylimited, largely by official prices of agriculturalproducts for processing and from energysources, and controlled prices of consumergoods. Hence, the state is, at times, forced tointroduce subsidies that impose a burden onthe budget and reduce the incentive for foodindustry enterprises to improve their efficiency.
The level of agricultural contractual prices ishigher than that of free prices. Adjustments aremade in the contractual prices for qualitydifferences, volume of purchases andseasonality of delivery; the latter particularly fordairy products, seasonal products such as fruitand vegetables and, since 1983, poultry andrabbits.
The authorities apply a complex system ofagricultural subsidies and taxes. Their net effecton agricultural incomes has tended to beincreasingly negative in recent years. Subsidiesare currently estimated to contribute about10-110/o to agricultural revenues, while taxesreduce it by 13-14%. A decade ago theamounts were 20% in subsidies and 11-12% intaxes. Hence, the agricultural sector is now anet and important contributor to the statebudget.
There are indirect and direct subsidies.Indirect subsidies are related to productionrequisites and have been rapidly decreasing inrecent years. No subsidies are now paid onsmall-scale machinery and pesticides, and thoseon fertilizer have been much reduced.
There are several forms of direct subsidies.Those related to agricultural investment havetended to lose importance in relation to otherareas of subsidy allocation. Indeed, the share ofagricultural subsidies in total subsidyexpenditure has fallen from about 40% in theearly 1970s to less than 15% at present. Thefollowing types of investment are currentlysubsidized: (i) investment in construction andbuilding modernization, in particular in dairyand pig farming; (ii) establishing vineyards andorchards in designated areas; and (iii) landimprovement.
Investment subsidies take the form of, for
75

76
BOX 2.7
Agriculture in Poland in the1980s
In the early 1980s, Poland faced adeep economic crisis. In theagricultural sector that wascharacterized by (i) a heavy deficitin foreign trade of food andagricultural products; (ii) animbalanced domestic market forfood products, with demand beinghigher than supply because of theformer policy of maintaining lowfood prices; (iii) a structuralstagnation of peasant farms, whichcover about two-thirds of totalfarm land; and (iv) the failure ofthe industrial sector to produce anadequate supply of agriculturalinputs.
Since 1982, the government hasintroduced a series of economicmeasures designed to overcomethe crisis. The measures include: (i)a farm price policy to stimulatedomestic agricultural production,particularly grains and rapeseed; (ii)a policy of self-sufficiency in foodand agricultural products to haltthe increasing foreign debt of the1970s to which imports of livestockfeed contributed more thanone-half; (iii) a gradual reduction offood price subsidies, from theequivalent of about 41% of totalfood sales in 1980 to 19% in 1985,which entailed a sharp increase inretail food prices; and (iv) a systemto negotiate between peasantfarmer unions and the state so asto fix prices, thus compensating forrising costs of production due tohigher prices of inputs, andpartially offsetting increases in thecost-of-living.
As a result, and helped byfavourable weather conditions, thepace of agricultural output growthaccelerated, from 1.3% a yearduring 1971-80 to 2.8% during1980-86. Grain yields increased11°/0 between the second-half ofthe 1970s and first-half of the1980s; and rapeseed output, themajor oilcrop in Poland, doubledbetween 1984 and 1986 to reachover 1 million tons. The highannual rate of growth of cropproduction during 1980-86, of 4.7%a year, resulted in an increase inthe domestic supply of animalfeeds. Grain imports were reducedfrom some 7 million tons at the,end of the 1970s to 2.2 milliontons in 1985, and oilcrops from 1.3million to 1 million tons. About
$8 000 million of grains andoilcrops were imported between1970 and 1980, which accountedfor about one-half of the tradedeficit in convertible currencies.This was the cost of significantlyincreasing the consumption ofmeat from 53 kg per caput in1970 to 74 kg per caput in 1980.With the reduction of imports ofanimal feeds, however, per caputannual meat consumption sharplydeclined to 58 kg in 1982 to riseagain to 60 kg in 1985.
A major threat endangering thefuture of the, so far, successfulfarm policy is that theperformance of the industrialsector has lagged behind. Thissector has not only failed toprovide attractive consumer goods,but has not met the plannedsupply targets for major farminputs. The output of fertilizers,crop protection chemicals andprocessed livestock feeds not onlyremains below the pre-crisis levelsof 1978, but has been growingmore slowly than the output ofthe industries they are associatedwith. This is the result of pastinvestment policies that haveneglected the development ofindustries which are linked toagriculture. For example, a growingsupply of agricultural raw materialsfaces bottlenecks in foodprocessing and distribution, leadingto waste; and an incomplete rangeand poor quality of inputs result intheir productivity being lower thanexpected. The successfulagricultural production policy hasshowed up the constraints in foodprocessing and distribution, in theindustries supplying inputs forfarming, as well as the wholeinfrastructure serving agriculture.
Costly investment programmesare currently being undertaken bythe Government of Poland toalleviate these barriers so as toincrease agricultural production.

example, a fixed amount of money on eachhead of livestock housed, or per hectare ofland, or it finances part of the total investmentcost.
A much wider range of investments aresubsidized through reductions in interest rateson loans. This form of subsidy has gainedsignificance with the recent increases in interestrates (about 13-14% in 1986), which are nowmore in line with market realities and prevailinginternational rates. For instance, loans for theconstruction of storage facilities, warehouses,plants for processing food and mixing feed,water mains, roads, etc., receive a 2% interestrefund. There is also a 4% refund on interestpaid on loans for livestock breeding centres,irrigation systems and polythene sheeting forvegetable production.
Production subsidies are also granted toencourage expansion of milk and beef-cattleproduction and for the opening up ofagricultural land (50% of the cultivation cost isborne by the state budget). There is also atemporary subsidy on fuel, which is used tohelp offset the increases in energy prices.
Special subsidies for the promotion of localemployment opportunities are granted tolarge-scale enterprises operating under worsethan average conditions. In these cases,incomes are supplemented by tax exemptionsand price bonuses. For example, depending onthe estimated productive capacity of the soil,the state gives a price supplement of 6-20%,according to the products sold. Qualifyingenterprises are also granted tax exemptions. Inparticular, to encourage alternative sources ofincome, 15-40% of the tax payable onnon-agricultural activities can be withheld,provided it is invested in industrial activities.
Small-scale farms receive special subsidiesthat enable them to purchase pesticides andfertilizers at the same advantageous prices asthose paid by large enterprises. They alsobenefit from grants to increase their stock ofcattle. Another form of subsidy covers 40% ofthe initial investment costs of producingvegetables. Grants are also provided for theplanting of vineyards and orchards, providedthey meet the technical requirements of, andare linked to, large enterprises. In addition,several small-scale producers can qualify forgrants if the combined size of their plantingscovers a minimum area.
Turning to the tax system, the state leviesvarious duties and taxes on agriculturalproducers to raise revenue and control theactivities of enterprises. One group of obligatorypayments include the following:
National insurance contribution, which rosefrom 17% in the mid-1970s to 33% in 1986;
Land tax, assessed on the basis of a landvalue scale. The tax is payable only from value14 on the scale (Ft56/ha) to value 40 (Ft1 680/ha).11 Farm enterprises pay taxes on theaverage value of their entire holding; and
Industrial production tax and turnover tax,calculated as a percentage of gross income,depending on activity or product. Both taxeswere devised to ensure that agriculturalenterprises make tax contributions equivalent tothose of industrial firms.
Another group of taxes applies to incomes:Communal tax of 3% on an enterprise's
gross income;Tax on profits or income, applied
progressively to income exceeding Ft33 000; itrises from 4% on incomes between ofFt35 000-40 000, to 34% on incomes overFt75 000.
Personal income tax, levied on increases inaverage income exceeding 5%. Greaterincreases may be penalized by tax rates ofmore than 100%;
Accumulation or investment tax of 5-200/o,to steer investment into priority areas. Forexample, investments in land improvement orenvironmental protection are exempt from thetax.
" The current value of the forint is US$1 = Ft45.
77
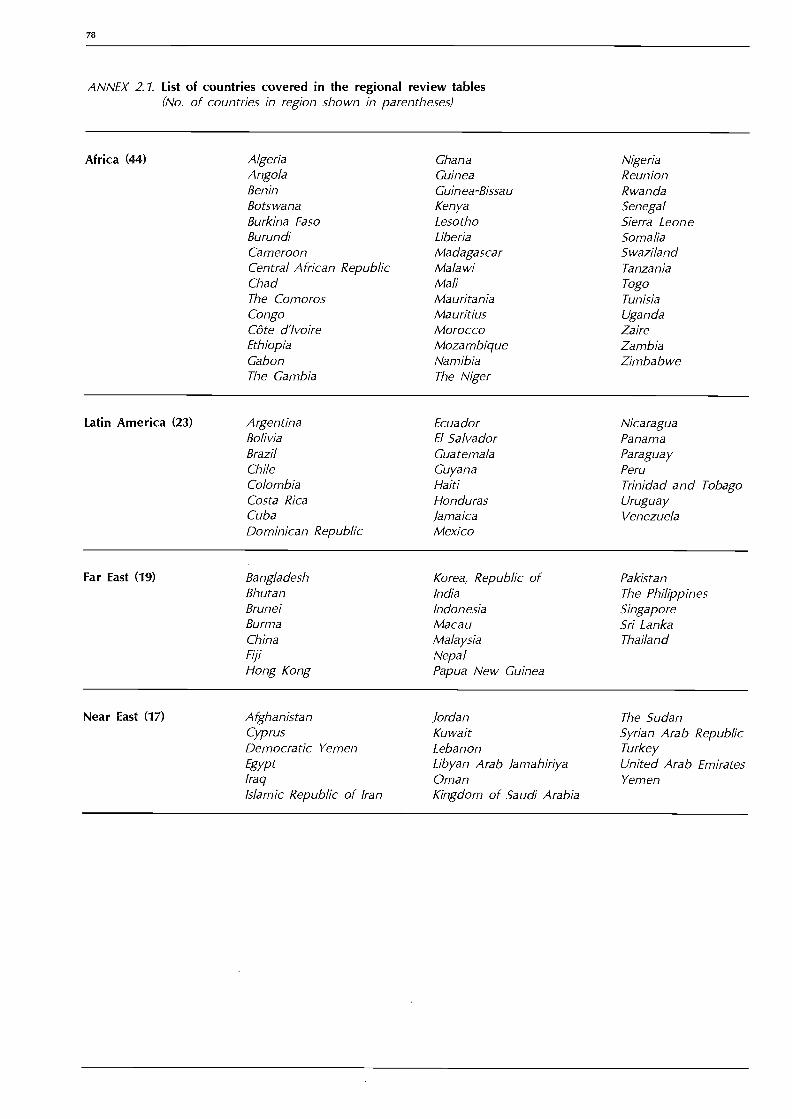
78
ANNEX 2.1. List of countries covered in the regional review tables(No. of countries in region shown in parentheses)
Africa (44)
Near East (17)
AlgeriaAngolaBeninBotswanaBurkina FasoBurundiCameroonCentral African RepublicChadThe ComorosCongoCôte d'IvoireEthiopiaGabonThe Gambia
AfghanistanCyprusDemocratic YemenEgyptIraqIslamic Republic of Iran
GhanaGuineaGuinea-BissauKenyaLesothoLiberiaMadagascarMalawiMaliMauritaniaMauritiusMoroccoMozambiqueNamibiaThe Niger
JordanKuwaitLebanonLibyan Arab JamahiriyaOmanKingdom of Saudi Arabia
NigeriaReunionRwandaSenegalSierra LeoneSomaliaSwazilandTanzaniaTogoTunisiaUgandaZaireZambiaZimbabwe
The SudanSyrian Arab RepublicTurkeyUnited Arab EmiratesYemen
Far East (19) Bangladesh Korea, Republic of PakistanBhutan India The PhilippinesBrunei Indonesia SingaporeBurma Macau Sri LankaChina Malaysia ThailandFiji NepalHong Kong Papua New Guinea
Latin America (23) Argentina Ecuador NicaraguaBolivia El Salvador PanamaBrazil Guatemala ParaguayChile Guyana PeruColombia Haiti Trinidad and TobagoCosta Rica Honduras UruguayCuba Jamaica VenezuelaDominican Republic Mexico

PART THREEFINANCING AGRICULTURALDEVELOPMENT

INTROCIUCTION
The significant variations in agriculturalproduction and trade, over time and amongdeveloping countries and regions, asdocumented in the previous chapters, raisequestions as to the role that agricultural financeplays in creating such differences. Past levels ofinvestment in livestock, tree crops, landimprovement, irrigation works, agriculturalmachinery and infrastructure, are powerfulexplanatory factors. Similarly, relative levels ofexpenditure on agricultural services and inputscan also help explain the variations. An analysisof these flows could identify useful policyprescriptions, leading to a more rational use ofscarce resources and the attainment of higherperformance levels.
Unfortunately, the nature of developmentfinance is too complex to be analysed in a waythat would yield unambiguous conclusions,especially as regards the agricultural sector ofdeveloping countries. For most of thesecountries, agriculture is a major source ofdevelopment finance, as well as a user of it. Alarge part of investment is non-monetized, forexample, in the form of labour-time to clear orimprove land, or to tend to breeding livestock.
Investment is needed outside the agriculturalsector for infrastructure such as roads andport-handling facilities, to enable the output ofinvestment within the sector to be properlyexploited. Similarly, the effectiveness ofgovernment current expenditure on researchand veterinary services, for example, dependson how efficiently it is provided and not juston levels of expenditure. It also depends onwhether the rural population is capable of fullyexploiting the services offered, reflecting pastlevels and distribution of expenditures on farmsupply and service networks, rural educationand even health. Questions must be raised alsoabout the comparability of expenditure data atthe country level in times of rapid inflation anddistorted exchange rates. Furthermore, thepublic and private sectors (government andprivate interests) play widely varying rolesamong countries in mobilizing financialresources and making decisions on their use.
Nevertheless, there are other compellingreasons for surveying the financing ofagricultural development at this time, even in apreliminary and exploratory way. Theconvulsions that have shaken the worldeconomy with gathering force in recent years,have cast doubt on the continued applicationof conventional thinking which underlaid much
of development efforts during the past 30 to 40years. The belief in the primal role of the publicsector in accelerating development through itsfiscal policies was sustained during the 1970s bythe ease and low cost of external borrowingfrom world capital markets. It led to a surge inexternal borrowing in the decade until the early1980s. Another line of thinking, which hasbuttressed the important role of externalassistance in promoting economic development,is associated with the "two gap" thesis thatchronic shortages of capital and foreignexchange are major constraints to development.Recently, however, there have been signs of"aid fatigue" in some donor constituencies, apronounced cutback in capital flows todeveloping countries from external privatesources, and reductions in governmentexpenditures. Consequently, the magnitude andreliability of financial flows from conventionalsources, as well as the uses to which they areput, have become more pressing issues.
This chapter, therefore, is a "ground-clearing"exercise, which attempts to give a perspectiveon the various flows of financial resources toagriculture and their uses during a decade ofmajor economic adjustment and stress. Itprovides a framework for analysing the role andplace of agriculture in overall developmentfinance, discusses some major issues raised, andputs forward possible courses of action forpolicy-making and areas for future research.
81
MACRO-ECONOMIC OVERVIEW
This section discusses patterns ofmacro-economic adjustment during 1974-84 fora sample of 35 developing countries.' Itprovides the framework and context forsubsequently examining in greater detail theindividual components of agricultural finance,the mobilization of which took place in aneconomic environment characterized byadjustment and change.
The flows of financial resources have beendivided into two groups: those passing throughthe fiscal budget of governments and thosemore within the private domain. Within eachgroup, the flows are identified by major sourceand use.
In macro-economic terms, adjustment of acountry's economy in any given year can bedivided into external (as regards the world) anddomestic adjustments. The two adjustments arerelated by the following ex-post nationalaccounting identity:2
(M X) + R = I Sr,
where: M = imports of goods and non-factorservices
X = exports of goods and non-factorservices
R = net factor payments, made upprincipally of interest paymentson external debt; profits anddividends paid on foreign directinvestment; and remittancesreceived from residents workingabroad
= total investment, includingvariations in stocks
S, = national savings, which is thesum of savings of businesses,households and government.
1 This sample was drawn from the list of 39 countriesselected for FAO's study on "Agricultural Price Policies:Issues and Proposals", (Rome, 1987) and for which some
agricultural financial data had been collected. The list ofcountries is shown in Box 3.1.
2 For further discussion of "national accounting identity",see Paul Host-Madsen, "Macroeconomic Accounts: AnOverview", IMF Pamphlet Series, No. 29, Washington D.C.
1979; and, for its practical application, see Inter-American
Development Bank, "Economic and Social Progress in Latin
America, External Debt: Crisis and Adjustment", Wash-ington D.C. 1985, (particularly chapters 1 and 2).
The left-hand or external adjustment side ofthe equation comprises the current accountdeficit or surplus, and the right-hand ordomestic adjustment side comprises theinvestment-savings gap. Therefore, ex-post,external adjustment equals domesticadjustment, and the variation in the currentaccount deficit or surplus equals the variationin the investment-savings gap.
For all 35 countries as a group, the currentaccount deficit widened in 1975 following thefirst oil price rise in 1973, but by 1977, externaladjustment measures aimed at curbing importshad reduced it to 3.5% of GDP (Figure 3.1).3After the second oil price rise in 1979, thecurrent account deficit again increased sharplyand by 1981 reached on average 6.9% of GDPfor the 35-country sample. A deficit of this sizewas unsustainable for a long period, and thusmost countries subsequently implementedexternal adjustment measures. By 1984, thedeficit of the 35 countries as a group haddeclined to 3.5% of GDP.
Following the trend in the current accountdeficit, the investment-savings gap for the 35countries as a group widened between 1977and 1981, and declined between 1982 and1984. In theory, the widening investment-savingsgap that accompanied the growing currentaccount deficit might have been accompaniedby rising or falling rates of either investment ornational savings, depending upon the strengthof the underlying savings response andinvestment opportunities. In fact, the averagenational savings rate of the 35-country sampledeclined every year from 1977 until 1982, whenthe downward trend was reversed. The fall inthe investment rate started several years afterthe national savings rate had already begun todecline and held fairly constant until 1980.However, investment continued to fall after1982 in most regions, when the national savingsrate began to show some improvement.
This brief overview of macro-economicadjustment during 1974-84 for the 35-countrysample masks the considerable diversity amongregions. Hence, a closer look is needed atregional patterns and timing of external anddomestic adjustment.
External AdjustmentThe average current account deficit of Africancountries covered in the sample was
3 According to national accounting conventions, a currentaccount deficit has a positive sign.

BOX 3.1 The 35 developing countries used in the sample in this chapter are:
The 35-country sample Far East (9) Latin America (10) Africa (12) Near East (4)
BangladeshIndiaIndonesiaKorea, RepublicMalaysiaPakistanPhilippinesSri LankaThailand
A comparison was made betweenthese "sample developingcountries" and "all developingcountries", as represented by 103developing countries, data forwhich are held in The State ofFood and Agriculture's data bank.
Four indicators were used forthis comparison: (i) the share ofagricultural GDP per total GDP; (ii)the share of agricultural exportsper total merchandise' exports;
The Near East was the"atypical" region among35-country sample, becselection was made ona country's agricultural
ArgentinaBoliviaBrazilColombiaCosta RicaDominicanEcuadorJamaicaMexicoPeru
mostthe
ause thethe basis ofimportance.
EthiopiaGhanaCôte d'IvoireKenyaMalawi
Rep. 25. MoroccoNigerNigeriaSenegalSierra LeoneTanzaniaTunisia
(iii) GDP per caput; and (iv) totalmerchandise trade as a share oftotal GDP, as a measure of theeconomy's "openness". All datareferred to the average for 1981/83,except GDP per caput, which wasfor 1983.
The results of this comparison,shown as regional or total simpleaverages, are summarized in thetable below:
EgyptSudanSyriaTurkey
83
The 35 sample countries comparedwith the 103 developing countries,had lower GDP per caput, exceptfor Africa, and had less "open"economies.
Agricultural AgriculturalGDP per exports
total GDP per totalexports
35-country sample (%) (0/0)
GDP percaput
($)
Totaltrade
per GDP
(%)
Africa 32 39 819 45Latin America 14 33 1 475 33Near East 24 37 1 018 33
Far East 27 27 755 46Total 25 34 1 019 41
103 developing countries
Africa 33 42 732 58
Latin America 15 41 1 820 42Near East 12 15 5 696 88
Far East 27 23 1 347 72Total 25 35 1 919 62

84
persistently greater than that in the Far East,Latin America or the Near East. Between 1977and 1982, the deficit in Africa averaged 9.4% ofGDP compared with 5% in Latin America, 4%in the Far East and 3.1% in the Near East.Thus, Africa was relying comparatively more onexternal sources of finance.
The effects of the 1973 oil price rise werestrongly felt in 1974 when the current accountdeficit widened in all four regions; but by 1976,it began to be reduced somewhat. By 1977, thedeficit was reduced further in the Far East, LatinAmerica and the Near East; but in Africa, itcontinued to widen and by 1978, reached10.7% of GDP. In 1980 (after the 1979 oil priceincrease), the average current account deficit inthe African sample countries reached anunsustainable level of 11.2% of GDP.
%of GDP
30-FAR EAST
25-
20-
15-
10-
o
-5-
-10-
1974 1976 1978 1980 1982 1984
30-AFRICA
25 -
20 -
15-
10 -
5_
-5_
-10 -
30 _ALL REGIONS
25 -
20 -
15 -
10 -
5 -
o
-10-
'1974 19176 19178 1980 19' '82 1984
%of GDP
30 - LATIN AMERICA
25-
20-
15 -
10 -
5-
0
-5-
-10-
194 119'7 '6 1948 1198 ' '0 1982 1984
30 _NEAR EAST
25-
20-
15
10-5_
o
-5-
-b0
1974 1976 1978 1980 1982 1984
- Investment
National savings
Agricultural net exports
Agricultural investment "*
Current account deficit
Domestic adjustment
In the early 1980s, external adjustmentmeasures were adopted in all regions, with theresult that after 1982, the pattern of wideningcurrent account deficits was reversed.
By 1984, external adjustments in Africa andLatin America brought their average currentaccount deficits back to 4% of GDP, aremarkably sharp adjustment for Africa. In theFar East and the Near East, the figure wasreduced to about 3% of GDP respectively.
In order to better understand the patternand timing of these external adjustments, it ishelpful to trace through the key componentsunderlying the current account deficit, includingterms of trade, volume of exports and theirpurchasing power, volume of imports anddebt-service ratios.
During_ 1974-84, the international terms of
External adjustment
Based on a sample of 35 Developing Countries**Based on a sample of 21 Developing Countries. 1984 data not available
Sources: IMP, international Financial Statistics: FAO, Policy Analysis Division
Figure 3.1 EXTERNAL AND DOMESTIC ADJUSTMENT, BY REGION*, 1974-84

TABLE 3.1. Total external merchandise trade, by region,'1974-84
(Percentage change over the period)
Based on the sample of 35 developing countries but excluding Tanzania and Turkey.Sources: UNCTAD, Handbook of International Trade and Development Statistics, 1985;IMF, World Economic Outlook, April 1986.
trade declined significantly for the 35developing countries, by 17% on average (Table31). The deterioration in world prices wasgreatest for Far East exports and least forexports from the Near East region, whichincludes Egypt.
There were marked regional differences in thegrowth of export volumes, which reflected acombination of demand and supply factorssuch as: the commodity composition of exportsfrom each region; demand for thesecommodities on world markets; climaticconditions affecting the supply of agriculturalcommodities; and domestic price and non-pricepolicies affecting domestic demand and supply.Over the 1974-84 decade as a whole, however,while the export volumes of the Far East, LatinAmerica and the Near East expanded(particularly in the Far East), they actuallydeclined in Africa. Therefore, despite theworsening terms of trade, the purchasing power
85
of exports from the Far East, the Near East andLatin America rose between 11-39%. Incontrast, the purchasing power of Africanexports fell 24%. Most of the changes, bothpositive and negative, in the purchasing powerof exports occurred during 1980-84.
The volume of imports rose considerably inthe Near East and the Far East during 1974-84.Africa and Latin America recorded onlymoderate or slight increases during the earlierperiod 1974-80, showing that the rises in theircurrent account deficits were due mainly torising prices, particularly of oil, and because ofshortages of foreign exchange, they were forcedto cut back imports severely during 1980-84.
Many countries borrowed from abroad toincrease or protect their imports, but the termsof borrowing hardened during 1974-84, withshorter average grace and amortization periods,a falling proportion of concessional lending andhigher average interest rates. In all four regions,the cost of servicing foreign debt rose morequickly than did export earnings (Table 3.2). Thesharpest increase was recorded in Africa, whereowing in part to falling export volumes, notedabove, the average debt-service ratio increasedfrom 6.5% to 22.5% of export earningsbetween 1975 and 1984. Nevertheless, LatinAmerica persistently had the highest regionaldebt-service ratio, with repayments of principaland interest absorbing more than one-quarterof export earnings during 1980-84. Even for thegroup of countries in the Far East, the averagedebt-service ratio rose from a low of 8.4% oftotal exports of goods and services in 1980 to13.6% four years later.
To help finance the overall deficit in thebalance of payments, many developingcountries outside the Far East ran down theirforeign exchange reserves. In the Far East,foreign exchange reserves, as a share of importsof goods and services, were on average thesame during 1980-84 as they had been in 1975(Table 3.3). Latin America maintained thehighest average level of reserves among thefour regions during 1980-84, reflecting in part itsneed to finance debt-service payments, whichwere also generally higher than those in otherregions in this period. For Africa, which hadmaintained the largest current account deficitthroughout 1974-84, it was not surprising tofind that foreign exchange reserves declinedrapidly. While international reserves hadcovered 23% of the annual import bill in 1975,by 1984 the figure was only about 10%, orsufficient to cover only five weeks of imports.Moreover, as already noted, since 1978 thevolume of imports had annually declined. In the
Item 1974-1980 1980-1984 1974-1984
TERMS OF TRADE
Far East 26 26Latin America 15 2 17Africa 13 4 17Near East 4 3 7All regions 17 2 19
VOLUME OF EXPORTS
Far East 53 35 as
Latin America 21 13 34
Africa 5 13 gNear East 9 17 26
All regions 19 11 30
PURCHASING POWER OF EXPORTS
Far East 4 35 39
Latin America 0 11 11
Africa 8 16 24Near East 4 14 18
All regions 3 9 6
VOLUME OF IMPORTS
Far East 39 24 63
Latin America 2 14 12Africa 13 20 7Near East 44 43 87
All regions 10 0 10

as
TABLE 3.2. Debt-service payments as a percentage of total exports of goods and services, by region,' 1975, 1980-84
Based on the sample of 35 developing countries.b Seven countries only.Source IMF, International Financial Statistics Yearbook, various issues.
TABLE 3.3. Foreign exchange reserves as a percentage of total imports of goods and services, by region,' 1975,1980-84
Based on the sample of 35 developing countries.b Six countries only.Source IMF, International Financial Statistics Yearbook, various issues.
Near East, foreign exchange reserves alsodecreased rapidly in relation to the annualimport bill, partly because of the largeexpansion in the volume of imports, particularlyfood, that took place during the decade.
Domestic AdjustmentThe patterns of domestic adjustment by regionduring 1974-84 showed wide differences, asseen in the levels and trends of investment andnational savings (see also Figure 3.1).
During 1974-84, the sample countries in theFar East and Near East had the highest averagelevels of national savings (around 20% of GDP)and investment (23-25% of GDP).4 Whileinvestment rates were similar in Latin Americaand Africa (21%), national savings rates werehigher in Latin America (16%) than in Africa(14%), and tended to be more stable.
Total investment rates in the Far East during1974-84 increased each year except in 1984,and fluctuations in the current account deficitwere associated with higher investment rates. Adecline in investment rates began after 1976 inthe Near East and two years later in Africa.Investment rates in Latin America held fairly
Recall that national sayings equals domestic savingsminus net factor payments. Therefore, if the latter increases
while domestic sayings remain unchanged, national savings
will decline.
constant until 1980, and after deteriorating forthree years, showed some improvement in1984. They continued to fall, however, in theNear East and Africa.
Similarly, the underlying savings response wasmuch stronger in the Far East than in otherregions where national savings as a share ofGDP declined almost continually between 1977and 1983, reflecting the increasing flow of netfactor payments abroad. There was a sharpdrop in the share of investment financed bynational savings, particularly in Africa wherenational savings financed only 55% ofinvestment during this period.
After 1982, the current account deficitdeclined in all four regions; and while the mostsatisfactory pattern of domestic adjustmentwould have been to increase domestic savings,which offsets the fall in external savings toleave capital formation unaffected, this was notthe case. Between 1982 and 1984, no regionmanaged to raise both the rate of nationalsavings and investment. In Africa, the Far Eastand Latin America, the rates of national savingsimproved, but investment rates either continuedto fall (Africa) or showed no particular trend(the Far East and Latin America). In the NearEast, both national savings and investment ratescontinued to decline.
Region 1975 1980 1981 1982 1983 1984
Far East 11.3 8.4 9.1 11.2 13.7 13.6
Latin America 14.4 21.3 25.4 28.0 26.7 27.1
Africa 6.5 14.7 17.1 17.9 19.4 22.5"
Near East 17.6 17.9 17.9 18.4 19.2 23.5
All regions 11.3 15.3 17.5 19.1 20.0 21.2
Region 1975 1980 1981 1982 1983 1984
Far East 23.4 29.6 22.0 20.8 22.1 21.4
Latin America 18.4 35.9 24.2 25.4 21.6 29.1
Africa 22.8 15.7 12.0 10.8 12.6 10.4"Near East 21.0 21.2 13.5 13.3 11.7 9.4
All regions 21.5 25.7 18.2 17.2 17.5 17.6

BOX 3.2
Agriculture's share ofinvestment
An important policy issue is theshare of agricultural investment intotal investment required toachieve agricultural and overalleconomic growth objectives.Attempting to answer it involvesthe use of incremental capitaloutput ratios (ICOR), which shouldbe regarded as useful rules ofthumb rather than reliable targetsor indicators of performance.
Nevertheless, if reliable data onagricultural output and capitalformation are available, agriculturalICOR can be calculated for periodsof time sufficiently long for randomfluctuations in outlook to besmoothed out, but not longenough for output to besignificantly affected by shifts intechnology or other structuralchanges. Clearly, a goodknowledge of a country'sagricultural sector within theoverall economy is necessary todetermine the length of theseperiods.
The share of agriculturalinvestment of total investment canbe determined for planningpurposes from the followingrelationship.
IA/If =gA/gT GDPA/GDPT ICORA/ICORT1
Where the new expressions are:
I = investment= growth rate of output
Subscripts A and T =agricultural and total (for theeconomy) respectively.
Using some typical figures, gA, =4%, gr = 5%, GDPA/GDPT =25%, ICORA = 3.3 (the medianICORA for the 21 country sample);and ICOR-1- = 4.
Expressing these in decimals, lAilf= 0.04/0.05 x 0.25 x 3.3/4 =0.165
In other words, to achieve atarget agricultural growth rate of4% a year, on the aboveassumptions, agriculture's share oftotal investment should be16-17%. The computed figures arerather sensitive to changes in thevariables. For example, changingICORA from 3.3 to 4 in the above
example will raise the agriculturalinvestment rate to 20%.
Of course very importantquestions remain unanswered bysuch rule of thumb methods: theareas of investment in agriculturethat should be given priority; thelevels of recurrent expenditureavailable to sustain the investment;investment in non-agriculturalsectors such as transport, directlysupporting agriculture; and theoverall policy and incentiveframework within which theinvestment is taking place.
Nevertheless, unless one hasgood reason to believe that theICOR are changing rapidly or willbe changing during a planningperiod (and if so, why), the methodis a starting-point for settingsectoral investment targets.
' There are alternative formulations. Forexample, the capital requirement for
agriculture can be determined from gkr/s
where g is the desired growth rate ofagricultural output, k is ICORA, r the share
of agriculture in GDP and s the proportion
of GDP going to gross capital formation.See Rajkrishna, "Some Aspects of Agricul-
tural Growth, Price Policy and Equity in
Developing Countries", Food Research
Institute Studies, vol. 18, no. 3, 1982.
87

88
AGRICULTURAL 'PERFORMANCE
While these economic adjustments werecontinuing, how did the agricultural sectors ofthe 35 developing countries perform? In aneconomic sense, agricultural performance hereis measured by (i) growth in value added(agricultural GDP); (ii) the sector's contributionto reducing the current account deficit bygenerating a trade surplus (external adjustment);and (iii) closing the investment-savings gap(domestic adjustment).
Growth of Agricultural Value AddedFor the 35 countries as a group, total GDPgrew faster than agricultural GDP (Table 3.4).During 1974-80, total GDP per caput rose onaverage 2.6% a year, compared with anaverage per caput rise of only 0.2% a year inagricultural GDP. During 1980-84, however, bothtotal GDP and agricultural GDP failed to expandas quickly as population, although the fall intotal GDP per caput (about 0.7% a year) wasless than that of agricultural GDP per caput(-1.1% a year). Nevertheless, the setbacksustained by agriculture in 1980-84 was lessthan that of the economy as a whole. Growthof agricultural GDP was halved in 1980-84compared to 1976-80, but growth of total GDPfell by two-thirds. In this respect, agriculturemade some contribution to stabilizing total GDPgrowth.
In Africa, there was zero growth inagricultural GDP during 1980-84, and agriculturalvalue added expanded only half as quickly asdid population for the decade as a whole(1974-84). The poor performance of Africanagriculture, exacerbated by the drought of1983-84, was a source of the region's overalleconomic crisis. Agricultural performance inLatin America was little better than in Africaand growth of agricultural value added slowedconsiderably in 1980-84. Agriculture performed,however, much better than the region'snon-agricultural sectors as the debt-relatedeconomic crisis unfolded in the 1980s. In theNear East, the rapid growth in agricultural valueadded in 1974-80 was not sustained in 1980-84,although agricultural GDP just managed to keeppace with growth in population over thedecade as a whole. Here again, theperformance in the Far East outstripped that ofother regions, where agricultural GDP per caputincreased steadily in 1974-80, and furtherimproved in 1980-84.
As total GDP grew more quickly than
agricultural GDP in all regions during 1980-84,the share of agriculture in total GDP declinedquite sharply, particularly in countries in the FarEast and the Near East where non-agriculturalGDP grew particularly fast (Figure 3.2). Theshare of agricultural GDP in these latter tworegions declined by four percentage pointsbetween 1974-80 and 1980-84, falling from 32%to 28% of total GDP in the Far East, and from28% to 24% of total GDP in the Near East.The agricultural sector remained the largest inAfrica where it accounted for 35% of totalGDP in 1974-80, compared with only 15% ofGDP in Latin America. In both these regions,the share of agricultural GDP declined by twopercentage points between 1974-80 and1980-84.
Agriculture and the Current Account DeficitThe links among trade, savings, investment andeconomic growth underlie the well-knownconcept of the gains from trade. Exports allowa country to specialize in the production ofcommodities in which it has a comparativeadvantage. In this way it can economize onresources that can be used for investment topromote economic growth. Similarly, a countrycan bring unutilized agricultural resources intouse to produce commodities for exportmarkets the vent for surplus argument. Anagricultural trade surplus permits imports ofgoods for which there are no or only imperfectdomestic substitutes, relieve productionbottlenecks and so increase savings andinvestment. As the agricultural sector continuesto dominate the economies of most developingcountries, the agricultural trade surplus plays animportant role in development finance.
Turning to the 35-country sample, thevolume of agricultural exports expandedproportionately less than the volume of totalexports during 1974-84 in all regions (exceptAfrica in 1980-84), reflecting in part poorerprospects for agricultural commodities on worldmarkets than non-agricultural products, and theslower rate of agricultural growth than totalgrowth (Table 3.5).5 The 35 countries as a grouphad only a 5% improvement in the volume oftheir agricultural exports, with all of theincrease coming in 1980-84. Nevertheless, thevalue of agricultural exports benefited from thecommodity price boom of 1975-77.
5 See Table 3.1 for data on total merchandise exports ofthese countries.
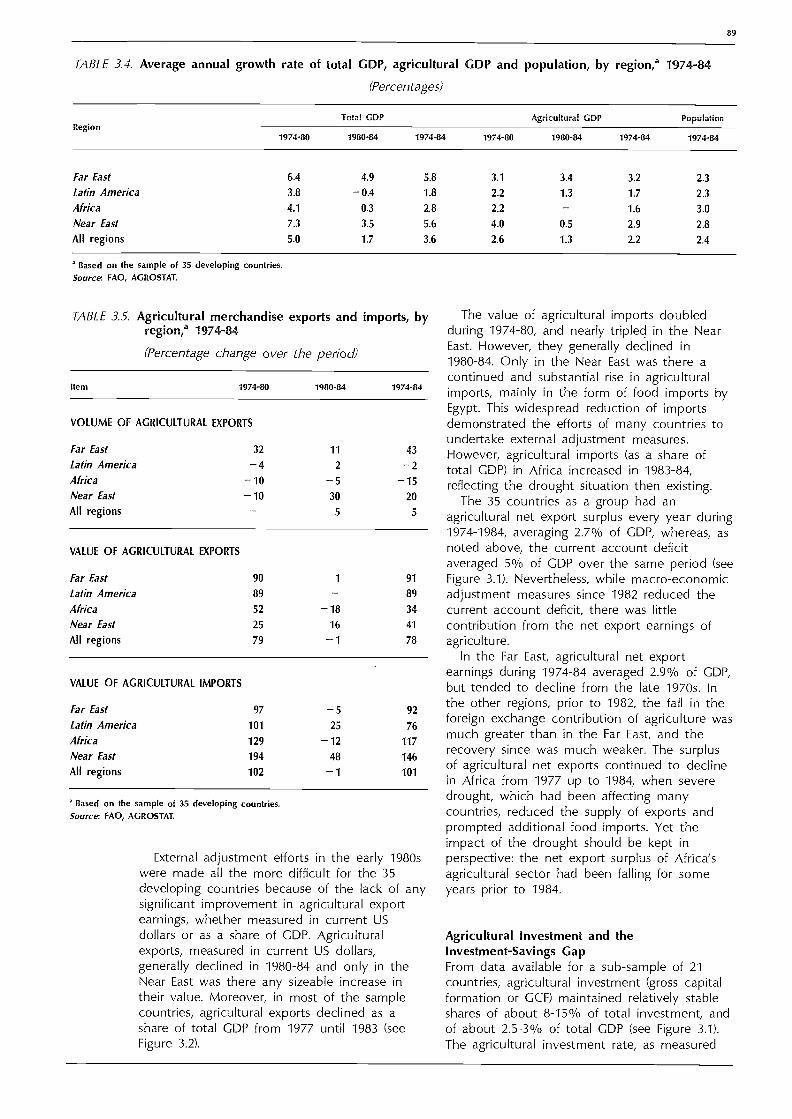
TABLE 3.4. Average annual growth rate of total GDP, agricultural GDP and population, by region,' 1974-84
(Percentages)
Based on the sample of 35 developing countries.Source: FAO, AGROSTAT.
TABLE 3.5. Agricultural merchandise exports and imports, byregion,a 1974-84
(Percentage change over the period)
Based on the sample of 35 developing countries.Source: FAO, AGROSTAT.
External adjustment efforts in the early 1980swere made all the more difficult for the 35developing countries because of the lack of anysignificant improvement in agricultural exportearnings, whether measured in current USdollars or as a share of GDP. Agriculturalexports, measured in current US dollars,generally declined in 1980-84 and only in theNear East was there any sizeable increase intheir value. Moreover, in most of the samplecountries, agricultural exports declined as ashare of total GDP from 1977 until 1983 (seeFigure 3.2).
The value of agricultural imports doubledduring 1974-80, and nearly tripled in the NearEast. However, they generally declined in1980-84. Only in the Near East was there acontinued and substantial rise in agriculturalimports, mainly in the form of food imports byEgypt. This widespread reduction of importsdemonstrated the efforts of many countries toundertake external adjustment measures.However, agricultural imports (as a share oftotal GDP) in Africa increased in 1983-84,reflecting the drought situation then existing.
The 35 countries as a group had anagricultural net export surplus every year during1974-1984, averaging 2.7% of GDP, whereas, asnoted above, the current account deficitaveraged 5% of GDP over the same period (seeFigure 3.1). Nevertheless, while macro-economicadjustment measures since 1982 reduced thecurrent account deficit, there was littlecontribution from the net export earnings ofagriculture.
In the Far East, agricultural net exportearnings during 1974-84 averaged 2.9% of GDP,but tended to decline from the late 1970s. Inthe other regions, prior to 1982, the fall in theforeign exchange contribution of agriculture wasmuch greater than in the Far East, and therecovery since was much weaker. The surplusof agricultural net exports continued to declinein Africa from 1977 up to 1984, when severedrought, which had been affecting manycountries, reduced the supply of exports andprompted additional food imports. Yet theimpact of the drought should be kept inperspective: the net export surplus of Africa'sagricultural sector had been falling for someyears prior to 1984.
Agricultural Investment and theInvestment-Savings GapFrom data available for a sub-sample of 21countries, agricultural investment (gross capitalformation or GCF) maintained relatively stableshares of about 8-15% of total investment, andof about 2.5-3% of total GDP (see Figure 3.1).The agricultural investment rate, as measured
89
1974-80 1980-84 1974-84 1974-80 1980-84 1974-84 1974-84
Far East 6.4 4.9 5.8 3.1 3.4 3.2 2.3
Latin America 3.8 -0.4 1.8 2.2 1.3 1.7 2.3
Africa 4.1 0.3 2.8 2.2 1.6 3.0
Near East 7.3 3.5 5.6 4.0 0.5 2.9 2.8
All regions 5.0 1.7 3.6 2.6 1.3 2.2 2.4
Item 1974-80 1980-84 1974-84
VOLUME OF AGRICULTURAL EXPORTS
Far East 32 11 43
Latín America -4 2 -2Africa -10 -5 -15Near East -10 30 20
All regions 5 5
VALUE OF AGRICULTURAL EXPORTS
Far East 90 1 91
Latin America 89 89
Africa 52 -18 34
Near East 25 16 41
All regions 79 -1 78
VALUE OF AGRICULTURAL IMPORTS
Far East 97 -5 92
Latin America 101 -25 76
Africa 129 -12 117
Near East 194 48 146
All regions 102 --1 101
RegionTotal GDP Agricultural GDP Population

go
by the share of agricultural GCF of agriculturalGDP, was much more variable, however, withan average figure of 13% but a range of5-29%.
This overall picture leads to two generalconclusions on agricultural investment indeveloping countries:
Agricultural investment rates tend to behigher as per caput incomes rise and the shareof agriculture of total GDP typically decreases;and
The share of agricultural investment in totalGCF moves in the opposite direction, however,showing that lower-income countries tend toinvest relatively more in agriculture.
Therefore, agricultural investment intensifies(i.e., has a rising share of agricultural GDP) aseconomic development proceeds.
These two relationships of agricultural
o-I
74 75 76 77 78 79 80 81 82 83 84
Sources: World Bank, FAO, Policy Analysis Division
investment to income levels and the share ofagriculture in the economy, allow attempts tobe made to identify countries that are or havebeen investing in agriculture more than: (a)their income levels indicate, a measurement ofinvestment effort; and (b) the agricultural sharesof their GDP apparently warrant, as measuredby a standardized index.
As might be expected, the results of thesemeasurements using investment data from alimited sample of countries is not conclusive,although some countries, such as India, Kenya,Pakistan and Tanzania, stand out as havingmade a significant investment effort inagriculture during the 1970s and early 1980s.Some of these countries also have recordedincreases in agricultural output in recent yearsthat are better than the average, but therelationships do not appear to be significant.
% of GDP % of GDP
40 - 40 -FAR EAST LATIN AMERICA
35 - 35 -
30 - 30 -
25 - 25 -
20 - 20 -
15 - 15-W
10 - 10 -
5 - 5 -
o- 1 1 1 1 1 1 1 0
74 75 76 77 78 79 80 81 82 83 84 74 75 76 77 78 79 80 81 82 83 8440 - 40 -
AFRICA NEAR EAST35 - 35 -
30 30
25 - 25 -
20 - 20 -
15 - 15 -
10 - 10 -
5- 5 -
0- 0 -74 75 76 77 78 79 80 81 82 83 84 74 75 76 77 78 79 80 81 82 83 84
40 -ALL REGIONS
35 -
30 - , Agricultural GDP
25 - Agricultural exports
20 -
15 - Agricultural imports
10 -Based on a sample of 35 Developing Countries
5 -
Figure 3.2 AGRICULTURAL GDP, EXPORTS AND IMPORTS AS A SHARE OF TOTAL GDP, BY REGION*, 1974-84

Furthermore, when relating the limited statisticalinformation on price policies as measured byprice bias to investment effort, someinconsistencies in policies are apparent.6 Suchinconsistencies are shown by agricultural pricesbeing strongly biased against producers on theone hand, while a significant investment efforttoward agriculture has been made on theother. The evidence is not conclusive, however,one reason being that it is difficult to get anunambiguous measurement of price bias.Another is that clearly some governmentsbelieve investment to be a more powerfulpolicy tool than producer prices to promoteagricultural development.
Returning to the 1974-84 period of economicadjustment under review, no major trend inagricultural investment is apparent, but therewas some falling away in 1979, parallel withthat seen in total investment. Hence,agricultural investment apparently suffered littlefrom the pressures to close theinvestment-savings gap. One reason may bethat in most countries a relatively large shareof agricultural investment is private (50-60% istypical), and much of private investment isnon-monetized and in the form of own-labourin such activities as land improvements,building stockyards and rearing livestock. Ananalysis of investment data for 21 countries,prepared for FAO's study Agriculture: Toward2000, showed that typically 30-33% of totalagricultural investment could be accounted forby such activities. Therefore, agriculturalinvestment is not likely to be very sensitive tochanges in policies operating through prices,interest rates, etc. Another possibility is thatestimates of agricultural investment are notaccurate enough to capture relatively minor,but nevertheless significant changes in them.
Reliable' data on agricultural savings are notavailable for a sufficient number of countries.Hence, the net contribution of the agriculturalsector toward the investment-savings gap onthe side of savings cannot be quantified withany accuracy. The potential for mobilizingadditional savings from rural areas for use inprofitable investment opportunities in theprivate sector, and to help finance the fiscaldeficit, will be discussed later in the section onrural financial markets. The financing ofgovernment revenues through agriculturaltaxation is addressed in the next section on thefiscal budget.
6 For a description of price bias, see FAO, "Agricultura! Price
Policies: Issues and Proposals", Rome, 1987.
91
In conclusion, the performance of theagricultural sector, in terms of its rate ofgrowth in value added and its contribution tothe current account deficit andinvestment-savings gap, has not been uniformlysatisfactory, although the data available areincomplete. During a period when majoradjustments in the structure of the economiesof most developing countries were taking place,with some exceptions, agricultural growth fellback and its trade surplus declined (the externaladjustment typically being achieved through thecompression of merchandise imports), butinvestment in the sector was not noticeablyreduced. Only in its contribution to GDPgrowth did it prove to be a reasonably robustperformer in some regions. As noted, however,the regional performance was very diverse.Some of this disappointing performance stemsfrom elements external to the agricultural sectoritself, particularly the deterioration in agriculturalterms of trade and the slowdown in growth ofagricultural exports volumes because of theeconomic recession during the early 1980s. Yetthis experience poses questions regarding theefficiency of agricultural investment andgovernment expenditures on the sector and thepolicy framework in which they were set.

92
THE FISCAL BUDGET
IntroductionA broad picture of the different components ofagricultural finance can be obtained by breakingdown further the right-hand or domestic side ofthe national accounting identity introduced atthe beginning of Section 2. This provides aframework for the further analysis of eachcomponent although, to simplify matters, thedistinction between current and capital accounttransfers is not too rigorously made.'
(M X + = (IG + G + (lp Sp)
foreign sector public sector private sector
The right-hand side of the identity iscomposed of the public sector (or fiscal budget)and the private sector, which will be discussedin a following section.
Within the public sector:
1G capital formation by the public sector,or the development budget.public sector consumption expenditures,or the recurrent budget.
= tax and non-tax revenues (forconvenience all sources of fundsaccruing to public authorities may beincluded here).
The major uses and sources of fiscal financerelated to agriculture include on the side ofuses (lc and G):
capital and recurrent expenditures onagriculture by parent ministries and agriculturalparastatals; andon the side of sources (T):
revenue from external borrowing foragriculture, including official and officiallyguaranteed loans on concessional andnon-concessional terms;
grants of development assistance, includingfood aid that finance agricultural projects andprovide budgetary support; and
7 For example, R comprises private and official unrequited
transfers. Migrant worker remittances and interest pay-ments on private external debt comprise the bulk of privatetransfers and may be regarded as current. The maincomponent of official transfers is grants of developmentassistance, a capital transfer.
domestic revenues raised, includingagricultural taxation.
These however, do not encompass allgovernment expenditures and revenues relatedto agriculture and provide only a generalindication of the size and pattern of fiscalfinance for agricultural development. Particularattention is paid in this section to the financingof agriculture in the 1980s, at a time whendomestic adjustment measures have sought toreduce the overall fiscal deficit.8
Overview of the Fiscal BudgetFor the 35 countries as a group, total centralgovernment expenditure occupied a largc andrising for much of the periodpart of theireconomies, averaging one-quarter of their totalGDP during 1974-83 (Figure 3.3). Among theregions, the share ranged from 21-22% in LatinAmerica and the Far East, 28% in Africa and35% in the Near East. The pattern shows thattotal expenditure increased steadily between1974 and 1982, but was cut back sharply in1983 as a result of domestic adjustmentmeasures. Data for 18 of the 35 countriesindicate that the downward trend continued in1984.
Central government expenditure as a share oftotal GDP rose six percentage points between1974 and 1982 for the 35 countries as a group,with much of this increase coming in 1974-75,as the budgetary effects of the first oil pricerise in 1973 were felt. It continued to driftupwards from 1976 to 1979. With the secondoil price rise in 1979, it increased further andreached a peak in 1982, when it averaged 28%of GDP.
The fiscal deficit followed a pattern similar tothat of total central government expenditure.For the 35 countries as a group, the deficitcontinued to widen from 2.2% of GDP in 1974to 8.6% of GDP in 1982, after which itdecreased. By 1983, the overall size had been -cut back to 7.1% of GDP, and data availablefor 18 of the 35 countries suggest that it wasfurther reduced in 1984. The four regions eachfollowed a similar pattern with the overalldeficit rising until 1982, when it reached 8.3%in the Far East, 8.6% in Africa and the NearEast, and 9% in Latin America. The overall
While data on agricultural expenditure are presented forthe sample of 35 countries during 1974-84, information onexternal and domestic sources of revenue related to
agriculture was difficult to obtain for this period. Hence,attention has been focused on the 1980-84 period.

deficit was reduced in all regions in 1983, withthe sharpest cutback occurring in the Far East.Data on eight of the nine countries in the FarEast show that by 1984, the fiscal deficit in theregion had been reduced to 5.9% of GDP,which was the size of the deficit prevailing inthe late 1970s, prior to the second oil priceincrease.
Efforts to trim the size of the fiscal deficit inthe early 1980s were made more difficult bythe decline in total revenue. The decline wasdue primarily to a reduction in non-tax revenueand external grants. Total revenue had risenfrom 1976 until 1980, when it reached 20.8% ofGDP. By 1983, this figure had declined by twopercentage points for the 35 countries as agroup. In the Far East, total revenue wasmaintained in the 1980s, but declined in LatinAmerica, Africa and the Near East. Total taxrevenue rose slightly during 1974-84 andaccounted for more than four-fifths of totalrevenue throughout this period. Most of thechanges in total revenue were due to majorfluctuations in non-tax revenue, particularlyexternal borrowings.
Agricultural Expenditure by the Public SectorAgricultural expenditure averaged 2.2% of GDPfor the 35 countries as a group during 1974-83,and remained remarkably constant, showinglittle tendency to follow the pattern of totalexpenditure (see Figure 3.3). Among the regions,
Figure 3.3 CENTRAL GOVERNMENT EXPENDITURE AND REVENUE AS A SHARE OF TOTAL GDP, ALL REGIONS*, 1974-83
%of GDP
30ALL REGIONS
20
10
o
-10
1974 1975 1976 1977 1978 1979 1980 1981 1982 1983
Total Total Total Agricultural ====.1 Fiscalexpenditure revenue tax revenue expenditures deficit
* Based on a sample of 35 Developing Countries Sources: Government Finance Statistics: FAO. Policy Analysis Division
however, agricultural expenditure ranged from1.5% to 1.9% of GDP in Latin America and theFar East, to 2.4% of GDP in Africa, and 2.8% inthe Near East. Between the earlier years(1974-80) and the latter years (1980-83), therewas a tendency for agricultural expenditure todecline slightly as a share of GDP in LatinAmerica and the Near East, while the shareremained relatively constant in the Far East andactually increased as a percentage of GDP inAfrica.
The proportion of total expenditure allocatedto agriculture increased in Africa in the early1980s, during a period of domestic adjustmentefforts to reduce the fiscal deficit. Agriculturalexpenditure (development plus currentexpenditures) averaged 7.7% of totalgovernment expenditure between 1974 and1979, and this share rose to 9.2% of totalspending in 1980-83. In contrast, the proportionof total government spending on agriculturewas lower in the other regions in the 1979-83period than in 1974-79 (Table 3.6).
Development expenditure on agriculture inthe Far East and the Near East declined as aproportion of total development expenditurefrom 1979, but rose in Africa and LatinAmerica.
Somewhat in contrast, the share ofagricultural current expenditure of totalexpenditure fell in all regions except Africa from1979. The share of current expenditure was alsosignificantly smaller than that of development
93

94
TABLE 3.6. Annual average central government agriculturalexpenditure, by region,' 1974-83
(Percentages)
Agricul-tural
develop-ment
expendi-ture
Agricul-tural
currentexpendi-
ture
Based on the sample of 35 developing countries.Source: IMF, Government Finance Statistics Yearbook, various years; and FAO.
TABLE 3.7. Growth in real agricultural expenditure' and theagricultural labour force, by region,b 1974-83
(Annual average percentage rates of growth)
Agricul-tural
labourforce
Semi-log regressions in 1980 prices deflated by GDP deflator.b Based on the sample of 35 developing countries.Sources IMF, Government Finance Statistics Yearbook, various years; World Bank,Poverty and Hunger: Issues and Options for Food Security in Developing Countries,1986; and FAO, AGROSTAT.
expenditure (between a third and a fifth),reflecting the lower recurrent cost requirementsof investment in agriculture compared withsome other sectors, especially service sectorssuch as health and education (see Box 3.3).Furthermore, current expenditure on agricultureis understated in many developing countries, asdata available exclude much of the spendingon or by agricultural parastatals. The fiscal costsof cereal imports, food subsidies, marketingboard losses, and the non-repayment ofagricultural loans are often financed directlyfrom the treasury rather than beingappropriated through the agricultural ministries.
As seen from Table 3.6, agriculturalexpenditure had a low share of totalgovernment expenditure, of about 8%, with aregional range of about 6-10% during 1974-83.It had a corresponding low share of agriculturalGDP, of between 6-12% on average, thehighest in the Near East and Latin America, theshare falling for Africa 8%), with the Far Eastthe least (6%). Nevertheless, some countriesdevoted a large share of government resourcesto agriculture in relation to the sector's GDP,more than 20% in such diverse countries asJamaica and Tunisia, and 20% in Mexico. Othercountries spent through their governmentbudget the equivalent of as little as 2% of theiragricultural GDP on the sector.
Trends in public sector expenditure onagricultureReal agricultural expenditure, measured in 1980prices and allowing for inflation, increased in allregions except in Latin America during 1974-83(Table 3.7). For the 35 countries as a group, itrose 4% a year during this period, andagricultural development expenditure increasedmore than 5% annually. There were wideregional differences, however.
For Latin American countries in the sample,real agricultural expenditure declined in eightout of the ten countries, and for the region,the decline averaged -1.1% a year during1974-83. While real agricultural developmentexpenditure continued to increase modestly,agricultural current expenditure fell 6.6% ayear, which suggests that most Latin Americangovernments tried to maintain agriculturalinvestment at the expense of currentconsumption. However, expenditures by stategovernments may not have been fully capturedby these data.
The opposite occurred in the Near Eastwhere there was a moderate overall increase intotal agricultural expenditure, enhanced by the
Item 1974-79 1979-83 1974-83
AGRICULTURAL EXPENDITURE AS %
OF TOTAL EXPENDITURE
(DEVELOPMENT + CURRENT)
Far East 10.4 9.6 10.1
Latin America 7.0 6.0 6.6
Africa 7.7 9.2 8.3
Near East 8.4 7.2 7.9
All regions 8.4 8.3 8.3
AGRICULTURAL DEVELOPMENT
EXPENDITURE AS % OF TOTAL
DEVELOPMENT EXPENDITURE
far East 23.8 18.7 21.8
Latin America 15.4 17.6 16.3
Africa 16.2 19.2 17.4
Near East 14.2 12.5 13.6
All regions 17.9 17.8 17.9
AGRICULTURAL CURRENT
EXPENDITURE AS % OF TOTAL
CURRENT EXPENDITURE
Far East 4.5 4.0 4.3
Latin America 4.5 3.9 4.2
Africa 4.8 5.6 5.1
Near East 5.4 4.9 5.2
All regions 4.7 4.7 4.7
Far East 7.2 8.6 5.8 1.2
Latín America -1.1 2.7 -6.6 0.7
Africa 6.3 6.5 4.4 1.7
Near East 3.4 2.8 8.0 0.3
All regions 4.0 5.2 2.9 1.0
Agricul-tural
expendi-Region ture
(develop-ment +current)

sample countries of the region having a lowrate of growth in their agricultural labour force.Agricultural current expenditure, however,increased at the expense of agriculturaldevelopment expenditure, approximating that ofinvestment. This disparity in development andcurrent expenditure paths was heavilyinfluenced by the Syrian Arab Republic and theSudan, where agricultural developmentexpenditure fell in real terms, althoughagricultural current expenditure increasedrapidly by 8-14% a year during 1974-83. Thissituation may have been caused by increasedgovernment intervention in agriculture.
The fastest growth in real agriculturalexpenditure was recorded in the Far East whereit rose 7.2% a year during 1974-83, andincreased in all nine countries of the sample. Inthe Far East, development and currentexpenditures on agriculture grew more in linewith each other during this period.Nevertheless, there were three countries in thesample whose growth rates in total expenditureon agriculture were low and not statisticallysignificant.
For the African countries in the sample,agricultural expenditure increased substantially,rising on average 6.3% a year during 1974-83.Real agricultural expenditure rose in all twelveAfrican countries, except Tanzania and Ghana;and development expenditure on agriculture isrecorded as growing notably fast. However,these trends are based on budgetappropriations, and actual expenditures may lagbehind in cases where institutional weaknessesare constraining government activities.
It is widely believed that governmentexpenditure tends to rise at a faster rate thanGDP, as per caput national incomes rise. Thisevolution reflects the increasing tax-bearingability of an economy as it grows, and thepolitical demand for increasing expenditure onsocial services or other governmentinterventions.9 In brief, this implies that theobserved income elasticity of public expenditureis greater than unity. It may be questionedwhether government expenditure on agriculturefits this pattern in countries in a relatively earlystate of economic development.
Taking GNP per caput to represent stages indevelopment, the 35 developing country samplewas divided into three groups with averageannual per caput incomes during 1974-83 of:
9 See R.S. Thorn, 'The Evolution of Public Finance During
Economic Development", The Manchester School, vol. 35,1967.
(i) up to $399 (14 countries); (ii) between $400and $1 099 (14 countries); and (iii) from $1 100(7 countries).
Regressing agricultural expenditure on percaput GNP for the 10-year observations,1974-1983, gave the following incomeelasticities:
Per caput GNP Currenta Developmenta Total'
= Significance at 1% level.
The income elasticities were not only high oreven greater than unity, but also highlysignificant. For example, in the case of thelow-income countries, a 1% increase in percaput income resulted in an increase inexpenditure on agriculture by 1.1°/o, with arather greater response with regard todevelopment expenditure. The elasticities tendedto be lower for medium and for higher incomecountries. The higher income countries werereceiving less development assistance whichtended to reduce the relative size of thedevelopment budget.
The results of other regressions on the sharesof agricultural expenditure in relation to GDPand in relation to total government expenditureagainst per caput income, for the same groupof countries, were also in line with expectations.As national incomes rose, agriculturalexpenditure's share of GDP increased, but at adeclining rate and the share actually fell in thehigher income group. Also, agriculture's share oftotal expenditure rose, but only very slowlywith income in the low-income group, and waslower in the medium- and higher-incomegroups. Thus, while expenditure on agriculturerose with rising incomes, expenditure on othersectors rose faster. This is to be expected, giventhe agricultural sector's declining relative size asan economy expands.
Vulnerability of Agricultural ExpenditureFew empirical investigations have been made ofagricultural expenditure's vulnerability tocutbacks or increases in total governmentexpenditure compared with expenditures inother sectors.19 As a measure of its
10 See N. Hicks and A. Kubisch, "Cutting GovernmentExpenditures in LDCs", Finance and Development, IMF,
September 1984.
95
Up to $399 1.042 1.174 1.200$400-1 099 0.689 1.177 0.931From $1 100 0.914 1.118 0.959

vulnerability, it was assumed that agriculturewas relatively well protected if real expenditureon it was reduced by less than theproportionate reduction in total realexpenditure, or if agricultural expenditure wasincreased relatively more than total expenditure.Calculations were made of the percentage rateof change in agricultural expenditure and totalexpenditure, measured in 1980 prices, for the35-country sample over the 1974-83 and1979-83 periods.
The results were inconclusive for the 35countries as a group, with agriculturalexpenditure being more vulnerable than totalexpenditure in half of the countries, andrelatively protected in the other half during1974-83 and 1979-83. On a regional basis, thepattern of vulnerability was more distinct,however. In the Far East, Latin America and theNear East, real agricultural expenditures weremore vulnerable than total expenditures intwo-thirds of the countries, and in onlyone-third were they actually protected. This wasin contrast with Africa where agriculturalexpenditure was more vulnerable than totalexpenditure in only three out of the 12countries, and it was well protected in morethan two-thirds of them. A similar regionalpattern also prevailed in the latter years1979-83.
The instability of agricultural expenditureDid the apparent trend toward maintainingagricultural expenditure in Africa affectdevelopment and current expenditures equally?Or was there a tendency to favour one overthe other? And how did the other regionscompare in this respect? Relatively little isknown about how changes in levels of totalexpenditure are allocated for development andcurrent purposes. In an attempt to quantify theinstability of agricultural expenditure, changes indevelopment and current expenditures weremeasured as the absolute deviation from alog-linear trend, measured in 1980 prices, usingthe GDP deflator.
In the Far East, Latin America and the NearEast, the instability in agricultural currentexpenditures was found to be greater than inagricultural development expenditures,suggesting that governments sought to protectagricultural investments (Table 3.8). The oppositepattern emerged in Africa, where the instabilityof agricultural development expenditure wasgreater than agricultural current expenditure ineight out of 12 African countries in the sample.This suggests that governments sought to raise
or reduce spending on agricultural investmentrather than change present consumptionpatterns. Overall, African countries had thehighest instability in agricultural real expenditure(development plus current), with percentagedeviations from the trend averaging 22%,compared with average deviations of between13-19% in the other regions during1974-83.
Some conclusionsFirm conclusions about domestic adjustmentand agricultural expenditure should not bedrawn from this non-random and small sampleof 35 countries, but there seems to have beenan effort toward maintaining agriculturalexpenditure in Africa not found in otherregions.
In the early 1980s, total expenditure wasreduced in all regions, but expenditure onagriculture in Africa was relatively wellprotected, whereas it was more vulnerable thantotal expenditure in the Far East, Latin Americaand the Near East. Other evidence shows thatin Africa, agricultural expenditure did notdecline in relation to GDP, or as a share oftotal expenditure. Moreover, agricultural currentexpenditure is seriously understated in manyAfrican countries where parastatal finance is notaccounted for by government ministries relatingto the agricultural sector, and so may not berecorded in government financial statistics. Theapparent bias toward maintaining realagricultural expenditure in Africa did not affectdevelopment and current expenditures equally,and the instability of development expenditurewas found to be greater than that ofagricultural current expenditure through thecentral government budget.
Despite the level of real agriculturalexpenditure sustained in the early 1980s, theagricultural performance in Africa wasdisappointing. There was zero growth inagricultural GDP during 1980-84, admittedlyadversely affected by drought, but agriculturalvalue added grew only 2.2% a year during1974-80, and thus significantly less thanpopulation. This warrants a closer examinationof the size and composition of expenditure byagricultural ministries and parastatals, and thepolicy framework influencing the effectivenessof spending by the public sector.
Very few empirical studies have been madeof public sector expenditure's contribution toagricultural growth. One recent study of ninecountries in Latin America found that suchexpenditures made a significant contribution

TABLE 3.8. Instability of real agricultural expenditure, byregion,' 1974-83
(Average percentage deviation from trend indexb)
Region
Agricul-tural
expendi-ture
(develop-ment +current)
Agricul-tural
develop-ment
expendi-ture
Agricul-tural
currentexpendi-
ture
Based on the sample of 35 developing countries.The absolute deviation from a log-linear trend index is used, and data have been
deflated by the GDP deflator in 1980 prices.Sources: IMF, Government Finance Statistics Yearbook, various years; and FAO.
during a 30-year period, 1950-80.11 Thecontribution of government expenditure onagriculture (GEA) to agricultural output washigh where GEA per hectare was also high.The average contribution was 8%, comparableto that of modern inputs such as fertilizers,and was greater the higher the share ofirrigation, research and extension componentsof GEA.
If the public input to agriculture was morebroadly defined to include expenditures oneducation, health and land reform, the first twobeing consistently the largest components ofthe total (in the Far East irrigation is generallythe largest component), the study concludedthat during a decade, agricultural output wouldhave been more than 10% less without thepublic input than with it.
This Latin American study was based on anexhaustive research of expenditure data at thelevels of central and state governments, andindependently administered governmentagencies or parastatals. This degree of researchwas needed for accurate estimates to ,he madeof all public sector expenditures and theircomponents. It could not be undertaken forthis chapter, however. Such a shortcomingidentifies a large area for future work.
Policies on public sector expenditure onagriculture are generally expected to increaseoutput by shifting the supply curve. Pricepolicies affect output without shifting thesupply curve, at least in the short run. The twosets of policies may be related because pricepolicies may have implications for expendituressuch as food subsidies. They will thus also haveimplications for the overall budget, and where
11 Victor J. Elias, Government Expenditures on Agriculture
and Agricultural Growth in Latin America, IFPRI Research
Report no. 50, Washington D.C., October 1985.
this is constrained, then expenditure on onecomponent can only be achieved by cuttingback on another, even if the overall level ofexpenditure is maintained. The trade-offsbetween such allocations merit exploration witha view to maximizing the contribution of thepublic sector input to growth in agriculturaloutput.
External Sources of Finance to Agriculture
OverviewExternal sources of capital to the governmentprovide support for both the balance ofpayments and the fiscal budget. The inflow offoreign exchange from the disbursement ofexternal loans and grants or grant-likecontributions, supplement export earnings, andwhen converted into local currency andchannelled through the fiscal budget, providean external source of revenue to financegovernment expenditures.
Total capital flows come from either officialor private sources. Recorded private flows arenormally officially guaranteed and disbursedthrough government or parastatal institutions.Private borrowings, if officially guaranteed, alsoadd to external public debt, and so areconsidered here with the fiscal budget.
Before continuing with the analysis of the35-country sample, a global perspective ofthese flows to the agricultural sector isnecessary. They comprise official commitmentsof external assistance to agriculture (OCA),which contain grants and concessional andnon-concessional loans from bilateral andmultilateral sources; food aid, the greater part(70%) of which is estimated to constitutegrant-like contributions, but may not bedesignated exclusively to agriculture; and privateexternal borrowings consisting of loans fromcommercial banks and supplier credits.According to the Organization for EconomicCooperation and Development (OECD),non-government organizations are alsoresponsible for mobilizing increasing resourcesto developing countries, an estimated $2 300million in 1983, of which about one-sixth of thisamount was allocated to agricultural and ruraldevelopment.
Assistance to agriculture from official sources.FAO maintains data on OCA made since 1974,and therefore reflect the flows since thewidespread acceptance by donors for the needto give priority to this sector. Total OCA grew5.6% a year (in 1980 prices) between 1974-76
97
Far East 13 15 20
Latin America 19 28 30
Africa 23 26 22
Near East 14 15 16
All regions 17 21 22

98
BOX 3.3
The recurrent cost problem
The inadequate financing ofrecurrent budgets, which is neededto properly operate and maintainprevious investments, isincreasingly recognized as a majorproblem.' Scenes of broken-downfarm tractors, inadequately fundedagricultural research centres andtraining institutions, or impassableroads because of a lack ofmaintenance will be easily recalledby anyone with agricultural fieldexperience. Adequate recurrentfunding is a chronic problem forlow-income countries with littlecapacity for raising governmentrevenues. Economic adjustmentefforts are likely to worsen theeffects if they focus mainly onreducing budgetary deficits bycurtailing expenditures. Therecurrent component of thecurrent budget is especiallyvulnerable in these situations.
The problem has been causedpartly by the increase indevelopment in recent years.Public investment has risen,supported, in many cases, by flowsof external assistance or fundedfrom external borrowings. Whilesome recurrent costs arising fromthese investments have beenfinanced from user charges, suchas for cattle dips or water chargeson irrigation schemes, assumingsuch charges would only covercost of repairs and maintenance, inmost cases recurrent expenditurefalls directly within the governmentbudget.
There are three principal reasonsfor the emergence of the recurrentcost problem:i) Recurrent costs are usuallyfunded out of the current budget,
generally associated withconsumption, as opposed to thedevelopment budget, relating toinvestment. There may be curbs orceilings placed on the growth ofthe current budget in attempts toreduce fiscal deficits.
A different mix of investmentprojeas will require different levelsof recurrent financing insubsequent years. Agriculturalinvestment usually is not verydemanding in this respect,requiring, for example, $10 a yearof recurrent expenditure per $100of investment. But ruraldevelopment projects and socialinvestments such as schools andhospitals have a much higherrequirement, of up to $70 per $100invested.2
The pressure of other budgetarydemands pre-empts the recurrentbudget. Demands for wageincreases in the civil service,military and security spending, etc.,often take priority in the allocationof limited funds. The cost ofunderfinancing existingdevelopment projects is not alwaysimmediately apparent and soreceives insufficient attention.
Was there evidence of a recurrentexpenditure problem provided bythe pattern of current anddevelopment expenditures of the35-country sample during 1974-84?A simple model was built linkingcurrent expenditure by countryand year to past development(capital) expenditure, and the rateof inflation, another cause ofunderfinancing. The regionalcoefficients showing the extent towhich current expenditure reflectedchanges in developmentexpenditure and inflation areshown in the table below.
1974-84
1% change in:
Development Inflationexpenditure
a Significance at the 1% level.b Significance at the 5% level.
The coefficients have the correctsign. A value of less than 1 impliesthat the change in currentexpenditure was less than thechange in developmentexpenditure or inflation. Thecoefficients were not significant fordevelopment expenditures in LatinAmetica and the Near East, andonly moderately significant (5%) forinflation in the Far East. During1974-84, there was a relativeundercompensation of currentexpenditure compared withdevelopment expenditures in Africaand the Far East, with the latterregion making relatively greatercompensatory efforts. A 10%change in developmentexpenditure was followed by a6.3% change in currentexpenditure in the Far East, forexample. The effect of inflation wasrelatively more important in LatinAmerica and the Near East inexplaining changes in currentexpenditure.
Without more detailedknowledge of the types ofdevelopment expenditure and theirimpact on recurrent requirements,(i.e., "R" coefficients seefootnote), as well as thenon-recurrent component ofcurrent budgets, one cannot judgewhether a given level of currentexpenditure has been adequate ornot.
A recent comprehensive survey is pro-vided in Recurrent Costs and AgriculturalDevelopment, J. Howell (ed.), Overseas
Development Institute, London 1985.
2 The recurrent expenditure implications of
investments in different activities have
been termed "R" coefficients. The figuresquoted are meant to give orders of mag-nitudes. See P. Heller, 'The Under-financing
of Recurrent Development Costs", Finance
and Development, IMF, March 1979.
ok change in currentexpenditure
Far East 0.633a 0.103bLatin America 0.054 0.598'Africa 0.385a 0.204aNear East 0.172 0.301a

and 1982-84 (Table 3.9). Within this overallgrowth, however, the rate slowed between thethree-year intervals spanning this period,indicating a secular decline.
There was little overall difference in theaverage growth rates of concessional andnon-concessional commitments between 1978and 1984. Although in the late 1970sconcessional flows increased 47% comparedwith 18% for non-concessional flows, thissituation changed soon thereafter, withconcessional commitments increasing by only8%, but non-concessional by 40% in 1982-84.Multilateral assistance to agriculture grew fasterthan bilateral aid, 6.5% a year compared with4.4% a year. The growth in debt-creatingnon-concessional commitments from theregional banks was nearly 14% a year.
Most OCA is for capital instead of currentexpenditure, but the share for the latter hastended to rise along with the trend for moreprogramme and budget support. Otherimportant changes that have taken place duringthe past decade have been declines in theshares of (i) local manufacture of inputs, and(ii) livestock production; and rises in the sharesof (i) external supply of production inputs,
research, extension and training, andregional development (Table 3.10).
Regarding the regional distribution of OCA,the Far East region received the greatest share,46% during 1982-84. Commitments to Africagrew fastest between 1974-76 and 1982-84 (8%a year in the Far East and 10.4% a year inAfrica, in 1980 prices). During 1974-84,commitments in real terms grew 6% a year inLatin America, but by very little in the NearEast.
Concessional commitments grew particularlyfast in Africa during 1974-84 (11.80/0 a year),while non-concessional commitments grewfastest in Latin America (9.6% a year). Duringthis period, the shares of total commitments tofood-deficit countries increased from 59% to65%, and in LDCs, from 16% to 19%.
Relating these regional shares to agriculturalpopulation and per caput income, the Far Eastgets a less than proportional share of OCA,even when China is excluded (Table 3.11). LatinAmerica's share has fallen, but relative toagricultural population, it receives almost threetimes the level of OCA in the Far East.
Disbursements of OCA. Data ondisbursements of OCA are available only from1980. Since then, disbursements have reflectedthe earlier trend of commitments. There hasbeen a marked increase in World Bankdisbursements reflecting the Bank's earlier
99
increase in commitments to agriculture.Recently, World Bank disbursements toagriculture have exceeded commitments, whichalso reflect a slowdown in growth of the latter.
An analysis of disbursements of OCA since1980 was undertaken in greater depth for asample of countries. During 1980-83, there wasa statistically significant, but not strongrelationship between the levels of per caputagricultural GDP and disbursements asmeasured by (i) disbursements, as a percentageof agricultural GDP (average 3.5% with a rangeof 0.2% to 14%); (ii) disbursements per caputagricultural labour force in constant 1980 dollars
average $36 with a range of $4 to $206;and (iii) disbursements as a percentage ofgovernment expenditure in agriculture (average32% with a range of less than 1% to 87%).The signs of the coefficients showed that withhigher agricultural income, disbursements (as aproportion of agricultural GD P and totalexpenditure on agriculture) fell, as might beexpected. The size of the coefficients, however,also showed that some low-income countrieswere receiving proportionally less disbursements,and some higher-income countries,proportionally more. The largest recipients ofOCA are not necessarily those in greatest need.Further analysis also showed a positive andstatistically significant correlation between thelevels of OCA received by a country and itsdevelopment expenditure on agriculture. Asmight be expected, the relationship betweenOCA and current expenditure was muchweaker.
External private lending. The "privatization" ofborrowings by developing countries was aremarkable feature of the 1970s and continuedtill 1981. Private-sector lending (i.e., bank sectoror private financial institutions and suppliercredits) grew from 15% of total long-termresource flows to all sectors in 1970, to 29% in1973, and a later peak of 32% in 1981, beforedeclining sharply.
For agriculture, however, external privatelending has been much less important as asource of finance. Data available for 82countries showed that during 1982-84, privatecommitments to agriculture averaged $1 014million a year (in current dollars), comparedwith $2 083 million during 1980-82 and $1 157million during 1974-76 (Table 3.12).
Flows of external private funds to agriculturehave been highly erratic at the country andregional levels according to available data.During 1980-83, they averaged less than 1% oftotal disbursements to Bangladesh, but nearly60% to Nigeria. This performance is linked to

100
TABLE 3.9. Overall trends in official commitments to agriculture (OCA) a (including technical assistance grants),1974-84
(1980 US$ millions/year) b
Broad definition.b The UN value index for manufactured exports is used as a deflator.'Rate of change based on exponential trend fittings to annual data.a Not statistically significant at the 10% level.'Including UNDP, CGIAR, FAO/TF, FAOTTCP.Sources: FAO and OECD.
the eligibility of countries to receive resourceson concessional terms, the degree ofgovernmental involvement in agriculture, andthe overall credit-worthiness of individualcountries.
At the regional level, the most notablefeatures during 1974-84 were the relatively largeamounts flowing to a few African countries, andthe recent sharp increase in flows to the Far
East (mainly Indonesia and the Philippines)which was more than offset by declines incommitments to Latin America and Africa. InBrazil, private flows of total commitments fellfrom 46% in 1980 to less than 1% in 1983; inPeru, the shares were 69% in 1981 and 13% in1983.
When private flows to agriculture werecompared with disbursements of official
Item 1974-76 1976-78 1978-80 1980-82 1982-84
Annualrate of
change'1974-84
(%)
CONCESSIONAL COMMITMENTS 5 341 6 581 7 854 8 476 8 500 5.5
Multilateral 2 223 2 742 3 272 3 600 3 390 5.7
IDA 968 1 287 1 681 1 721 1 666 6.3
Regional banks 604 694 804 861 698 29dOPEC multilateral 80 138 105 150 174 12.6
Otherse 396 398 406 491 542 4.8
Bilateral 3 119 3 840 4 583 4 867 5 109 5.5
DAC/EEC 2 742 3 492 4 381 4 429 4 684 6.1
OPEC bilateral 377 348 201 438 425
NON-CONCESSIONAL COMMITMENTS 2 876 3 461 3 396 3 939 4 761 5.7
Multilateral 2 384 2 994 3 075 3 775 4 509 7.2
IBRD 1 982 2 486 2 445 2 642 3 192 4.3
Regional banks 399 489 614 1 099 1 220 13.6
OPEC multilateral 4 19 8 16 75 65.5
Bilateral 492 467 322 164 252 8.8DACEEC 287 348 271 162 252
OPEC bilateral 205 119 52 210.1
TOTAL COMMITMENTS 8 219 10 042 11 249 12 406 13 261 5.6
Multilateral 4 608 5 736 6 346 7 375 7 900 6.5
IBRD/IDA 3 125 3 973 4 126 4 362 4 858 4.6
Regional banks 1 003 1 183 1 418 1 960 1 918 8.8
OPEC multilateral 84 158 112 166 249 15.7
Others e 396 398 406 492 542 4.8
Bilateral 3 611 4 306 4 904 5 031 5 361 4.4
DAC/EEC 3 029 3 840 4 652 4 591 4 935 5.6
OPEC bilateral 582 466 252 440 425 7.1d
Memorandum item: in current prices, million $ 5 002 7 146 10 075 11 795 11 724 11.1

TABLE 3.10. Percentage distribution of OCA, by purpose,developing countries, mid-1970s and early 1980s
Sources: FAO and OECD.
assistance since 1980, there was a weak butpositive correlation between the two sources,indicating some complementarity. In otherwords, countries borrowing more from privatesources also received more official assistance(both concessional and non-concessional) andvice versa. The correlation was strongerbetween private and non-concessional officialflows, which would be expected.
Food Aid. The value of food aid grew byabout 40/e a year, in terms of current dollars,during 1974-84 (Table 3.13). This overall growthreflected a rapid increase in the late 1970s,followed by a period of relative stagnation.Shipments of cereals (grain equivalent) increasedagain from about 1983 mainly in response tothe African food emergency. Lower cerealprices meant that larger shipments were nottranslated into greater values, however.
Multilateral food aid through the World FoodProgramme (WFP) has grown by about 9% ayear, almost three times faster than bilateralaid, so that its share currently approaches aquarter of the combined total. As multilateralfood aid is entirely on a grant basis, togetherwith a sudden increase in bilateral food aid asgrants in most recent years, the grantcomponent of food aid has recently increasedto nearly three-quarters of the total. Anotherfeature, has been the rapid increase of theemergency component of multilateral food aid,as reflected in the growth of shipments throughthe WFP's International Emergency FoodReserve (IEFR), set up in 1976.
Food aid as a resource is not necessarilydesignated to agricultural activities, but may beused for general budgetary support through thegeneration of counterpart funds. Nevertheless,two-thirds of food aid through the WFP isnon-emergency aid and mostly designated to
12 Note that the estimated value of food aid flows is
included in ODA but not in OCA. The relative proportionsof food aid shown exclude aid from the Council for Mutual
Economic Assistance (CMEA).
" Disbursements cover official loans from bilateral andmultilateral sources, plus private credits officially guaran-teed from financial institutions, supplier credits, nationaliz-ation and bonds. Net disbursements, alternatively known as
net transfers, are defined as gross disbursements minusdebt-service payments of principal and interest.
101
agricultural or infrastructural developmentprojects. Much bilateral aid, however, isprogramme aid or for general budgetarysupport. It is more meaningful, therefore, tolook at food aid in the context of officialdevelopment assistance (ODA) to all sectors,rather than comparing it to concessionaldisbursements to the agricultural sector alone.The proportion of food aid in relation to ODAto all sectors, which had been about 14% in1974-76, but then fell back with the rapidgrowth of ODA in the late 1970s, has recentlyrecovered a little. In 1982-84, however, food aidwas equivalent to 9.4% of ODA to all sectors,but was on a rising trend due to the Africanfood emergency.12
The 35-country sample: the external sectorHaving briefly surveyed the global dimensions ofthree sources of government finance, potentiallyfor use in agriculture, a closer analysis is madehere with regard to the 35-country sample. Theflows have been divided into two types:(i) disbursements of credits or loans, whetheror not on concessional terms, which aredebt creating; and (ii) grants or grant-likecontributions, which are not debt creating.
Disbursements of credits or loans. Thecurrent value of external gross disbursements toagriculture for the 35 countries as a groupaveraged $4 385 million annually during 1980-84(Table 3.14).13 Although it remained relativelyconstant each year throughout this period, itwas slightly higher in 1984 than it had beenduring the previous four years. Similarly, in theFar East, Latin America and the Near East, in1984 the current value of gross disbursementsto agriculture was the same or slightly higherthan it had been during the previous fouryears. But in Africa, gross disbursements toagriculture declined and net disbursementsturned negative. The regional distribution washighly skewed, with the Far East receiving 45%
Use of OCA Mid-1970s Early 1980s
Land and water development 18 17
Agricultural services 9 11
Supply of production inputs 3 6
Crop production 5 7
Livestock production 5 2
Fisheries 2 3
Research, extension, training 2 4
Rural development and infrastructure 18 22
Manufacture of inputs 14 4
Agro-industries 7 6
Forestry 3 2
Regional development 3 5
Unallocated 11 11
TOTAL 100 100
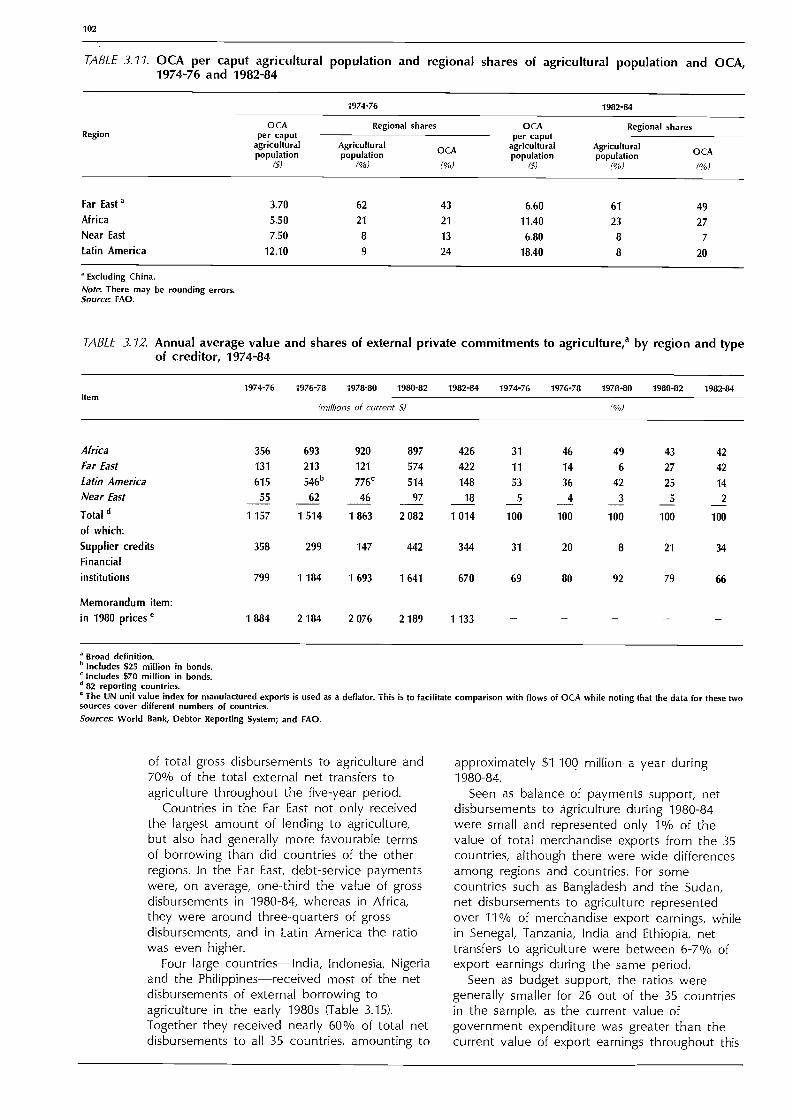
102
TABLE 3.11. OCA per caput agricultural population and regional shares of agricultural population and OCA,1974-76 and 1982-84
Excluding China.Note: There may be rounding errors.Source: FAO.
TABLE 3.12. Annual average value and shares of external private commitments to agriculture,' by region and typeof creditor, 1974-84
of total gross disbursements to agriculture and70% of the total external net transfers toagriculture throughout the five-year period.
Countries in the Far East not only receivedthe largest amount of lending to agriculture,but also had generally more favourable termsof borrowing than did countries of the otherregions. In the Far East, debt-service paymentswere, on average, one-third the value of grossdisbursements in 1980-84, whereas in Africa,they were around three-quarters of grossdisbursements, and in Latin America the ratiowas even higher.
Four large countries India, Indonesia, Nigeriaand the Philippines received most of the netdisbursements of external borrowing toagriculture in the early 1980s (Table 3.15).Together they received nearly 60% of total netdisbursements to all 35 countries, amounting to
Broad definition.b Includes $25 million in bonds.
Includes $70 million in bonds.d 82 reporting countries.e The UN unit value index for manufactured exports is used as a deflator. This is to facilitate comparison with flows of OCA while notingthat the data for these twosources cover different numbers of countries.Sources: World Bank, Debtor Reporting System; and FAO.
approximately $1 100 million a year during1980-84.
Seen as balance of payments support, netdisbursements to agriculture during 1980-84were small and represented only 1% of thevalue of total merchandise exports from the 35countries, although there were wide differencesamong regions and countries. For somecountries such as Bangladesh and the Sudan,net disbursements to agriculture representedover 11% of merchandise export earnings, whilein Senegal, Tanzania, India and Ethiopia, nettransfers to agriculture were between 6-7% ofexport earnings during the same period.
Seen as budget support, the ratios weregenerally smaller for 26 out of the 35 countriesin the sample, as the current value ofgovernment expenditure was greater than thecurrent value of export earnings throughout this
Item1974-76 1976-78 1978-80 1980-82 1982-84 1974-76 1976-78 1978-80 1980-82 1982-84
(millions of current 5) (%)
Africa 356 693 920 897 426 31 46 49 43 42
Far East 131 213 121 574 422 11 14 6 27 42
Latin America 615 546b 776' 514 148 53 36 42 25 14
Near East 55 62 46 97 18 5 4 3 5 2
Total d
of which:1 157 1 514 1 863 2 082 1 014 100 100 100 100 100
Supplier credits 358 299 147 442 344 31 20 8 21 34
Financial
institutions 799 1 184 1 693 1 641 670 69 80 92 79 66
Memorandum item:in 1980 prices 1 884 2 184 2 076 2 189 1 133
Region
1974-76 1982-84
OCA Regional shares OCA Regional sharesper caput
agriculturalpopulation
Agriculturalpopulation OCA
per caputagriculturalpopulation
Agriculturalpopulation OCA
(5) (%) (%) (S) (%) (%)
Far East a 3.70 62 43 6.60 61 49Africa 5.50 21 21 11.40 23 27Near East 7.50 8 13 6.80 8 7
Latin America 12.10 9 24 18.40 8 20
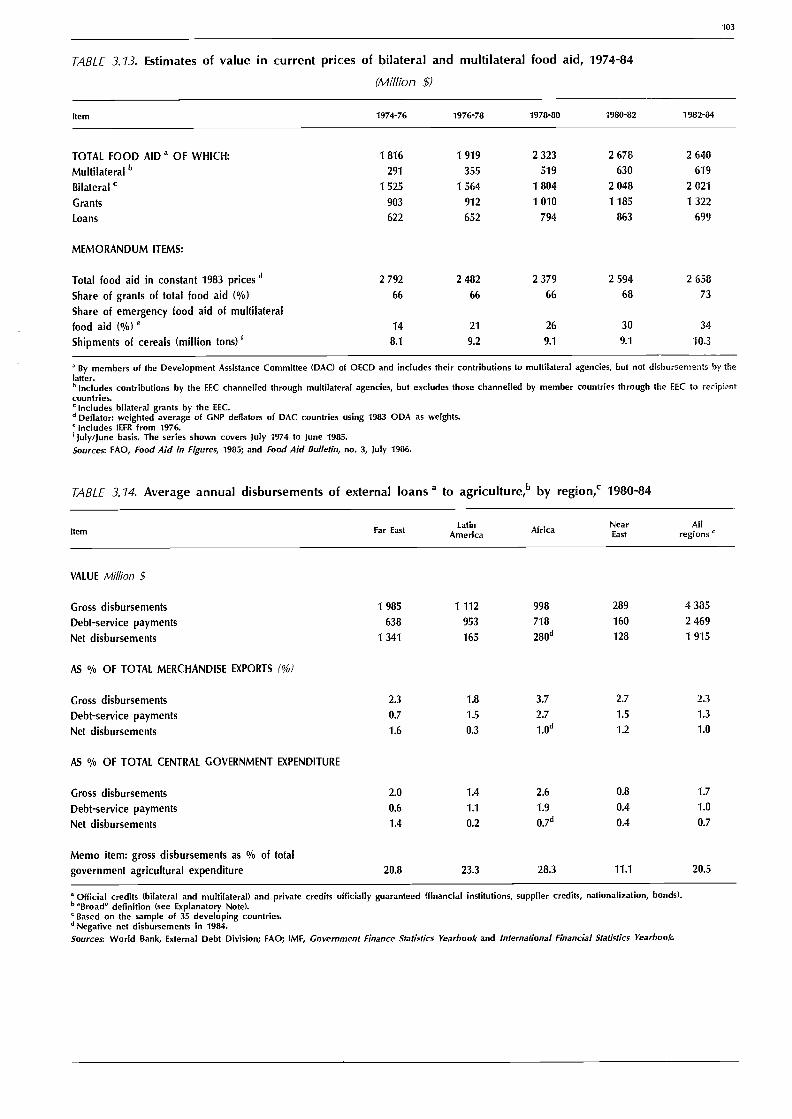
TABLE 3.13. Estimates of value in current prices of bilateral and multilateral food aid, 1974-84
(Million $)
103
a By members of the Development Assistance Committee (DAC) of OECD and includes their contributions to multilateral agencies, but not disbursements by thelatter.b Includes contributions by the EEC channelled through multilateral agencies, but excludes those channelled by member countries through the EEC to recipientcountries.
Includes bilateral grants by the EEC.d Deflator: weighted average of GNP deflators of DAC countries using 1983 ODA as weights.
Includes IEFR from 1976.July/June basis. The series shown covers July 1974 to June 1985.
Sources FAO, Food Aid in Figures, 1985; and Food Aid Bulletin, no. 3, July 1986.
TABLE 3.14. Average annual disbursements of external loans a to agriculture,b by region,` 1980-84
Official credits (bilateral and multilateral) and private credits officially guaranteed (financial institutions, supplier credits, nationalization, bonds).b "Broad" definition (see Explanatory Note).
Based on the sample of 35 developing countries.d Negative net disbursements in 1984.Sources: World Bank, External Debt Division; FAO; IMF, Government Finance Statistics Yearbook and International Financial Statistics Yearbook.
Item 1974-76 1976-78 1978-80 1980-82 1982-84
TOTAL FOOD AID a OF WHICH: 1 816 1 919 2 323 2 678 2 640
Multilateral b 291 355 519 630 619
Bilateral ` 1 525 1 564 1 804 2 048 2 021
Grants 903 912 1 010 1 185 1 322
Loans 622 652 794 863 699
MEMORANDUM ITEMS:
Total food aid in constant 1983 prices d 2 792 2 482 2 379 2 594 2 658
Share of grants of total food aid (% ) 66 66 66 68 73
Share of emergency food aid of multilateral
food aid (%)e 14 21 26 30 34
Shipments of cereals (million tons) f 8.1 9.2 9.1 9.1 10.3
Item Far East LatinAmerica Africa
NearEast
Allregions
VALUE Mil/ion $
Gross disbursements 1 985 1 112 998 289 4 385
Debt-service payments 638 953 718 160 2 469
Net disbursements 1 341 165 280d 128 1 915
AS % OF TOTAL MERCHANDISE EXPORTS (%)
Gross disbursements 2.3 1.8 3.7 2.7 2.3
Debt-service payments 0.7 1.5 2.7 1.5 1.3
Net disbursements 1.6 0.3 10d 1.2 1.0
AS % OF TOTAL CENTRAL GOVERNMENT EXPENDITURE
Gross disbursements 2.0 1.4 2.6 0.8 1.7
Debt-service payments 0.6 1.1 1.9 0.4 1.0
Net disbursements 1.4 0.2 0.7d 0.4 0.7
Memo item: gross disbursements as % of total
government agricultural expenditure 20.8 23.3 28.3 11.1 20.5

104
TABLE 3.15. Major recipients of disbursements a to agricul-ture,b selected countries, 1980-84
21 selectedcountriesfrom 35-countrysample` Agriculture
(Million $)
Average annual net disbursements to:
Agricultureas % of totalmerchandise
exports
Agricultureas % of total
centralgovernmentexpenditure
Official credits (bilateral and multilateral) and private credits officially guaranteed(financial institutions, supplier credits, nationalization, bonds).b Broad definition.` Selected on the basis that in each country the net disbursements to agricultureamounted to more than 1% of total merchandise export earnings during 1980-84.Sources: World Bank, External Debt Division; FAO; IMF, Government Finance StatisticsYearbook and International Financial Statistics Yearbook.
period. Therefore, when external netdisbursements to agriculture are expressed as apercentage of central government expenditure,as opposed to merchandise export earnings, theratio is smaller. External net disbursements toagriculture (broad definition) represented lessthan 1% of total central government spendingin the 35 countries as a group. The Far Eastwas the only region where external netdisbursements to agriculture were more than1% of total government expenditure during1980-84. However, net disbursements toagriculture constituted relatively large shares oftotal expenditure in Senegal (6.9%) and theNiger (5.6%).
Disbursements of external loans to all sectorswere naturally much larger, although externalloans were generally not available on suchfavourable terms to non-agricultural sectors. Anextremely high ratio of debt-service paymentsto gross disbursements were experienced by the35 countries. Gross disbursements to all sectorsaveraged $65 700 million a year during 1980-84,but almost offsetting this sum was the cost of
debt-service payments that totalled $56 200million, leaving only $9 500 million a year in netdisbursements to all sectors during 1980-84(Table 3.16).
Looking at the regional distribution ofexternal net transfers to all sectors, as withagriculture, funds were heavily concentrated inthe Far East, which received $7 400 million neta year during 1980-84 compared with $2 700million to Africa. After averaging $3 500 milliona year between 1980 and 1983, net transfers toall sectors in Africa suddenly turned negative in1984 (-$300 million). Moreover, in LatinAmerica disbursements to all sectors werenegative (on average, - $2 100 million a yearover the five-year period). The inflows ofexternal net disbursements to all sectors inLatin America, which reached $8 100 million in1981, were followed by net outflows in 1982-83.By 1984, external net disbursements to allsectors had plummeted to -$11 800 million.
As balance of payments support, external netdisbursements to all sectors for the 35 countriesas a group amounted to 5.2% of totalmerchandise exports during 1980-82. Netdisbursements to Latin America were negativeand hence a drain on the balance of payments.The largest support for the balance ofpayments was provided to the Near East, whereexternal net disbursements to all sectorsrepresented 14.2% of total merchandise exports,compared with 10.1% in Africa, and 8.9% inthe Far East.
As budget support, external netdisbursements to all sectors averaged 3.8% oftotal government expenditure during 1980-84 inthe 35 countries as a group. In Latin America,net outflows were equivalent to -2.1 0/0 of totalcentral government expenditure, while therewere external net inflows, which providedbudget support equivalent to 4.2% of totalcentral government expenditure in the NearEast and exceeded 7% of totah centralgovernment expendidure in the Far East andAfrica.
In summary, while gross disbursement toagriculture were by far the largest in the FarEast among the four regions (in current USdollars and in terms of budget support andbalance of payments support), their netcontribution to domestic and externaladjustment must not be exaggerated. During1980-84, in the nine Far Eastern countries of thesample, net disbursements to agricultureamounted to only 1.6% of their totalmerchandise export earnings and 1.4% of theirtotal government expenditures.
Relating the disbursements of external loans
Bangladesh 87 12.1 4.3
Sudan 64 11.4 3.1
Senegal 35 6.8 6.9
Tanzania 32 6.7 1.9
India 550 6.4 2.0
Ethiopia 23 5.6 1.8
Egypt 70 4.4 1.0
Niger 16 4.0 5.6
Sierra Leone 5 4.0 2.2
Pakistan 76 2.9 1.2
Nigeria 158 2.7 2.3
Dominican Republic 24 2.6 2.0
Sri Lanka 30 2.6 1.4
Philippines 103 2.0 2.6
Jamaica 16 2.0 1.5
Mexico 18 1.8 0.9
Peru 46 1.6 1.1
Kenya 21 1.5 1.0
Indonesia 325 1.4 1.6
Malawi 3 1.4 1.0
Thailand 81 1.2 0.9

TABLE 3.16. Annual average external disbursements a to all sectors, by region,b 1980-84
Official credits (bilateral and multilateral) and private credits officially guaranteed (financial institutions, supplier credits, nationalization, bonds).b Based on the 35-developing-country sample.
Negative net disbursements during 1982-84.d Negative net disbursements in 1984.Source: World Bank, World Debt Tables 1984-85.
TABLE 3.17. Cereal food aid, by region,' 1980-84 average
Item
Shipments of cereal food aid ('000 tons) c2
Volume of cereal food aid as % volume of cerealimports
Value of cereal imports as % value of total merchandiseexports
Estimated value of cereal food aid as % value of totalmerchandise exports
Estimated value of cereal food aid as % value of totalgovernment expenditure
Based on the 35-developing-country sample.b Weighted by metric tons of cereals and value of trade for each country.
Financial years 1980/81 - 1984/85.Source: FAO, Food Aid in Figures, 1985, and AGROSTAT.
to annual government expenditure onagriculture, gross rather than net disbursementsappear to be the more realistic measure ofsuch contributions to government sectoralfinancing, because the sector itself does nothave to service external debts incurred but theeconomy as a whole, if these debts are publiclyguaranteed. As government agriculturalexpenditures are a relatively small proportion oftotal government expenditures, typically lessthan 10%, as seen from Table 3.6, (p. 94) gross
Far EastLatin
America Africa NearEast
Allregions
105
disbursements of .loans made a correspondinglylarger contribution to government agriculturalexpenditure. During 1980-84, the average figurewas 20-21% for all regions, but it exceeded28% for Africa (see Table 3.14).
During the same period, net disbursements toall sectors were eight to ten times greater thanthose to agriculture in Africa and the Near East;while in Latin America, the current value of netdisbursements to all sectors was negative, therewas a net outflow of resources. The Far East
Item Far East LatinAmerica Africa Near
EastAll
regions b
VALUE (Millions of current .5)
Gross disbursements 21 762 30 262 8 086 5 660 65 721Debt-service payments 14 317 32 360 5 291 4 240 56 199Net disbursements 7 454 -2 097 2 745 1 419 9 522
AS o/ TOTAL MERCHANDISE EXPORTS
Gross disbursements 25.7 48.3 30.2 52.6 35.4
Debt-service payments 16.8 51.1 20.1 38.4 30.1
Net disbursements 8.9 10.1d 14.2 5.2d
AS % OF TOTAL CENTRAL GOVERNMENT EXPENDITURE
Gross disbursements 22.6 36.9 21.6 15.5 25.6
Debt-service payments 14.8 39.0 14.4 11.3 21.8
Net disbursements 7.8 7.2d 4.2 3.8d
712 603 1 503 2 298 7 117
16.0 4.0 23.8 26.6 14.3b
3.9 4.7 7.1 16.9 54b
0.6 0.2 1.7 4.5 0.8b
0.5 0.2 1.2 1.3 0.5b
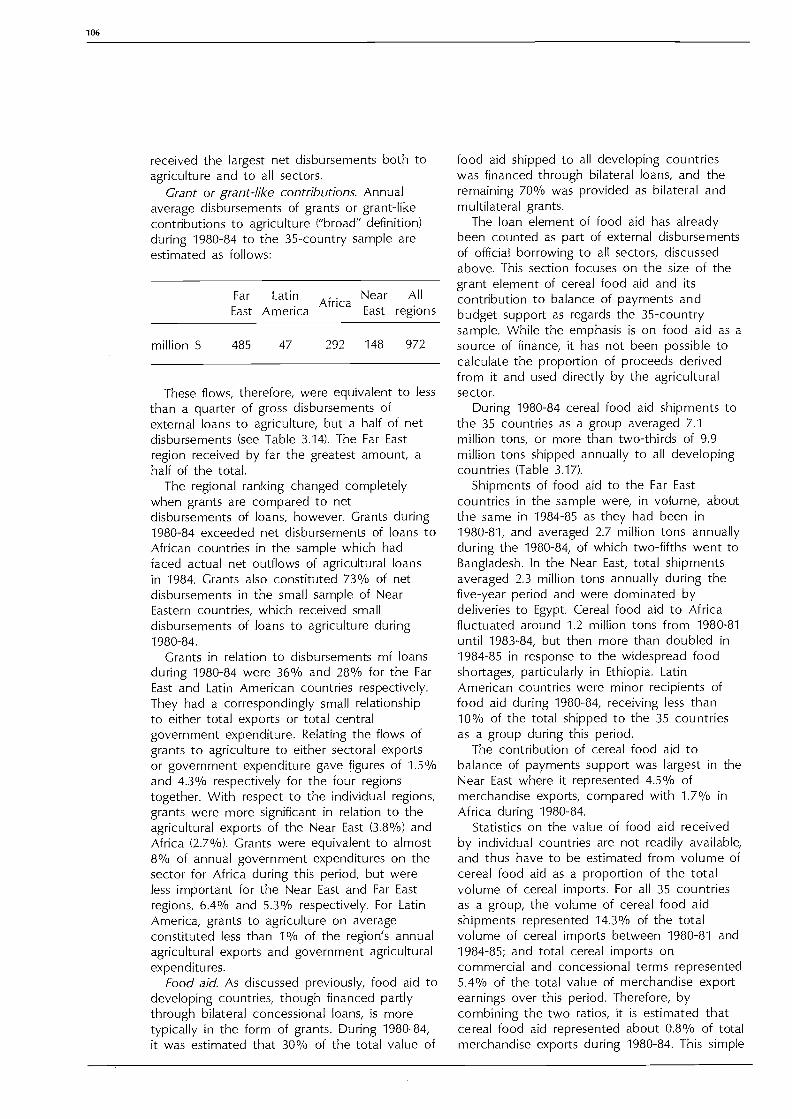
106
received the largest net disbursements both toagriculture and to all sectors.
Grant or grant-like contributions. Annualaverage disbursements of grants or grant-likecontributions to agriculture ("broad" definition)during 1980-84 to the 35-country sample areestimated as follows:
Far Latin Near AllEast America
AfricaEast regions
million $ 485 47 292 148 972
These flows, therefore, were equivalent to lessthan a quarter of gross disbursements ofexternal loans to agriculture, but a half of netdisbursements (see Table 3.14). The Far Eastregion received by far the greatest amount, ahalf of the total.
The regional ranking changed completelywhen grants are compared to netdisbursements of loans, however. Grants during1980-84 exceeded net disbursements of loans toAfrican countries in the sample which hadfaced actual net outflows of agricultural loansin 1984. Grants also constituted 73% of netdisbursements in the small sample of NearEastern countries, which received smalldisbursements of loans to agriculture during1980-84.
Grants in relation to disbursements mf loansduring 1980-84 were 36% and 28% for the FarEast and Latin American countries respectively.They had a correspondingly small relationshipto either total exports or total centralgovernment expenditure. Relating the flows ofgrants to agriculture to either sectoral exportsor government expenditure gave figures of 1.5%and 4.3% respectively for the four regionstogether. With respect to the individual regions,grants were more significant in relation to theagricultural exports of the Near East (3.8%) andAfrica (2.7%). Grants were equivalent to almost8% of annual government expenditures on thesector for Africa during this period, but wereless important for the Near East and Far Eastregions, 6.4% and 5.3% respectively. For LatinAmerica, grants to agriculture on averageconstituted less than 1% of the region's annualagricultural exports and government agriculturalexpenditures.
Food aid. As discussed previously, food aid todeveloping countries, though financed partlythrough bilateral concessional loans, is moretypically in the form of grants. During 1980-84,it was estimated that 30% of the total value of
food aid shipped to all developing countrieswas financed through bilateral loans, and theremaining 70% was provided as bilateral andmultilateral grants.
The loan element of food aid has alreadybeen counted as part of external disbursementsof official borrowing to all sectors, discussedabove. This section focuses on the size of thegrant element of cereal food aid and itscontribution to balance of payments andbudget support as regards the 35-countrysample. While the emphasis is on food aid as asource of finance, it has not been possible tocalculate the proportion of proceeds derivedfrom it and used directly by the agriculturalsector.
During 1980-84 cereal food aid shipments tothe 35 countries as a group averaged 7.1million tons, or more than two-thirds of 9.9million tons shipped annually to all developingcountries (Table 3.17).
Shipments of food aid to the Far Eastcountries in the sample were, in volume, aboutthe same in 1984-85 as they had been in1980-81, and averaged 2.7 million tons annuallyduring the 1980-84, of which two-fifths went toBangladesh. In the Near East, total shipmentsaveraged 2.3 million tons annually during thefive-year period and were dominated bydeliveries to Egypt. Cereal food aid to Africafluctuated around 1.2 million tons from 1980-81until 1983-84, but then more than doubled in1984-85 in response to the widespread foodshortages, particularly in Ethiopia. LatinAmerican countries were minor recipients offood aid during 1980-84, receiving less than10% of the total shipped to the 35 countriesas a group during this period.
The contribution of cereal food aid tobalance of payments support was largest in theNear East where it represented 4.5% ofmerchandise exports, compared with 1.7% inAfrica during 1980-84.
Statistics on the value of food aid receivedby individual countries are not readily available,and thus have to be estimated from volume ofcereal food aid as a proportion of the totalvolume of cereal imports. For all 35 countriesas a group, the volume of cereal food aidshipments represented 14.3% of the totalvolume of cereal imports between 1980-81 and1984-85; and total cereal imports oncommercial and concessional terms represented5.4% of the total value of merchandise exportearnings over this period. Therefore, bycombining the two ratios, it is estimated thatcereal food aid represented about 0.8% of totalmerchandise exports during 1980-84. This simple

method of estimation assumes that the value offood aid as a share of the total cereal importbill is proportional to its share of the totalvolume of imported cereals. This is only anapproximation. For more exact estimates to bemade, further information would be requiredabout the composition of food aid and howfood aid commodities are valued.
The contribution of food aid as part ofexternal and domestic adjustment effortsundertaken by developing countries in the1980s was small in most countries. In the FarEast and Latin America, it amounted to about1% of average export earnings during 1980-84.Nevertheless, the contributions were significantlygreater for the major recipient regions. For theNear East countries in the sample, includingEgypt and the Sudan, the value of food aid wasalmost four times net disbursements of externalloans. In Africa, it was almost double.
The importance of cereal food aid wassmaller when expressed as a percentage of totalcentral government expenditure. As budgetsupport, the grant element represented lessthan half of one percent of total centralgovernment expenditure for the sample of 35countries during 1980-84, but exceeded 1% ofexpenditure in Africa and the Near East.
During the same period, the largest quantitiesof cereal food aid were delivered to Bangladeshand Egypt and represented quite significantlevels of budget support to these countries(Table 3.18). In Bangladesh, it represented 8.4%of total central government expenditure. For thesecond largest recipient, Egypt, the imputedvalue of total cereal food aid provided asgrants and concessional loans was 2.5% oftotal government expenditure.
In summary, for a few major recipients, thegrant element of cereal food aid was animportant source of balance of payments andbudget support during 1980-84, but for the 35countries as a group, the estimated value ofcereal food aid (provided in the form of grants)represented around less than 1% of exportearnings and 0.5% of total central governmentexpenditure during this period. The contributionincreased to 6% when food aid grants werecompared to annual average governmentexpenditure on agriculture.
Government Revenue and Agricultural TaxationAlthough data on government revenue areunavailable for some countries, and datacovering parastatal agencies that may generaterevenue are extremely limited, IMF statisticsindicate that in 1983, central government
current and capital revenues were equivalent to21% of GDP for the developing countries. TheWorld Bank estimates that in 1983, centralgovernment current revenue was equivalent to14%, 23% and 24% of GNP for low-, middle-and upper middle-income developing countries,respectively.14
For the 35-country sample used throughoutthis chapter, during 1980-84, external netdisbursements to all sectors, including food aid,were equivalent to less than 5% of centralgovernment expenditure, which was equivalentto 27% of GDP. Hence, the bulk of fiscalspending was funded from domestic sources,and government revenue was equivalent toabout 20% of GDP.
Taxation is clearly the major source ofdomestic revenue, even in developing countries.According to IMF data, during 1977-83, taxes ongoods and services provided 27% ofgovernment revenue. Other main revenuesources were: taxes on income, profits andcapital gains (24%); non-tax revenue, mainlyreceipts from governmental activities (21%); andtaxes on international trade and transactions(16%). All other taxes (social security, payroll,property, poll, etc.) accounted for the remaining12%. There were substantial variations amongthe developing regions. Countries in the NearEast obtained 70% of their revenue fromnon-tax sources and African countries reliedmainly on taxes on income (41%) and goodsand services (20%). In general, less developedcountries tended to rely more on taxes ongoods, services and international trade. Asdevelopment proceeded, income and socialsecurity taxes accounted for a rising share.
The typically large share of agricultural GDPof total GDP in developing countries (anaverage 25% in the 35-country sample)suggests that agricultural taxation could be amajor source of tax revenue, and hence, animportant instrument for development policy.Governments may resort to taxing agriculture asa form of involuntary savings where ruralfinancial markets are not fully developed.Nevertheless, applying a tax also affects income,savings, investment and productivity, and thusfuture income and taxes, demonstrating thecircularity of the effects of most financialinstruments.
Available data suggest that explicit taxationof agriculture is not a major source ofgovernment revenue. Many developing
14 World Bank, World Development Report, 1986.
107
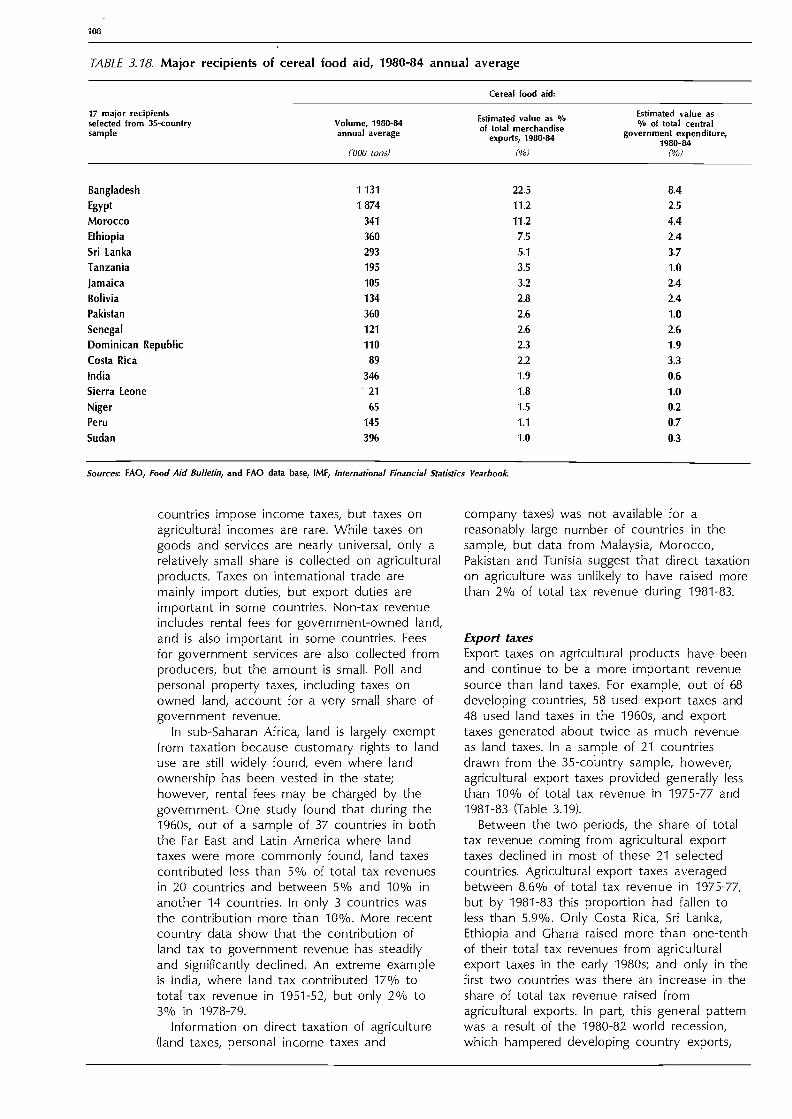
108
TABLE 3.18. Major recipients of cereal food aid, 1980-84 annual average
Sources: FAO, Food Aid Bulletin, and FAO data base, IMF, International Financial Statistics Yearbook
countries impose income taxes, but taxes onagricultural incomes are rare. While taxes ongoods and services are nearly universal, only arelatively small share is collected on agriculturalproducts. Taxes on international trade aremainly import duties, but export duties areimportant in some countries. Non-tax revenueincludes rental fees for government-owned land,and is also important in some countries. Feesfor government services are also collected fromproducers, but the amount is small. Poll andpersonal property taxes, including taxes onowned land, account for a very small share ofgovernment revenue.
In sub-Saharan Africa, land is largely exemptfrom taxation because customary rights to landuse are still widely found, even where landownership has been vested in the state;however, rental fees may be charged by thegovernment. One study found that during the1960s, out of a sample of 37 countries in boththe Far East and Latin America where landtaxes were more commonly found, land taxescontributed less than 5% of total tax revenuesin 20 countries and between 5% and 10% inanother 14 countries. In only 3 countries wasthe contribution more than 10%. More recentcountry data show that the contribution ofland tax to government revenue has steadilyand significantly declined. An extreme exampleis India, where land tax contributed 17% tototal tax revenue in 1951-52, but only 2% to3% in 1978-79.
Information on direct taxation of agriculture(land taxes, personal income taxes and
company taxes) was not available for areasonably large number of countries in thesample, but data from Malaysia, Morocco,Pakistan and Tunisia suggest that direct taxationon agriculture was unlikely to have raised morethan 2% of total tax revenue during 1981-83.
Export faxesExport taxes on agricultural products have beenand continue to be a more important revenuesource than land taxes. For example, out of 68developing countries, 58 used export taxes and48 used land taxes in the 1960s, and exporttaxes generated about twice as much revenueas land taxes. In a sample of 21 countriesdrawn from the 35-country sample, however,agricultural export taxes provided generally lessthan 10% of total tax revenue in 1975-77 and1981-83 (Table 3.19).
Between the two periods, the share of totaltax revenue coming from agricultural exporttaxes declined in most of these 21 selectedcountries. Agricultural export taxes averagedbetween 8.6% of total tax revenue in 1975-77,but by 1981-83 this proportion had fallen toless than 5.9%. Only Costa Rica, Sri Lanka,Ethiopia and Ghana raised more than one-tenthof their total tax revenues from agriculturalexport taxes in the early 1980s; and only in thefirst two countries was there an increase in theshare of total tax revenue raised fromagricultural exports. In part, this general patternwas a result of the 1980-82 world recession,which hampered developing country exports,
Bangladesh 1 131 22.5 8.4
Egypt 1 874 11.2 2.5
Morocco 341 11.2 4.4
Ethiopia 360 7.5 2.4
Sri Lanka 293 5.1 3.7
Tanzania 195 3.5 1.0
Jamaica 105 3.2 2.4
Bolivia 134 2.8 2.4
Pakistan 360 2.6 1.0
Senegal 121 2.6 2.6
Dominican Republic 110 2.3 1.9
Costa Rica 89 2.2 3.3
India 346 1.9 0.6
Sierra Leone 21 1.8 1.0
Niger 65 1.5 0.2
Peru 145 1.1 0.7
Sudan 396 1.0 0.3
Cereal food aid:
17 major recipientsselected from 35-countrysample
Volume, 1980-84annual average
Estimated value as %of total merchandise
exports, 1980-84
Estimated value as% of total central
government expenditure,1980-84
(000 tons) (%) (%)

TABLE 3.19. Agricultural export taxation and expenditure, selected countries, 1975-77 and 1981-83
(Percentages)
Source IMF, Government Finance Statistics Yearbook; World Bank; FAO.
but was also the result of domestic policiesthat reduced the level of explicit taxation onexports to encourage the production of exportproducts and foreign exchange earnings.
As a source of financing governmentexpenditure, therefore, agricultural exporttaxation is relatively small, covering only 3.6%of total central government expenditure in the21 selected countries in 1981-83. Nevertheless,in comparison with external sources of finance,such as disbursements of external assistance toagriculture, agricultural export taxation appearsto be a far larger source of revenue.Furthermore, as governments generally allocateonly a small share of their total expenditure to
agriculture, export taxes on agriculture typicallycover 40-50% of central governmentexpenditure on the sector.
Nevertheless, for the 21 countries as a group,this conclusion implies that there was a netinflow of fiscal finance to the agricultural sector,as central government expenditure onagriculture was significantly larger than therevenue raised from explicit taxes onagriculture. Agricultural expenditure in thesecountries accounted for 8.3% of centralgovernment expenditure during 1981-83, whichwas more than twice the value of revenueraised from agricultural export taxes (3.6% oftotal central government expenditure in
109
1975-77 1981-83 1975-77 1981-83 1975-77 1981-83
FAR EAST
India 0.3 0.1 0.3 0.1 10.6 12.9
Malaysia 17.2 4.3 12.8 2.2 9.1 7.4
Pakistan 3.8 0.8 1.6 0.5 5.5 6.0
Philippines 6.2 1.9 5.0 1.6 11.2 11.4
Sri Lanka 8.4 15.5 6.0 8.6 8.3 5.4
LATIN AMERICA
Argentina 8.1 5.7 5.2 3.5 1.1 4.1
Brazil 1.1 1.7 1.1 1.5 5.3 7.0
Colombia 6.0 2.7 4.7 1.9 ... ...Costa Rica 19.0 34.1 14.2 23.9 4.6 4.7
Dominican Republic 18.0 4.7 16.0 3.0 11.5 13.2
Ecuador 8.9 0.3 4.4 2.2 6.2 6.7
AFRICA
Ethiopia 22.9 13.8 13.6 7.3 8.7 9.5
Ghana 30.0 19.9 16.4 9.4 7.6 9.9
Kenya 0.7 0.5 10.3 9.9
Níger 1.1 1.0 4.5 10.2
Nigeria 0.1 0.6 - 2.6 4.4
Senegal 2.0 0.9 1.7 0.9 4.4 9.2
Sierra Leone 11.5 6.0 6.6 2.8 7.6 10.9
Tanzania 9.5 1.1 5.5 0.6 13.8 8.0
NEAR EAST
Sudan 3.7 2.8 2.4 1.6 10.5 10.3
Syria 2.5 0.7 0.6 0.2 6.8 4.6
Total 21 selected countries 8.6 5.9 5.7 3.6 7.5 8.3
Agricultural export taxation: Agriculture expenditure:
21 selected countries from as % of total as % of total central as °A of total central35-country sample tax revenue government expenditure government expenditure

110
BOX 3.4
External assistance tofisheries
1981-83) and assuming that few other taxeswere explicitly levied. Only in Costa Rica andSri Lanka were central government expenditureson agriculture less than the revenues collectedfrom agricultural export taxes alone, althoughArgentina, Ghana and Ethiopia were close to abalance.
Rather than taxing agriculture as part of aconscious development policy, implicit taxescommonly are imposed by governmentsthrough the manipulation of producer prices,marketing margins and costs, exchange ratesand trade policies. FAO's recent study onagricultural price policies concludes that indeveloping countries, agriculture has beenpenalized often by negative protection arisingfrom national policies, including traderestrictions and macro-economic policies suchas exchange rate controls:15 The study found
15 FAO, Agricultural Price Policies, Rome, 1987.
External assistance onconcessionary terms, includingtechnical assistance to the fisheriessector of developing countries fromthe mid-1970s to the early 1980s,increased from $138 million in1974-75 to $496 million in 1983-84,an annual growth rate of morethan 15%. Since 1983, however,this trend has been reversed and,according to preliminary data,assistance to the sector may havedeclined by up to 15% in 1985.
The number of fishery projectsbegun annually also has declined,from about 260 a year in the late1970s to 150 a year in themid-1980s. Excluding technicalassistance for which information onall sectors is lacking, andnon-concessional lending, about2-3% of OCA ("broad" definition)has been committed to the fisherysector in recent years.
Within these totals, there havebeen some significant shifts in theallocation of this assistance. Theconstruction of infrastructure suchas fishing ports and vessels, hasreceived consistently up to a thirdof external assistance, with theformer rece-iving the larger share.
that African farmers have fared worse thanfarmers elsewhere in the world in this respect.The frequency and magnitude of movements inprice bias adverse to agriculture meant that bythe early 1980s, there was a pressing need toimprove price incentives for producers.
The widespread devaluations in the early1980s, often accompanying structuraladjustment programmes, point to a reduction inthis adverse price bias. Nevertheless, it seemsthat subsequently the real value of producerprices have not been maintained. However, asworld prices for many agricultural commoditiesin the mid-1980s have continued to decline,government interventions may have served tohave maintained producer prices above worldprice levels.
A related consideration, also given weight incurrent structural adjustment efforts, concernsthe efficiency of government or parastatalintervention in agricultural marketing, inputsupply and the provision of subsidies. The aim
More recently, however, theallocations for these purposes havedeclined. Areas of fisheriesdevelopment receiving increasingshares of external assistance areaquaculture and what is known asthe "post-harvest" sector(processing and marketing). Aid toaquaculture quadrupled between1978 and 1984, increasing its sharefrom 9% to 16%. Post harvestactivities now account for about7% of total assistance to thesector, compared to about 3% in1978.
Although interest in small-scalefisheries has expanded considerably,its share of total fishery assistancehas remained at about 17%. Inrecent years, however, donors suchas the World Bank haveincreasingly included a fisherycomponent in rural developmentprojects. Several integratedsmall-scale fisheries projects alsohave been launched in recentyears, for example in West Africa,Zanzibar and the Bay of Bengal.

is to lower government expenditures, and by sodoing, restore producer incentives in order topromote agricultural output and, hence, savingsand investment.
The move away from this still widespreadimplicit taxation of agriculture provides theopportunity for a reformulation of explicittaxation policies to provide the government therevenue for development needs. Increases inagricultural production and productivity willcreate larger net producer returns and ruralsavings. An important task of government willbe to help channel the generated savings intoagriculture.
Some Conclusions and Policy IssuesThis review that so far has placed agriculture inthe macro-economy and explored some aspectsof the fiscal budget relating to agriculturalfinance, raises a very wide range of issues withimplications for policy. Some major issues orrather clusters of issuesare set down underthree main headings: the current accountbalance, the investment-savings gap and thefiscal budget.
The current account balanceAgriculture is a highly tradable sector andremains a sector of significant importance inthe majority of developing countries: a 25%share of total GDP and a 33% share of totalmerchandise exports are typical figures. Thesector characteristically generates a net surplusboth through export earnings and substitutingfor agricultural imports that covers a relativelylarge share of the current account deficit of thenon-agricultural sectors of a developingeconomy. Again, typical figures are anagricultural trade surplus equivalent to 5% oftotal GDP compared with a total deficit ofabout the same size. From the earlier analysis,it was shown that an overall current accountdeficit much larger than 5% of GDP cannot besustained for very long and generally leads tostructural adjustment measures having to beadopted. A disturbing sign of this analysis,therefore, is the observed decline in the netsurplus of agriculture even though agriculturalimports have tended to decline. This, coupledwith an observed decline in the overall deficit,means that in the absence of a majorexpansion in non-agricultural exports, which hasnot occurred in most recent years, the overalldeficit has been reduced by a majorcompression of non-agricultural imports. Wherethese are investment goods, such cutbacks
must have a long-term negative impact on thefuture productive capacity of the economy. Thisimpact may be felt on agriculture itself, if itleads to reductions in investment in economicinfrastructure such as transport and portfacilities.
Some of the observed declines in agriculturalexports may be due to developing countriesshifting away from exporting primarycommodities to semi-manufactured ormanufactured products. This is taking place but,in most cases, only gradually.
The current low prices for agricultural exportcommodities and their generally poor prospects,point to low rates of return on pastinvestments made in agricultural projects aimedfor export markets, as well as cutbacks inforeign savings for investment in other sectorsof the economy. This very broad conclusionnot only underlines the importance of moves toeliminate unfair trade practices and supplies inexcess of food security needs, but also thosemacro-economic policy measures that willsustain world economic growth and so lead tobetter market opportunities, particularly indeveloping countries themselves. Unless thesepositive steps are taken, the second bestalternative is to rely less on agricultural exportsand more on production for domesticconsumption.
The investment-savings gapHow does agriculture fit into a "typical"situation where external savings are fallingbecause imports are being compressed, interestpayments on debt are rising and remittancesfrom residents working overseas may also befalling? In this case, with external savingsdeclining, domestic savings must rise ifinvestment levels are to be maintained. This isoften difficult because the government is likelyto be struggling to reduce the public fiscaldeficit, and the private sector may be facingfalling real incomes and hence, dissaving tomaintain consumption levels.
On the side of investment, in developingcountries agriculture is normally lesscapital-intensive than other sectors, andinvestment is typically achieved more throughnon-monetized labour time, particularly in landimprovement and simple farm buildings. It hasbeen seen that an investment rate of 10-13%of agricultural GDP is a fairly typical figurewhich, if total investment is in the also typicalrange of 22-25% of total GDP, implies thatnon-agricultural investment is usually a muchlarger proportion of non-agricultural GDP,
111

112
BOX 3.5
Financing forestrydevelopment
The current increased concern overthe financing of forestry investmentstems from increased internationalrecognition of the consequences ofdeforestation and forest resourcemismanagement, and appreciationof the sheer magnitude of theproblem. At the same time, it isincreasingly recognized that manypeople (FAO estimates more than1 000 million) depend on a rapidlydwindling or virtually non-existentsupply of wood for their energyneeds. On the more commercialside, increased investment isneeded to sustain the dynamicexpansion of industrial productsbased on wood, such as paper.
Why is it necessary todemonstrate that investment inforestry compares favourably withthat in other sectors? Why is itthat in forestry, investments arenot made "spontaneously"? Alongwith the possible diversity offorestry projects from, at oneextreme, "capital intensive"industrial projects to, at the otherextreme, "human intensive"projects aimed to improve woodsupplies for the poor, forestryinvestments also have specialproperties that tend to discourageinvestment, for example:
They have long "gestation"periods, difficult to justify wheninterest rates are high and peoplehave a short planning horizon;
They may generate higheconomic rates of return whenincluding externalities such as river
basin protection or broadsocio-economic benefits, but theirdirect financial return may be low,making them unattractive tocommercial investors;
Forest resources are oftenregarded as common property thatdiscourages investment whileproviding an incentive to depleteresources; and
The typical disbursement andfinancing profiles of internationalloans simply do not match thefinancial flows of most forestryprojects.
Forest planners therefore areforced to adopt innovativemeasures to try to attractinvestment into the sector. Suchmeasures may include thefollowing:
Investment in forestry resourceswith a long pay-off period can belinked to industrial activities thathave high financial returns;
In some cases, the existingnatural forest wealth can generatefinancial resources to supportafforestation programmes;
The externalities of forestrysuch as indirect economic andenvironmental benefits, can beinternalized by integrating forestrywith large-scale watershedmanagement and irrigationprojects; and
Transactional costs can be highin the case of participatoryor community developmentprojects involving large numbers ofpeople, but these can beminimized by financingcooperatives or communitiesundertaking forestry activities,rather than individuals.
The elimination of obstacles toincreased forestry developmentrequires deliberate and forcefulaction. The FAO Tropical ForestryAction Plan, prepared in 1985, isan example of this. Its basicpurpose is to promote andharmonize multilateral and bilateralcooperation for mobilizingincreased financial resources forinvestment in the forestry sector oftropical countries. The Plan hasreceived broad internationalsupport and, in addition, somebanking institutions such as theInter-American Development Bankare changing their regulations sothat their lending programme can
be adapted to the particularfinancial needs of forestrydevelopment.
Increased forestry financing alsodepends crucially on the policies ofnational authorities. These policiesmay have to bring the multiplesocio-economic benefits generatedby forestry activities into line withfinancial returns. Examples of suchpolicies are Chile's direct subsidieson afforestation that have beenhighly successful, Brazil's taxholidays that have generated largeafforestation programmes, and asubsidized credit programme in theRepublic of Korea that has workedeffectively. Measures have to betailored to the level ofdevelopment of rural financialmarkets and the types of forestryactivities needed. Also, there willhave to be massive investmentsmade to have an impact on thescale of problems faced.

25-30%.16 What this means though is that theagricultural sector itself can be less demandingon investment requirements, particularly if adevelopment strategy is followed that avoidscapital-intensive projects such as large-scaleirrigation and land development schemes.
It has been shown that by and large theagricultural investment rate was broadlymaintained during 1974-84, except in thosecountries whose government budgets weresustained by earnings from oil, and the like,and which were heavily investing innon-agricultural sectors. Nevertheless, therewere some signs of cutbacks in agriculturalinvestment rates in the early 1980s comparedwith the mid-1970s. In these situations, itbecomes even more important that relativeprices of inputs and outputs, agricultural andnon-agricultural, enable producers to realizepositive returns on investments. At the sametime, subsidies and taxes should be astransparent as possible. To maintain investmentrates in certain key sectors, careful attentionmust be given to the appropriate roles ofpublic and private investment so as to promotea more efficient allocation of limited investmentfunds, among sectors and among activitieswithin sectors. Private investment is invevitablymore profit conscious, and oriented more toshort-term instead of long-term returns.
On the side of savings, the savings potentialof rural areas appears to be largely untapped.While the very poor cannot save, there will bemany low-income people in rural areas,small-scale farmers, labourers, and thoseemployed in informal rural services, who have ahigh propensity to save, but entirely lack thefacilities to save in monetary terms. Individually,they may not be able to save much,collectively they can. The mobilization of suchsavings is a vitally important area ofdevelopment of rural financial markets, which isdifficult to achieve in practice. Financialintermediaries, in early stages of developmenttypically focus more on the asset side of theirbalance sheets, their loan portfolios, than theliability side, their savings deposits. Thistendency is sustained by the currentwidespread practice of channelling targetedcredit funds from the central bank, often atsubsidized interest rates, and from external
16 Of course, the non-agricultural sector is also typicallygrowing faster than agriculture, which leads to a discussion
of incremental capital-output ratios (ICOR), discussed inBox 3.2.
sources to target rural groups. The importantissue of the development of rural financialmarkets is discussed at greater length in afollowing section.
The fiscal budgetOn the side of government expenditure onagriculture, there are two key issues. The first is
the need for less concern on the quantity ofresources expended and more on the qualityand efficiency of their use.
This involves the allocation of suchexpenditures to be more toward those activitiesthat governments have a comparativeadvantage in performing. This may be inagricultural research, extension and educationactivities and less in marketing, for example.Moves to privatize government operations insuch areas as marketing are steps in thisdirection, but they are likely to be resistedpolitically and may entail initial expenditure onsome institutional development to ensure thatthe private sector is capable of taking on itsnew roles. Expenditure on research on exportcrops such as coffee and tea traditionally hasbeen funded by growers themselves in manycountries, and extension services as well, insome cases.
The second issue concerns recurrent costs.Here "recurrent" is carefully defined to coverthe costs of maintaining and operating projectsand programmes as part of the current budget.So there not only has to be a rationalallocation of the government budget betweendevelopment and current expenditures (the firsttypically is what is externally funded plus theresidual of the budgetif any after coveringcurrent needs), but attention has to be given tothe recurrent demands placed on the currentbudget of past and ongoing developmentexpenditures. There is usually a conflict here.Donors may regard current expenditures as"consumption", but the true recurrent part is animportant corollary of development (capital)expenditures. On the other hand, governmentsmay regard the non-recurrent part of theircurrent budgets as politically inviolable.
With regard to the sources side of the fiscalbudget, the latter years of the 1974-84 periodhave witnessed a slowing in the growth ofdevelopment assistance to agriculture, evenafter allowing for the appreciation of the dollarand a slowing in inflation rates. It is unlikelythat development assistance will obtain asignificantly larger share of OECD's nationalincome; although some increase is likely, as
113

114
BOX 3.6
Agricultural export taxes
donor countries attempt to respond tointernational calls for greater aid allocations andso move from a typical share of 0.35% or lessof GDP up towards the UN target of 0.7% (andeven 1% of GDP in some cases). It is alsounlikely that agriculture will capture anincreasing share of development assistance toall sectors; the gains achieved from the late1970s appear to have drifted back again since1982. Therefore, growth rates in OCA may beonly 3-4°/o a year compared with 5-6°/o a yearduring 1974-84, and a higher rate of growth inthe earlier years of that period. Some mayargue that the absorptive capacity ofdeveloping countries inhibits a return to themore rapid growth rate of earlier years.
OCA has to be seen in a proper perspective.Gross disbursements may contribute a sizeableshare of government expenditure on agriculture:a typical figure is about 30%. The range,however, is very wide and the average is raisedby the relatively large amounts of aid receivedby a few countries, mainly on political grounds,although aid, in general, is more evenly spreadthan hitherto. But gross OCA was less than15% of developing countries' export earningsfrom crops, livestock, fishery and forestproducts in 1983-84. An immense number of
Some recent empirical evidence ofthe significance of export taxrevenue also is provided in a studycovering 31 developing countriesthat collected more than 5% oftotal revenue from this sourceduring 1973-79.1 Export taxescontributed more than 20% infour countries and more than 10%in 15; the overall share, however,tended to decline. It also wasunstable because of changes in taxrates, exchange rates, internationalprices and export volumes.
In the past, some countries haveused the export tax as animportant policy tool to shapeeconomic development. Forexample, between 1940 and 1972,export taxes in Argentina extracted,on average, about 50% ofagricultural income at factor cost.The direct effect of the tax itself,at 15%, was considerably less thanthe indirect effect, 34%, arisingfrom the reduction in domestic
trained human resources, scarce in developingcountries, was required to administer thistransfer of resources. A greater emphasis onprogramme or sector funding and budgetarysupport for approved activities could result in agreater capacity to absorb funds, their moreeffective utilization and a lesser demand onskilled manpower.
If all external borrowings are included (officialand private government guaranteed credits), netdisbursements may be very much less thangross. To recapitulate an example shown, LatinAmerica's agricultural sector received $1 100million gross a year during 1980-84, but theeconomy as a whole received only $165 millionnet of interest and repayments. Unlessborrowed funds are wisely invested, they mayprove to be a drain on the rest of theeconomy. Information is generally lacking toinvestigate this issue further, but the WorldBank reports that while the rates of return onagricultural projects it has funded haveachieved target levels, these are generally lowerthan investments in other productive sectors,and the project failure rate is rather high.
Domestic sources of government revenuefocus on taxes. While agriculture is, in general,rather lightly explicitly taxed, and the sector's
prices caused by the tax. The sizeof these effects, however,fluctuated widely during the periodreviewed.2
'Richard Goode, "Government Finance in
Developing Countries", Studies of Govern-
ment Finance, The Brookings Institution,Washington D.C., 1984.
2 D. Cavallo and Y. Mundlak, "Agriculture
and Economic Growth in an Open
Economy: the Case of Argentina", IFPRI,
Research Report no. 36, Washington D.C.,
1982.

implicit tax burden is difficult to document, it is
likely to be heavy. Implicit taxation includesmarket interventions, excessive margins ofmonopsonistic marketing boards and equivalenttaxes represented by overvalued exchange rates.The latter may result in saving governmentexpenditure on funding crop or livestockpurchases rather than generating revenue, but itnevertheless results in a transfer of resourcesout of the sector. The forced procurement offood products may be another means. To thesemay be added the resource transfer effect ofthe whole panoply of measures designed toprotect domestic industries, including thoseproducing agricultural inputs. As a matter ofpolicy, it would be better to remove suchhidden distortions that affect agriculturalprofitability in mostly adverse ways, andsubstitute fully transparent and progressivedirect and indirect taxes on the sector.
THE PRIVATE SECTOR
Data limitations, as mentioned earlier, prevent acomprehensive and consistent review of thegovernment fiscal budget as it relates toagriculture in developing countries. Thesituation, however, becomes even worse withrespect to the private sector. Little is knownabout private investment in agriculture indeveloping countries, and information onsavings capacity in rural areas is alsoincomplete, as are data on the workings ofrural financial markets. With regard to theexternal private sector, the flows of foreigndirect investment (FDI) to agriculture indeveloping countries are not easily traced.Greater recourse in developing rural financialmarkets and exploiting the potential for greaterFDI have been put forward as possible solutionsto overcoming agricultural financing constraints.
The first part of this section provides anoverview of private sector financing, againattempting to link agriculture to themacro-economy. The second part discusses theimportant issue of rural financial markets.Frequently they have been distorted to channelcredit funds to select target groups of theagricultural population, while institutionaldevelopment has been ignored or neglected.Third, there is a brief survey on FDI and itsimpact on agriculture.
OverviewAn overview of private sector borrowing tofinance agricultural development, otherinvestment activities and consumption, can begained by examining the size and pattern ofdomestic credit expansion. By definition, totaldomestic credit is equivalent to the moneysupply (money plus quasi-money plus otheritems) minus net foreign assets:17
Moneysupply
= Netforeignassets
Domesticcredit totheprivatesector
+ Domesticcredit togovernment(includingparastatalsector)
For the 35-country sample, domestic credit tothe private sector, as a share of GDP, increased
17 For further details see IMF, "Monetary Survey" section,
International Financial Statistics Yearbook.
115

116
Figure 3.4
9 percentage points between 1974 and 1984,rising from 16% to 25% of GDP (Fig. 3.4).Domestic credit to government was persistentlysmaller in size, but rose by the same amountover the same period, from 11% to 20% ofGDP. Regional differences in the ratio ofdomestic credit to GDP are the outcome of anumber of factors, including bankinginstitutions, the degree of financialintermediation, levels and changes in realincome, fiscal and monetary policies, and therelative size of the public and private sectors.
The biggest rise in domestic credit to theprivate sector occurred in the Far East in 1974,where private sector credit as a percentage ofGDP was substantially higher than in otherregions, and this disparity increased over thefollowing decade. In 1974, the ratio of private
MONETARY SURVEY: DOMESTIC CREDIT TO PRIVATE SECTOR AND GOVERNMENT, BY REGION*, 1974-84
74 75 76 77 78 79 80 81 82 83 84
Sources: IMF, International Financial Statistics: FAO. Policy Analysis Division
sector credit to GDP was already 20% in theFar East, whereas it ranged from 13-17% in theNear East, Africa and Latin America. By 1984,domestic credit to the private sector had risento 34% of GDP in the Far East compared withratios of 21-25% in other regions. The followingdiscussion of rural financial markets gives somereasons why this may have occurred.
Also in the Far East, domestic credit to theprivate sector increased relative to domesticcredit to government throughout the period1974-84. In the Near East, credit to the privatesector was persistently smaller in size thancredit to government; but in the 1980s, thedifference narrowed and private sector creditincreased relative to domestic credit togovernment. In Africa and Latin America,domestic credit to government rose faster than
060
50
40
30
20
10
0
74 75 76 77 78 79
ALL REGIONS*
IIi i ii
8081
t I
82 83 84
I
74 75 76 77 78 79 80 81 82 83 84
Domestic credit,total
To private sector
To government
* Based on a sample of 35 Developing Countries
% of GDP % of GDP
60 60
FAR EAST LATIN AMERICA
50 50
40 40
30 30
20 20
10 10
0 i iit' Ilii 0 till] I
74 75 76 77 78 79 80 81 82 83 84 74 75 76 77 78 79 80 81 82 83 8460 60
AFRICA NEAR EAST
50 50-
40 40
30 30
20 20
10 10

TABLE 3.20. Financing of the fiscal deficit in selected countries, 1983
(Percentages)
Overall fiscal21 selected countries deficitfrom 35-country sample
Average, excluding Turkey.Source: IMF, Government Finance Statistics Yearbook.
credit to the private sector from 1974 until1982, when the pattern changed as a result ofdomestic adjustment measures to curb the sizeof the fiscal deficits.
Most domestic credit to government is usedto finance the fiscal deficit, either from moneycreation or local borrowing. In 1983, onaverage, two-thirds of the fiscal deficit for 21out of the 35 countries in the sample, wasfinanced domestically and one-third wasfinanced externally by foreign loans and grants.Interest payments on domestic and externalborrowing absorbed 11.40/0 of total governmentexpenditures in these countries (Table 3.20). Therange, however, was large: from less than 6%of total government expenditure (KoreaRepublic) to 35% (Mexico).
The general reduction in the size of the fiscaldeficit after 1982 meant that a smaller amount
Financing of the fiscal deficit
Externalfinancing
InterestDomestic paymentsfinancing
117
of the money supply was required to finance itand consequently, a larger share of domesticcredit could be directed to the private sectorwhere it could be used for financing agriculturaldevelopment or other activities. For the 35countries as a group, domestic credit togovernment decreased by nearly 2% of GDPbetween 1982 and 1984, whereas domesticcredit to the private sector rose by just over 2percentage points, so that there was a slightincrease in total domestic credit. Similarly, in allregions except Latin America, the reduction indomestic credit to government wasaccompanied by an increase in private sectorcredit of around 2% of GDP, and a small risein total domestic credit. However, in LatinAmerica, domestic credit to the private sectordeclined by nearly 2% of GDP between 1982and 1984, and there was a small reduction in
As oh of total central government expenditure
FAR EAST
India 3.4 3.6 30.6 11.3
Indonesia 10.9 6.4 4.5 6.9
Korea Rep. 5.4 3.3 2.1 5.6
Pakistan 29.3 4.9 24.3 12.5
Philippines 141 10.2 3.9 9.4
Sri Lanka 32.3 15.5 16.7 16.3
Thailand 21.5 4.6 16.8 12.5
LATIN AMERICA
Argentina 45.0 3.2 41.8 8.8
Bolivia 60.0 0.0 60.0 5.8
Brazil 11.7 -1.4 13,1 12.4
Costa Rica 8.4 6.4 2.0 8.0
Dominican Rep. 1V.8 3.6 14.2 8.0
Mexico 29.7 12.2 17.5 35.0
Peru 38.6 19.3 19.3 20.0
AFRICA
Kenya 18.8 8.9 9.8 14.3
Malawi 24.1 23.0 1.1 13.6
Morocco 23.9 10.2 13.6 11.0
Senegal 22.0 16.6 5.4 6.4
Sierra Leone 61.4 9.6 51.8 8.6
NEAR EAST
Egypt 17.6 2.5 15.1 6.7
Turkey 17.3 6.7
Average 21 selected countries 25.9 8.1a 18.2a 11.4

118
total domestic credit in relation to GDP.Domestic credit to government continued torise until 1983, and although it fell in 1984, theratio was still higher than in 1982.
In summary, it was only in the Far East thata significant expansion in domestic credit wasrecorded during 1974-84, and from about 1979in the Near East. However, from data currentlyavailable, it is impossible to partition these flowsbetween agricultural and non-agriculturalinvestment and consumption. A survey offinancial markets in rural areas could show theirlevel of development and how well they maybe mobilizing domestic resources for investmentin agriculture and other rural activities.
Rural Financial Markets (RFMs)RFMs include all the man-made rules andregulations that guide the behaviour of ruralpeople relating to the accumulation of savingsand their use, the flow and holding of funds inthe rural sector, the allocation of private andpublic investible funds and the integration ofrural financial activities with national andinternational institutions. Therefore, RFMs coverthe activities of formal or institutional sourcesof credit (public and private institutions likestate banks, agricultural development banks,commercial banks, credit unions andcooperatives, postal savings and loans banks) aswell as informal or non-institutional creditsources, such as private money-lenders (traders,friends and relatives) landlord-tenant sharerelationships and local rotating creditassociations.
RFMs also embrace the institutions relating tothe customs, practices and attitudes towardrural savings and the decisions on institutionalsavings as hoarding and forms ofnon-monetized savings, together with the formalinstitutions designed to mobilize rural savings.RFMs therefore play an important role infinancial intermediation, the process thatfacilitates the transfer of claims on resourcesfrom people and economic areas with a"saveable" surplus, to those people or areaswith a need for credit or investment. Financialintermediation is a key process promotingeconomic development and how well itoperates will strongly influence the pace ofeconomic growth.'
18 For a discussion of RFMs and financial intermediation, see
R.L. Tinnermeier, "Agricultural Finance and Rural Develop-
ment", in K.C. Nobe and R.K. Sampath (eds.), Issues in Third
World Development, 1983.
A regional comparison of progress in institutionbuildingThere are quite wide regional differences withrespect to the type of institutions thatdominate RFMs and their degree ofdevelopment (see Annex 3.1). In the Far East, anextensive network of cooperative, private orstate-owned banks has been established.Despite the great progress made in building uprural banking institutions, and the priority givento the servicing of small farmers, a largenumber of small-scale farmers in many Asiancountries do not yet have access to bankingservices. Nevertheless, the relatively advancedstate of rural financial institutions and markets,do raise the question of the role of theseinstitutions in being able to respond rapidly andflexibly to changes in domestic credit expansion,as shown in an earlier section.
A comprehensive overview of rural financialinstitutions in Latin America is currently notavailable. However, networks of developmentbanks covering agricultural credit and ruralcooperative banks have expanded considerablyduring the last two decades. Yet, rural financialservices are largely confined to large-scalefarmers, while smaller farmers lack adequateaccess to financial services."
In the Near East, agricultural credit servicesare provided through specialized governmentfinancial institutions or through cooperativeorganizations that are both supervised andbacked by their governments. Some agriculturalcredit institutions also extend savings services,but the amount collected remains low incomparison with loans extended.
Generally, African governments haveestablished parastatal agricultural creditinstitutionsoften linked to developmentprojects which supply credit, but have notoperated deposit accounts. Rural cooperativebanks have been promoted in some countriessuch as Mauritius, Cameroon, Ghana, Kenyaand Rwanda, but are comparatively lesswidespread than in the Far East. Despite themany rural development projects in Africa,which have included agricultural credit as amajor instrument for development, the majorityof farmers still have no access to financinginstitutions because of poorly developed branchnetworks. This results in very large ratios ofrural people per branch, typically150 000-300 000 to 1 compared with ratios of
19 See also C. Gonzales-Vega, Strengthening Agricultural
Banking and Credit Systems in Latin America and theCaribbean, FAO, Rome, April 1986.

BOX 3.7
Mobilizing rural savings:Indonesia and the Domin C?-rtRepublic
Indonesia. The Bank RakyatIndonesia (BRI) has recentlyinstituted a new general ruralcredit programme (KUPEDES) thathas made important changes inthe way financial services areprovided in rural areas. KUPEDESgrew out of an earlier creditprogramme, BIMAS, that providedlarge amounts of subsidized andtarget loans for rice production.
Under BIMAS, 3 600 villagebanks were formed as retail outletsfor rice loans. By the mid-1970s,BIMAS's coverage peaked when3.4 million farmers received loans.Soon after, loan recovery problemsemerged and the number of loansmade began to shrink, as moreand more borrowers failed torepay. By 1983, loan recoveries, ina much smaller BIMAS programme,were 80% or less. Also, villagebanks were covering less than40% on average of their operatingcosts, and BIMAS was threatenedby closure.
The Government of Indonesia inJune 1983 instituted majormonetary reforms. These includedeliminating many quantitativelending requirements for banks,freeing interest rates and stressingsavings mobilization. These reformsencouraged BRI to retain its villagebanking system and to institutemajor changes, including increasinginterest rates charged on loans tocover its operating costs, andgiving bank managers authority toextend and collect loans made forany purpose. Savings mobilizationwas stressed through offeringhigher interest rates on savingsaccounts. As a further stimulus, BRIbegan to tie the bank's access toits funds to savings mobilizationperformance. For every unit ofmoney mobilized by village banks,two units of money could beborrowed from BRI at interest ratesequal to the top rate paid tosavers (15% in 1986). Some villagebanks also were allowed to mergeor to convert to village serviceposts, which are open one or tl.vodays a week, depending on theirvolume of business. In late 1986,many of these village banks weregenerating sufficient incomes tocover their operating costs, loandefaults were less than 3%, andsavings deposits, as a percentage
119
of loans, were increasing.Dominican Republic. The
Agricultural Bank (Banco Agrícola)of the Dominican Republic begana major restructuring of itsactivities in 1983. Founded in the1940s, the bank was the primaryprovider of agricultural loans,handling 25-30 targeted lines ofcredit, largely from the CentralBank. The bank did not acceptprivate deposits in any of its30 branches, and was entirelydependent on government ordonor funds for its loans. Loanrecovery was a chronic problem.
Tight government budgets andless donor willingness to fundtraditional agricultural creditprogrammes began to limit sharplythe bank's access to outside fundsin the early 1980s. As a result, itwas decided that savings depositshad to be mobilized if the bankwas to sustain lending. The bankfirst received permission to acceptdeposits, got the government toreduce reserve requirements onthe bank's deposits, and thenopened up savings deposit servicesin a small number of pilotbranches. In addition to interestrate incentives, savers were offeredprizes as added inducement.
Special incentives were alsoprovided to branch employeesbased on savings mobilizationperformance. Over a period ofseveral years, the bank has openedabout 35 000 savings accounts andhas mobilized the equivalent of$8 million in an economy that hasbeen under severe financial stress.
Furthermore, the bank is nowless dependent on the governmentand donors for funds, is providinga broader range of financialservices to rural clients, is morecareful in granting loans and isprojecting an image of a "seriousbank" that has staying power.

120
BOX 3.8
Innovative financialintermediaries in Zimbabwe
5 000-20 000 to 1 in the more denselypopulated countries of the Far East.
Despite the efforts made to build ruralfinancing institutions, large proportions of ruralpopulations in developing countries, particularlysmall farmers, depend mainly on informalmarkets for their limited financial needs. Thesemarkets include relatives, friends,money-lenders, traders and informal savingsclubs. It has been estimated that in somecountries in the Far East, less than a half offarmers are served by banks despite theprogress that has been achieved, while inAfrica, the proportion may be only 10-20%.
Because most formal rural credit is targetedat farmers, most non-farm rural enterprisescannot be financed directly with formal loans.Hence, these too have to rely on informalmarkets and are financed from redirectedagricultural loans or remain underfunded. InBangladesh, for example, the Grameen Bank hasfound widespread demand for loans to fund awide range of non-farm activities in rural areas,activities that provide important services tofarmers and generate employment and incomefor the rural poor.
Over the past 20 years inZimbabwe approximately 5 500savings clubs have been formed ofwhich about two-thirds are stillactive. The total membership is140 000, mainly women, with about20-30 members in each club. By1984, the movement had a totalequivalent of more than$2.7 million in savings.
Although the deposited funds ofan individual member are his orhers to withdraw, there is a strongtendency toward the collective useof savings, organized by the leaderof the individual savings club.These collective savings arefrequently used for farminvestment purposes, usually forinputs such as fertilizer. Theseinputs are then distributed tomembers according to theirrespective contribution to thepooled savings.
The savings club movement hasbeen instrumental in enablingmany farmers to significantlyincrease their crop production
The role of credit in promoting agriculturaldevelopment and influencing the evolution ofRFMsThe provision of subsidized agricultural credithas become an important policy instrument tochannel funds to poor farmers and to stimulatedevelopment through the introduction ofmodern technologies. The Pro-gramme of Actionof the World Conference on Agrarian Reformand Rural Development (WCARRD) of 1979,specifically referred to the need forgovernments to consider action to designinstitutional credit schemes which increase thevolume of credit to peasant producers throughpublic and private lending institutions. Therewas also a call for a reorientation of thepractices of such institutions toward the needsof small farmers for housing, consumption andproduction credit.
Many agricultural credit programmes havebeen financially supported by'external fundsprovided by aid agencies and by governmentsubsidies. Between 1974 and 1982, funds frommultilateral sources for agricultural credit grewby 22% a year in real terms and their share oftotal multilateral resource flows to agriculture
through investment in improvedinputs. Notably, the pooled savingsand bulk purchase of fertilizermake it possible for the small farmsector to be commerciallyattractive to private-sector farmservicing companies.

doubled to nearly 16%.2° FAO's data bank onexternal assistance to agriculture generallyconfirms this picture. Commitments identified asbeing allocated to the agricultural credit sectorrose from 6.5% of total OCA ("broad"definition) in 1975-77 to nearly 9% in 1982-84,an average annual rate of growth of 15%.Multilateral commitments dominated, with over90% of total commitments for this purpose, butbilateral commitments have risen fast.
Considerable efforts also have been made tobuild up rural financial institutions to facilitateagricultural financing, often as part of formalcredit programmes funded from externalsources. As has been noted, however, theinstitutions established and their viability havebeen regionally different, because frequentlyformal credit programmes have not emphasizedinstitutional development sufficiently, and therequired management skills and experiencehave been lacking in many developingcountries, particularly in Africa. Sometimes thevery existence of a credit programme usingfunds at subsidized interest rates loanedthrough a parastatal organizationoften fromexternal sources of fundshas led to theatrophy of local financial institutions. Thesecredit schemes may result in poor farmers notreceiving adequate resources; in addition,private savings are not mobilized or may evenbe repressed by low interest rates on deposits.
Credit is often wrongly seen by agriculturaldevelopment planners as an input rather thanas a claim on resources and services. Yet creditwill not promote development if otherconstraints are not relieved, such as lowproducer prices, lack of inputs and appropriatetechnologies, lack of markets because ofinadequate roads and low and unstable yields.
Despite such limitations, low rates of intereston credit targeted to low-income farmers havebeen justified on the grounds that they offsetother price distortions and can transfer incomesto the rural poor. However, credit is highlyfungible and can be diverted to other uses andusers. If credit is offered at rates significantlybelow the market level set by the informalsector, it will be rationed because demand willgreatly exceed the supply of funds available. Itwill therefore tend to end up in the hands of
20 See Maurice J. Williams and Thomas W. Stephens,"Resource Flows Through the Multilateral System for Food
and Agriculture: Trends of the Decade", Food Policy, vol. 9
no. 4, November 1984.
121
the relatively wealthier members of ruralcommunities or those with patronage or otheradvantages, and not necessarily used foragricultural purposes. Providing credit for anyworthwhile rural enterprise, and not limiting itto agricultural activities alone, is a first step thatan innovative rural financing institution shouldadopt.
Viability of rural banking institutionsA major shortcoming of conventionalagricultural credit programmes in developingcountries has been the neglect of the oftenrudimentary financial systems such programmesare imposed upon. The resulting systemstypically depend, to a large extent, ongovernment-controlled sources of finance, oftenexternally funded to some degree. Theinstitutions involved, also typically parastatal,are generally heavily subsidized to cover theirtransaction costs and the credit funds have tobe supplemented to cover defaults ornon-repayment of loans. This situation isdifficult to sustain in times of domesticbudgetary stringency and the need to curtailexternal borrowings.
A major theme of this chapter is that thefinancing of agriculture in developing countrieswill have to increasingly shift to exploiting morethe domestic savings that are available. Thisapproach involves creating or nurturing viablefinancial systems and their componentinstitutions in rural areas. The Central Bank hasa key role to play in this development byshifting from its traditional regulatory function,toward a role that also promotes the creationof a sound financial structure and, morespecifically, the setting up of rural financialmarkets that function. The following are someof the major issues involved.
Mobilizing savings. Conventional approachesto agricultural credit often have overlooked theimportance of savings mobilization. Manygovernment-sponsored agricultural creditinstitutions do not provide deposit services.One of the main effects of credit programmesfunded by concessionary discount lines ofcentral banks is that the credit agencies havestrong disincentives to mobilize voluntarysavings. In other words, the banking systemfinds it easier and cheaper to accept largepublic loans at concessionary rates than toundertake the difficult task of mobilizing fundsthrough large numbers of small private deposits.There also remains the widely held belief thatthe rural poor are "too poor" to save, will notuse a banking system for savings, and their

122
savings are not responsive to changes ininterest rates.
Only in a few cases, however, have ruralpeople been provided with positive incentivesto save in a financial form and in attractiveways of doing so. Yet evidence is mountingthat significant levels of rural savings can beachieved in a wide variety of situations.Successful examples are shown by theagricultural cooperatives or farmer associationsin China and the Republic of Korea where, in1979, loans were 73% and 50%, respectively ofassets (deposits plus capital paid and reserves).In the Republic of Korea, the averagepropensity of farm households to save in 1974ranged from about 0.22 in households with lessthan 0.5 ha of land, to 0.40 in those with 2 haor more.21 The overall average for the survey ofsome 2 500 households was 0.33 and had morethan doubled during the previous 12 years.Other examples of rural savings schemes indeveloping countries are shown in Annex 3.1.
Rural savings mobilization also contributes todeveloping a functioning RFM because itfacilitates credit appraisal and loan recovery.Borrowers may have a his'tory of makingdeposits and become better known to thelenders who, in turn, are likely to make morecareful appraisal of borrowers if they wereloaning the savings of neighbours and friends,as well as their own.
That rural people want to save isdemonstrated by the widespread informalsaving clubs or rotating savings and creditassociations (ROSCAs) found in Africa, the FarEast and the Caribbean. There remains theneed to develop links between these informalinstitutions and the banking system, to promotefinancial savings.
Another incentive for savings mobilization isto adjust upwards the rate of interest oncentral bank discount lines so that funds fromthis source are not cheaper than thosemobilized through deposits. Alternatively, accessto concessionary rediscount lines can becontingent on savings mobilization performance.
Loan recovery. Low repayment rates havebeen a major problem of many agriculturalcredit projects. Arrears often amount to20-50% and maybe more. Table 3.21 showsexamples of the experience in Asia, and thesituation in other regions is likely to be worse.In extreme cases, the amount recovered is
21 See Dale W. Adams, "Mobilizing Household SavingsThrough Rural Financial Markets", Economic Development
and Cultural Change, vol. 20, 3 April 1978.
smaller than the transaction costs incurred inmaking the loans.
Loan defaults jeopardize the viability of thelending institutions, draw off scarcemanagement time to handle recovery problems,increase the cost of maintaining creditprogrammes and destroy the working relationsbetween borrowers and lenders.
Poor loan recovery is due to weak lendingdecisions, poor quality of loan services thatraise the cost of borrowing, lack of incentivesto recover loans, unfavourable weatherconditions or wilful default. Lack of well-definedagricultural technical packages, inadequate linksamong credit, input supply, marketing andextension services, and lack of managerial skillshave contributed also to loan recoveryproblems.
As a general rule, lenders try to limit theirdefault risks by requiring collateral on loans.However, faulty legal systems, deficientconditions regarding land titles, the cost oftaking over collateral in the event of a defaultand the difficulty of taking assets fromlow-income farmers, severely limit a bank'sability to use mortgaged items effectively.
Transaction costs. These costs for rural banksare for making, servicing and recovering loansand, in some cases, for mobilizing savings. Suchcosts may be surprisingly high in rural areas forformal lenders because the size of transactionsare typically small and short term, andborrowers may not be accessible (Table 3.221.The administrative costs of lending to smallfarmers (excluding the cost of capital) may be10-30% of the value of the loan or more. Forexample, in 1985 the lender transaction costs ofa fertilizer credit project in Africa wereestimated to be 62%, while the interest ratecharged to borrowers was 10%. Examples ofrelatively efficient programmes in Honduras andthe Dominican Republic in 1984-85 give costsof 3-10%.
In many cases, transaction costs are raisedbecause of extensive reporting requirements oftargeted loan programmes. It is not unusual foran agricultural bank to be administering 20-30(in an extreme case up to 200) lines of credit.
Lenders are required to develop costlyaccounting systems that differentiate betweenloans under each programme. With such asystem, it is relatively easy, for example, todetermine the number of small-farmer loansmade, how many fertilizer loans were issued, orhow many maize loans were made by a bank.It is more difficult, however, to get informationthat is useful for efficient management of thefinancial intermediary.

TABLE 3.21. Percentage of overdue agricultural loans to farmers in Asian countries in recent years
Borrowers also may incur substantialtransaction costs: cumbersome proceduresnecessitating frequent trips to the bank, andlate delivery of the loan itself, particularly thosepaid-in-kind as inputs, may significantly raisethe cost of borrowing from formal lenders,particularly for small-scale borrowers.
Interest rates. The setting of interest rates hasbecome a major issue in many developingcountries. Although it is understandable thatborrowers argue for low interest rates, theresult is often excess demand for loans thatconsequently have to be rationed, distortions inthe rural financial system and dissension in thecommunity when some have access tobelow-market rates and others do not.
Low interest rates also discourage savings,which again leads to making banks dependentupon government or donor funds. Furthermore,low spreads between interest rates on depositsand loans, which have to cover the transactioncost of the bank and bad debts, have
123
Source B.R. Quinones, Jr. "An Overview of Agricultural Credit Systems in Selected Asian Countries", Asian and Pacific Regional Agricultural Credit Association(APRACA), Bangkok, Thailand 1985.
undermined the viability of banking institutions.Many rural banking institutions, particularlyparastatals, cannot cover the expenditures ofoperation within the interest rate spreadsprovided. This situation has prevented theseinstitutions from competing more actively withthe informal lenders upon whom the majorityof small farmers still depends for their creditneeds, and hence has inhibited the evolution ofRFMs.
In many instances, large differences betweennominal interest rates and the rates of inflationhave often led to negative and erratic realinterest rates (Table 3.23). Highly negative realinterest rates greatly inhibit financial savings yetconfer correspondingly large benefits on thosewho can obtain loans. Erratic rates also inhibitsavings and investment. Subsidizing interestrates for specific purposes, as often occurs withtargeted agricultural loans, do not necessarilyincrease agricultural investment. It may bebetter to promote rural development directly
Country Institution/ProgrammeOverdue loans
as % ofloans disbursed
Inclusiveyears
Bangladesh Total agricultural loans 1980-84
China Total agricultural loans 12 1983
India Primary agr. credit societies 43 1978-83
Primary land dev. banks 46 1978-83
Commercial banks 47 1978-83
Regional rural banks 18 1978-83
Indonesia Mass permanent working capital credit (KMKP) 42 as of
Sept. 84
Korea, Rep. NACF loans 9 1973-83
Malaysia Bank Pertanian Malaysia 26 1977-83
Nepal Agricultural dev. bank 36 1979-84
Pakistan Supervised credit system 5-10 1983-84
Other agricultural loansshort term 40 1983-84
long term 38 1983-84
Philippines Masagana 99 Credit Programme
Rural banks 48 1973-83
Government banks 62 1973-83
Sri Lanka Total agricultural loans 46 1967-83
Thailand BAAC: Individual farmers 20-24 1979-83
Cooperatives 55-63 1979-83
Darmers' associations 65-71 1979-83

124
TABLE 3.22. Borrowing transaction costs at the farm level in selected countries, by loan size
(Percentages)
such as through investment in roads and otherinfrastructure, than by such indirect means asinterest rate subsidies for credit to particularagricultural activities.
An adjustment of interest rate policies isneeded in many developing countries to allowdomestic savings to be mobilized and financiallysound banking institutions developed. Whereinterest rates are seriously distorted, however,as with exchange rates, bringing them closer toa more normal rate may lead to problems ofadjustment and the process may have to beundertaken relatively slowly.' If the governmenthas a large budget deficit, however, raisinginterest rates will raise the interest costcomponent in the budget and may make thedeficit even worse. It was shown above thatinterest rate costs constitute a relatively largepart of government expenditures in developingcountries (11% in 21 selected countries fromthe 35-country sample).
Field-level delivery systems. Attempts to buildviable rural financial institutions face a basicdilemma: the need to handle financialtransactions at minimum cost, yet the parallelneed to improve farmers' access to financialservices, involving the extension of the networkof rural branches. Various methods have beentried to overcome such difficulties:
22 A real rate of interest of 2-3% has been a long-termnorm, although it has risen in recent years along withinflationary expectations.
Source: Carlos E. Cuevas and Douglas H. Graham, "Rationing Agricultural Credit in LDCs: The Role and Determinants of Transaction Costs for Borrowers",Economics and Sociology Occasional Paper No. 1178, Department of Agricultural Economics and Rural Sociology, Ohio State University, December 1984.
Mini-branches, occupied by one officer on apart-time basis;
Mobile credit and savings officers who visitrural centres according to a roster, such as onmarket days (popular in the Far East with itsdense populations, but entails high transportcosts in Africa);
Establishing non-banking intermediaries suchas savings and credit cooperatives, voluntarysmall groups of farmers such as in China, theRepublic of Korea and Thailand, but also inAfrica (Malawi and Ghana), and informal savingsclubs (see Box 3.8); and
Using input or produce marketing systemsto extend and recover agricultural credit suchas through traders, or as in the Philippines, ricemillers.
The success of these approaches depends,however, on skills and institutional developmentwhich are most lacking in those areas with thegreatest need for financial services. Furthermore,using the trading system as an intermediaryoffers opportunities to lower transaction costs,but may meet with opposition because of theprejudice against the trading sector in somecountries. Cooperatives may be subject topolitical manipulation and, as previouslydiscussed, the existence of parastatal rurallending agencies offering credit at subsidizedrates, even if supposedly targeted, removesmuch of the incentive for establishing formalbanking intermediaries.
Transaction costs by loan size Bangladesh Ecuador Honduras Panama Peru
A. TRANSACTION COSTS AS % OF
LOAN AMOUNT
Sample average 21.7 2.8 3.0 5.2 1.2
Small loan 29.4 5.3 5.9 5.7 3.9
Medium loan 17.5 2.0 1.6 3.0 1.3
Large loan 7.0 0.6 0.2 2.0 1.0
B. TRANSACTION COSTS AS °A OF
EXPLIC1T-INTEREST CHARGES
Sample average 180.8 22.9 23.1 46.4 4.0
Small loan 245.0 47.7 45.4 50.9 13.0
Medium loan 145.8 17.3 12.3 26.8 4.3
Large loan 58.1 4.1 1.5 17.9 3.3

TABLE 3.23. Difference between rate of interest on deposits a and rate of inflation, selected developing countries,1976-84
(Percentages)
125
Interest rate on one-year term deposit.b Denotes a break in the available times series.Sources Adapted from Bernhard Fischer et al., Sparkapitalbildung in Entwicklungsländem: Engpisse und Reformansitze, München: Weltforum Verlag, 1986. Sourcesof Data for 1983-84: Khatkhate, Deena R., "Assessing the Level and Impact of Interest Rates in Less Developed Countries", IMF, Internal Document, 1985; and GOIMF, International Financial Statistics Yearbook, 1986.
Region/country 1976 1977 1978 1979 1980 1981 1982 1983 1984
Africa
Cameroon 10 7 1 5 4 6 11 12 7
Côte divoire 6 22 8 11 7 1 2 lb 3
Ghana 49 109 64 42 38 103 14b 114 27Kenya 6 10 8 3 7 4 11 2 2
Nigeria 19 18 16 6 14 15 0 16b 31Senegal 5 5 2 4 3 0 9 5 5Sierra Leone 10 lb 4 14 2 13 21 59 55Tanzania 3 8 7 10 24 20 23 21 32
Far East
Bangladesh 4 0 3 7 5 2 1 3b
India 16 2 3 1 4 5 1Indonesia 5 1 1 12 10 3 1 --6.1) 6
Pakistan 4 0 4 2 2 1 5
Philippines 6 4 4 6 5 0 ...Thailand 4 0 0 2 8 1 10 14b
Near East
Egypt 5 7 5 2 12 0
Turkey 11 21 36 47 78
Latin America
Argentina 253 25 35 22 8 27 ...Bolivia 5 2 0 _4) 29 1 101 224 1142Brazil 7 5 20 3 15 4 21 ...Colombia 5 8 7 1 7 10 5 8' 13
Costa Rica 10 9 12 9 0 ... 72b 13 3
Mexico ... 18 6 1 0 2 7 47 17Peru 22 24 26 35 28 12 7 101b 102

126
TABLE 3.24. Foreign direct investment (FDI) in developing countries, 1974-84
(US$ '000 million)
Item
Net FDI in 7 major developingcountries a
Net FDI in all developing countries
Gross FDI in non-oil developingcountries
Links between formal and informal financialmarketsMost farmers, especially low-income farmers, inthe majority of developing countries, stilldepend upon informal financial markets fortheir credit needs. These markets are oftencriticized for their poor performance andexploitation, particularly the activities oftraders-cum-moneylenders. Yet these marketscontinue to operate by providing fast andeffective services at usually low cost, with theminimum of documentation, if any. While casesof exploitation clearly exist, interest chargesgenerally reflect market rates and the risksinvolved. Improving the links between theinformal and formal financial sectors couldmake an important contribution to financialperformance. Informal lenders may beborrowers from the formal market.
What is needed are better and regularassessments of the performance of the informalsector: responsiveness to customers' needs,economic efficiency, including transaction costsand use of market power in setting interestrates and allocating funds. Here, further appliedfield research is called for.
Three other steps are needed:i) The relaxation of restrictions on formalfinancing institutions to enable them tocompete with the informal sector, particularlywith respect to interest rates;
Greater market transparency of informalfinancial markets through the provision ofinformation on savings and credit terms andinterest rates; andiii) Strengthening the bargaining orcountervailing power of weak borrowersthrough the formation of such groups.Attempts, however, to "formalize" informalgroups through the imposition of rules andregulations, may jeopardize their existence.
Foreign Direct Investment (FDI) in DevelopingCountriesFDI is a private external resource flow todeveloping countries that has traditionally been
Argentina, Brazil, Indonesia, Republic of Korea, Mexico, the Philippines and Venezuela. .
Sources-. IMF, "Foreign Private Investment in Developing Countries", Occasional Paper, no. 33, January 1985; and Sheila Page, op. cit.
dominated by transnational corporations (TNCs)from industrialized countries. FDI differs fromother external sources of investment funds inthat it is not normally debt creating andinvolves the ownership of assets created by theinvestment. As a source of investment funds,what characterizes FDI in almost all cases indeveloping countries is its "concentration": it is
concentrated in a few countries in one sectoror a few subsectors by a few firms from a fewcountries. This is the result of the dominance ofFDI by TNCs that specialize in certain lines ofproduction processes.
Generally, FDI has been concentrated in afew developing countries such as Brazil, Mexico,Singapore, the Philippines, Malaysia, theRepublic of Korea, Indonesia, Thailand andHong Kong (Table 3.24). Not only does FDI flowmostly to a few developing countries, it alsotends to be concentrated in countries withrelatively high income. For example, in 1981,70% of FDI to non-oil developing countrieswent to countries with GDP greater than $1500 per caput, while only 200/o went tocountries with GD P per caput of less than $500(Brazil alone accounted for 20% of FDI in thatyear).23
The stock of FDI in developing countries,according to IMF estimates, reached $141 000million in 1982, while profit outflows reached$21 000 million. However, this is probablyunderestimated because profits can betransferred to parent companies of TNCs in anumber of ways such as transfer pricing,royalties and management fees. Developingcountries account for around one-fourth of thestock and flows of FDI."
23 UNCTAD, "Flow of Financial Resources to, from, andamong Developing Countries", Trade and DevelopmentBoard Committee on Invisibles and Financing Related toTrade, Geneva, February 25, 1985.
24 UN Centre for Transnational Corporations (UNCTC),
"Trends and Issues in Foreign Direct Investment and Related
Flows", ST/CTC/59, New York 1985.
1974 1975 1976 1977 1978 1979 1980 1981 1982 1983 1984
1.7 2.8 1.6 2.5 3.7 4.3 4.2 6.3 4.6 2.5 2.7
6.6 10.5 7.9 9.4 10.8 12.4 10.5 15.7 9.9 6.3 10.0
5.1 5.3 5.3 5.3 7.1 9.6 9.1 13.6 12.2 8.9 9.4

The principal investing countries are the UnitedStates, France, the United Kingdom, the FederalRepublic of Germany and Japan. The U.S. sharewas 44% of total FDI of OECD countries during1982-84, while the shares of the UnitedKingdom, the Federal Republic of Germany,France and Japan were 8-10% each. The EEC asa whole had the same share as the UnitedStates in this period. The United Statesdominates FDI in Latin America and its share inthe Far East is rising, while the other countrieshave spread their investments geographically.25
The flows of FDI to all sectors in developingcountries have been influenced by host countryrestrictions and regulations, changes in thenational and international economic climate,trends in borrowing from private externalsources and changes in corporate strategies ofTNCs. As borrowings became more attractive inthe 1970s, debt-creating loans (especially fromprivate banks) gained in share relative to equityfinancing (EDO. Although FDI also continued torise into the early 1980s and tended tomaintain its share (140/o) of total resource flowsto developing countries, the annual shareranged from 5 °/o to 20%.
There has been a recent change in the sizeand regional composition of FDI, the flows ofwhich began to fall drastically in 1983. Theregional shift in FDI has been from LatinAmerica to the Far East and Africa. LatinAmerica's share of total FDI in non-oil LDCswas 68% during 1969-73 compared with 52%during 1979-83; the shares of the Far East (30°/oto 37°/o) and Africa (2 % to 11%)correspondingly rose in these periods.
It is estimated that gross FDI in LatinAmerica totalled $6 500 million in 1982 and $3800 million in 1983, a decline of $2 700 millioncompared with a decline of $2 500 million forall developing countries (including LatinAmerica), from $14 900 million to $12 400million. The decline continued into 1984 forLatin America ($400 million) compared with anincrease of $1 400 million for the otherdeveloping countries.28
Although both FDI and private lending havedeclined sharply since 1981, the relative declinein FDI has been smaller. The decline in FDI was
25 Sheila Page, "The Structure of Foreign Investment: Impli-
cations of Recent Changes for Europe and the Third World",
in EEC and the Third World: A Survey 6, C. Stevens and J.
Verloren van Themaat (eds.), London: Hodder and
Stoughton, 1987.
26 UNCTC, op. cit., 1985.
primarily the result of growing uncertainties inthe world economic environment, recession inmost developing countries and high real interestrates that raised the opportunity cost of capital.
FDI in agricultureFDI in agriculture, compared with other externalflows such as OCA and private loans fromcommercial banks, is difficult to quantify, but isgenerally agreed to be relatively small. Forexample, net FDI averaged around $10 000million from 1980 to 1984, of which probablyless than 5% or $500 million was accounted forby agriculture.27 Nevertheless, FDI in agriculturecan be important in some countries such asThailand where it accounted for 14% of totalFDI during 1979-82.
While these figures are relatively low, theproportion of FDI in total investment in a givenactivity in developing countries can be quitesignificant and even dominant, as in the exportof .some commodities in Latin America. Forexample, 80-90% of developing countries'exports of wheat, maize, coffee, tea and cocoawere controlled by TNCs in 1980.28 This waslargely due to the facilities owned or controlledby TNCs, such as grain handling and grading,warehousing, port facilities, shipping, as well astheir access to markets and foreign exchange.In Latin America, 93% of investment in pulpand paper production was accounted for byFDI, while in nine African countries, itaccounted for two-thirds of their total forestryinvestment. On occasion it is only a TNC thatis large enough to command the requiredresources to successfully handle a majorventure. It is in such cases that the bargainingpower of a TNC can become a major politicalissue.
The nature of FDI in agriculture seems to beevolving from food production to inputsupplies, estate management, contract farming,consultations and food processing, marketingand distribution. A parallel and complementarydevelopment is more business cooperationbetween the investors and the host country.This cooperation often takes the form of a jointventure, which shifts more risk onto the hostcountry, but also allows the latter more controlof the operations.
27 IMF, "Foreign Private Investment in Developing Coun-tries", Occasional Paper, no 33, January 1985.
28 FAO, 'Transnational Corporations in Food and Agricul-
ture, Forestry and Fishery Sectors in Developing Countries",
CES 87/6, February 1987.
127

128
Transnational Corporations: Evolution andCharacteristicsBroadly speaking, transnational corporations(TNCs) are profit motivated, technicallysophisticated and active in a sector orsubsector where demand is generated by arelatively high-income population or wherethere are potential export markets.29
Recently, there have been declines in FDI inthe primary sectors of developing countries,largely because of declining prices for a widerange of primary commodities, high interestrates and stagnant world economic growth. Themanufacturing and service sectors of developingcountries, on the other hand, have seen anincrease in FDI because of their low labourcosts and growing markets.
Because many developing countries arealready heavily indebted, increasing attentionhas been turned toward FDI as a source ofinvestment funds in appropriate sectors,including agriculture. Developing countries alsohave learned from past experience with TNCs,which have made them more aware of theadvantages and disadvantages, and theyincreasingly have national enterprises more ableto compete or cooperate with TNCs. Generally,the host country can expect to gain from TN Cexpertise in management, its state of the arttechnology, and its access to foreign exchangeand international markets.
Nevertheless, developing countries oftenprefer loans from foreign commercial banks toFDI to finance development, because a loan iscontracted over a specified period of time, isflexible, is managed by host-country officialsand does not lay claim to national resources.Furthermore, a TNC may remain for anindefinite period irrespective of the needs andgoals of the host country. In addition, the TNCis likely to accumulate capital that may or maynot be reinvested in a manner compatible witha host country's development goals or aims.
The cost of a TNC to the host country,comprised of remittances of profits and equitygrowth, can be significantly higher than interestpayments on a comparable loan. However, withFDI, the risk is borne by the investor and notby the host country, whereas with a bank loanthe risk is shared. In addition, the repayment ofa loan is independent of the profitability of a
29 Hal Hill and Brian Johns, 'The Role of Direct ForeignInvestment in Developing East Asian Countries", in Welt-
wirtschaftliches Archly, Review of World Economics, Heft 2,
Journal of the Kiel Institute of Economics, Tübingen, 1985.
project, whereas with equity financing, which isa major characteristic of FDI, the rate ofrepayment is directly linked to the profitabilityof the investment.
There is much written that is critical of theperformance of TNCs in developing countries.However, only some of the accusations madeare supported by empirical evidence, and thestudies that have been conducted are ofteninconclusive. In some cases, there are conflictsbetween a TNC's operations and a hostcountry's goals, but these cases appear to be inthe minority and many could have beenavoided, particularly if a countervailinginstitution had existed in the host country.
A TNC's corporate strategy is usually centredaround securing a foreign market, raw materialsand low-wage costs. Its investment generally isrisk capital not likely to be invested ininfrastructure or similar projects, possibly with ahigh social return but a low financial return tothe investor. In addition, relatively high rates ofreturn on investment are expected because ofthe perceived risk due to political andeconomic instability in potential host countries.Hence, the location of its investments issensitive to economic conditions in the hostand home countries, as well as prospects forforeign markets. The purposes a developingcountry has for recruiting a TNC may havelittle to do with the goals of the TNC, so thepossibility for misunderstandings can arise.
Because TNCs are profit motivated (and donot act as development aid institutions), theyare not likely to invest in small farm productionof staple crops for domestic markets, becausesuch ventures are unlikely to make sufficientlyattractive profits. TNCs are more frequentlyassociated with products that are sold to arelatively high-income segment of thepopulation, because TNCs develop theirexpertise in high-income countries in theseparticular products and look for marketopportunities in countries where incomes arerising. They are also export oriented becausethey have access to international markets, anda developing host country's market often is notbig enough for the TNC's operations to be ableto exploit economies of scale.
There are opportunities for developingcountries and international venture capital tobenefit from collaboration in specific sectorswith well-defined goals. The recent work of the128 member country International FinanceCorporation (IFC), an affiliate of the World Bank,is an example of this trend. The IFC's ultimatepurpose is to provide financing and investmentexpertise to the private sector in its -107

member developing countries, withoutinterfering with private-sector capital sources.The intention is to bring together foreign ordometic entrepreneurs with either foreign ordomestic investment capital in ventures thatare productive and contribute to economicdevelopment. A recent example of this neweffort by the IFC is the promotion of shrimpfarming, which has been undertaken because oflikely high financial returns, the potential toenhance development, and its suitability to anumber of developing countries. In 1984, 8% ofIFC investments were for the wood, pulp andpaper sector and 3% for the agribusinesssector. In 1986, the Foreign Investment AdvisoryService was created by the IFC to attract andregulate specifically FDI.
In order to reduce "political risk" and therebypromote the flow of FDI to developingcountries, the World Bank recently initiated theestablishment of the Multilateral InvestmentGuarantee Agency (MIGA). The PreparatoryCommittee for the Establishment of the MIGAmet in September 1986 to formulate itsregulations and policies. MIGA will guaranteenon-commercial risks of FDI, and conductprogrammes of policy consultation, researchand technical assistance. It will come intooperation vV'hen at least five industrial and 15developing countries subscribe at least one-thirdof the share capital of $1 082 million. ByJanuary 1987, 51 countries had signed theMIGA convention, but only seven had ratified it.Several bilateral investment guarantee schemesalready are in operation, but they only cover asmall share of FD1.
AGENDA FOR FUTURE RESEARCH
This review of some aspects of agriculturalfinance has shown the area to be a rich onefor research. The more complex and elusiveissues centre on the interrelationships betweenagriculture and other economic sectors in adeveloping country and the financing measuresthat best promote a selected developmentstrategy according to the resources availablefrom domestic and external sources. A gooddeal of preparatory work needs to be done,however, before such complex issues can betackled. The major parts of this work are asfollows.
Definitions and concepts. There is muchconfusion over what is currently meant by"agriculture", which renders making too strict acomparison between the various flows ofagricultural finance a risky business. Definitionshave been fairly tightly drawn for specific areas,particularly those related to economic accountssuch as investment and official commitments toagriculture. But definitions are suspected ofbeing particularly weak in the area of publicexpenditure on agriculture.
Data and information. This chapter onfinancing agricultural development has involvedmuch effort in the collection of data, mainlylimited to the 35 developing country sample.This effort was not always successful. Areas ofparticular weaknesses are:
Public expenditure on agriculture,particularly tracing expenditure by theagricultural parastatal sector, governmentsubsidies and taxes that do not pass throughthe mainline agricultural ministries, theallocation to current and capital (development)budgets and the allocations by end purpose. Innot a few cases, governments probably do notknow their overall rate of spending onagriculture.
Investment in agricultural activities. Here thenational accounting definitions are reasonablythorough, but data could be found for theperiod covered for only about 20 countries.Some of these data are incomplete and abreakdown between public and privateinvestment is virtually lacking.
While data on official commitments anddisbursem'ents on agriculture are reasonablycomplete and well documented, information on
129

130
private external lending to the sector is lesssatisfactory, being aggregated and highly erraticat the country level. Perhaps such lending is bynature "lumpy". The allocations of this lendingto the various subsectors of agriculture, unlikeOCA, are not known.
Few hard facts are known about ruralsavings or rural financial markets generally.Most estimates of rural savings are drawn fromthe amounts deposited in bank branchessituated in rural areas. But these are not thesole sources of rural savings, while urbanbranches may be attracting savings from ruralareas. Propensities to save in rural areas andthe relationship among interest rates,development of financial institutions and savingrates should be investigated further.
Key issues are the viability of rural bankinginstitutions involving rural deposit mobilization,transaction costs and loan recovery; theinformal financial markets and its links with theformal sector; and financial and economicpolicies, including the role of the central bank,that affect the performance of rural financialmarkets.
While information on total FDI is available(but not on such a consistent basis as externalprivate lending because the latter is debtcreating), there is little information on thesectoral allocation of FDI by country. Estimatesof remittances of profits and other transferswould enable estimates of net FDI to be madeby sector.
Information on agricultural taxation isincomplete. Standard reference sources such asthe IMF's Government Finance Yearbooksprovide excellent coverage of total governmentimposed taxation, but a breakdown by sector islacking, and taxes or cesses imposed by localadministrations may not be captured. Exportduties on primary commodities may includenon-agricultural commodities such as minerals.Such details can be uncovered only by closer,country-level investigations. The weight ofimplicit taxation on the sector, such asexcessive margins of monopsonistic marketingboards or manipulation of exchange rates,needs to be assessed. FAO's study onagricultural prices, with its estimates of pricebias embodying policy and exchange ratecomponents, has gone some way in thisdirection." Similar estimates could be made ofsubsidies on agricultural production, informationon which is also incomplete.
The main purpose of the above preliminarywork would be to improve the transparency ofagricultural policies, a necessary precondition tounravelling the complex interrelationships thatcharacterize agriculture's financing role inquickening the pace of economic development.
3° FAO, op. cit. 1987.

Country and scheme Characteristics
ANNEX 3.1. Features of selected savings schemes in rural areas of developing countries, 1985-86
ChinaRural credit cooperatives
IndiaRegional rural banks Started in 1975; by 1982, had mobilized deposits totalling Rs 3 801 million
($395 million at 1982 exchange rate).
IndonesiaKUPEDES-SIMPEDES
NepalSmall Farmer Development Under this programme, small farmers, landless labourers, tenants and otherProgramme rural poor are organized into groups to facilitate their access to credit and
other services and to mobilize group savings. Started in 1975, theprogramme is currently operated through 250 projects in the 60 districts ofthe country. By July 1986, 5 295 male groups and 705 female groups,totalling 6 000 groups, had been formed covering 54 155 rural households,and NRs 263 million ($12.4 million) had been disbursed to the members andNRs 96 million ($4.5 million) had been collected back. Mobilization of groupsavings is an important feature of the programme. By July 1986, NRs 3.7million (about $175 000) had been mobilized under the scheme.
PhilippinesIntegrated Rural Financing
Focuses on the poor who are encouraged to form homogeneous groups offive to seven, meeting weekly; each group member deposits 1 taka (about$0.03) a week as personal savings, accumulated in a group fund account.Savings schemes are linked closely with loans for production investment forthe poor.
More than 300 000 cooperatives (with 370 000 full-time and 320 000part-time staff) have an active programme of mobilizing rural savings, whichtotalled RMB 96 200 million (about $25 846 million) in 1986 and havecontributed up to two-thirds of rural deposits mobilized by the AgriculturalBank of China.
In mid-1983, interest rates on savings, time deposits and savings certificateswere freed and quantitative credit ceilings eliminated. Bank RakayatIndonesia initiated a rural credit programme, KUPEDES, with the primaryobjective of promoting a self-sustaining village banking system to generateenough funds to cover their costs. In 1986, the system had its firstprofitable year and introduced a new savings instrument, SIMPEDES, offeringadequate rates of interest, but with no limitations on withdrawals. Therewere 3.5 million individual savings accounts in this system in 1986amounting to an equivalent of $100 million savings or nearly $29 peraccount at the end of 1986. SIMPEDES has provided 53% of the fundsneeded for lending through the KUPEDES system.
Started in 1985, contains a component for research involving the designand pilot-testing of various schemes that will encourage farmers to depositwith banks. The programme covers a two-year pilot-testing period which isexpected to be extended.
Integrated Rural Financing Pilot A specialized lending programme that began in 1983 and includes a savingsProgramme component aimed at facilitating farmers "to graduate" to self-financing. In
each of the eleven sites where the programme has been implemented,farmer organizations play a leading role in instilling "savings consciousness".
131
ASIA
BangladeshGrameen Bank

132
Integrated Estate DevelopmentProgramme
Sri LankaCooperative rural banks
Cooperative banks
Mobile Bank Savings Schemein the tea plantation sector
ThailandInformal rotating savings andcredit associations
AFRICA
Burkina FasoVillage savings and creditcooperatives
National Agricultural Bank
BurundiSavings and creditcooperatives
CameroonCredit union movement
Launched by the Land Bank of the Philippines, services the financing needsand support requirements primarily of the beneficiaries of the Land ReformProgramme. This integrated support package provides for the savings needsof participating farmers, and was achieved by organizing them intocooperative groups or Samahang Nayons, under which the farmers mutuallyagreed on a savings scheme.
Was introduced in 1984 by the People's Bank and serves as the bank'svillage-level organization. In 1984 there were 888 cooperative rural bankswith 1 802 036 savings accounts and total savings of SLRs 905.5 million($34.5 million).
Efficiently run thrift and credit societies have progressively been convertedinto cooperative banks. After the conversion, these societies introducedsavings schemes to offer comparable rates of interest on deposits and newand varied credit schemes for the benefit of members. In 1984 there were1 685 societies with a total savings of SLRs 113.2 million ($4.3 million).
The Hatton National Bank Ltd. started the scheme in 1970 specifically fortea plantation workers. By 1984 the bank had mobilized SLRs 285.23 million($10.9 million) in rural areas.
These associations are widespread in rural areas of Thailand, and it hasbeen suggested that the scope for linking them with banking institutionsshould be explored.
The Union des Coopératives d'Epargne et de Crédit du Burkina (UCECB),started in 1970, had at the end of 1986, 40 member cooperatives with3 480 members. In 1986, it collected savings of CFA 111 700 000 ($346 000).UCECB provides training, inspection and support services to its membercoops. The Union Régionale des Caisses Populaires de la Bongouriba, begunin 1972, and the Union des Caisses Populaires Gorom-Gorom, begun in1986, are savings and credit cooperatives.
In October 1986, the Caisse Nationale de Crédit Agricole (NationalAgricultural Bank) started a savings programme in its three branches.
Started in May 1985 with the technical support of the French CentreInternational de Crédit Mutuel, it promotes savings and loan cooperatives.During the first year, deposits totalling FBu 12 million (about $107 000) weremobilized by 20 cooperatives with 11 921 members. It is a new experiencein the country and follows the scheme of the banques populaires ofRwanda.
Started in 1963; by 1984, there were 200 credit unions with 53 000 membersand shares/savings of CFAF 5 300 million (about $11 million). A Small FarmerProduction Credit Programme was begun in 1975.
Country and scheme Characteristics
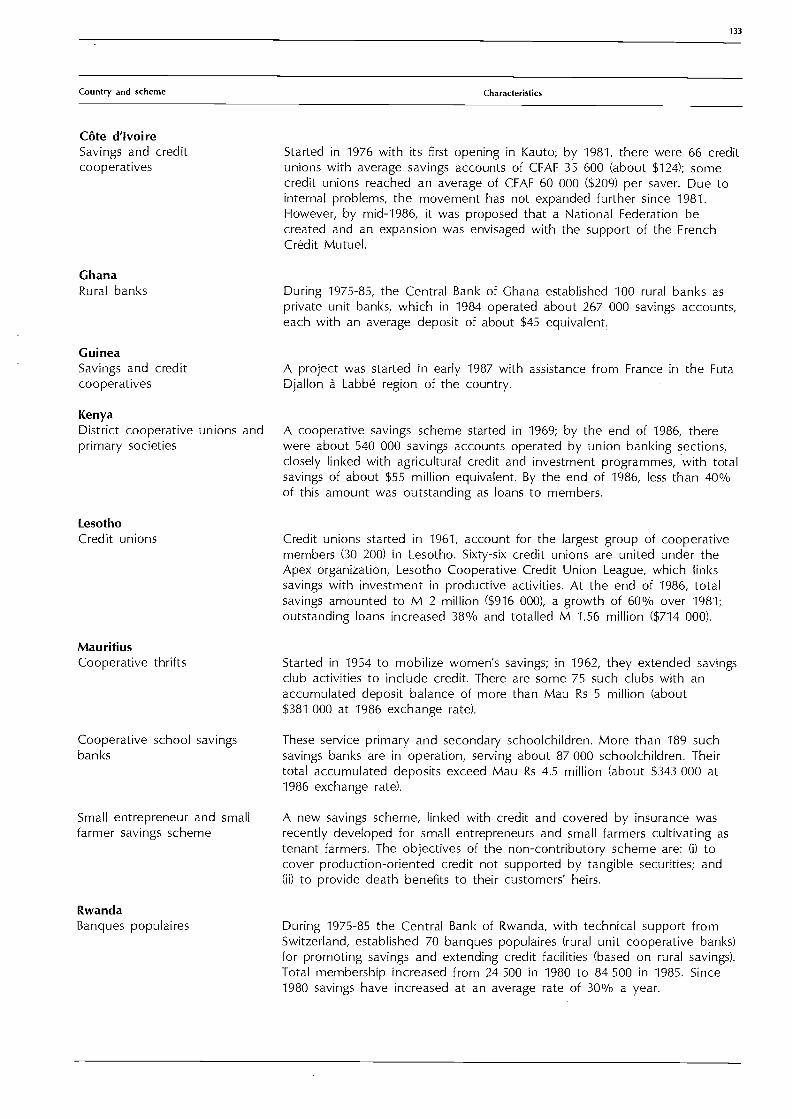
Country and scheme Characteristics
Cote d'IvoireSavings and credit Started in 1976 with its first opening in Kauto; by 1981, there were 66 creditcooperatives unions with average savings accounts of CFAF 35 600 (about $124); some
credit unions reached an average of CFAF 60 000 ($209) per saver. Due tointernal problems, the movement has not expanded further since 1981.However, by mid-1986, it was proposed that a National Federation becreated and an expansion was envisaged with the support of the FrenchCredit Mutuel.
GhanaRural banks
GuineaSavings and creditcooperatives
LesothoCredit unions
MauritiusCooperative thrifts
Cooperative school savingsbanks
Small entrepreneur and smallfarmer savings scheme
RwandaBanques populaires
133
During 1975-85, the Central Bank of Ghana established 100 rural banks asprivate unit banks, which in 1984 operated about 267 000 savings accounts,each with an average deposit of about $45 equivalent.
A project was started in early 1987 with assistance from France in the FutaDialIon à Labbé region of the country.
KenyaDistrict cooperative unions and A cooperative savings scheme started in 1969; by the end of 1986, thereprimary societies were about 540 000 savings accounts operated by union banking sections,
closely linked with agricultural credit and investment programmes, 'withtotoalsavings of about $55 million equivalent. By the end of 1986, less thanof this amount was outstanding as loans to members.
Credit unions started in 1961, account for the largest group of cooperativemembers (30 200) in Lesotho. Sixty-six credit unions are united under theApex organization, Lesotho Cooperative Credit Union League, which linkssavings with investment in productive activities. At the end of 1986, totalsavings amounted to M 2 million ($916 000), a growth of 60% over 1981;outstanding loans increased 38% and totalled M 1.56 million ($714 000).
Started in 1954 to mobilize women's savings; in 1962, they extended savingsclub activities to include credit. There are some 75 such clubs with anaccumulated deposit balance of more than Mau Rs 5 million (about$381 000 at 1986 exchange rate).
These service primary and secondary schoolchildren. More than 189 suchsavings banks are in operation, serving about 87 000 schoolchildren. Theirtotal accumulated deposits exceed Mau Rs 4.5 million (about $343 000 at1986 exchange rate).
A new savings scheme, linked with credit and covered by insurance wasrecently developed for small entrepreneurs and small farmers cultivating astenant farmers. The objectives of the non-contributory scheme are: (i) tocover production-oriented credit not supported by tangible securities; and(ii) to provide death benefits to their customers' heirs.
During 1975-85 the Central Bank of Rwanda, with technical support fromSwitzerland, established 70 banques populaires (rural unit cooperative banks)for promoting savings and extending credit facilities (based on rural savings).Total membership increased from 24 500 in 1980 to 84 500 in 1985. Since1980 savings have increased at an average rate of 30% a year.

134
SenegalSavings and creditcooperatives
ZambiaCredit unions
Finance Services of Zambia,cooperative federation andcooperative unions andsocieties
ZimbabweSavings clubs
LATIN AMERICA
Dominican RepublicSavings MobilizationProgramme
Year MembersSavings
accountsSayings
(RF mil/ion)
A project is planned to start in 1987 with technical support from France inthe Kaolak area, which will be extended to other areas later.
In 1985 the Credit Union and Savings Association of Zambia Ltd. had 226credit unions with 47 000 members and savings of K 16 million (about. $2.8million at 1985 exchange rate); about 20% of these operated in rural areas.In addition to their own funds, credit unions are channelling to farmersfunds originating from the government. In 1986, K 16 million ($1.3 million at1986 exchange rate) was made available by the government.
The Cooperative Savings Scheme started as a pilot scheme in 1983 and hasbeen expanded to cover four provincial cooperative unions and 14 primarysocieties. At the end of 1986, 3 400 accounts operated with a balance ofK 431 000 (about $34 000).
During 1970-85, the Savings Development Movement of Zimbabwe, avoluntary non-governmental organization, promoted the formation of 5 500informal, grassroots-level savings clubs (mainly rural women) with 140 000members. These clubs are closely linked with well-defined agriculturaltechnical package programmes (seed, fertilizer, insecticides) to increaseagricultural productivity. By 1984, these clubs had an equivalent of over$2.7 million in savings.
The Banco Agrícola started in 1983 a successful Savings MobilizationProgramme in its 29 branches, preceded by proper training programmes forstaff and of interest rate adjustments. Over a period of several years, 35 000savings accounts have been opened and $8 million equivalent mobilized.Savings deposits in four credit unions have since increased tenfold andborrower delinquency, which once ranged between 45% and 71% of theirportfolio, has declined to 7-15%.
Sources: FAO: compiled on the basis of country reports. For exchange rates: IMF, International Financial Statistics, February 1987.
1980 24 522 39 576 4 440 (547.8 million)
1985 (30.6) 84 497 94 258 14 448 (5140 million)

ANNEX TABLES

ANNEX TABLE t VOLUME OF PRODUCTION OF MAJOR AGRICULTURAL, FISHERY AND FOREST PRODUCTS
ANNUALRATE OF
1976 1977 1978 1979 1980 1981 1982 1983 1984 1985 1.986 CHANGE1976-86
THOUSAND METRIC TONS PERCENT
137
1/ NOMINAL CATCH (LIVE WEIGHT) EXCLUDING WHALES2/ EXCEPT FOR PULP FOR PAPER AND PAPER ANO PAPERBOARD, ALL FOREST PRODUCTS ARE EXPRESSED IN THOUSAND CUBIC METRES
WORLD
AGRICULTURAL PRODUCTS
TOTAL CEREALS 1479909 1471218 1602064 1553025 1566601 1651068 1710472 1644498 1804346 1846397 1864796 2.41WHEAT 425431 387290 451187 428508 446312 455729 482688 494244 516906 505789 535960
6RICE PADDYBARLEY
350446172157
372260160258
388046179939
377324158214
399344160117
412475152300
424023164258
451946162156
469978171778
473550176073
474148180730
t-12().51
MAIZE 351358 370994 393511 418793 395992 450413 450333 347609 452864 488440 480361 2.62MILLET ANO SORGHUM 90139 94177 95339 91435 84330 101476 96758 95026 97474 105552 100168 1.16
ROOT CROPS 551278 572172 597795 587383 538190 556232 557513 561215 591833 586522 592418 .34POTATOES 291880 298741 315617 320943 264163 288965 288387 287645 312079 300274 308548 .12CASSAVA 114108 117663 121432 117469 125039 128478 127566 124232 130521 136691 137397 1.72
TOTAL PULSES 44762 42291 44167 40902 40548 41197 45308 47047 49036 50740 52643 2.06
CITRUS FRUIT 49022 50400 49763 51079 56227 56042 54975 58738 56706 56058 59948 1.91BANANAS 33353 35442 35675 35745 37764 38697 38908 38227 40667 40063 41299 1.94APPLES 31647 30445 32427 36573 34131 32742 41438 39317 39860 38072 40923 2.89
VEGETABLE OILSOIL EQUIV 40125 45456 47666 51342 49970 53693 57075 53300 59342 64606 64902 4.34SOYBEANS 57402 73807 75381 88714 81076 88143 92105 79462 90652 101122 95839 3.97GROUNDNUTS IN SHELL 17019 17669 18487 17980 17111 20558 18144 18711 20223 21629 21729 2.24SUNFLOWER SEED 10517 12304 13333 15312 13615 14263 16358 15671 16549 18796 20689 5.56RAPESEED 7612 7904 10570 10538 10512 12344 15066 13997 16548 19050 19716 10.07COTTONSEED 22067 25659 24444 26424 26650 28740 27920 27489 35149 32278 28491 3.15COPRA 5285 4717 4861 4296 4509 4701 4851 4746 3945 4849 5323 -.19PALM KERNELS 1371 1442 1368 1645 1781 1812 2134 1999 2384 2588 2729 7.56
SUGAR (CENTRIFUGAL,RAW) 83191 89659 90360 88379 84185 93264 102740 97231 99976 99052 100090 1.85
COFFEE GREEN 3521 4408 4723 4947 4808 6036 5053 5692 5225 5923 5188 3.47COCOA BEANS 1351 1461 1487 1679 1664 1736 1611 1608 1748 1963 2002 3.25TEA 1580 1751 1792 1818 1873 1875 1945 2045 2192 2313 2296 3.57
COTTON LINT 11949 13967 13258 13946 13875 15287 14851 14315 18275 17166 15048 2.82JUTE AND SIMILAR FIBRES 3036 3289 3962 3945 3538 3553 3333 3458 3598 6551 3681 2.86SISAL 559 558 503 501 528 491 492 402 424 480 436 -2.57
TOBACCO 5103 5547 5981 5418 5306 5966 6894 5963 6465 7018 6109 1.81NATURAL RUBBER 3618 3666 3736 3834 3826 3779 3803 4103 4195 4299 4372 1.89
TOTAL MEAT 116158 120226 124865 129742 133579 136073 137264 141651 145381 150559 155040 2.77TOTAL MILK 435737 448160 454730 461142 467732 469820 480831 498837 502793 512886 520751 1.76TOTAL EGGS 23439 24476 25627 26444 27211 28006 28814 29382 30253 31061 31935 3.01WOOL GREASY 2668 2647 2629 2688 2758 2817 2845 2879 2872 2966 3005 1.36
FISHERY PRODUCTS 1/
FRESHWATER + DIADROMOUS 7279 7481 7429 7685 8021 8609 8888 9669 9957 10849MARINE FISH 54728 52991 54734 55091 55332 57296 58379 58057 63967 64149CRUST+ MOLLUS+ CEPHALOP 6948 7494 7774 8102 8595 8704 9208 9120 9522 9522AQUATIC MAMMALS 421 441 454 492 460 487 457 263 211 184AQUATIC ANIMALS 131 237 200 204 128 221 281 428 255 424AQUATIC PLANTS 2492 3080 3224 3187 3349 3074 3122 3288 3599 3727
FOREST PRODUCTS 2/
SAWLOGS CONIFEROUS 605388 619741 637208 645105 614115 581026 561111 623497 642758 647459 647480 .34SAWLOGS NONCONIFEROUS 236677 241312 253378 256372 263919 250411 239896 251967 259834 257944 259444 .61PULPW000+PARTICLES 323441 315850 332541 357378 370658 372407 361952 368631 385551 386811 386811 2.01FUELWOOD 1319548 1331807 1370836 1422373 1479154 1522299 1555849 1583949 1612290 1642302 1667745 2.54SAWNWOOD CONIFEROUS 329361 343059 348675 346881 333564 315549 311467 326279 343965 346558 346557 .06SAWNWOOD NONCONIFEROUS 102777 103250 108061 110327 113119 111459 107739 110502 116514 118311 117686 1.28WOOD-BASED PANELS 95390 101580 104420 106374 101272 100466 95075 101592 105821 108809 109438 .77PULP FOR PAPER 112938 114535 120628 125862 128671 128142 122779 131908 139436 140322 137345 2.09PAPER+PAPERBOARD 147152 151869 159641 168991 169691 170380 166605 177177 190077 192832 198449 2.81
WESTERN EUROPE
AGRICULTURAL PRODUCTS
TOTAL CEREALS 141806 153145 168203 164351 177511 167203 181333 173591 211434 196224 190243 3.02WHEAT 56722 53460 63933 60248 70024 66271 73690 73720 92702 80294 80874 4.62RICE PADDY 1511 1311 1650 1831 1702 1597 1705 1519 1750 1933 1939 2.40BARLEY 42544 51197 55362 52830 57235 50636 53714 49747 62889 58831 53651 1.76MAIZE 24098 29539 28202 32384 31280 32623 35556 34534 36439 37779 38973 4.09MILLET AND SORGHUM 478 604 764 649 618 601 510 466 501 401 399 -4.15
ROOT CROPS 45108 55022 53084 52002 49186 48603 48371 42533 50519 50590 48361 -.50POTATOES 44958 54872 52940 51857 49040 48465 48240 42411 50411 50476 48242 -.50
TOTAL PULSES 1557 1651 1775 1791 1874 1640 1917 2094 2684 3199 3850 8.28
CITRUS FRUIT 6626 6603 6305 6488 6627 6772 6731 8651 6352 8023 8565 2.46BANANAS 363 422 431 436 511 522 492 500 490 436 430 1.47APPLES 10200 7658 10635 10655 10701 7646 12696 9088 10924 - 9232 10549 .78
VEGETABLE OILSOIL EQUIV 2128 2596 2737 2677 3309 2929 3763 3639 4240 4548 4709 7.81-

138
ANNEX TABLE 1. (Contl VOLUME OF PRODUCTION OF MAJOR AGRICULTURAL, FISHERY AND FOREST PRODUCTS
ANNUALRATE OF
1976 1977 1978 1979 1.980 1981 1982 1983 1984 1985 1986 CHANGE1976-86
THOUSAND METRIC TONS PERCENT
SOYBEANS 57 78 85 102 66 118 233 300 389 523 1142 32.00GROUNDNUTS IN SHELL 17 19 20 21 19 15 14 17 15 17 17 -1.91SUNFLOWER SEED 772 1010 1149 1276 1302 1219 1736 1891 2476 2934 3566 14.91RAPESEED 1388 1330 1731 1696 2543 2522 3296 3142 4163 4390 4372 14.23COTTONSEED 300 337 326 284 333 366 285 329 363 446 496 3.80
SUGAR ICENTRIFUGAL,RAW1 13810 15447 15601 15789 15729 19072 18009 14811 16481 16398 16845 1.29
COTTON LINT 148 173 165 146 178 196 156 176 196 241 258 4.54
TOBACCO 446 391 409 439 401 438 462 436 479 494 495 1.90
TOTAL MEAT 25650 26315 27213 28502 29342 29605 29666 30048 30836 30901 31200 1.94TOTAL MILK 129359 132359 136901 139554 141823 142416 146249 150638 149261 147014 148130 1.41TOTAL EGGS 5119 5192 5316 5395 5443 5536 5692 5562 5490 5501 5522 74WOOL GREASY 154 152 157 157 159 155 157 161 164 170 174 1.10
FISHERY PRODUCTS 1/
FRESHWATER + DIADROMOUS 182 183 200 210 260 248 265 273 283 325MARINE FISH 10888 10945 10288 10037 9951 10007 9502 9747 10199 9765CRUST+ MOLLUS+ CEPHALOP 960 947 953 917 1036 1048 1137 1197 1115 1159AQUATIC MAMMALS 89 80 60 94 81 82 79 23 12 20AQUATIC ANIMALS 4 3 5 2 1 1 1 1 1
AQUATIC PLANTS 217 280 295 290 258 217 233 231 253 262
FOREST PRODUCTS 2/
SAWLOGS CONIFEROUS 83972 87161 89561 96073 97381 90791 89591 94371 95820 94721 94721 .93SAWLOGS NONCONIFEROUS 20736 21885 24084 23882 24240 23838 22524 21723 22314 22523 22523 .03PULPWOOD+PARTICLES 79816 73403 75913 83932 83788 86401 84045 82462 88652 91733 91733 1.85FUELWOOD 37006 35486 34084 35526 37305 38303 38905 39520 39931 39826 39832 1.43SAWNWOOD CONIFEROUS 47330 49219 49031 53613 54877 50554 50134 51307 53491 51936 51936 .70SAWNWOOD NONCONIFEROUS 11630 12385 12538 12724 12437 11472 11295 10637 11435 11732 11732 -.82WOOD-BASED PANELS 25140 25132 25535 26607 26602 24960 23575 23887 24026 23764 23764 -.93PULP FOR PAPER 24020 23196 24932 26693 26647 26489 25045 26901 29173 29223 29021 2.11PAPER+PAPERBOARD 38628 39230 41472 45174 44736 44707 43738 45556 49953 50164 50402 2.64
USSR AND EASTERN EUROPE
AGRICULTURAL PRODUCTS
TOTAL CEREALS 293808 266091 312719 251009 264130 233882 269542 268902 260613 273597 298087 -.19WHEAT 126017 121253 151590 113566 127688 107425 113780 107417 105071 110361 127187 -1.49RICE PADDY 2126 2381 2269 2584 2934 2666 2651 2818 2938 2814 2929 2.87BARLEY 83290 67038 78108 62927 59219 51413 59740 64703 58151 62221 70493 -1.76MAIZE 30909 30955 29062 32920 30619 31776 40048 35974 37951 39389 41460 3.40MILLET AND SORGHUM 3513 2231 2408 1744 2077 2035 2718 2747 2169 3155 2549 .59
ROOT CROPS 152736 145232 154405 163116 111251 135403 129664 135629 147334 134604 149883 -.68POTATOES 152734 145229 154403 163113 111249 135399 129661 135627 147332 134603 149882 -.68
TOTAL PULSES 9328 8231 8620 5052 7132 5290 7800 9866 10215 10883 9343 2.82
CITRUS FRUIT 134 234 204 340 161 313 286 415 369 156 294 4.70APPLES 10436 10946 8967 11301 8567 10002 13278 13125 11935 11572 12322 2.44
VEGETABLE OILSOIL EQUIV 4455 4689 4472 4436 4330 4365 4676 4556 4481 4779 5175 .88SOYBEANS 834 862 1012 1042 1118 907 1007 953 997 857 1169 1.23GROUNDNUTS IN SHELL 4 4 5 6 7 9 9 8 8 7 6 6.40SUNFLOWER SEED 6666 7395 6794 7208 6328 6636 7350 6904 6536 7080 7707 .45RAPESEED 1531 1285 1306 574 1129 1097 1064 1312 1718 1932 2321 5.73COTTONSEED 5066 5366 5210 5615 6100 5901 5690 5647 5278 5398 5120 .05
SUGAR ICEHTRIFUGAL.RAW1 11603 13889 13621 12229 10842 10943 12450 13392 13434 12969 13150 .57
TEA 92 106 111 118 130 137 140 146 151 152 158 5.19
COTTON LINT 2597 2709 2744 2514 2816 2905 2800 2598 2354 2651 2560 -.51JUTE ANO SIMILAR FIBRES 49 47 44 48 52 45 50 55 58 60 63 3.10
TOBACCO 712 608 567 627 545 574 637 670 665 693 685 1.00
TOTAL MEAT 22258 23831 25051 25245 25096 24844 24737 26042 26902 27261 28124 1.81TOTAL MILK 127514 134505 135205 133850 131386 127756 129328 137330 140558 141251 143330 .85TOTAL EGGS 4769 5174 5397 5498 5630 5818 5853 6053 6172 6256 6413 2.65WOOL GREASY 534 567 578 573 559 574 571 584 595 578 596 .70
FISHERY PRODUCTS 1/
FRESHWATER + DIADROMOUS 1060 1089 1037 1137 1078 1122 1178 1213 1209 1320MARINE FISH 10329 9226 8818 8621 9063 9118 9306 9518 10365 10004CRUST+ MOLLUS+ CEPHALOP 109 248 207 437 565 540 732 428 368 478AQUATIC MAMMALS 5 7 7 5 6 9 8 8 8 7AQUATIC ANIMALS 1 1
AQUATIC PLANTS 2 2 15 19 20 19 16 15 17 18
1/ NOMINAL CATCH (LIVE WEIGHT) EXCLUDING WHALES2/ EXCEPT FOR PULP FOR PAPER AND PAPER ANO PAPERBOARD, ALL FOREST PRODUCTS ARE EXPRESSED IN THOUSANO CUBIC METRES
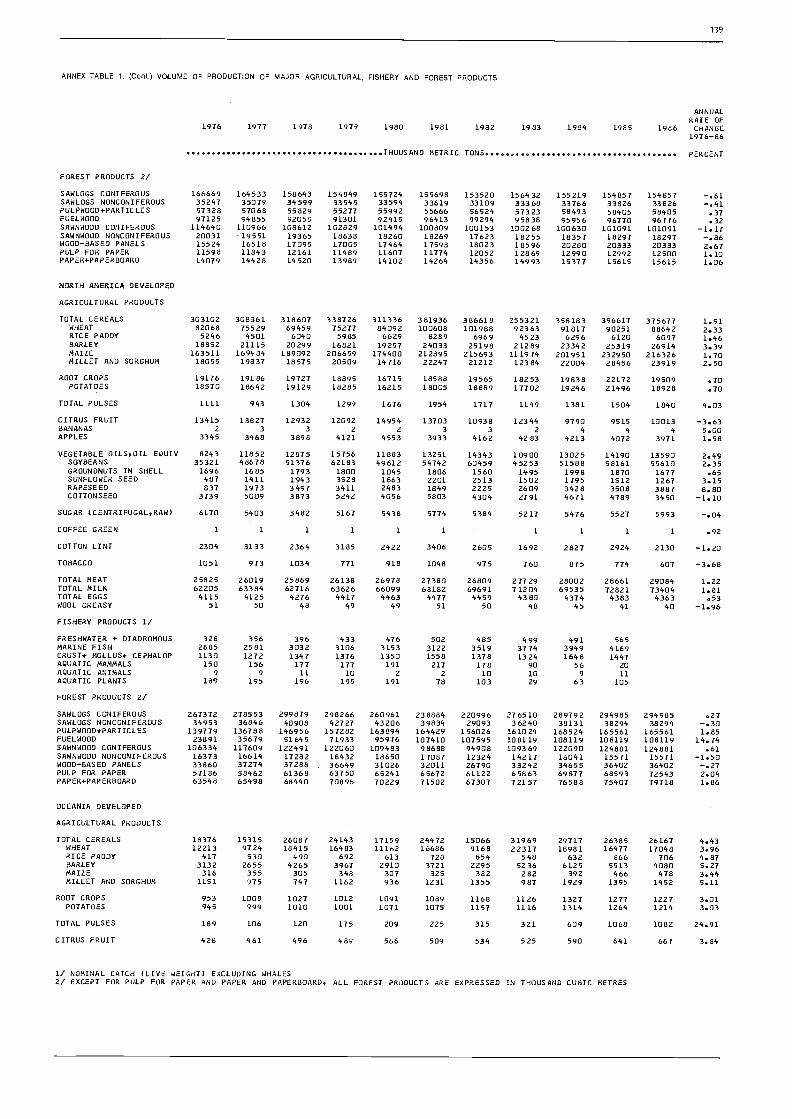
ANNEX TABLE 1 Coral VOLUME OF PRODUCTION OF MAJOR AGRICULTURAL, FISHERY AND FOREST PRODUCTS
1976 1977 1978 1979 1980 1981
139
ANNUALRATE OF
1982 1983 1984 1985 1986 CHANGE1976-86
1/ NOMINAL CATCH (LIVE WEIGHT) EXCLUDING WHALES2/ EXCEPT FOR PULP FOR PAPER ANO PAPER AND PAPER6OARD, ALL FOREST PRUDUCTS ARE EXPRESSED IN THOUSAND CU6IC METRES
FOREST PRODUCTS 2/
SAWLOGS CONIFEROUS 166669 164533 158643 154849 155724 155698 153520 156432 155219 154857 154857 -.61SAWLOGS NONCONIFEROUS 35247 35079 34599 33545 33594 33619 33109 33368 33766 33826 33826 -.41PULPWOOD+PARTICLES 57328 57068 55829 55277 55992 55666 56524 57323 58493 58405 58405 .37FUELWOOD 97125 94855 92055 91301 92415 96413 99294 95838 95956 96770 96776 .32SAWNWODD CONIFEROUS 114640 110966 108612 102829 101494 100809 100153 100268 100630 101091 101091 -1.17SAWNWOOD NONCONIFEROUS 20031 19551 19365 18638 18260 18269 17623 18255 18357 18297 18297 -.86WOOD-BASED PANELS 15524 16518 17095 17005 17464 17598 18023 18596 20280 20333 20333 2.67PULP FOR PAPER 11598 11843 12161 11489 11607 11774 12052 12869 12990 12992 12500 1.10PAPERrPAPERBOARD 14079 14428 14520 13989 14102 14264 14356 14993 15377 15615 15615 1.06
NORTH AMERICA DEVELOPED
AGRICULTURAL PRODUCTS
TOTAL CEREALS 303102 308361 318607 338726 311336 381936 386618 255321 358183 396617 375677 1.91WHEAT 82068 75529 69459 75277 84092 100608 101988 92363 91817 90251 88642 2.33RICE PADDY 5246 4501 6040 5985 6629 8289 6969 4523 6296 6120 6097 1.46BARLEY 18852 21115 20299 16821 19257 24033 25198 21289 23342 25319 26914 3.39MAIZE 163511 169484 189092 206659 174400 212895 215693 111974 201951 232950 216326 1.70MILLET AND SORGHUM 18055 19837 18575 20509 14716 22247 21212 12384 22004 28456 23919 2.50
ROOT CROPS 19176 19186 19727 18895 16715 18588 19565 18253 19838 22172 19509 .70POTATOES 18570 18642 19129 18285 16215 18005 18889 17702 19246 21496 18928 .70
TOTAL PULSES 1111 943 1304 1299 1676 1954 1717 1149 1381 1504 1840 4.03
CITRUS FRUIT 13415 13827 12932 12092 14954 13703 10938 12344 9790 9515 10013 -3.63BANANAS 2 3 3 2 2 3 3 2 4 4 5 5.00APPLES 3345 3468 3898 4121 4553 3933 4162 4283 4213 4072 3971 1.58
VEGETABLE OILS,OIL EQUIV 8243 11852 12875 15756 11883 13251 14343 10900 13025 14190 13590 2.49SOYBEANS 35321 48678 51376 62183 49612 54742 60459 45253 51588 58161 55610 2.35GROUNDNUTS IN SHELL 1696 1685 1793 1800 1045 1806 1560 1495 1998 1870 1677 .65SUNFLOWER SEED 487 1411 1943 3528 1863 2201 2513 1502 1795 1512 1267 3.15RAPESEED 837 1973 3497 3411 2483 1849 2225 2609 3428 3508 3887 8.80COTTONSEED 3739 5009 3873 5242 4056 5803 4304 2791 4671 4789 3450 -1.10
SUGAR (CENTRIFUGAL.RAW) 6170 5403 5482 5167 5438 5774 5384 5217 5476 5527 5993 -.04
COFFEE GREEN 1 1 1 1 1 1 1 1 1 1 .92
COTTON LINT 2304 3133 2364 3185 2422 3406 2605 1692 2827 2924 2130 -1.20
TOBACCO 1051 973 1034 771 918 1048 975 760 875 774 607 -3.68
TOTAL MEAT 25825 26019 25869 26138 26978 27380 26809 27729 28002 28661 29084 1.22TOTAL MILK 62205 63384 62716 63626 66099 68182 69691 71204 69535 72821 73404 1.81TOTAL EGGS 4115 4125 4276 4417 4463 4477 4459 4380 4374 4383 4363 .53WOOL GREASY 51 50 48 49 49 51 50 48 45 41 40 -1.96
FISHERY PRODUCTS 1/
FRESHWATER + DIADROMOUS 328 356 396 433 476 502 485 499 491 565MARINE FISH 2685 2581 3032 3106 3153 3122 3519 3774 3949 4169CRUST+ MOLLUS+ CEPHALOP 1130 1272 1347 1.376 1350 1558 1378 1324 1648 1447AQUATIC MAMMALS 150 156 177 177 191 217 178 90 56 20AQUATIC ANIMALS 9 9 11 10 2 2 10 10 9 11AQUATIC PLANTS 189 195 196 195 191 78 103 29 63 105
FOREST PRODUCTS 2/
SAWLOGS CONIFEROUS 267372 278553 299879 298266 260961 238884 220996 276510 289792 294985 294985 .27SAWLOGS NONCONIFEROUS 34953 36846 40908 42727 43206 39834 29093 36240 38131 38294 38294 -.30PULPWOOD+PARTICLES 139779 1367.88 146956 157282 163894 164429 156026 161024 168524 165561 165561 1.85FUELW000 23891 35679 51645 71933 95976 107410 107595 108119 108119 108119 108119 14.74SAWNWOOD CONIFEROUS 106334 117609 122491 122060 109483 98688 94908 109369 122090 124881 124881 .61SAWNWOOD NONCONIFEROUS 16373 16614 17282 18432 18650 17087 12324 15217 16041 15571 15571 -1.50WOOD-BASED PANELS 33860 37274 37288 36649 31026 32011 26790 33242 34655 36402 36402 -.27PULP FOR PAPER 57186 58462 61368 63750 65241 65672 61122 65863 69877 68593 72543 2.04PAPER+PAPERBOARD 63548 65498 66440 70896 70229 71502 67307 72157 76588 75407 79718 1.86
OCEANIA DEVELOPED
AGRICULTURAL PRODUCTS
TOTAL CEREALS 18376 15315 26087 24143 17159 24472 15066 31969 29717 26385 26167 4.43WHEAT 12213 9724 18415 16483 11162 16686 9168 22317 18981 16477 17048 3.96RICE PADDY 417 530 490 692 613 728 854 548 632 866 706 4.87BARLEY 3132 2655 4265 3967 2910 3721 2295 5236 6125 5513 4080 5.27MAIZE 316 355 305 348 307 325 382 282 392 466 478 3.44MILLET ANO SORGHUM 1151 975 747 1162 936 1231 1355 987 1929 1395 1452 5.11
ROOT CROPS 953 1008 1027 1012 1091 1089 1168 1126 1327 1277 1227 3.01POTATOES 945 999 1010 1001 1071 1075 1157 1116 1314 1264 1214 3.03
TOTAL PULSES 189 106 120 175 209 225 315 321 609 1068 1082 24.91
CITRUS FRUIT 428 461 496 489 566 509 534 525 590 651 667 3.84
THOUSAND METRIC TONS PERCENT

140
ANNEX TABLE 1. (CoMJ VOLUME OF PRODUCTION OF MAJOR AGRICULTURAL, FISHERY AND FOREST PRODUCTS
ANNUALRATE OF
1976 1977 1978 1979 1980 1981 1982 1983 1984 1985 1986 CHANGE1976-86
THOUSAND METRIC TONS PERCENT
BANANAS 115 98 113 125 124 130 140 146 145 132 107 1.85APPLES 447 447 444 525 510 549 520 534 513 622 575 2.83
VEGETABLE OILS'OIL EQUIV 74 86 140 159 120 126 118 105 164 265 229 9.32SOYBEANS 45 55 77 99 82 73 77 53 89 110 105 5.76GROUNDNUTS IN SHELL 35 32 39 62 39 43 58 23 47 42 43 1.05SUNFLOWER SEED 80 75 158 186 142 139 115 104 170 293 215 8.74RAPESEED 9 16 24 41 18 15 7 18 33 88 100 16.99COTTONSEED 41 46 72 79 136 161 190 164 230 410 382 25.83
SUGAR ICENTRIFUGAL,RAW( 3296 3318 2902 2963 3330 3435 3536 3170 3548 3350 3350 .84
COTTON LINT 25 28 44 53 83 99 134 101 141 249 258 26.29
TOBACCO 18 19 19 19 18 17 15 15 16 14 14 -3.04
TOTAL MEAT 4032 4089 4307 4102 3799 3812 3850 3923 3579 3775 3762 -1.17TOTAL MILK 12984 12582 11724 12202 12248 12079 12203 12593 13711 14077 14247 1.32TOTAL EGGS 263 264 274 268 264 277 272 272 261 246 243 -.70WOOL GREASY 1066 1005 988 1025 1066 1082 1.080 1073 1091 1188 1188 1.48
FISHERY PRODUCTS 1/
FRESHWATER + DIADROMOUS 4 5 5 5 4 4 4 4 5 4
MARINE FISH 105 122 136 171 170 202 209 290 308 300CRUST+ HOLUB+ CEPHALOP 72 81 81 93 113 121 150 158 149 139AQUATIC PLANTS 1 1 1 1 1 1 1 1 1
FOREST PRODUCTS 2/
SAWLOGS CONIFEROUS 7595 7178 6913 7021 8443 8607 8357 7703 7308 7622 7622 .55SAWLOGS NONCONIFEROUS 6631 6518 6336 5846 5881 6077 5725 4569 4556 4734 4734 -3.99PULPW000+PARTICLES 7191 8596 8335 8330 9890 10177 9513 9865 10455 11083 11083 3.85FUELWOOD 1607 1619 1636 1447 1458 1818 2118 2524 2924 2924 2930 8.13SAWNWOOD CONIFEROUS 3067 2917 2559 2743 3101 3370 3414 3141 3156 3484 3484 2.15SAWNWOOD NONCONIFEROUS 2430 2340 2063 1986 2069 2145 2013 1790 1747 1845 1845 -2.75WOOD-BASED PANELS 1054 1043 1059 1073 1.166 1215 1228 1053 1199 1240 1240 1.73PULP FOR PAPER 1660 1714 1699 1699 1824 1913 1896 1794 1877 1943 1932 1.56PAPER+PAPERBOARD 1761 1890 1867 1942 2104 2151 2188 2101 2214 2297 2297 2.59
AFRICA DEVELOPING
AGRICULTURAL PRODUCTS
TOTAL CEREALS 48691 43624 46227 45546 49042 47323 51075 47342 46368 58823 61923 2.32WHEAT 5760 3634 4789 4646 5422 4371 5644 4617 5024 6349 6712 2.92RICE PADDY 5760 5725 5794 6063 6317 6507 6566 6692 6852 7097 7379 2.61BARLEY 4699 2468 3894 3769 4464 3150 4435 2882 3157 5292 5252 2.24MAIZE 15658 14970 14788 13468 13188 14869 15052 13849 14346 17957 18898 1.62MILLET AND SORGHUM 15480 15598 15553 15930 17958 16954 17642 17847 15926 20153 21167 2.64
ROOT CROPS 80599 80146 80642 81058 84754 86832 89864 87726 91442 101617 102698 2.54POTATOES 2673 2665 3044 3125 3264 3278 3543 3757 3538 3777 3903 3.88CASSAVA 46780 46706 45490 45523 48303 49831 51199 50405 53169 58371 60720 2.70
TOTAL PULSES 5072 4296 4634 5092 4791 4701 5200 5177 4438 5448 6407 1.93
CITRUS FRUIT 2394 2486 2699 2498 2617 2549 2499 2396 2556 2507 2886 .62BANANAS 3995 3943 3990 4164 4476 4582 4602 4633 4624 4722 4834 2.17APPLES 56 61 61 64 73 81 82 84 103 118 126 8.36
VEGETABLE OILS'OIL EQUIV 4003 3752 3634 3653 3866 3770 3880 3789 3863 4066 4326 .74SOYBEANS 137 142 172 178 202 183 204 170 185 159 230 3.75GROUNDNUTS IN SHELL 4445 3629 4000 3281 3407 3614 3686 3144 3392 3513 3942 -1.11SUNFLOWER SEED 125 149 157 150 140 134 137 139 155 170 168 1.62RAPESEED 22 22 22 21 22 16 16 24 16 23 23 -.47COTTONSEED 933 936 962 907 912 893 874 958 1152 1207 1201 2.66COPRA 167 161 170 180 178 173 187 195 195 193 202 2.12PALM KERNELS 656 647 549 659 706 685 663 585 651 681 692 .62
SUGAR ICENTRIFUGAL,RAO 3105 3040 3366 3524 3524 3726 3900 3920 3938 3992 4205 3.13
COFFEE GREEN 1165 1235 1064 1088 1161 1265 1199 1183 1158 1254 1360 1.18COCOA BEANS 860 944 902 1034 1.024 1068 883 891 1049 1070 1061 1.43TEA 157 192 202 197 185 195 206 219 235 266 258 4.22
COTTON LINT 505 500 515 493 510 493 496 554 606 679 662 3.03JUTE AND SIMILAR FIBRES 8 7 8 9 1.03SISAL 223 204 175 15: 16: 14: 14: 124 117 104 104 -7.31
TOBACCO 249 224 224 259 275 211 232 254 303 283 299 2.33NATURAL RUBBER 204 205 195 194 196 200 198 199 228 238 249 1.93
TOTAL MEAT 3989 4218 4391 4510 4639 4759 4923 4951 4895 5063 5213 2.43TOTAL MILK 6796 7051 7380 7599 7611 7736 8064 6051 7816 7999 8190 1.63TOTAL EGGS 508 548 571 612 644 675 734 784 821 873 936 6.21WOOL GREASY 76 67 69 70 73 76 82 95 89 98 97 3.85
1/ NOMINAL CATCH (LIVE WEIGHT) EXCLUDING WHALES2/ EXCEPT FOR PULP FOR PAPER AND PAPER AND PAPERBOARD' ALL FOREST PRODUCTS ARE EXPRESSED IN THOUSAND CUBIC METRES

ANNEX TABLE 1. (Cont.) VOLUME OF PRODUCTION OF MAJOR AGRICULTURAL, FISHERY ANO FOREST PRODUCTS
ANNUALRATE DF
1976 1977 1978 1.979 1980 1981 1982 1983 1984 1985 1986 CHANGE1976-86
THOUSAND METRIC TONS PERCENT
141
1/ NOMINAL CATCH (LIVE WEIGHT) EXCLUDING WHALES2/ EXCEPT FOR PULP F3R PAPER AND PAPER AND PAPERESOARD, ALL FOREST PRODUCTS ARE EXPRESSED IN THOUSAND CUBIC METRES
FISHERY PRODUCTS 1/
FRESHWATER + DIADROMOUS 1343 1396 1346 1314 1282 1268 1330 1404 1403 1332MARINE FISH 1411 1507 1558 1491 1516 1707 1664 1775 1796 1780CRUST+ MOLLUS+ CEPHALOP 57 56 59 57 82 103 120 131 129 105AQUATIC ANIMALS 1 1 1 1 1 1 1 1 1 1
AQUATIC PLANTS 5 5 5 5 5 5 5 5 5 5
FOREST PRODUCTS 2/
SAWLOGS CONIFEROUS 1137 1292 1316 1032 1286 1241 1339 1177 1271 1239 1239 .42SAWLOGS NONCONIFEROUS 14947 15867 16225 16814 17952 17845 16892 16571 17085 17320 17320 1.05PULPW000+PARTICLES 2213 2255 2610 2171 2002 2008 2037 2050 2138 2101 2101 -1.12FUELWOOD 273436 284111 292402 300348 310064 319180 328328 336910 346610 355719 364993 2.90SAWNWOOD CONIFEROUS 506 527 461 494 508 570 584 531 551 532 532 1.01SAWNWOOD NONCONIFEROUS 3184 3587 4354 4432 5194 5310 5091 4822 5125 5510 5510 4.74WOOD-BASED PANELS 752 847 912 955 1141 1151 1213 1231 1277 1365 1309 5.85PULP FOR PAPER 336 321 343 409 435 471 359 381 376 390 364 1.01PAPER+PAPERBOARD 219 265 281 344 377 398 397 412 422 443 452 6.88
LATIN AMERICA
AGRICULTURAL PRODUCTS
TOTAL CEREALS 86258 86099 85307 84105 88498 104513 105348 99912 106957 110237 107421 3.03WHEAT 19336 11540 14969 15103 14874 15202 22727 20110 21910 20197 21586 4.58RICE PADDY 15418 15111 13425 14445 16441 15623 17541 14758 16974 17151 17518 1.79BARLEY 1883 1376 1716 1330 1302 1262 1147 1161 1331 1262 1198 -3.36MAIZE 37388 43729 40151 39751 45242 55316 47861 47214 51012 55568 53061 3.54MILLET AND SORGHUM 10982 13215 13727 12281 9572 16052 14785 15083 14255 15008 12778 2.04
ROOT CROPS 45200 46029 46454 45627 44047 46466 45756 41575 43480 44756 47186 -.22POTATOES 9738 10102 10903 10988 10360 11848 11752 10089 12142 11329 11499 1.44CASSAVA 31326 31966 31580 30941 30206 31223 30503 28031 27610 29624 32109 -.70
TOTAL PULSES 3911 4601 4719 4580 4303 5334 5486 4348 5153 5080 5006 1.87
CITRUS FRUIT 12788 13413 13813 14540 16928 17560 18181 18057 21559 19291 21204 5.44BANANAS 17655 18412 18189 17808 18598 18792 19099 18340 19584 19661 20426 1.19APPLES 1198 1329 1449 1670 1652 1683 1704 1691 2074 1859 2161 5.05
VEGETABLE OILStOIL EQUIV 4652 5390 5241 5834 6493 6312 6148 6594 7356 8401 7760 5.17SOYBEANS 12643 14960 12927 15464 19814 20499 18655 20331 24425 27168 21989 7.10GROUNDNUTS IN SHELL 1058 1157 1014 1389 1099 1012 915 817 899 853 813 -3.70SUNFLOWER SEED 1192 955 1717 1550 1756 1353 2068 2463 2268 3309 4275 12.83RAPESEED 111 91 61 75 96 64 32 17 17 44 109 -9.43COTTONSEED 2354 3369 3220 3098 2958 2796 2454 2307 3080 3415 2748 -.08COPRA 229 232 236 214 235 227 282 282 239 184 189 -1.01PALM KERNELS 297 311 298 327 328 314 307 309 292 310 323 .15
SUGAR ICENTRIFUGAL,RAW) 25930 27225 26909 26272 26394 27227 28886 28590 29385 28466 28031 1.00
COFFEE GREEN 1905 2673 3096 3259 2966 4074 3138 3792 3396 3899 3020 4.13COCOA BEANS 432 459 520 572 552, 561 606 572 532 712 731 4.22TEA 44 52 39 44 51 39 49 54 55 66 73 4.47
COTTON LINT 1341 1E198 1809 1728 1652 1555 1355 1314 1734 1887 1459 -.43JUTE ANO SIMILAR FIBRES 127 114 100 114 112 132 95 104 113 102 104 -1.31SISAL 321 342 316 333 346 335 341 270 298 366 323 -.27
TOBACCO 727 740 768 797 732 689 762 713 719 703 689 -.78NATURAL RUBBER 35 39 41 43 46 51 54 57 58 63 67 6.49
TOTAL MEAT 13208 13907 14459 14572 15068 15830 15802 15850 15578 16037 16555 1.96TOTAL MILK 33468 32658 32777 33759 35455 35840 36568 36405 36813 38443 39022 1.79TOTAL EGGS 1889 1997 2205 2410 2567 2617 2725 2698 2909 3064 3171 5.05WOOL GREASY 296 314 298 301 306 314 315 324 320 318 325 .81
FISHERY PRODUCTS 1/
FRESHWATER + DIADROMOUS 226 249 279 235 296 322 338 444 468 454MARINE FISH 7483 6018 8032 9198 8676 9405 10423 8099 10835 12462CRUST+ MOLLUS+ CEPHALOP 450 437 576 633 538 532 570 591 649 651AQUATIC MAMMALS 23 16 23 20 16 10 1 7 7
AQUATIC ANIMALS 25 71 52 54 50 49 36 30 46 77AQUATIC PLANTS 92 99 90 129 124 152 222 213 213 235
FOREST PRODUCTS 2/
SAWLOGS CONIFEROUS 21766 23930 22958 26802 29294 28493 29037 30038 31568 32241 32241 4.02SAWLOGS NONCONIFEROUS 23044 23694 23908 27100 30176 29789 29631 30027 30855 31249 31249 3.31PULP4000+PARTICLES 12913 13667 19804 26641 29274 29135 29009 29832 30440 30631 30631 8.58FUELWOOD 213142 218050 223529 230758 235781 240828 247295 254466 260211 265472 270728 2.47SAWNWOOD CONIFEROUS 9695 10541 11289 12149 11552 11500 11177 12068 12689 13104 13104 2.47SAWNWOOD NONCONIFEROUS 10843 11725 11531 12167 13736 14496 14024 14365 15090 15122 15122 3.55WOOD-BASED PANELS 3119 3364 3514 3741 4295 4439 4323 4447 4580 4671 4671 4.16PULP FOR PAPER 3291 3734 4180 4485 5485 5370 5684 6162 6242 6588 6477 7.09PAPER+PAPEROOARD 5306 5637 6263 7026 7730 7451 7723 7962 8759 9167 9761 5.85

142
ANNEX TABLE t (Cont) VOLUME OF PRODUCTION OF MAJOR AGRICULTURAL, FISHERY ANO FOREST PRODUCTS
ANNUALRATE OF
1976 1977 1978 1979 1980 1981 1982 1983 1984 1985 1986 CHANGE1976-86
THOUSAND METRIC TONS PERCENT
1/ NOMINAL CATCH 1LIVE WEIGHT) EXCLUDING WHALES2/ EXCEPT FOR PULP FOR PAPER AND PAPER ANO PAPERBOARD, ALL FOREST PRODUCTS ARE EXPRESSED IN THOUSANC CUBIC METRES
NEAR EAST DEVELOPING
AGRICULTURAL PRODUCTS
TOTAL CEREALS 56018 51652 54595 53694 55536 59736 58541 55943 53549 62521 67271 1.61WHEAT 31354 29206 30324 30634 30782 32145 32553 31091 30834 33984 36504 1.37RICE PADDY 4754 4569 4807 4762 4437 4839 5036 4566 4408 4734 4901 .07BARLEY 8935 7403 8197 8163 9536 10676 10601 10157 9508 11313 12599 4.08MAIZE 5406 5052 5498 5309 5547 5535 5721 6007 5679 6662 7206 2.69MILLET ANO SORGHUM 4186 4132 4557 3625 4161 5503 3733 3297 2330 5046 5389 -.23
ROOT CROPS 5710 5828 5892 6514 7234 7551 7818 7813 7943 8934 8958 4.93POTATOES 5303 5435 5484 6025 6773 7084 7316 7334 7475 8443 8458 5.12CASSAVA 99 95 103 127 122 125 125 125 125 128 130 2.88
TOTAL PULSES 1904 1860 1734 1687 1857 1920 2284 2471 2301 2552 3025 5.03
CITRUS FRUIT 3157 3262 3393 3698 3644 3706 4253 4389 4306 4003 4237 3.23BANANAS 277 298 270 260 291 295 335 340 335 347 355 2.92APPLES 1626 1685 1850 2359 2567 2513 2966 3205 3508 3338 3315 8.50
VEGETABLE OILS,OIL EQUIV 1536 1426 1551 1400 1673 1340 1552 1326 1426 1352 1691 -.15SOYBEANS 123 119 197 195 145 209 319 340 297 377 432 13.57GROUNDNUTS IN SHELL 870 1145 923 977 814 842 611 523 496 397 569 -8.49SUNFLOWER SEED 612 506 524 634 794 630 652 763 755 848 994 5.38RAPESEED 6 14 13 43 12 6 2 -38.91COTTONSEED 2329 2609 2471 2330 2284 2201 2311 2467 2587 2501 2425 .27
SUGAR (CENTRIFUGAL,RAW) 2846 2678 2512 2587 2492 3104 3748 3825 3714 3667 3633 4.50
COFFEE GREEN 4 4 5 5 4 4 4 5 6 1.29TEA 80 104 113 13: 12: 76 103 137 154 177 177 6.47
COTTON LINT 1364 1520 1446 1376 1360 1318 1379 1442 1500 1455 1360 .03JUTE AND SIMILAR FIBRES 14 13 13 13 13 13 13 13 13 14 14 .15
TOBACCO 379 298 344 274 295 238 277 303 246 231 247 -3.60
TOTAL MEAT 2917 3099 3212 3316 3492 3713 3885 4089 4319 4500 4651 4.88TOTAL MILK 13486 13646 14561 15232 15808 16520 16667 16929 16253 17350 17404 2.61TOTAL EGGS 597 696 763 715 751 851 917 985 1036 1095 1143 6.40WOOL GREASY 161 163 157 162 167 174 177 183 170 182 190 1.67
FISHERY PRODUCTS 1/
FRESHWATER + DIADROMOUS 133 132 140 161 174 176 181 180 186 185MARINE FISH 606 486 557 699 771 810 835 900 935 945CRUST+ MOLLUS+ CEPHALOP 40 41 29 37 41 33 36 36 44 52
AQUATIC MAMMALS 2 3 2 2 3 1
FOREST PRODUCTS 2/
SAWLOGS CONIFEROUS 4796 5265 5216 4718 4964 5218 5214 4190 4150 4060 4060 -2.47SAWLOGS NONCONIFEROUS 1314 1442 1859 1523 1315 1366 1366 1371 1353 1339 1339 -1.20PULPW000+PARTICLES 907 984 1003 1043 672 714 712 765 513 379 379 -9.31FUELWOOD 61608 37801 37827 40679 41839 41021 41561 42005 40174 40776 41619 -1.28SAWNWOOD CONIFEROUS 2916 2917 4104 4114 4127 4107 4101 3787 3794 3792 3792 1.79SAWNWOOD NONCONIFEROUS 646 871 1146 1146 1139 1121 917 916 915 915 915 .54WOOD-BASED PANELS 615 761 797 843 734 733 724 764 984 1072 1073 4.25PULP FOR PAPER 317 340 273 463 494 487 487 517 588 588 366 5.05PAPER+PAPERBOARD 587 629 560 737 774 832 821 674 808 760 760 2.80
FAR EAST DEVELOPING
AGRICULTURAL PRODUCTS
TOTAL CEREALS 233715 252275 267448 250759 273697 290001 276050 317384 318575 325110 329226 3.45WHEAT 38288 38904 41013 46459 44140 49540 50449 57213 58446 57998 62657 5.29RICE PADDY 152822 171767 181435 162613 186944 193463 184162 209545 211008 223030 219761 3.52BARLEY 5126 3320 3819 3819 2592 3366 2937 2901 2810 2292 2574 -5.54MAIZE 16231 15455 17940 17060 19227 20325 18141 22257 23854 22559 24315 4.52MILLET AND SORGHUM 21163 22738 23155 20725 20705 23226 20268 25390 22378 18884 20230 -.62
ROOT CROPS 49949 51302 56421 55087 58011 60282 59160 59397 65497 65071 58900 2.20POTATOES 9712 9455 10312 12459 10921 12423 12822 12994 15341 16106 13994 5.02CASSAVA 31373 33408 37741 34125 39338 40179 39139 38839 42563 41624 37580 2.20
TOTAL PULSES 14676 13866 14070 13853 11319 13032 13557 14960 15158 14430 15712 .97
CITRUS FRUIT 3259 2885 3074 3183 3499 3852 3819 4102 4084 3979 3985 3.46BANANAS 9013 10211 10576 10705 11377 11930 11572 11532 12546 11329 11890 2.28APPLES 891 989 1070 1208 1179 1462 1586 1684 1660 1661 1760 7.35
VEGETABLE OILS,OIL EQUIV 10651 10934 11414 11684 11861 13676 14211 13974 15283 16605 17309 5.14SOYBEANS 1094 1128 1353 1387 1484 1423 1423 1602 2238 2437 2766 9.00GROUNDNUTS IN SHELL 6579 7495 7712 7159 1.440 8790 6976 8372 8142 7622 8206 1.58SUNFLOWER SEED 218 141 154 114 41 91 236 349 504 506 524 16.75RAPESEED 2350 1996 2042 2268 1820 2705 2764 2583 2965 3456 3030 4.90COTTONSEED 3075 3711 3746 4229 4213 4423 4404 3345 5071 5567 5386 4.56

ANNEX TABLE 1. (Cont). VOLUME OF PRODUCTION OF MAJOR AGRICULTURAL, FISHERY AND FOREST PRODUCTS
ANNUALRATE OF
1976 1977 1978 1979 1980 1981 1982 1983 1984 1985 1986 CHANGE1976-86
THOUSAND METRIC TONS ..... PERCENT
COPRA 4564 3963 4086 3500 3706 3899 3984 3869 3053 3994 4490 -.59PALM KERNELS 366 431 465 600 691 739 1086 1024 1352 1496 1610 16.83
SUGAR (CENTRIFUGAL,RAW1 10817 12381 13511 12840 9660 12023 17903 16831 14223 14411 15030 3.29
COFFEE GREEN 386 435 498 530 604 619 652 636 598 685 718 5.51COCOA BEANS 24 27 33 44 54 71 90 111 134 146 176 23.61TEA 820 889 897 890 911 923 887 919 1024 1054 1003 1.95
COTTON LINT 1538 1856 1873 2114 2007 2195 2202 1679 2536 2786 2701 4.63JUTE AND SIMILAR FIBRES 2436 2643 3217 3186 2767 2688 2595 2712 2604 4236 2701 1.26
TOBACCO 851 1001 1060 1003 951 993 1081 1151 1080 1113 1077 1.89NATURAL RUBBER 3252 3269 3331 3431 3415 3346 3342 3612 3657 3737 3774 1.50
TOTAL MEAT 4630 4662 5020 5411 5625 5780 5889 6312 6732 7051 7290 4.80TOTAL MILK 38341 39815 40844 42156 43838 45534 47705 50713 53287 57693 60179 4.64TOTAL EGGS 1486 1634 1757 1890 2038 2117 2209 2346 2507 2627 2791 6.21WOOL GREASY 65 70 71 75 80 77 80 83 86 90 94 3.34
FISHERY PRODUCTS 1/
FRESHWATER + DIAOROMOUS 2310 2362 2364 2402 2537 2849 2804 3025 2849 2836MARINE FISH 7039 7823 7947 7863 7792 8243 8214 8763 9655 9182CRUST+ MOLLUS+ CEPHALOP 1668 1799 1801 1972 2087 2140 2204 2215 2262 2220AQUATIC ANIMALS 47 100 84 77 24 55 132 249 60 214AQUATIC PLANTS 312 371 352 372 442 538 477 534 586 645
FOREST PRODUCTS 2/
SAWLOGS CONIFEROUS 3119 3250 2920 3629 3367 3430 3471 3666 3645 3706 3727 1.96SAWLOGS NONCONIFEROUS 75901 75645 80554 78791 81992 74193 77136 82880 83530 80571 82071 .72PULPW000+PARTICLES 2943 3331 3367 3388 3436 3167 3123 3430 3507 3482 3482 .98FUELWOOD 428680 437883 448002 457141 467364 476729 486413 496464 506419 516817 526250 2.08SAWNWOOD CONIFEROUS 1953 2810 3006 3454 3148 3854 4012 4580 4220 4402 4401 7.23SAWNWOOD NONCONIFEROUS 20545 22138 23533 23479 25863 25997 28997 30286 31802 33631 33006 5.19WOOD-BASED PANELS 4466 5290 5859 6055 5713 6338 7230 8106 8534 9481 10166 7.93PULP FOR PAPER 1466 1508 1666 1830 1801 1875 1976 2587 2769 2959 2725 7.64PAPER+PAPERBOARD 2332 2916 3361 3764 3807 4190 4151 4770 5358 5681 6142 8.99
ASIAN CENT PLANNED ECON
AGRICULTURAL PRODUCTS
TOTAL CEREALS 272077 264823 293700 313601 303114 310120 341362 373296 394946 370245 381326 4.07WHEAT 51006 41724 54471 63333 55823 60336 69362 82589 88918 87196 91.671 7.64RICE PADDY 147075 149330 156372 163368 161102 165905 185667 193991 204239 195191 198323 3.56BARLEY 3404 3391 3809 4035 3125 3533 3678 3509 3888 3383 3415 -.04MAIZE 50501 51803 58522 62634 65434 62070 63491 71401 76815 67424 71552 3.56MILLET AND SORGHUM 14820 14434 15218 14412 12859 13055 14226 16587 15488 12428 11824 -1.17
ROOT CROPS 143917 160397 172462 156236 158121 143638 147710 159003 155699 148640 146731 -.50POTATOES 42640 46843 54145 49792 50982 47205 50123 52031 50153 47727 47291 .39CASSAVA 4398 5350 6378 6613 6925 6969 6444 6670 6863 6758 6670 2.94
TOTAL PULSES 6757 6436 6908 7131 7169 6879 6773 6492 6833 6315 6126 -.76
CITRUS FRUIT 875 973 948 1150 1345 1464 1680 2067 2251 2675 2900 13.60BANANAS 883 986 1015 1128 1235 1281 1479 1585 1787 2222 2022 9.46APPLES 2101 2519 27Z3 3331 2843 3501 2941 4083 3515 4209 4617 6.76
VEGETABLE OILSOIL EQUIV 3828 4020 4630 5066 5691 7065 7709 7779 8825 9606 9359 10.57SOYBEANS 7019 7646 7957 7844 8339 9748 9480 10214 10173 11025 12116 5.21GROUNDNUTS IN SHELL 2070 2155 2568 2994 3788 4021 4119 4146 5072 7033 6261 12.59SUNFLOWER SEED 100 170 279 340 910 1332 1286 1341 1705 1901 1700 34.18RAPESEED 1353 1173 1871 2404 2386 4067 5657 4288 4206 5607 5872 17.83COTTONSEED 4120 4112 4347 4424 5422 5945 7207 9286 12529 8310 7099 9.99COPRA 32 40 46 61 64 65 70 98 112 115 121 14.21PALM KERNELS 41 40 42 43 40 41 45 47 46 48 49 2.01
SUGAR 10ENTRIFUGAL,RAW, 2675 3154 3303 3690 3840 4486 5198 4860 5767 6712 6410 9.43
COFFEE GREEN 18 21 14 14 16 21 19 20 22 28 29 5.42TEA 277 295 313 325 350 389 444 449 463 483 515 6.69
COTTON LINT 2060 2056 2173 2212 2711 2973 3603 4643 6265 4155 3549 9.99JUTE AND SIMILAR FIBRES 401 463 578 574 584 665 570 564 800 2130 789 9.92SISAL 9 8 9 d 8 3 3 3 3 4 4 -11.60
TOBACCO 1060 1077 1338 1026 994 1591 2279 1485 1909 2554 1833 8.35NATURAL RUBBER 123 149 166 162 164 177 204 232 249 257 277 7.93
TOTAL MEAT 10235 10374 11328 13641 15162 16017 17183 18048 19740 22286 24120 9.21TOTAL MILK 3003 3094 3232 3376 3579 3759 4168 4460 4922 5349 5825 7.03TOTAL EGGS 2592 2698 2840 2988 3151 3360 3614 3934 4253 4560 4844 6.69WOOL GREASY 155 156 157 174 196 210 223 214 203 197 202 3.32
1/ NOMINAL CATCH 1LIVE rIEIGHT) EXCLUDING ,(HALES2/ EXCEPT FUR PULP FUR PAPER ANO PAPER ANO PAPERBOARD, ALL FOREST PRODUCTS ARE EXPRESSED IN THOUSANC CUBIC METRES
143

144
ANNEX TABLE 1. (Coni.) VOLUME OF PRODUCTION OF MAJOR AGRICULTURAL, FISHERY AND FOREST PRODUCTS
ANNUALRATE OF
1976 1977 1978 1979 1980 1981 1982 1983 1984 1985 1986 CHANGE1976..86
THOUSAND METRIC TONS PERCENT
FISHERY PRODUCTS 1/
FRESHWATER + DIADROMOUS 1401 1422 1376 1468 1605 1785 1978 2289 2724 3439MARINE FISH 4485 4568 4532 4335 4470 4517 4777 4795 5109 5228CRUST+ MOLLUS+ CEPHALOP 1045 1167 1239 1122 1144 1151 1322 1435 1580 1679AQUATIC MAMMALS 2 2 1 1 1 1 1 1 1 1AQUATIC ANIMALS 6 13 4 14 10 19 19 20 20 22AQUATIC PLANTS 965 1434 1606 1519 1601 1399 1419 1535 1675 1726
FOREST PRODUCTS 2/
SAWLOGS CONIFEROUS 27944 28588 29311 30973 30984 27923 28442 29419 33965 33965 33965 1.76SAWLOGS NONCONIFEROUS 17942 18535 19005 20031 19665 18473 18779 19383 22283 22283 22283 2.01PULPW000+PARTICLES 4476 4671 4876 5089 5074 4670 4752 4893 5614 5614 5614 1.97FUELWOOD 170100 173263 176538 179956 183467 187081 190792 194587 198435 202372 202990 1.88SAWNWOOD CONIFEROUS 11697 12188 12745 13318 13887 14511 15162 15695 18134 18134 18134 4.89SAWNWOOD NONCONIFEROUS 7039 7445 7728 8025 8323 8652 9019 9291 10742 10742 10742 4.59WOODBASED PANELS 1429 1516 2023 2160 2303 2388 2566 2742 2807 2807 2807 6.97PULP FOR PAPER 3345 3698 4295 4699 4932 4969 4942 5414 5976 7210 1698 .51PAPER+PAPERBOARD 4289 4580 5243 6031 6438 6509 7015 8433 9591 11169 11173 10.44
1/ NOMINAL CATCH (LIVE WEIGHT) EXCLUDING WHALES2/ EXCEPT FOR PULP FOR PAPER ANO PAPER ANO PAPERBOARD, ALL FOREST PRUDUCTS ARE EXPRESSED IN THOUSAND CUBIC METRES

ANNEX TABLE 2. INDICES OF FOOD PRODUCTION
TjTAL PER CAPUTCHANuc CHANGE
1962 1983 1984 1985 19,6 19416 TU 15912 1533 1984 19415 1986 1985 TO1986 1986
1979-81-10, PtACENT ....1979-81=10C PERCENT
WORLD 106 106 111 113 116 2.12 102 101 104 104 105 .49
DEVELOPED CUUNTRIES 104 100 117 100' 109 1.20 103 98 104 114 105 .59
WESTERN EUROPE 105 103 110 106 107 .67 104 102 106 105 105 .47
EUROPEAN ECON COMMUNITY 104 103 110 107 108 .72 104 102 108 105 106 .54BELGIUM-LUXEM6OURG 97 94 104 104 104 -.11 97 94 104 104 104 -.20DENMARK 111 105 127 123 126 1.94 111 105 127 124 126 1.94FRANCE 105 101 110 110 108 -1.96 104 100 108 107 105 -2.26GERMANY FED.REP. OF 109 106 114 108 115 6.41 109 106 114 109 116 6.60GREECE 109 102 107 103 99 -3.46 107 100 104 59 96 -3.85IRELAND 98 99 113 111 106 -4.11 95 96 107 104 99 -5.31ITALY 99 108 100 101 101 C8 99 107 99 100 100 -.01NETHERLANDS 109 107 110 104 111 6.59 108 105 107 101 108 6.23UNITED KINGDOM 103 105 115 109 112 2.99 103 105 115 108 111 2.96
OTHER WESTERN EUROPE 109 106 110 104 104 .34 108 104 108 102 102 .04AUSTRIA 112 107 111 109 104 -4.03 112 107 111 109 104 -4.05FINLAND 107 117 114 113 112 -1.05 106 115 112 110 108 -1.35ICELAND 99 96 98 99 97 -1.79 96 93 93 93 91 -2.59MALTA 115 114 109 113 119 5.82 113 112 106 108 114 5.00NORWAY 109 104 114 111 105 -5.92 108 103 112 110 103 -6.08PORTUGAL 106 94 103 104 '105 .78 104 92 100 100 100 .14SPAIN 103 95 112 107 105 -2.51 102 93 109 104 101 -3.11SWEDEN 106 105 114 103 103 105 104 114 103 103 .11SWITZERLANU 110 105 108 106 108 -.35 108 103 106 106 105 -.40YUGOSLAVIA 109 104 107 99 102 3:38 108 102 104 95 98 2.73
USSR AND EASTERN EUROPE 104 108 110 113 117 6.49 103 105 107 106 112 5.64
EASTERN EUROPE 104 104 111 109 115 5.86 103 102 109 106 112 5.32ALBANIA 102 109 109 109 108 -.61 98 102 100 98 95 -2.69BULGARIA 110 101 109 95 106 11.37 110 101 108 93 104 10.95CZECHOSLOVAKIA 109 114 120 117 119 1.78 109 113 119 116 117 1.46GERMAN DEMOCRATIC REP. 97 98 105 111 109 -1.69 97 98 106 111 109 -1.83HUNGARY 112 109 116 108 109 1.23 112 109 116 109 110 1.31POLAND 100 104 107 109 116 6.06 98 101 103 105 110 5.32ROMANIA 106 104 116 109 125 14.36 104 102 114 107 121 13.58
USSR 104 109 110 110 117 6.00 102 106 106 105 110 5.02
NORTH AMERICA DEVELOPED 106 89 102 109 , 106 -2.74 104 87 98 103 100 -3.58
CANADA 117 109 108 112 124 10.66 114 106 104 106 116 9.54UNITED STATES 105 90 102 106 104 -3.80 103 87 98 103 98 -4.62
OCEANIA DEVELOPED 93 111 106 106 107 .52 91 107 101 100 99 -.66
AUSTRALIA 67 116 110 105 106 2.66 85 111 104 98 100 1.38NEW ZEALAND 104 107 106 110 110 -4.99 104 105 103 112 105 -5.80
OTHER DEV.ED COUNTRIES 100 95 101 104 106 1.42 98 92 97 99 100 .46ISRAEL 107 117 111 124 116 -6.45 102 110 102 112 103 -7.98JAPAN 99 99 110 110 111 .38 98 97 107 107 106 -.13SOUTH AFRICA 96 79 89 95 99 4.18 92 73 81 84 85 1.58
DEVELOPING COUNTRIES 107 112 116 119 123 2.94 103 105 107 108 109 .98
AFRICA DEVELOPING 105 103 103 113 118 3.94 99 95 92 57 98 .74
NORTH WESTERN AFRICA 131 104 105 119 128 7.57 96 96 95 105 109 4.73ALGERIA 96 102 108 121 125 2.69 90 93 96 104 104 -.35MOROCCO 115 105 107 114 137 20.12 110 58 97 101 118 17.39TUNISIA 91 106 104 134 120 -10.61 83 99 96 121 106 -12.54
WESTERN AFRICA 106 102 110 117 122 4.42 99 93 97 100 101 1.07BENIN 99 103 126 133 139 4.93 94 94 112 114 116 1.72BURKINA FASO 105 107 106 130 14o 11.94 100 99 96 116 126 9.02COTE D.IVOIRE 99 102 117 126 122 -3.68 92 91 101 105 98 -6.95GAMBIA 143 100 110 13o 136 -.48 138 95 102 124 121 -2.57GHANA 97 39 131 124 138 11.29 91 81 115 106 114 7.61GUINEA 107 100 102 133 108 4.90 102 95 93 92 94 2.34LIBERIA 104 112 115 115 116 2.70 97 - 102 101 58 97 -.57MALI 116 122 113 109 122 11.84 110 112 101 95 103 8.60MAURITANIA 99 91 94 90 110 11.71 95 64 84 85 92 8.33NIGER 100 102 82 104 106 3.72 95 94 73 51 91 .64NIGERIA 109 157 113 123 149 4.61 102 97 99 104 105 1.02SENEGAL 122 66 104 123 117 -5.00 115 61 94 109 100 -7.54SIERRA LEONE 112 116 105 101 112 10.90 109 113 98 93 101 8.79TOGO 103 94 106 10, 100 -4.76 9, 87 94 91 84 -7.63
CENTRAL AFRICA 133 105 105 199 111 1.66 58 97 94 55 94 -1.18ANGOLA 131 102 102 102 102 .20 96 54 92 90 87 -2.43CANEKUON 106 104 104 103 111 2.74 96 So 93 95 95 -.11CENTRAL AFRICAN loE 195 106 153 96 106 5.84 100 95 95 67 94 7.22CHAU 193 105 56 119 122 2.61 56 58 88 106 106 .14CONGO 156 102 135 136 128 1.93 101 54 93 93 92 -.80GA6ON 104 137 137 19; 157 4.52 101 102 100 97 97 .31ZAIRE 158 110 113 116 117 .99 102 121 101 IGO 98 -2.03
EASTERN AFRICA 126 104 97 10) 11, 3.13 10e 9, 85 94 93 -.156ORUNJI 137 180 203 115 119 5.44 101 S8 92 97 97 .55
145

146
ANNEX TABLE 2. (COM.) INDICES OF FOOD PRODUCTION
TOTAL PER CAPUT(MANGE CHANGE
1962 1963 1984 1965 1966 1985 TU 1962 1963 1984 1985 1986 1985 TO1980 1986
1979-81.100 PERCENT ....1979-81=100 PERCENT
ETHIOPIA 107 100 90 99 132 3.19 102 93 82 88 88 .34
KENYA 114 112 84 111 119 7.30 105 99 72 90 93 2.94MADAGASCAR 104 110 111 114 114 -.04 99 ICI 100 59 96 -2.90MALAWI 106 103 104 105 106 1.69 100 94 92 90 88 -1.62MAURITIUS 121 103 101 111 120 7.77 110 97 93 101 107 6.05
MOZAMBIJUE 102 97 96 98 101 2.69 90 89 86 85 85 .15
RWANDA 112 119 97 133 106 2.77 104 108 85 87 87 -.62SOMALIA 106 101 100 106 108 1.19 100 92 88 52 91 -.92TANZANIA 100 104 139 112 114 2.90 94 93 95 93 92 -.78UGANDA 117 125 94 140 152 4.10 110 113 83 124 125 .53
ZAMBIA 98 113 104 114 118 2.78 92 94 91 97 96 -.68ZIMBABWE 102 80 88 125 122 -2.35 96 72 77 106 99 -5.81
SOUTHERN AFRICA 104 99 98 101 102 .96 98 51 87 87 86 -2.06BOTSWANA 105 98 92 96 99 .99 97 88 79 81 78 ..2.70
LESOTHO 86 89 89 100 93 -7.31 81 83 80 88 79 -9.69SWAZILAND 138 111 112 111 113 1.86 102 LC2 99 95 94 -1.31
LATIN AMERICA 107 106 110 113 113 .39 102 99 100 101 99 -1.76
CENTRAL AMERICA 102 107 108 109 112 2.90 97 99 97 95 96 .35
COSTA RICA 94 96 102 105 109 3.33 89 69 92 92 93 .85
EL SALVADOR 57 92 103 104 100 -4.28 82 84 92 90 84 -.7.21
GUATEMALA 111 111 111 112 112 .16 105 102 100 97 95 -2.69HONDURAS 102 96 95 100 110 9.66 96 87 83 85 90 6.31
MEXICO 102 109 111 111 113 1.80 97 101 100 97 97 -.60NICARAGUA 93 92 89 93 91 .68 87 83 77 76 74 -2.65PANAMA 102 108 107 112 106 -5.11 98 102 98 100 93 -7.08
CARIBBEAN 104 104 109 106 107 1.11 101 99 102 98 97 -.57BARBADOS 86 81 85 86 92 6.92 85 80 84 85 90 6.08CUBA 108 105 114 112 113 .81 107 103 111 108 108 ...17
DOMINICAN REPUBLIC 105 111 115 112 111 -.31 101 103 105 99 97 -2.48HAITI 100 104 107 106 110 3.34 95 97 97 94 94 .67
JAMAICA 94 102 112 109 108 -.71 91 98 105 101 99 -2.21SOUTH AMERICA 108 105 110 115 114 -.32 103 99 101 103 1.00 .-2.37
ARGENTINA 108 105 108 104 109 4.25 104 100 101 96 99 2.74BOLIVIA 111 84 103 111 104 -6.46 105 78 92 97 89 -9.00BRAZIL 113 108 115 123 119 -3.36 108 101 105 110 104 -5.35CHILE 104 99 104 108 116 8.02 101 95 98 100 106 6.39COLOMBIA 101 99 104 106 110 4.00 96 93 96 95 97 1.88ECUADOR 107 92 103 117 120 1.96 101 85 92 102 101 -.84GUYANA 103 93 88 89 91 1.76 98 88 81 81 81 -.03PARAGUAY 108 112 108 121 116 -4.04 101 102 96 104 97 *6.68PERU 111 104 115 114 112 -1.15 105 96 104 100 96 -.3.60
URUGUAY 112 115 105 100 102 -3.84 111 113 102 102 98 -4.57VENEZUELA 98 105 103 106 110 3.83 93 96 92 92 93 1.15
NEAR EAST DEVELOPING 109 108 106 113 118 4.95 103 100 96 99 101 2.01
NEAR EAST IN AFRICA 106 109 106 115 119 3.63 100 100 96 100 101 1.05EGYPT 110 113 113 119 120 1.04 105 105 102 105 104 -1.23LIBYA 142 142 138 172 178 3.67 131 126 118 141 141 -.07SUDAN 100 102 93 115 123 6.58 94 93 83 100 104 3.55
NEAR EAST IN ASIA 110 107 106 112 118 5.40 104 100 96 99 101 2.31AFGHANISTAN 103 104 104 103 99 -4.28 102 102 101 100 92 -.8.79
CYPRUS 108 92 103 90 96 .02 105 89 98 90 89 -1.02IRAN 113 110 110 114 117 2.84 107 101 98 98 98 .03'RAU 115 112 109 130 147 10.79 107 100 94 111 119 7.19JORDAN 109 116 121 120 125 3.79 102 105 105 100 100 -.27LEBANON 119 106 108 123 129 5.18 123 108 109 123 127 2.98SAUDI ARABIA 124 158 157 246 200 5.72 113 138 132 158 202 1.73SYRIA 114 113 101 109 123 13.00 107 102 88 91 99 8.91TURKEY 107 106 106 11U 116 5.26 103 99 98 99 103 3.13YEMEN ARAO REPU8LIC 109 102 113 122 140 14.79 103 94 101 106 119 11.49YEMEN DEMOCRATIC 95 100 101 100 98 -2.15 90 92 90 87 83 -5.04
FAR EAST DEVELOPIN6 105 114 117 121 123 1.68 101 107 108 109 109 -.19
SOUTH ASIA 134 116 118 121 123 1.48 100 139 108 109 108 -.406ANGLADESH 105 106 110 114 118 4.67 10C 99 98 100 100 .22
INDIA 104 118 120 123 124 .59 100 111 111 112 111 -1.13NEPAL 99 115 115 116 112 -3.93 94 107 105 103 97 -6.09PAKISTAN 107 111 113 117 124 6.12 101 101 100 100 104 3.78SRI LANKA 91 100 93 9, 101 0.27 dil Sí 83 87 91 4.71
EAST SOUTH-EAST ASIA 107 111 117 120 125 2.05 103 I34 108 109 109 .218URMA 116 122 129 13o 143 3.65 113 116 119 125 127 1.71INDONESIA 108 115 127 121 134 3.90 104 1C8 117 117 119 2.19KOREA REP 101 103 139 111 117 5.12 98 95 103 103 106 3.39
LAO 111 116 129 141 147 4.05 107 109 118 127 129 1.56MALAYSIA 114 128 115 123 130 5.30 106 100 104 109 112 3.08PHILIPPINES 101 101 102 106 110 3.88 96 54 93 54 95 1.28THAILAND 139 116 118 124 Ild -3.19 105 129 109 111 105 -4.73
ASIAN CENT PLANNED 6623 110 118 125 127 133 5.bu 107 113 119 118 123 3.77
CHINA 110 117 125 12, 133 5.29 107 113 119 118 123 4.05KAMPUCHEA,DENJCAATIC 113 139 154 105 163 -1.26 113 130 140 147 142 -3.68KUREA DPR 105 113 116 121 143 1.76 10C 122 105 107 106 -.60WINGOLIA 107 112 108 109 113 3.46 101 103 97 55 96 .66VIET NAM 110 115 122 125 13'f 4.56 106 109 113 116 115 2.44
OTHER DEV.ING GJUiITIIOS 123 99 139 110 113 1.79 99 o2 99 98 97 -.49

ANNEX TABLE 3. INDICES OF AGRICULTURAL PRODUCTION
TOTAL PER CAPUTCHANGE CHANGE
1982 1983 1984 1985 1986 1985 TO 1982 1983 1984 1985 1986 1985 TO1986 1986
1979-8110O PERCENT 1979-81100 PERCENT
WORLD 106 106 111 114 115 1.26 102 100 104 105 104 ....35
DEVELOPED COUNTRIES 104 100 106 108 109 .86 103 97 103 104 104 .20
WESTERN EUROPE 105 103 110 107 107 .64 104 102 108 105 106 e44
EUROPEAN ECON COMMUNITY 104 103 110 107 108 .67 104 102 108 106 106 .49BELGIUM--LUXEMBOURG 97 94 104 104 104 ...12 97 94 104 104 104 -.eaDENMARK 111 105 127 123 126 1.94 111 105 127 124 126 1.94FRANCE 105 101 110 110 107 -2.02 103 100 108 107 105 -2.32'GERMANY FED.REP. OF 109 106 114 108 115 6.40 109 106 114 109 116 6.59GREECE 108 102 108 105 102 -.2.93 106 100 105 101 98 -.3.32IRELAND 98 99 112 111 106 -4.09 95 96 107 104 99 -'5.30ITALY 99 108 100 101 101 -.02 99 108 99 100 100 ,.11NETHERLANDS 109 107 110 104 111 6.53 108 105 107 102 108 6.17UNITED KINGDOM 103 105 115 109 112 2.96 103 105 114 108 111 2.93
OTHER WESTERN EUROPE 109 106 110 104 104 .44 108 104 108 102 102 .13AUSTRIA 112 107 111 109 105 ."4.03 112 107 111 109 104 "4..04FINLAND 107 117 114 113 112 ..1.05 106 115 112 110 108 -1.35ICELAND 99 96 98 99 97 ...1.74 96 93 93 93 91 ...2.54MALTA 115 114 109 113 119 5.82 113 112 106 108 114 5.00NORWAY 109 104 114 112 105 ..5.82 108 103 112 110 103 5.98PORTUGAL 106 94 103 104 105 .78 104 92 100 100 100 .14SPAIN 103 95 112 108 105 -2.31 102 93 109 ' 104 101 24.91SWEDEN 106 105 114 103 103 105 104 114 103 103 .11SWITZERLAND 109 105 108 108 108 ....30 108 103 106 106 105 -..35YUGOSLAVIA 110 104 107 99 103 3.51 108 102 104 96 98 2.86
USSR ANO EASTERN EUROPE 104 108 109 109 116 6.04 103 105 106 105 111 5.20
EASTERN EUROPE 104 104 111 109 115 5.65 103 102 109 106 112 5.12ALBANIA 102 108 108 109 108 ....57 97 101 99 97 95 ...2.64BULGARIA 110 99 108 94 103 8.84 109 98 107 93 101 8.43CZECHOSLOVAKIA 109 114 120 117 119 1.63 109 113 119 116 117 1.31GERMAN DEMOCRATIC REP, 97 98 106 111 110 -1.41 98 98 106 112 110 ..1.55HUNGARY 112 109 116 108 109 1o15 112 109 116 109 110 1.23POLAND 99 104 107 109 116 5.73 97 101 103 105 110 4.99ROMANIA 105 103 116 109 125 14.16 104 102 114 107 121 13.38
USSR 104 109 109 109 115 5.51 102 106 105 105 109 4.54
NORTH AMERICA DEVELOPED 105 88 102 108 104 *3.58 103 86 98 103 98 '4.42
CANADA 116 109 108 112 123 10.09 113 105 104 106 116 8.98UNITED STATES 104 88 102 107 102 -4.90 102 85 98 102 96 -.5.71
OCEANIA DEVELOPED 95 109 106 109 109 .49 93 105 101 102 101 ....69
AUSTRALIA 90 113 110 109 112 2.73 88 109 104 102 104 1.46NEW ZEALAND 104 106 105 114 108 ..5.32 103 104 102 109 103 .-6.12
OTHER DEV.ED COUNTRIES 100 95 101 104 105 1.08 98 92 96 98 98 .12ISRAEL 107 116 110 123 110 -.10.33 102 109 101 111 98 -41.79JAPAN 99 99 108 108 109 .34 97 97 105 105 104 -..17SOUTH AFRICA 96 80 90 96 99 3.74 92 75 81 85 85 1.15
DEVELOPING COUNTRIES 107 112 116 120 122 1.62 103 105 107 108 108 .32
AFRICA DEVELOPING 105 104 104 113 118 3.93 99 95 92 98 98 .73
NORTH WESTERN AFRICA 102 105 106 121 129 7.16 97 97 96 106 110 4.33ALGERIA 97 103 109 122 126 2.76 91 94 96 105 105 .48MOROCCO 115 106 108 114 137 19.79 110 98 97 101 118 17.07TUNISIA 92 106 104 134 120 -10.38 88 99 96 120 106 .-12.31
WESTERN AFRICA 105 102 107 117 122 4.65 99 93 95 100 101 1.29BENIN 100 105 129 136 145 6.60 94 96 115 117 121 3.33BURKINA FASO 105 107 106 131 148 12.59 100 100 97 116 128 9.66COTE D.IVOIRE 97 101 101 121 118 -2.15 90 90 87 101 95 -.5.48GAMBIA 143 100 110 136 135 -.44 138 94 102 123 120 -2.56GHANA 97 89 129 123 137 11.19 91 81 114 105 113 7.52GUINEA 106 100 102 103 108 4.72 102 94 93 92 94 2.17LIBERIA 103 107 115 113 116 2.65 97 97 101 97 96 -...62MALI 114 121 113 110 123 11.79 108 111 101 96 104 8.55MAURITANIA 99 91 94 98 110 11.71 93 84 84 85 92 8.33NIGER 100 102 82 104 108 3.73 95 94 73 91 91 .65NIGERIA 109 107 113 123 128 4.63 102 97 99 104 105 1.04SENEGAL 122 88 105 124 118 -4.55 116 82 95 109 101 -7.11SIERRA LEONE 111 112 101 101 111 10.82 107 107 94 92 100 8.71TOGO 100 95 105 108 103 -4.50 94 87 93 93 86 -7.38
CENTRAL AFRICA 104 105 107 '110 112 2.10 99 96 96 96 95 .-.75ANGOLA 99 100 101 101 102 1.59 94 93 91 89 88 -1.08CAMEROON 105 100 106 107 112 4.61 99 92 95 93 95 1.71CENTRAL AFRICAN REP 106 105 105 99 108 9.15 101 98 96 88 94 6.54CHAD 101 110 97 120 120 .61 97 103 89 107 105 -.1.82CONGO 106 102 103 106 108 1.69 101 94 93 93 92 -1.04GABON 104 107 107 105 107 2.32 101 102 100 97 97 .32ZAIRE 108 111 113 116 118 .96 102 102 101 101 99 -.2.06
EASTERN AFRICA 106 104 100 110 114 2.98 100 95 88 95 94 .-..30BURUNDI 103 107 102 111 113 2.06 98 99 91 97 96 ...80
147

148
ANNEX TABLE 3. (Cont.) INDICES OF AGRICULTURAL PRODUCTION
TOTAL PER CAPUTCHANGE CHANGE
1982 1983 1984 1985 1986 1985 TO 1982 1983 1984 1985 1986 1985 TO1986 1986
1979-81=100 PERCENT 1979..81=100 PERCENT
ETHIOPIA 107 101 93 99 103 4.88 102 94 84 87 89 1.99KENYA 112 113 100 117 127 8.57 103 100 85 95 99 4.11MADAGASCAR 104 109 111 113 113 .22 98 100 99 98 96 ...205MALAWI 108 105 109 109 112 2.16 102 96 96 94 93 14.17MAURITIUS 119 103 104 113 121 7.07 114 97 96 103 108 5.37MOZAMBIQUE 101 96 96 97 100 2.84 95 88 85 84 84 611RWANDA 110 119 100 104 107 2.42 103 107 87 89 88 ....96
SOMALIA 106 101 100 106 108 1.19 100 92 88 92 91 ...92TANZANIA 99 102 107 108 111 2.70 92 92 93 90 89 -.97UGANDA 118 125 97 147 153 3.65 111 114 85 125 125 .10ZAMBIA 97 103 106 115 119 3.19 91 94 93 97 97 ....28
ZIMBABWE 99 85 101 128 123 -4.08 92 76 88 107 99 ..7.148SOUTHERN AFRICA 103 99 98 101 102 1.00 98 90 87 87 85 ..2.03
BOTSWANA 105 98 92 98 99 .99 97 88 79 81 78 ...2.71LESOTHO 87 91 91 101 94 -.6.67 83 85 82 89 81 -.9.06SWAZILAND 108 111 112 111 113 1.70 102 102 99 95 94 -.1.49
LATIN AMERICA 105 105 109 113 111 -1.62 100 98 99 101 97 ..3.72
CENTRAL AMERICA 101 105 106 106 108 1.56 95 97 95 93 92 -.97COSTA RICA 97 101 108 115 111 ..3.53 92 93 97 101 95 ...5.05EL SALVADOR 84 89 94 94 85 -9.87 79 81 83 81 71 ..12.63GUATEMALA 107 103 105 102 101 ..1.09 101 94 93 89 85 -3.90HONDURAS 102 99 98 102 108 5.72 95 90 85 86 88 2.48MEXICO 102 109 109 109 111 1.54 97 100 98 96 95 .85NICARAGUA 98 92 92 91 86 -5.56 92 83 80 77 70 ..8.69PANAMA 103 109 109 113 110 .-201 98 102 100 101 97 .4,03
CARIBBEAN 104 103 109 106 106 .33 101 99 102 98 97 ...1.33BARBADOS 86 81 85 86 92 6.92 85 80 84 85 90 6.08CUBA 109 105 114 112 113 .73 108 103 112 109 109 ...25DOMINICAN REPUBLIC 105 111 115 111 106 ..4.82 101 104 105 99 92 ...6.:#89
HAITI 100 105 107 106 110 3.42 95 97 97 94 94 .75JAMAICA 94 102 111 109 108 ...53 91 98 105 101 99 ...2.04
SOUTH AMERICA 106 105 109 115 112 -2.58 102 98 100 103 98 .4.58ARGENTINA 108 104 108 104 108 3.77 104 99 101 96 98 2,27BOLIVIA 110 84 102 109 103 -.6.12 104 78 91 96 87 ...808BRAZIL 108 107 113 124 115 ..7.66 104 101 104 111 101 9.55CHILE 104 99 104 108 116 7.89 101 95 98 100 106 6.27COLOMBIA 101 100 103 103 107 3.55 97 94 94 93 94 1.44ECUADOR 107 92 104 119 122 2.86 101 84 93 103 103 03GUYANA 102 93 88 89 91 1.75 98 88 81 81 81 ....03
PARAGUAY 108 110 110 129 120 -6.82 102 100 97 111 101 ..9.38PERU 105 101 113 111 110 -1.00 100 94 101 98 94 ..3.46URUGUAY 112 115 106 109 107 .4.92 110 113 103 105 103 ..2,66VENEZUELA 98 105 103 108 111 3.59 92 96 92 93 94 .91
NEAR EAST DEVELOPING 108 108 106 112 117 4.30 103 100 96 98 100 1.39
NEAR EAST IN AFRICA 105 107 105 113 116 2.56 99 99 95 99 99EGYPT 107 108 108 114 115 .91 102 101 98 101 100 -.1.35LIBYA 142 142 137 171 177 3.65 131 126 117 141 141 .41139
SUDAN 101 105 98 118 123 4.17 96 97 88 102 104 1.21NEAR EAST IN ASIA 109 108 106 112 117 4.92 104 100 96 98 100 184AFGHANISTAN 101 103 103 103 99 ..4.01 100 101 101 100 91 8.53CYPRUS 107 92 103 96 96 .-.02 105 89 98 90 89 ..1.05IRAN 113 110 110 113 117 2.97 107 101 98 98 98 .16IRAQ 115 112 110 133 147 10.62 107 101 95 11/ 119 1.02JORDAN 109 117 120 120 124 3.64 102 106 105 100 100 -.41LEBANON 118 106 107 122 128 5.14 119 107 108 122 125 2.44SAUDI ARABIA 124 157 157 245 259 5.68 113 138 132 197 201 1.70SYRIA 115 116 103 110 124 12.41 107 105 90 93 100 834TURKEY 107 106 106 110 115 407 103 99 98 99 101 2.53YEMEN ARAB REPUBLIC 109 102 112 121 139 14.62 103 94 101 106 118 11.32YEMEN DEMOCRATIC 95 101 102 101 99 -2.03 90 93 91 88 84 -.4.93
FAR EAST DEVELOPING 105 113 117 121 122 1.05 101 106 107 109 108 ...81
SOUTH ASIA 104 114 117 121 122 .43 100 107 108 109 108 1..43BANGLADESH 105 107 109 116 116 .15 100 99 98 101 99 -2.43INDIA 104 117 120 123 123 -.26 100 110 111 112 110 .1.96NEPAL 98 114 113 115 111 -3.42 94 106 103 102 97 ...5.59PAKISTAN 107 107 115 121 128 5.59 101 98 102 104 107 3.26SRI LANKA 93 99 91 97 103 5.58 90 94 85 89 92 4.03
EAST SOUTH-EAST ASIA 107 110 116 120 122 2.21 103 104 107 108 109 .37BURMA 117 122 128 137 141 3.30 112 115 118 124 126 1.37INDONESIA 107 114 125 128 133 4.16 103 107 116 116 119 2.37KOREA REP 102 102 109 110 116 5.10 99 98 102 102 105 3.37LAO 111 116 129 140 146 4.15 107 109 118 126 128 1.66MALAYSIA 110 106 112 117 122 4.34 105 99 101 104 106 2.14PHILIPPINES 103 101 102 106 110 3.61 98 94 93 94 95 1.31THAILAND 109 115 118 123 120 -2.48 105 109 109 111 107 -4.03
ASIAN CENT PLANNED ECON 112 119 129 129 133 2.98 109 115 123 121 123 1.69
CHINA 112 119 130 129 133 2.99 109 115 123 121 123 1.78KAMPUCHEAIDEMOCRATIC 117 139 154 167 165 .-1.14 113 130 141 148 143 ..3,56KOREA DPR 105 110 116 121 123 1.82 100 102 ,105 107 106 ....55
MONGOLIA 107 111 106 107 110 3.15 101 102 95 93 94 .36VIET NAM 110 115 122 129 135 4.57 106 109 113 117 120 2.44
OTHER DEV.ING COUNTRIES 101 100 108 110 112 1.94 97 93 97 97 97

ANNEX TABLE 4. VOLUME OF EXPORTS OF MAJOR AGRICULTURAL, FISHERY AND FOREST PRODUCTS
ANNUALRATE OF
1975 1.976 1977 1978 1979 1980 1981 1982 1983 1984 1985 CHANGE1975-85
THOUSAND METRIC TONS PERCENT
149
WORLD
AGRICULTURAL PRODUCTS
WHEAT+FLOUR,WHEAT EQUIV. 73824 69064 74486 84921 81563 99527 105202 104979 111816 116489 104994 5.37RICE MILLED 7724 8916 10853 9600 11644 12978 13093 12044 11436 12680 10851 3.55BARLEY 12604 13930 13112 14585 14106 16226 20277 18346 17754 23008 21806 6.07MAIZE 52085 62377 57764 68792 76096 80304 79442 70040 69045 68961 69597 2.27MILLET 207 303 272 315 296 214 242 226 220 178 181 -3.82SORGHUM 10156 11161 11937 10923 11365 11164 14464 13724 11728 12381 12885 2.07
POTATOES 3931 4411 4696 4038 4630 4921 4949 5204 4779 4722 5079 2.00SUGAR,TOTAL (RAW EQUIV.) 21937 23185 28985 26139 26686 27510 29344 30725 29706 28675 28286 2.40PULSES 1788 1906 1981 2116 2349 2815 3148 2968 3148 3289 3683 7.69
SOYBEANS 16479 19766 20025 24062 25489 26877 26219 28928 26585 25775 25527 4.17SOY6EAN OIL 1365 1839 2106 2610 2953 3196 3488 3406 3651 4026 3490 9.70GROUNDNUTS SHELLED BASIS 899 1035 874 745 744 730 826 730 759 748 805 -2.00GROUNDNUT OIL 402 561 581 416 502 474 320 447 495 290 315 -4.15COPRA 1082 1147 941 703 443 461 415 430 256 289 381 -13.29COCONUT OIL 1043 1374 1110 1334 1142 1216 1357 1264 1324 991 1233 .11PALM NUTS KERNELS 308 391 279 181 160 201 138 111 120 130 93 -12.01PALM OIL 2043 2186 2333 2404 2845 3614 3227 3773 4014 4302 5233 9.58OILSEED CAKE ANO MEAL 14463 18820 19110 21873 23221 25687 27706 27602 31863 28498 30562 7.13
BANANAS 6370 6341 6658 7045 6948 6957 6998 7291 6335 6999 6943 .69ORANGES+TANGER+CLEMEN 5165 5154 5404 5212 4967 5140 4998 5033 4836 5323 4955 -.43LEMONS AND LIMES 813 967 894 982 921 996 936 1016 951 1018 1011 1.43
COFFEE GREEN+ROASTED 3573 3656 2934 3441 3796 3706 3708 3928 4039 4210 4404 2.59COCOA BEANS 1160 1148 972 1086 930 1064 1329 1251 1206 1349 1444 2.79TEA 813 852 904 885 903 981 950 919 980 1081 1080 2.52
COTTON LINT 3994 4049 3929 4472 4373 4832 4264 4417 4307 4316 4211 .68JUTE ANO SIMILAR FIBRES 590 668 565 496 561 520 573 513 500 490 340 -3.81
TOBACCO UNMANUFACTURED 1251 1306 1280 1432 1374 1353 1490 1429 1.342 1396 1354 .80NATURAL RUBBER 3011 3249 3292 3317 3422 3330 3148 3116 3450 3654 3685 1.29
WOOL GREASY 853 1010 1103 890 937 907 952 874 893 879 905 -.83BOVINE CATTLE 1/ 6681 6769 6675 7580 7442 7024 7218 7595 7384 7088 6819 .51SHEEP AND GOATS 1/ 11830 10776 12430 14776 15267 18639 17607 18572 20420 19238 18763 6.29PIGS 1/ 6428 6945 6942 7951 8421 10746 9846 9357 9575 10123 10065 4.84TOTAL MEAT 5547 6264 6811 7170 7829 8094 8860 8583 8944 8793 8966 4.71MILK DRY 391 457 586 602 662 871 868 816 742 827 844 7.36TOTAL EGGS IN SHELL 535 518 573 606 656 746 807 826 794 841 775 5.22
FISHERY PRODUCTS
FISH FRESH FROZEN 2893 2975 3364 3894 4197 4360 4486 4444 4838 4718 4990 5.60FISK CURED 434 437 406 405 445 455 479 448 424 408 405 -.20SHELLFISH 760 896 848 985 1137 1056 1121 1243 1374 1510 1649 7.40FISH CANNED AND PREPARED 721 841 792 844 887 1021 1033 946 910 976 1031 2.93SHELLFISH CANNED+PREPAR 88 94 115 112 115 133 148 161 184 195 204 9.03FISH BODY AND LIVER OIL 597 567 581 696 728 746 728 730 733 948 1049 5.29FISH MEAL 2188 2118 2056 2101 2342 2369 2178 2687 2360 2648 3239 3.41
FOREST PRODUCTS 2/
SAWLOGS CONIFEROUS 23898 28411 28593 29773 31753 27909 22485 26315 29386 30888 32577 1.26SAWLOGS NONCONIFEROUS 36239 45376 47067 48311 45953 42001 32973 33260 32248 29593 29972 -4.33PULPW000+PARTICLE 31876 33856 35121 32616 36223 40643 39495 34471 34712 38588 39668 1.63FUELWOOD 2229 1998 2423 1894 2243 2780 2248 2392 2715 2720 2475 2.36SAWNWOOD CONIFEROUS 43250 56294 61710 65879 08743 65938 60646 61439 70576 72755 73472 3.53SAWNWOOD NONCONIFEROUS 7918 11425 11168 11994 13380 12545 10950 10923 12506 12576 11780 2.13WOOD-BASED PANELS 12436 14384 14971 16401 16680 16323 16759 15452 17404 18013 18860 3.06PULP FOR PAPER 13660 15523 15594 17489 18704 19749 18746 17310 19748 20271 20610 3.53PAPER AND PAPERBOARD 23074 27090 28292 30273 33278 35034 35356 33618 36721 39789 40439 5.03
WESTERN EUROPE
AGRICULTURAL PRODUCTS
WHEAT+FLOUR,WHEAT EWUIV. 14417 14499 12860 13773 16091 19926 23693 22408 23811 27408 29646 8.88RICE MILLED 613 660 738 839 674 943 999 933 941 984 1198 5.63BARLEY 5686 5078 4408 8634 7199 8052 10795 7416 8390 11526 12791 8.89MAIZE 5666 5876 4457 4869 5050 5474 4808 5743 7705 7809 7029 3.83MILLET 15 11 12 12 13 15 20 20 26 20 24 8.31SORGHUM 737 771 385 262 308 206 240 269 159 165 190 -13.40
POTATOES 2589 2337 2707 2793 3016 3455 3543 3666 3517 3591 3777 4.63SUGARrTOTAL IRA4 EQUIV.) 2249 3072 3924 4446 4632 5626 6147 6466 6078 5631 5258 8.54PULSES 323 226 302 353 450 456 448 419 606 814 1237 13.84
SOYBEANS 111 189 120 237 353 327 160 207 127 88 95 -4.22
1/ THOUSAND HEAD2/ EXCEPT FOR PULP FJK PAPER ANO PAPFR RNLI PAPCRoUAROT ALL FOREST PRODUCTS ARE EXPRESSED IN THOUSAND CUBIC METRES

150
ANNEX TABLE 4. (Cont.) VOLUME OF EXPORTS OF MAJOR AGRICULTURAL, FISHERY AND FOREST PRODUCTS
ANNUALRATE OF
1975 1976 1977 1978 1979 1980 1981 1982 1983 1984 1985 CHANGE1975-85
THOUSAND METRIC TONS PERCENT
SOYBEAN OIL 719 744 767 1099 1208 1204 1272 1380 1387 1427 1324 7.49GROUNDNUTS SHELLED 8ASIS 13 24 21 28 14 18 24 25 17 24 24 2.35GROUNDNUT OIL 74 49 44 45 64 79 68 74 99 62 61 3.22COPRA I 17 3 4 1 2 1 -39.38COCONUT OIL 203 269 163 119 61 43 58 87 60 57 51 -14.16PALM NUTS KERNELS 1 1 1 1 2 3 1 2 -26.87PALM OIL 86 98 111 97 92 123 114 94 123 131 141 3.77OILSEED CAKE AND MEAL 2251 2630 2518 3437 3957 4247 4921 5330 6417 6113 6378 12.02
BANANAS 35 25 31 41 43 43 48 46 35 47 35 3.02ORANGES+TANGER+CLEMEN 1999 2057 2113 1921 1907 1799 1659 1880 1702 2425 1956 -.26LEMONS ANO LIMES 461 525 464 505 483 512 430 574 449 532 542 .82
COFFEE GREEN+ROASTED 86 92 78 102 130 106 122 126 142 165 202 8.28COCOA BEANS 11 15 30 34 31 44 48 52 52 66 76 18.16TEA 43 46 60 50 46 43 44 43 51 56 56 1.20
COTTON LINT 65 89 70 71 60 57 55 75 69 68 98 .91JUTE ANO SIMILAR FIBRES 21 18 17 19 16 17 17 15 16 14 14 -3.23
TOBACCO UNMANUFACTURED 177 179 153 223 234 197 210 247 249 265 243 4.35NATURAL RUBBER 29 32 27 21 21 16 14 15 16 23 23 -4.62
WOOL GREASY 55 64 57 60 65 69 61 57 69 65 62 .98BOVINE CATTLE I/ 3416 3121 2979 3322 ' 3340 3412 3620 3546 3493 3537 3480 1.17SHEEP ANO GOATS 1/ 1152 1183 1318 1732 1384 1418 927 784 1196 1137 1411 -1.28PIGS 1/ 2596 3112 3106 3421 4004 4777 4747 4537 4737 4688 4755 6.25TOTAL MEAT 2433 2395 2648 2894 3173 3673 3900 3785 4075 4303 4451 6.96MILK DRY 285 334 433 450 516 660 673 599 531 641 623 7.52TOTAL EGGS IN SHELL 326 335 349 382 444 506 538 601 596 586 542 7.05
FISHERY PRODUCTS
FISH FRESH FROZEN 1054 1086 1137 1398 1686 1642 1788 1874 1966 1915 2018 7.35FISH CURED 278 287 259 254 276 279 309 274 271 268 266 -.08SHELLFISH 250 277 234 266 283 280 327 314 344 405 413 5.28FISH CANNED AND PREPARED 207 249 249 262 265 258 261 263 266 275 277 1.87SHELLFISH-CANNED+PREPAR 27 32 34 36 38 42 47 57 72 75 80 11.75FISH BODY AND LIVER OIL 249 319 339 271 297 333 335 270 265 272 392 .92FISH MEAL 864 948 1020 871 951 922 846 826 936 1008 970 .31
FOREST PRODUCTS 2/,
SAWLOGS CONIFEROUS 1704 2428 2590 1899 2395 2937 2735 2429 2494 2786 3282 4.02SAWLOGS NONCONIFEROUS 1665 1833 2077 2017 2055 2257 2128 1928 2011 2335 2458 2.54PULPW000+PARTICLE 8627 8173 7575 6846 8321 10313 10737 9666 8771 10597 12176 3.84FUELWOOD 987 816 1033 551 797 965 745 1010 1172 1172 940 2.51SAWNHOOD CONIFEROUS 12640 17061 16554 18051 20349 19783 17142 18334 20620 20377 19637 3.17SAWNWOOD NONCONIFEROUS 1607 2801 2494 2756 2514 2395 2037 1896 2017 2428 2287 -.36WOOD-BASED PANELS 5171 6151 6194 6737 7386 7047 6696 6321 6474 6906 7225 1.87PULP FOR PAPER 5199 5697 5578 6705 6852 6654 6210 5612 6726 7068 7183 2.38PAPER ANO PAPERBOARD 10655 13098 13753 15659 17385 17423 18108 17770 19624 21939 22807 6.79
USSR ANO EASTERN EUROPE
AGRICULTURAL PRODUCTS
WHEAT+FLOUR.WHEAT EQUIV. 5335 4164 5443 3969 5002 4170 4380 5092 4042 3805 4610 -1.46RICE MILLED 16 11 11 13 24 33 25 28 38 64 41 16.92BARLEY 1040 943 1725 222 232 336 247 276 276 277 270 -14.05MAIZE 983 1536 1318 1493 554 1325 1770 1326 860 854 977 -2.45MILLET 3 7 3 3 5 6 3 5 4 3 2 -3.57SORGHUM 10 11 5 7 7 5 9 6 4 4 6 -6.58
POTATOES 490 442 682 371 655 322 323 299 185 141 308 -10.27SUGAR,TOTAL IRAN EQUIV.) 438 573 808 953 717 738 631 807 762 871 1086 5.20PULSES 119 112 117 135 145 122 122 112 118 178 207 3.76
SOYBEANS 11 10 32 6 30 5 4 5 5 11 6 -8.53SOYBEAN OIL 2 12 13 7 10 17 14 20 15 35 14 17.03GROUNDNUTS SHELLED BASIS 1 1 2COCONUT OIL 1 1
OILSEED CAKE ANO MEAL 49 14 61 53 20 27 91 100 91 63 140 14.87ORANGES+TANGEK+CLEMEN 1 2 2 1 1
COCJA BEANS 5 12TEA 17 15 22 17 17 20 18 17 26 30 19 3.36
COTTON LINT 601 867 976 865 807 863 928 970 826 653 638 -2.25
TOBACCO UNHANUFACTURED 102 101 99 89 102 103 90 88 85 81 79 -2.54
WOOL GREASY 1 1 1 2 3 3 1 1 1 1 -7.18BOVINE CATTLE 1/ 686 498 540 544 676 577 460 607 705 702 675 1.77SHEEP AND GOATS 1/ 3457 3025 3504 3800 4719 4598 3720 3654 4179 4233 3576 1.58PIGS 1/ 944 720 720 1158 1152 1144 1713 1091 973 857 939 1.70TOTAL MEAT 627 547 658 620 744 738 779 715 758 832 801 3.38
1/ THOUSAND HEAD2/ EXCEPT FJR PULP FOR PAPER ANO PAPER AND PAPERBOARD, ALL FOREST PRUoUCTS ARE EXPRESSED IN THOUSAND CUBIC METRES

ANNEX TABLE 4. (Cont.) VOLUME OF EXPORTS OF MAJOR AGRICULTURAL, FISHERY ANO FOREST PRODUCTS
ANNUALRATE Of
1975 1976 1977 1978 1979 1980 1981 1982 1983 1984 1985 CHANGE1975-85
. ..THOUSAND METRIC TONS ..... PERCENT
TOTAL EGGS IN SHELL 121 101 120 114 104 90 78 59 55 65 46 -9.14
FISHERY PRODUCTS
FISH FRESH FROZEN 606 607 532 561 594 610 496 412 542 531 605 -1.17FISH CURED 19 12 11 15 21 17 11 6 18 6 -24.42SHELLFISH 1 1 1 1 1 2 1 38 72 70 113 73.46FISH CANNED AND PREPARED 45 47 46 37 33 36 35 29 37 38 66 -.09SHELLFISH CANNED+PREPAR 3 2 1 1 1 2 1 2 2 1 3 .64FISH BODY AND LIVER OIL 4 2 1 11FISH MEAL 19 18 14 21 20' 22 12 9 12 8 11 -7.71
FOREST PRODUCTS 2/
SAWLOGS CONIFEROUS 8884 9534 9919 10281 8774 7430 6783 7025 7762 8085 8257 -2.50SAWLOGS NONCONIFEROUS 354 201 315 296 404 384 285 289 315 232 198 -2.47PULPW000+PARTICLE 12146 12401 12155 11375 12066 12162 12428 10730 12086 13862 13872 .92FUELWOOD 235 92 115 141 143 183 94 70 92 121 132 -3.81SAWNWOOD CONIFEROUS 10362 11009 10592 10782 9956 9513 9363 9630 9697 9476 9672 -1.35SAWNWOOD NONCONIFEROUS 749 714 702 752 600 597 539 487 536 564 294 -6.51W000-8ASED PANELS 1588 1702 1791 1875 1842 1827 1683 1548 1598 1437 1518 -1.55PULP FOR PAPER 673 854 856 926 827 895 896 982 1162 1217 1332 5.55PAPER AND PAPERBOARD 1295 1480 1653 1779 1664 1732 1697 1701 1731 1718 1693 1.84
NORTH AMERICA DEVELOPED
AGRICULTURAL PRODUCTS
WHEAT+FLOUR,WHEAT EQUIV. 43589 38974 40736 50841 47174 54495 61342 61264 63319 65263 43504 3.71RICE MILLED 2139 2107 2288 2279 2301 3054 3133 2540 2385 2141 1940 .21BARLEY 4068 5432 4343 4249 4654 4195 6853 7097 7258 5876 2938 1.50MAIZE 33526 44692 40580 50550 59414 63923 56067 49658 48099 49602 44482 2.06MILLET 23 1.5 60 24 28 41 55 39SORGHUM 5848 5797 6139 5184 5950 8050 8032 6051 5325 6828 7239 1.75
POTATOES 369 857 503 282 289 344 395 461 363 296 321 -4.13SUGAR,TOTAL (RAW EQUIV.) 291 122 166 149 135 654 1187 154 323 399 436 10.54PULSES 390 400 374 390 470 913 1141 854 679 635 646 8.15
SOYBEANS 12506 15361 16234 20794 20951 21882 21980 25652 22791 19651 17052 3.72SOYBEAN OIL 355 506 768 916 1110 1081 809 911 786 1043 588 4.80GROUNDNUTS SHELLED BASIS 241 130 302 381 356 285 146 201 224 266 311 .99GROUNDNUT OIL 12 48 45 40. 5 18 20 10 2 7 17 -14.25COCONUT OIL 8 26 17 9 5 19 14 13 11 21 19 3.37OILSEED CAKE ANO MEAL 4105 5370 4740 6793 6845 8009 7471 6917 7517 5563 5619 2.97
BANANAS 187 201 199 201 197 205 217 210 188 202 197 .27ORANGES+TANGER+CLEMEN 481 461 410 356 318 482 443 353 497 374 412 -.66LEMONS AND LIMES 183 225 236 237 173 171 176 135 163 148 144 -4.56
COFFEE GREEN+ROASTED 55 69 106 59 79 79 70 60 43 63 52 -3.08COCOA BEANS 9 10 14 9 9 7 14 14 16 12 11 3.52TEA 4 3 4 5 5 5 4 4 5 5 13 8.59
151
COTTON LINTJUTE AND SIMILAR FIBRES
TOBACCO UNMANUFACTUREDNATURAL RUBBER
WOOL GREASYBOVINE CATTLE 1/SHEEP AND GOATS 1/PIGS 1/TOTAL MEATMILK DRYTOTAL EGGS IN SHELL
FISHERY PRODUCTS
871 779 1017 1347 1527 1823 1269 1392 1205 1497 1097 3.851 1 2 1 -26.32
293 293 314 364 299 293 300 290 264 275 277 -1.3629 29 25 20 21 28 18 16 20 35 41 1.07
1 1 1 1 1 1 7.11421 684 651 592 436 424 441 563 440 479 506 -1.60344 250 214 153 135 144 225 287 226 332 382 3.3447 56 54 201 145 254 171 342 483 1362 1171 39.62472 693 700 721 777 973 1073 987 926 956 1013 6.4717 16 16 7 5 36 37 29 37 19 49 13.1422 22 38 39 30 61 87 64 31 25 22 1.91
FISH FRESH FRUTEN 236 250 354 383 414 418 499 546 494 509 558 8.56FISH CURED 47 62 65 63 64 76 87 89 70 65 70 3.06SHELLFISH 42 48 71 93 133 115 88 80 69 64 79 3.28FISH CANNED AND PREPARED 36 46 52 63 64 81 93 68 82 82 85 8.06SHELLFISH CANNED+PREPAR a 9 9 11 11 11 11 11 4 3 3 -10.00FISH 800Y ANO LIVER OIL 93 91 60 110 101 137 117 98 191 188 133 7.63FISH MEAL 35 63 61 82 40 108 75 42 95 41 58 1.33
FOREST PRODUCTS 2/
SAWLOGS CONIFEROUS 12196 14842 14362 15565 17865 15135 11676 15269 17395 18441 19320 3.03SAWLOGS NONCONIFEROUS 328 470 481 522 630 784 751 506 755 761 602 6.02PULPW000+PARTICLE 68o7 8337 8710 8216 9463 9887 8382 6605 6422 5847 5498 -3.57FUELWOOD 206 162 200 170 98 63 108 85 85 90 89 -5.05SAWNWOOD CONIFEROUS 18553 26379 32305 34492 35407 33612 31770 31423 38296 40879 42219 5.68SAWNWOOD NONCON1FEROUS 807 814 847 1341 1025 1190 1209 1083 1340 1373 1172 4.72
1/ THOUSAND HEAD2/ EXCEPT FOR PULP FOR PAPER AND PAPER AND PAPEROJARD, All FOREST PRODUCTS ARE EXPRESSEU IN THOUSANC CUHIC METRES
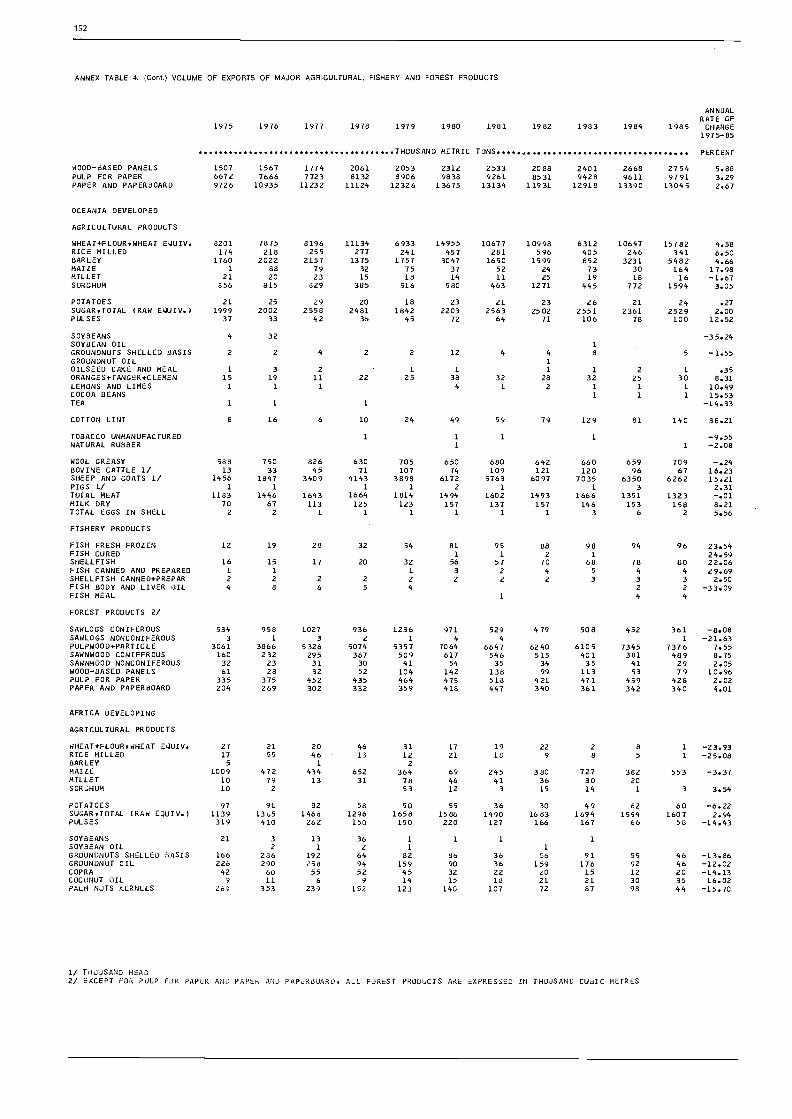
152
ANNEX TABLE 4. (Cont.) VOLUME OF EXPORTS OF MAJOR AGRICULTURAL, FISHERY AND FOREST PRODUCTS
ANNUALRATE GF
1975 1976 1977 1978 1979 1980 1981 1982 1983 1984 1985 CHANGE1975-85
THOUSAND METRIC TONS PERCENT
WOOD-BASED PANELS 1507 1567 1774 2061 2053 2312 2533 2088 2401 2668 2754 5.88PULP FOR PAPER 6672 7666 7723 8132 8906 9838 9261 8531 9428 9611 9791 3.29PAPER AND PAPERBOARD 9726 10935 11232 11124 12326 13675 13134 11931 12918 13390 13045 2.67
OCEANIA DEVELOPED
AGRICULTURAL PRODUCTS
WHEAT+FLOUR,WHEAT EWUIV. 8201 7875 8196 11134 6933 14955 10677 10998 8312 10647 15782 4.58RICE MILLED 174 218 255 277 241 457 281 596 405 246 341 6.50BARLEY 1760 2022 2157 1375 1757 3047 1650 1599 852 3231 5482 4.66MAIZE 1 88 79 32 75 37 52 24 73 30 164 17.98MILLET 21 20 23 15 18 14 11 25 19 18 16 -1.67SORGHUM 856 815 829 385 516 580 463 1271 445 772 1594 3.05
POTATOES 21 25 29 20 18 23 21 23 26 21 24 .27SUGAR,TOTAL IRAW E DIV., 1999 2002 2558 2481 1842 2203 2563 2502 2551 2361 2529 2.00PULSES 37 33 42 3o 45 72 64 71 106 78 100 12.52
SOYBEANS 4 32 -35.24SOYBEAN OIL 1
GROUNDNUTS SHELLED BASIS 2 2 4 2 2 12 4 4 5 -1.55GROUNDNUT OIL i
OILSEED CAKE AND MEAL 1 3 2 1 1 1 1 2 1 .35ORANGES+TANGER+CLEMEN 15 19 11 22 25 38 32 28 32 25 30 8.31LEMONS ANO LIMES 1 1 1 4 1 2 1 1 1 10.49COCOA BEANS 1 1 1 15.53TEA 1 1 1 -14.33
COTTON LINT a 16 6 10 24 49 59 79 129 81 140 38.21
TOBACCO UNMANUFACTURED 1 1 1 1 -9.55NATURAL RUBBER 1 1 -2.08
WOOL GREASY 588 750 826 630 705 650 680 642 660 659 709 -.24BOVINE CATTLE 1/ 13 33 45 71 107 74 109 121 120 96 67 16.23SHEEP AND GOATS 1/ 1456 1847 3409 4143 3898 6172 5763 6097 7035 6350 6262 15.21PIGS 1/ 1 1 1 1 z 1 1 3 2.31TOTAL MEAT 1183 1446 1643 1664 1814 1494 1602 1493 1666 1351 1323 -.01MILK DRY 70 67 113 125 123 157 137 157 146 153 158 8.21TOTAL EGGS IN SHELL 2 z 1 1 1 1 1 1 3 6 2 5.56
FISHERY PRODUCTS
FISH FRESH FROZEN 12 19 28 32 54 81 95 88 98 94 96 23.54FISH CURED 1 1 2 1 24.59SHELLFISH 16 15 17 20 32 56 57 70 68 78 80 22.06FISH CANNED AND PREPARED 1 1 1 3 2 4 5 4 4 29.69SHELLFISH CANNED+PREPAR 2 22 2 2 2 2 3 3 3 2.50FISH BODY AND LIVER OIL 4 a 4 2 2 -33.09FISH MEAL 1 4 4
FOREST PRODUCTS 2/
SAWLOGS CONIFEROUS 534 958 1027 936 1236 971 529 479 508 452 361 -8.08SAWLOGS NONCONIFEROUS 3 1 3 2 1 4 4 1 -21.63PULPWOOD+PARTICLE 3061 3866 5326 5074 5357 7064 6647 6240 6105 7345 7376 7.55SAWNWOOD CONIFEROUS 160 232 295 367 509 617 546 515 401 381 489 8.75SAWNWOOD NONCONIFEROUS 32 23 31 30 41 54 35 34 35 41 29 2.05W000-BASED PANELS 61 28 32 52 104 142 138 99 113 93 79 10.96PULP FOR PAPER 335 375 452 435 464 475 518 421 471 459 428 2.02PAPER ANO PAPERBOARD 204 269 302 332 359 418 447 340 361 342 340 4.01
AFRICA DEVELOPING
AGRICULTURAL PRODUCTS
WHEAT+FLOUR.WHEAT EWUIV. 27 21 20 46 31 17 19 22 2 8 1 -23.93RICE MILLED 17 55 46 13 12 21 18 9 a 5 1 -25.08BARLEY 5 1 ZMAIZE 1009 472 434 652 364 69 245 380 727 382 553 -3.37MILLET 10 79 13 31 78 46 41 36 30 20SORGHUM 10 2 53 12 3 15 14 1 3 3.54
POTATOES 97 91 82 58 50 55 36 30 49 62 60 -6.22SUGAR,TOTAL (RAW EQUIV.) 1139 1365 1468 1296 1658 1586 1490 1683 1694 1594 1607 2.94PULSES 319 410 262 150 150 220 127 166 167 66 58 -14.43
SOYBEANS 21 3 13 36 1 1 1 1
SOYBEAN OIL 2 1 2 1 1
GROUNDNUTS SHELLED BASIS 166 286 192 64 82 86 36 56 91 55 46 -13.86GROUNDNUT OIL 226 290 259 94 159 90 36 159 176 92 46 -12.02COPRA 42 60 55 52 45 32 22 z0 15 12 20 -14.13COCONUT OIL 9 11 6 9 14 15 19 21 21 30 35 16.02PALM NUTS KERNELS 269 353 239 152 123 140 107 72 87 98 44 -15.70
1/ THOUSAND HEAD2/ EXCEPT FOR PJLP FJR PAPER ANO PAPER ANO PAPERBOARD, ALL F R ST PRODUCTS ARE EXPRESSED IN THOUSANC CUdIC METRES

ANNEX TABLE 4. (Cont.) VOLUME OF EXPORTS OF MAJOR AGRICULTURAL, FISHERY AND FOREST PRODUCTS
1975 1976 1977 1978
153
ANNUALRAFE. 1F
1979 1980 1981 1982 1983 1984 1985 CHANGE1975-85
THOUSAND METRIC TONS PERCENT
PALM OIL 209 155 118 96 63 138 85 84 71 73 105 -6.96OILSEED CAKE ANO MEAL 678 760 712 456 668 478 357 487 468 312 356 -7.45
BANANAS 351 317 308 344 292 243 205 187 193 216 221 -6.03ORANGES+TANGER+CLEMEN 592 664 744 873 672 854 715 661 591 582 602 -1.47LEMONS ANO LIMES 1 1 1 2 1 1 1 2 7 5 6 23.48
COFFEE GREEN+ROASTED 1106 1147 877 926 1015 896 964 1051 947 900 1010 -.90COCOA BEANS 818 862 691 778 601 757 970 820 786 890 876 1.32TEA 135 148 165 182 197 180 168 191 200 153 215 3.57
COTTON LINT 271 351 300 312 339 336 334 299 329 367 409 2.21JUTE AND SIMILAR FIARES 1
TOBACCO UNHANUFACTURED 113 141 129 139 132 172 189 148 141 175 172 3.42NATURAL RUBBER 186 159 153 145 142 138 146 151 156 185 189 .77
WOOL GREASY 4 3 4 4 3 4 4 4 4 5 5 2.62ADVINE CATTLE 1/ 1022 1126 1125 1181 1255 1398 1446 1402 1167 1174 965 .43SHEEP AND GOATS 1/ 3515 Z548 2461 3066 3047 3644 3410 3659 3085 2575 3222 .69PIGS 1/ 13 15 2 1 1 1 1 -32.44TOTAL MEAT 102 112 118 99 97 48 44 46 52 51 52 -9.73MILK DRY 1 2 4TOTAL EGGS IN SHELL 1 1 1 1 1 1 -5.12
FISHERY PRODUCTS
FISH FRESH FROLEN 76 76 83 128 117 173 259 281 367 329 193 17.05FISH CURED 29 17 22 22 25 23 19 20 19 13 9 -6.93SHELLFISH 39 43 43 48 34 34 76 90 132 136 135 15.98FISH CANNED AND PREPARED 59 74 69 62 77 79 94 82 101 98 104 5.41FISH BODY AND LIVER OIL 12 7 7 7 7 5 11 3 10 7 -28.86FISH MEAL 83 43 19 39 27 29 28 20 46 31 3 -13.99
FOREST PRODUCTS 2/
SAWLOGS CONIFEROUS 15 11 2 2 2
SAWLOGS NONCONIFEROUS 5012 6309 6434 6211 6175 5971 4599 4723 4547 5076 4211 -3.24PULPW000+PARTICLE 70 127 100 75 112 84 173 173 173 173 173 9.07FUELWOOD 56 47 51 51 51 5 28 28SAWNWOOD CONIFEROUS 97 113 119 116 126 108 94 81 79 82 78 -4.11SAWNW000 NONCGNIFEROUS 625 664 682 706 680 611 520 554 598 681 743 -.17WOOD-BASED PANELS 206 220 241 261 236 272 283 264 287 293 300 3.47PULP FOR PAPER 136 235 173 218. 240 240 229 192 202 252 243 3.09PAPER ANO PAPERBOARD 19 22 19 16 24 21 20 9 a 12 11 -7.94
LATIN AMERICA
AGRICULTURAL PRODUCTS
WHEAT+FLOUR.WHEAT EQUIV. 2054 3345 6095 1833 4427 4621 3960 4043 10411 7491 9760 13.67RICE KILLED 437 535 999 732 573 548 638 512 510 538 473 -1.98BARLEY 28 43 130 18 58 72 32 24 59 95 82 5.77MAIZE 5088 4560 6864 5927 5990 3557 9199 5828 7320 5720 7063 2.89MILLET 94 124 172 196 139 63 136 101 96 54 88 -5.98SORGHUM 2180 3499 4295 4625 3899 1544 5073 5368 5339 4252 3354 3.84
POTATOES 50 99 106 67 77 61 45 44 33 43 56 -6.64SUGAR,TOTAL (RAW EQUIV.) 11107 10533 13050 12429 12726 12031 12698 13020 12957 12841 12180 1.21PULSES 233 312 424 464 395 341 287 286 355 409 365 1.38
SOY8EANS 3435 3934 3441 2845 3814 4493 3909 2877 3270 5168 7197 4.35SOYBEAN OIL 285 562 544 570 609 840 1353 1024 1369 1412 1511 16.46GROUNDNUTS SHELLED BASIS 60 24 53 52 97 97 86 62 106 104 109 10.59GROUNDNUT OIL 38 140 181 155 209 207 80 113 104 57 108 -1.45COPRA 2 2 2 5
COCONUT OIL 5 5 5 9 a 4 5 6 6 17 3 2.02PALM NUTS KERNELS 4 2 3 9 7 5 1 4 4 1 2 -8.67PALM OIL 3 5 3 4 5 1 5 11 14 19 36 24.18OILSEED CAKE ANO MEAL 4299 5798 7354 7676 7497 8891 10912 10498 12366 12158 13407 16.73
BANANAS 4779 4839 5231 5520 5366 5358 5472 5732 5081 5532 5493 1.13ORANGES+TANGER+CLEMEN 190 173 224 269 314 308 318 393 427 410 462 10.11LEMONS AND LIMES 22 25 29 47 74 53 51 34 58 62 103 12.04
COFFEE GREEN+ROASTED 2055 2032 1547 1960 2179 2199 2124 2229 2425 2524 2567 3.29COCOA BEANS 270 209 187 211 226 183 201 247 226 211 296 1.16TEA 23 32 34 41 39 44 35 43 53 54 50 6.84
COTTON LINT 806 607 689 903 733 641 608 600 539 480 665 -3.26JUTE ANO SIMILAR FIARES 1 2 2 1
TOBACCO UNMANUFACTURED 244 255 238 267 276 254 271 273 278 290 269 1.37NATURAL RUBBER 6 7 5 8 4 4 2 3 3 2 2 -10.47
WOOL GREASY 108 92 108 107 80 105 125 108 87 79 69 -2.72
1/ THOUSAND HEAD2/ EXCEPT FUR PULP FUR PAPER AND PAPER AND PAPERBOARD, ALL PUREST PRODUCTS ARE EXPRESSED IN THOUSAND CU8IC METRES

154
ANNEX TABLE 4. (Cont.) VOLUME OF EXPORTS OF MAJOR AGRICULTURAL, FISHERY AND FOREST PRODUCTS
ANNUALRATE CF
1975 1976 1977 1978 1979 1980 1981 1982 1983 1984 1985 CHANGE1975-85
THOUSAND METRIC TONS PERCENT
BOVINE CATTLE 1/ 610 985 983 1551 1277 754 762 929 1044 695 776 -2.67SHEEP AND GOATS 1/ 93 106 112 125 98 65 312 245 589 308 231 15.99PIGS 1/ 42 65 31 24 16 1 2 7 2 -34.57TOTAL MEAT 449 775 778 840 815 747 999 1034 1002 797 823 4.19MILK DRY 16 34 18 10 4 3 11 18 17 2TOTAL EGGS IN SHELL 1 3 3 2 4 12 14 6 3 4 4 11.79
FISHERY PRODUCTS
FISH FRESH FROZEN 145 208 304 370 361 417 367 407 403 367 483 8.87FISH CURED 5 4 7 3 6 a 5 10 4 4 5 .76SHELLFISH 93 97 100 143 169 138 124 161 170 172 172 6.41FISH CANNED AND PREPARED 16 29 48 72 82 144 146 103 56 64 49 10.13SHELLFISH CANNED+PREPAR 3 3 5 2 5 4 4 4 5 6 6 8.19FISH BODY AND LIVER OIL 148 41 49 72 110 107 76 180 25 139 182 5.97FISH MEAL 909 846 743 845 1023 1054 960 1506 1025 1257 1892 6.87
FOREST PRODUCTS 2/
SAWLOGS CONIFEROUS 15 23 167 689 968 1029 377 906 1024 902 1271 46.34SAWLOGS NONCONIFEROUS 55 86 49 60 86 114 65 54 55 68 62 -.35PULPWOOD+PARTICLE 107 115 53 .
FUELWOOD 13 21 106 152 214 167 71 23 57 10 7 -11.15SAWNWOOD CONIFEROUS 1134 1050 1429 1477 1678 1718 1319 1102 1172 1217 1033 -1.18SAWNWOOD NONCONIFEROUS 590 629 838 727 1121 1130 994 892 851 908. 908 3.67WOOD-BASED PANELS 252 326 374 487 488 625 606 608 584 650 656 9.05PULP FOR PAPER 332 382 443 715 1024 1318 1374 1302 1528 1487 1433 17.74PAPER AND PAPERBOARD 155 199 226 276 351 398 497 404 651 939 778 18.36
NEAR EAST DEVELOPING
AGRICULTURAL PRODUCTS
WHEAT+FLOUR,WHEAT EQUIV. 15 27 640 2131 876 540 648 709 1139 992 757 35.22RICE MILLE0 130 256 276 223 211 259 159 59 44 107 30 -16.11BARLEY 12 366 302 50 88 229 424 1026 661 320 97 20.08MAIZE 1 14 8 43 111 155 40 53 10 6MILLET % 6 3 4 z 2 3 8 2 4 1 -7.61SORGHUM 48 75 137 66 196 286 256 423 186 25
POTATOES 209 382 438 292 315 454 394 483 450 489 381 4.96SUGAR,TOTAL (RAW EQUIV.! 58 48 64 55, 37 45 71 219 318 591 329 27.68PULSES 109 121 176 256 303 299 500 573 658 616 399 18.93GROUNDNUTS SHELLED BASIS 218 312 175 111 52 51 108 101 24 44 17 -21.01GROUNDNUT OIL 7 2 26 35 16 33 16 18 2 18 3 -3.60COCONUT OIL 1 1
PALM OIL 1OILSEED CAKE AND MEAL 452 368 252 225 214 261 145 105 104 122 42 -17.26
BANANAS 12 10 5 4 7 19 20 11 10 II 10 4.37ORANGES+TANGER+CLEMEN 697 716 754 643 619 627 759 705 687 710 669 -.12LEMONS AND LIMES 118 162 131 151 149 202 206 208 216 217 158 4.72
COFFEE GREEN+ROASTEDTEA
COTTON LINT
TOBACCO UNMANUFACTURED
3 3 3 3 6 5 6 7 2 2.5844 8 7 10 16 15 17 5 4 3 3 -7.20
856 1004 710 768 669 608 532 584 623 644 483 -5.14
75 86 71 84 77 94 138 110 75 72 106 2.14
WOOL GREASY a 7 12 9 8 7 3 6 6 5 5 -6.52BOVINE CATTLE 1/ 18 11 16 12 21 13 60 112 77 51 28 18.38SHEEP ANO GOATS 1/ 720 828 680 1209 1421 2026 2858 3505 3710 3862 3295 21.78PIGS 3TOTAL HEAT 14 9 It 15 15 22 74 96 74 90 64 28.59MILK DRY 1 1 1 1 1 37.39TOTAL EGGS IN SHELL 12 1 3 7 10 13 18 27 42 71 73 40.33
FISHERY PRODUCTS
FISH FRESH FROZEN 6 4 3 7 17 14 28 30 31 35 28 27.52FISH CURED 12 10 4 3 2 1 1 1 1 1 I -23.22SHELLFISH 7 9 9 a 11 '10 5 7 7 6 10 -1.41FISH CANNED ANO PREPARED 1 3 4 4 5 a 3 3 2 2 1 -6.11SHELLFISH CANNED+PREPAR 2 2 3 1 2 3 4 5 7 a 6 15.61FISH BODY ANO LIVER OIL i 2 1 1 1 2 5 5 24.97FISH MEAL 1 1 1
FOREST PRODUCTS 2/
SAHLOGS CUNIFEROuS 4 3 1 I 1 2 7 11 20 15 31.79SAWLOGS NONCONIFEROUS 17 10 9 5 3 4 36 36 35 100 76 28.56FUELWOOD 21 22 31 22 20 31 24 16 24 17 17 -3.07SAwNWOOD CONIFERouS 49 60 69 60 103 44 96 94 126 107 82 7.06SAWNwOOD NONCONIFERous 1 1 1 2 3 6 12 r 8 5 33.55W000-BASED PANELS 27 29 28 28 24 19 19 24 27 23 23 -1.79
1/ THOUSAND HEAD2/ EXCEPT FOR PULP FUR PAPER ANO PAPER AND PAPEROUARJ, ALL FOREST PROOUCTS ARE EXPRESSEO IN THOUSAND CUOIC METRES

ANNEX TABLE 4. (Con.) VOLUME OF EXPORTS OF MAJOR AGRICULTURAL, FISHERY AND FOREST PRODUCTS
ANNUALRATE OF
1975 1970 1977 1978 1979 1980 1981 1982 1983 1984 1985 CHANGE1975-85
THOUSAND METRIC TONS PERCENT
PULP FOR PAPERPAPER AND PAPERBOARD 9 10 1.1 10 16 21 35 35 41 71 56 24.75
FAR EAST DEVELOPING
AGRICULTURAL PRODUCTS
WHEAT+FLOUR.WHEAT EQUIV. 115 83 264 967 801 510 295 157 247 352 469 7.51RICE MILLED 1862 3534 4732 3043 4965 5331 6033 6050 5495 7020 5776 9.94BARLEY 32 39 13 73 259 275 907 252 1658 134 75.78MAIZE 2276 2483 1768 2196 2146 2342 2721 3030 2859 3473 2904 4.54MILLET 8 1 6 2 2 1 2 1SORGHUM 213 182 138 166 170 208 288 317 248 327 334 7.71
POTATOES 46 95 73 55 99 106 72 72 62 58 55 -1.17SUGARJOTAL (RAW EQUIV.) 2900 3639 4511 2822 3269 2722 2930 4093 3762 3113 2957 -.40PULSES 170 191 181 245 291 312 338 379 318 319 432 8.97
SOYBEANS 32 38 47 30 27 27 27 27 26 23 29 -4.00SOYBEAN OIL 4 2 4 7 6 27 32 49 76 84 45 45.09GROUNDNUTS SHELLED BASIS 86 174 69 24 40 55 113 106 84 72 72 .14GROUNDNUT OIL 9 10 5 6 16 5 5 6 28 .8 9 2.96COPRA 834 878 683 445 193 234 172 232 77 73 143 -21.56COCONUT OIL 760 1004 845 1112 976 1061 1192 1064 1143 779 1045 1.46PALM NUTS KERNELS 33 33 30 13 23 45 24 15 14 13 25 -6.22PALM OIL 1726 1897 2067 2168 2638 3303 2963 3487 3709 3951 4808 10.39OILSEED CAKE AND MEAL 2061 3353 2871 2582 3291 3054 3011 3218 3330 2929 3165 2.21
BANANAS 872 846 738 832 921 972 924 983 684 842 829 -.15ORANGES+TANGER+CLEMEN 137 37 113 65 89 78 50 62 74 69 60 -3.17LEMONS AND LIMES 1 2 1 7 2 3 3 4 44.82
COFFEE GREEN+ROASTED 226 264 267 339 335 370 371 403 409 488 519 7.89COCOA BEANS 15 18 18 24 32 41 65 88 89 120 149 28.03TEA 502 512 499 459 445 537 546 481 483 562 558 1.00
COTTON LINT 244 218 56 128 133 396 415 329 379 207 363 10.04JUTE AND SIMILAR FIBRES 566 646 543 467 521 467 515 453 449 430 277 -5.17
TOBACCO UNMANUFACTURED 198 210 232 224 212 198 259 238 205 197 173 -.88NATURAL RUBBER 2737 2967 3027 3080 3179 3101 2924 2886 3205 3348 3365 1.35
WOOL GREASY 1 Z 1, 1 1 1 -9.23BOVINE CATTLE 1/ 74 73 98 78 66 60 36 39 66 76 78 -2.43SHEEP ANO GOATS 1/ 28 80 215 70 100 120 60 26 4 23 56 -13.39PIGS 1/ 11 23 11 15 19 18 24 129 160 113 187 35.31TOTAL MEAT 33 44 60 68 95 90 103 127 96 103 118 12.08MILK DRY 4 5 5 7 10 13 10 10 9 11 13 11.71TOTAL EGGS IN SHELL 5 6 10 6 5 5 11 8 6 16 20 9.65
FISHERY PRODUCTS
FISH FRESH FROZEN 418 291 542 559 552 569 539 447 538 442 545 2.31FISH CURED 32 30 27 32 27 28 27 29 28 37 38 1.50SHELLFISH 228 288 293 319 362 313 328 378 384 439 472 5.98FISH CANNED ANO PREPARED 18 27 37 49 47 55 80 100 112 146 177 23.59SHELLFISH CANNED+PREPAR 27 21 38 35 36 50 55 61 68 72 77 13.14FISH BODY AND LIVER OIL 1 1 1 3 2 2 1 1 1 1 2 -1.63FISH MEAL 57 84 117 141 164 153 151 141 154 157 160 7.91
FOREST PRODUCTS 2/
SAWLOGS CONIFEROUS 356 423 394 270 396 327 291 127 109 107 38 -18.41SAWLOGS NONCONIFEROUS 28203 35758 37017 38457 35843 31534 24005 24286 23128 19372 20789 -5.92PULPW000+PARTICLE 930 697 1033 860 736 1003 1033 909 1001 605 447 -3.47FUELWOOD 706 810 841 731 799 1181 1164 1086 1229 1208 1186 6.09SAWNWOOD CONIFEROUS 134 251 258 425 481 410 254 197 138 186 214 -2.60SAWNWOOD NONCONIFEROUS 3298 5551 5374 5463 7236 6415 5511 5838 7003 6469 6244 4.14WOOD-BASED PANELS 2512 3110 3198 3342 3159 2933 3590 3428 4772 5059 5499 6.80PULP FOR PAPER 2 3 2 2 6 6 10 8 9 15 16 25.22PAPER ANO PAPERBOARD 104 175 139 154 146 291 301 222 212 224 293 8.39
ASIAN CENT PLANNED ECON
AGRICULTURAL PRODUCTS
WHEAT+FLOUR.WHEAT EQUIV. 4 4 6 8 9 467 75 83 35.23RICE MILLED 2324 1540 1488 2096 1836 1637 94: 994 1279 1466 1050 -5.98BARLEY 6 2 1 2 1 7 2
MAIZE 315 430 356 230 240 104 141 96 92 1043 6391 11.78MILLET 56 52 37 30 20 5 1 2 2 10 -30.31SORGHUM 10 1 3 4 4 150
POTATOES 50 55 53 62 81 77 80 89 78 72 61 3.75SUGAR.TOTAL (RAW EQUIV.) 639 674 777 493 514 657 440 463 257 189 403 -9.51
1/ THOUSAND HEAD2/ EXCEPT FOR PULP FOR PAPER AND PAPER ANO PAPERDUARD, ALL FOREST PRODUCTS ARE EXPRESSED IN THUUSAND CUBIC METRES
155
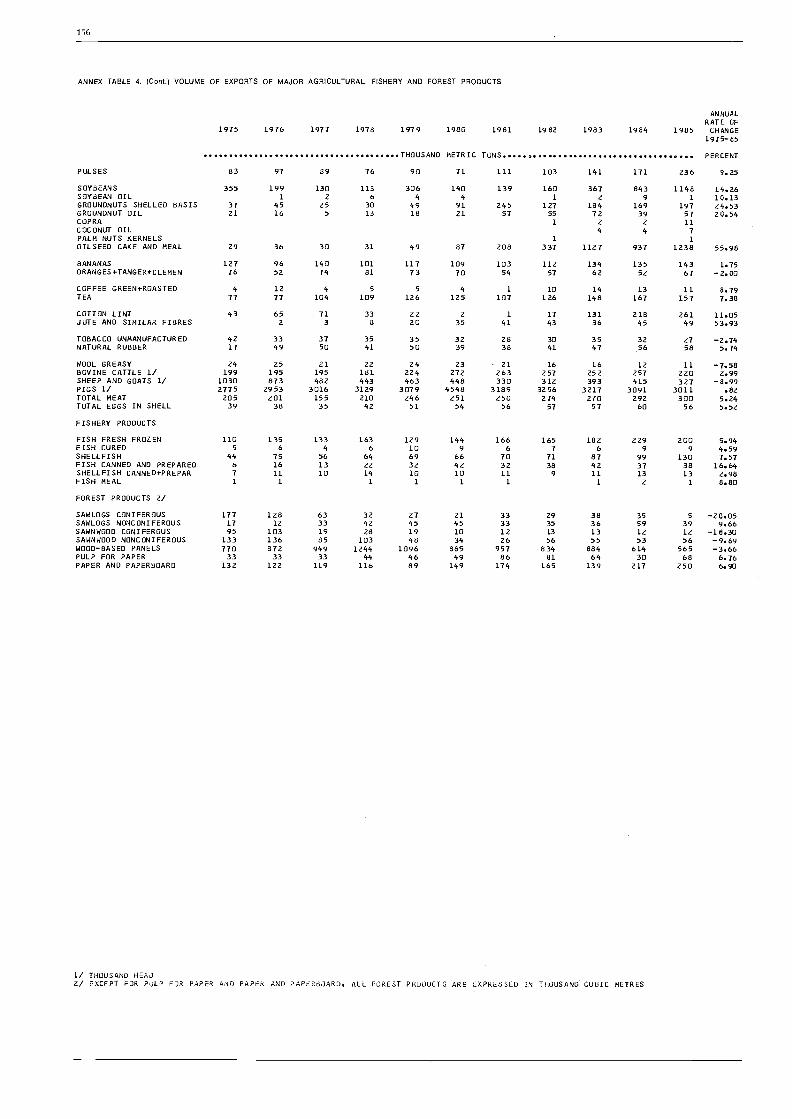
1S6
ANNEX TABLE 4. (Cont.) VOLUME OF EXPORTS OF MAJOR AGRICULTURAL, FISHERY AND FOREST PRODUCTS
ANNUALRATE OF
1975 1976 1977 1978 1979 1980 1981 1982 1983 1984 1985 CHANGE1975-85
THOUSAND METRIC TONS PERCENT
PULSES 83 97 89 76 90 71 111 103 141 171 236 9.25
SOYBEANS 355 199 130 113 306 140 139 160 367 843 1148 14.26SOYBEAN OIL I 2 b 4 4 1 2 9 1 10.13GROUNDNUTS SHELLED BASIS 37 45 25 30 49 91 245 127 184 169 197 24.53GROUNDNUT OIL 21 16 5 13 18 21 57 55 72 39 57 20.54COPRA 1 2 2 11COCONUT OIL 4 4 7PALM NUTS KERNELS 1 1
OILSEED CAKE AND MEAL 29 36 30 31 49 87 208 337 1127 937 1238 55.98
BANANAS 127 96 140 101 117 109 103 112 134 135 143 1.75ORANGES+TANGER+CLEMEN 76 52 74 81 73 70 54 57 62 52 67 -2.00
COFFEE GREEN+ROASTED 4 12 4 5 5 4 1 10 14 13 11 8.79TEA 77 77 104 109 126 125 107 126 148 167 157 7.38
COTTON LINTJUTE AND SIMILAR FIBRES
43 65 71 33 22 217 131 218 261 11.052 3 8 20 35 41 43 36 45 49 53.93
TOBACCO UNMANUFACTURED 42 33 37 35 35 32 28 30 35 32 27 -2.74NATURAL RUBBER 17 49 50 41 50 39 38 41 47 .56 58 5.74
WOOL GREASY 24 25 21 22 24 23 21 16 16 12 11 -7.58BOVINE CATTLE 1/ 199 195 195 181 224 272 263 257 252 257 220 2.99SHEEP AND GOATS I/ 1030 873 482 443 463 448 330 312 393 415 327 -8.99PIGS I/ 2775 2953 3016 3129 3079 4548 3189 3256 3217 3091 3011 .82TOTAL MEAT 205 201 155 210 246 251 250 274 270 292 300 5.24TOTAL EGGS IN SHELL 39 38 35 42 51 54 56 57 57 60 56 5.52
FISHERY PRODUCTS
FISH FRESH FROZEN 110 135 133 163 129 144 166 165 182 229 200 5.94FISH CURED 5 6 4 6 10 9 6 7 6 9 9 4.59SHELLFISH 44 75 56 64 69 66 70 71 87 99 130 7.57FISH CANNED AND PREPARED 6 16 13 22 32 42 32 38 42 37 38 16.64SHELLFISH CANNED+PREPAR 7 11 10 14 10 10 11 9 11 13 13 2.98FISH MEAL 1 1 1 1 1 1 1 2 1 8.80
FOREST PRODUCTS 2/
SAWLOGS CONIFEROUS 177 128 63 32 27 21 33 29 38 35 5 -20.05SAWLOGS NONCONIFEROUS 17 12 33 42 45 45 33 35 36 59 39 9.66SAWNWOOD CONIFEROUS 95 103 19 28 19 10 12 13 13 12 12 -18.30SAWNWOOD NONCONIFEROUS 133 136 85 103 48 34 26 56 55 53 56 -9.69WOOD-BASED PANELS 770 872 949 1244 1096 885 957 834 884 614 565 -3.66PULP FOR PAPER 33 33 33 44 46 49 86 81 64 30 68 6.76PAPER AND PAPERBOARD 132 122 119 116 89 149 174 165 139 217 250 6.90
1/ THOUSAND HEAD2/ EXCEPT FOR PULP FOR PAPER AND PAPER AND PAPEROJARD, ALL FOREST PRODUCTS ARE EXPRESSED IN THOUSAND' COMIC METRES
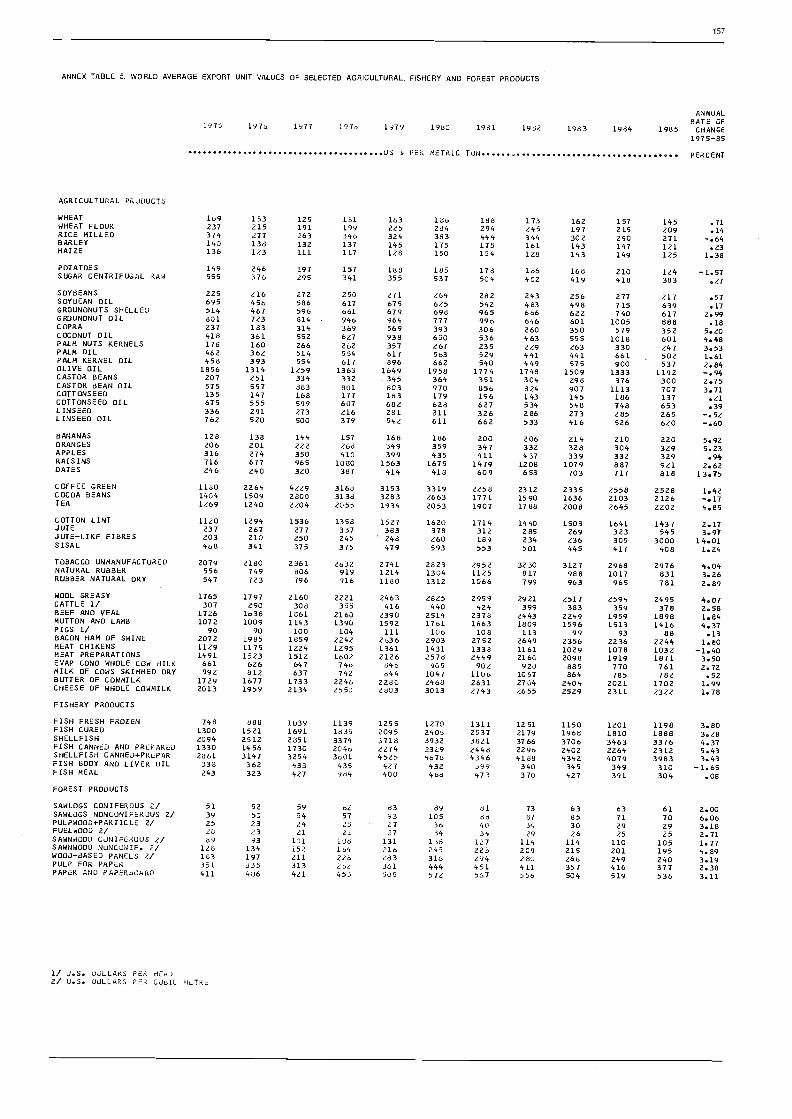
ANNEX TABLE 5. WORLD AVERAGE EXPORT UNT VALUES OF SELECTED AGMCULTURAL, FISHERY AND FOREST PRODUCTS
ANNUALRATE OF1975 1976 1977 1970 1979 1960 1981 1982 1983 1984 1985 CHANGE1975-85
US $ PER METRIC. TON PERCENT
AGRICULTURAL PRODUCTS
WHEAT 169 153 125 131 163 130 168 173 162 157 145 71WHEAT FLOUR 237 215 191 199 225 264 294 245 197 215 209 .14RICE MILLED 374 277 263 Jeto 324 383 444 344 302 250 271 -.64BARLEY 140 138 132 137 145 175 175 161 143 147 121 .23MAIZE 136 123 111 117 128 150 154 128 143 149 125 1.38
POTATOESSUGAR CENTRIFUGAL RAW
157
149 246 197 157 188 185 176 186 168 210 124 -1.57555 376 295 341 355 537 504 402 419 418 383 .27
SOYBEANS 225 216 272 250 271 264 282 243 256 277 217 .57SOYBEAN OIL 695 456 586 617 675 625 542 483 498 715 639 .17GROUNDNUTS SHELLED 514 467 596 661 679 696 965 666 622 740 617 2.99GRDUNDNUT OIL 801 723 814 946 964 777 990 646 601 1005 888 .18COPRA 237 183 314 369 569 393 306 260 350 579 352 5.20COCONUT OIL 418 361 552 627 938 650 536 463 555 1018 601 4.48PALM NUTS KERNELS 176 160 266 262 357 267 235 229 263 330 247 3.53PALM OIL 462 362 514 554 617 563 529 441 441 661 502 1.61PALM KERNEL OIL 458 393 554 617 896 662 540 449 575 900 537 2.84OLIVE OIL 1856 1314 1259 1363 1649 1958 1774 1748 1509 1333 1192 -.94CASTOR BEANS 207 251 334 332 .345 364 351 304 298 376 300 2.75CASTOR 6EAN OIL 575 557 883 801 603 970 856 824 907 1113 707 3.71COTTONSEED 135 147 168 177 183 179 196 143 145 186 137 .21COTTONSEED OIL 675 555 599 607 682 628 627 534 548 748 653 .39LINSEED 336 291 273 216 281 311 326 286 273 285 265 -.52LINSEED OIL 762 520 500 379 542 611 662 533 416 526 620 -.60
BANANAS 128 138 144 157 168 186 200 206 214 210 220 5.92ORANGES 206 201 222 266 349 359 347 332 328 304 329 5.23APPLES 316 274 350 410 399 435 411 437 339 332 329 .94RAISINS 716 677 965 1080 1563 1675 1479 1208 1079 887 921 2.62DATES 246 240 320 387 414 418 609 653 703 717 818 13.75
COFFEE GREEN 1180 2264 4229 3168 3153 3319 2258 2312 2335 2558 2528 1.42COCOA BEANS 1404 1509 2800 3138 3283 2663 1771 1590 1636 2103 2126 -.17TEA 1269 1240 2204 2055 1934 2053 1907 1788 2008 2645 2202 4.85
COTTON LINT 1120 .1294 1536 1358 1527 1620 1714 1440 1503 1641 1437 2.17JUTE 237 267 277 337 383 378 312 285 269 323 545 3.97JUTE-LIKE FIBRES 203 210 250 245 ' 248 260 189 234 236 305 3000 14.01SISAL 468 341 375 375 479 593 553 501 445 417 408 1.24
TOBACCO UNMANUFACTURED 2079 2180 2361 2o32 2741 2823 2952 3230 3127 2968 2976 4.04NATURAL RUBBER 556 749 806 919 1214 1304 1125 817 988 1017 831 3.26RUBBER NATURAL ORY 547 723 796 916 1180 1312 1066 799 963 965 781 2.89
WOOL GREASY 1765 1797 2160 2221 2463 2825 2959 2921 2517 2594 2495 4.07CATTLE 1/ 307 290 308 355 416 440 424 399 383 359 378 2.58BEEF AND VEAL 1726 1638 1861 2160 2390 2514 2378 2443 2249 1959 1898 1.84MUTTON ANO LAMB 1072 1009 1143 1390 1592 1761 1863 1809 1596 1513 1416 4.37PIGS 1/ 90 90 100 104 111 106 108 113 99 93 88 .13BACON HAM OF SWINE 2072 1985 1859 2242 2636 2903 2752 2649 2356 2236 2244 1.80MEAT CHIKENS 1129 1175 1224 1295 1361 1431 1338 1161 1029 1078 1032 -1.40NEAT PREPARATIONS 1491 1523 1512 1602 2126 2576 2449 2160 2098 1919 1871 3.50EVAP CONO WHOLE COW MILK 661 626 647 74u 846 905 902 920 885 770 761 2.72MILK OF COWS SKIMMED DRY 992 812 637 742 844 1047 1106 1057 864 785 782 .52BUTTER OF COWMILK 1729 1677 1733 2246 2280 2466 2631 2704 2404 2021 1702 1.99CHEESE OF WHOLE COWMILK 2013 1959 2134 2550 2603 3013 2743 2655 2529 2311 2322 1.78
FISHERY PRODUCTS
FISH FRESH FROZEN 748 868 1039 1139 1255 1270 1311 1251 1150 1201 1198 3.80FISH CURED 1300 1521 1691 1835 2095 2405 2537 2179 1968 1810 1888 3.28SHELLFISH 2094 2512 2851 3374 3718 3932 3821 3766 3706 3463 3376 4.37FISH CANNED ANU PREPARELI 1330 1456 1730 204o 2274 2329 2448 2296 2402 2264 2312 5.43SHELLFISH CANNED+PREPAR 2861 3147 3254 3601 4525 4675 4346 4188 4342 4079 3983 3.43FISH BODY AND LIVER OIL 338 362 433 435 427 432 399 340 345 349 310 -1.65FISH MEAL 243 323 427 984 400 466 473 370 427 391 304 .08
FOREST PRODUCTS
SAWLOGS CONIFEROUS 2/ 51 52 59 62 83 89 81 73 63 63 61 2.00SAWLOGS NONCONIFEROUS 2/ 39 50 54 57 93 105 88 87 85 71 70 6.06PULPWOOD+PARTICLE 2/ 25 23 24 25 27 36 40 34 30 29 29 3.18FUELWOOD 2/ 20 23 21 21 27 34 34 29 26 25 25 2.71SAWNWOOD CONIFEROUS 2/ 89 93 101 108 131 138 127 114 114 110 105 1.77SAWNWOOD NUNCOWIF. 2/ 128 134 152 164 216 245 223 209 215 201 195 4.89WOOD-BASED PANELS 2/ 103 197 211 220 283 316 294 260 268 249 240 3.19PULP FOR PAPER 351 335 313 2bt 361 444 451 411 357 416 377 2.38PAPER ANO PAPER3OARD 411 406 421 453 505 572 567 556 504 519 536 3.11
1/ D.S. DOLLARS PE6 HEAD2/ U.S. DOLLARS PER C.J011 M.TRE

158
ANNEX TABLE 6. VOLUME OF IMPORTS OF MAJOR AGRICULTURAL, FISHERY AND FOREST PRODUCTS
ANNUALRATE OF
1975 1976 1977 1978 1979 1980 1981 1982 1983 1984 1985 CHANGE1975..85
THOUSAND METRIC TONS PERCENT
1! THOUSAND HEAD2/ EXCEPT FOR PULP FOR PAPER AND PAPOR AND PAPERBOARD, ALL FOREST PRODUCTS ARE EXPRESSED IN THOUSAND CUBIC METRES
WORLD
AGRICULTURAL PRODUCTS
WHEAT+FLOUR,WHEAT EQUIV. 73950 72258 70922 80087 85540 97876 103020 107775 106010 116653 102605 5.16RICE MILLED 7553 9158 9955 10164 12165 12933 13794 11472 12066 11478 11875 3.81BARLEY 12512 13703 12355 14749 14767 15011 18633 18670 17691 22726 20080 5.77MAIZE 51708 61873 55050 67879 74971 79204 80186 69276 69293 67726 68572 2.37MILLET 319 314 359 346 331 263 202 229 217 178 179 -.-7.00
SORGHUM 9339 10605 10928 10432 10208 11014 13751 13500 10998 12875 11793 2.56
POTATOES 3758 4329 4724 3906 4569 4678 4713 5135 4758 4771 5197 2.40SUGAR,TOTAL (RAW EQUIV.1 22090 22660 27511 24525 26480 27107 28372 29534 28135 28185 27141 2.22PULSES 1864 1876 2054 2066 2355 2921 3192 2946 3045 3424 3767 7.66
SOYBEANS 16313 19983 19623 23411 26125 27048 26294 28533 26785 24704 25419 4.08
SOYBEAN OIL 1374 1616 2078 2404 2873 3244 3252 3698 3721 4144 3426 10.59GROUNDNUTS SHELLED BASIS 889 1030 815 805 777 709 720 814 762 747 805 -1.84GROUNDNUT OIL 428 512 596 475 474 513 358 413 507 321 348 -3.52COPRA 1033 1215 919 804 458 465 393 477 252 311 364 -43.34COCONUT OIL 955 1412 1096 1255 1198 1125 1399 1292 1295 1049 1156 .44PALM NUTS KERNELS 278 349 292 169 161 182 161 123 127 124 98 -10.77PALM OIL 1884 2018 2471 2318 2701 3411 3225 3694 3910 3968 4877 9.46OILSEED CAKE AND MEAL 14911 18475 19221 21972. 23854 25376 27069 28436 33112 29334 31998 7.49
BANANAS 6311 6346 6582 6875 7039 6735 6781 6760 6067 6586 7087 .38
ORANGES+TANGER+CLEMEN 4991 5188 5288 4971 5067 5241 5023 5160 5155 5237 4929 -.03LEMONS AND LIMES 830 936 912 961 965 991 969 1049 1004 1001 1008 1.57
COFFEE GREEN+ROASTED 3677 3777 3126 3435 3912 3790 3815 3880 4006 4049 4237 1.79COCOA BEANS 1192 1160 1006 1096 1026 1068 1242 1270 1262 1324 1459 2.49TEA 806 846 901 832 891 923 884 891 914 1035 1013 1.94
COTTON LINT 4083 4106 4037 4503 4521 5069 4419 4502 4354 4496 4519 .98JUTE AND SIMILAR FIBRES 579 682 563 492 572 574 534 575 509 387 360 .18
TOBACCO UNMANUFACTURED 1301 1298 1258 1424 1394 1405 1442 1409 1381 1432 1410 .99NATURAL RUBBER 3129 3274 3388 3351 3493 3391 3281 3132 3425 3706 3667 1.03
WOOL GREASY 844 1034 870 883 919 853 872 834 842 818 947 -...57
BOVINE CATTLE 1/ 6194 6581 6667 7216 7216 6664 6919 7286 7013 6774 6699 .58
PIGS 1/ 6375 6802 6688 7749 8084 10498 9715 9022 9324 9928 9968 4.87TOTAL MEAT 5541 6041 6617 6944 7569 7892 8397 8662 8669 8508 8949 4.77MILK DRY 272 345 475 473 516 590 590 574 520 589 585 6.34TOTAL EGGS IN SHELL 529 516 573 636 674 742 766 824 821 821 772 5.10
FISHERY PRODUCTS
FISH FRESH FROZEN 2833 2989 3064 3385 3664 4239 4436 4472 4675 4810 4955 6.29FISH CURIO 377 367 305 329 365 400 397 362 414 415 408 1.91SHELLFISH 825 945 894 1070 1217 1120 1138 1242 1364 1517 1573 6.20FISH CANNED ANO PREPARED 733 889 797 875 922 1017 1062 959 894 907 961 1.93SHELLFISH CANNED+PREPAR 129 146 154 159 160 172 183 200 221 229 238 6.10FISH BODY AND LIVER OIL 631 613 569 653 763 752 737 796 729 894 1032 4.72FISH MEAL 2288 2199 2239 2090 2469 2266 2051 2518 2287 2275 2631 .99
FOREST PRODUCTS 2/
SAWLOGS CONIFEROUS 24330 27708 29302 29858 31516 28054 23839 26398 30398 31127 33231 1.47SAWLOGS NONCONIFEROUS 35772 44190 46214 47651 48228 42216 35096 32778 33529 30949 29842 -3.89PULPW000+PARTICLE 31445 32398 36670 34187 39249 43086 41366 36452 37634 41357 41752 2.44FUELWOOD 3015 2921 3082 2769 2908 3112 2533 3118 3481 3860 4026 2.79SAWNWOOD CONIFEROUS 42394 54302 60767 65298 67388 63311 58325 59664 67629 70117 72391 3.42SAWNWOOD NONCONIFEROUS 7982 10400 11240 11669 13257 12662 11264 10847 11941 12340 12222 2.47N000-8ASED PANELS 12380 14559 14548 15866 16789 15657 16637 15468 16885 17865 18801 3.04PULP FOR PAPER 13666 15497 15533 17563 18799 19316 18517 17299 19567 20419 20839 3.57PAPER ANO PAPERBOARD 23005 26572 27816 30466 32283 33601 34024 33613 35541 39156 40529 5.00
WESTERN EUROPE
AGRICULTURAL PRODUCTS
WHEAT+FLOURFWHEAT EQUIV. 12459 13184 12602 13384 12981 14127 13336 13964 10586 12624 15529 .47
RICE MILLED 793 1212 1294 1461 1299 1291 1490 1687 1559 1703 1894 6.27BARLEY 5477 6329 6136 6567 5105 5247 5966 6194 6665 5119 4560 -1.33MAIZE 25301 26440 26733 24757 25117 23455 21740 21103 18873 15992 15025 -5.42MILLET 112 90 182 195 150 98 109 122 110 99 126 -1.65SORGHUM 2767 3017 2216 1453 1196 1273 1103 2149 685 1145 246 -15.71
POTATOES 2372 3150 2999 2565 2808 3051 3026 32 28 3167 3235 3630 2.70SUGARJOTAL (RAW EQUIV.) 5275 4608 4235 3521 3459 3139 3074 3195 3148 3789 3119 -4.11PULSES 795 821 888 907 1054 1014 924 1067 1306 1429 1867 7.38
SOYBEANS 10524 11719 11612 14201 15311 16249 14414 16454 15009 13575 13780 2.71

ANNEX TABLE 8. (ConL) VOLUME OF IMPORTS OF MAJOR AGRICULTURAL, FISHERY AND FOREST PRODUCTS'
ANNUALRATE OF
1975 1976 1977 1.976 1979 1980 1981 1982 1983 1984 1985 CHANGE1975-85
THOUSAND METRIC TONS PERCENT
SOYBEAN OIL 575 532 502 559 580 675 643 681 743 702 683 3.36GROUNDNUTS SHELLED BASIS 603 726 558 541 528 414 389 431 385 396 423 -5.37GROUNDNUT OIL 338 351 355 325 407 446 297 349 396 255 274 -1.95COPRA 816 961 670 515 294 253 184 280 113 132 133 -19.61COCONUT OIL 281 427 331 395 390 414 561 537 512 372 420 3.46PALM NUTS KERNELS 260 327 271 153 137 147 140 106 96 100 79 -12.32PALM OIL 797 860 829 781 856 833 723 735 859 718 832 -.63OILSEED CAKE ANO MEAL 10102 12778 12863 15320 16704 17397 18205 19297 21471 19780 22424 7.37
BANANAS 2332 2256 2430 2525 2460 2221 2172 2178 2018 2183 2305 -1.06ORANGES+TANGER+CLEMEN 3198 3245 3322 3143 3227 3229 2969 3185 3118 3298 3010 -.44LEMONS ANO LIMES 398 432 408 428 432 429 416 452 451 431 449 .89
COFFEE GREEN+ROASTED 1747 1811 1543 1703 1955 1930 1999 1997 2061 1998 2098 2.32COCOA BEANS 564 566 561 590 569 616 664 721 649 738 793 3.48TEA 289 297 336 250 278 297 244 287 266 306 277 -.59
COTTON LINT 1189 1320 1154 1216 1150 1259 1017 1147 1246 1251 1342 .32JUTE AND SIMILAR FI8RES 177 232 208 157 182 132 120 97 85 88 54 -11.84
TOBACCO UNMANUFACTURED 677 695 677 785 743 701 679 670 682 670 678 -.47NATURAL RUBBER 875 941 950 861 925 892 838 844 830 865 935 -.50
WOOL GREASY 391 528 418 437 444 399 394 353 316 395 422 -1.96BOVINE CATTLE 1/ 3445 3306 3175 3472 3529 3404 3210 3478 3401 3336 3725 .49PIGS 1/ 3314 3629 3284 3875 4382 5202 5496 4680 4889 4879 4977 4.66TOTAL MEAT 3106 3333 3461 3776 3790 3761 3500 3778 3889 3835 4197 2.15MILK DRY 97 125 108 115 137 156 132 145 147 145 135 3.33TOTAL EGGS IN SHELL 311 307 327 366 399 431 431 445 441 467 466 4.71
FISHERY PRODUCTS
FISH FRESH FROZEN 1147 1130 1.230 1335 1474 1599 1613 1710 1568 1621 1.660 4.27FISH CURED 158 156 158 165 191 196 174 172 210 209 207 3.11SHELLFISH 295 333 277 349 372 416 414 478 520 598 635 8.33FISH CANNED AND PREPARED 273 310 296 286 312 335 337 317 350 361 365 2.62SHELLFISH CANNED+PREPAR 60 64 68 73 80 87 86 90 97 97 101 5.40FISH BODY AND LIVER OIL 558 538 511 584 666 666 637 706 613 813 889 4.53FISH MEAL 1204 1187 1115 1104 1245 1182 1027 1288 1250 1165 1230 .45
FOREST PRODUCTS 2/
SAWLOGS CONIFEROUS 3221 4417 4890 4094 4547 5103 4507 4660 4495 4356 4756 1.73SAWLOGS NONCONIFEROUS 6985 8858 8793 7715 8044 8424 6889 6139 6174 6337 6032 -3.35PULPW000+PARTICLE 17920 17252 16718 15037 17463 20877 22039 19447 19125 22488 23729 3.34FUELWOOD 1963 1956 1940 1673 1784 2016 1539 1851 2216 2490 2631 2.66SAWNWOOD CONIFEROUS 17176 23111 22096 23684 27274 25507 21507 22714 23839 22948 21753 .97SAWNWOOD NONCONIFEROUS 3620 5435 5521 5620 6724 6088 4933 4891 5386 5322 5516 1.24WOOD-BASED PANELS 6076 7564 7524 8440 9652 8951 8956 8462 8980 9491 9930 3.54PULP FOR PAPER 7293 8441 8270 9435 10034 10013 9531 8807 9581 10057 10293 2.46PAPER AND PAPERBOARD 9907 12368 12631 13602 15046 15107 15728 15742 17318 18745 19002 5.80
USSR AND EASTERN EUROPE
AGRICULTURAL PRODUCTS
WHEAT+FLOUR,WHEAT EQUIV. 13457 13099 11996 13101 16167 21293 24583 27256 26829 31340 23559 10.10RICE MILLED 543 647 725 710 940 994 1599 1127 601 490 585 .13BARLEY 3283 4118 2225 4137 4559 4311 6007 3247 3531 3326 5911 3.01MAIZE 9131 17664 7493 17809 20175 18863 22075 14959 7837 13415 18059 2.01MILLET 1 1 1 1 1 1 1
SORGHUM 310 1041 705 830 229 1567 3967 2709 2078 1990 1452 18.61
POTATOES 514 368 664 301 512 297 330 481 158 136 210 -10.54SUGAR,TOTAL (RAW EQUIV., 3949 4596 5634 4667 4933 5825 6426 8146 7028 6935 5515 4.99PULSES 59 39 33 39 41 62 85 60 35 77 42 2.59
SOYBEANS 520 2089 1544 1409 2360 1707 1653 1906 1938 1205 1122 2.37SOYBEAN OIL 31 72 94 103 126 154 198 316 256 199 387 22.62GROUNDNUTS SHELLED BASIS 59 54 59 57 46 54 61 67 54 68 72 1.98GROUNDNUT OIL 4 2 Z 2 1 1 1 1 -14.57COPRA 29 25 38 26 18 20 10 14 14COCONUT OIL 42 93 48 66 58 89 77 99 79 6: 60 2.88PALM NUTS KERNELS 4 4 4 4 3 4PALM OIL 17 28 67 58 113 112 184 384 329 292 250 33.56OILSEED CAKE AND MEAL 3541 3592 3704 3699 4033 4599 5331 5069 6685 4156 4447 4.08
BANANAS 267 224 281 299 298 269 232 155 167 200 217 -4.12ORANGES+TANGER+CLEMEN 715 693 727 719 690 748 688 645 640 610 691 -1.17LEMONS AND LIMES 310 330 314 326 309 333 308 363 291 286 284 -.93
COFFEE GREEN+ROASTED 205 199 201 178 201 228 203 207 214 236 260 2.19COCOA BEANS 280 256 175 202 198 201 199 178 243 246 248 -.03TEA 88 82 80 71 79 102 116 107 110 129 151 6.25
COTTON LINT 769 679 720 681 718 743 638 693 764 841 829 1.21
1/ THOUSAND HEAD2/ EXCEPT FOR PULP FJR PAPER AND PAPER AND PAPERBOARD, ALL FOREST PRODUCTS ARE EXPRESSED IN THOUSAND CUBIC METRES
159

160
ANNEX TABLE 6. (Cont.) VOLUME OF IMPORTS OF MAJOR AGRICULTURAL, RSHERY AND FOREST PRODUCTS
JUTE ANO SIMILAR FIBRES
TOBACCO UNMANUFACTURED 147 126 133 135 133 178 196 201 189 202 184 4.89
NATURAL RUBBER 473 485 409 433 437 441 418 360 446 435 358 -1.79
WOOL GREASY 162 162 161 182 188 182 174 173 219 135 160 -.02
BOVINE CATTLE 1/ 506 195 224 84 176 180 169 167 190 216 173 -3.68
PIGS 1/ 185 59 291 507 442 479 844 565 637 519 532 16.95
TOTAL HEAT 545 416 757 267 646 956 1228 1091 1132 916 825 9.41
MILK DRY 23 28 43 29 42 71 78 90 47 58 70 11.10
TOTAL EGGS IN SHELL 52 37 43 43 47 43 34 36 31 28 21 -6.43
FISHERY PRODUCTS
FISH FRESH FROZEN 141 180 138 202 210 251 145 115 382 468 551 11.70
FISH COREO 24 28 18 17 15 20 26 20 40 30 36 5.32
FISH CANNED ANO PREPARED 41 52 41 39 34 38 39 37 34 32 47 -1.55FISH BODY AND LIVER OIL 34 4 7 6 5 22 13 25 16 23 46 14.82
FISH MEAL 498 445 407 384 476 310 233 291 218 214 250 -8.28
FOREST PRODUCTS 2/
SAWLOGS CONIFEROUS 830 787 885 960 720 1050 960 498 655 629 606 -3.92
SAWLOGS NONCONIFEROUS 588 556 556 442 416 454 487 385 367 375 405 -4.29
PULPW000+PARTICLE 1722 1548 1440 1345 1446 1583 1390 1248 1286 1323 1248 -2.48
FUEL WOOD 32 31 31 27 25 25 25 20 25 25 12 -6.25
SAWNWOOD CONIFEROUS 3599 2702 3157 3228 2644 2665 2884 2774 2642 2862 3199 -1.00
SAWNWOOD NONCONIFEROUS 442 366 363 326 268 274 331 213 226 222 214 -6.74
WOOD-BASED PANELS 1245 1386 1314 1132 1045 1137 1115 942 826 762 812 -5.50
PULP FOR PAPER 1106 1040 1027 1053 1021 1173 1093 1031 1101 1067 1253 .88
PAPER AND PAPERBOARD 1713 1706 1712 1709 1784 2044 1968 1965 1729 1689 1763 .46
NORTH AMERICA DEVELOPED
AGRICULTURAL PRODUCTS
WHEAT+FLOUR.WHEAT EQUIV. 17 23 35 1 5 6 1 57 53 101 272 29.48
RICE MILLED 74 80 80 82 91 94 106 126 128 141 174 8.51
BARLEY 307 195 180 108 157 140 127 198 141 146 105 -5.51
MAIZE 818 838 623 476 849 1228 1276 807 352 541 567 -3.42
MILLET 1 -2.65
SORGHUM 1 2 7 22.69
POTATOES 208 213 301 235. 242 212 340 344 278 303 330 4.27
SUGARITOTAL (RAW EQUIV.I 4492 5054 6383 4835 5406 4595 5459 3471 3665 4163 3672 -3.66
PULSES 44 34 53 43 39 43 61 47 48 55 51 2.76
SOYBEANS 385 422 318 325 351 483 382 468 315 285 247 -2.70
SOYBEAN OIL 23 31 28 35 22 12 9 4 35 17 42 -3.63
GROUNDNUTS SHELLED BASIS 61 62 55 66 63 55 72 61 67 70 69 1.52
GROUNDNUT OIL 7 a 7 6 5 5 4 4 6 5 4 -5.82
COCONUT OIL 435 603 495 503 527 422 476 427 475 400 474 -1.59
PALM OIL 483 416 282 173 163 137 138 132 168 161 251 -8.12
OILSEED CAKE AND MEAL 301 386 374 426 491 431 443 457 525 690 750 7.49
BANANAS 2179 2411 2410 2543 2659 2669 2794 2935 2708 2942 3352 3.36
ORANGES+TANGER+CLEMEN 264 339 380 303 294 320 333 317 329 307 299
LEMONS AND LIMES 23 24 27 34 36 38 43 38 40 51 66 9.43
COFFEE GREEN+ROASTED 1324 1290 986 1195 1277 1190 1104 1150 1089 1178 1233 -.59
COCOA BEANS 248 252 186 226 179 162 264 213 233 218 292 1.11
TEA 96 106 117 91 101 107 107 103 97 109 97 -.06
COTTON LINTJUTE AND SIMILAR FIBRES
TOBACCO UNMANUFACTUREDNATURAL RUBBER
WOOL GREASYBOVINE CATTLE 1/PIGS 1/TOTAL MEATTOTAL EGGS IN SHELL
FISHERY PRODUCTS
ANNUALRATE OF
1975 1976 1977 1978 1979 1980 1981 1982 1983 1984 1985 CHANGE1975-85
THOUSAND METRIC TONS PERCENT
83 80 68 70 79 93 111 122 93 45 52 -2.05
61 73 53 59 61 65 63 52 61 59 57 -.9223 25 14 17 23 10 18 18 16 11 16 -4.43
177 161 142 173 188 191 176 167 163 214 202 1.91
747 818 903 846 862 695 759 713 772 906 923 48
13 17 12 15 11 14 20 16 20 22 17 4.24
516 1183 1184 1337 758 731 816 1085 1004 792 893 .27
30 46 44 204 137 248 147 295 448 1322 1227 43.43
718 862 755 875 912 854 766 866 808 866 1010 1.59
12 13 19 la 21 12 12 11 22 30 18 4.08
FISH FRESH FROZEN 611 709 727 800 776 699 735 676 700 688 760 .42
FISH CURED 30 37 30 34 31 26 35 33 32 33 32 .10
SHELLFISH 139 157 158 146 155 146 156 175 213 222 235 4.92
FISH CANNED AND PREPARED 82 103 78 89 95 99 104 112 126 153 187 7.29
SHELLFISH CANNED+PREPAR 27 35 41 40 41 39 47 54 69 73 84 10.48
FISH BODY AND LIVER OIL 7 11 8 9 9 12 10 . 8 9 8 10 .18
FISH MEAL 108 128 74 40 82 45 56 79 68 81 234 2.52
1/ THOUSAND HEAD2/ EXCEPT POR PULP FOR PAPER AND PAPAR AND PAPERBOARD, ALL FOREST PRUDUCTS ARE EXPRESSED IN THOUSAND CUBIC METRES
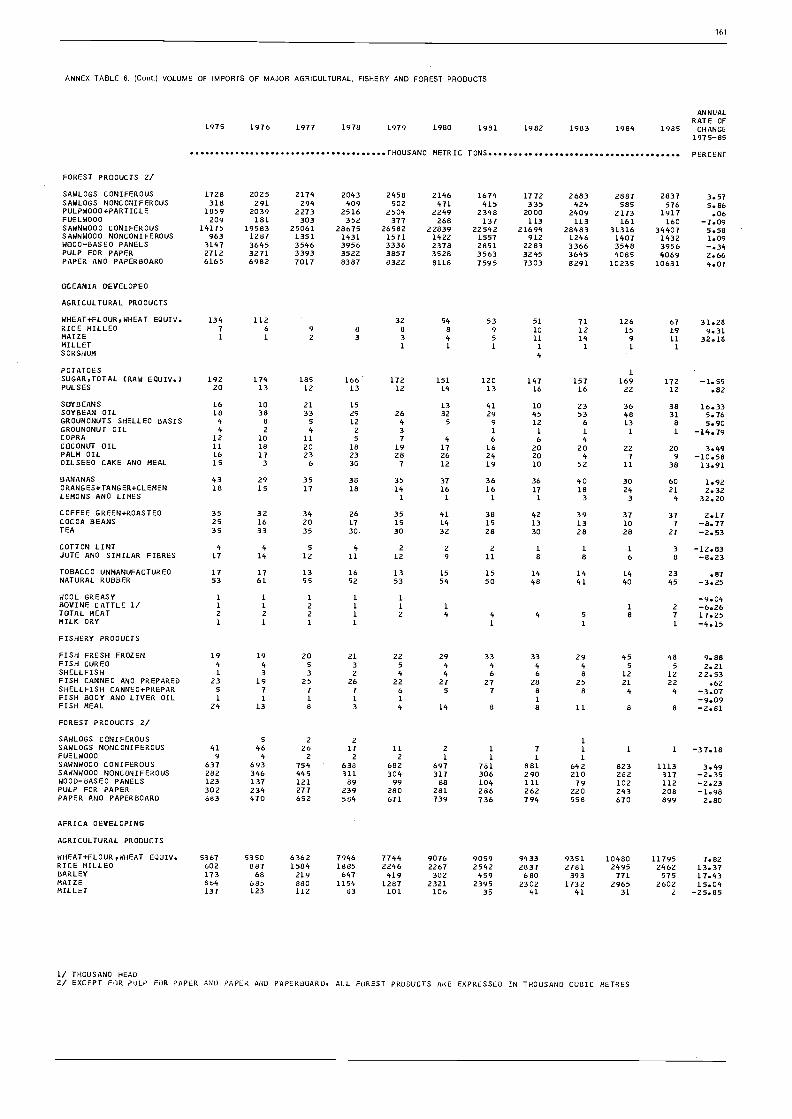
ANNEX TABLE 6. (Cont.) VOLUME OF IMPORTS OF MAJOR AGRICULTURAL, FISHERY AND FOREST PRODUCTS
ANNUALRATE OF
1975 1976 1977 1978 1979 1980 1981 1982 1983 1984 1985 CHANGE1975-85
THOUSAND METRIC TONS PERCENT
161
1/ THOUSAND HEAD2/ EXCEPT FOR PULP FOR PAPER ANO PAPER ANO PAPERBOARD/ ALL FUREST PRODUCTS ARE EXPRESSED IN THOUSAND CUBIC METRES
FOREST PRODUCTS 2/
SAWLOGS CONIFEROUS 1728 2025 2174 2043 2458 2146 1674 1772 2683 2887 2837 3.57SAWLOGS NONCONIFEROUS 318 291 294 409 502 471 415 335 424 585 576 5.86PULPW000+PARTICLE 1859 2039 2273 2516 2504 2249 2348 2000 2409 2173 1917 .06FUELWOOD 209 181 303 352 377 268 137 113 113 161 160 -7.09SAWNWOOD CONIFEROUS 14175 19583 25061 28675 26582 22839 22542 21694 28483 31316 34407 5.58SAWNWODD NONCONIFEROUS 963 1287 1351 1431 1571 1422 1557 912 1246 1407 1432 1.09WOOD-BASED PANELS 3147 3645 3546 3956 3336 2378 2851 2283 3366 3548 3956 -.34PULP FOR PAPER 2712 3271 3393 3522 3857 3528 3563 3245 3645 4085 4069 2.66PAPER AND PAPERBOARD 6165 6982 7017 8387 8322 8118 7595 7303 8291 10235 10631 4.07
OCEANIA DEVELOPED
AGRICULTURAL PRODUCTS
WHEAT+FLOUR/WHEAT EQUIV. 134 112 32 54 53 51 71 126 67 31.28RICE MILLED 7 6 9 8 8 8 9 10 12 15 19 9.31MAIZE 1 1 2 3 3 4 5 11 14 9 11 32.18MILLET I. I 1 1 1 1 1SORGHUM 4
POTATOES 1SUGAR/TOTAL (RAW EQUIV.) 192 174 185 166 172 151 120 147 157 169 172 '..1.155PULSES 20 13 12 13 12 14 13 16 16 22 12 .82
SOYBEANS 16 10 21 15 13 41 10 23 36 38 16.33SOYBEAN OIL 18 38 33 29 26 32 29 45 53 48 31 5.76GROUNDNUTS SHELLED BASIS 4 8 5 12 4 5 9 12 6 13 8 5.90GROUNDNUT OIL 4 z 4 z 3 1 1 1 1 1 -14.79COPRA 12 10 11 5 7 4 6 6 4COCONUT OIL 11 18 20 18 19 17 16 20 20 22 20 3.49PALM OIL 16 17 23 23 28 26 24 20 4 7 9 ..-10.58OILSEED CAKE AND MEAL 15 3 6 30 7 12 19 10 52 11 38 13.91
BANANAS 43 29 35 38 35 37 36 36 40 30 60 1.92ORANGES+TANGER+CLEMEN 18 15 17 18 14 16 16 17 18 24 21 2.32LEMONS ANO LIMES 1 1 1 1 3 3 i 32.20
COFFEE GREEN+ROASTED 35 32 34 26 35 41 38 42 39 37 37 2.17COCOA BEANS 25 16 20 17 15 14 15 13 13 10 7 *8.77TEA 35 33 35 30. 30 32 28 30 28 28 27 -2.53
COTTON LINT 4 4 5 4 2 2 2 1 1 1 3 -12.83JUTE AND SIMILAR FIBRES 17 14 12 11 12 9 11 8 8 6 8 ...8.23
TOBACCO UNMANUFACTURED 17 17 13 16 13 15 15 14 14 14 23 .87NATURAL RUBBER 53 61 55 52 53 54 50 48 41 40 45 *3.25
WOOL GREASY 1 1 1 1 1
BOVINE CATTLE 1/ 1 1 2 1 1 1 1 2 -6.26TOTAL MEAT 2 2 2 1 2 4 4 4 5 8 7 17.25MILK DRY 1 1 1 1 1 1 1
FISHERY PRODUCTS
FISH FRESH FROZEN 19 19 20 21 22 29 33 33 29 55 48 9.88FISH CURED 4 4 5 3 5 4 4 4 4 5 5 2.21SHELLFISH 1 3 3 2 4 4 6 6 8 12 12 22.53FISH CANNED AND PREPARED 23 19 25 26 22 27 27 28 25 21 22 .62SHELLFISH CANNED+PREPAR 5 7 7 7 6 5 7 8 a i 4 -3.07FISH BODY AND LIVER OIL 1 1 I 1 1 1 -9.09FISH MEAL 24 13 8 3 4 14 8 a 11 a 8 -2.81
FOREST PRODUCTS 2/
SAWLOGS CONIFEROUS 5 2 2 1SAWLOGS NONCONIFEROUS 41 46 26 17 11 2 1 7 1 1 I -.37.18FUEL WOOD 9 4 2 z 2 1 1 1 1
SAWNWOOD CONIFEROUS 637 693 754 638 682 697 781 881 642 823 1113 3.49SAWNWOOD NONCONIFEROOS 282 346 445 311 304 317 306 290 210 282 317 -2.35WOOD-BASED PANELS 123 137 121 89 99 88 104 111 79 102 112 ...2.23PULP FOR PAPER 302 234 277 239 280 281 2436 262 220 243 208 -1.98PAPER AND PAPERBOARD 683 470 652 584 671 739 736 794 558 670 899 2.80
AFRICA DEVELOPING
AGRICULTURAL PRODUCTS
WHEAT+FLOUR/WHEAT EQUIV. 5367 5350 6362 7946 7744 9076 9059 9433 9351 10480 11795 7.82RICE MILLED 602 887 1584 1885 2246 2287 2542 2837 2781 2495 2462 13.37BARLEY 173 68 219 647 419 302 459 680 393 771 575 17.43MAIZE 864 685 880 1154 1287 2321 2395 2302 1732 2965 2602 15.04MILLET 137 123 112 83 101 106 35 41 41 31 2 -25.85

162
ANNEX TABLE 6. (ContJ VOLUME OF IMPORTS OF MAJOR AGRICULTURAL, FISHERY AND FOREST PRODUCTS
ANNUALRATE OF
1975 1976 1977 1978 1979 1980 1981 1982 1983 1984 1985 CHANGE1975-85
THOUSAND METRIC TONS PERCENT
SORGHUM 42 118 99 149 132 106 153 157 241 412 375 18.68
POTATOES 189 149 211 233 307 245 217 272 451 350 422 9.20SUGAR,TOTAL (RAW EQUIV.) 1329 1496 1888 2043 2105 2245 2360 2156 2373 2234 2260 4.81PULSES 89 77 91 118 209 217 145 157 214 232 246 11.77
SOYBEANS 9 16 50 22 31 25 11 35 16 13 23 -.11SOYBEAN OIL 156 121 256 312 357 336 336 448 392 367 312 9.38GROUNDNUTS SHELLED BASIS 35 17 25 27 12 16 9 12 a 6 40 -7.70GROUNDNUT OIL a 30 22 10 10 16 16 18 19 10 18 .72COPRA 3 3 3 4 4 3 2 2 3 5 3 -.70COCONUT OIL 9 18 20 10 9 7 14 12 10 17 13 .57PALM NUTS KERNELS 1
PALM OIL 29 68 81 106 98 165 244 293 261 189 211 20.37OILSEED CAKE AND MEAL 58 54 102 122 157 188 242 260 225 298 277 18.90
BANANASORANGES+TANGER+CLEMENLEMONS ANO LIMES
38 41 47 31 17 18 28 59 24 28 10 -7.2412 10 12 12 12 10 9 9 981
7 --4.131 1 1 1 1 1 1 3.72
COFFEE GREEN+ROASTED 65 78 59 83 76 80 103 69 114 98 102 4.75COCOA BEANS 2 1 3 1 1 1 1 1 5 1 2 1.58TEA 45 42 46 56 70 57 69 57 58 62 68 4.07
COTTON LINT 54 46 51 42 48 44 65 86 92 98 89 8.47JUTE AND SIMILAR FIBRES 80 61 73 58. 58 64 52 51 55 39 41 -5.74
TOBACCO UNMANUFACTURED 53 46 49 62 62 53 49 49 51 46 49NATURAL RUBBER 17 18 22 21 20 21 26 23 23 26 26 3.86
WOOL GREASY 1 3 3 4 3 2 2 1 2 1 3 -3.61BOVINE CATTLE 1/ 577 632 697 776 835 824 895 846 962 1075 756 4.34F105 11 1 1 1 1 1 1 2 2 3 4 2 16.56TOTAL MEAT 57 84 110 139 137 142 149 214 188 206 235 12.78MILK DRY 21 23 23 25 23 32 30 26 30 35 39 5.58TOTAL EGGS IN SHELL a 13 21 44 35 50 52 71 78 49 47 19.38
FISHERY PRODUCTS
FISH FRESH FROZEN 340 346 250 287 329 891 966 866 866 733 586 12.29FISH CURED 46 58 21 33 44 58 72 43 46 29 38 -.26SHELLFISH 14 16 17 19 6 a 4 5 23 23 1 -11.12FISH :ANNED AND PREPARED 82 139 114 152 145 132 137 111 69 54 51 -7.30SHELLFISH CANNED+PREPAR 3 2 1 10.06FISH BODY AND LIVER OIL 1 3 2 3.
21 1 -31.49
FISH MEAL 12 13 17 27 2'1. 24 25 32 35 48 28 11.67
FOREST PRODUCTS 2/
SAWLOGS CONIFEROUS 38 43 31 32 73 94 84 110 169 171 171 20.72SAWLOGS NONCONIFEROUS 153 172 286 197 204 326 225 241 321 318 310 6.40FUELWOOD 26 / 1
SAWNWOOD CONIFEROUS 764 829 1251 763 1019 905 1409 1531 1827 1790 1486 8.78SAWNWOOD NONCONIFEROUS 153 168 155 202 203 194 232 193 183 183 163 1.09WOOD-BASED PANELS 183 192 310 263 316 359 321 258 290 198 199 .29PULP FOR PAPER 56 95 97 102 104 120 135 116 149 143 136 7.42PAPER AND PAPERBOARD 460 456 496 519 529 537 671 579 561 532 550 2.16
LATIN AMERICA
AGRICULTURAL PRODUCTS
WHEAT+FLOUR,WHEAT EQUIS'. 7162 8981 8152 10777 10718 12039 11977 11037 11789 12091 11273 4.39RICE MILLED 563 489 428 432 1339 1059 789 607 948 616 1034 6.08BARLEY 262 207 203 358 323 479 413 351 474 505 515 9.22MAIZE 3897 2438 3590 4714 3954 8887 7032 3330 8129 5462 4029 5.34MILLET 4 6 2 4 6 3 2 3 4SORGHUM 1348 554 1440 1442 1902 2943 3641 3162 3825 3158 3429 16.48
POTATOES 196 173 198 205 252 341 208 195 165 184 136 -2.15SUGAR,TOTAL (RAW EQUIS'.) 113 286 646 882 717 1567 1489 1353 1742 1204 371 15.92PULSES 308 299 400 291 284 816 876 520 369 501 488 5.99
SOYBEANS 127 444 628 971 952 1205 2235 2030 1298 1806 1835 23.79SOYBEAN OIL 141 243 245 351 372 430 432 587 541 707 562 14.33GROUNDNUTS SHELLED BASIS 46 3814 11 13 14 18 9 20 17 -5.50GROUNDNUT OIL 41 64 13: 85 9 2 4 1 2 1 2 -38.15COPRA 21 1
COCONUT OIL 40 88 26 39 15 25 19 23 16 15 18 -11.62PALM NUTS KERNELS 2 2 2 1 1 1 3 1
PALM OIL 3 16 16 a 6 16 12 11 5 5 6 -3.43OILSEED CAKE AND MEAL 340 413 593 647 710 968 957 1092 1196 1221 1292 14.04
BANANAS 233 184 226 287 391 434 446 316 227 227 227 .94ORANGES+TANGER+CLEMEN 17 19 26 22 44 57 36 25 20 17 13 -2.14LEMONS ANO LIMES 2 3 4 o 4 z 3 2 2 2 1 -7.00
1/ THOUSAND HEAD2/ EXCEPT FOR PULP RJR PAPER ANO PAPER ANO PAPERBOARD, ALL FOREST PRODUCTS ARE EXPRESSED IN THOUSAND CUBIC METRES

ANNEX TABLE 6. (Cont.) VOLUME OF IMPORTS OF MAJOR AGRICULTURAL, FISHERY AND FOREST PRODUCTS
ANNUALRATE OF
1975 1976 1977 1.978 1979 1980 1981 1982 1983 1984 1985 CHANGE1975-85
THOUSAND METRIC TONS PERCENT
COFFEE GREEN+ROASTED 82 86 54 58 93 49 64 59 67 70 68 -1.32COCOA BEANS 15 7 3 3 z 3 10 13 3 6 9 1.08TEA 10 13 14 16 19 16 14 13 14 13 15 1.43
COTTON LINT 69 56 85 71 91 79 93 79 77 118 101 4.42JUTE ANO SIMILAR FIBRES 45 30 15 12 18 36 34 14 14 11 14 -7.66
TOBACCO UNMANUFACTURED 15 17 18 16 17 28 24 20 19 15 21 1.94NATURAL RUBBER 144 165 170 182 182 187 184 162 165 204 202 2.05
WOOL GREASY 6 a 6 7 9 13 12 13 9 9 12 6.54BOVINE CATTLE 1/ 397 516 490 583 928 419 464 436 375 369 388 -3.16PIGS 1/ 47 59 36 32 21 10 26 57 17 9 9 -13.89TOTAL MEAT 160 183 197 373 365 335 413 338 267 303 380 6.76MILK DRY 50 73 181 138 120 153 156 139 118 153 111 5.56TOTAL EGGS IN SHELL 7 9 14 11 17 19 18 30 15 10 9 3.64
FISHERY PRODUCTS
FISH FRESH FROZEN 126 98 90 109 133 Ill 96 97 83 70 84 -3.69FISH CURED 67 54 48 46 47 56 52 52 47 46 40 -2.64SHELLFISH 7 4 5 5 9 a 10 9 7 4 6 1.36FISH CANNED AND PREPARED 41 43 49 60 74 92 87 79 43 39 62 1.78SHELLFISH CANNED+PREPAR 1 1 1 1 2 2 2 1 1 -7.09FISH BODY AND LIVER OIL 20 43 27 35 . 67 43 68 35 68 13 37 .99FISH MEAL 143 75 66 108 138 163 126 108 63 101 64 -2.79
FOREST PRODUCTS 2/
SAWLOGS CONIFEROUS 7 43 26 34 54 128 156 162 160 144 143 31.13SAWLOGS NONCONIFEROUS 134 73 69 105 65 57 30 29 30 75 88 -6.80PULPWOOD+PARTICLE 31 35 24 16 16 8 aFUELWOOD 9 6 12 4 4 5 7 5 3 4 6 -7.30SAWNWOOD CONIFEROUS 1235 1467 1486 1715 1524 2184 1874 1477 1666 1709 1854 2.67SAWNWOOD NONCONIFEROUS 742 427 520 679 692 917 642 652 597 753 696 2.03W000-BASED PANELS 169 184 234 304 401 493 499 482 519 454 430 11.34PULP FOR PAPER 544 536 462 530 653 740 762 735 645 766 773 4.66PAPER ANO PAPERBOARD 1650 1756 2162 1869 1856 2395 2437 2278 1958 1796 1726 .63
NEAR EAST DEVELOPING
AGRICULTURAL PRODUCTS
WHEAT+FLOUR.WHEAT EQUIV. 8758 7658 9207 10320 10703 12767 13999 14127 16726 20758 17687 9.71RICE MILLED 939 1106 1456 1548 1887 1790 2020 1991 2247 2477 2188 8.85BARLEY 473 465 991 852 1493 2361 3290 5002 3879 8940 5789 34.71MAIZE 791 1009 1492 1850 2369 2685 3745 3805 4124 4294 4664 19.52MILLET 3 10 6 4 4 2 2 3 4 4 5 -2.78SORGHUM 91 197 189 254 109 101 132 339 59 52 34 -11.15
POTATOES 168 164 230 231 282 353 426 422 375 413 336 9.76SUGAR,TOTAL (RAW EQUIV.) 2098 1694 2266 2400 3463 3353 3499 3898 3560 3736 3442 7.52PULSES 243 234 202 213 258 257 359 332 314 320 305 4.59
SOYBEANS 28 29 63 138 180 99 116 108 94 161 128 14.33SOYBEAN OIL 270 332 233 281 381 442 504 519 715 676 617 11.37GROUNDNUTS SHELLED BASIS 9 a 15 6 8 16 9 7 5 7 6 -4.75GROUNDNUT OIL 1 z z 1 1 3 1 1 1 -19.65COPRA 8 7 1
COCONUT OIL 22 31 a 7 4 14 12 16 14 11 17 -.64PALM NUTS KERNELS 1 5
PALM OIL 137 76 148 164 187 148 291 376 418 456 522 18.95OILSEED CAKE AND HEAL 100 237 379 459 442 406 543 674 845 1058 1138 21.53
BANANAS 255 308 277 289 319 300 316 263 255 222 167 -3.48ORANGES+TANGER+CLEMEN 532 636 555 472 512 546 619 625 636 626 520 .89LEMONS AND LIMES 32 54 52 45 77 79 77 80 87 96 77 8.80
COFFEE GREEN+ROASTED 49 51 53 42 40 46 56 74 77 63 68 4.75COCOA BEANS 4 4 2 4 1 1 5 54 5 6.98TEA 132 157 150 205 188 183 171 168 19t 223 221 3.97
COTTON LINT 26 7 37 21 41 22 24 27 27 27 62 7.99JUTE AND SIMILAR FIBRES 31 40 31 24 41 20 25 37 44 23 29 -1.05
TOBACCO UNMANUFACTURED 44 45 45 52 60 47 61 75 79 81 69 6.61NATURAL RUBBER 51 50 49 46 37 40 50 65 96 82 84 6.99
WOOL GREASY 26 27 32 17 18 18 19 13 18 18 22 -3.99BOVINE CATTLE 1/ 160 184 389 390 386 503 736 713 594 549 341 10.80PIGS 1/ 5
TOTAL HEAT 251 334 462 582 673 980 1302 1294 1266 1241 1163 17.85MILK DRY 3 5 10 11 20 14 24 28 24 24 21 21.97TOTAL EGGS IN SHELL 81 77 83 84 75 108 139 149 153 146 121 7.72
1/ THOUSAND HEAD2/ EXCEPT FOR PULP FOR PAPER ANO PAPER AND PAPERBOARD, ALL FOREST PRODUCTS ARE EXPRESSED IN THOUSAND CUBIC METRES
1671

164
ANNEX TABLE 6. (Contl VOLUME OF IMPORTS OF MAJOR AGRICULTURAL, FISHERY AND FOREST PRODUCTS
ANNUALRATE OF
1975 1976 1977 1978 1979 1980 1981 1982 1983 1984 1985 CHANGE1975-85
THOUSAND METRIC TONS PERCENT
FISHERY PRODUCTS
FISH FRESH FROZEN 41 60 55 70 55 76 107 112 133 153 134 13.45FISH CURED 3 4 2 3 3 4 6 5 4 4 7 7.82SHELLFISH 1 1 2 1 2 2 2 2 2 1 4 11.35FISH CANNED AND PREPARED 33 42 46 55 51 70 64 64 63 50 49 3.78SHELLFISH CANNED+PREPAR 1 1 2 3 2 2 1 42.53FISH BODY AND LIVER OIL 2 2 2 1 1 1 1 1 1 -18.22FISH MEAL 27 51 136 56 52 80 146 113 106 89 149 11.95
FOREST PRODUCTS 2/
SAWLOGS CONIFEROUS 167 196 231 176 126 173 202 273 317 279 393 7.54SAWLOGS NONCONIFEROUS 66 86 55 68 42 57 46 5 6 11 11 -23.34PULPWOOD+PARTICLE 8 9 13 36 40 14 4 9 9 4 4 -11.92FUELWOOD 172 180 159 163 119 126 146 183 169 167 122 -1.25SAWNWOOD CONIFEROUS 1744 2202 3063 2441 2689 3242 3498 3938 4179 4563 4097 8.86SAWNWOOD NONCONIFEROUS 294 406 659 620 469 630 550 630 758 811 679 7.12WGOD-BASED PANELS 465 597 749 804 931 1072 1425 1588 1324 1442 1485 12.37PULP FOR PAPER 136 159 135 127 113 121 111 110 178 171 201 2.59PAPER AND PAPERBOARD 696 725 866 889 905 975 1042 1008 1006 1204 1623 6.67
FAR EAST DEVELOPING
AGRICULTURAL PRODUCTS
WHEAT+FLOUR,WHEAT EQUIV. 15063 13644 7213 8060 8808 8887 7792 9707 11531 10772 9264 -1.55RICE MILLED 3023 3698 3848 3465 3392 4497 4384 2089 3225 2468 2641 -3.20BARLEY 539 a 327 101 106 206 270 916 450 1624 313 25.39MAIZE 1440 1971 2517 3125 4114 3888 4491 4851 6275 4879 5562 13.67MILLET 13 29 10 1 2 3 3 6 4 5 2 -11.75SORGHUM 204 398 19 49 144 62 178 445 223 420 388 15.00
POTATOES 87 93 104 117 143 155 145 170 138 125 Ill . 3.71SUGAR,TOTAL (RAW EQUIV.) 1127 1116 1435 1866 1935 2607 2807 2310 2127 2317 4295 11.11PULSES 93 90 91 167 207 207 377 381 366 461 476 21.19
SOYBEANS 153 433 370 489 728 874 1093 1219 1137 1355 1443 21.47SOYBEAN OIL 87 194 529 583 841 1004 981 976 922 1353 720 21.22GROUNDNUTS SHELLED BASIS 18 43 23 28 39 67 93 152 144 81 104 21.08GROUNDNUT OIL 23 48 64 42 36 38 34 36 55 37 44 1.32COPRA 55 96 99 163 74 115 110 81 47 88 136 .89COCONUT OIL 34 55 87 158. 91 58 149 83 89 86 73 4.54PALM NUTS KERNELS 4 5 5 6 10 15 6 3 12 5 4 1.25PALM OIL 277 372 842 847 1058 1757 1436 1561 1677 1943 2533 21.34OILSEED CAKE AND MEAL 333 533 717 804 965 1005 1026 1339 1524 1737 1205 14.09
BANANAS 56 45 48 57 69 59 49 59 50 71 68 2.51ORANGES+TANGER+CLEMEN 208 199 215 222 208 238 273 249 286 251 250 2.94LEMONS AND LIMES 4 6 7 a 8 9 10 13 70.59
COFFEE GREEN+ROASTED 31 42 32 19 27 19 36 51 72 96 94 12.99COCOA BEANS 9 9 8 12 17 27 45 60 61 50 58 27.08TEA 64 70 81 77 84 86 97 94 110 127 114 6.24
COTTON LINT 790 794 843 860 827 888 775 788 863 991 960 1.55JUTE AND SIMILAR FIBRES 80 123 57 64 80 119 109 165 142 124 112 6.28
TOBACCO UNMANUFACTURED 53 59 69 64 69 82 88 70 63 68 64 1.61NATURAL RUBBER L23 142 160 193 215 182 208 226 198 277 250 6.73
$01001 GREASY 26 27 32 29 30 33 39 34 36 34 50 4.82BOVINE CATTLE 1/ 286 279 293 324 356 343 362 367 352 301 271 .76PIGS 1/ 2796 3004 3023 3123 3095 4552 3194 3414 3323 3188 3214 1.31TOTAL MEAT 149 173 212 279 297 227 266 352 360 330 316 7.80MILK DRY 68 84 99 143 159 152 153 130 139 158 194 8.05TOTAL EGGS IN SHELL 58 57 64 68 75 76 75 80 78 88 87 4.36
FISHERY PRODUCTS
FISH FRESH FROZEN 148 156 162 185 229 210 258 280 294 367 437 11.09FISH CURED 32 21 18 21 21 28 22 26 26 54 40 6.03SHELLFISH 68 89 95 119 180 122 115 132 139 151 164 6.91FISH CANNED AND PREPARED 114 112 84 83 79 96 78 92 51 48 47 -8.00SHELLFISH CANNED+PREPAR 14 16 15 16 14 18 16 21 22 21 17 3.73FISH BODY AND LIVER OIL 2 7 4 4 4 2 2 3 3 5 22 7.30FISH MEAL 99 84 93 131 164 148 158 251 171 173 187 8.70
FOREST PRODUCTS 2/
SAWLOGS CONIFEROUS 461 750 1200 2426 2128 1536 1186 1548 2116 2073 2217 11.66SAWLOGS NONCONIFEROUS 6180 7505 8558 9371 9355 6526 5985 5415 5789 4986 4331 -5.42PULPWOOD+PARTICLE 61 1 2 2 1 3 117 118FUELWOOD 473 462 546 489 519 560 588 741 749 727 770 5.75SAWNWOOD CONIFEROUS 179 214 228 235 80 87 72 45 46 49 37 -18.14
1/ THOUSAND HEAD2/ EXCEPT FOR PULP FOR PAPER AND PAPER AND PAPERBOARD, ALL FOREST PRODUCTS ARE EXPRESSED IN THOUSAND CUBIC METRES

ANNEX TABLE 6. (Cont.) VOLUME OF IMPORTS OF MAJOR AGRICULTURAL, FISHERY AND FOREST PRODUCTS
ANNUALRATE OF
1975 1976 1977 1.978 1979 1980 1981 1982 1983 1984 1985 CHANGE1975-85
. ..THOUSAND METRIC TONS PERCENT
SAWNWOOD NONCONIFEROUS 981 1463 1741 1829 2345 1850 1762 1910 1840 1774 1372 2.22WOOD-BASED PANELS 392 472 495 575 610 724 821 680 794 652 584 4.97PULP FOR PAPER 286 423 555 696 735 728 815 791 1090 1042 1110 12.31PAPER AND PAPERBOARD 1133 1459 1495 1830 1995 2072 2247 2349 2313 2533 2481 7.60
ASIAN CENT PLANNED ECON
AGRICULTURAL PRODUCTS
WHEAT+FLOUR,WHEAT EQUIV. 5287 3798 9164 10271 11756 13243 15688 15565 12643 11234 6649 7.12RICE MILLED 737 784 214 250 619 593 459 566 174 497 487 -2.86BARLEY 174 333 265 336 704 402 354 509 481 430 369 6.29MAIZE 1729 2150 2222 3064 5412 4438 3287 4117 5569 3015 3107 6.70SORGHUM 152 255 394 473 517 417 840 767 534 597 564 11.86SUGAR,TOTAL (RAW EQUIV.( 760 952 1895 1587 1368 1114 1294 2373 2130 1456 2091 7.41PULSES 33 39 49 68 58 72 91 124 88 91 83 10.88
SOYBEANS 854 829 985 1172 1696 1529 1682 1516 1420 1345 1470 5.85SOYBEAN OIL 42 27 149 137 143 136 56 63 36 25 43 -6.04GROUNDNUTS SHELLED BASIS 2 1 6GROUNDNUT OIL 20 1COPRA 1 3 3 7 1 3 7COCONUT OIL 47 29 22 19 27 31 26 31 26 27 29 -1.09PALM NUTS KERNELS 2 1PALM OIL 12 3 30 14 ' 48 63 26 24 18 21 73 15.45OILSEED CAKE ANO MEAL 1 29 41 55 1 9 14 15 33 61 73 24.30
BANANAS 10 15ORANGES+TANGER+CLEMEN 2 1 1 5 2 3
COFFEE GREEN+ROASTEDCOCOA BEANSTEA
COTTON LINTJUTE AND SIMILAR FIBRES
TOBACCO UNMANUFACTUREDNATURAL RUBBER
165
7 6 6 5 6 7 17 30 16 11 32.265 11 12 15 17 17 4 23 10 12 6 -1.746 5 5 6 5 5 4 4 5 6 6 -.64
412 428 422 818 835 1235 1021 824 521 369 360 -.3822 27 34 39 36 47 25 44 36 25 21 -.49
11 13 15 19 22 32 54 46 21 28 45 13.17298 248 316 300 333 358 220 225 326 309 261 -.62
WOOL GREASY 13 22 22 28 51 60 94 112 116 85 145 26.35BOVINE CATTLE 1/ a 1 2 1 1 4 10PIGS 1/ 2 1 4 . 3 3 5 3 3 2 2 14.24TOTAL MEAT 29 10 4 11 18 16 23 27 28 31 35 12.83
FISHERY PRODUCTS
FISH FRESH FROZEN 4 4 6 4 4 z 3 3 3 4 4 -3.20FISH CURED 7 1 1 1 1 1 1 -38.60SHELLFISH 4 3 4 9 14 20 2 5 4 2 2 -6.79FISH CANNED AND PREPARED 2 5 1 1 1 2 2 2 2 3 3 3.04SHELLFISH CANNED+PREPAR 1 1 1 1 1 16.99FISH BODY ANO LIVER OIL 3 2 23 2 2 2 z 5 3 2.57FISH MEAL 95 136 124 14; 168 154 160 226 205 262 309 10.43
FOREST PRODUCTS 2/
SAWLOGS CONIFEROUS 614 618 419 389 422 630 1181 3115 5391 6776 7576 37.45SAWLOGS NONCONIFEROUS 3887 4437 6236 7127 6760 6481 5491 4837 5975 4704 4630PULPW000+PARTICLE 88 711 711 728 1069 843 1957 1192 2005 1563 1626 22.64SAWNWOOD CONIFEROUS 21 29 29 29 29 31 10 6 11 15 9 -11.68SAWNWOOD NONCONIFEROUS 23 30 38 56 96 139 197 293 423 519 529 41.54WOOD-BASED PANELS 3 12 13 24 36 51 260 287 314 710 551 70.49PULP FOR PAPER 219 235 175 208 210 427 525 440 683 672 670 15.97PAPER AND PAPERBOARD 174 217 297 411 427 650 662 510 678 634 731 14.40
I/ THOUSAND HEAD2/ EXCEPT FOR PULP FUR PAPER AND PAPER ANO PAPERDUARD, ALL FOREST PRODUCTS ARE EXPRESSED IN THOUSAND CUBIC METRES

166
ANNEX TABLE 7. INDICES OF VALUE OF EXPORTS OF AGRICULTURAL, FISHERY AND FOREST PRODUCTS
ANNUALRATE OF
1975 1976 1977 1976 1979 1980 1961 1962 1983 1984 1985 CHANGE1975-85
1979 61=100 PERCENT
WORLD
AGRICULTURAL PRODUCTS ,u 91 73 77 91 105 105 94 92 97 89 5.04FOOD 91 59 64 75 88 105 106 95 92 96 88 5.09FEED 37 54 67 7, 66 111 113 105 116 101 82 8.57RAW MATERIALS 57 96 76 63 95 114 101 90 91 97 87 3.87BEVERAGES 44 67 97 93 105 110 65 86 91 103 105 5.20
FISHERY PRODUCTS 41 53 63 85 94 101 105 101 104 106
FOREST PRODUCTS 50 60 65 73 94 117 96 69 91 96 96 6.26
DEVELOPED COUNTRIES
AGRICULTURAL PRODUCTO 57 58 63 74 66 105 107 96 92 93 84 5.33FOOD 56 56 61 73 . 87 105 108 96 91 92 83 5.18FEED 38 50 59 74 88 113 109 103 115 96 81 8.74RAW MATERIALS 56 63 79 81 95 104 102 96 90 97 88 4.51BEVERAGES 47 54 69 79 101 113 96 96 93 98 106 7.26
FISHERY PRODUCTS 45 55 65 93 95 102 103 97 100 98
FOREST PRODUCTS 52 81 66 74 93 117 101 91 92 99 100 6.22
WESTERN EUROPE
AGRICULTURAL PRODUCTO 53 54 62 75 91 106 103 96 93 94 94 6.49FOOD 54 54 61 7, 99 116 104 96 92 92 92 6.28FEED 30 46 57 79 87 97 116 119 132 119 104 12.58RAW MATERIALS 65 75 74 95 113 99 88 88 92 102 96 3.10BEVERAGES 46 53 65 75 101 103 96 95 93 98 109 7.79
FISHERY PRODUCTS 46 55 67 101 94 104 102 92 96 92
FOREST PRODUCTS 50 59 63 72 93 109 98 69 89 96 100 6.45
USSR AND EASTERN EUROPE
AGRICULTURAL PRODUCTS 74 73 88 84 96 103 100 94 84 80 75 .53FOOD 77 72 do 62 98 113 100 90 79 80 74 .11FEED 56 134 134 117 113 99 91 109 91 71 78 -2.31RAW MATERIALS 06 74 96 69 95 102 103 105 93 77 73 .73
BEVERAGES 97 95 78 95 104 105 94 97 103 95 91 3.63
FISHERY PRODUCTS 74 78 70 32 105 19, 91 89 114 110
FOREST PRODUCTS 89 74 64 do 97 104 99 99 99 99 99 3.39
NORTH AMERICA DEVELOPED
AGRICULTURAL PRODUCTS 57 39 op 7, 65 114 111 94 94 98 73 5.06F000 60 115 38 71 64 1,4 112 95 94 98 72 4.87FEED 37 51 56 .75 66 1,7 105 9, 106 63 67 6.83RAW MATERIALS 51 54 71 91 92 116 101 91 86 102 84 5.65BEVERAGES 47 49 111 7, 94 110 95 91 79 91 88 7.24
FISHERY PWJDUCTS 53 44 57 55 98 94 106 105 102 97
FOREST PRJOUCTS 22 62 bb 79 93 105 102 91 96 104 100 6.66
OCEANIA DEVELOPED
1GRILULIURAL PRO0OCT5 09 01 99 67 81 12s 11, 1:34 89 91 95 5.59F000 94 91 93 o, 77 199 119 1,9 87 SO 93 5.54FEED ,I. 55 105 119 127 7, 118 1,3 95 73 6C .50RAW MATERIALS 51 83 19 71 92 122 oC 1'23 92 95 100 5.88BEVERAGES 03 97 93 09 74 '94 i3. 139 157 177 158 12.65
FISHERY PALBAICT5 33 56 53 5 83 1..3 119 J..ro 134 152
FOREST PKJJUCTS 47 j5 111 oS 03 89 81 6.23

ANNEX TABLE 7. (COM.) INDICES OF VALUE OF EXPORTS OF AGRICULTURAL, FISHERY AND FOREST PRODUCTS
ANNUALRATE OF
1975 1976 1977 197, 1079 19o3 1981 1962 1983 1984 1985 CHANGE1975-85
1975-81=101. PERCENT
DEVELOPING COUNTRIES
-
167
AGRICULTURAL PRODUCTS 59 67 82 84 95 164 101 90 94 103 98 4.53FOOD 86 63 73 79 91 102 107 53 94 105 100 4.86FEED 37 53 76 73 64 98 116 105 116 106 84 8.42RAW MATERIALS 59 73 78 85 96 105 99 84 91 96 87 3.20BEVERAGES 42 74 112 100 107 113 80 84 89 106 105 4.30
FISHERY PRODUCTS 36 49 59 76 93 99 106 106 111 118
FOREST PRODUCTS 37 54 59 66 101 110 69 82 88 82 79 6.59
AFRICA DEVELOPING
AGRICULTURAL PRODUCTS 60 78 102 99 105 105 90 83 78 89 90 .76FOOD 76 76 90 102 102 1e6 92 60 72 83 84 -.32FEED 78 97 124 76 129 94 77 80 83 56 49 -5.45RAW MATERIALS 61 76 78 76 89 100 110 92 97 110 102 4.95BEVERAGES 51 62 129 102 115 105 80 84 82 93 97 1.56
FISHERY PRODUCTS 46 47 49 63 79 95 126 122 141 139
FOREST PRODUCTS 50 66 71 78 91 124 85 70 67 69 66 .95
LATIN AMERICA
AGRICULTURAL PRODUCTS 58 66 82 85 94 104 101 90 98 102 100 4.75FOOD 69 63 73 76 91 102 168 90 100 103 103 4.97FEED 32 52 70 71 79 95 125 104 122 109 84 9.90RAW MATERIALS 62 70 84 93 95 101 104 91 82 85 82 1.86BEVERAGES 38 78 105 102 107 116 77 85 90 102 103 4.53
FISHERY PRODUCTS 35 46 53 73 91 107 102 108 105 112
FOREST PRODUCTS 32 32 40 48 81 111 109 90 95 114 97 14.30
NEAR EAST DEVELOPING
AGRICULTURAL PRODUCTS 65 79 80 do 90 98 112 109 103 105 87 3.72FOOD 45 56 64 76 84 97 119 122 112 110 89 8.57FEED 125 115 113 77 94 121 65 02 49 65 25 -11.52RAW MATERIALS 96 118 108 101 99 100 102 90 90 100 86 -1.76BEVERAGES 36 48 08 79 104 65 111 74 63 58 41 .99
FISHERY PRODUCTS 49 55 76 60 67 94 119 134 139 157
FOREST PRODUCTS 41 49 56 46 76 66 136 152 164 211 161 18.65
FAR EAST DEVELOPING
AGRICULTURAL PRODUCTS 32 39 73 74 91 109 103 90 91 109 93 6.18FOOD 59 58 86 87 87 1.1 112 99 91 117 98 6.83FEED 41 66 12 79 91 10.) 106 19 97 96 78 5.98RAW MATERIALS 44 60 05 -76 96 1,-9 95 73 88 88 76 4.73BEVERAGES 45 59 115 95 95 115 9,. 81 98 139 124 7.19
FISHERY PRODUCTS
FOREST PRODUCTS
36
34
49
57
69
82
lc,
67
100
110
93
1U6
107
05
109
65
111
88
117
74 76 5.65
ASIAN CENT PLANNED EGON
AGRICULTURAL PRODUCTS 63 71 69 83 94 io 102 99 111 127 151 6.72FOOD 94 74 85 64. 91 I07 1'....2 92 94 110 140 4.69FEED 11 lo 14 1, 23 93 180 1,0 349 255 297 51.22RAW MATERIALS .7 22 89 95 113 135 62 116 156 178 179 9.34dEVERAGES
FISHERY PRLIJUCTS
76
24
43
58
61
52
4_,
04
106
90
1,-3
99
59
109
157
1»03
116
111
146
127
143 12.24
FOREST PRODUCTS 90 55 o2 101 o 11., ,7 93 85 79 5.79

168
ANNEX TABLE 8. INDICES OF VOLUME OF EXPORTS OF AGRICULTURAL, FISHERY AND FOREST PRODUCTS
ANNUALRATE OF
1975 1976 1.977 1978 1979 1980 1981 1982 1983 1984 1985 CHANGE1975-.85
1979-81=100 PERCENT
WORLD
AGRICULTURAL PRODUCTS 77 83 85 91 95 101 105 104 106 109 109 3.58FOOD 74 80 84 90 94 101 106 105 106 109 108 3.90FEED 54 71 73 88 89 100 111 115 125 116 123 8.04RAW MATERIALS 88 94 95 100 99 102 99 98 99 101 100 .90'
BEVERAGES 89 92 83 90 100 99 101 104 107 114 118 3.08
FISHERY PRODUCTS 70 78 85 91 97 99 104 107 110 114
FOREST PRODUCTS 73 87 90 96 101 102 97 93 103 107 109 2.87
DEVELOPED COUNTRIES
AGRICULTURAL PRODUCTS 72 78 81 88 93 102 105 103 104 107 105 3.98FOOD 72 77 80 88 92 102 106 104 103 107 105 4.12FEED 54 67 65 86 91 102 106 112 123 108 110 7.57RAW MATERIALS 80 87 94 96 99 103 98 98 96 . 99 95 1.31BEVERAGES 76 82 87 83 99 98 103 104 108 118 123 4.69
FISHERY PRODUCTS 75 82 85 90 97 99 105 105 107 111
FOREST PRODUCTS 72 86 88 94 100 102 98 95 105 110 112 3.42
WESTERN EUROPE
AGRICULTURAL PRODUCTS 73 77 78 85 94 100 107 107 112 118 123 5.61FOOD 72 76 78 85 93 100 107 106 111 117 122 5.60PEED 52 61 61 82 90 95 114 134 149 143 152 12.25RAW MATERIALS 89 95 85 102 107 97 96 99 107 116 113 2.34BEVERAGES 76 83 85 83 99 97 104 106 111 121 128 5.03
FISHERY PRODUCTS 80 86 87 89 97 98 105 106 114 120
FOREST PRODUCTS 67 83 84 93 101 100 99 97 107 116 119 4.65
USSR AND EASTERN EUROPE
AGRICULTURAL PRODUCTS 99 96 107 96 100 100 100 102 97 99 99 ....04
FOOD 101 96 108 96 101 99 100 100 96 103 105 .15FEED 71 138 117 115 112 96 92 108 67 66 91 -3.32RAW MATERIALS 98 103 111 99 96 101 103 109 95 80 80 ...1.98
BEVERAGES 80 80 91 93 98 100 102 104 114 114 107 3.50
FISHERY PRODUCTS 114 113 106 101 104 106 90 80 104 103
FOREST PRODUCTS 100 106 108 112 103 100 97 97 102 103 103
NORTH AMERICA DEVELOPED
AGRICULTURAL PRODUCTS 65 72 75 89 91 104 104 101 98 99 83 3.32FOOD 66 73 74 88 91 103 106 103 99 100 82 3.46FEED 54 68 64 87 90 108 102 98 109 88 85 4.94RAW MATERIALS 71 69 82 97 98 110 93 93 85 95 83 1.85BEVERAGES 58 70 105 75 94 107 99 89 75 88 90 2.27
FISHERY PRODUCTS 47 54 76 90 94 97 109 107 106 103
FOREST PRODUCTS 72 84 88 91 99 103 98 92 103 106 106 3.05
OCEANIA DEVELOPED
AGRICULTURAL PRODUCTS 76 89 99 96 94 106 100 99 98 97 114 2.23FOOD 75 85 96 99 92 109 99 99 96 95 114 2.38FEED 80 120 142 137 151 66 83 107 105 68 76 ..4.01RAW MATERIALS 78 100 107 88 100 97 102 99 104 102 114 1.91BEVERAGES 96 100 89 83 84 98 118 117 142 151 150 5.89
FISHERY PRODUCTS 53 51 63 66 85 104 110 128 132 139
FOREST PRODUCTS 55 67 79 81 94 105 101 87 88 89 87 3.64

ANNEX TABLE 8. (C0B11 INDICES OF VOLUME OF EXPORTS OF AGRICULTURAL, FISHERY AND FOREST PRODUCTS
ANNUALRATE OF
1975 1976 1977 1978 1979 1980 1981 1982 1983 1984 1985 CHANGE1975...85
1979-811O0 PERCENT
DEVELOPING COUNTRIES
169
AGRICULTURAL PRODUCTS 85 93 93 95 98 98 104 106 110 112 117 2.91FOOD 81 90 97 94 97 97 106 108 112 114 118 3637FEED 53 75 83 90 86 97 116 118 127 126 139 8.53RAW MATERIALS 96 103 96 104 99 100 100 97 103 103 105 .49BEVERAGES 96 97 81 93 101 100 99 103 107 111 115 2.30
FISHERY PRODUCTS 63 73 85 92 97 100 103 109 113 120
FOREST PRODUCTS 77 97 98 104 107 102 91 86 94 93 92 .02
AFRICA DEVELOPING
AGRICULTURAL PRODUCTS 112 116 100 101 99 98 104 103 97 98 103 ..1.01FOOD 115 119 106 103 95 99 106 102 97 98 99 ...1.55FEED 115 135 137 93 132 96 72 92 99 64 73 ..6.08RAM MATERIALS 88 100 88 93 94 101 105 93 94 ' 109 114 1.75BEVERAGES 115 116 94 99 106 94 101 109 98 95 106 -.89
FISHERY PRODUCTS 63 68 71 83 84 90 126 133 173 159
FOREST PRODUCTS 86 109 107 107 108 106 86 84 84 93 85 -.1.93
LATIN AMERICA
AGRICULTURAL PRODUCTS 80 86 92 97 100 96 104 103 113 111 118 3.43FOOD 76 86 100 98 101 93 105 104 114 110 119 3.47FEED 47 66 82 85 82 97 120 115 134 131 143 10.21RAW MATERIALS 100 91 97 119 102 98 100 92 88 83 94 14.37BEVERAGES 94 93 72 91 102 101 97 102 111. 115 118 3.22
FISHERY PRODUCTS 72 73 79 87 96 107 97 110 95 102
FOREST PRODUCTS 46 49 59 71 92 105 103 94 113 127 118 10.71
NEAR EAST DEVELOPING
AGRICULTURAL PRODUCTS 90 109 98 106 95 95 110 118 115 116 93 1.13FOOD 71 91 94 102 90 92 118 130 125 127 99 4.25FEED 55 82 68 74 95 122 84 52 53 53 22 -7.02RAW MATERIALS 123 142 106 113 102 99 99 101 101 101 86 -3.15BEVERAGES 51 64 74 77 100 85 114 81 71 61 47 -.4.46
FISHERY PRODUCTS 78 60 94 83 101 92 107 126 133 148
FOREST PRODUCTS 59 66 69 59 90 85 124 138 163 224 178 14.69
FAR EAST DEVELOPING
AGRICULTURAL PRODUCTS 74 88 89 87 93 101 106 110 108 117 117 4.24FOOD 67 83 88 79 92 100 108 118 113 125 120 5.89FEED 57 85 83 105 92 98 110 124 99 111 119 5.38RAW MATERIALS 88 96 93 96 97 102 101 97 105 104 107 1.55BEVERAGES 82 88 87 92 90 105 105 102 103 120 124 3.92
FISHERY PRODUCTS 60 71 93 97 103 97 100 108 115 121
FOREST PRODUCTS 83 108 108 111 112 102 86 83 90 82 86 -2.08
ASIAN CENT PLANNED ECON
AGRICULTURAL PRODUCTS 97 92 86 95 100 103 96 106 127 143 178 5.71FOOD 105 92 84 94 99 105 95 98 108 126 173 4.23FEED 43 53 13 11 26 89 186 196 436 351 457 41.03RAW MATERIALS 87 109 110 112 113 96 91 122 168 182 175 6.35BEVERAGES 65 69 87 93 107 105 89 115 137 152 140 8.15
FISHERY PRODUCTS 55 88 85 103 91 98 111 106 118 139
FOREST PRODUCTS 94 99 98 126 107 92 101 93 96 85 83 -.1.76

170
ANNEX TABLE 9. INDICES OF VALUE OF IMPORTS OF AGRICULTURAL, FISHERY AND FOREST PRODUCTS
ANNUALRATE DF
1975 1976 1977 1978 1979 1980 1981 1982 1983 1984 1985 CHANGE1975-.85
1979-81-100 PERCENT
WORLD
AGRICULTURAL PRODUCTS 58 61 69 77 91 105 105 95 92 96 91 5.10FOOD 61 59 64 74 88 104 108 97 92 95 90 5.24FEED 40 53 68 72 88 100 112 106 115 100 86 8.39RAW MATERIALS 59 68 77 84 96 106 98 87 89 97 90 3.76BEVERAGES 45 63 97 93 103 109 88 87 89 99 101 4.92
FISHERY PRODUCTS 44 55 64 78 96 100 104 105 105 105
FOREST PRODUCTS 50 60 67 75 95 108 97 94 91 96 95 6.14
DEVELDPED COUNTRIES
AGRICULTURAL PRODUCTS 61 65 74 81 95 105 101 92 90 94 91 4.03FOOD 66 65 68 79 93 104 103 93 88 92 90 3.89FEED 41 55 68 72 88 100 112 104 112 94 82 7.51RAW MATERIALS 63 74 81 87 99 105 96 87 90 98 92 3.02BEVERAGES 45 64 98 93 104 110 86 87 88 98 101 4.78
FISHERY PRODUCTS 45 56 67 79 99 99 102 104 107 108
FOREST PRODUCTS 52 62 68 76 98 108 94 91 88 94 94 5.41
WESTERN EUROPE
AGRICULTURAL PRODUCTS 61 65 77 86 99 106 95 92 87 87 88 3.23FOOD 67 65 73 85 98 106 96 92 86 84 86 2.64FEED 39 53 66 72 89 101 109 106 107 95 83 8.10RAW MATERIALS 62 76 82 91 101 106 93 86 87 96 97 2.88BEVERAGES 44 61 96 91 104 110 86 86 86 92 95 4.56
FISHERY PRODUCTS 46 52 62 75 94 108 98 96 93 90
FOREST PRODUCTS 50 62 67 72 94 110 96 89 84 88 88 5.05
USSR AND EASTERN EUROPE
AGRICULTURAL PRODUCTS 56 60 61 66 83 102 115 98 93 96 88 6.14FOOD 53 58 52 61 80 101 119 100 90 97 88 7.11FEED 53 57 73 69 82 94 124 100 134 81 68 5.30RAW MATERIALS 72 71 82 80 97 107 97 88 98 94 89 2.72BEVERAGES 56 68 99 89 96 112 92 91 94 101 103 4.16
FISHERY PRODUCTS 77 90 92 94 104 107 89 85 99 89
FOREST PRODUCTS 87 78 83 84 86 106 107 101 90 89 96 1.72
NORTH AMERICA DEVELOPED
AGRICULTURAL PRODUCTS 60 69 81 88 99 104 98 86 91 105 105 4.41FOOD 70 69 72 81 95 102 104 87 92 104 106 4.33FEED 54 73 82 88 104 93 102 91 108 132 111 6.44RAW MATERIALS 55 73 76 83 102 99 99 78 91 114 93 4.43BEVERAGES 44 68 100 101 106 109 85 89 88 104 106 4.90
FISHERY PRODUCTS 50 68 75 80 96 96 108 113 130 133
FOREST PRODUCTS 53 66 77 96 103 97 100 102 115 134 135 8.28
OCEANIA DEVELOPED
AGRICULTURAL PRODUCTS 70 63 80 92 90 107 104 109 95 114 116 5.52FOOD 82 65 75 89 91 103 107 125 104 126 118 5.88FEED 92 24 43 186 48 87 164 75 339 107 193 14.96RAW MATERIALS 66 74 76 86 87 109 104 91 76 89 105 3.10BEVERAGES 50 49 94 100 90 114 96 92 87 111 120 7.01
FISHERY PRODUCTS 54 52 69 73 81 96 123 119 109 125
FOREST PRODUCTS 65 58 73 70 35 104 110 122 83 103 117 6.60

ANNEX TABLE 9 (Cont.) INDICES OF VALUE OF IMPORTS OF AGRICULTURAL, FISHERY AND FOREST PRODUCTS
ANNUALRATE OF
1975 1976 1977 1978 1979 1980 1981 1982 1983 1984 1985 CHANGE1975-85
1979-81=100 PERCENT
DEVELOPING COUNTRIES
171
AGRICULTURAL PRODUCTS 51 49 57 66 80 105 115 102 98 103 90 8.17FOOD 53 48 54 64 78 105 117 104 99 103 89 8.45FEED 30 40 67 71 82 99 119 122 140 160 122 16.01RAW MATERIALS 46 54 68 76 88 108 104 89 86 93 86 6.13'BEVERAGES 47 60 86 93 101 100 99 86 96 108 106 6.20
FISHERY PRODUCTS 39 45 49 70 81 104 115 111 97 88
FOREST PRODUCTS 41 49 63 69 84 104 112 107 104 106 101 9.80
AFRICA DEVELOPING
AGRICULTURAL PRODUCTS 54 48 60 71 80 106 114 100 93 94 95 7.32FOOD 54 46 56 69 78 106 115 102 94 94 96 7.95FEED 20 23 47 60 79 98 123 118 92 124 112 18.97RAW MATERIALS 66 63 78 84 97 101 102 104 103 107 106 5.44BEVERAGES 55 70 101 98 92 104 104 72 84 75 73 .59
FISHERY PRODUCTS 33 43 37 67 67 106 127 90 74 48
FOREST PRODUCTS 56 58 73 71 82 94 124 108 110 97 89 6.47
LATIN AMERICA
AGRICULTURAL PRODUCTS 47 48 52 63 78 110 112 87 86 88 76 6.97FOOD 47 47 49 62 74 111 115 88 87 87 75 7.07FEED 29 37 64 62 81 102 116 116 125 126 100 14.47RAW MATERIALS 47 52 65 73 95 108 98 81 79 104 87 6.27BEVERAGES 41 55 68 67 128 87 86 63 57 58 58 .86
FISHERY PRODUCTS 53 45 50 71 91 103 106 105 76 54
FOREST PRODUCTS 49 54 63 63 74 111 115 114 89 84 82 6.60
NEAR EAST DEVELOPING
AGRICULTURAL PRODUCTS 49 44 53 62 74 102 124 117 114 129 109 11.99FOOD 49 42 49 58 73 102 126 118 112 127 106 12.28FEED 19 42 74 83 84 87 129 136 190 211 201 22.57RAW MATERIALS 69 72 91 86 88 93 119 109 140 131 135 7.38BEVERAGES 42 52 83 113 93 107 100 102 113 139 131 9.89
FISHERY PRODUCTS 24 33 52 68 65 104 131 116 112 101
FOREST PRODUCTS 46 54 78 75 78 103 119 116 107 112 113 9.23
FAR EAST DEVELOPING
AGRICULTURAL PRODUCTS 63 62 65 73 85 102 113 98 102 114 98 6.42FOOD 67 62 61 70 83 103 114 98 102 110 94 6.17FEED 38 43 69 71 86 103 111 122 137 169 100 13.19RAW MATERIALS 52 65 82 81 92 102 106 93 94 114 101 5.96BEVERAGES 51 68 92 83 95 97 108 112 136 181 193 12.05
FISHERY PRODUCTS 45 52 59 73 90 101 109 136 126 136
FOREST PRODUCTS 35 47 56 71 99 101 100 96 95 99 92 9.56
ASIAN CENT PLANNED ECON
AGRICULTURAL PRODUCTS 40 37 54 64 66 106 108 101 82 69 57 6.22FOOD 45 37 56 63 88 101 111 110 89 73 57 6.29FEED 40 60 86 118 42 94 164 120 150 203 148 14.04RAW MATERIALS 31 37 47 67 80 118 101 81 65 58 55 5.90BEVERAGES 17 51 115 77 96 96 109 69 121 89 84 9.67
FISHERY PRODUCTS 33 42 47 78 96 107 97 105 110 132
FOREST PRODUCTS 21 32 49 67 77 110 114 109 144 156 145 20.74

172
ANNEX TABLE 10INDICES OF VOLUME OF IMPORTS OF AGRICULTURAL, FISHERY AND FOREST PRODUCTS
ANNUALRATE OF
1975 1976 1977 1978 1979 1980 1981 1982 1983 1964 1985 CHANGE1975.85
1979-81-100 PERCENT
WORLD
AGRICULTURAL PRODUCTS 78 84 85 90 96 100 104 105 106 109 110 3.58FOOD 75 81 84 89 95 100 105 107 107 110 110 3.97FEED 57 71 76 88 93 98 109 119 129 117 129 7.96RAW MATERIALS 91 95 93 99 100 102 98 97 98 102 103 .95BEVERAGES 90 93 84 89 100 99 101 .102 105 109 114 2.50
FISHERY PRODUCTS 76 84 84 90 98 98 103 107 111 114
FOREST PRODUCTS 72 86 90 96 102 101 96 94 101 106 108 2.89
DEVELOPED COUNTRIES
AGRICULTURAL PRODUCTS 85 92 90 94 99 99 102 104 104 107 110 2.39FOOD 84 91 90 93 98 99 103 105 104 108 109 2.47FEED 58 73 76 89 93 98 109 117 127 111 124 7.18RAW MATERIALS 98 104 98 103 103 101 97 97 99 104 106 .17BEVERAGES 91 93 83 89 100 100 100 102 103 108 113 2.39
FISHERY PRODUCTS 78 87 86 91 100 98 103 108 114 117
FOREST PRODUCTS 75 89 91 97 104 101 94 92 99 105 108 2.38
WESTERN EUROPE
AGRICULTURAL PRODUCTS 88 94 92 97 100 100 99 104 103 104 111 1.87FOOD 89 95 95 99 101 101 99 104 103 103 109 1.52FEED 55 70 74 90 94 98 108 119 119 114 128 7.86RAW MATERIALS 97 109 102 106 104 101 94 94 96 101 107 ,131BEVERAGES 89 90 84 87 100 98 102 103 105 105 112 2.54
FISHERY PRODUCTS 77 79 80 85 96 103 101 108 110 116
FOREST PRODUCTS 69 86 87 92 103 101 96 94 102 106 107 3.24
USSR AND EASTERN EUROPE
AGRICULTURAL PRODUCTS 73 79 75 77 89 99 112 110 104 106 101 4.42FOOD 66 75 70 73 87 98 115 113 100 107 100 5.33FEED 71 73 78 78 85 100 115 115 160 90 97 5.23RAW MATERIALS 99 92 91 93 98 103 99 99 110 105 102 1.25BEVERAGES 101 97 93 84 92 106 102 98 100 109 115 1.54
FISHERY PRODUCTS 136 149 123 102 109 104 87 87 111 119
FOREST PRODUCTS 101 94 97 96 92 105 103 97 90 90 97
NORTH AMERICA DEVELOPED
AGRICULTURAL PRODUCTS 92 102 95 101 103 97 100 97 101 110 117 1.38FOOD 91 106 104 103 103 95 101 96 102 109 119 1.11FEED 75 91 88 102 107 94 98 99 110 143 154 5.52RAW MATERIALS 94 101 101 102 105 95 100 91 98 115 114 1.00BEVERAGES 95 95 79 97 103 100 97 101 100 109 113 1.95
FISHERY PRODUCTS 88 107 99 100 103 95 102 107 122 127
FOREST PRODUCTS 76 91 96 109 107 97 96 87 107 123 129 3.30
OCEANIA DEVELOPED
AGRICULTURAL PRODUCTS 110 101 102 97 96 103 101 119 116 123 130 2.32FOOD 115 95 102 99 97 101 102 133 134 142 138 3.68FEED 140 36 52 218 56 95 150 83 371 83 275 11.15RAW MATERIALS 112 126 105 109 97 104 99 96 86 94 123 -1.39BEVERAGES 96 91 98 81 95 105 100 111 101 112 119 2.47
FISHERY PRODUCTS 81 80 94 89 88 99 114 121 113 135
FOREST PRODUCTS 97 83 100 86 96 100 104 113 83 100 125 1.84

ANNEX TABLE 10. (Cont.) INDICES OF VOLUME OF IMPORTS OF AGRICULTURAL, FISHERY AND FOREST PRODUCTS
ANNUALRATE OF
1975 1976 1977 1978 1979 1980 1981 1982 1983 1984 1985 CHANGE1975-.85
1979-'81=100 PERCENT
DEVELOPING COUNTRIES
173
AGRICULTURAL PRODUCTS 59 63 72 81 89 102 109 109 112 115 111 7.19FOOD 57 60 70 80 88 102 110 110 113 116 111 7.78FEED 43 51 70 81 87 101 112 134 148 173 173 14.92RAW MATERIALS 70 71 79 89 92 106 102 97 96 98 97 3.52BEVERAGES 80 93 93 93 102 93 105 101 117 119 118 3.51
FISHERY PRODUCTS 65 68 69 81 88 103 108 105 99 94
FOREST PRODUCTS 63 72 85 89 93 101 106 104 111 112 110 5.46
AFRICA DEVELOPING
AGRICULTURAL PRODUCTS 58 62 78 89 90 102 108 111 111 113 120 7.26FOOD 54 57 74 89 89 102 108 112 111 113 121 8.17FEED 22 28 49 60 82 96 122 130 107 144 145 20.06RAW MATERIALS 96 88 95 99 101 97 102 107 113 117 112 2.40BEVERAGES 93 104 118 96 89 94 116 92 115 108 111 1.02
FISHERY PRODUCTS 47 64 49 63 70 110 121 89 80 57
FOREST PRODUCTS 70 75 91 83 90 93 117 105 115 105 96 4.03
LATIN AMERICA
AGRICULTURAL PRODUCTS 55 61 68 81 86 107 107 93 99 96 91 5.54FOOD 53 59 67 80 83 109 108 93 100 95 89 5.82PEED 43 51 68 75 84 109 107 126 134 135 143 12.78RAW MATERIALS 73 75 85 88 97 103 99 91 87 110 105 3.24BEVERAGES 75 83 70 75 129 79 92 75 75 77 78 -..20
FISHERY PRODUCTS 86 69 64 78 98 102 100 87 69 60
FOREST PRODUCTS 78 77 86 81 84 110 106 99 88 83 82 1.18
NEAR EAST DEVELOPING
AGRICULTURAL PRODUCTS 51 55 67 74 85 99 116 121 127 144 131 11.24FOOD 48 52 64 72 84 99 117 122 126 144 129 11.92FEED 25 49 78 88 91 89 119 146 177 208 235 20.70RAW MATERIALS 100 96 102 84 91 88 121 115 149 130 135 4.38BEVERAGES 75 90 89 106 97 101 102 114 124 131 132 5.15
FISHERY PRODUCTS 39 49 71 73 75 103 122 117 113 102
FOREST PRODUCTS 58 70 88 83 86 101 112 121 122 135 136 8.36
FAR EAST DEVELOPING
AGRICULTURAL PRODUCTS 79 84 79 85 92 102 106 107 116 121 123 5.02FOOD 80 84 75 83 90 103 107 106 116 117 120 4.98FEED 55 58 73 86 93 101 106 136 153 192 174 13.38RAW MATERIALS 81 86 96 97 97 101 101 103 109 124 119 3.67BEVERAGES 79 94 95 83 95 93 112 123 155 183 174 8.58
FISHERY PRODUCTS 81 79 94 102 99 101 100 127 130 142
FOREST PRODUCTS 57 75 85 101 108 95 97 96 103 103 100 4.11
ASIAN CENT PLANNED ECON
AGRICULTURAL PRODUCTS 47 45 65 79 94 103 103 108 93 78 72 5.76FOOD 47 44 72 79 98 98 105 116 102 87 76 6..64
FEED 68 65 76 125 48 91 161 130 161 208 192 12.95RAW MATERIALS 46 47 51 79 85 116 99 89 71 56 62 3.29BEVERAGES 23 70 68 64 95 99 105 147 233 81 28 6.68
FISHERY PRODUCTS 69 62 68 90 111 92 96 127 110 136
FOREST PRODUCTS 48 56 71 86 86 103 111 106 146 152 150 12.02

174
ANNEX TABLE 11. THE IMPORTANCE OF AGRICULTURE N THE ECONOMY
AGRICULTURAL GDP AGRIC.POPULATIONCOUNTRY AS % AS %
TOTAL GDP TOTAL POPULATION TOTAL1984 1985
AGRIC.EXPORTS AGRIC.IMPORTS SHARE OF TOTALAS % AS % IMPORTS FINANCEDEXPORTS TOTAL IMPORTS BY AGR.EXPORTS
1985 1985 1985
ALGERIA 8 26 22 1
ANGOLA 72 7 36 9BENIN 45 66 81 10 aBOTSWANA 67 7 17 8BURKINA FASO 4: 86 86 35 29BURUNDI 92 82 17 52CAMEROON 22 66 49 14 '51
CAPE VERDE 23 47 17 36 1
CENTRAL AFRICAN REPUBLIC 39 68 54 30 60CHAD 79 78 34 124COMOROS 81 79 22 40CONGO 7 61 1 14 2COTE D.IVOIRE 26 61 77 19 127DJIBOUTI 79 34EGYPT 20 43 18 37 7
EQUATORIAL GUINEA 61 60 13 44ETHIOPIA 77 66 34 29GABON 6 7Z 17 1
GAMBIA 28 83 47 41 21
GHANA 52 53 62 17 52GUINEA 42 78 5 17 6GUINEA-BISSAU 81 57 29 17KENYA 31 79 71 12 47LESOTHO 83 60 28 4LIBERIA 36 72 30 24 29LIBYA 2 14 16MADAGASCAR .79 85 17 63MALAWI 80 95 6 83
MALI 56 83 91 23 53MAURITANIA 28 67 10 44 16MAURITIUS 14 25 41 20 36MOROCCO 17 41 17 21 9
MOZAMBIQUE 83 49 25 aNAMIBIA 39NIGER 53 89 19 29 18
NIGERIA 31 66 3 15 4REUNION 14 99 24 9RWANDA 92 82 18 26SAO TOME ANO PRINCIPE 37 69 61 24 42SENEGAL 17 80 14 27 8
SEYCHELLES 79 5 18 2
SIERRA LEONE 44 66 47 34 38SOMALIA 73 90 35 29SOUTH AFRICA 18 6 5 6
SUDAN 27 .66 66 27 28SWAZILAND 70 44 12 29TANZANIA 82 75 10 33TOGO 32 71 42 37 28TUNISIA 16 29 a 15 5
UGANDA 84 92 4 117ZAIRE 69 17 29 25
ZAMBIA 15 71 2 9 2
ZIMBABWE 71 41 4 51
BARBADOS 7 a 11 17 6
BELIZE 36 54 32 48BERMUDA 3 1 18CANADA 3 4 8 6 9COSTA RICA 22 28 67 8 58CUBA 21 86 13 65DOMINICA 33 31 57 21 29DOMINICAN REPUBLIC 15 41 59 16 34EL SALVADOR 21 41 58 11 45GRENADA 31 66 19 21GUADELOUPE 12 79 22 9GUATEMALA 54 65 10 62HAITI 63 47 25 16HONDURAS 27 60 71 8 55JAMAICA 6 32 27 20 13MARTINIQUE 10 56 22 15MEXICO a 33 7 15 11NICARAGUA 24 42 81 12 30PANAMA 28 47 10 12
TRINIDAD AND TOBAGO 9 2 24 3UNITED STATES 3 15 6 9
ARGENTINA 12 67 6 136BOLIVIA 25 44 5 19 5
BRAZIL 28 36 9 67CHILE 15 15 9 19COLOMBIA 20 31 69 12 63ECUADOR 15 35 22 7 26FRENCH GUIANA 29 4 18 1
GUYANA 25 24 41 6 16PARAGUAY 49 95 9 59
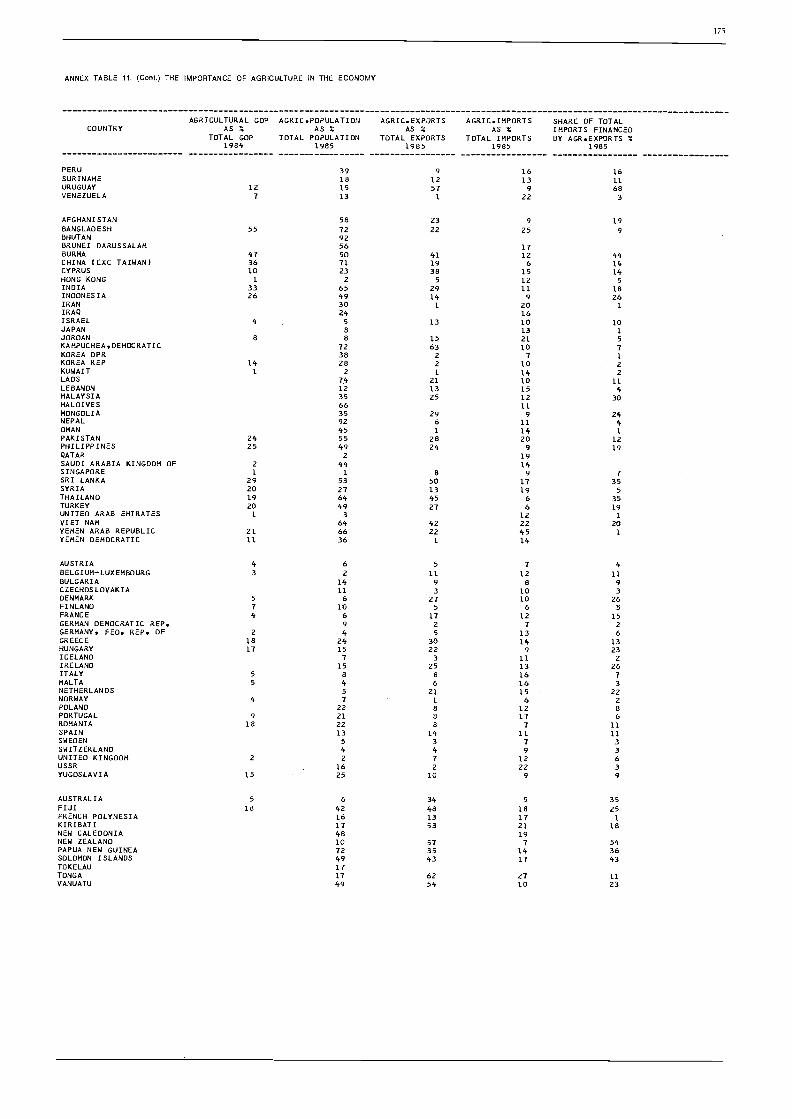
ANNEX TABLE 11. (Cont.) THE IMPORTANCE OF AGRICULTURE M THE ECONOMY
171
AGRICULTURAL GDP AGRIC.POPULATIONCOUNTRY AS % AS %
TOTAL GDP TOTAL POPULATION1984 1985
AGRIC.EXPORTS AGRIC.IMPoRTSAS %
TOTAL EXPORTS TOTAL1985
SHARE OF TOTALAS X IMPORTS FINANCEDIMPORTS BY AGR.EXPORTS X
1985 1985
PERU 39 9 16 16SURINAME la 12 13 11URUGUAY 12 15 57 9 68VENEZUELA 7 13 1 22 3
AFGHANISTAN 58 23 19BANGLADESH 55 72 22 2: 9BHUTAN 92BRUNEI DARUSSALAM 56 17BURMA 47 50 41 12 44CHINA (EXC TAIWAN) 36 71 19 6 14CYPRUS 10 23 38 15 14HONG KONG 1 2 5 12 5INDIA 33 65 29 11 18INDONESIA 26 49 14 9 26IRAN 30 1 20 1IRAQ 24 16ISRAEL 4 5 13 10 10JAPAN a 13 1
JORDAN 8 8 15 21 5KAMPUCHEA,DEMOCRATIC 72 63 10 7KOREA DPR 38 2 7 1KOREA REP 14 28 2 10 2KUWAIT 1 2 1 14 2LAOS 74 21 10 11LEBANON 12 13 15 4MALAYSIA 35 25 12 30MALDIVES 66 11MONGOLIA 35 29 9 24NEPAL 92 6 11 4OMAN 45 1 14 1
PAKISTAN 24 55 28 20 12PHILIPPINES 25 49 24 9 19QATAR 2 19SAUDI ARABIA KINGDOM OF 2 44 14SINGAPORE 1 1 8 9 7SRI LANKA 29 53 50 17 35SYRIA 20 27 13 19 5THAILAND 19 64 45 6 35TURKEY 20 49 27 6 19UNITED ARAB EMIRATES 1 3 12 1VIET NAM 64 42 22 20YEMEN ARAB REPUBLIC 21 66 22 45 1
YEMEN DEMOCRATIC 11 36 1 14
AUSTRIA 4 6 5 7 4BELGIUMLUXEMBOURG 3 2 11 12 11BULGARIA 14 9 8 9CZECHOSLOVAKIA 11 3 10 3DENMARK 5 6 27 10 26FINLAND 7 10 5 6 5FRANCE 4 6 17 12 15GERMAN DEMOCRATIC REP. 9 2 7 2GERMANY, PEO. REP. OF 2 4 5 13 6GREECE 18 24 30 14 13HUNGARY 17 15 22 9 23ICELAND 7 3 11 2IRELAND 15 25 13 26ITALY 5 8 8 16 7MALTA 5 4 6 16 3NETHERLANDS 5 21 15 22NORWAY 4 7 1 6 2POLAND 22 8 12 8PORTUGAL 21 8 17 6ROMANIA 1: 22 8 7 11SPAIN 13 14 11 11SWEDEN 5 3 7 3SWITZERLAND 4 4 9 3
UNITED KINGDOM 2 2 7 12 6USSR 16 2 22 3YUGOSLAVIA 15 25 10 9 9
AUSTRALIA5
6 34 5 35FIJI 18 42 48 18 25FRENCH POLYNESIA 16 13 17 1
KIRIBATI 17 53 21 18NEW CALEDONIA 48 19NEW ZEALAND 10 57 7 54PAPUA NEW GUINEA 72 35 14 36SOLOMON ISLANDS 49 43 17 43TOKELAU 17TONGA 17 62 27 11VAN UATU 49 54 10 23
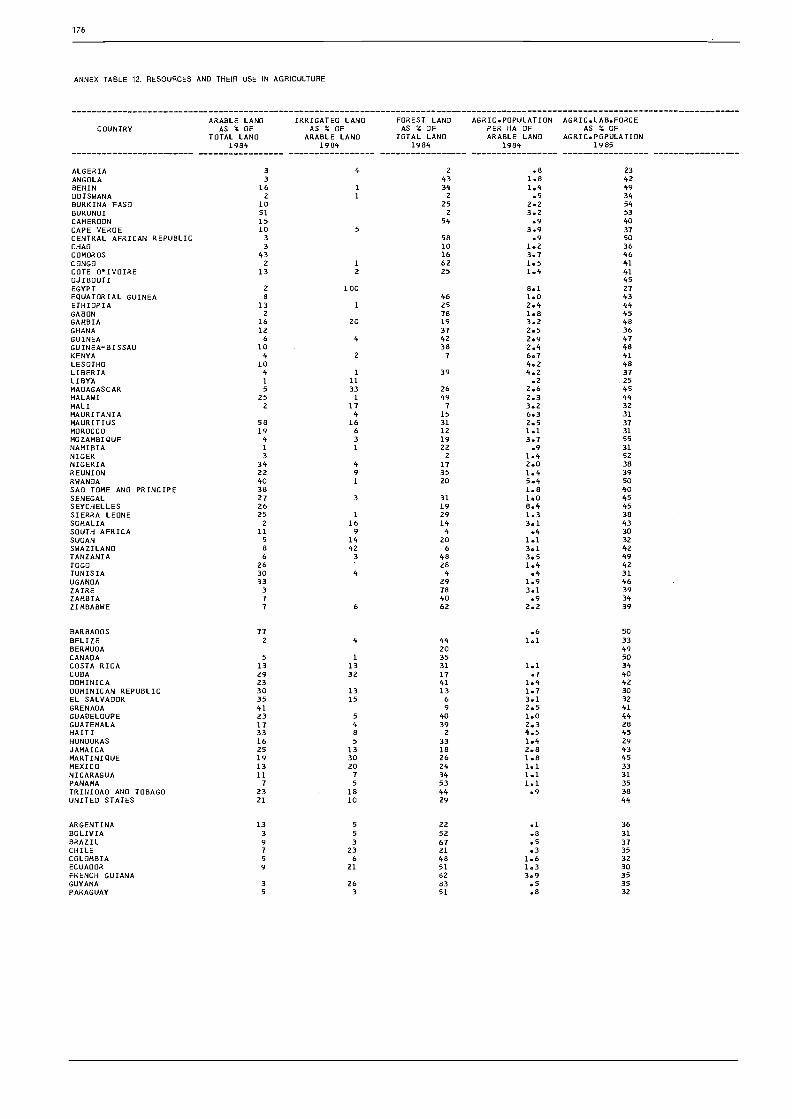
176
ANNEX TABLE 12. RESOURCES AND THEIR USE M AGRICULTURE
ARABLE LANDCOUNTRY AS % OF
TOTAL LAND1984
IRRIGATED LAND FOREST LAND AGRIC.POPULATION AGRIC.LAB.FORCEAS % OF AS % OF PER HA OF AS % OF
ARABLE LAND TOTAL LAND ARABLE LAND AGRIC.POPULATION1984 1984 1984 1985
ALGERIA 3 4 2 .8 23ANGOLA 3 43 1.8 42BENIN 16 1 34 1.4 49BOTSWANA 2 1 2 .5 34
BURKINA FASO 10 25 2.2 54BURUNDI 51 2 3.2 53
CAMEROON 15 54 .9 40CAPE VERDE 10 5 3.9 37CENTRAL AFRICAN REPUBLIC 3 58 .9 50
CHAD 3 10 1.2 36COMOROS 43 16 3.7 46CONGO 2 1 62 1.5 41COTE D'IVOIRE 13 2 25 1.4 41DJIBOUTI 45EGYPT Z 100 8.1 27EQUATORIAL GUINEA 8 46 1.0 43ETHIOPIA 13 1 25 2.4 44GABON 2 78 1.8 45GAMBIA 16 20 19 3.2 48GHANA 12 37 2.5 36GUINEA 6 4 42 2.9 47GUINEA-BISSAU 10 38 2.4 48KENYA 4 2 7 6.7 41
LESOTHO 10 4.2 48LIBERIA 4 1 39 4.2 37
LIBYA 1 11 .2 .25MADAGASCAR 5 33 26 2.6 45MALAWI 25 1 49 2.3 44MALI 2 17 7 3.2 32MAURITANIA 4 15 6.3 31
MAURITIUS 58 16 31 2.5 37MOROCCO 19 6 12 1.1 31
MOZAMBIQUE 4 3 19 3.7 55
NAMIBIA 1 1 22 .9 31NIGER 3 2 1.4 52NIGERIA 34 4 17 2.0 38
REUNION 22 9 35 1.4 39RWANDA 40 1 20 5.4 50SAO TOME AND PRINCIPE 38 1.8 40SENEGAL 27 3 31 1.0 45SEYCHELLES 26 19 8.4 45SIERRA LEONE 25 1 29 1.3 38SOMALIA 2 16 14 3.1 43SOUTH AFRICA 11 9 4 .4 30SUDAN 5 14 20 1.1 32SWAZILAND 8 42 6 3.1 42TANZANIA 6 3 48 3.5 49TOGO 26 28 1.4 42TUNISIA 30 4 4 .4 31UGANDA 33 29 1.9 46ZAIRE 3 78 3.1 39ZAMBIA 7 40 .9 34ZIMBABWE 7 6 62 2.2 39
BARBADOS 77 .6 50
BELIZE 2 4 44 1.1 33BERMUDA 20 49CANADA 5 1 35 50COSTA RICA 13 13 31 1.1 34CUBA 29 32 17 .7 40DOMINICA 23 41 1.4 42DOMINICAN REPUBLIC 30 13 13 1.7 30EL SALVADOR 35 15 6 3.1 32GRENADA 41 9 2.5 41
GUADELOUPE 23 5 40 1.0 44GUATEMALA 17 4 39 2.3 28HAITI 33 8 2 4.5 45HONDURAS 16 5 33 1.4 29JAMAICA 25 13 18 2.8 43MARTINIQUE 19 30 26 1.8 45MEXICO 13 20 24 1.1 33NICARAGUA 11 7 34 1.1 31PANAMA 7 5 53 1.1 35TRINIDAD AND TOBAGO 23 18 44 9 38UNITED STATES 21 10 29 44
ARGENTINA 13 5 22 .1 36BOLIVIA 3 5 52 .8 31BRAZIL 3 67 .5 37CHILE ; 23 21 .3 35COLOMBIA 5 48 1.6 32ECUADOR 2: 51 1.3 30FRENCH GUIANA 82 3.9 35GUYANAPARAGUAY .:
263
8351
.5
.a3532
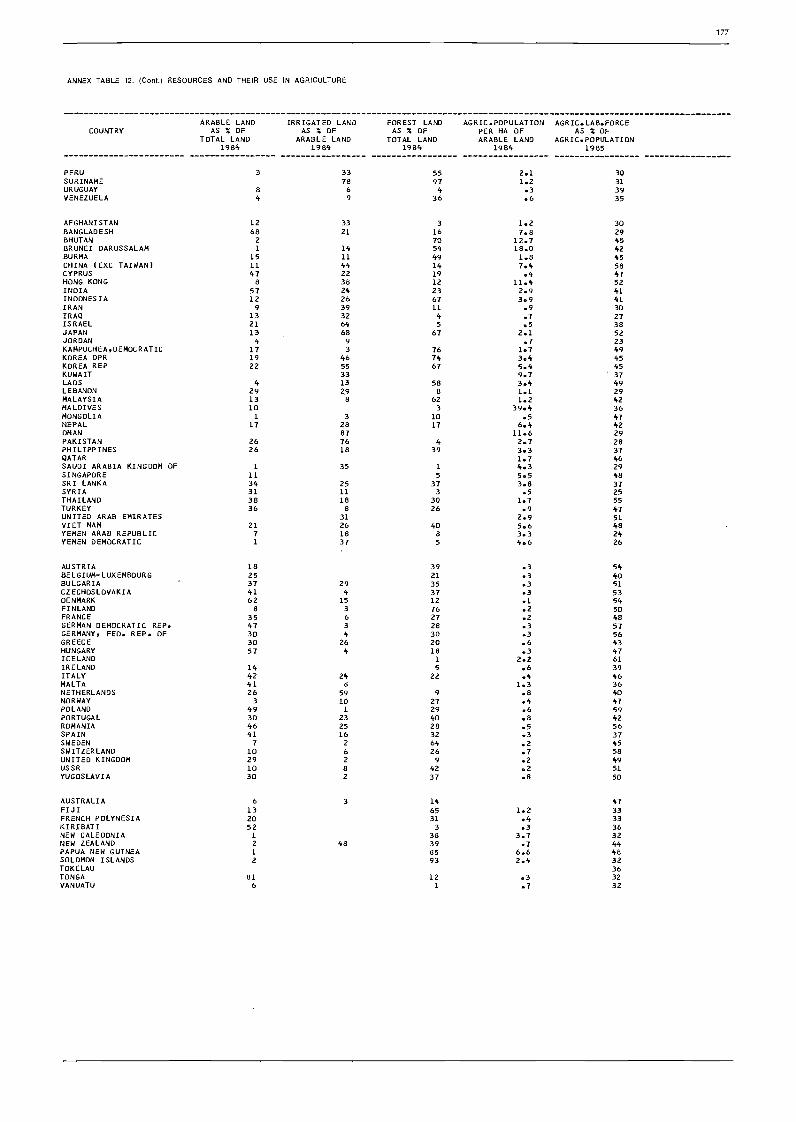
ANNEX TABLE 12. (COM.) RESOURCES AND THEM USE N AOR=LTURE
PERU 3 33 55 2.1 30SURINAME 78 97 1.2 31URUGUAY 8 6 4 .3 39VENEZUELA 4 9 36 .6 35
AFGHANISTAN 12 33 3 1.2 30BANGLADESH 68 21 16 7.8 29BHUTAN 2 70 12.7 45BRUNEI DARUSSALAM 1 14 54 18.0 42BURMA 15 11 49 1.8 45CHINA (EXC TAIWAN) 11 44 14 7.4 58CYPRUS 47 22 19 .4 47HONG KONG a 38 12 11.4 52INDIA 57 24 23 2.9 41INDONESIA 12 26 67 3.9 41IRAN 9 39 11 .9 30IRAQ 13 32 4 .7 27ISRAEL 21 64 5 .5 38JAPAN 13 68 67 2.1 52JORDAN 4 9 .7 23KAMPUCHEA,DEMOCRATIC 17 3 76 1.7 49KOREA DPR 19 46 74 3.4 45KOREA REP 22 55 67 5.4 45KUWAIT 33 9.7 37LAOS 4 13 58 3.4 49LEBANON 29 29 a 1.1 29MALAYSIA 13 a 62 1.2 42MALDIVES 10 3 39.4 36MONGOLIA 1 3 10 .5 47NEPAL 17 28 17 6.4 42OMAN 87 11.6 29PAKISTAN 26 76 4 2.7 28PHILIPPINES 26 18 39 3.3 37QATAR 1.7 46SAUDI ARABIA KINGDOM OF 1 35 1 4.3 29SINGAPORE 11 5 5.5 48SRI LANKA 34 25 37 3.8 37SYRIA 31 11 3 .5 25THAILAND 38 18 30 1.7 55TURKEY 36 a 26 .9 47UNITED ARAB EMIRATES 31 2.9 51VIET NAM 21 26 40 5.6 48YEMEN ARAB REPUBLIC 7 18 8 3.3 24YEMEN DEMOCRATIC 1 37 5 4.6 26
AUSTRIA la 39 .3 54BELGIUM...LUXEMBOURG 25 21 .3 40BULGARIA 37 29 35 .3 51CZECHOSLOVAKIA 41 4 37 .3 53DENMARK 62 15 12 .1 54FINLAND a 3 76 .2 50FRANCE 35 6 27 .2 48GERMAN DEMOCRATIC REP. 47 3 28 .3 57GERMANY, PEO. REP. OF 30 4 30 .3 56GREECE 30 26 20 .6 43HUNGARY 57 4 18 .3 47ICELAND 1 2.2 61IRELAND 14 5 .6 39ITALY 42 24 22 .4 46MALTA 41 a 1.3 36NETHERLANDS 26 59 9 .8 40NORWAY 3 10 27 .4 47POLAND 49 1 29 .6 59PORTUGAL 30 23 40 .8 42ROMANIA 46 25 28 .5 56SPAIN 41 16 32 .3 37SWEDEN 7 2 64 .2 45SWITZERLAND 10 6 26 .7 58UNITED KINGDOM 29 2 9 .2 49USSR 10 a 42 .2 51YUGOSLAVIA 30 z 37 .8 50
AUSTRALIA 6 3 14 47FIJI 13 65 1.2 33FRENCH POLYNESIA 20 31 .4 33KIRIBATI 52 3 .3 36NEW CALEDONIA 1 38 3.7 32NEW ZEALAND z 48 39 .7 44PAPUA NEW GUINEA 1 85 6.6 48SOLOMON ISLANDS 2 93 2.4 32TOKELAU 36TONGA 81 12 a3 32VANUATU 6 1 .7 32
177
ARABLE LAND IRRIGATED LAND FOREST LAND AGRIC.POPULATION AGRIC.LAB.FORCECOUNTRY AS S OF AS S OF AS S OF PER HA OF AS S OF
TOTAL LAND ARABLE LAND TOTAL LAND ARABLE LAND AGRIC.POPULATION1984 1.984 1984 1984 1985

178
ANNEX TABLE 12/8. RESOURCES AND THEIR USE N AGRICULTURE
AGRICULTURAL GFCF AGRICULTURAL GFCF FERTILIZER USE NOS. OF TRACTORS OFFICIAL COMMITM.COUNTRY $ PER HA $ PER CAPUT OF PER HA ARAB.LAND PER 000 HA TO AGRICULTURE
ARABLE LAND AGRIC.LAB.FORCE KG/HA ARABLE LAND $ PER CAPUT1984 1984 1984 1984 1985
ALGERIA 29 8 3.0ANGOLA 2 3 .5
BENIN 4 6.1BOTSWANA 2.8 16.8 1 2 19.7BURKINA FASO .1 .1 4 7.5BURUNDI 1 13.4CAMEROON 7 7.6CENTRAL AFRICAN REPUBLIC I 10.8CHAD 2 7.0COMOROS 2.8CONGO 4 1 12.5COTE WIVOIRE 10 1 7.0EGYPT 314.5 148.4 344 17 3.8ETHIOPIA 2 3.0GABON 48.1 57.3 6 3
GAMBIA 13 11.6GHANA 3 1 6.6GUINEA 11.8GUINEA-BISSAU 12.6KENYA 32.0 11.6 34 3 3.8LESOTHO 48.7 24.5 15 5 10.5LIBERIA 3 1 9.1LIBYA 400.0 6197.8- 55 13MADAGASCAR 2 1 7.7MALAWI 25 1 15.8MALI 11 10.1MAURITANIA 2 2 26.9MAURITIUS 75.7 84.4 253 3 2.8MOROCCO 30 4 12.9MOZAMBIQUE 1 2 3.5NAMIBIA 4
NIGER 8.2NIGERIA 9REUNION 127 31RWANDA 2 6.4SAO TOME AND PRINCIPE 3
SENEGAL 4 9.6SEYCHELLES 5
SIERRA LEONE 1 1.6SOMALIA 4 2 19.1SOUTH AFRICA 32.2 263.1 73 14SUDAN 4 1 7.1SWAZILAND 104.2 80.9 59 26 15.3TANZANIA 8.3 4.8 7 4 3.6TOGO 6 2.3TUNISIA 67.5 485.0 18 6 25.3UGANDA 1 4.3ZAIRE 2 3.0ZAMBIA 11 I 16.8ZIMBABWE 45.5 52.9 54 8 9.7
BARBADOS 200 18BELIZE 37 17CANADA 67.4 5690.8 51 14COSTA RICA 92.3 241.0 149 10 20.8CUBA 179 20DOMINICA 147 5DOMINICAN REPUBLIC 40 2 2.8EL SALVADOR 12.7 13.2 76 5 15.7GRENADA 2GUADELOUPE 202 25GUATEMALA 41.5 62.7 50 2 1.9HAITI 4 1 3.9HONDURAS 21 2 9.7JAMAICA 86 11 29.7MARTINIQUE 530 50MEXICO 67 6 5.9NICARAGUA 38 2 4.1PANAMA 50 7 18.3TRINIDAD ANO TOBAGO 52 22 .9UNITED STATES 87.7 4736.6 104 25
ARGENTINA 4 6 3.7BOLIVIA 2 4.4BRAZIL 45 10 3.4CHILE 33 6
COLOMBIA 64 5 .1ECUADOR 29 3 19.8FRENCH GUIANA 117 32GUYANA 30 7 20.2PARAGUAY 4 4 15.8PERU 21 5 3.4SURINAME 199 28URUGUAY 37 23 .2VENEZUELA 63.7 305.5 71 11 2.0

ANNEX TABLE 12/B. (Cont) RESOURCES AND THEIR USE IN AGRICULTURE
179
AGRICULTURAL GFCF AGRICULTURAL GFCF FERTILIZER USE NOS. OF TRACTORS OFFICIAL COMMITM.COUNTRY $ PER HA $ PER CAPUT OF PER HA ARAB.LAND PER 000 HA TO AGRICULTURE
ARABLE LAND AGRIC.LAB.FORCE KG/HA ARABLE LAND $ PER CAPUT1984 1984 1984 1984 1985
AFGHANISTAN 9BANGLADESH 65 1 4.3BHUTAN 2 2.6BRUNEI DARUSSALAM 10BURMA 19 1 4.1CHINA IEXC TAIWAN/ 194 9 .4CYPRUS 128.7 761.6 41 26 11.4HONG KONG 1
INDIA 42.7 37.1 47 3 1.5INDONESIA 90 1 6.1IRAN 156.1 526.8 62 7IRAQ 358.4 1834.1 22 7ISRAEL 258.2 1272.9 229 64JAPAN 146.1 126.3 440 345JORDAN 36 12 15.3KAMPUCHEA,DEMOCRATIC 1
KOREA DPR 335 29KOREA REP 651.1 275.5 359 4 66KUWAIT 150 9LAOS 1LEBANON 170 10MALAYSIA 104.4 205.8 140 2 8.1MONGOLIA 13 8NEPAL 18 1 7.3OMAN 20 2 8.0PAKISTAN 304,4 40.6 61 7 4.9PHILIPPINES 33 2 2.4QATAR 151 21SAUDI ARABIA KINGDOM OF 190 1SINGAPORE 833 9SRI LANKA 87 12 12.8SYRIA 93.0 738.6 39 7 1.9THAILAND 30.0 33.3 24 6 2.4TURKEY 56 20 7.2UNITED ARAB EMIRATES 10893.0 6808.3 235VIET NAM 60 6YEMEN ARAB REPUBLIC 85.6 110.4 13 2 9.8YEMEN DEMOCRATIC 14 7 13.0
AUSTRIA 470.9 2719.1. 256 214BELGIUM...LUXEMBOURG 394.0 3102.9 517 146BULGARIA 233 14CZECHOSLOVAKIA 339 26DENMARK 209.0 3020.2 251 65FINLAND 397.4 3653.5 217 102FRANCE 177.1 1915.3 307 81GERMAN DEMOCRATIC REP. 314 31GERMANY, FED. REP. OF 418.2 2242.2 427 199GREECE 90.4 337.7 168 43HUNGARY 288 10ICELAND 5462.5 53972.7 3330 1750IRELAND 325.8 1420.2 697 159ITALY 304.3 1698.9 171 98MALTA 250.8 543.3 86 34NETHERLANDS 1117.3 3607.4 786 217NORWAY 691.5 4192.9 295 171POLAND 222 54PORTUGAL 78 29 6.4ROMANIA 159 16SPAIN 80 30SWEDEN 235.4 3438.5 152 63SWITZERLAND 437 251UNITED KINGDOM 211.9 2293.3 370 77USSR 99 12YUGOSLAVIA 108.2 238.3 125 74 1.7
AUSTRALIA 26 7FIJI 66 20 43.8FRENCH POLYNESIA 24 2NEW CALEDONIA 25 62NEW ZEALAND 1121.0 3578.1 1042 152PAPUA NEW GUINEA 18 3 16.1TONGA 77.4 683.3 2 1
VANUATU 1

180
ANNEX TABLE 13. MEASURES OF OUTPUT AND PRODUCTWITY M AGRICULTURE
AGRICULTURAL GDP AGRICULTURAL GDPCOUNTRY $ PER CAPUT GROWTH RATE
AGRIC.POPULATION 1975-841984 1
INDEX OF FOOD INDEXPRODUC.PER CAPUT PRODUC.PER
1979-81=1001984-86
OF TOT.AOR. PER CAPUT DIETARY INDEX OF VALUECAPUT ENERGY SUPPLIES OF AGRIC.EXPORTS
1979-.81=100 AS X OF REQUIREM. 1979-.81=1001984-.86 1984 1983-.85
ALGERIA 693 12.9 114 98 112 103ANGOLA 102 89 84 110BENIN 154 8.8 133 118 94 118BOTSWANA 87 97 80 96 126BURKINA FASO .62 5.5 127 113 81 106BURUNDI 118 10.2 109 94 91 101CAMEROON 252 7.9 111 97 90 98CAPE VERDE 125 6.0 96 87 112 92CENTRAL AFRICAN REPUBLIC 126 4.9 106 95 91 114CHAD 56 112 99 63 299COMOROS 113 97 90 80CONGO 138 4.1 106 93 115 132COTE D'IVOIRE 302 6.0 121 94 108 75DJIBOUTI 134EGYPT 439 7.6 117 100 130 137EQUATORIAL GUINEA 72ETHIOPIA 59 5.8 97 87 72 255GABON 256 6.3 106 98 104 111GAMBIA 90 5.2 129 116 93 116GHANA 568 20.5 134 113 .76 92GUINEA 185 4.3 104 93 75 87GUINEA-BISSAU 143 130 84 59KENYA 102 4.6 101 91 93 119LESOTHO 68 4.0 94 84 103 119LIBERIA 228 6.8 117 99 100 97LIBYA 1416 12.3 162 133 153 100MADAGASCAR 131 6.1 113 98 109 69MALAWI 75 6.0 106 93 106 66KALI 85 2.2 114 100 76 167MAURITANIA 150 6.8 101 87 90 129MAURITIUS 443 110 103 121 78MOROCCO 223 3.2 125 111 111 84MOZAMBIQUE 99 85 72 134NAMIBIA 98 84 83 105NIGER 112 3.9 96 83 96 89NIGERIA 369 11.5 116 98 86 72REUNION 90 85 129 90RWANDA 102 88 83 133SAO TOME AND PRINCIPE 132 79 70 104 81SENEGAL 80 115 101 98 102SEYCHELLES 90SIERRA LEONE 167 9.6 107 96 79 59SOMALIA 105 90 90 103SOUTH AFRICA 630 4.5 95 84 122 160SUDAN 164 1.6 110 98 74 93SWAZILAND 112 96 111 119TANZANIA 150 13.4 111 91 101 95TOGO 103 1.9 103 91 97 126TUNISIA 529 4.2 119 107 119 94UGANDA 135 115 89 53ZAIRE 78 3.3 115 100 97 95ZAMBIA 87 3.6 112 95 93 62ZIMBABWE 105 4.0 114 103 86 157
BARBADOS 3309 6.6 88 87 129 89BELIZE 102 91 114 76BERMUDA 112CANADA 9771 5.6 115 109 129 95COSTA RICA 1037 4.5 99 92 125 82CUBA 113 110 135 104DOMINICA 893 124 119 109 112DOMINICAN REPUBLIC 606 7.1 113 101 109 98EL SALVADOR 421 5.5 103 79 94 94GRENADA 464 93 88 98 89GUADELOUPE 122 119 Ill 86GUATEMALA 108 86 105 73HAITI 105 93 82 98HONDURAS 300 10.1 108 92 98 52JAMAICA 179 112 104 115 108MARTINIQUE 128 127 116 85MEXICO 567 5.4 110 96 136 88NICARAGUA 831 10.0 89 77 108 119PANAMA 673 7.9 111 102 105 108TRINIDAD AND TOBAGO 2296 13.3 95 87 124 114UNITED STATES 104 98 139 101
ARGENTINA 2365 157.6 107 99 122 47BOLIVIA 735 15.2 107 93 90 95BRAZIL 637 5.7 119 105 110 60CHILE 992 10.3 109 100 107 58COLOMBIA 767 9.3 106 93 Ill 106ECUADOR 563 9.7 113 99 90 134FRENCH GUIANA 92GUYANA 388 96 87 110 56PARAGUAY 777 13.8 114 102 121 80

ANNEX TABLE 13 Cont.) MEASURES OF OUTPUT AND PRODUCTIVITY M AGRICULTURE
PERU 294 114 98 92 76SURINAME 1039 9.6 122 116 119 103URUGUAY 1208 5.9 104 102 101 52VENEZUELA 1532 11.7 103 90 105 94
AFGHANISTAN 102 97 91 80BANGLADESH 95 2.4 113 99 86 115BHUTAN 70 113 102 143BRUNEI DARUSSALAM 123 99 126 135BURMA 165 7.2 136 122 118 68CHINA (EXC TAIWAN/ 136 9.8 130 125 110 56CYPRUS 1236 6.1 99 93 140 109HONG KONG 1762 4.4 127 115 118 106INDIA 110 7.1 122 111 99 132INDONESIA 258 8.9 120 108 117 77IRAN 109 95 130 125IRAQ 125 105 121 111ISRAEL 3452 4.0 113 100 119 88JAPAN 110 104 122 96JORDAN 1031 14.4 123 102 120 113KAMPUCHEA.DEMOCRATIC 161 144 95 30KOREA DPR 120 106 135 59KOREA REP 980 6.9 114 104 121 87KUWAIT 4312 18.2 107LAOS 139 124 100 25LEBANON 120 118 121 87MALAYSIA 123 104 IZO 117MALDIVES 125 106 92 87MONGOLIA 109 93 116 69NEPAL 115 101 92 129OMAN 473 20.8 163PAKISTAN 122 8.9 118 104 93 131PHILIPPINES 317 7.3 106 94 104 104QATAR 116SAUDI ARABIA KINGDOM OF 543 25.3 215 171 129 112SINGAPORE 4999 6.2 104 98 120 122SRI LANKA 188 8.2 97 90 107 85SYRIA 1322 18.1 112 95 128 141THAILAND 251 7.6 120 109 111 105TURKEY 382 111 100 126 193UNITED ARAB EMIRATES 8039 18.2 92VIET NAM 128 116 104 45YEMEN ARAB REPUBLIC 157 9.0 123 107 93 101YEMEN DEMOCRATIC 105 4.0 100 88 97 105
AUSTRIA 4869 2.6 107 107 134 86BELGIUM...LUXEMBOURG 7705 1.0 103 103 140 91BULGARIA 101 99 147 125CZECHOSLOVAKIA 119 118 140 75DENMARK 9208 4.4 126 126 132 86FINLAND 7457 5.2 113 110 112 72FRANCE 5292 2.2 109 107 133 85GERMAN DEMOCRATIC REP. 108 109 145 93GERMANY/ FED. REP. OF 5108 .4 113 114 130 88GREECE 2131 5.9 103 101 149 IZOHUNGARY 2061 7.4 108 109 132 68ICELAND 98 92 116 88IRELAND 110 103 153 81ITALY 3838 4.4 101 100 140 93MALTA 2400 6.8 114 109 103 76NETHERLANDS 109 106 124 94NORWAY 6803 3.1 109 107 121 73POLAND 110 105 125 46PORTUGAL 797 101 98 129 93ROMANIA 1339 9.1 116 113 128 48SPAIN 107 104 136 89SWEDEN 107 106 115 81SWITZERLAND 109 107 128 87UNITED KINGDOM 6005 5.9 110 110 124 81USSR 112 106 134 105YUGOSLAVIA 972 4.3 101 98 142 71
AUSTRALIA 8945 6.1 108 104 127 107FIJI 685 3.6 110 100 110 97FRENCH POLYNESIA 101 90 109 99KIRIBATI 68NEW CALEDONIA 108 96 110 82NEW ZEALAND 111 105 128 112PAPUA NEW GUINEA 112 97 82 79SOLOMON ISLANDS 128 107 80 111TONGA 1408 7.4 95 85 108 104VANUATU 109 89 88 86
181
AGRICULTURAL GDP AGRICULTURAL GDP INDEX OF FOOD INDEX OF TOT.AGR. PER CAPUT DIETARY INDEX OF VALUECOUNTRY PER CAPUT GROWTH RATE PRODUCPER CAPUT PRODUCPER CAPUT ENERGY SUPPLIES OF AGRICaEXPORTS
AGRIC.POPULATION 1975.-84 1979..81=100 1979..81=100 AS X OF REQUIREM. 1979..81=1001984 X 1984-86 1984.-86 1984 1983..85

182
ANNEX TABLE 14. CARRY-OVER STOCKS OF SELECTED AGRICULTURAL PRODUCTS
CROP YEAR ENDING IN1981 1982 1983 1984 1985 1986A 1987e
MILLION TONS
CEREALS
DEVELOPED COUNTRIES 147.7 187.9 234.8 156.8 202.7 286.9 328.2CANADA 14.0 16.2 18.5 13.3 12.2 14.8 23.6UNITED STATES 71.8 111.2 152.2 79.5 98.8 181.1 211.7AUSTRALIA 2.6 5.3 2.5 8.1 8.8 6.1 3.9EEC 20.8 18.2 22.8 15.6 33.6 35.9 28.6JAPAN 8.8 7.1 5.2 4.8 5.2 5.6 6.3USSR 15.0 13.0 18.0 23.0 29.0 31.0 40.0
DEVELOPING COUNTRIES 102.3 108.8 106.0 123.4 133.5 130.2 123.2
FAR EAST 76.8 78.2 78.3 97.3 106.9 98.2 89.1BANGLADESH 1.3 0.7 0.6 0.8 1.0 1.0 0.9CHINA 48.0 46.0 51.0 58.0 64.0 52.0 46.0INDIA 7.1 7.7 7.6 12.8 18.1 17.0 14.4PAKISTAN 1.5 2.2 2.2 2.2 1.5 1.8 2.3
NEAR EAST 10.1 12.8 11.9 14.0 13.4 13.7 14.1TURKEY 0.5 1.1 1.0 0.3 0.7 0.5 0.6
AFRICA 3.4 4.7 4.6 3.1 2.9 6.1 8.3
LATIN AMERICA 11.9 13.2 11.2 9.0 10.2 12.1 11.6ARGENTINA 1.0 1.5 1.8 1.7 1.0 0.9 1.2BRAZIL 2.8 3.3 3.1 1.5 2.0 3.4 4.3
WORLD TOTALOF WHICH: 250.0 296.7 340.8 280.2 336.2 417.0 451.4
WHEAT 98.6 105.7 122.0 134.4 152.9 159.2 164.7RICE (MILLED BASIS) 43.9 45.8 42.8 47.7 53.9 54.8 49.6
COARSE GRAINS 107.5 145.2 176.0 98.0 129.3 203.0 237.1
SUGAR (RAW VALUE)
WORLD TOTAL 1 SEPT. 25.5 33.3 39.1 39.9 40.3 37.4
COFFEEc 2.50 2.97 3.26 3.08 3.05 2.59
DRIED SKIM MILK ....THOUSAND TONS....
UNITED STATES 404 582 628 566 459 312EEC 368 670 996 664 597 821
TOTAL OF ABOVE 772 1 252 1 624 1 280 1 056 1 133
A ESTIMATE.B FORECAST.c GROSS OPENING STOCKS AT THE COMMENCING OF THE COFFEE YEARS, 1 OCTOBER.
SOURCE: FAO, COMMODITIES AND TRADE DIVISION.

ANNEX TABLE 15. ANNUAL CHANGES IN CONSUMER PRICES: ALL ITEMS AND FOOD
ALL ITEMS FOOD1970 1975 1980 1984 1970 1975 1980 1984
REGION AND COUNTRY TO TO TO TO TO TO TO TO1975 1980 1985 1985 1975 1980 1985 1985
%/YEAR
DEVELOPED COUNTRIES
WESTERN EUROPEAUSTRIA 7.4 3.8 4.8 3.2 6.7 4.4 4.1 2.2BELGIUM 8.3 6.4 13.3 4.8 4.6 7.5 7.5 3.5DENMARK 9.5 10.4 7.9 4.7 10.7 ... 8.1 4.2FINLAND 2.0 10.6 8.5 5.8 12.4 10.8 9.3 7.7FRANCE 8.8 10.4 9.6 5.8 9.6 10.0 9.7 4.9GERMANY, FED. REP. 6.2 4.0 3.8 2.2 5.6 3.3 3.2 0.8GREECE 13.1 16.3 20.5 19.3 14.7 17.6 20.6 19.5ICELAND 24.8 42.0 50.5 32.3 28.3 41.0 53.1 37.5IRELAND 13.0 84.9 12.1 5.3 14.3 13.7 10.0 3.8ITALY 11.4 3.0 13.8 9.2 11.6 15.6 12.5 8.7NETHERLANDS 8.6 6.1 4.0 2.2 6.9 ... 3.3 0.8NORWAY 8.3 8.4 8.9 5.7 8.3 7.4 6.6 ...PORTUGAL 15.3 23.9 19.3 16.3 21.0 24.2 17.7SPAIN 12.0 18.6 12.3 8.8 12.1 16.0 12.3 9.5SWEDEN 7.8 10.5 8.9 7.4 7.9 10.7 11.7 7.4SWITZERLAND 7.9 2.4 4.1 3.4 7.3 2.9 4.9 3.0UNITED KINGDOM 12.3 14.4 6.8 6.1 15.1 13.9 5.5 3.1YUGOSLAVIA 19.3 18.2 45.7 73.5 19.1 19.4 47.1 70.4
NORTH AMERICACANADAUNITED STATES
OCEANIAAUSTRALIA 10.2 10.6NEW ZEALAND 9.8 14.8
7.4 8.46.7 8.9
7.3 4.05.2 3.6
8.4 6.711.3 15.5
11.1 9.99.5 7.6
9.8 12.09.4 16.8
5.9 2.93.8 2.4
7.8 6.29.6 14.7
OTHER DEVELOPEDCOUNTRIES
ISRAEL 23.9 60.0 193.7 304.7 25.1 65.0 192.9 316.5JAPAN 12.0 6.5 2.6 2.0 13.0 5.5 2.6 1.7SOUTH AFRICA 9.3 12.0 13.7 16.2 11.7 13.0 12.9 11.9
DEVELOPING COUNTRIES
LATIN AMERICA
ARGENTINA 59.5 100.0 207.9 672.2 58.0...
327.0 624.1BAHAMAS 9.5 6.9 5.5 4.6 11.8 7.7 5.1 5.6BARBADOS 18.6 10.0 6.1 3.9 21.0 9.1 6.1 5.2BOLIVIA 23.7 17.0 51.6A 1 168.0 27.2 16.4 . 1 128.0BRAZIL 23.5e 46.0 133.7 201.6 25.9B 49.0 142.8. 210.3CHILE 225.4 70.0 41.0 30.7 245.5 70.0 18.0 28.3COLOMBIA 19.5 23.0 21.9 25.3 24.0 25.0 22.5 32.9COSTA RICA 13.7 8.1 36.3 14.5 3.7 9.6 38.5 12.3DOMINICAN REPUBLIC 11.1 8.3 10.6A 13.3 3.4 8.6A ..ECUADOR 13.7 11.7 27.2 28.0 18.4 11.2 35.6A 30.7EL SALVADOR 8.4 ... 14.0 22.3 8.8 ... 14.3 18.9GUATEMALA 2.9 10.7
...18.7 3.3 9.4 . 20.5
GUYANA 8.2 12.8 19.6A 12.2 14.1 26.8A .HAITI 13.7 8.0 8.8 10.8 15.5 9.3 6.6 11.17HONDURAS 6.5 9.2 7.1 1.8 8.0 9.6 4.2 1.7JAMAICA 14.9 22.0 25.8 17.2 24.0 15.7 25.6MEXICO 12.4 21.0 18.9 57.7 13.9 19.5 63.7 59.7PANAMA 7.8 6.9 9.6 1.0 9.9 6.6 3.6 0.3PARAGUAY 12.6 14.7 3.1 15.4 14.9 ...PERU 12.1 37.0 100.2 163.3 13.9 50.0 87.8 ...PUERTO RICO 8.8 5.6 2.9 0.4 12.6 5.5 2.8 0.4SURINAME 8.2 11.5 6.4 10.9 9.5 12.2 4.8 9.9TRINIDAD & TOBAGO 13.7 12.9 13.1 7.7 17.1 11.1 14.8 8.5URUGUAY 73.4 55.0 43.7 72.2 76.0 55.0 43.1 63.0VENEZUELA 5.5 11.4 10.5 11.9 8.5 15.7 13.6 20.8
FAR EAST
BANGLADESH 39.0c 7.6 10.1 9.0 42.0c 5.0 10.9 8.6BURMA 17.8 3.8 4.5 6.7 21.0 2.6 4.2 9.8INDIA 13.2 1.3 6.9 3.3 14.2 0.8 6.7 2.7INDONESIA 21.3 10.1 4.7 25.2
...8.4 2.4
KOREA, REP. OF 14.3 17.2 6.3 2.5 16.8 17.2 5.4 3.7MALAYSIA 6.7 4.6 4.5 0.3 10.4 3.7 2.5 -2.5NEPAL 10.3 6.7 11.6 27.6 9.8 6.1 4.1 -0.4PAKISTAN 15.2 9.0 7.6 7.2 16.6 8.0 7.5 5.8PHILIPPINES 18.7 12.0 20.6 23.1 20.1 11.0 20.2 22.3SRI LANKA 8.0 9.9 12.6 1.5 9.1 10.7 12.6 0.1THAILAND 9.8 10.4 4.6 3.2 11.9 10.6 3.0 -2.0
183

184
ANNEX TABLE 15. (Cont.) ANNUAL CHANGES IN CONSUMER PRICES: ALL ITEMS AND FOOD
ALL ITEMS FOOD1970 1975 1980 1984 1970 1975 1980 1984
REGION AND COUNTRY TO TO TO TO TO TO TO TO1975 1980 1985 1985 1975 1980 1985 1985
%/YEAR
AFRICA
ALGERIA 5.1 12.4 7.1A 7.2 15.7 4.0ABOTSWANA ... 12.4 8.5 8.1 13.8 9.6BURUNDI ... 18.3 8.9 3.8 ... 16.2 9.4 7.8CAMEROON 10.2 10.7 11.6 11.1 11.5 11.8 ... ...ETHIOPIA 3.7 15.7 6.6 19.4 2.7 19.2 6.8 26.4GABON 11.4 12.9 10.1 7.4 2.7 ... ... ...GAMBIA 10.5 10.2 12.0 17.3 12.8 9.7 13.4 18.2GHANA 17.4 70.0 118.5 10.4 20.3 45.0 51.3 -11.1COTE D'IVOIRE 8.2 16.7 11.7 1.8 9.3 19.3 4.2 1.6KENYA 13.9° 9.8 15.3 11.3 14.7° 10.2 12.9 13.8LESOTHO 14.7° 15.1 13.7 16.1 16.4° 18.6 13.1 11.3LIBERIA 12.1 8.8 3.4 -1.0 13.7 8.1 2.1 -3.6MADAGASCAR 9.7 9.2 20.0 10.6 12.0 9.0 19.8 12.6MALAWI 8.9 9.2 18.7 10.7 9.5 9.1MAURITIUS 13.1 16.9 ... 6.7 14.7 16.3 7.2MOROCCO 5.4 9.7 9.7 7.7 7.2 9.3 10.3 7.6NIGER 7.9 14.6 6.8 -1.0 10.6 14.8 8.4 -2.5NIGERIA 11.5 14.4 19.9 5.5 13.1 20.0 21.3 3.9SENEGAL 13.0 6.8 12.3 13.1 16.5 6.4 11.5 9.1SIERRA LEONE 8.4 13.8 45.0" ... 11.0 12.9 43.1A ...SWAZILAND 9.3 13.2 13.9 18.2 9.8 14.0 13.7 12.9TANZANIA 13.1 14.5 12.9 33.3 17.7 13.4 30.5 29.3TOGO 8.9 8.1 6.3 -1.8 9.7 9.9 5.3 -8.3TUNISIA 4.8 10.2" 7.8 5.2 10.8" 9.2ZAIRE 18.6 ... ... ... 21.2 ... ...ZAMBIA 7.1 15.2 19.4 36.2 7.4 13.7 19.9 36.2ZIMBABWE ... 9.8 15.9 8.5 8.4 17.8 6.6
NEAR EAST
CYPRUS 8.0 ... 6.4 5.0 10.2 7.2 4.6EGYPT 5.8 12.9 14.9 14.1 8.6 14.4 15.9 ...IRAN 9.6 16.1 16.1 4.4 10.0 18.9 15.4 5.2IRAQ 11.3 14.5 18.1 5.7JORDAN 6.0 11.6 ... 3.0 9.2 9.8 ... 2.2KUWAIT 10.1 7.1 4.6 1.5 15.4 6.1 2.6 -0.1SAUDI ARABIA 11.3 -0.1 -3.0 9.5 0.9 -2.8SUDAN 11.6 16.8 27.2" ... 12.0 14.2 26.6' ...SYRIA 16.7 10.9 12.0 17.5 18.2 ... 11.2 18.9TURKEY 6.2 50.0 42.6° 44.9 7.7 47.0 40.7
A 1980-841972-75
c 1973-751982-85
SOURCE: ILO, BULLETIN OF LABOUR STATISTICS, 1986-4.

ANNEX TABLE 16. PER CAPUT DIETARY ENERGY SUPPUES M SELECTED DEVELOPED AND DEVELOPMG COUNTRIES
COUNTRY 1969-71 1974-76 1977-79 1980-82 1983-85
CALORIES PER CAPUT PER DAY
ALGERIA 1825 2168 2433 2662 2710ANGOLA 2033 1972 2159 2109 1947BENIN 2078 2019 2197 2089 2136BOTSWANA 2138 2117 2123 2163 2164BURKINA FASO 1968 1961 2002 2037 1961BURUNDI 2363 2275 2377 2385 2217CAMEROON 2185 2270 2218 2127 2074CAPE VERDE 1894 2166 2490 2540 2614CENTRAL AFRICAN REPUBLIC 2159 2240 2135 2116 2045CHAO 2139 1755 1828 1703 1575COMOROS 2219 2091 2021 2102 2090CONGO 2174 2274 2370 2487 2532EGYPT 2499 2692 2851 3122 3262ETHIOPIA 1702 1575 1655 1768 1692GABON 1895 2016 2138 2284 2434GAMBIA 2249 2124 2179 2211 2229GHANA 2199 2165 1917 1702 1679GUINEA 1907 1933 1883 1747 1724GUINEA-BISSAU 1926 1793 1792 1939 1979COTE 061VOIRE 2369 2310 2421 2603 2448KENYA 2245 2250 2240 2186 2162LESOTHO 2020 2080 2341 2341 2346LIBERIA 2209 2280 2393 2374 2342LIBYA 2367 3468 3595 3670 3619MADAGASCAR 2494 2533 2486 2508 2467MALAWI 2323 2478 2515 2462 2429MALI 1836 1766 1763 1766 1793MAURITANIA 1988 1803 1918 2056 2076MAURITIUS 2300 2556 2705 2720 2721MOROCCO 2424 2573 2732 2725 2687MOLAMBIQUE 2075 1937 1850 1775 1664NAMIBIA 1961 1935 1945 1930 1875NIGER 2002 1958 2275 2362 2265NIGERIA 2131 2083 2198 2250 2060REUNION 2519 2729 2815 2928 2916RWANDA 1967 1923 2009 2104 2013SAO TOME AND PRINCIPE 2152 1953 2251 2434 2435SENEGAL 2371 2269 2336 2381 2339SEYCHELLES 1993 2151 2271 2304 2289SIERRA LEONE 1956 1941 2016 2031 1834SOMALIA 2181 1975 2015 2062 2059SOUTH AFRICA 2710 2908 2889 2942 2945SUDAN 2115 2102 2263 2312 2003SWAZILAND 2224 2456 2465 2518 2562TANZANIA 1949 2257 2386 2410 2314TOGO 2194 2085 2080 2227 2202TUNISIA 2271 2610 2729 2774 2827UGANDA 2282 2253 2205 2229 2291ZAIRE 2253 2291 2164 2144 2154ZAMBIA 2192 2320 2267 2164 2123ZIMBABWE 2115 2105 2151 2087 2094
ANTIGUA AND BARBUDA 2293 2074 1989 2180 2105BAHAMAS 2640 2306 2241 2606 2703BARBADOS 2889 2947 3025 3131 3129BELIZE 2463 2621 2702 2655 2546BERMUDA 2934 2615 2531 2541 2530CANADA 3349 3373 3376 3404 3442COSTA RICA 2404 2561 2605 2633 2772CUBA 2573 2647 2736 2902 3094DOMINICA 2174 2196 2320 2474 2615DOMINICAN REPUBLIC 2083 2234 2275 2339 2468EL SALVADOR 1854 2058 2134 2153 2148GRENADA 2347 2140 2209 2339 2371GUADELOUPE 2333 2423 2434 2560 2672GUATEMALA 2101 2158 2179 2248 2298HAITI 1920 1940 1912 1899 1838HONDURAS 2151 2110 2170 2191 2208JAMAICA 2531 2661 2639 2555 2576MARTINIQUE 2360 2500 2603 2711 2830MEXICO 2703 2827 2931 3102 3147NETHERLANDS ANTILLES 2449 2571 2726 2792 2850NICARAGUA 2432 2381 2382 2328 2423PANAMA 2346 2341 2311 2366 2420ST KITTS ANO NEVIS 2123 2236 2251 2271 2233SAINT LUCIA 2132 2128 2232 2353 2421ST VINCENT GRENADINES 2252 2243 2276 2541 2684TRINIDAD ANO TOBAGO 2567 2631 2743 2894 2967UNITED STATES 3467 3477 3554 3604 3652
ARGENTINA 3318 3263 3250 3221 3195BOLIVIA 1971 2015 2050 2115 2114BRAZIL 2472 2497 2555 2631 2636CHILE 2674 2582 2575 2644 2589COLOMBIA 2158 2346 2452 2540 2578ECUADOR 1957 2C35 2353 2058 2031FRENCH GUIANA 1619 2514 2624 2660 2783GUYANA 2292 2305 2390 2426 2492PARAGUAY 2753 2730 2779 2781 2813
185

186
ANNEX TABLE 16. (Cont.) PER CAPUT DIETARY ENERGY SUPPLIES IN SELECTED DEVELOPED AND DEVELOPING COUNTRIES
PERU 2289 2272 2196 2188 2144SURINAME 2340 2304 2447 2578 2666URUGUAY 3002 2931 2751 2840 2720VENEZUELA 2412 2445 2652 2645 2550
AFGHANISTAN 2185 2207 2225 2225 2196BANGLADESH 2013 1861 1845 1878 1859BRUNEI DARUSSALAM 2339 2546 2716 2798 2790BURMA 2069 2134 2242 2420 2517CHINA 1974 2055 2187 2345 2564CYPRUS 3066 3006 3195 3344 3497HONG KONG 2659 2650 2692 2738 2715INDIA 2021 1986 2117 2075 2161INDONESIA 2012 2191 2327 2462 2504IRAN 2216 2766 2832 2951 3115IRAQ 2249 2353 2540 2813 2901ISRAEL 3018 3069 3036 3014 3049JAPAN 2751 2782 2826 2855 2804JORDAN 2617 2366 2563 2843 2962KAMPUCHEA,DEMOCRATIC 2286 1882 1822 1910 2115KOREA DPR 2501 2766 2954 3081 3131KOREA REP 2528 2757 2816 2817 2822KUWAIT 2777 2781 3092 3162 3135LAOS 2025 1808 1883 2129 2242LEBANON 2477 2578 2758 2932 3014MACAU 2155 2196 2131 2079 2109MALAYSIA 2409 2535 2587 2611 2634MALDIVES 1684 1679 1852 1994 1992MONGOLIA 2385 2510 2690 2717 2811NEPAL 1996 1925 1951 2009 2048PAKISTAN 2027 2112 2164 2240 2186PHILIPPINES 2053 2135 2292 2344 2313SAUDI ARABIA KINGDOM OF 1887 1992 2526 2916 3093SINGAPORE 2587 2639 2648 2678 2728SRI LANKA 2260 2145 2329 2185 2410SYRIA 2355 2498 2662 3000 3198THAILAND 2258 2378 2394 2406 2440TURKEY 2819 2951 3054 3122 3180UNITED ARAB EMIRATES 3130 3559 3657 3620 3644VIET NAM 2170 2008 2017 2110 2234YEMEN ARAB REPUBLIC 1841 2037 2146 2218 2254YEMEN DEMOCRATIC 2078 1910 2010 2282 2293
ALBANIA 2556 2583 2714 2757 2740AUSTRIA 3303 3318 3366 3483 3484BELGIUMLUXEMBOURG 3483 3524 3516 3640 3700BULGARIA 3500 3530 3559 3648 3626CZECHOSLOVAKIA 3417 3435 3411 3477 3479DENMARK 3394 3346 3442 3611 3529FINLAND 3141 3142 3049 3097 3008FRANCE 3257 3252 3282 3339 3337GERMAN DEMOCRATIC REP. 3348 3470 3570 3678 3768GERMANY, FEO. REP. OF 3273 3280 3372 3433 3475GREECE 3189 3531 3501 3629 3660HUNGARY 3338 3428 3491 3515 3522ICELAND 2920 2969 3052 3139 3041IRELAND 3508 3565 3616 3761 3795ITALY 3422 3452 3546 3561 3486MALTA 3057 2878 2814 2709 2590NETHERLANDS 3247 3285 3306 3350 3355NORWAY 3078 3097 3299 3348 3203POLAND 3333 3469 3493 3338 3253PORTUGAL 3008 2960 3013 3104 3135ROMANIA 3068 3310 3406 3335 3394SPAIN 2868 3265 3326 3346 3335SWEDEN 2924 3014 3016 3077 3053SWITZERLAND 3495 3325 3476 3501 3440UNITED KINGDOM 3337 3219 3217 3144 3130USSR 3348 3388 3397 3387 3403YUGOSLAVIA 3327 3508 3518 3613 3599
AUSTRALIA 3285 3314 3421 3358 3343FIJI 2708 2485 2664 2818 2932FRENCH POLYNESIA 2840 2707 2800 2860 2860KIRIBATI 2189 2449 2560 2676 2616NEW CALEDONIA 2871 2848 2893 2940 2909NEW ZEALAND 3411 3453 3408 3424 3402PAPUA NEW GUINEA 2042 2086 2111 2178 2157SAMOA 2070 2215 2366 2403 2373SOLOMON ISLANDS 2146 2102 2132 2112 2085TONGA 2524 2743 2814 2863 2870VANUATU 2586 2571 2432 2384 2331
COUNTRY 1969-71 1974-76 1977-79 1980-82 1983-85
CALORIES PER CAPUT PER DAY

ANNEX TABLE 17. ANNUAL AGRICULTURAL SHARES OF TOTAL OFFICIAL COMMITMENTS TO ALL SECTORS (BROAD DEFINITION), BY MULTILATERAL AND BILATERAL SOURCES,1978-85
1978 1979 1980 1981 1982 1983 1984 1985^
CONCESSIONAL AND NON-CONCESSIONALCOMMITMENTS
MULTILATERAL AGENCIES B 39 36WORLD BANKc 41 37REGIONAL DEVELOPMENT BANKSc 31 33OPEC MULTILATERALc 30 7
BILATERAL SOURCES 9DAC/EEC 11 1. 2 11 11 11 11 11OPEC BILATERAL 3
ALL SOURCES(MULTILATERAL + BILATERAL) 17
CONCESSIONAL COMMITMENTS ONLY (ODA)
MULTILATERAL AGENCIES8WORLD BANKcREGIONAL DEVELOPMENT BANKS°OPEC MULTILATERALc
A PRELIMINARY.e INCLUDING UNDP, CGIAR, FAO/TF, FAO/TCP, AND IFAD (FROM 1978).C EXCLUDING COMMITMENTS TO CGIAR.
SOURCES: FAO AND OECD.
49 49 49 53 49 47 47 5352 52 45 58 43 51 48 5448 53 62 65 57 39 33 4729 7 15 14 30 26 46 65
BILATERAL SOURCES 13 16 13 14 16 15 15 14DAC/EEC 17 18 16 18 17 17 17 15OPEC BILATERAL 3 7 1 4 12 5 3 5
ALL SOURCES(MULTILATERAL + BILATERAL) 19 21 19 21 22 20 20 21
187
38 36 35 35 29 3135 32 32 38 27 2845 44 43 27 30 3316 16 17 21 22 28

188
ANNEX TABLE 18. PERCENTAGE DISTRIBUTION OF OFFICIAL COMMITMENTS TO AGRICULTURE (BROAD DEFINITION), BY MULTILATERAL AND BILATERAL, SOURCES, 1978-85
1978 1979 1980 1981 1982 1983 1984 1985A
CONCESSIONAL AND NON-CONCESSIONALCOMMITMENTS
MULTILATERAL AGENCIES 58 52 59 58 59 63 55 61WORLD BANKB 43 34 35 34 35 44 29 38REGIONAL DEVELOPMENT BANKSB 10 12 15 17 15 11 17 15OPEC MULTILATERAL!' 2 1 1 2 2 2 2OTHERc 3 6 8 6 7 6 6 6
BILATERAL SOURCES 42 48 41 42 41 37 45 39DAC/EEC 40 44 40 40 35 35 44 37OPEC BILATERAL 2 4 1 2 6 2 1 2
ALL SOURCES(MULTILATERAL BILATERAL) 100 100 100 100 100 100 100 100
CONCESSIONAL COMMITMENTS ONLY (ODA)
MULTILATERAL AGENCIES 41 37 45 43 40 41 36 43WORLD BANKB 26 18 21 21 20 18 20 25REGIONAL DEVELOPMENT BANKS° 8 11 12 12 7 11 6 7OPEC MULTILATERALB 2 1 1 2 2 2 2OTHERc 5 a 11 9 11 10 8 9
BILATERAL SOURCES 59 63 55 57 60 59 64 57DAC/EEC 56 59 53 54 51 56 62 54OPEC BILATERAL 3 4 2 3 9 3 2 3
ALL SOURCES(MULTILATERAL + BILATERAL) 100 100 100 100 100 100 100 100
A PRELIMINARY.a EXCLUDING COMMITMENTS TO CGIAR.c INCLUDING UNDP, CGIAR, FAO/TF, FAO/TCP AND IFAD (FROM 1978).
SOURCES: FAO AND OECD.

ANNEX TABLE 19. DAC COUNTRIES: BILATERAL ODA COMMITMENTS FROM INDIVIDUAL COUNTRIES AND PROPORTION TO AGRICULTURE (BROAD DEFINITION)
BILATERAL ODA TO ALL SECTORS PROPORTION OF ODA TO AGRICULTURE
COUNTRY 1981 1982 1983 1984 1985A 1981 1981 1983 1984 1985A
8 MILLION
AUSTRALIA 590 545 536 694 532 14 11 5 10 8AUSTRIA 265 291 183 79 65 10 1 2 1 3BELGIUM 432 320 183 169 118 4 3 5 1 2CANADA 1 011 807 1 139 1 575 1 172 39 15 25 22 25DENMARK 225 282 260 288 340 44 51 22 38 34FINLAND 111 123 96 171 233 19 11 24 13 11FRANCE 4 431 4 358 4 380 4 403 3 756 8 8 11 10 10GERMANY, FED. REP. 3 467 2 713 2 271 2 800 2 427 13 18 15 14 15IRELAND - 12 14 13 17 - - - - 24ITALY 481 641 882 903 1 340 6 17 20 20 16JAPAN 3 437 3 622 3 483 3 968 4 076 24 18 17 19 24NETHERLANDS 1 066 934 901 902 731 27 22 23 27 19NEW ZEALAND 52 47 40 41 47 33 30 15 15 23NORWAY 262 309 288 350 346 26 25 17 35 23SWEDEN 518 579 526 576 566 39 32 24 26 25SWITZERLAND 253 207 239 218 307 46 31 55 22 26UK 1 000 1 112 927 1 009 731 8 8 12 14 14USA 5 135 6 112 6 989 8 144 9 156 16 14 14 15 11
TOTAL DACCOUNTRIES 22 736 23 014 23 337 26 303 25 960 17 15 15 16 15
A PRELIMINARY.
SOURCE: OECD.
189

190
ANNEX TABLE 20. PERCENTAGE DISTRIBUTION OF OFFICIAL COMMITMENTS TO AGRICULTURE (EXCLUDING TECHNICAL ASSISTANCE GRANTS), BY PURPOSE 1978-85
1978 1979 1980 1981 1982 1983 1984 1985^
NOTE: THIS TABLE NOW INCLUDES FORESTRY IN THE NARROW DEFINITION.
A PRELIMINARY, INCLUDING PARTIAL ESTIMATES.E INCLUDING RIVER DEVELOPMENT.° INCLUDING INPUTS SUCH AS FISHING TRAWLERS, FISHING GEAR.D INCLUDING COMMITMENTS TO CGIAR.E MOSTLY FERTILIZERS.
SOURCES: FAO COMPUTERIZED DATA BANK ON EXTERNAL ASSISTANCE TO AGRICULTURE.
LAND AND WATER DEVELOPMENT8 26 18 25 17 22 20 20 20AGRICULTURAL SERVICES 12 10 13 7 12 15 17 11SUPPLY OF INPUTS 5 3 6 5 4 6 5 5
CROP PRODUCTION 8 7 7 6 a 6 7 6LIVESTOCK 4 3 2 2 1 2 2 4FISHERIES° 3 3 3 3 2 2 2 2RESEARCH, EXTENSION, TRAINING° 4 3 5 5 5 6 9 6
FORESTRY 2 3 2 2 3 2 3 5AGRICULTURE, UNALLOCATED 12 17 9 14 11 9 12 16TOTAL NARROW DEFINITION 76 67 72 61 68 68 77 74RURAL DEVELOPMENT/INFRASTRUCTURE 15 16 19 22 23 21 12 14MANUFACTURING OF INPUTS' 4 11 2 10 4 1 5 2AGRO-INDUSTRIES 5 6 7 5 4 7 3 4
REGIONAL DEVELOPMENT - - - 2 1 3 3 6TOTAL BROAD DEFINITION 100 100 100 100 100 100 100 100

ANNEX TABLE 21. DISTRIBUTION OF OFFICIAL COMMITMENTS TO AGRICULTURE, EXCLUDING TECHNICAL ASSISTANCE GRANTS (BROAD DEFINITION) FROM ALL SOURCES, BYREGION ANO ECONOMIC GROUPS, 1978-85
1978 1979 1980 1981 1982 1983 1984 1985A
CONCESSIONAL AND NON-CONCESSIONALCOMMITMENTS
FAR EAST AND PACIFIC 49 46 46 42 49 42 48 47AFRICA 22 24 22 28 28 26 27 25LATIN AMERICA 21 22 24 23 18 24 18 19NEAR EAST 8 8 8 7 5 9 7 9
TOTAL 4 DEVELOPING REGIONS 100 100 100 100 100 100 100 100OF WHICH:
LOW-INCOME FOOD DEFICIT COUNTRIES' 60 65 66 64 65 62 69 60LEAST DEVELOPED COUNTRIES° 13 18 19 19 19 21 17 18
CONCESSIONAL COMMITMENTS
FAR EAST AND PACIFIC 53 55 50 48 46 48 53 52AFRICA 26 23 26 32 39 31 34 30LATIN AMERICA 14 13 14 12 9 12 7 11NEAR EAST 7 9 10 8 6 9 6 7
TOTAL 4 DEVELOPING REGIONS 100 100 100 100 100 100 100 100OF WHICH:
LOW-INCOME FOOD DEFICIT COUNTRIESa 70 75 78 78 78 78 82 70LEAST DEVELOPED COUNTRIES° 21 24 27 28 30 36 26 29
NON-CONCESSIONAL COMMITMENTS
FAR EAST AND PACIFIC 41 24 37 31 53 33 38 39AFRICA 17 27 12 20 11 19 17 18LATIN AMERICA 33 42 47 44 33 40 38 32NEAR EAST 9 7 4 5 3 8 7 11
TOTAL 4 DEVELOPING REGIONS 100 100 100 100 100 100 100 100OF WHICH:
LOW-INCOME FOOD DEFICIT COUNTRIESB 43 41 36 38 44 40 45 46LEAST DEVELOPED COUNTRIESc 1 3 1 2 1 1 1 2
191
A PRELIMINARY, INCLUDING PARTIAL ESTIMATES.B 64 COUNTRIES WITH PER CAPUT GNP OF USS790 IN 1985. UP TO 1984, 65 COUNTRIES INCLUDING MALAWI, NEPAL AND PAKISTAN EXCLUDING SWAZILAND. IN 1985,64 COUNTRIESEXCLUDING MALAWI, NEPAL AND PAKISTAN AND INCLUDING SWAZILAND.c 36 COUNTRIES.
SOURCES: FAO COMPUTERIZED DATA BANK ON EXTERNAL ASSISTANCE TO AGRICULTURE.

WHERE TO PURCHASE FAO PUBLICATIONS LOCALL YPOINTS DE VENTE DES PUBLICATIONS DE LA FAO
PUNTOS DE VENTA DE PUBLICACIONES DE LA FAO
ALOE- FUE CURA HONDURAS NEW ZEALAND sues_seENAPEP - Entreprise nalionale desmessageries de presse
Ediciones Cubanas,Ernpresade Comercio Exterior de
Escuela Agrícola Panamericana,Libreria RTAC
Government Printing OfficeBookshops
Librairie Payot SA.Lausanne et Genève.
47, rue Didouche Mourad, Alger.
O ANGOLA
PublicacionesObispo 461, Apartado 605,La Habana.
Zamorano, Apartado 93,Tegucigalpa.Oficina de la Escuela Agricola
25 Rutland Street.Mail orders: 85 Beach Road,Private Bag, CPO, Auckland;
Buchhandlung und AntiquariatHeinimann & Co.Kirchgasse 17, 8001 Zurich.
Empresa Nacional do disco e de Panamericana en Tegucigalpa Ward Street, Hamilton;Publicacoes, ENDIPU-U.E.E.Rua Cirilo de Conceioao Silva, No. 7,C.P. No. 1314-C Luanda.
O ARGENTINALibrería Agropecuaria SA.
CYPRUSMAMPO Box 1722, Nic,osia.
O CZECHOSLOVAKL4ART1A,
Blvd. Morazan, Apta. Glapson,Apartado 93, Tegucigalpa.
HONG KONGSwindon Book Co.13-15 Lock Road, Kowloon.
Mulgrave Street (Head Office),Cubacade World Trade Centre,Wellington;159 Hereford Street, Christchurch:Princes Street, Dunedin.
SURINAMEVACO n.v. in SurinameDomineestraat 26,PO Box 1841, Paramaribo.
0 SWEDENPasteur 743, 1028 Buenos Aires. Ve Smeckach 30, NICARAGUA Books and documents:
AUSTRALIAHunter Publications58A Gipps Street,Collingwood, Vic. 3066.
PO Box 790, 111 27 Prague 1.
DENMARKMunksgaard Export andSubscription Service
HUNGARYKulturaPO Ekiix 149, 1389 Budapest 62.
ICRLAND
Librería Universitaria,Universidad CentroamericanaApartado 69, Managua.
NIGERIA
CE. Fritzes Kurtgl.Hovbokhandel, Regeringsgatan 12,PO Box 16356, 103 27 Stockholm.Subscriptions:Vennergren-Williams AB
AUSTRIAGerold & Co.Graben 31, 1011 Vienna.
35 Narre Sogade,DK 1370 Copenhagen K.
ECUADORLibri Mundi, Librería Internacional
Snaebliim Jónsson and Co. h.f.Hafnarstraeti 9, PO Box 1131,101 Reykjavik.
INDIA
University E3ookshop(Nigeria) LimitadUniversity of lbadan, lbadan.
NORWA Y
PO Box 30004, 104 25 Stockholm.
TANZANIADar-es-Salaam BookshopPO Box 9030, Dar-es-Salaam.BAHRAIN
United Schoots InternationalPO Box 726, Manama.
O BANGLADESHAssociation of DevelopmentAgencies in BangladeshHouse No. 46A, Road,No. 6A,Dhanmondi R/A, Dhaka.
BELGIQUEM. J. De Lannoy202, avenue du Roi,1060 Bruxelles. CCP 000-0808993-13.
BOLIVIA
Juan León Mera 851,Apartado Postal 3029, Quito.Su Librería Cia. UdaGarcía Moreno 1172 y Mejia,Apartado Postal 2556, Quito.
EL SALVADORLibrería Cultural Salvadoreña, S.A.de CV.7° Avenida Norte 121,Apartado Postal 2296, San Salvador.
ESPAÑAMundi-Prensa Libros SACastello 37, 28001 Madrid.Librería AgricolaFernando VI 2, 28004 Madrid.
FINI_AND
Oxford Bar* and Stationery Co.Scindia House, New Delhi 100 001;17 Park Street, Calcutta 700 016Ordord Subscription Agency,Institute for Development Education1 Anasuya Ave, Kilpauk,Madras 600010.
INDONESIAP.T. !raí Buku Agung13 Kwitang, Jakarta.
IRAQNational House for Publishing,Distributing and AdvertisingJamhuria Street, Baghdad.
'/FIEL-ANOThe Controller
Johan Grundt Tanum BokhandelKarl Johansgate 41-43,PO Box 1177, Sentrum, Oslo 1.
O PAKISTANMirza Book Agency65 Shahrah-e-Quaid-e-Azam,PO Box 729, Lahore 3.Sasi Book StoreZaibunnisa Street, Karachi.
O PARAGUAYAgencia de Librerías Nizza S.A.Casilla 2596, Eligio Ayala 1073,Asunción.
PEROLibreria Distribuidora "Santa Rosa"Jirón Apurimac 375, Casilla 4937,
Bookshop, Universityof Dar-es-SataamPO Box 893, Morogoro.
o THAILANDSuksapan PanitMansion 9, Rajadamnern Avenue,Bangkok.
TOGOUbrairie du Bon PasteurB.P. 1164. tomé.
O TUNISIESociété tunisienne de diffusion5, avenue de Carthage, Tunis.
TLIRKEYKuttur Yayinlari Is-Turk Ltd SIL
Los Amigos del LibroPerú 3712, Casilla 450, Cochabamba;Mercado 1315, La Paz.
O BOTSWANABotsalo Books (Pty) LtclPO Box 1532, Gaborone.
BRAZO..FundarAo Getulio VargasPraia de Botafogo 190,C.P. 9052, Rio de Janeiro.Livraria Canuto LtdaRua Consolada°, 348-2° andar,Caixa Postal 19198, Sào Paulo.
O BRUNEI-DARUSSALAMSST Trading Sdn. Bhd.Bangunan Tekno No. 385, JIn 5/59,PO Box 227, Petaling Jaya, Selangor.
Akateeminen Kirjakauppa1 Keskuskatu,PO Box 128, C0101 Helsinki 10.
FRANCEEditions A. Pedone13, rue Soufflot, 75005 Paris.
GERMANY, FED. REP.Mexander Hom InternationaleBuchhandlungKirch Gasse 39,Postfach 3340, 6200 Wiesbaden.UNO VerlagPoppelsdorfer Altea 55,D-5300 Bonn 1.Triops Verlag
Stationery Office, Dublin 4.
ITALYDistribution and Sales Section, FAOVia dalle Terme di Carac,alla,00100 Rome.Ubreria ScientificaDott. Lucio de Biasio "Aeiou"Via Meravigli 16, 20123 Milan.Libreria CommissionariaSansoni S.p.A. "Ucosa"Via Lamarmora 45,C.P. 552, 50121 Florence.
JAPANMaruzen Company LtdPO Box 5050,
Lima 1.
POLANDAra PolonaKrakowskie Przedmiescie 7,00-068 Warsaw.
O PORTUGALUvraria Portugal,Diasy Andrade Ltda.Rua do Carmo 70-74, Apartado 2681,1117 Lisbonne Codex.
REPÚBLICA DOMINICANAEditora Taller, C. por A.Isabel la Católica 309,Apartado de Correos 2190,
Ataturk Bulvari No. 191,Kat. 21, AnkaraBookshops in Istanbul and
O UNITED KINGDOMHer Majesty's Stationery Office49 High Holborn,London WC1V 6HB (callers only).HMSO Publications Centre,Agency Section51 Nine Elms Lane,London 5698 SOR (trade and Londonarea mail orders);13a Castle Street,Edinburgh EH2 3AR;80 Chichester Street,Belfast BT1 4JY;
O CANADARemad Publishing Co. Ud.61 Sparks St, Ottawa, Ont.;211 Yonge St, Toronto, Ont.Editions Renouf Ltée .
Reiffeisenstr. 24, 6060 Langen.
GHANAGhana Publishing CorporationPO Box 3632, Accra.
Tokyo International 100-31.
KENYAText Book Centre UdKijabe Street, PO Box 47540, Nairobi.
ZI Santo Domingo.Fundación Dominicana de DesarrolloCasa de las Gárgolas,Mercedes 4, Apartado 857,ZI Santo Domingo.
Brazennose Street,Manchester M60 8A5;258 Broad Street,Birmingham B1 2HE;Southey House, Wine Street,
route Transcanadienne, Suite 305,St-Laurent (Montréal) Qué.Toll free calls: Ontario, Quebec andMaritime- 1-800-267-1805;Western Provinces andNewfoundland - 1-800-267-1826.Head Office/Siège Social:
GREECEG.C. Beftheroudakis S.A.4 Nikis Street, Athens (T-126).John Mihalopoulos & Son SA75 Hermou Street,PO Box 73, Thessaloniki.
KOREA, REP. OFEutyoo Publishing Co. Ltd46-1 Susong-Dong, Jongro-Gu,PO f3ox 362, Kwangwha-Mun,Seoul 110.
O KUWAIT
ROMANIAIleximStr. 13 Dicembrie No. 3-5,Bucharest Sector 1.
SAUDI ARABIAThe Modern Commercial
Bristol BS1 280.
UNFTED STATESOF AM/En/CAUNIPUB4611/F, Assembly Drive,Lanham, MD 20706.
1294 Algoma Road, Ottawa, Ont.
O CHILELibrería - Oficina Regional FAO
GUATEMALADistribuciones Culturales yTécnicas "Artemis"
Avenida 12-11, Zona 1,
The Kuwait Bookshops Co. LtdPO Box 2942, Safat.
LUXEMI3OLIFIG
University BookshopPO Box 394, Riyadh.
O SINGAPORE
URUGUAYLibrería Agropecuaria S.R.LAlzahar.1328, c.c. 1755, Montevideo.
Avda. Santa Maria 6700,Casilla 1009, Santiago.Teléfono: 228-80-56.
O CHINAChina National PublicationsImport CorporationPO Box 88, Beijing.
CONGO
Apartado Postal 2923, Guatemala.
GUINEA-BISSAUConselho Nacional da CulturaAvenida da Unidade Africana,C.P. 294, Bissau.
O GUYANAGuyana National TradingCorporation Ltii
M. J. De Lannay202, avenue du Roi,1060 Bruxelles (Belgique).
MALAYSIASST Trading Sdn. Bhd.Bangunan Tekno No. 385, Jln 5/59,PO Box 227, Petaling Jaya, Selangor.
MAROC
MPH Distributors (S) Pie. Ltd.71177 Stamford Road, Singapore 6.Setect Books Pto. Lkl.215 Tanglin Shopping Centre,19 Tanglin Rd., Singapore 1024.
SOMAIJA"Samater's"PO Box 936, Mogadishu.
YUGOSLAVIAJugosiovenska Knjiga, Trg.Republike 5/8,PO Box 36, 11001-BelgradeCankarjeva ZalozbaPO Box;201-IV, 61001 Ljubljana.
ZAMBIAKingstons (Zambia) Ud,
Offrce national des librairiespopulairesB.P. 577, Brazzaville.
COSTA RICALibreria, Imprenta y
45-47 Water Street,PO Box 308, Georgetown.
O HAInUbrairie "A la Caravelte"26, rue Bonne Foi,
Librairie "Aux Bellas Irnages"281, avenue Mohammed V,Rabat.
MAURMUSNalanda Company Limitad30 Bourbon Street, Port-Louis.
SRI LANKAM.D. Gunasena á Co. Lid217 Olcott Mawatha,PO Box 246, Colombo 11.
SUDAN
Kingstons Building,President Avenue, PO Box 139,Ndola.
Other CounirlesAutres Paya
Litografia Lehmann SAApartado 10011, San José.
B.P. 111, Port-au-Prince. NETHERLANDSKeesing b.v.Hogeliweg 13, 1101 CB Amsterdam.
University Bookshop,Urtiversily of KhartoumPO Box 321, Khartoum.
0005 PaísesDiskibutkin and Sales Section, FAO,Via delle Terme di Caracalla,00100 Rome, Italy.
Postbus 1118, 1030 BC Amsterdam.

i
i
1
i 1
,
, 1
i
i I
.
1
1
1
I '
I
I
Il
I
P-00SBN 925-102595-9
ISSN 0081-4539
1