the state of higher education - the campaign for college...
TRANSCRIPT
The State of Higher Education
NOVEMBER 2013
Latinos in
in California
The economic and social imperative for advancing Latino college achievement
2
The Latino population in California is large, growing rapidly, and on its way to attaining majority status in less than 40 years.1 However, Latino college-degree
attainment is low, despite a significant increase in college-going rates.
Great promise, but far from being kept
In 2012, seven out of 10 Latino high school graduates in the U.S. enrolled in college, a rate higher than that of their White counterparts, according to a Pew Research Center study.2
Research also has consistently confirmed that despite low educational attainment among Latinos, Latino parents have high educational aspirations for their children and believe that a college education is critical to their future success. Recent Public Policy Institute of California (PPIC) Statewide Surveys found that 83 percent of Latino parents hope their children earn at least a bachelor’s degree and 92 percent of Latinos believe that a college education is “very important.” 3 4
That is the good news.
The bad news is that, compared to Whites and Asians, Latino college students are:
• Less likely to enroll in a four-year university;
• Less likely to attend a selective college;
• Less likely to enroll in college full-time; and
• Less likely to complete a bachelor’s degree.
The math is clear. If the California economy is to have the college-educated workforce it needs, we must find ways to significantly improve college completion rates among Latinos. There is no other reasonable solution given the population
dynamics of California today. California needs to get to work. It needs to develop a workforce that is prepared and that will strengthen our economy.
But, as the Campaign for College Opportunity has found in this report, which is part of a new series on the State of Higher Education in California, we are on track to produce a generation of young people less educated than our older population. The principal reason is that one of the largest and fastest growing segments of our population—native-born and immigrant Latinos—has unacceptably low rates of college completion.
The state of educational attainment for Latinos in California raises questions about equity and fairness in our society, but on a practical dollars-and-cents level, it also raises concerns about our collective future and the strength of our economy and workforce if we do not act now to strengthen our most
critical resource: our human capital.
For a more prosperous California, we need significantly more Latino students to fulfill their academic goals and attain
college degrees and credentials. This will not only make their lives better, but ensure a strong economy for the
state we all live in.
Like any segment of our student population, when Latinos go to college and complete a
certificate or degree, California wins. In fact, for every dollar California invests in a student who completes college, it receives $4.80. The return is a combination of taxes on increased earnings and a decrease in state expenditures on social services and
incarceration.5
Going to college and completing a certificate or degree is good for the graduate too. Latinos and others with degrees earn upwards of $1.3 million dollars more over their lifetimes and spend four years less in poverty than their peers with only a high school diploma.6
The economic and social imperative for advancing Latino college achievement

3
1. Create a statewide plan for higher education
• Establish statewide and college-by-college benchmarks for increasing Latino college-going and completion rates and decreasing the number of students and amount of time spent in pre-college level courses.
• Prioritize resources for institutions to examine performance problems and identify solutions to improve success for all students.
• Monitor progress toward benchmarks and completion goals in a public and transparent way.
2. Fund colleges for both enrollment and success
• Increase funding for higher education to ensure all eligible students have a spot in college.
• Establish a new funding mechanism that creates incentives beyond just college enrollment funding and holds colleges and universities accountable for increasing underrepresented minority graduation and completion rates.
3. Improve K-12 & postsecondary coordination
• Improve coordination between high schools and colleges with regard to early college preparation and assessment. Leverage the implementation of new Common Core Standards and Smarter Balance Assessments to ensure that California students have one common definition of college readiness and are better prepared to succeed in higher education.
• Improve coordination between two-year colleges and four-year universities; particularly in the areas of assessment, transfer, and workforce preparation.
4. Invest in services students need to succeed
• Develop a comprehensive strategy to improve the delivery of pre-college level education to significantly increase the number of Latino students successfully moving onto college-level work.
• Prioritize educational resources that support student success and completion including orientation, counseling, and advising that help close information gaps for low-income, first-generation Latino students.
5.Strengthenfinancialsupportoptionsforstudents
• Ensure that all eligible students apply and receive federal and California student aid for which they qualify.
• Expand financial aid for students attending community colleges through the Cal Grant program.
Recommendations
This report offers a demographic overview of the Latino population in California and an analysis of key education indicators over time. The report also includes the following five recommendations for policymakers, college leaders and families to secure California’s economic future by significantly increasing college-going and completion rates for Latinos in our state:
Despite the clear benefits of college attendance and completion for Latinos and for the state of California, we are not on track to meet the 2.3 million additional degrees our economy will require. This should sound an urgent alarm for all of us.
4
Latinos California’s New Majority
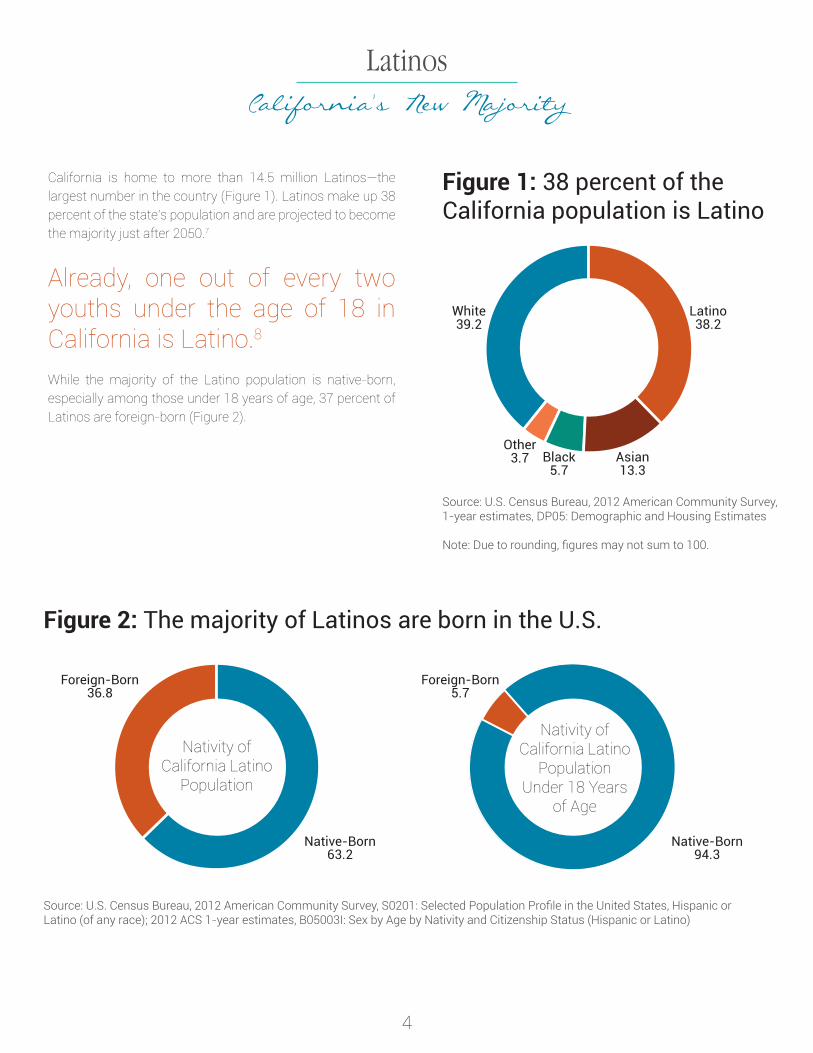
California is home to more than 14.5 million Latinos—the largest number in the country (Figure 1). Latinos make up 38 percent of the state’s population and are projected to become the majority just after 2050.7
Already, one out of every two youths under the age of 18 in California is Latino.8
While the majority of the Latino population is native-born, especially among those under 18 years of age, 37 percent of Latinos are foreign-born (Figure 2).
Figure 2: The majority of Latinos are born in the U.S.
Source: U.S. Census Bureau, 2012 American Community Survey, S0201: Selected Population Profile in the United States, Hispanic or Latino (of any race); 2012 ACS 1-year estimates, B05003I: Sex by Age by Nativity and Citizenship Status (Hispanic or Latino)
Native-Born63.2
Foreign-Born36.8
Native-Born94.3
Foreign-Born5.7
Nativity of California Latino
Population
Nativity of California Latino
Population Under 18 Years
of Age
Figure 1: 38 percent of the California population is Latino
Source: U.S. Census Bureau, 2012 American Community Survey, 1-year estimates, DP05: Demographic and Housing Estimates
Note: Due to rounding, figures may not sum to 100.
Asian13.3
Black5.7
Other3.7
White39.2
Latino38.2
5
Educational AttainmentStill a long way to go
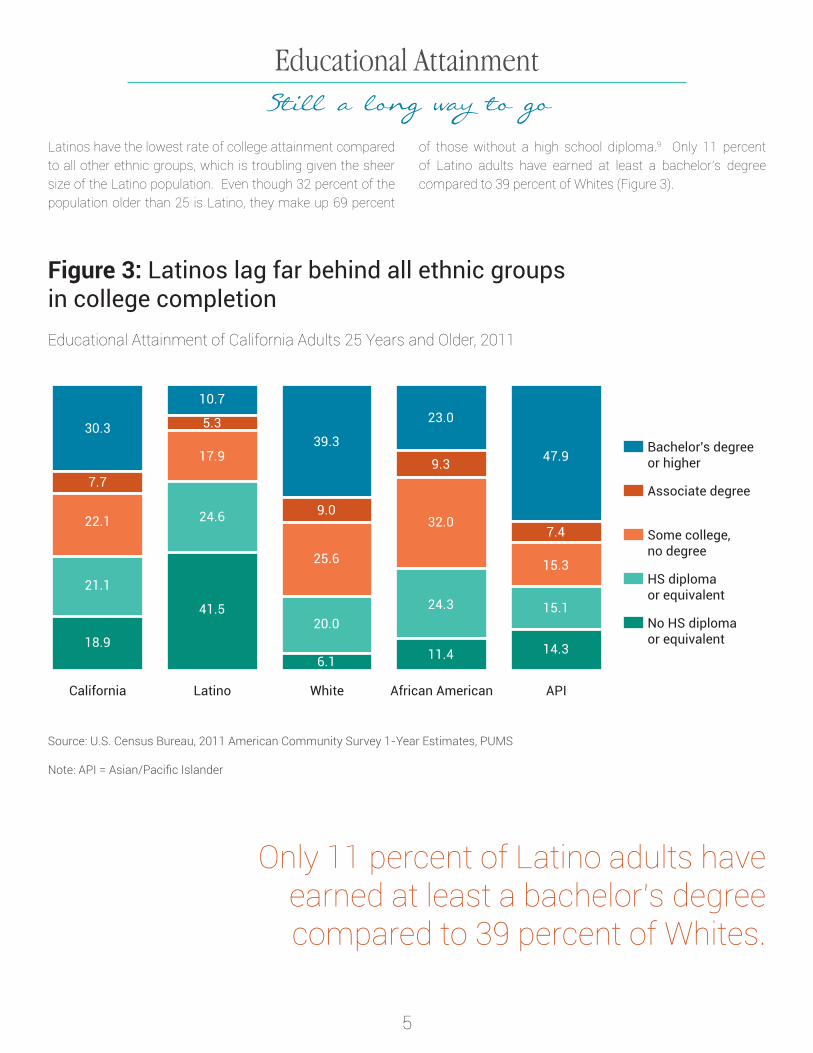
Latinos have the lowest rate of college attainment compared to all other ethnic groups, which is troubling given the sheer size of the Latino population. Even though 32 percent of the population older than 25 is Latino, they make up 69 percent
of those without a high school diploma.9 Only 11 percent of Latino adults have earned at least a bachelor’s degree compared to 39 percent of Whites (Figure 3).
Figure 3: Latinos lag far behind all ethnic groups in college completionEducational Attainment of California Adults 25 Years and Older, 2011
Source: U.S. Census Bureau, 2011 American Community Survey 1-Year Estimates, PUMS
Note: API = Asian/Pacific Islander
APIAfrican AmericanWhiteLatinoCalifornia
18.9
21.1
22.1
7.7
30.3
10.7
5.3
17.9
24.6
41.5
39.3
23.0
47.9
9.0
25.6
20.0
6.1
9.3
32.0
24.3
11.4
7.4
15.3
15.1
14.3
Bachelor's degreeor higher
Associate degree
Some college,no degree
HS diplomaor equivalent
No HS diplomaor equivalent
Only 11 percent of Latino adults have earned at least a bachelor’s degree compared to 39 percent of Whites.
6
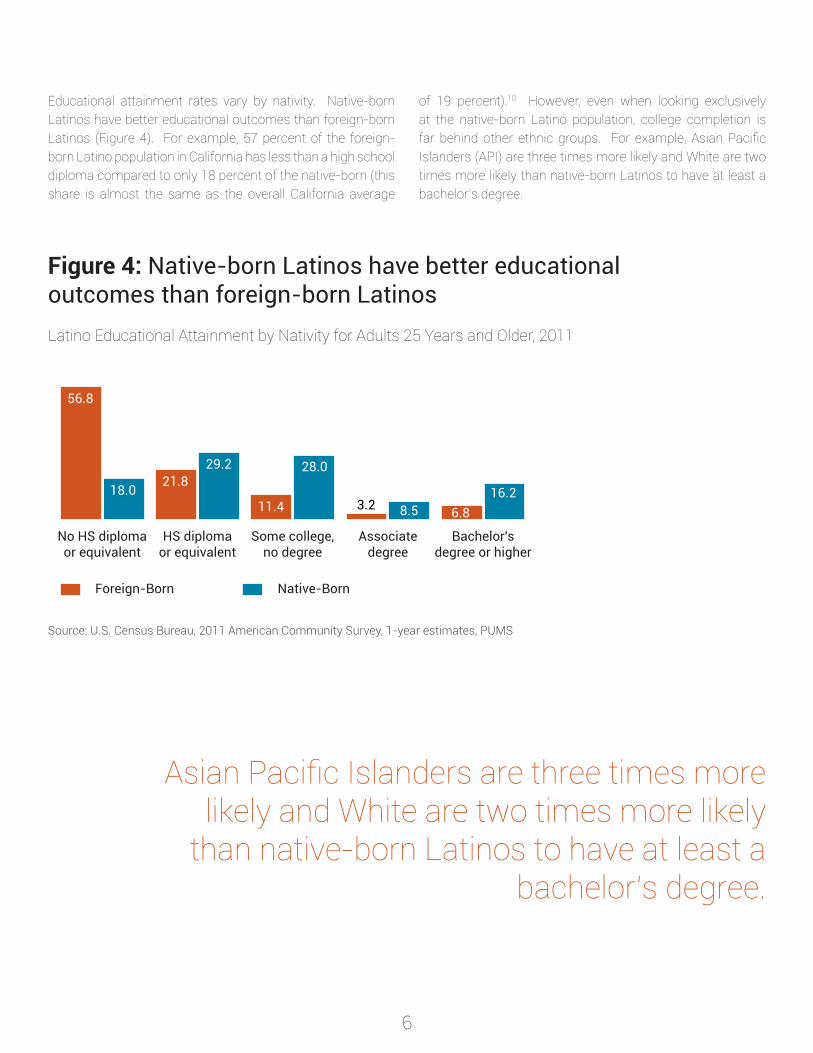
Educational attainment rates vary by nativity. Native-born Latinos have better educational outcomes than foreign-born Latinos (Figure 4). For example, 57 percent of the foreign-born Latino population in California has less than a high school diploma compared to only 18 percent of the native-born (this share is almost the same as the overall California average
of 19 percent).10 However, even when looking exclusively at the native-born Latino population, college completion is far behind other ethnic groups. For example, Asian Pacific Islanders (API) are three times more likely and White are two times more likely than native-born Latinos to have at least a bachelor’s degree.
Bachelor'sdegree or higher
Associatedegree
Some college,no degree
HS diplomaor equivalent
No HS diplomaor equivalent
56.8
18.021.8
29.2
11.4
28.0
3.2 8.5 6.816.2
Foreign-Born Native-Born
Figure 4: Native-born Latinos have better educational outcomes than foreign-born LatinosLatino Educational Attainment by Nativity for Adults 25 Years and Older, 2011
Source: U.S. Census Bureau, 2011 American Community Survey, 1-year estimates, PUMS
Asian Pacific Islanders are three times more likely and White are two times more likely
than native-born Latinos to have at least a bachelor’s degree.

7
Though attainment rates remain low, Latinos in California have made progress in the past two decades. The share of Latinos between the ages of 25 and 64 without a high school diploma or equivalent dropped 16 percentage points between 1990 and 2011 (Figure 5). However, the share of those with a baccalaureate degree or higher has only grown by four percentage points. The news is only slightly better when we
look at Latino adults between 25 and 34 years where we see a 23 percentage point gain among those who earned a high school diploma, but only a five percentage point gain among those earning at least a baccalaureate degree (not shown).11 The bottom line is that while more young Latinos are graduating from high school and enrolling in higher education, too few are completing college.
Figure 5: In the past 21 years, there’s been a huge growth in the number of Latinos with high school diplomas, but too few are graduating from collegeLatino Educational Attainment, ages 25 to 64
Source: 1990 Decennial Census of Population and Housing, SF 3, PUMS; 2000 Decennial Census of Population and Housing, PUMS 5% Sample; 2011 ACS 1-year, PUMS
Note: Data for 1990 includes population 25 years and older.
Bachelor's degree or higherAssociate degreeSome college, no degreeHS diploma or equivalentNo HS diploma or equivalent
201120001990
7.15.2
13.9
18.8
55.0 51.8
8.14.3
16.0
19.7
11.0
5.5
18.7
25.3
39.4
The bottom line is that while more young Latinos are graduating from high school and
enrolling in higher education, too few are completing college.

8
Latinos are underrepresented at every system of higher education in California. Latinos make up 47 percent of the traditional college-going age population (18 and 24 years), but
they’re only 39 percent of total undergraduate enrollment at CCC, 33 percent at CSU, and 20 percent at UC (Figure 6).
Figure 6: Latinos are underrepresented among every system of higher educationLatino Representation, Fall 2012
CCCFor-profitsCSUAICCUUCA-GHigh SchoolGraduates
46.2
percent of population, age 18-24,that is Latino (46.7%)
33.7
20.4 21.1
32.836.5
38.7
percent of studentpopulations that
are Latino
percent of undergraduate enrollment that is Latino
Sources: Author’s calculations from California Community Colleges Chancellor’s Office, California State University Analytic Studies, University of California Accountability Report, Association of Independent California Colleges and Universities (AICCU), U.S. Department of Education
Terms: A-G: a set of courses that are the minimum requirement to be eligible to attend a California State University or University of California. UC: University of California. AICCU: Association of Independent California Colleges and Universities. CSU: California State University. For-profits: Degree-granting higher education institutions which are not supported with apportionment money from the state, nor are incorporated as a non-profit organization. CCC: California Community Colleges.
Note: For-profit data is for fall 2011, latest available.
Latinos are underrepresented at every system of higher education in California.
College-Going PatternsChallenged from the start

9
Latino first-time freshmen enrollment is concentrated at the California Community Colleges. In the fall of 2012, 69 percent of first-time Latino freshmen enrolled at a community college—118,730 students. Fourteen percent (23,252) enrolled at the CSU, eight percent (14,358) at for-profit colleges, five percent (8,747) at the UC, and almost four percent (5,930) at non-profit institutions that belong
to the Association of Independent California Colleges and Universities (AICCU). Even at the total undergraduate level, the majority of Latinos are enrolled at the community colleges (68 percent), followed by 14 percent at the CSU. Only four percent of Latino undergraduates in California are enrolled at the UC (Figure 7).
Figure 7: In 2012 most Latinos enrolled at a California Community College
First-Time Freshmen Latino Enrollment, Fall 2012
Total Undergraduate Latino Enrollment, Fall 2012
Sources: Author’s calculations from California Community Colleges Chancellor’s Office, California State University Analytic Studies, University of California Accountability Report, U.S. Department of Education
Note: For-profit data is for fall 2011, latest available.Note: Due to rounding, figures may not sum to 100.
Improving completion rates for transfer, degrees, and certificates within the California Community
College system alone could result in up to 1,150,000 more adults with the skills and
education to meet the state’s workforce needs.12
CCC69.4
CSU13.6
For-profit8.4
UC5.1
AICCU3.5
CCC68.1
CSU13.9
For-profit10.3
UC4.2
AICCU3.6
TOTAL899,172
TOTAL171,017
10
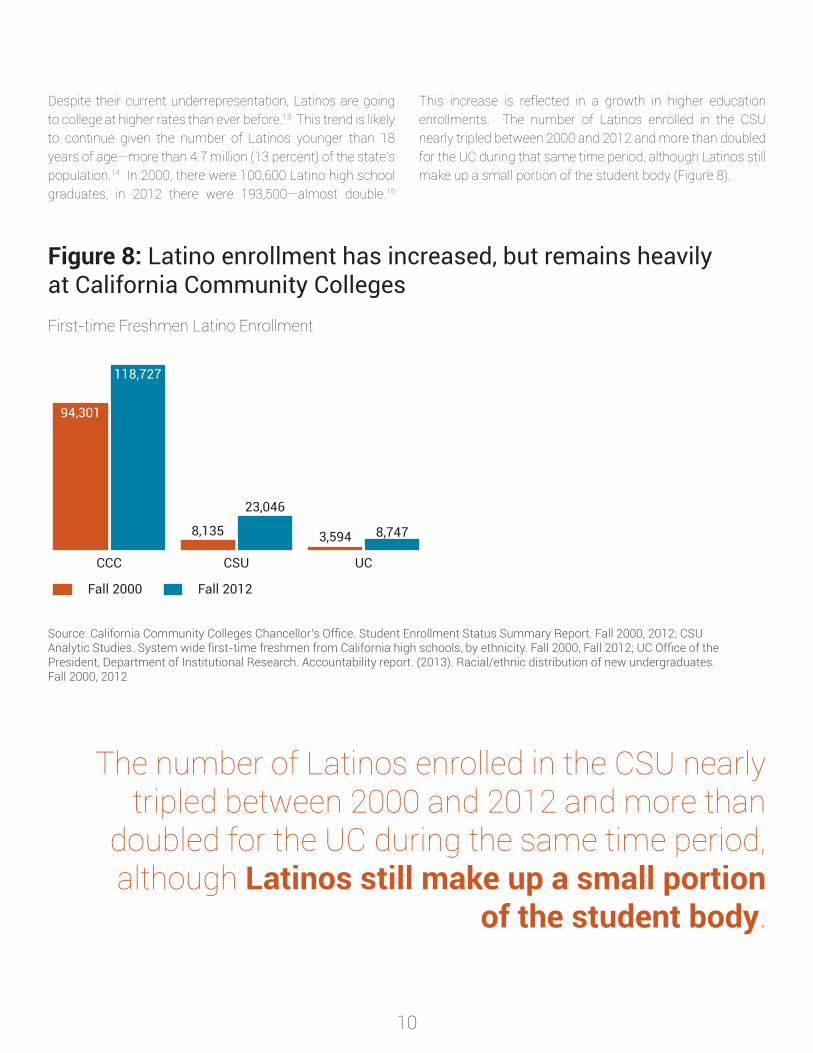
Despite their current underrepresentation, Latinos are going to college at higher rates than ever before.13 This trend is likely to continue given the number of Latinos younger than 18 years of age—more than 4.7 million (13 percent) of the state’s population.14 In 2000, there were 100,600 Latino high school graduates; in 2012 there were 193,500—almost double.15
This increase is reflected in a growth in higher education enrollments. The number of Latinos enrolled in the CSU nearly tripled between 2000 and 2012 and more than doubled for the UC during that same time period, although Latinos still make up a small portion of the student body (Figure 8).
Figure 8: Latino enrollment has increased, but remains heavily at California Community CollegesFirst-time Freshmen Latino Enrollment
UCCSUCCC
94,301
Fall 2012Fall 2000
118,727
3,594 8,7478,135
23,046
Source: California Community Colleges Chancellor’s Office. Student Enrollment Status Summary Report. Fall 2000, 2012; CSU Analytic Studies. System wide first-time freshmen from California high schools, by ethnicity. Fall 2000, Fall 2012; UC Office of the President, Department of Institutional Research. Accountability report. (2013). Racial/ethnic distribution of new undergraduates. Fall 2000, 2012
The number of Latinos enrolled in the CSU nearly tripled between 2000 and 2012 and more than
doubled for the UC during the same time period, although Latinos still make up a small portion
of the student body.
11
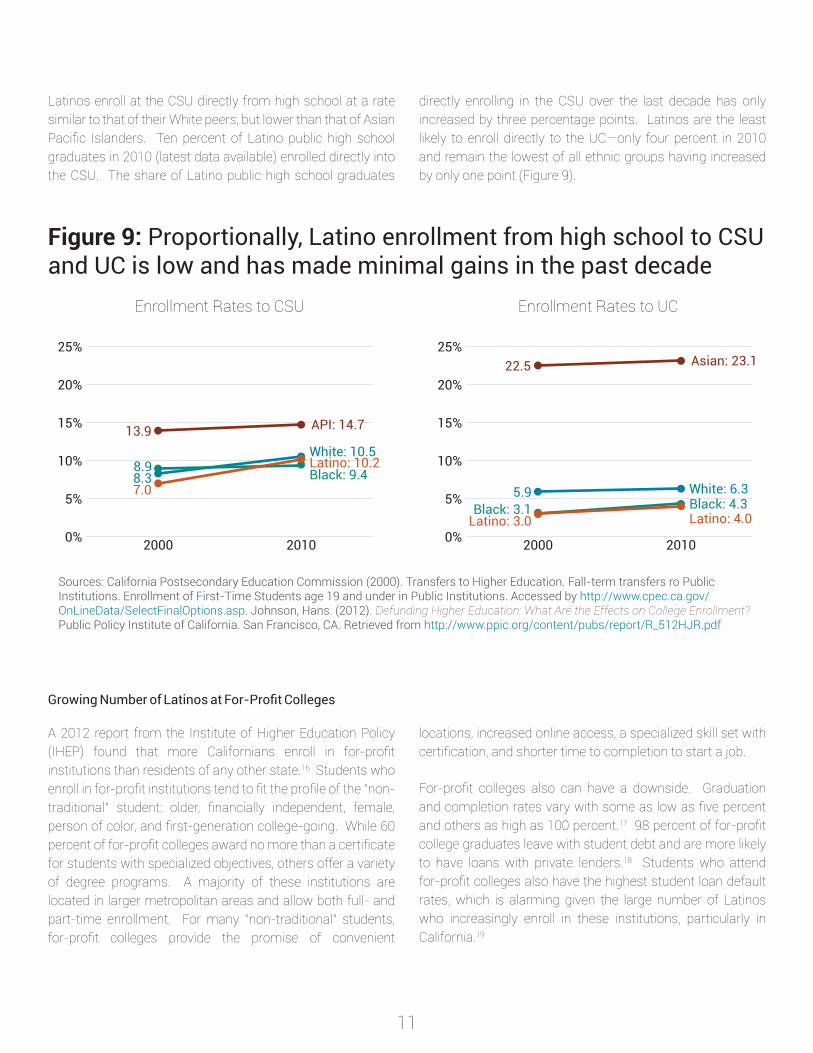
Latinos enroll at the CSU directly from high school at a rate similar to that of their White peers, but lower than that of Asian Pacific Islanders. Ten percent of Latino public high school graduates in 2010 (latest data available) enrolled directly into the CSU. The share of Latino public high school graduates
directly enrolling in the CSU over the last decade has only increased by three percentage points. Latinos are the least likely to enroll directly to the UC—only four percent in 2010 and remain the lowest of all ethnic groups having increased by only one point (Figure 9).
Figure 9: Proportionally, Latino enrollment from high school to CSU and UC is low and has made minimal gains in the past decade
0%
5%
10%
15%
20%
25%
20102000
API: 14.7
White: 10.5
Black: 9.4Latino: 10.2
13.9
8.98.37.0
Enrollment Rates to CSU Enrollment Rates to UC
Sources: California Postsecondary Education Commission (2000). Transfers to Higher Education. Fall-term transfers ro Public Institutions. Enrollment of First-Time Students age 19 and under in Public Institutions. Accessed by http://www.cpec.ca.gov/OnLineData/SelectFinalOptions.asp. Johnson, Hans. (2012). Defunding Higher Education: What Are the Effects on College Enrollment? Public Policy Institute of California. San Francisco, CA. Retrieved from http://www.ppic.org/content/pubs/report/R_512HJR.pdf
A 2012 report from the Institute of Higher Education Policy (IHEP) found that more Californians enroll in for-profit institutions than residents of any other state.16 Students who enroll in for-profit institutions tend to fit the profile of the “non-traditional” student: older, financially independent, female, person of color, and first-generation college-going. While 60 percent of for-profit colleges award no more than a certificate for students with specialized objectives, others offer a variety of degree programs. A majority of these institutions are located in larger metropolitan areas and allow both full- and part-time enrollment. For many “non-traditional” students, for-profit colleges provide the promise of convenient
locations, increased online access, a specialized skill set with certification, and shorter time to completion to start a job.
For-profit colleges also can have a downside. Graduation and completion rates vary with some as low as five percent and others as high as 100 percent.17 98 percent of for-profit college graduates leave with student debt and are more likely to have loans with private lenders.18 Students who attend for-profit colleges also have the highest student loan default rates, which is alarming given the large number of Latinos who increasingly enroll in these institutions, particularly in California.19
GrowingNumberofLatinosatFor-ProfitColleges
0%
5%
10%
15%
20%
25%
20102000
Asian: 23.1
White: 6.3Black: 4.3Latino: 4.0
22.5
5.9Black: 3.1
Latino: 3.0
12
As this report finds, enrollment rates from high school directly to California’s four-year institutions remain low for Latinos and, despite increasing college-going rates, they remain underrepresented in every segment of higher education. The question on everyone’s mind is, “Why”? And the answer is not a simple one: depressed high school graduation rates, poor college readiness, and budget cuts to college access all contribute to low college enrollment numbers. While that is part of the story, it is not the complete story. A variety of factors contribute to Latino underrepresentation at the CSU, UC, and other four-year universities. California policymakers and colleges should put sound policies in place that address these issues in order to improve Latino enrollment, persistence, and completion rates.
Eligibility Matters
The minimum requirement for eligibility to the California State University (CSU) or the University of California (UC) system is completion of the A-G curriculum, a set of courses students usually complete in their 9th to 12th grade years. Admission to the CSU and the UC is then based on Grade Point Average (GPA), test scores, and the applicant’s overall profile. The A-G curriculum therefore acts as a gatekeeper—only those who have completed the curriculum can apply to the CSU and UC, and even then, there is no guarantee of admission.
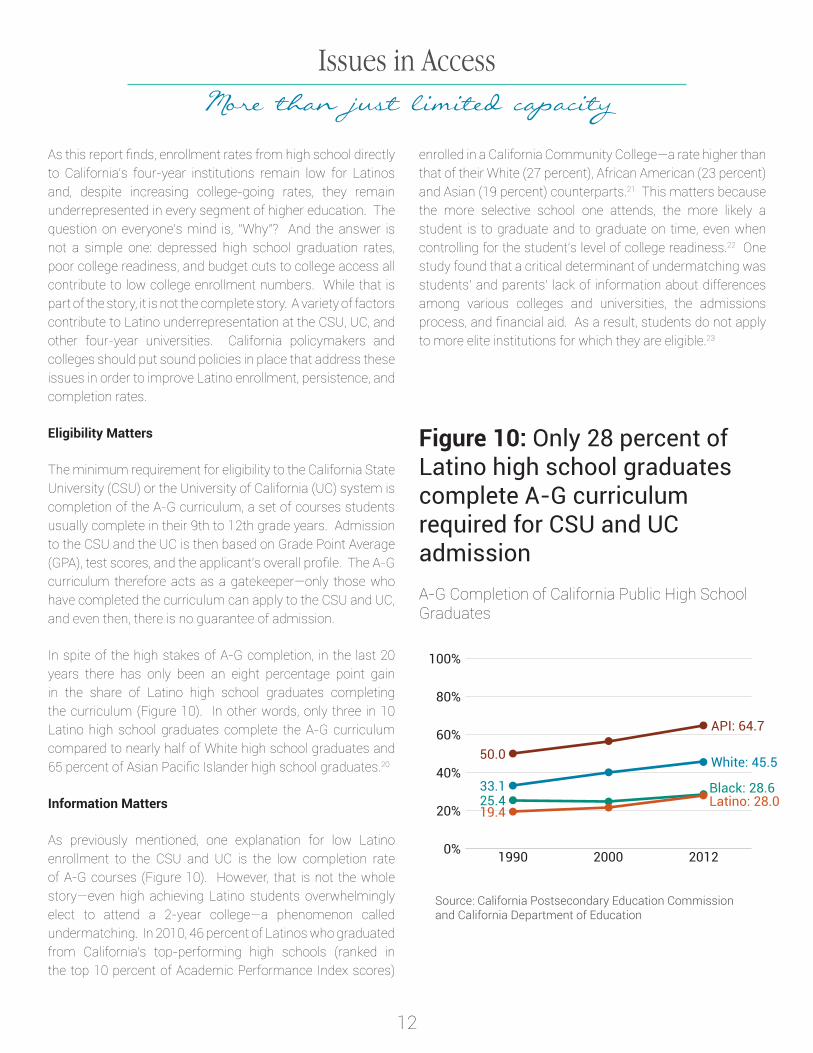
In spite of the high stakes of A-G completion, in the last 20 years there has only been an eight percentage point gain in the share of Latino high school graduates completing the curriculum (Figure 10). In other words, only three in 10 Latino high school graduates complete the A-G curriculum compared to nearly half of White high school graduates and 65 percent of Asian Pacific Islander high school graduates.20
Information Matters
As previously mentioned, one explanation for low Latino enrollment to the CSU and UC is the low completion rate of A-G courses (Figure 10). However, that is not the whole story—even high achieving Latino students overwhelmingly elect to attend a 2-year college—a phenomenon called undermatching. In 2010, 46 percent of Latinos who graduated from California’s top-performing high schools (ranked in the top 10 percent of Academic Performance Index scores)
enrolled in a California Community College—a rate higher than that of their White (27 percent), African American (23 percent) and Asian (19 percent) counterparts.21 This matters because the more selective school one attends, the more likely a student is to graduate and to graduate on time, even when controlling for the student’s level of college readiness.22 One study found that a critical determinant of undermatching was students’ and parents’ lack of information about differences among various colleges and universities, the admissions process, and financial aid. As a result, students do not apply to more elite institutions for which they are eligible.23
Figure 10: Only 28 percent of Latino high school graduates complete A-G curriculum required for CSU and UC admissionA-G Completion of California Public High School Graduates
0%
20%
40%
60%
80%
100%
201220001990
API: 64.7
White: 45.5
Black: 28.6Latino: 28.0
50.0
33.125.419.4
Source: California Postsecondary Education Commission and California Department of Education
Issues in AccessMore than just limited capacity
13
Congratulations, you’ve been admitted...but you’re not really ready for college. Stuck in pre-college level work.
The share of students across the country requiring some level of remediation in math or English is staggering. A 2010 study by the National Center for Public Policy and Higher Education found that nationally, 60 percent of students who enroll in college for the first time are required to take pre-college level courses in English or math. For those who attend two-year colleges, the proportion jumps to 75 percent.27
Data reported by the CSU system to Complete College America found that nearly 60 percent of students entering the CSU enrolled in pre-college level courses. For Latinos entering the CSU, that share is even greater—75 percent—compared to 41 percent of Whites.28
Among the California Community Colleges, 85 percent of incoming students are assessed to be unprepared for college-level math and 70 percent unprepared for college-level English.29 Latinos are more likely to be placed into and required to complete pre-college level courses before enrolling in collegiate-level courses than their White and Asian counterparts.30 The large number of Latinos in community colleges coupled with overrepresentation in pre-college level courses is troubling because research shows that only one out of five students in pre-college level courses ever completes a vocational certificate, associate degree or transfers to a four-year university within six years of starting at a community college.31
Money Matters
Family income also has a significant effect on college enrollment at four-year institutions. Low-income students, regardless of race, are considerably underrepresented at four-year colleges. However, low-income Latinos are still much less likely to attend more selective universities than low-income White students.24 Low-income students may face a variety of obstacles such as financial uncertainty, expensive child care, simultaneous part- or full-time employment, and unreliable transportation which may act as roadblocks on their pathway to postsecondary education. However, research has shown that robust support services such as high quality financial advising, counseling, and strong academic support have been effective in improving rates of persistence and success among low-income students.25
Parental Education Matters
Parental education is one of the strongest contributors to four-year college enrollment. Young adults with at least one parent who attended college are more likely to enroll in four-year institutions—even when controlling for income. Low-income Californians between the ages of 18 and 26 with college-educated parents have a 24 percent chance of enrolling in a CSU or similarly ranked four-year college. The probability for those whose parents do not have a bachelor’s degree decreases to 13 percent.26 All the more reason to increase completion rates now—to ensure the success of future generations.

14
For California to close the workforce shortage, Latino college completion rates must significantly improve. This will provide greater mobility of Latinos into the middle class and toward greater economic security and provide the state of California with a significant return on investment.32 The gains in Latino college-going are promising, but completion rates are unacceptably low. Educational equity is a matter of social justice, but California also has economic motivation to improve Latino completion rates.
Community Colleges
Recently, the California Community Colleges released a scorecard documenting completion rates for students by race/ethnicity. The scorecard reports that in 2011-12, four out of 10 Latino degree-seeking students completed an associate degree, certificate or transferred to a four-year institution after six years (Figure 11). The scorecard breaks down outcomes for “prepared” versus “unprepared” students and finds that nearly 65 percent of “prepared” Latinos complete a degree, certificate, or transfer versus 35 percent of “unprepared” Latinos.33 Completion rates have declined over the past six years for Latinos, African Americans, Asians, and Whites. Given the volume of students enrolled in California’s 112 community colleges, this is especially disturbing.
While the scorecard is a major step forward in providing greater data and transparency on the progress students make at community colleges, it does not offer the full story of what is happening to Latino students. For example, the CCC scorecard captures only those students who have earned six units and have attempted a math or English course within their first three years. In a 2010 study commissioned by the Campaign for College Opportunity, researchers looked at students who had earned six units, regardless of math or English attempts, and found that only two in 10 Latinos earned a degree, certificate or became transfer-eligible after six years.34 Currently, the scorecard provides percentages of students and does not include raw numbers, leaving questions about the total number of Latino students who are prepared versus unprepared, and completing at each community college. Additionally, students who earn a certificate, associate degree, or transfer to a four-year school are bunched together as completers—there’s no way to disaggregate these figures in order to understand the difference in student success outcomes within these completion categories.
Figure 11: An average of four in 10 Latinos complete community college after six years
0%
20%
40%
60%
80%
100%
201220092006
Asian: 66.7
White: 53.5
Black: 39.0Latino: 39.5
70.9
58.347.443.6
Source: California Community Colleges Chancellor’s Office, Scorecard Metric Summary Report
Note: Percentage of first-time students with minimum of 6 units earned who attempted any Math or English in the first three years and completed an associate degree, certificate or transfer-related outcome within six years of entry.
CCC 6-year Completion Rate — Overall(“Prepared” and “Unprepared” included)
Getting across the graduation stage. Access to college is not enough.
Less than two -thirds of “prepared” Latinos, and
fewer than four out of 10 “unprepared” Latinos,
complete community college in six years.

15
Completion rates for Latinos at the CSU are only slightly better. Fewer than half of Latino first-time freshmen who entered in the fall of 2006 graduated within six years. Only 10 percent of Latino freshmen who entered in fall 2008 graduated within the traditional four-year timeframe (Figure 12). However, in
the past decade, the share of Latinos who graduate within six years has increased by seven percentage points; Latinos who graduate within four years have improved their outcomes by only two percentage points.
California State University
Figure 12: Fewer than half of Latinos graduate CSU within six yearsCSU 6- and 4-Year First-Time Freshmen Graduation Rates
0%
10%
20%
30%
40%
50%
60%
2012200920062003
API: 53.4
White: 58.4
Black: 34.7
Latino: 44.6
White: 23.1
Black: 7.8Latino: 10.3API: 12.2
50.7
45.1
37.7
26.3
16.2
9.78.15.3
FOU
R-YE
ARSI
X-YE
AR
Source: CSU Analytic Studies, California State University Graduation Rates, Consortium for Student Retention Data Exchange (CSRDE), Retrieved from http://www.asd.calstate.edu/csrde/index.shtml
California could produce an additional 790,000 four-year degrees if gaps in enrollment and
achievement between underrepresented minority students and White and Asian students
were to be closed.35
16
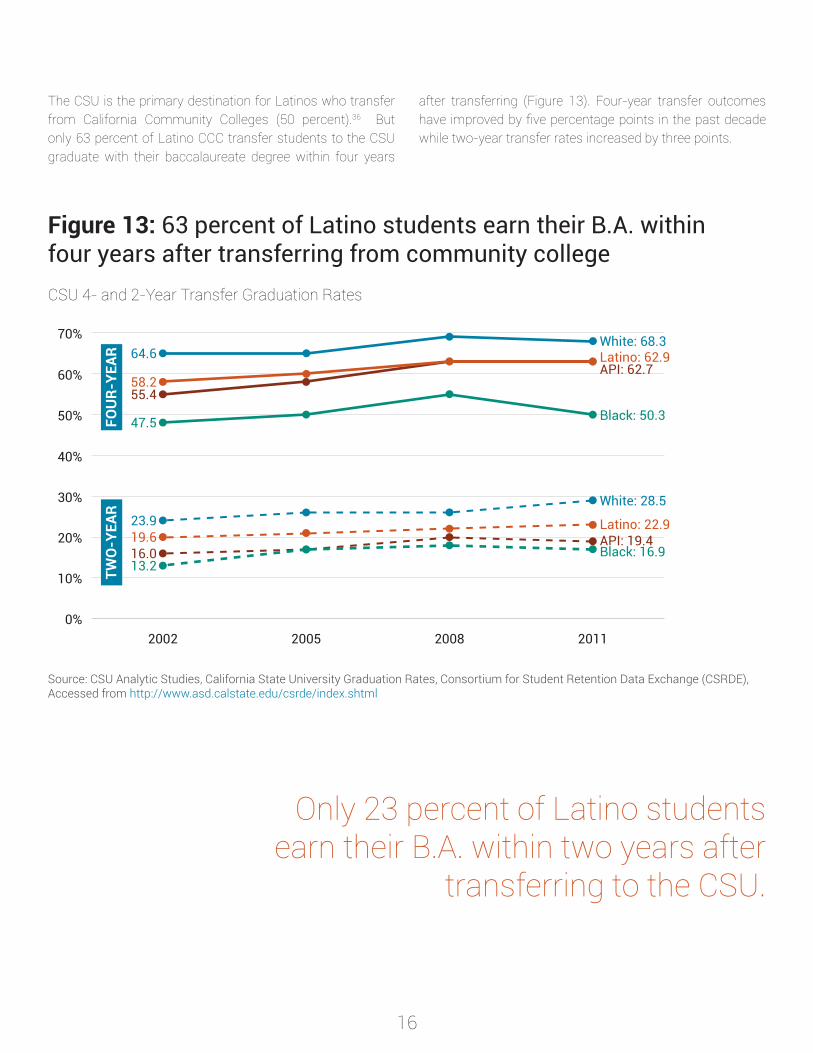
The CSU is the primary destination for Latinos who transfer from California Community Colleges (50 percent).36 But only 63 percent of Latino CCC transfer students to the CSU graduate with their baccalaureate degree within four years
after transferring (Figure 13). Four-year transfer outcomes have improved by five percentage points in the past decade while two-year transfer rates increased by three points.
Figure 13: 63 percent of Latino students earn their B.A. within four years after transferring from community collegeCSU 4- and 2-Year Transfer Graduation Rates
0%
10%
20%
30%
40%
50%
60%
70%
2011200820052002
API: 62.7
White: 68.3
Black: 50.3
Latino: 62.9
White: 28.5
Black: 16.9
Latino: 22.9API: 19.4
64.6
58.255.4
47.5
23.919.616.013.2
FOU
R-YE
ARTW
O-Y
EAR
Source: CSU Analytic Studies, California State University Graduation Rates, Consortium for Student Retention Data Exchange (CSRDE), Accessed from http://www.asd.calstate.edu/csrde/index.shtml
Only 23 percent of Latino students earn their B.A. within two years after
transferring to the CSU.
17
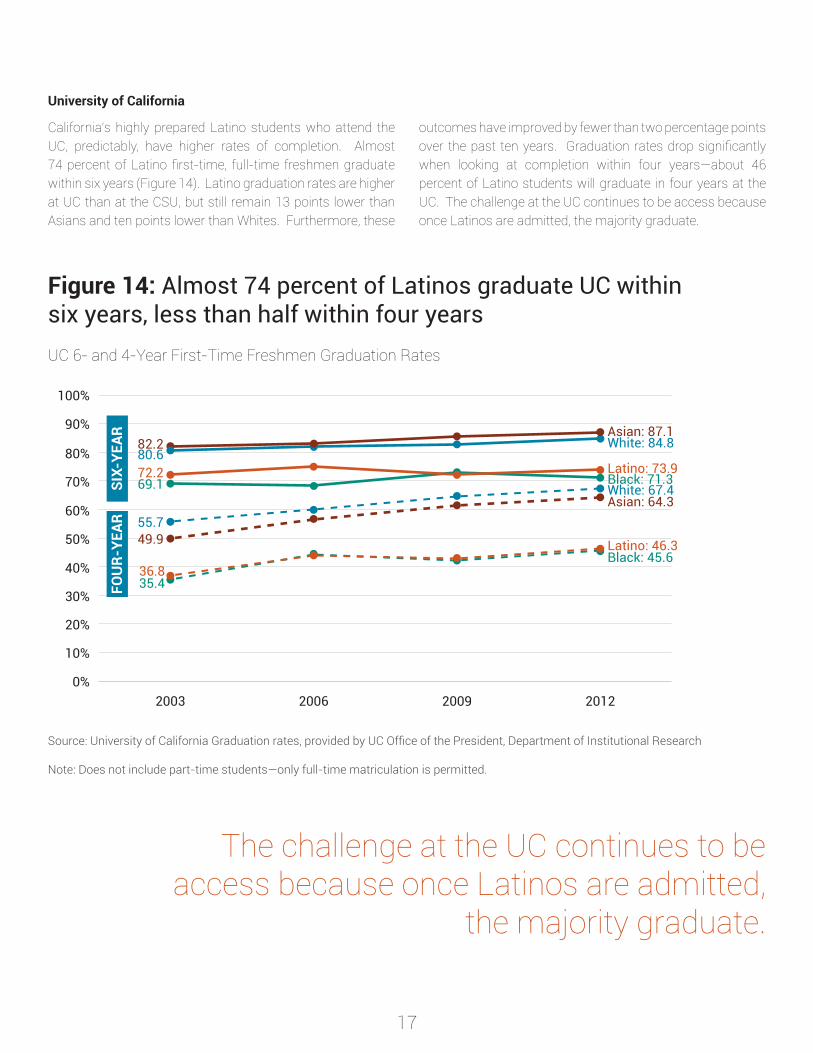
California’s highly prepared Latino students who attend the UC, predictably, have higher rates of completion. Almost 74 percent of Latino first-time, full-time freshmen graduate within six years (Figure 14). Latino graduation rates are higher at UC than at the CSU, but still remain 13 points lower than Asians and ten points lower than Whites. Furthermore, these
outcomes have improved by fewer than two percentage points over the past ten years. Graduation rates drop significantly when looking at completion within four years—about 46 percent of Latino students will graduate in four years at the UC. The challenge at the UC continues to be access because once Latinos are admitted, the majority graduate.
University of California
Figure 14: Almost 74 percent of Latinos graduate UC within six years, less than half within four yearsUC 6- and 4-Year First-Time Freshmen Graduation Rates
0%
10%
20%
30%
40%
50%
60%
70%
80%
90%
100%
2012200920062003
Asian: 87.1White: 84.8
Black: 71.3Latino: 73.9White: 67.4
Black: 45.6Latino: 46.3
Asian: 64.3
82.280.672.269.1
55.749.9
36.835.4FO
UR-
YEAR
SIX-
YEAR
Source: University of California Graduation rates, provided by UC Office of the President, Department of Institutional Research
Note: Does not include part-time students—only full-time matriculation is permitted.
The challenge at the UC continues to be access because once Latinos are admitted,
the majority graduate.
18
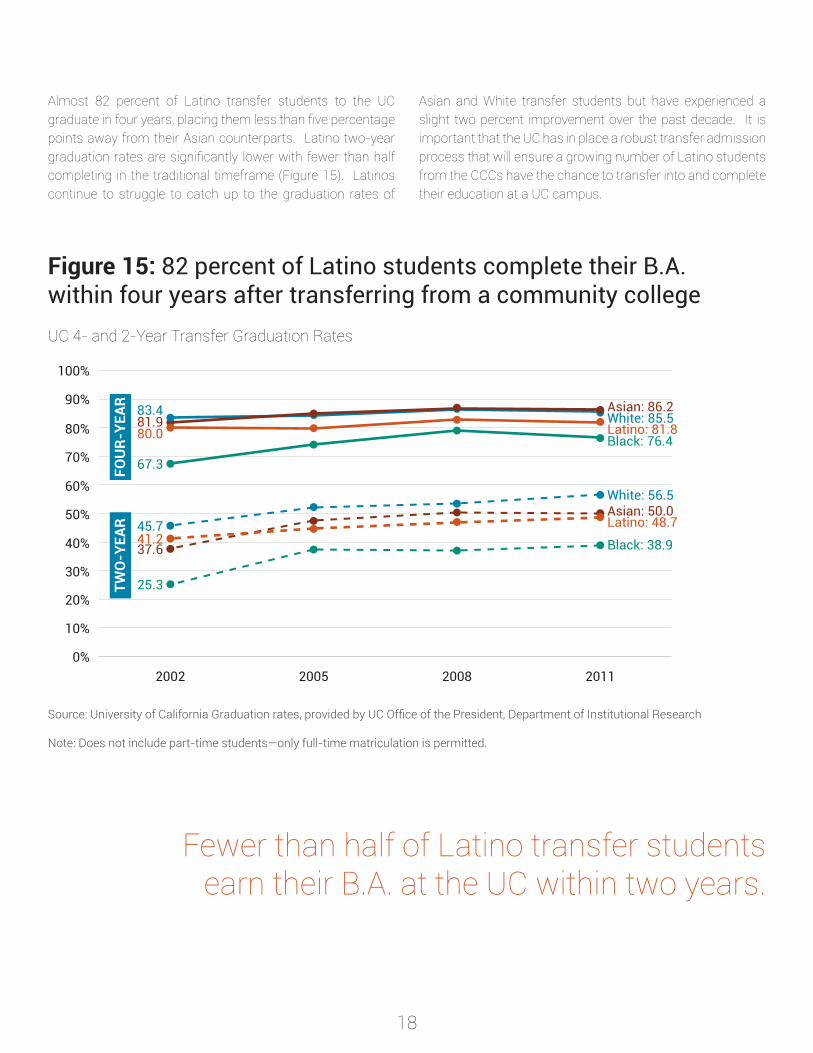
Figure 15: 82 percent of Latino students complete their B.A. within four years after transferring from a community collegeUC 4- and 2-Year Transfer Graduation Rates
0%
10%
20%
30%
40%
50%
60%
70%
80%
90%
100%
2011200820052002
Asian: 86.2White: 85.5
Black: 76.4Latino: 81.8
FOU
R-YE
AR
White: 56.5
Black: 38.9
Latino: 48.7Asian: 50.0
83.481.980.0
67.3
45.741.237.6
25.3TWO
-YEA
R
Source: University of California Graduation rates, provided by UC Office of the President, Department of Institutional Research
Note: Does not include part-time students—only full-time matriculation is permitted.
Almost 82 percent of Latino transfer students to the UC graduate in four years, placing them less than five percentage points away from their Asian counterparts. Latino two-year graduation rates are significantly lower with fewer than half completing in the traditional timeframe (Figure 15). Latinos continue to struggle to catch up to the graduation rates of
Asian and White transfer students but have experienced a slight two percent improvement over the past decade. It is important that the UC has in place a robust transfer admission process that will ensure a growing number of Latino students from the CCCs have the chance to transfer into and complete their education at a UC campus.
Fewer than half of Latino transfer students earn their B.A. at the UC within two years.
19
Conclusion An economic and social imperative
California needs more and better-educated workers to remain competitive with other major economies of the nation and the world. A highly trained workforce helps California retain and attract employers, and that in turn helps to ensure work opportunities and a better standard of living for everyone.
To accomplish this, we need a system of higher education that works—one that strategically, efficiently and cost effectively produces the graduates who will build the economy of today and tomorrow.
The good news is that this report confirms the incredible willingness and desire among Latino youth to go to college. Enrollment is high and growing.
But too few Latino college students are earning a certificate or college degree. We are falling into a pattern of improved college access, without success.
The large enrollment figures give an appearance of progress and confirm the desire for higher education among Latinos, but the goals of college completion remain largely unfilled.
Solutions that aim to improve completion and graduation rates cannot look the same as they did 20 years ago because our state demographics are changing and the important role of our public colleges and universities could not be clearer.
The positive impact of improved rates of degree attainment will make its way to the pocketbooks and wallets of the state’s residents. A report by the National Center for Higher Education Management Systems estimated that if California closed its racial/ethnic educational attainment gap by 2020, California’s personal income would increase by more than $135 billion (2012 dollars).37
When we improve Latino educational outcomes in California, we all benefit.
Recommendations
California education officials, along with students and their families, can take action—starting now—that will close this education gap and get our workforce growing in the right direction. The Campaign for College Opportunity offers the following recommendations:
1. Create a statewide plan for higher education;
2. Fund colleges for both enrollment and success;
3. Improve K-12 & postsecondary coordination;
4. Invest in services students need to succeed; and
5. Strengthenfinancialsupportoptionsforstudents.
20
Sources
FIGURE 6California Community Colleges Chancellor’s Office, Annual/Term Student Count Report, Fall 2012 Accessed from CCC Data Mart http://datamart.cccco.edu/Students/Student_Term_Annual_Count.aspxCSU Analytic Studies. Enrollment by Campus and Ethnic Group, Fall 2012, Table 1, Accessed from http://www.calstate.edu/as/stat_reports/2012-2013/feth01.htmUC Accountability report. (2013). Racial/ethnic distribution of students, University wide and by campus, Fall 2012. Accessed http://accountability.universityofcalifornia.edu/index/8.1.1Data provided by Director of Research & Publications from Association of Independent California Colleges and Universities (AICCU)U.S. Department of Education. Institute of Education Sciences, National Center for Education Statistics. (2011). Integrated Postsecondary Education Data System (IPEDS). Fall 2011 Enrollment: Race/ethnicity, gender, attendance status, and level of student (all undergraduates) at for Profits in California (less than 2-year, 2-year, and 4-year).
FIGURE 7First Time Freshmen Sources: California Community Colleges Chancellor’s Office, Student Enrollment Status Summary Report, Fall 2012 Accessed from CCC Data Mart http://datamart.cccco.edu/Students/Enrollment_Status.aspxCSU Analytic Studies. First-Time Freshmen Enrollment by Campus and Ethnicity, Fall 2012, Table 3 Accessed from http://www.calstate.edu/as/stat_reports/2012-2013/fnse03.htmUC Accountability report. (2013). Racial/ethnic distribution of new undergraduates, Fall 2000 to 2012, Accessed http://accountability.universityofcalifornia.edu/index/8.2Data provided by Director of Research & Publications from Association of Independent California Colleges and Universities (AICCU)U.S. Department of Education. Institute of Education Sciences, National Center for Education Statistics. (2011). Integrated Postsecondary Education Data System (IPEDS). First-time, full-time freshmen at For Profits in California (less than 2-year, 2-year, and 4-year) in Fall 2011.
Total Undergraduate Sources: California Community Colleges Chancellor’s Office, Annual/Term Student Count Report, Fall 2012 Accessed from CCC Data Mart http://datamart.cccco.edu/Students/Student_Term_Annual_Count.aspxCSU Analytic Studies. Enrollment by Campus and Ethnic Group, Fall 2012, Table 1, Accessed from http://www.calstate.edu/as/stat_reports/2012-2013/feth01.htm UC Accountability report. (2013). Racial/ethnic distribution of students, University wide and by campus, Fall 2012. Accessed http://accountability.universityofcalifornia.edu/index/8.1.1 Data provided by Director of Research & Publications from Association of Independent California Colleges and Universities (AICCU)U.S. Department of Education. Institute of Education Sciences, National Center for Education Statistics. (2011). Integrated Postsecondary Education Data System (IPEDS). Fall 2011 Enrollment: Race/ethnicity, gender, attendance status, and level of student (all undergraduates) at for Profits in California (less than 2-year, 2-year, and 4-year).
FIGURE 101990 data from California Postsecondary Education Commission, First-Time Students at Public Institutions/College Going Counts by race/ethnicity; 2000 & 2012 data from CA Department of Education, DataQuest, Graduates, # of Grads and Grads with UC/CSU Required Courses by , First-Time Students at Public Institutions / College Going Counts by race/ethnicity
21
Endnotes
1 Pitkin, John, Dowell Myers. (2012). Generational Projections of the California Population by Nativity and Year of Immigrant Arrival. Los Angeles, CA. Page 8. Retrieved from http://www.usc.edu/schools/price/futures/pdf/2012_Pitkin-Myers_CA-Pop-Projections.pdf2 Fry, Richard and Paul Taylor. (2013). Hispanic High School Graduates Pass Whites in Rate of College Enrollment. Pew Hispanic Center. Washington, D.C. Retrieved from http://www.pewhispanic.org/files/2013/05/PHC_college_enrollment_2013-05.pdf3 Public Policy Institute of California. (December 2012). PPIC Statewide Survey. Mark Baldassare, Survey Director. Survey: Educational hopes for child (December 2012) by race/ethnicity (Percents). PPIC bears no responsibility for the interpretations presented or conclusions reached based on analysis of the data.4 Public Policy Institute of California. (November 2010). PPIC Statewide Survey. Mark Baldassare, Survey Director. Survey: Importance of a college education today (November 2010) by race/ethnicity (Percents). PPIC bears no responsibility for the interpretations presented or conclusions reached based on analysis of the data. 5 Stiles, Jon, Michael Hout, and Henry Brady. (2012). California’s Economic Payoff: Investing in College Access & Completion. Berkeley, CA. Retrieved http://www.collegecampaign.org/resource-library/our-publications/6 Ibid.7 Pitkin, John, Dowell Myers. (2012). Generational Projections of the California Population by Nativity and Year of Immigrant Arrival. Los Angeles, CA. Page 8. Retrieved from http://www.usc.edu/schools/price/futures/pdf/2012_Pitkin-Myers_CA-Pop-Projections.pdf8 U.S. Census Bureau, 2011 American Community Survey, 1-year estimates, DP05: Demographic and Housing Estimates and U.S. Census Bureau, 2011 American Community Survey 1-Year estimates, B01001I: Sex by Age (Hispanic or Latino) and U.S. Census Bureau, 2011 American Community Survey 1-Year estimates, DP05: Demographic and Housing Estimates9 U.S. Census Bureau, 2011 American Community Survey 1-Year Estimates, PUMS. Latinos include any race of Hispanic origin. White, African American, API do not include Hispanic origin10 U.S. Census Bureau, 2011 American Community Survey, 1-year estimates, PUMS11 U.S. Census Bureau, 2011 American Community Survey, 1-year estimates, PUMS12 California Competes. (2012). The Road Ahead: Higher education, California’s promise, and our future economy. San Francisco, CA. Retrieved from http://californiacompetes.org/wp-content/uploads/2012/06/CaCompetes_Report_Final-2.pdf13 Fry, Richard and Paul Taylor. (2013). Hispanic High School Graduates Pass Whites in Rate of College Enrollment. Pew Hispanic Center. Washington, D.C. Retrieved from http://www.pewhispanic.org/files/2013/05/PHC_college_enrollment_2013-05.pdf14 U.S. Census Bureau, 2012 American Community Survey, 1-year estimates, S0201: Selected Population Profile in the United States, Hispanic or Latino (of any race).15 California Department of Education. Graduation Data. 12th Grade Graduates Completing all Courses Required for U.C. and/or C.S.U. Entrance, 1999-2000 & 2011-2012 Retrieved from http://dq.cde.ca.gov/dataquest/stgradnum.asp?cChoice=StGrdEth&cYear=2011-12&cLevel=State&cTopic=Graduates&myTimeFrame=S&submit1=Submit and http://dq.cde.ca.gov/dataquest/stgradnum.asp?cChoice=StGrdEth&cYear=1999-00&ProgramName=All&cTopic=Graduates&cLevel=State&myTimeFrame=S16 Institute for Higher Education Policy. (2012). A New Classification Scheme for For-profit Institutions. Washington, D.C. Retrieved from http://www.ihep.org/assets/files/publications/a-f/(Report)_For-Profits_Classification_July_2012.pdf 17 Ibid.18 US Department of Education. (2010). Borrowing at the Maximum. Washington, D.C. Retrieved from http://nces.ed.gov/pubs2012/2012161.pdf19 U.S. Department of Education. (2013). Default Rates Continue to Rise for Federal Student Loans [Press release]. Retrieved from http://www.ed.gov/news/press-releases/default-rates-continue-rise-federal-student-loans20 1990 data from California Postsecondary Education Commission, First-Time Students at Public Institutions/College Going Counts by race/ethnicity; 2000 & 2012 data from CA Department of Education, DataQuest, Graduates, # of Grads and Grads with UC/CSU Required Courses by race/ethnicity, First-Time Students at Public Institutions / College Going Counts by race/ethnicity21 Malcom-Piqueux, Lindsey. (2013). Addressing Latino Outcomes at California’s Hispanic-Serving Institutions: Latino and Latino High School Graduates are Disproportionately Enrolled in Community Colleges. A joint report from USC’s Center for Urban Education and Tomás Rivera Policy Institute. Los Angeles, CA. Retrieved from http://trpi.uscmediacurator.com/cc-enrollment/

22
22 Carnevale, Anthony and Jeff Strohl. (2013). Separate and Unequal: How Higher Education Reinforces the Intergenerational Reproduction of White Racial Privilege. Georgetown University – Center on Education and Workforce. Washington, D.C. Retrieved from http://www9.georgetown.edu/grad/gppi/hpi/cew/pdfs/Separate&Unequal.FR.pdf23 Dillon, Eleanor and Jeffrey Smith. (2013). The Determinants of Mismatch Between Students and Colleges. Working paper 19286 Retrieved from http://www.nber.org/papers/w1928624 Reardon, Sean F., Baker, Rachel, and Klasik, Daniel. (2012). Race, income, and enrollment patterns in highly selective colleges 1982-2004. Center for Education Policy Analysis, Stanford University. Retrieved from http://cepa.stanford.edu/content/race-income-and-enrollment-patterns-highly-selective-colleges-1982-200425 Solorzano, Daniel, Amanda Datnow, Vicki Park, and Tara Watford. (2013). Pathways to Postsecondary Success: Maximizing opportunities for youth in poverty. UC ACCORD. Retrieved from http://pathways.gseis.ucla.edu/publications/PathwaysReport.pdf26 Terriquez, Veronica and Sandra Florian. (2013). Socioeconomic Inequalities in the Postsecondary Enrollment, Employment, and Civic Engagement of California’s Youth (Policy Report No. 8). UCLA All Campus Consortium on Research for Diversity (UC/ACCORD) – Pathways to Postsecondary Success initiative. Retrieved from http://pathways.gseis.ucla.edu/publications/2013_07SocioeconomicPR.pdf27 National Center for Public Policy and Higher Education (2010). Beyond the Rhetoric: Improving College Readiness through Coherent State Policy. San Jose, CA. Retrieved from http://www.highereducation.org/reports/college_readiness/CollegeReadiness.pdf28 Complete College America (2011). Higher Education’s Bridge to Nowhere. Washington, D.C. Retrieved from http://www.completecollege.org/docs/California_remediation.pdf29 California Legislative Analyst’s Office. (2011). Are Entering Freshmen Prepared For College-Level Work? Sacramento, CA. Retrieved from http://www.lao.ca.gov/sections/higher_ed/FAQs/Higher_Education_ Issue_02.pdf 30 Perry, Mary; Matthew Rosin; Kathryn Woodward. (2010). Course-taking patterns, policies, and practices in developmental education in the California Community Colleges. Mountain View, CA. Retrieved from http://www.edsource.org/assets/files/ccstudy/FULL-CC-DevelopmentalCoursetaking.pdf31 California Budget Project. (2011). Gateway to a Better Future: Creating a Basic Skills System for California. Sacramento, CA. Retrieved from http://www.cbp.org/pdfs/2011/110506_Basic_Skills_Gateway.pdf32 In 2005, California’s return on investing in higher education was $3.00. Stiles, Jon, Michael Hout, and Henry Brady. (2005). Return on Investment: Educational Choices and Demographic Change in California’s Future. Berkeley, CA. Retrieved from http://www.collegecampaign.org/resource-library/our-publications/
In 2012 the return on investment was calculated at $4.80. Stiles, Jon, Michael Hout, and Henry Brady. (2012). California’s Economic Payoff: Investing in College Access & Completion. Berkeley, CA. Retrieved from http://www.collegecampaign.org/resource-library/our-publications/33 “Prepared” is defined as degree and/or transfer-seeking students whose lowest course attempted in Math and/or English was college level. “Unprepared” is defined as degree and/or transfer-seeking students whose lowest course attempted in Math and/or English was remedial level.34 Moore, Colleen and Nancy Shulock. (2010). Divided We Fail: Improving completion and closing racial gaps in California’s Community Colleges. Institute for Higher Education Leadership & Policy—California State University. Sacramento, CA. p. 7.35 California Competes. (2012). The Road Ahead: Higher education, California’s promise, and our future economy. San Francisco, CA. Retrieved from http://californiacompetes.org/wp-content/uploads/2012/06/CaCompetes_Report_Final-2.pdf36 Moore, Colleen and Nancy Shulock. (2010). Divided We Fail: Improving completion and closing racial gaps in California’s Community Colleges. Institute for Higher Education Leadership & Policy—California State University. Sacramento, CA. p. 7.37 Kelly, Patrick. (2005). As America Becomes More Diverse: The impact of state higher education inequality—California Profile. National Center for Higher Education Management Systems. Boulder, CO. Retrieved from http://www.higheredinfo.org/raceethnicity/California_State_Profile.pdf
23
About This Report
The Campaign for College Opportunity conducted this in-depth profile of Latinos and California’s public higher education system in the hopes of illuminating the current demographic, educational attainment, and college participation landscape of this key population. Most importantly, this report recommends actions for improving Latinos college completion rates through public policy and utilizing a number of strategies.
This is the first report in our new series: The State of Higher Education in California.
Methodology
Data for this report were collected from a variety of sources. Primarily, demographic and social characteristics were collected from the 1990 and 2000 Decennial Census and the American Community Survey (ACS). The ACS, annually published by the U.S. Census Bureau, provides a detailed socioeconomic and demographic profile of the U.S. population. The ACS replaces the “long form” of the Decennial Census; the advantage of the ACS is annual collection, as opposed to collection once every ten years through the Decennial Census. Since 2000, the ACS is conducted nationwide with an annual sample of 3 million households. Data indicators are based on the 2011 and 2012 ACS one-year estimates collected and analyzed through tools provided by the U.S. Census Bureau: Factfinder and DataFerrett using PUMS data sets. Data for Latino/Hispanic includes those of any race. Data for White, Asian Pacific Islander, Black/African American excludes persons of Hispanic origin. In some cases data for Asians is reported and in other cases, Asian Pacific Islander. This reflects the difference in data provided by the different segments.
Data was also collected through the Integrated Postsecondary Education Data System (IPED) database, available at the National Center for Education Statistics (NCES) website, the California Postsecondary Education Commission (CPEC), the California Department of Education (CDE), the California Community Colleges Chancellor’s Office, the California State University Division of Analytic Studies, the University of California’s Office of the President, and the Association of Independent California Colleges and Universities (AICCU).
Acknowledgments
A special thanks to our principal funders for this project: the Kresge Foundation, the Lumina Foundation, and the Evelyn & Walter Haas Jr. Fund. Their commitment and dedication to increasing opportunity for all Americans in higher education is to be admired. We would also like to thank the additional funders who make our work possible including: the California Education Policy Fund, the College Access Foundation of California, and the California Wellness Foundation.
The Campaign would additionally like to thank members of our Senior Faculty Advisory Body for providing valuable expertise and feedback as this report was being drafted: Estela Mara Bensimon (University of Southern California), Darla M. Cooper (The RP Group), Michelle Asha Cooper (Institute for Higher Education Policy), Carrie Hahnel (The Education Trust-West), Hans Johnson (Public Policy Institute of California), Deborah Santiago (Excelencia in Education), and Jane V. Wellman (National Association of System Heads). Affiliation is provided for identification purposes only.
Nadia Valliani, Research and Policy Analyst with the Campaign for College Opportunity, was the principal researcher of this report, with significant contributions from Michele Siqueiros and Audrey Dow.
24
About The Campaign for College Opportunity
The Campaign for College Opportunity is a broad-based, bipartisan coalition, including business, education and labor leaders that is dedicated to ensuring the next generation of Californians has the opportunity to go to college and succeed. The Campaign works to create an environment of change and lead the state toward effective policy solutions. It is focused upon substantially increasing the number of students attending two- and four-year colleges in the state and significantly impacting the rate of student success and achievement of their postsecondary education objectives.
For more information, visit: www.collegecampaign.org.
Board of Directors
David Wolf (Chair) Campaign for College Opportunity Co-Founder
Thomas A. Saenz (Vice Chair) President & General Counsel, Mexican American Legal Defense and Educational Fund (MALDEF)
Marcus A. Allen Partner, Englander Knabe & Allen
George Boggs Superintendent-President Emeritus, Palomar College; President & CEO Emeritus, American Association of Community Colleges
Pamela H. David Executive Director, Walter & Elise Haas Fund
Gary K. Hart Former California Secretary of Education & State Senator
Bill Hauck Senior Advisor, Goddard Claussen/West Trustee, California State University
William G. McGinnis Trustee Butte-Glenn Community College District
Rory O’Sullivan Policy and Research Director Young Invincibles
Eloy Ortiz Oakley Superintendent-President Long Beach City College
Darline Robles Professor of Clinical Education USC Rossier School of Education
Frederick R. Ruiz Co-Founder & Chairman Emeritus, Ruiz Food Products; Regent, University of California
Lisa A. Smith Managing Director, Loop Capital Markets
We are dedicating this publication to Steve Weiner, co-founder of the Campaign for College Opportunity, who passed away in April 2013. Steve loved California and understood the transformational power of education for individuals, especially low-income students and students of color. He knew that the promise of college opportunity had to be kept, not only to ensure better opportunities for those who benefited from earning a college degree, but to ensure the very economic and social security of our state. Steve’s vision for a better California is with us every single day.
LosAngelesOffice714 W. Olympic Boulevard, Suite 745Los Angeles, CA 90015Tel: 213.744.9434Fax: 800.207.3560Executive Director: Michele Siqueiros
SacramentoOffice1512 14th StreetSacramento, CA 95814Tel: 916.443.1681Fax: 916.443.1682Associate Director: Jessie Ryan
www.facebook.com/collegecampaign www.twitter.com/CollegeOpp
www.collegecampaign.org
Ensuring that the next generation has the opportunity to go to college, and that California produces an additional 2.3
million college graduates by 2025
and succeed