the state of lake superior - great lakes fishery commission
TRANSCRIPT


THE STATE OF LAKE SUPERIORIN 1992
edited by
Michael J. HansenNational Biological Survey
Great Lakes Center1451 Green Road
Ann Arbor, MI 48105
Citation (general): Hansen, M. J. [ED.]. 1994. The state of Lake Superior in 1992.Great Lakes Fish. Comm. Spec. Pub. 94-l. 3110 p.
Citation (individual paper): Hansen, M. J., M. P. Ebener, J. D. Shively, and B. L.Swanson. 1994. Lake trout, p. 13-34. In M. J. Hansen [ed.] The state of LakeSuperior in 1992. Great Lakes Fish. Comm. Spec. Pub. 94-l.
SPECIAL PUBLICATION 94-1
Great Lakes Fishery Commission2100 Commonwealth Blvd., Suite 209
Ann Arbor, MI 481051563
July 1994
Contribution 848 of the National Biological Survey,Great Lakes Center, Ann Arbor, MI 48105


TABLE OF CONTENTS
EXECUTIVE SUMMARY . . . . . . . . . . . . . . . . . . . . . . . . . . . . . 1Objectives . . . . . . . . . . . . . . . . . . . . . . . . . . . . . . . . . . . . . . . . . . . . . . . 1Progress . . . . . . . . . . . . . . . . . . . . . . . . . . . . . . . . . . . . . . . . . . . . . . . . . 2 Lake Trout . . . . . . . . . . . . . . . . . . . . . . . . . . . . . . . . . . . . . . . . . . . . . . . 2 Other Salmonines . . . . . . . . . . . . . . . . . . . . . . . . . . . . . . . . . . . . . . . . . . 3Forage Species . . . . . . . . . . . . . . . . . . . . . . . . . . . . . . . . . . . . . . . . . . . . 4Other Species . . . . . . . . . . . . . . . . . . . . . . . . . . . . . . . . . . . . . . . . . . . . . 4Sea Lamprey . . . . . . . . . . . . . . . . . . . . . . . . . . . . . . . . . . . . . . . . . . . . . 4Ruffe . . . . . . . . . . . . . . . . . . . . . . . . . . . . . . . . . . . . . . . . . . . . . . . . . . . 5Habitat . . . . . . . . . . . . . . . . . . . . . . . . . . . . . . . . . . . . . . . . . . . . . . . . . 5
HISTORY, Michael J. Hansen and Richard G. Schorfhaar 7. . . . . . . . . . . . . .Introduction . . . . . . . . . . . . . . . . . . . . . . . . . . . . . . . . . . . . . . . . . . . . . . 7Goals and Objectives . . . . . . . . . . . . . . . . . . . . . . . . . . . . . . . . . . . . . . . 9Background . . . . . . . . . . . . . . . . . . . . . . . . . . . . . . . . . . . . . . . . . . . . . 10
LAKE TROUT, Michael J. Hansen, Mark P. Ebener, J. Dale Shively,and Bruce L. Swanson . . . . . . . . . . . . . . . . . . . . . . . . . . . . . . . . . . . . . . . . . 13
Introduction . . . . . . . . . . . . . . . . . . ,, . . . . . . . . . . . . . . . . . . . . . . . . . . 13stocking . . . . . . . . . . . . . . . . . . . . . . . . . . . . . . . . . . . . . . . . . . . . . . . . 13Abundance . . . . . . . . . . . . . . . . . . . . . . . . . . . . . . . . . . . . . . . . . . . . . . 16Mortality . . . . . . . . . . . . . . . . . . . . . . . . . . . . . . . . . . . . . . . . . . . . . . . 21Growth . . . . . . . . . . . . . . . . . . . . . . . . . . . . . . . . . . . . . . . . . . . . . . . . 24Wounding . . . . . . . . . . . . . . . . . . . . . . . . . . . . . . . . . . . . . . . . . . . . . . 27Fishery and Lamprey-Induced Mortality . . . . . . . . . . . . . . . . . . . . . . . . . 31Recommendations . . . . . . . . . . . . . . . . . . . . . . . . . . . . . . . . . . . . . . . . 34
OTHER SALMONINES, James W. Peck, Wayne R. MacCallum,Stephen T. Schram, Donald R. Schreiner, and J. Dale Shively . . . . . . . . . . . . 35
Introduction . . . . . . . . . . . . . . . . . . . . . . . . . . . . . . . . . . . . . . . . . . . . . 35Rainbow (Steelhead) Trout . . . . . . . . . . . . . . . . . . . . . . . . . . . . . . . . . . 37Coho Salmon . . . . . . . . . . . . . . . . . . . . . . . . . . . . . . . . . . . . . . . . . . . . 41Chinook Salmon . . . . . . . . . . . . . . . . . . . . . . . . . . . . . . . . . . . . . . . . . . 44Brown Trout . . . . . . . . . . . . . . . . . . . . . . . . . . . . . . . . . . . . . . . . . . . . 46Splake . . . . . . . . . . . . . . . . . . . . . . . . . . . . . . . . . . . . . . . . . . . . . . . . . 47Brook Trout . . . . . . . . . . . . . . . . . . . . . . . . . . . . . . . . . . . . . . . . . . . . . 48Pink Salmon . . . . . . . . . . . . . . . . . . . . . . . . . . . . . . . . . . . . . . . . . . . . . 49Atlantic Salmon . . . . . . . . . . . . . . . . . . . . . . . . . . . . . . . . . . . . . . . . . . 50Recommendations . . . . . . . . . . . . . . . . . . . . . . . . . . . . . . . . . . . . . . . . 51

FORAGE SPECIES, James H. Selgeby, Charles R. Bronte,and Jeffrey W. Slade . . . . . . . . . . . . . . . . . . . . . . . . . . . . . . . . . . . . . . . . . . 53
Introduction . . . . . . . . . . . . . . . . . . . . . . . . . . . . . . . . . . . . . . . . . . . . . 53Lake Herring . . . . . . . . . . . . . . . . . . . . . . . . . . . . . . . . . . . . . . . . . . . . 54Rainbow Smelt . . . . . . . . . . . . . . . . . . . . . . . . . . . . . . . . . . . . . . . . . . . 57Other Species . . . . . . . . . . . . . . . . . . . . . . . . . . . . . . . . . . . . . . . . . . . . 59Predator-Prey Interactions . . . . . . . . . . . . . . . . . . . . . . . . . . . . . . . . . . . 59Recommendations . . . . . I, . . . . . . . . . . . . . . . . . . . . . . . . . . . . . . . . . . 62
OTHER SPECIES, Wayne R. MacCallum, Stephen T. Schram,and Richard G. Schorfhaar . . . . . . . . . . . . . . . . . . . . . . . . . . . . . . . . . . . . . 63
Introduction . . . . . . . . . . . . . . . . . . . . . . . . . . . . . . . . . . . . . . . . . . . . . 63Lake Whitefish . . . . . . . . . . . . . . . . . . . . . . . . . . . . . . . . . . . . . . . . . . . 63Walleye . . . . . . . . . . . . . . . . . . . . . . . . . . . . . . . . . . . . . . . . . . . . . . . . 70Lake Sturgeon . . . . . . . . . . . . . . . . . . . . . . . . . . . . . . . . . . . . . . . . . . . 73Recommendations . . . . . . . . . . . . . . . . . . . . . . . . . . . . . . . . . . . . . . . . 76
SEA LAMPREY, Gerald T. Klar and Jerry G. Weise . . . . . . . . . . . . . . . . 77Introduction . . . . . . . . . . . . . . . . . . . . . . . . . . . . . . . . . . . . . . . . . . . . . 77History . . . . . . . . . . . . . . . . . . . . . . . . . . . . . . . . . . . . . . . . . . . . . . . . . 77Adult Populations . . . . . . . . . . . . . . . . . . . . . . . . . . . . . . . . . . . . . . . . . 79Production Areas . . . . . . . . . . . . . . . . . . . . . . . . . . . . . . . . . . . . . . . . . 80Larval Populations . . . . . . . . . . . . . . . . . . . . . . . . . . . . . . . . . . . . . . . . 81Control Strategy . . . . . . . . . . . . . . . . . . . . . . . . . . . . . . . . . . . . . . . . . . 83Nontarget Effects . . . . . . . . . . . . . . . . . . . . . . . . . . . . . . . . . . . . . . . . . 85Recommendations . . . . . . . . . . . . . . . . . . . . . . . . . . . . . . . . . . . . . . . . 86
RUFFE, James H. Selgeby . . . . . . . . . . . . . . . . . . . . . . . . . . . . . . . . . . . . 87Introduction . . . . . . . . . . . . . . . . . . . . . . . . . . . . . . . . . . . . . . . . . . . . . 87History.. . . . . . . . . . . . . . . . . . . . . . . . . . . . . . . . . . . . . . . . . . . . . . . . 87Interactions With Native Species . . . . . . . . . . . . . . . . . , . . . . . . . . . . . . 89Recommendations . . . . . . . . . . . . . . . . . . . . . . . . . . . . . . . . . . . . . . . . 92
HABITAT, Donald R. Schreiner . . . . . . . . . . . . . . . . . . . . . . . . . . . . . . . . 93Introduction . . . . . . . . . . . . . . . . . . . . . . . . . . . . . . . . . . . . . . . . . . . . . 93Maintain Existing Habitat . . . . . . . . . . . . . . . . . . . . . . . . . . . . . . . . . . . 93Restore Damaged Habitat . . . . . . . . . . . . . . . . . . . . . . . . . . . . . . . . . . . 94Reduce Contaminant Levels . . . . . . . . . . . . . . . . . . . . . . . . . . . . . . . . . 96Coordinate With Other Programs . . . . . . . . . . . . . . . . . . . . . . . . . . . . . 96Habitat Projects Between 1989 and 1991 . . . . . . . . . . . . . . . . . . . . . . . . 98Recommendations . . . . . . . . . . . . . . . . . . . . . . . . . . . . . . . . . . . . . . . . 99
ACKNOWLEDGMENTS . . . . . . . . . . . . . . . . . . . . . . . . . . . , . . . . . . 101
REFERENCES . . . . . . . . . . . . . . . . . . . . . . . . . . . . . . . . 1 0 3

EXECUTIVE SUMMARY
The Lake Superior fish community in 1992 is substantially differentthan it was a half century ago and is far from a state desired bymanagement agencies. Fish-community objectives were established for LakeSuperior in response to A Joint Strategic Plan for Management of GreatLakes Fisheries (Great Lakes Fishery Commission 1980) and are thetemplate for this report on the state of the lake. Reporting on progresstoward meeting stated goals and objectives will focus attention on criticalfishery issues and enhance understanding among fishery- andenvironmental-management agencies, political bodies, and the public.
Objectives
Fish-community objectives for Lake Superior include:
- Restore lake herring (Coregonus artedi) stocks to historic levels ofabundance for the purposes of lake trout (Salvelinus namaycush)restoration, production of other predators, and fishery harvest.
- Achieve a sustained annual yield of 1.8 million kg of lake trout fromnaturally reproducing stocks and an unspecified yield of other salmonidpredators while maintaining a predator-prey balance that allows normalgrowth of lake trout.
- Manage exploitation of nondepleted stocks to maintain a stable,self-sustaining status for lake whitefish (C. clupeaformis), deepwaterciscoes (Coregonus spp.), suckers (Catostomus spp.), and walleye(Stizostedion vitreum vitreum) and reestablish depleted stocks of nativespecies such as lake sturgeon (Acipenser fulvescens), brook trout(Salvelinus fontinalis), and walleye.
- Achieve a 50% reduction in parasitic:-phase sea lamprey (Petromyzonmarinus) abundance by the year 2000 and a 90% reduction by the year2010.
- Achieve no net loss of the productive capacity of habitats supportingLake Superior fisheries, restore the productive capacity of habitats thathave suffered damage, and reduce contaminants in all fish species tolevels below consumption advisory levels.

Progres s
Progress toward reaching fish-community objectives has been substan-tial, but target levels were not achieved by 1992.
- The annual yield of lake trout was 32.9% of the target level lakewide(25.2% in Canada and 32.4% in the United States) but was stillsubstantially supported by stocking in many areas. Other salmoninepredators reproduced widely and contributed 10% to the total yield ofsalmonine predators.
- Lake herring stocks rebounded in many areas of the lake, but it isunclear whether historic abundance levels have been reached
- Lake whitefish stocks supported greater commercial yields than anyother period in history. Most walleye, lake sturgeon, and brook troutstocks remained depressed because of overharvest, habitat degradation,and competition with introduced species.
- Parasitic-phase sea lamprey abundance remained approximately 10% ofprecontrol levels but still accounted for 312% of the total lake troutyield in the United States.
- Numerous opportunities for achieving habitat objectives have becomeavailable in Lake Superior, including Remedial Action Plans (RAPS) inAreas of Concern (AOCs), licensing of hydropower facilities, abinational program to restore and protect the Great Lakes basin, andother smaller projects.
Lake Trout
Lake trout, the dominant predator in Lake Superior until the 1950s,sustained an annual yield in excess of 1.8 million kg from 1929 to 1943.Most inshore stocks of lake trout collapsed during the 1950s because of sealamprey predation and uncontrolled commercial fishing. The currentannual yield of lake trout is 32.9% of the fish-community goal, althoughstocked fish contribute substantially to yield in some areas. Sea lampreypredation accounts for 14.7% of the lake trout-yield goal in the UnitedStates and an unknown portion of the goal in Canada. Stocking began soonafter the onset of the collapse of inshore lake trout stocks-in Michigan andWisconsin in 1952 and in Minnesota in 1964. More than 27 million troutwere stocked by 1970. More than 90 million trout were stocked by 1992.

Lake trout abundance increased in Lake Superior during the 1950s and1960s where stocking was undertaken or where remnant native populationssurvived. During the 1970s and 1980s, abundance of hatchery fish inMichigan declined as stocking rates were decreased. Abundance of wildfish increased during the 1970s as reproduction expanded. During the1980s, wild-fish abundance stabilized as fisheries became established. InWisconsin, abundance of hatchery fish declined slowly during the 1970s and1980s, while abundance of wild fish remained relatively stable. InMinnesota, wild- and hatchery-fish abundance increased steadily after 1970.Stockings in the United States and Canada during 1991 and 1992 were neartarget levels.
Lake trout mortality from fishing and sea lamprey predation wasexcessive during the period preceding the collapse of inshore stocks but wassubsequently brought under control. During the 1970s and 1980s, totalmortality remained above the target rate of 45% in most jurisdictions, andyield remained divided approximately equally between fishing and sealamprey predation. Sea lamprey predation is a dominant component oftotal mortality in the United States west of the Keweenaw Peninsula. Laketrout growth rates were generally higher in the United States than inCanada during the early 1980s but eventually became more similar. Growthrates declined steadily in Michigan between 1970 and 1989 but remainedmore consistent in Wisconsin and Minnesota. The observed decline ingrowth rate coincides with the decline in rainbow smelt (Osmerus mordax)abundance. Rainbow smelt remain the Ipreferred prey of lake trout in spiteof rebounding lake herring abundance in some areas.
Other Salmonines
Introductions of rainbow trout (Oncorhynchus mykiss) and brown trout(Salmo trutta) in the late 1800s, pink salmon (0. gorbuscha) in 1956, cohosalmon (0. kisutch) in 1966, and chinook salmon (0. tshawytscha) in 1967were successful in establishing populations across Lake Superior by the1980s. However, these anadromous fishes comprised only 10% of the totalyield of predators between 1988 and 1990. Abundance of rainbow trout andpink salmon declined recently; however, abundance of the other species isstable or increasing. Splake (a fertile hybrid resulting from a brook troutand lake trout cross) are stocked for put-grow-take local fisheries,particularly in Wisconsin. Brook trout. are native to Lake Superior, butpopulations were reduced to low levels in most areas through overfishing,habitat loss, and competition with introduced anadromous salmonids.Atlantic salmon (S. salar) were stocked for put-grow-take local fisheries in

Minnesota. Lakewide fin clipping of all chinook salmon stocked in LakeSuperior between 1988 and 1990 was conducted to ascertain the level ofnatural reproduction.
Forage Species
Lake herring was the dominant forage fish until the 1950s but declinedwhen rainbow smelt colonized the lake and grew in abundance during the1960s and 1970s. During the latter half of the 1980s and early 1990s, lakeherring populations rebounded. Although they are now far more abundantthan rainbow smelt, they still have not increased to historic levels ofabundance. Total biomass of lake herring increased greatly from 1984 to1986 and remained high from 1987 to 1992. Biomass of rainbow smelt hasbeen low since 1980 because of excessive mortality on older-agedindividuals. Diets of larger predators remain dominated by rainbow smelt,but lake herring consumption is increasing in areas where abundance isimproving. Limited bioenergetics analysis shows that prey consumption bysalmonine predators may be excessive in some areas.
Other Species
Because of increased abundance and expanded fisheries, lake whitefishstocks currently support greater commercial harvest than at any other timein the twentieth century. Lake trout restoration efforts have beennegatively impacted by expanded lake whitefish fisheries in some areas-asituation that bears further examination by management agencies. Lakesturgeon and walleye exist mostly as suppressed, localized popula-tions-management agencies continue restoration efforts of historicallyimportant stocks. Stocks of deepwater ciscoes declined continuouslythrough the 1980s as siscowet (Salvelinus namaycush siscowet), a deepwaterform of lake trout, stocks expanded. Brook trout restoration efforts havebeen largely unsuccessful.
Sea Lamprey
Current control methods reduced sea lamprey abundance by 90% fromprecontrol levels. Intensified chemical treatments and integration of newcontrol methods (including sterile-male releases, barrier construction, andincreased trapping) will be used to further reduce sea lamprey populations.Integrated management of sea lamprey initiatives will attempt to refineobjectives to control sea lamprey abundance and define an optimal sealamprey-control program to meet those objectives. The initiatives include:

- detailed evaluations of historic data on sea lamprey abundance,
- salmonid wounding and mortality, and
- chemical treatment to link control efforts to levels of fishery damage.
Ruffe
The ruffe (Gymnocephalus cernuus) is a Eurasian percid fish that wasintroduced into Lake Superior during the 1980s - most likely through ballastwater from an ocean-going vessel. Ruffe distribution is currently restrictedto the Duluth-Superior Harbor in western Lake Superior, several rivermouths as far as 80 km east of Duluth, and Thunder Bay Harbor inOntario. Ruffe abundance in the Duluth-Superior Harbor has grownsteadily since its introduction. Predation on ruffe by native predators wasvirtually nil in 1989, however, ruffe comprised 20% of all fish eaten bypredators in 1992.
Habitat
To help achieve no net loss of existing habitat, inventory and mappingof important spawning grounds in Lake Superior were initiated. To restoredamaged habitat, Stage 1 of the RAPS were completed or initiated for sixAOCs in Ontario and Michigan. In addition, Stage 2 of the RAP for theSt. Louis Bay and River system was completed. Also, Federal EnergyRegulatory Commission relicensing was in progress in eight hydropowerfacilities. To reduce contaminant levels, sources of point-source pollutionwere identified (some within AOCs) as locations where regulatory actionsshould be sought. These regulatory actions should help to reduce toxicsubstances so aquatic-organism health is not impaired, nor is the health ofhumans and wildlife jeopardized by consuming these aquatic organisms.

Michael J. HansenNational Biological Survey
Great Lakes Center1451 Green Road
Ann Arbor, MI 48105
and
Richard G. SchorfhaarMichigan Department of Natural Resources
Marquette Fisheries Station484 Cherry Creek RoadMarquette, MI 49855
Introduction
Fish-community objectives were established for Lake Superior (Busiahn 1990)in response to A Joint Strategic Plan for Management of Great Lakes Fisheries(Joint Plan) (Great Lakes Fishery Commission 1980). Fish-community objectivesserve as templates for state of the lake reports produced every three to five years.Fish-community objectives will be revised, strengthened, and made more specificbetween each report. The process of reporting on progress toward meeting statedgoals and objectives will focus attention on critical fisheries issues and enhancecommunication and understanding among fishery and environmental agencies,political bodies, and the public.
The first state of the lake report (Hansen 1990) described the progress through1989 toward reaching fish-community objectives established by the Lake SuperiorCommittee (Busiahn 1990). The 1989 report also presented a comprehensivecompilation of information. This report is modeled after the first report andpresents relevant conclusions drawn from summaries of the larger 1989 data sets.The 1992 report is intended to present a summary of key findings about LakeSuperior through 1992.
An alphabetical list of common fish names and their corresponding scientificnames are given in Table 1. The table lists all fish species referred to throughoutthis publication.

Table 1. A list of common and scientific fish names used in this publication.
Common name Scientific name
Atlantic salmonbrook troutbrown bullheadbrown troutburbotchinook salmoncoho salmondeepwater ciscodeepwater sculpinjohnny darterlake herringlake sturgeonlake troutlake whitefishmuskellungenorthern pikePacific salmonpink salmonrainbow smeltrainbow troutruffesalmonsea lampreysiscowetslimy sculpinsplake (brook trout x lake trout hybrid)Spoonhead sculpinstonecattrlXlt-pe?Ch
walleyewhite suckeryellow perch
Salmo salarSalvelinus fontinalisAmeiurus nebulosus
Salmo truttaLota lota
Oncorhynchus tshawytschaOncorhynchus kisutch
Coregonus spp.Myoxocephalus thompsoni
Etheostoma nigrumCoregonus artedi
Acipenser fulvescensSalvelinus namaycush
Coregonus clupeaformisEsox masquinongy
Esox luciusOncorhynchus spp.
Oncorhynchus gorbuschaOsmerus mordax
Oncorhynchus mykissGymnocephalus cernuus
Oncorhynchus spp.Petromyzon marinus
Salvelinus namaycush siscowetCottus cognatus
Salvelinus fontinalis x S. namaycushCottus ricei
Noturus flavusPercopsis omiscomaycus
Stizostedion vitreum vitreumCatostomus commersoni
Perca flavescens
8

Goals and Objectives
The basis for Lake Superior fish-community objectives is provided in thecommon goal statement for Great Lakes fishery agencies given in the Joint Plan:
To secure fish communities, based on foundations of stable self-sustainingstocks, supplemented by judicious plantings of hatchery-reared fish, and providefrom these communities an optimum contribution of fish, fishing opportunitiesand associated benefits to meet needs identified by society for:
wholesome food,recreation,employment and income, anda healthy human environment.
The fish-community objectives established for Lake Superior (Busiahn 1990)include:
- Restore lake herring stocks to historic levels of abundance for purposes of laketrout restoration, production of other predators, and fishery harvest.
- Achieve a sustained annual yield of 1.8 million kg of lake trout from naturallyreproducing stocks, and an unspecified yield of other salmonid predators, whilemaintaining a predator-prey balance that allows normal growth of lake trout.
- Manage exploitation of nondepleted stocks to maintain a stable, self-sustainingstatus (lake whitefish, deepwater ciscoes, suckers, and walleye) and reestablishdepleted stocks of native species (lake sturgeon, brook trout, and walleye).
- Achieve a 50% reduction in parasitic-phase sea lamprey abundance by the year2000 and a 90% reduction by the year 2010.
- Achieve no net loss of the productive capacity of habitats supporting LakeSuperior fisheries, restore the productive capacity of habitats that have suffereddamage, and reduce contaminants in all fish species to levels below consumptionadvisory levels.
In addition, the Great Lakes Water Quality Agreement of 1978 (InternationalJoint Commission 1989) states that Lake Superior should be maintained as abalanced and stable oligotrophic ecosystem with lake trout as the top aquaticpredator of a cold-water community and the benthic crustacean (Diporeia spp.) as

a key organism in the food chain. The 1978 Agreement goes on to establish thefollowing ecosystem-health indicators for Lake Superior lake trout and Diporeia spp.:
- Achieve lake trout productivity greater than 0.38 kg/ha from stable,self-producing stocks free of contaminants at concentrations that adversely affectthe trout themselves or the quality of the harvested products.
- Maintain Diporeia spp. abundance throughout the lake at the following levels:
- 220-320/m’ in water less than 100 m deep, and
- 30-160/mz in water more than 100 m deep.
Background
Lake Superior is the largest body of fresh water in North America and lies atthe head of the St. Lawrence River drainage (Lawrie and Rahrer 1973). Theshoreline is almost evenly divided between the United States and Canada but nearlytwo-thirds of the surface area lies in the United States (Table 2). In contrast, morethan two-thirds of the drainage basin lies in Canada. There are approximately asmany tributary streams in Canada as in the United States; however, the Canadianstreams are generally larger than the United States streams.
Lake Superior is oligotrophic because of its low temperature, low dissolvedsolids, great mean depth, and small littoral zone. Primary production is near thelow end of the range for freshwater lakes. Water clarity is very high with visibilitytypically 10 m deep, or more. Fish production averaged only 0.93 kg/ha during itspeak from 1916 to 1940. Fish production averaged only 0.80 kg/ha during the much-longer 90-year period from 1879 to 1969. The original fish community wasdominated by lake trout, lake whitefish, lake herring, and several species ofdeepwater ciscoes.
During the 1950s, excessive fishing and predation by sea lampreys (an invaderintroduced from the Atlantic Ocean) caused the collapse of lake trout, lake herring,and deepwater cisco populations (Hile et al. 1951; Pycha and Ring 1975; Jensen1978; Coble et al. 1990). Restoration of lake trout stocks was attempted throughsea lamprey control, lake trout stocking, and more restrictive regulation ofcommercial fishing. Inshore lake trout abundance increased tenfold between 1961and 1971 in Michigan and Wisconsin where stocking rates were highest, increasedmore slowly in Ontario where stocking rates were lower, and increased little inMinnesota where initiation of stocking was delayed. Remnant native stocks of leanlake trout continued to decline through the 1960s, but stocks of siscowet lake trout

increased off shore in the United States and Canada. Siscowet stocks are nownearly fully recovered. The only lean lake stocks that survived were at Gull IslandShoal and Cat Island in Wisconsin; Thunder Bay, Superior Shoal, and Slate Islandin Ontario; and Stannard Rock, Isle Royale, and Munising in Michigan.
Table 2. Lake Superior morphometry and hydrology (Lawrie and Rahrer 1973).
Length:
Depth:maximummean
Shoreline:United StatesCanadaTotal
Surface area:United StatesCanadaTotal
Volume:
Drainage area:United StatesCanadaTotal
Tributaries:United StatesCanadaTotal
Mean annual discharge: 2,124.7 m’/s 75,051 cfs
Retention time: 82 yr
668.3 km
305.5 km
406.3 m148.3 m
1463.0 km1,475.7 km2.938.7 km
53,613.0 km2
28,800.8 km2
82.413.8 km’
12,233.3 km3
43,770.8 km*101,786.6 km2
145,557.4 km2
350 mi
160 mi
1,333 ft487 ft
909 mi917 mi
1,826 mi
20,700 m?11,120 m?31,820 m?
2.927 mi3
16,900 m?39,300 m?56,200 mi2
840685
1.525

During and after the 1970s, lake trout restoration was slow because of reducedstocking and ineffective control of fishing. Recruitment of stocked fish declined inWisconsin where stocking was reduced in the late 1960s and in Michigan wherestocking was reduced in 1971. In contrast, recruitment of planted fish increased inMinnesota where intense stocking continued in the late 1960s and 1970s.Recruitment of stocked fish stabilized at a low level in Ontario (where stocking rateswere lower). Lake trout formerly stocked in Michigan and eastern Wisconsin werestocked in Minnesota and western Wisconsin because fishery managers thought thatstocked fish would be better protected from fishing-with a better chance to matureand reproduce. However, fishing in the United States increased steadily in the1960s and 1970s, and commercial catches in Ontario generally exceeded quotasimposed for the first time in 1961. During the 1970s, stocked fish werereproductively less efficient than native fish in Wisconsin (Krueger et al. 1986). Thisreproductive inefficiency probably resulted from holding juvenile fish in hatcheriesat a time when they normally imprinted to their natal spawning shoal.
In 1970, inshore stocks of lake trout in most areas of the lake were stillsupplemented by stocking. Natural reproduction, though increasing slowly in manyareas and rapidly in a few, was still inadequate to maintain stocks or sustain asubstantial yield. Fishery agencies recognized that lake trout restoration was moredifficult and time consuming than originally anticipated and would require continuedstocking, increased regulation of exploitation, increased control of sea lampreys,development of new sea lampreycontrol methods, and additional knowledge.
Progress toward fishery objectives was substantial in 1989 (Hansen 1990) butremained far below target levels. Herring stocks rebounded in many areas of thelake but remained below historic levels of abundance. The annual yield of laketrout approached half the target level but was still largely supported by stocking inmany areas. Yield of other predators approached 15% of total predator yield, butlake trout growth declined in Michigan. Stocks of lake whitefish supported greatercommercial yields than at any previous time. However, stocks of walleye, lakesturgeon, and brook trout remained depressed from overfishing, habitat degradation,and competition with introduced species. Parasitic-phase sea lampreys remained atapproximately 10% of precontrol populations but still accounted for a substantialportion of total lake trout mortality-particularly in United States waters west of theKeweenaw Peninsula. Habitat management and restoration were focused on Areasof Concern that had been identified as sites for Remedial Action Plans.

LAKETROUT
Michael J. HansenNational Biological Survey
Great Lakes Center1451 Green Road
Ann Arbor, MI 48105
Mark P. EbenerChippewa-Ottawa Treaty Fishery Management Authority
186 East Three Mile RoadSault Ste. Marie, MI 49783
J. Dale ShivelyGreat Lakes Indian Fish and Wildlife Commission
P. O. Box 9Odanah, WI 54861
and
Bruce L. SwansonWisconsin Department of Natural Resources
Lake Superior Office141 South 3rd StreetBayfield, WI 54814
Introduction
The fishery objective for lake trout in Lake Superior is to achieve a sustainedannual yield of 1.8 million kg from naturally reproducing stocks (Busiahn 1990).The average annual reported yield of lake trout to humans in 1990, 1991, and 1992was 32.9% of the goal (25.2% in Canada and 32.4% in the United States), butplanted fish made a large contribution to the yield in some areas. Sea lampreypredation accounted for approximately 14.7% of the goal in the United States andan unknown portion of the goal in Canada.. Yield to humans could therefore beincreased if sea lampreys could be reduced below current levels.
Stock ing
The lake trout restoration plan for Lake Superior adopted by the Lake SuperiorCommittee in March 1986 set forth a stocking policy to rebuild and maintain laketrout stocks (Lake Superior Technical Committee 1986). The lake was divided into

subareas for planning, setting priorities, and reporting (Fig. 1). Subareas in theUnited States were modified from statistical reporting districts (Smith et al. 1961)and those in Canada were taken from the Ontario quota-management plan. Theplan recommended that yearling lake trout derived from wild parents native to thestocking areas should be planted at a size of 40-55 kg and at a density of232-347/km2 of lake trout habitat.
Fig. 1. Lake Superior fishery-management areas.
Lake trout planting in Lake Superior began shortly after native stocks collapsed.Lake trout have been planted almost continuously in Michigan and Wisconsin since1952, in Ontario since 1958, and in Minnesota since 1962 (Lawrie and Rahrer 1973;Great Lakes Fishery Commission 1985; Ebener 1989) (Fig. 2). By 1970, more than27 million lake trout had been planted in Lake Superior-52% in Michigan, 22%in Ontario, 19% in Wisconsin, and 7% in Minnesota. An additional 1.6 millionfingerlings were planted in the United States. Lake trout planting between 1970 and1983 ranged from less than two million in 1973 to three million in 1982 (an averageof 2.5 million). Changes in United States planting rates from 1970 to 1983 weremade to better protect stocked fish from exploitation so they could mature andreproduce. Planting rates in Michigan were reduced 50% in 1971. In Wisconsin,planting was shifted during the 1970s from an area of the Apostle Islands with lowsurvival and high reproductive potential to an area in the west with high survival andlow reproductive potential. Plantings between 1984 and 1992 averaged 3.3 million-ranging from a low of 2.6 million in 1989 to a high of 3.9 million in 1985. InOntario, construction at Tarentorous Hatchery resulted in low plantings during 1989.
14

In the United States, an outbreak of epizootic epitheliotropic disease (Hnath 1993)in state and federal hatcheries resulted in low plantings during 1990. More than 90million lake trout have been planted through 1992--39% in Michigan, 34% inOntario, 16% in Wisconsin, and 11% in Minnesota.
Fig. 2. Lake trout planted in Lake Superior, 1950-92.
Planting priorities for lake trout were based on the quantity of quality spawninghabitat, historic production, total annual mortality rate, and level of naturalreproduction. Planting quotas were reduced for some management areas inMichigan and Wisconsin because survival of stocked lake trout declined, andplanting priorities were revised because of exploitation changes. Planting quotaswere not met in western Minnesota (MN-l), eastern Wisconsin (WI-2), or Michigan(MI-2 to MI-6) in 1990. Planting quotas were also not met in Keweenaw Bay(MI-4) in 1991 but were equaled or exceeded in other areas in 1990, 1991, and 1992(Fig. 3).
1 5
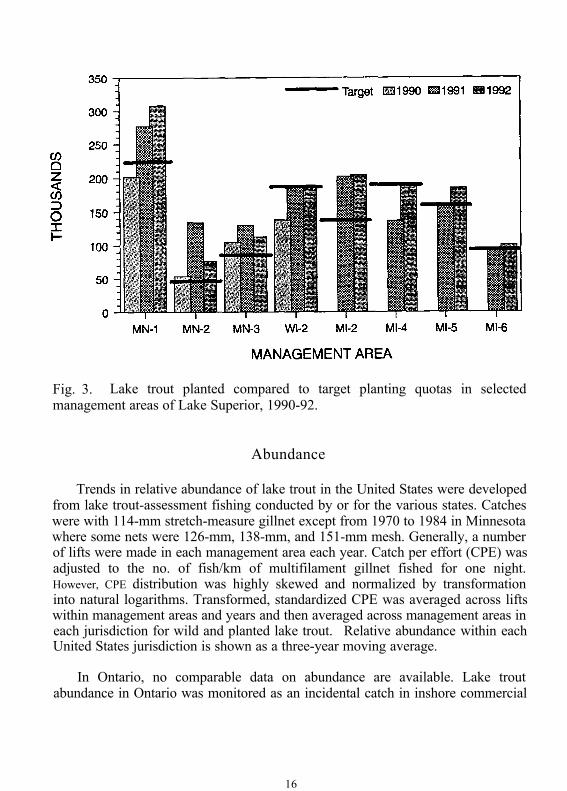
Fig. 3. Lake trout planted compared to target planting quotas in selectedmanagement areas of Lake Superior, 1990-92.
Abundance
Trends in relative abundance of lake trout in the United States were developedfrom lake trout-assessment fishing conducted by or for the various states. Catcheswere with 114-mm stretch-measure gillnet except from 1970 to 1984 in Minnesotawhere some nets were 126-mm, 138-mm, and 151-mm mesh. Generally, a numberof lifts were made in each management area each year. Catch per effort (CPE) wasadjusted to the no. of fish/km of multifilament gillnet fished for one night.However, CPE distribution was highly skewed and normalized by transformationinto natural logarithms. Transformed, standardized CPE was averaged across liftswithin management areas and years and then averaged across management areas ineach jurisdiction for wild and planted lake trout. Relative abundance within eachUnited States jurisdiction is shown as a three-year moving average.
In Ontario, no comparable data on abundance are available. Lake troutabundance in Ontario was monitored as an incidental catch in inshore commercial
16

lake whitefish fisheries and in offshore targeted lake trout fisheries. However,substantial misreporting of lake trout catches occurred in these fisheries so trendsin abundance are not reliable.
In Michigan (MI-3 to MI-7), abundance of wild lake trout generally increasedbetween 1970 and 1992. However, abundance of planted lake trout generallydecreased (Fig. 4). Wild lake trout abundance increased rapidly during the 1970sas strong year-classes of wild fish were recruited. Abundance was relatively stableduring the 1980s as recruitment of wild fish declined, but abundance has decreasedsince 1990 as adult mortality increased. Abundance of planted lake trout wasgreatest in 1970 but then declined. The reduced recruitment of wild fish andabundance of planted fish resulted in reduced total abundance of lake trout after1980. Abundance of wild lake trout in Michigan (MI-3 to MI-7) now greatlyexceeds stocked-fish abundance. Planted lake trout abundance in extreme easternMichigan (MI-8) was low during the last half of the 1970s. Wild lake trout remainscarce because restoration of lake trout was deferred because of the presence of alarge gillnet fishery for lake whitefish. Lake trout abundance in western Michigan(MI-2) has not been extensively monitored, but generally follows the same patternas seen in management areas MI-3 to MI-7.
In eastern Wisconsin (WI-2), abundance of planted lake trout declined graduallyduring the early 1970s, remained relatively stable during the late 1970s and early1980s, and declined again during the late 1980s and early 1990s (Fig. 4). Abundanceof wild lake trout varied without trend between 1970 and 1985, and has remainedstable since 1986. Wild lake trout now outnumber planted lake trout in easternWisconsin although not to the same extent as in Michigan. Eggs have been stockedon offshore reefs since 1980 because planted lake trout in these areas failed toreestablish self-reproducing populations on the numerous offshore spawning reefstypical of the area. Lake trout have been planted primarily to maintain predationpressure on rainbow smelt and to absorb sea lamprey predation and fishing effort.

Fig. 4. Spring abundance of wild and planted lake trout (no. of fish/km of 114-mmstretch-measure gillnet) in United States waters of Lake Superior, 1970-92.

In Minnesota, abundance of both wild and planted fish generally increasedbetween 1970 and 1992 (Fig. 4). Abundance of wild lake trout increased most after1980. Abundance of planted fish has been relatively consistent since 1980. Currentabundance of wild fish is still less than in Michigan or Wisconsin, but abundance ofplanted fish is much higher. Abundance is highest in western Minnesota (MN-l),intermediate in eastern Minnesota (MN-3), and lowest in central Minnesota (MN-2).
Lake trout were not planted around Isle Royale (MI-l), but stocks thererecovered rapidly following implementation of sea lamprey-control programs.Abundance of juvenile wild lake trout (as indexed in periodic small-mesh gillnets)increased steadily between 1958 and 1992 (Fig. 5). Low abundance of recruits in1968 resulted from extremely low abundance of spawners in the early 1960s causedby sea lamprey predation. Reproduction during the 1960s precipitated the recoverythat began during the 1970s and continued through 1992.
Fig. 5. Lake trout abundance (no. of fish/km of small graded-mesh gillnet) off IsleRoyale, Lake Superior, 1958-92.
Offshore stocks of siscowets also recovered rapidly after the onset of sealamprey-control programs. Siscowets are a race of lake trout that inhabits deepwater (76-213 m) with a 20%-80% fat content. Siscowet abundance increased inmost areas of Lake Superior and have become more important in commercialcatches. Summer catches in graded-mesh gillnets indicate that siscowets were
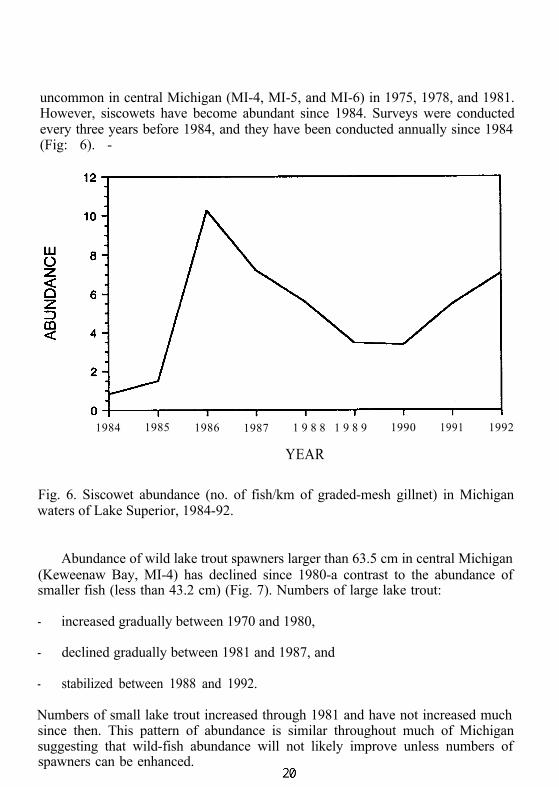
uncommon in central Michigan (MI-4, MI-5, and MI-6) in 1975, 1978, and 1981.However, siscowets have become abundant since 1984. Surveys were conductedevery three years before 1984, and they have been conducted annually since 1984(Fig: 6). -
1984 1985 1986 1987 1 9 8 8 1 9 8 9 1990 1991 1992
YEAR
Fig. 6. Siscowet abundance (no. of fish/km of graded-mesh gillnet) in Michiganwaters of Lake Superior, 1984-92.
Abundance of wild lake trout spawners larger than 63.5 cm in central Michigan(Keweenaw Bay, MI-4) has declined since 1980-a contrast to the abundance ofsmaller fish (less than 43.2 cm) (Fig. 7). Numbers of large lake trout:
- increased gradually between 1970 and 1980,
- declined gradually between 1981 and 1987, and
- stabilized between 1988 and 1992.
Numbers of small lake trout increased through 1981 and have not increased muchsince then. This pattern of abundance is similar throughout much of Michigansuggesting that wild-fish abundance will not likely improve unless numbers ofspawners can be enhanced.

1970 1972 1974 1976 1978 1980 1982 1984 1986 1988 1990 1992
YEAR
Fig. 7. Spring abundance of small and large lake trout (no. of fish/km of 114-mmstretch-measure gillnet) in Keweenaw Bay, Lake Superior, 1970-92.
Mortality
Mortality is calculated by fitting a regression line to the descending limb of acatch curve for age-7-11 lake trout caught in 114-mm gillnet. The target mortalityrate is 45% when computed by this method. However, true mortality is over-estimated because of gillnet-mesh selectivity. In recent years, age-8-12 lake troutwere used to calculate mortality because age-7 fish were not fully recruited.Mortality rates were not corrected for trends in recruitment. Mortality of wild fishcomputed in this way is biased upward partly because of increasing recruitment. Incontrast, abundance of stocked lake trout was not corrected for declining stockingrates or survival-resulting in deflated estimates of true mortality. Therefore, actualmortality of both wild and stocked lake trout is closer to the target rate thanindicated. Mortality of wild fish is lower, and mortality of stocked fish is higher.Mortality within each jurisdiction is displayed as a three-year moving average.
21

Mortality rates of wild lake trout in Ontario have only been available since 1985for management areas near Thunder Bay (ON-l), Black Bay (ON-7), Wawa(ON-28), and Sandy Island (ON-33). These mortality rates exceeded the target ratewith the exception of Black Bay. Mortality in Black Bay was lower than the targetrate in four of five years between 1987 and 1991 (Fig. 8). Lake trout catch in theseareas is restricted because of use of bycatch quotas for the lake whitefish fisheries.
Fig. 8. Total annual mortality of lake trout in selected Ontario management areasof Lake Superior, 1985-91.
In Michigan, mortality of wild lake trout often exceeded the target rate between1970 and 1992. However, mortality of stocked fish in recent years has generallybeen lower (Fig. 9). Average mortality of wild lake trout exceeded the target rateevery year between 1970 and 1992. Average mortality of stocked lake trout declinedduring the 1970s. During the 1980s and early 1990s, average mortality of stockedlake trout remained close to the target rate.

Fig. 9. Total annual mortality of lake trout in United States waters of Lake

In eastern Wisconsin (WI-2), mortality of both wild and planted fish exceededthe target rate between 1970 and 1986. However, wild fish have been below thetarget rate since 1988, and planted fish have been below the target rate since 1990(Fig. 9). The recent decline in mortality reflects a change from using scales insteadof otoliths for determining age. Mortality rates are lower, more accurate, and morereliable when based on otolith-aged fish than when based on scale-aged fish.Mortality in western Wisconsin (WI-l) since 1987 was generally higher for wild laketrout than for planted lake trout.
In Minnesota, mortality rates are available only for planted lake trout.Mortality was relatively near the target rate from 1974 to 1983, above the target ratefrom 1984 to 1990, and below the target rate since 1991 (Fig. 9). There has beenan overall decline in mortality since 1988.
Growth
Lake trout growth can be expressed in a variety of ways, most of which requireeither aging or back-calculation. Growth is expressed as the mean length of age-7lake trout caught in 114-mm stretch-measure-gillnet. In the United States, fish werefrom assessment fisheries; in Ontario, fish were from commercial fisheries. Thisdefinition of growth is the only measure available across nearly all areas and yearsthat incorporates a substantial growth history. However, in areas where fisherieshave increased, length-at-age may be suppressed by selective harvest of faster-growing individuals. Growth within each United States jurisdiction is displayed asa three-year moving average.
In Ontario, growth rates between 1981 and 1986 were slower than in the UnitedStates-age-7 lake trout were considerably smaller than those in Michigan,Wisconsin, or Minnesota (Figs. 10, 11). However, growth rates in Ontario increasedsharply in 1987 and 1988 but then fell again between 1989 and 1991. Lake troutgrowth was generally lower near Wawa than Thunder Bay, Black Bay, or near SandyIsland.
24

Fig. 10. Length of age-7 lake trout in selected Ontario management areas of LakeSuperior, 1981-91.
During the early 1970s, lake trout in Michigan were generally larger at age 7than lake trout in Minnesota and Wisconsin. By 1992, however, lake trout in allthree states were similar in length. In Michigan, mean length of age-7 lake troutdeclined during the 1980s for both wild and stocked fish (Fig. 11). Wild lake troutgrowth declined between 1970 and 1975, increased between 1976 and 1980, declinedagain between 1980 and 1989, and has remained stable since 1990. For hatcherytrout, growth declined gradually from 1970 to 1992 - except for an increase between1977 and 1979. In Wisconsin, average length of age-7 lake trout declined moregradually than in Michigan (Fig. 11). Growth of wild lake trout was generally betterthan growth of stocked fish between 1970 and 1988. However, growth of wild laketrout fell below growth of stocked fish between 1989 and 1992. In Minnesota, age-7fish were generally smaller than fish in Michigan and Wisconsin (Fig. 11). Growthincreased gradually between 1970 and 1983, decreased between 1984 and 1986, andgradually increased between 1987 and 1992.

Y E A R
Fig. 11. Length of age-7 lake trout in United States waters of Lake Superior,1970-92.

Wounding
The incidence of sea lamprey wounds on lake trout in Lake Superior is derivedfrom observed numbers of Type A, Stage I, II, and III sea lamprey marks (King andEdsall 1979) on every 100 lake trout caught during April and May. Thestandardized sea lamprey wounding rate (no. of wounds/100 fish) was initiated in1986 by all fishery-management agencies with jurisdiction on Lake Superior. In theUnited States, the sea lamprey wounding rate is determined from annual assessmentfisheries conducted by each management agency. In Ontario, sea lamprey woundingrate is determined from catches of lake trout in commercial fisheries. Average sealamprey wounding of lake trout larger than 43 cm in the United States and Canadawas derived as the quotient of the sum of sea lamprey wounds in all managementareas divided by the sum of the number of lake trout sampled in all managementareas.
Sea lamprey wounding of lake trout is usually greater in the United States thanin Canada. In the United States, average annual sea lamprey wounding between1986 and 1992 was 5-9 wounds/100 fish. In Canada, the rate was l-6 wounds/100fish for the same period. Wounding of lake trout has slowly increased since 1986in both the United States and Canada. In the United States, sea lamprey woundingof lake trout larger than 43 cm peaked in 1989, declined slightly in 1990 and 1991,and increased again in 1992 (Fig. 12). In Canada, sea lamprey wounding of laketrout larger than 63 cm has increased significantly since 1990. On fish larger than73 cm, sea lamprey wounding has increased significantly since 1989. Wounding oflake trout 43-53 cm long was about the same in 1992 as in 1986.
In the United States, average annual sea lamprey wounding of lake troutbetween 1986 and 1992 was consistently greater in western Minnesota (MN-l) andWisconsin (WI-l) than elsewhere. Wounding of lake trout decreased in the areafrom eastern Wisconsin (WI-2) to central Michigan (MI-2, MI-3, and MI-4).Wounding increased from central Michigan (MI-2, MI-3, and MI-4) to easternMichigan (MI-6 and MI-7). In Canada, wounding of lake trout was higher in thewest (ON-l, ON-2, and ON-4) than in the east. The average and range of annualsea lamprey wounds on lake trout were consistently similar between adjacentmanagement areas (Fig. 13).

Fig. 12. Average number of sea lamprey wounds on a variety of sizes of lake trout(no. of wounds/100 fish) in Canadian and United States waters of Lake Superior,1986-92.

Fig. 13. Average number of sea lamprey wounds on lake trout (no. of wounds/100fish) in Canadian and United States waters of Lake Superior, 1986-92.

We used a statistical relationship between sea lamprey wounding and theprobability of surviving a sea lamprey attack (P) and a model of lake troutinteractions with sea lampreys to estimate the number of lake trout killed by sealamprey attacks each year in selected areas of Lake Superior. The P-values derivedfrom laboratory studies of lake trout deaths as a result of single attacks were 0.35for lake trout 43-53 cm long, 0.45 for lake trout 53-63 cm long, and 0.55 for laketrout 63 cm and longer (Swink and Hanson 1986). However, the probability ofsurviving sea lamprey attacks could be as low as 14% (J. Koonce, Case WesternReserve University, 2080 Adelbert Rd., Cleveland, OH 44106-7080, pers. commun.),which would result in higher estimates of lake trout deaths. In Minnesota, laketrout deaths from sea lamprey attacks were higher in the 1980s than the 1970s.Since 1981, the average death rate is estimated at 50,000 fish/yr (Fig. 14). Annuallake trout deaths from sea lamprey predation between 1980 and 1991 averagedapproximately 10,000 in Michigan (MI-3, MI-5, and MI-6) and 30,000 in easternWisconsin (WI-2).
Fig. 14. Estimated number of lake trout killed by sea lampreys in selected areas ofUnited States waters of Lake Superior, 1970-90.

Fishery and Lamprey-Induced Mortality
The fishery objective for lake trout in Lake Superior is to achieve a sustainedannual yield (human extraction) of 1.8 million kg from naturally reproducing stocks.This objective was based on the historic average annual harvest from 1929 to 1943,which included all lake trout races. In the United States, the historic yield of laketrout was approximately 1.3 million kg. In Ontario, the historic yield of lake troutwas approximately 0.6 million kg.
To measure the progress of lake trout restoration, lake trout yield wassummarized in each jurisdiction for three years-1990, 1991, and 1992. The totalaverage reported yield of lake trout (1990-92) was 596,144 kg-32.9% of the historicaverage. In Ontario, the average annual yield (1990-92) was 160,107 kg-25.2% ofthe historic average annual yield. In the United States, the average annual yield(1990-92) was 436,037 kg-32.4% of the historic average yield. The historicalaverage, however, was based entirely on naturally produced fish (Fig. 15).
Fig. 15. Lake trout yield (dressed weight) for 1991, 1992, and 1993 compared to thehistoric yield (1929-43) in Canadian and United States waters of Lake Superior.

Based on mark-recapture surveys and regression relationships, the averagenumber of parasitic-phase sea lampreys in the United States (199092) was 29,010(Schleen et al. 1991; Klar and Schleen 1992). Based on an analysis of sealamprey-induced mortality on lake trout in eastern Wisconsin, the estimated averageweight of lake trout killed each year by each sea lamprey was 6.75 kg. Therefore,the average annual biomass of lake trout killed by sea lampreys in the United States(1990-92) was 197,383 kg-14.7% of the historic average annual yield. Thecombined annual lake trout take by sea lampreys and humans in the United States(1990-92) was 633,420 kg - 47.1% of the historic annual yield. Therefore, sealampreys accounted for 31.2% of the total annual yield of lake trout from theUnited States (1990-92) (Fig. 16).
The majority of sea lampreys (74.8%) in the United States (1990-92) wereestimated to occur west of the Keweenaw Peninsula. Average take of lake trout bysea lampreys was 147,571 kg - 41.6% of all lake trout yield (Fig. 17). In comparison,east of the Keweenaw Peninsula (1990-92) sea lampreys took only 49,812 kg-17.9%of the combined sea lamprey and human take.
Fig. 16. Lake trout yield by sea lampreys and humans (1990-92) compared to thehistoric yield (1929-43) in United States waters of Lake Superior.

Fig. 17. Lake trout yield by sea lampreys and humans (1990-92) compared to thehistoric yield (1929-43) in United States waters east and west of the KeweenawPeninsula of Lake Superior.

Recommendations
The following list of recommendations has been established:
1) The fish-community objective for lake trout in Lake Superior should be revisedto reflect independent targets for lean and siscowet lake trout.
2) Sea lamprey control should be enhanced in the United States west of theKeweenaw Peninsula and in the extreme east (MI-6 and MI-7) where losses dueto sea lampreys rival yield to humans.
3) All sources of fishing mortality should be examined in areas where totalallowable catches and annual mortality rates are excessive, and the adequacy offishery regulations should be evaluated.
4) Estimates of the probability of surviving a sea lamprey attack should be refinedbecause they are an essential component of the integrated management of sealamprey program.
5) Causes of declining survival of stocked lake trout in Michigan and Wisconsin(such as predation, competition, habitat changes, and contaminants) should beidentified, and if possible, mitigated to ensure that hatchery-reared fish can beused for stock restoration in these areas when necessary.
6) Sport- and commercial-fishing regulations should be made more stringent in thecentral United States (WI-2, MI-2, MI-3, MI-4, and MI-5) and in Whitefish Bayin Canada where fishing mortality is greatest.

OTHER SALMONINES
James W. PeckMichigan Department of Natural Resources
Marquette Fisheries Station484 Cherry Creek RoadMarquette, MI 49855
Wayne R. MacCallumOntario Ministry of Natural Resources
Lake Superior Management Unit435 James Street South
Thunder Bay, Ontario, CANADA P7C 5G6
Stephen T. SchramWisconsin Department of Natural Resources
Lake Superior Office141 South 3rd StreetBayfield, WI 54814
Donald R. SchreinerMinnesota Department of Natural Resources
Lake Superior Area Fisheries Program5351 North Shore Drive
Duluth, MN 55804
and
J. Dale ShivelyGreat Lakes Indian Fish and Wildlife Commission
P. 0. Box 9Odanah, WI 54861
Introduction
The fishery objective for other salmonines in Lake Superior is to sustain anunspecified yield while maintaining a predator-prey balance that allows normalgrowth of lake trout (Busiahn 1990). Between 1988 and 1990, the total annual yield(harvest) of all salmonines was composed of 90% lake trout (including siscowets)and 10% other salmonines. Wisconsin and Minnesota specified harvest goals forother salmonines from Lake Superior and its tributaries in management plans(Wisconsin Department of Natural Resources 1988; Minnesota Department of

Natural Resources, 5351 North Shore Drive, Duluth, MN 55804, unpubl. data).Salmonine predators in Lake Superior other than lake trout are all non-nativespecies (except for brook trout) and are all anadromous (except for splake).
Most species of other salmonines are routinely planted into Lake Superior;however, except for splake and Atlantic salmon, most species maintain theirpopulations through natural reproduction (Peck 1992). Agencies conductassessments of the relative abundance of other salmonines, but do not generallydetermine total abundance. Lakewide marking of chinook salmon planted between1988 and 1990 and coho salmon planted between 1992 and 1994 should provide abasis for determining the abundance of these species.
Creel surveys have been used to estimate angler harvest and to provide an indexof abundance of other salmonines in Lake Superior, Creel surveys on LakeSuperior have been conducted annually in Minnesota and Wisconsin since 1969, inMichigan since 1984, and in Ontario since 1986. Surveys were lakewide inMinnesota and Wisconsin but in Michigan were restricted to Marquette from 1984to 1986. Surveys included all areas west of Munising since 1987. Surveys in Ontariowere restricted to Sault Ste. Marie and Michipicoten Bay at Wawa. However, datawere also obtained from derbies at Thunder Bay, Wawa, and Rossport, InMinnesota, creel surveys were conducted on tributaries in spring (1980-90) and fall(1986, 1987, 1989, and 1991).
Michigan, Minnesota, Wisconsin, and Ontario prohibit the sale of othersalmonines by commercial fisheries, but pink salmon can be taken in Ontario.Nonetheless, incidental catch and mortality occurs in all of these fisheries. Theseincidentally caught fish must be returned to the water dead or alive. The incidentalcatch and mortality of other salmonines by Michigan-licensed fisheries are presentedfor each species. Tribal commercial fisheries in Minnesota and Wisconsin harvestother salmonines incidentally but prohibit sale to nontribal members. The tribalfishery in Michigan allows for the targeting and commercial sale of chinook andcoho salmon but not of brook trout, brown trout, and rainbow trout.
Annual spawning runs of adult salmonines were estimated at weirs on the BruleRiver, Wisconsin (since 1986), and on the French River, Minnesota (since 1974).Juvenile populations were estimated in Michigan streams since 1967 and Wisconsinstreams from 1977 to 1983. Studies are under way in Michigan to determine ifjuvenile production is related to adult abundance, especially for coho salmon.Ontario has conducted aerial counts of dead salmon in the Michipicoten River since1987 as a means of assessing spawning runs.

Rainbow (Steelhead) Trout
Anadromous rainbow trout (also called steelhead) became widely distributedafter being introduced into Lake Superior in 1895 (MacCrimmon 1971), and arenow naturalized in most Lake Superior tributaries (Moore and Braem 1965;Hassinger et al. 1974; Biette et al. 1981). Original rainbow trout introductions wereof uncertain origin. Recently, numerous known varieties have been introduced,including:
- Kamloops, Madison, and Donaldson strains in Minnesota in 1972 (Close andHassinger 1981);
- Siletz strain in Michigan in 1984 (Fielder 1987); and
- Skamania strain in Michigan in 1986 (Peck 1992), Minnesota in 1988, andWisconsin in 1991.
Wild steelhead populations exhibited significant genetic differentiation amongpopulations from different drainages and from within the Brule River drainage(Krueger and May 1987a).
Between 1989 and 1991, the range of plants of yearling steelhead was 104,000to 135,000 in Michigan, 166,000 to 247,000 in Minnesota, and 51,000 to 107,000 inWisconsin. In Ontario, the average was 42,000. Most steelhead yearlings plantedin Michigan have been Lake Michigan strain-the rest have been domestic rainbowand Skamania summer-steelhead strains. Yearling steelhead planted in Minnesotawere mostly Kamloops strain, but some were Knife River (Lake Superior) strain.Wisconsin has planted only wild Brule River-steelhead strain. Fingerlings were notroutinely stocked by any agency, but 0.8-3.7 million steelhead fry were stockedannually by Minnesota during the 1980s and early 1990s. Age-2 steelhead wereplanted in Minnesota in 1989 (943) and in Wisconsin in 1990 (51,000).
Fewer than 2% of steelhead planted in Michigan have been caught by the sportfishery. A similar number contributed to spawning runs (Hansen and Stauffer 1971;Wagner and Stauffer 1978a; Peck 1992). An exception has been the ChocolayRiver, where Lake Michigan-strain steelhead planted between 1983 and 1985contributed the most adult steelhead to the 1986-89 spawning runs. There has beenno evidence of natural reproduction by Kamloops - strain rainbow trout in Minnesota,but they have been found in spawning runs in streams throughout Lake Superior.In Michigan, planted steelhead averaged 15% of the Lake Superior sport catch and24%-43% in two tributaries near Marquette in the 1980s (Peck 1992). Thesteelhead sport catch in Wisconsin in recent years has been from naturally produced

fish. In Minnesota, some of the steelhead catch may be from fry plants inMinnesota streams. Kamloops strain contributed 91% of the 1990 rainbow troutharvest in Minnesota.
1984 1985 1986 1987 1988 1989 1990 1991
YEAR
Fig. 18. Sport-fishery harvest of rainbow trout in Michigan, Wisconsin, andMinnesota waters of Lake Superior, 1984-91.
Wisconsin and Michigan have recommended annual harvest goals for rainbow(steelhead) trout of 13,000 and 15,000 fish, respectively. Numbers of steelheadharvested in Lake Superior from 1984 to 1991 averaged 705 in Michigan, 432 inWisconsin, and 1,312 in Minnesota (Fig. 18). The low harvest in Wisconsin in 1990and 1991 was because of a restriction in regulations. The high harvest of Kamloopsstrain in Minnesota in 1990 was because of the addition of a winter creel survey.The average annual incidental catch and kill of steelhead in the Michigancommercial fishery from 1983 to 1989 was 11 fish and 6 fish, respectively. The totalharvest of Lake Superior steelhead is not known because most fish are caught intributary sport fisheries, few of which have been surveyed. The average harvest intribal commercial and home-use fisheries in Wisconsin was 4 fish between 1988 and1992. In eastern Michigan, the harvest was 73 fish between 1989 and 1991. Theaverage catch of steelhead in two tributaries at Marquette, Michigan, between 1984and 1987 (790 fish) (Peck 1992) equaled or exceeded the 1984-91 mean lakewidecatch in Michigan (705 fish). The mean catch in the Brule River, Wisconsin,

between 1987 and 1991 (7,180 fish) contributed approximately 65% of all wildsteelhead in Wisconsin. The spring catch in Minnesota tributaries contributedapproximately 66% of the total harvest.
Anglers and biologists have been concerned about an apparent decrease in LakeSuperior-steelhead numbers in recent years but survey results have beencontradictory. Harvest in Wisconsin (Fig. 18) and runs of steelhead in the BruleRiver (Fig. 19) did not decrease during the 1980s. However, spawning runs in theBrule River during the 1980s were less than the estimated sport harvest in the BruleRiver in 1978 and 1979 (Scholl et al. 1984). Rainbow trout harvest in Minnesotaincreased between 1984 and 1991 (Fig. 18), but most of this increase was becauseof the increased catch of Kamloops rainbow trout. Steelhead runs in the FrenchRiver, Minnesota, increased slightly between 1981 and 1991 (Fig. 20) - possiblybecause of increased fry plants. The steelhead harvest in Michigan did not decrease(Fig. 18).
Fig. 19. Numbers of trout and salmon in spawning runs in the Brule River,Wisconsin. 1986-91.

In the Big Huron River, Michigan, the average angling catch rates in 1973 and1988-89 were similar. However, a 60% reduction in fishing effort from 1973 to1988-89 may indicate a decline in the steelhead stock. Abundance of age-0 rainbowtrout in Chinks Creek (a Big Huron River tributary) was higher between 1982 and1991 than between 1967 and 1974 (Fig. 21). The opposite was true in the LittleGarlic River, 80 km to the east (Fig. 21), where sand in-filling of upstream spawningareas may have reduced juvenile production.
1981 1982 1983 1984 1985 1986 1987 1988 1989 1990 1991
YEAR
Fig. 20. Numbers of trout and salmon in spawning runs in the French River,Minnesota, 1981-91.
To protect steelhead stocks, daily bag limits were reduced in Michigan in 1989,Wisconsin in 1990, and Minnesota in 1991. The daily bag limit of steelhead wasreduced in Michigan from 5 fish to 3 fish for each trout and salmon species. InWisconsin, the limit was reduced from 5 fish of any size to 1 fish at least 711 mmlong. In Minnesota, a management plan was developed to enhance steelheadpopulations along the north shore. It included a daily bag limit that was reducedfrom 5 fish to 3 fish, of which only 1 fish could be a wild (unclipped) steelhead. Theminimum-length limit was 406 mm for planted (clipped) fish and 711 mm for(unclipped) wild fish.

1982 1983 1984 1985 1986 1987 1988 1989 1990 1991 1992
YEAR
Fig. 21. Abundance of age-0 rainbow trout (no./m’) in the Little Garlic River andChinks Creek, Michigan, 1982-92 - expressed as the change from the 1968-74average.
Coho Salmon
Coho salmon were first planted into Lake Superior in 1966 by the state ofMichigan. Coho salmon were planted in Minnesota and Ontario between 1969 and1972 (Hassinger 1974) but are currently planted only in Michigan. Annual releasesof coho salmon were reduced in 1990 from 325,000 to 200,000 yearlings; weredistributed at one site each in MI-2, MI-3, and MI-5; and were progeny of LakeMichigan parents. Coho salmon planted in 1992 were marked by removal of theright ventral fin to give agencies an opportunity to evaluate the contribution ofhatchery fish in the total catch.
Coho salmon planted in Michigan in 1984 and 1985 contributed 80% of thesport catch in a planted tributary but made up less than 10% of the catch in LakeSuperior and nonplanted tributaries (Peck 1992). Some of these fish strayed toWisconsin and Minnesota in Lake Superior, Wisconsin and Michigan in LakeMichigan, and Ohio in Lake Erie. In addition to extensive straying, diseases anddisabilities of hatchery-reared coho salmon have likely reduced their survival in Lake

Superior. Coho salmon of Lake Michigan origin planted in Lake Superior havebeen infected with bacterial kidney disease (BKD). BKD may cause anemia andcataracts and can be transmitted through the water between fish (J. Hnath, MichiganDepartment of Natural Resources, Fish Health Lab, 34270 CR 652, Route 1,Mattawan, MI 49071, pers. commun.). Therefore, BKD threatens naturalpopulations of coho salmon and other salmonines in Lake Superior.
Fig. 22. Abundance of age-0 coho salmon (no./m”) in the Little Garlic River andChinks Creek, Michigan, 1982-92--expressed as the change from the 1968-74average.
Coho salmon reproduce widely in Lake Superior. Initial plants of coho salmonin the 1960s strayed extensively and reproduced successfully in many Lake Superiorstreams (Peck 1970). Coho salmon reproduced successfully in all five streamsstudied by Stauffer (1977); and, by 1968, production rivaled good West Coast cohosalmon streams (Peck 1970). Abundance of juvenile coho salmon varied withouttrend between 1982 and 1992 and was greater than average between 1968 and 1974in the Little Garlic River and Chinks Creek in Michigan (Fig. 22). Coho salmonlikely reproduce in all Lake Superior streams that have suitable spawning substrateand are accessible during the spawning period. Coho salmon spawning runs inWisconsin’s Brule River varied greatly between 1986 and 1990 and were similar tosteelhead spawning runs in some years (Fig. 19). Few coho salmon have been foundduring surveys for juvenile and adult anadromous salmonines in Minnesota streams.
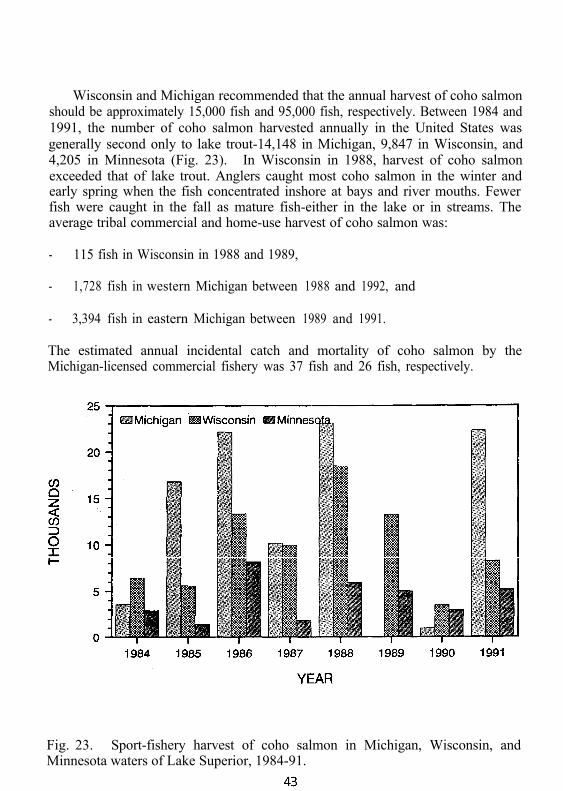
Wisconsin and Michigan recommended that the annual harvest of coho salmonshould be approximately 15,000 fish and 95,000 fish, respectively. Between 1984 and1991, the number of coho salmon harvested annually in the United States wasgenerally second only to lake trout-14,148 in Michigan, 9,847 in Wisconsin, and4,205 in Minnesota (Fig. 23). In Wisconsin in 1988, harvest of coho salmonexceeded that of lake trout. Anglers caught most coho salmon in the winter andearly spring when the fish concentrated inshore at bays and river mouths. Fewerfish were caught in the fall as mature fish-either in the lake or in streams. Theaverage tribal commercial and home-use harvest of coho salmon was:
- 115 fish in Wisconsin in 1988 and 1989,
- 1,728 fish in western Michigan between 1988 and 1992, and
- 3,394 fish in eastern Michigan between 1989 and 1991.
The estimated annual incidental catch and mortality of coho salmon by theMichigan-licensed commercial fishery was 37 fish and 26 fish, respectively.
Fig. 23. Sport-fishery harvest of coho salmon in Michigan, Wisconsin, andMinnesota waters of Lake Superior, 1984-91.

Chinook Salmon
Chinook salmon were first planted into Lake Superior in 1967 by the state ofMichigan. This introduction was extended to Minnesota in 1974, Wisconsin in 1977,and Ontario in 1988. Annual plants of spring fingerlings between 1989 and 1991averaged approximately 350,000 in Michigan, 509,000 in Minnesota, 384,000 inWisconsin, and 300,000 in Ontario. Chinook salmon planted by Michigan andWisconsin were progeny of fall-spawning Lake Michigan parents, those planted byMinnesota were progeny of Lake Superior parents caught at the French River weir,and those planted by Ontario were from Lake Huron parents. Initial plants inMinnesota were from spring-spawning parents (Close et al. 1984); but since 1979,plants have been from fall-spawning parents. Some of the progeny of LakeMichigan chinook salmon planted in Lake Superior were infected with BKD, andthe disease has also been found in naturally reproduced fish. Minnesota hasmonitored the incidence of BKD in chinook salmon returning to the French Riverweir since 1989, and Michigan monitored BKD incidence in spawning-run andsport-caught chinook salmon in 1991 and 1992. Agencies now routinely screenchinook salmon’ brood stock for BKD and eliminate any fish with detectable levelsof the disease.
Chinook salmon harvest ranks from third to fifth among salmonine sport catchesin the United States and second or third after lake trout in Ontario. Wisconsin andMichigan recommended harvest goals of 12,000 fish and 21,000 fish, respectively.The number of chinook harvested annually in Lake Superior between 1984 and 1991averaged 1,413 in Michigan, 2,609 in Wisconsin, and 1,806 in Minnesota (Fig. 24).In Ontario, important sport fisheries for chinook salmon occur in Goulais Bay, theMichipicoten River and Bay (at Wawa), the Nipigon River, and Thunder Bay. In1986, the estimated catch in Michipicoten Bay was 3,316. The number of chinooksalmon caught in the Wawa Salmon Derby peaked in 1986 (499 fish) then decreasedeach year since then (64 fish in 1992). The sport-fishery decline paralleled chinookdead-fish counts in the Michipicoten River which decreased from 10,000 in 1987 toless than 600 in 1992. Sport-fishery harvest of chinook salmon may be greater instreams than in Lake Superior-as was the case between 1984 and 1987 atMarquette, Michigan (Peck 1992). The tribal commercial and home-use harvest ofchinook salmon in Wisconsin averaged 47 fish from 1988 to 1992. In Michigan, theaverage was 796 fish from 1989 to 1992. The estimated annual incidental catch andmortality of chinook salmon in the Michigan-licensed commercial fishery was 15 fishand 6 fish, respectively.

1984 1985 1986 1987 1988 1989 1990 1991
YEAR
Fig. 24. Sport-fishery harvest of chinook salmon in Michigan, Wisconsin, andMinnesota waters of Lake Superior, 1984-91.
Chinook salmon have been observed spawning in numerous streams in theUnited States and in most large rivers in Canada. Peak runs of chinook salmon inthe Brule River, Wisconsin, occurred from late August to early September, andnumbered from 343 fish to 679 fish between 1986 and 1990 (Fig. 19). Chinooksalmon runs in the French River, Minnesota, were highest in the mid-1980s andhave decreased more recently (Fig. 20). Juvenile production has been difficult toquantify since most young chinook salmon leave streams soon after emerging in Mayand June (Carl 1984; Seelbach 1985). Consequently, all planted fish were markedin 1988, 1989, and 1990 to evaluate the relative abundance of marked (planted) andunmarked (wild) chinook salmon in the sport fishery and in spawning runs.Preliminary results indicate that most chinook salmon in Lake Superior areproduced in the wild. Hatchery fish contribute from less than 10% in Canada toapproximately 50% in Wisconsin and Minnesota.

Brown Trout
Brown trout were introduced into Lake Superior during the 1890s andestablished self-sustaining populations across Lake Superior-particularly in streamsof the western United States (Lawrie and Rahrer 1972). In Michigan, brown troutwere found in only 22 of Lake Superior’s 120 tributaries during the early 1960s(Moore and Braem 1965). A number of these were likely resident populations, butanadromous brown trout populations are found in the Ontonagon River (MI-2) andthe Sturgeon River (MI-4) (R. Juetten, Michigan Department of Natural Resources,Baraga, MI 94908, pers. commun.). In contrast, most Wisconsin streams haveanadromous brown trout populations (Moore and Braem 1965). However,abundance has been depressed in Wisconsin during the last 20 years-possiblybecause of furunculosis-induced mortality (Wisconsin Department of NaturalResources 1988). Anadromous brown trout runs in the Brule River, Wisconsin,ranged from 3,290 fish to 5,265 fish between 1986 and 1990 (Fig. 19). Wild browntrout populations in Wisconsin streams exhibit significant genetic differentiationamong stocks from different drainages and between anadromous and resident fishin the Brule and Sioux Rivers (Krueger and May 1987b). In Ontario, small,anadromous brown trout populations occur in the Steel and Michipicoten Rivers.Brown trout have not established anadromous populations in Minnesota.
1984 1985 1986 1987 1988 1989 1990 1991
YEAR
Fig. 25. Sport-fishery harvest of brown trout in Michigan, Wisconsin, and Minnesotawaters of Lake Superior, 1984-91.

Only Michigan and Wisconsin planted brown trout in Lake Superior between1989 and 1991 - averaging 88,000 fish and 145,000 fish (mainly yearlings),respectively. These were all domestic-strain progeny from hatchery brood stock.Wisconsin and Michigan have recommended harvest goals of 6,000 fish and 2,300fish, respectively. From 1984 to 1991, the number of brown trout harvested by thesport fishery averaged 388 in Michigan, 1,970 in Wisconsin, and 22 in Minnesota(Fig. 25). The lakewide brown trout harvest in Ontario is probably small&only 3fish were reported in a creel survey at Michipicoten Bay in 1986. The contributionof hatchery brown trout to the sport harvest was 50% in Wisconsin and 40% inMichigan. The annual incidental catch and mortality of brown trout in theMichigan-licensed commercial fishery was 55 fish and 12 fish, respectively. Theharvest in tribal commercial and home-use fisheries in Wisconsin averaged 174 fishbetween 1988 and 1992. In eastern Michigan, the harvest averaged 24 fish between1989 and 1991.
Splake
Splake is a fertile hybrid resulting from the cross of a female lake trout andmale brook trout. Fish culturists have known about splake since the late 1800s(Lawrie and Rahrer 1972). However, splake have not been used extensively inenhancement programs until recent decades. Splake were first planted in LakeSuperior (Michigan) in 1971, and approximately 60,000 yearlings have been plantedin most years since then. In Wisconsin, splake were planted for the first time in1973-150,000-300,000 were planted annually during the 1980s and approximately120,000 were planted annually in 1990 and 1991. Splake have not been planted inMinnesota and Ontario. The percentage of splake planted and harvested was atleast ten times greater than other salmonines in Michigan (Peck 1992). No naturalreproduction by splake has been found in Lake Superior, but sexually mature splakehave been found in spawning aggregations of lake trout.
The harvest of splake in Lake Superior occurs primarily near the sites wherethey were planted-Marquette (MI-5) and Munising (MI-6) in Michigan and theApostle Islands (WI-2) in Wisconsin. Wisconsin and Michigan have recommendedharvest goals of 10,000 fish and 17,000 fish, respectively. Average annual sportharvest of splake between 1984 and 1991 was 4,678 in Wisconsin and 530 inMichigan (Fig. 26). The sharp decrease in the 1991 splake catch in Wisconsin wasbecause there were no splake planted in 1989, and only fall fingerlings were plantedin 1990. No splake have been harvested in Minnesota or Ontario. Most splake inMichigan are caught in the late fall through early spring. No incidental catch ofsplake has been found in the Michigan-licensed commercial fishery. The harvest intribal commercial and home-use fisheries in Wisconsin averaged 17 fish between1988 and 1992.

1984 1985 1986 1987 1988 1989 1990 1991
YEAR
Fig. 26. Sport-fishery harvest of splake in Michigan and Wisconsin waters of LakeSuperior, 1984-91.
Brook Trout
Anadromous brook trout (coasters) are native to Lake Superior, but becamemuch less abundant and narrowly distributed in recent years because of overfishing,loss of suitable habitat, and competition with other introduced salmonines. Thelargest extant stock of coaster brook trout is in the Nipigon River, Ontario. Smallpopulations occur near the Nipigon in the Cypress, Gravel, and Little Gravel Rivers.In Michigan, brook trout were found in 93 of Lake Superior’s 120 tributaries(Moore and Braem 1965) but most were resident populations. More than 16Michigan tributaries had coaster brook trout populations in the past, but the onlyremaining spawning runs in recent years are in the Salmon Trout River (MI-5) andin Washington Creek and Grace Creek on Isle Royale (MI-l). Coaster brook troutno longer occur naturally in Wisconsin or Minnesota.
Restoration of coaster brook trout in Lake Superior has been attempted inWisconsin where 12,000-80,000 Lake Nipigon brook trout yearlings have beenplanted annually since 1984 to reestablish coaster populations. In Michigan,
4 8
50,000-60,000 domestic brook trout yearlings were planted annually in the 1980s, and16,000 were planted annually between 1989 and 1991. In Minnesota, 50,000 eggsand 30,000 fry of Nipigon brook trout were planted into five tributaries in 1992.Despite these efforts, brook trout have remained scarce in the sport fishery in LakeSuperior, and coaster brook trout populations have not been enhanced orestablished. A Lake Superior brook trout workshop was held in July 1992 to bringtogether agencies and share management concerns and strategies.
The state of Michigan has recommended an annual harvest goal for brook troutof 2,000 fish. Brook trout harvest estimates between 1984 and 1990 ranged from 4to 14 in Michigan, 0 to 291 in Wisconsin, and 0 to 31 in Minnesota. No brook troutwere found in the Michigan-licensed commercial fishery. Ontario harvest data werenot available. Wisconsin tribal commercial and home-use fisheries took only 9 fishin 1991 - other commercial harvests are likely to be quite small because of the lowabundance and limited distribution of brook trout in Lake Superior.
Pink Salmon
Pink salmon of an odd-year spawning population were introduced into LakeSuperior (Canada) in 1956, developed naturally reproducing populations from thissingle introduction, and were distributed throughout the Great Lakes by 1979(Emery 1981). Spawning runs of pink salmon in Lake Superior occurred in at least56 Michigan streams by 1980 (Wagner and Stauffer 1982). Pink salmon generallyspawn at age 2 during September and October. However, in Lake Superior someremain in the lake an extra year and spawn at age 3 resulting in the establishmentof an even-year spawning population (Wagner and Stauffer 1978b).
Pink salmon have never attracted a sport fishery in Lake Superior probablybecause of their small average size (0.5 kg). The annual catch between 1984 and1990 averaged less than 50 in Michigan, 0 in Wisconsin, and less than 50 inMinnesota. The catch in Ontario is unknown, but a dipnet fishery in theMichipicoten River yielded:
- 3,449 pink salmon in 1979,
- 392 pink salmon in 1980,
- 12,671 pink salmon in 1981,
- 1,016 pink salmon in 1982, and
- 3,807 pink salmon in 1983.

By 1987, the run had declined substantially, and no more permits for dipnettingwere issued. Sport harvest from the major spawning streams in Wisconsin andMichigan is largely unknown. The annual catch in three streams at Marquette,Michigan, averaged less than 100 fish between 1984 and 1987 (Peck 1992). Theharvest of pink salmon in Minnesota streams ranged from 106 fish to 734 fishbetween 1986 and 1991. Pink salmon were not caught in the Michigan-licensedcommercial fishery. The commercial fishery in Ontario harvests approximately300-3,000 fish annually (odd-year harvests are greater). Pink salmon harvest intribal commercial and home-use fisheries averaged 6 fish in Minnesota in 1989 and1990. In eastern Michigan, the harvest averaged 52 fish between 1989 and 1991.
Abundance of pink salmon in Lake Superior has been based on their abundancein stream spawning runs. Abundance in the lake is difficult to assess because pinksalmon are not abundant, they occupy various depths in the pelagic zone, and theyleave the stream immediately after emergence (usually in May) (Bagdovitz et al.1986). Abundance in spawning runs in Michigan streams increased between 1967and 1989, then decreased to early-1970 levels or disappeared entirely by 1989(Bagdovitz et al. 1986; Kocik et al. 1991). Similar decreases in spawning runs werereported in Wisconsin and Minnesota streams. Spawning runs in two Ontariostreams in eastern Lake Superior were greater than in Michigan streams butdecreased 50%-75% between 1981 and 1987 (Kelso and Nolte 1990).
Atlantic Salmon
Atlantic salmon have not been planted extensively in Lake Superior. Atlanticsalmon were planted in Wisconsin in 1972, 1973, and 1978; in Michigan in 1976; andin Minnesota since 1980. Releases in Minnesota were from Grand Lake, Maine,parents. In the French River:
- 10,000 yearlings were planted in 1980,
- 31,000 yearlings and 111,000 fingerlings were planted in 1989, and
- 52,000 yearlings and 37,000 fingerlings were planted in 1991.
Atlantic salmon initially returned to Minnesota tributaries in late August andearly September but have not returned until early November in recent years.Return of adults to the French River averaged approximately 8.5 fish/yr (Fig. 20),less than 0.5% of the number planted. These returns provided approximately 25%of the 200,000 eggs needed to sustain the planting program. In Lake Superior, nonatural reproduction by Atlantic salmon has been reported.

Annual harvest of Atlantic salmon in the sport fishery between 1984 and 1991averaged less than 200 in Minnesota. The average was less than 100 in Wisconsin,Michigan, and Ontario. Atlantic salmon were not found in the Michigan-licensedcommercial fishery between 1983 and 1989. The only known catch of Atlanticsalmon in tribal fisheries was incidental to commercial catches in Minnesota. Saleis permitted only to tribal members.
1)
2)
3)
4)
5)
6)
7)
8)
Recommendations
The following list of recommendations has been established:
Fish-community objectives for anadromous salmonines should be revised torecognize that stocking programs and fisheries should not compromise thegenetic integrity, health, abundance, or restoration plan of any naturallyreproducing population of salmonine species--including lake trout.
Harvest of anadromous salmonines from Lake Superior and its tributaries bysport fisheries and by state and tribal commercial fisheries should continue tobe monitored.
Fishing regulations should be adequate to allow survival of sufficient spawningpopulations of salmonines.
Spawning habitat for salmonines in Lake Superior tributaries should beprotected and enhanced.
Hatchery-reared salmonines should not be planted in streams or areas of LakeSuperior where wild populations are at carrying capacity.
Fish that are classified as diseased, as defined in the Great Lakes Fish DiseaseControl Policy and Model Program (Hnath 1993), should not be planted toprevent widespread straying that could infect healthy Great Lakes stocks.
Agencies should strive to minimize the loss of genetic variability of hatcherysalmonines by applying sound fish-culture and stocking practices.
Agencies should mark hatchery-reared trout and salmon to permit evaluationof wild production.

James H. Selgeby and Charles R BronteNational Biological Survey
Lake Superior Biological Station2800 Lake Shore Drive, East
Ashland, WI 54806
and
Jeffrey W. SladeU.S. Fish and Wildlife Service
Ashland Fisheries Resources Office2800 Lake Shore Drive, East
Ashland, WI 54806
Introduction
The fishery objective for forage species in Lake Superior is to restore lakeherring stocks to historic levels of abundance, to provide forage for lake trout andother predators, and to provide fishery harvest (Busiahn 1990). In 1986, interagencycommittees recommended that harvests of lake herring should be held at or belowthe 1974-83 average until stocks were fully recovered and methods for determiningsafe-harvest levels were available (Lake Superior Technical Committee 1986). In1992, interagency committees recommended that spawning-season closures or quotasshould be instituted until stocks recovered.
Lake herring stocks are presently increasing in some areas but have not yetreached historic levels. Diets of larger inshore predators remain dominated byrainbow smelt in spring. However, lake herring consumption is increasing in areasand in seasons where their abundance is increasing (Conner et al. 1993; Gallinat1993). Total biomass of rainbow smelt and lake herring increased substantiallybetween 1982 and 1986 and declined between 1987 and 1989. Total forage biomassin Minnesota and eastern Ontario is dominated by rainbow smelt. Biomass isdominated by lake herring in western Ontario, Wisconsin, and Michigan.

Lake Herring
Lake herring in Lake Superior historically yielded larger commercial harveststhan all other species combined. Catches in the United States peaked at 8.6 millionkg in 1941, declined slowly during the remainder of the 1940s, and declined sharplyto only 100,000 kg between 1981 and 1983. Analysis of commercial fishing recordsfor Wisconsin (Selgeby 1982) and Michigan (Peck et al. 1974) indicated thesedeclines were because of sequential overharvest of discrete stocks. Declines inMinnesota and eastern Ontario were likely the result of similar fishing patterns.
Fig. 27. Harvest of lake herring (round weight) from Lake Superior by variousmanagement authorities, 1971-91.
Lake herring harvest began to increase in the United States as abundanceincreased-the amount of increase varied among jurisdictions (Fig. 27). Fisheriesin Michigan have remained small, while those in Minnesota and Wisconsin haveincreased beyond the targeted 1974-83 average. Michigan fisheries are regulated bylimited entry, depth restrictions, and restrictive quotas. Minnesota fisheries areregulated by a closed spawning season and limited entry. Wisconsin fisheries areregulated by depth limits, mesh restrictions, limited entry, and special-use areas.
54

Tribal regulations are similar to state regulations in Wisconsin. Tribal fisheries inKeweenaw Bay (western Michigan waters) are regulated by quotas and in easternMichigan by a closed spawning season. Fisheries in Wisconsin and Minnesota havegrown as stocks recovered, but market conditions dictate the total catch. If marketconditions become more favorable, new regulations may be needed to protect stocksfrom overharvest in Wisconsin and Minnesota.
In contrast to the declines seen in the United States, major lake herring stocksin western Ontario did not appear to be overharvested until very recently. TheBlack Bay stock sustained relatively stable catches between 1960 and 1981, butcatches (kg/km) dropped by more than 80% between 1981 and 1988 (Fig. 28).Catches in Thunder Bay (kg/km) declined in the 1960s and early 1970s, reboundedto high levels between 1979 and 1981, and then declined sharply in 1983 and 1984.Catches in 1988 and 1989 were dominated (80%) by a single year-class (1984) whichsuggests that reproduction is threatened. Harvest was severely restricted between1989 and 1992 in an attempt to restore the stocks.
1981 1982 1983 1984 1985 1986 1987 1988 1989 1990 1991 1992
YEAR
Fig. 28. Abundance of lake herring in Black Bay and Thunder Bay, Ontario, LakeSuperior, 1981-92.

Strength of lake herring year-classes in the United States has increased greatlysince 1977 (Fig. 29). Year-class strength was indexed beginning in 1978 fromcatches of yearlings in trawls at 40-53 locations along the United States shore.Beginning in 1989, year-class strength was indexed at 24-34 additional locationsalong the Canadian shore. Year-classes were strong in 1978, 1980, and especially1984; moderate in 1983, 1985, and 1986; and weak in 1987. The 1988-90 year-classeswere strong, while the 1991 year-class appears relatively weak. Catches of adults ingillnets at various locations in Lake Superior generally corroborate the year-classstrength estimates made by trawls.
Fig. 29. Relative strength of lake herring and rainbow smelt year-classes in LakeSuperior (1977-91).
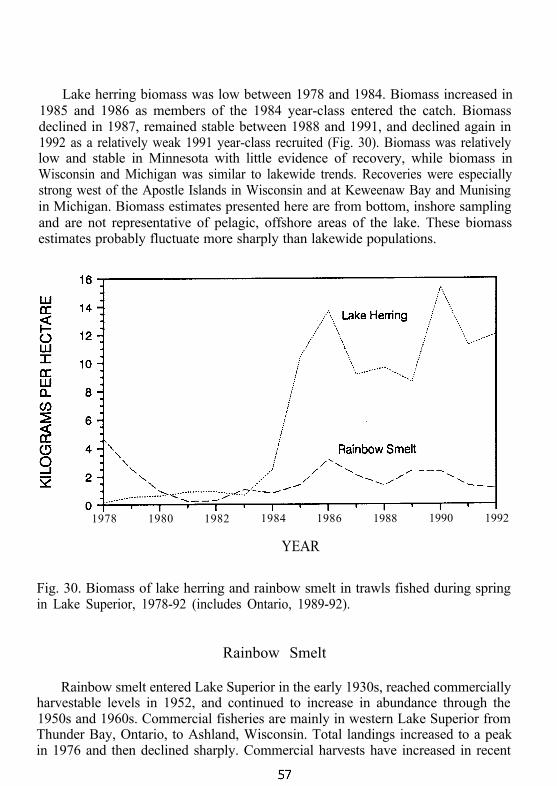
Lake herring biomass was low between 1978 and 1984. Biomass increased in1985 and 1986 as members of the 1984 year-class entered the catch. Biomassdeclined in 1987, remained stable between 1988 and 1991, and declined again in1992 as a relatively weak 1991 year-class recruited (Fig. 30). Biomass was relativelylow and stable in Minnesota with little evidence of recovery, while biomass inWisconsin and Michigan was similar to lakewide trends. Recoveries were especiallystrong west of the Apostle Islands in Wisconsin and at Keweenaw Bay and Munisingin Michigan. Biomass estimates presented here are from bottom, inshore samplingand are not representative of pelagic, offshore areas of the lake. These biomassestimates probably fluctuate more sharply than lakewide populations.
1978 1980 1982 1984 1986 1988 1990 1992
YEAR
Fig. 30. Biomass of lake herring and rainbow smelt in trawls fished during springin Lake Superior, 1978-92 (includes Ontario, 1989-92).
Rainbow Smelt
Rainbow smelt entered Lake Superior in the early 1930s, reached commerciallyharvestable levels in 1952, and continued to increase in abundance through the1950s and 1960s. Commercial fisheries are mainly in western Lake Superior fromThunder Bay, Ontario, to Ashland, Wisconsin. Total landings increased to a peakin 1976 and then declined sharply. Commercial harvests have increased in recent

years but remain far below harvests taken during the early and mid-1970s. Themajor decline in commercial catch during the late 1970s was because of a declinein abundance.
As a result of declining rainbow smelt abundance and increasing mortality,biomass estimated from trawl surveys declined more than 90% between 1978 and1981 (Fig. 30). By 1981, stocks were dominated by age-l and age-2 fish, andspawning stocks that had declined sharply in abundance were almost all age-3 fish.After 1983, stocks began to recover and increased in abundance lakewide through1986. By 1986, biomass was approximately 50% of that in 1978, but then declined.By 1992, biomass was approximately 25% of that in 1978.
In Minnesota, the general pattern of rainbow smelt decline and recovery wassimilar to the lakewide trend, but fluctuations were more erratic because of thedifficulty of sampling along the steep, rocky shoreline. Biomass trends in Wisconsinand Michigan were similar to the lakewide trend, but biomass in both states is nowmuch lower than in 1978. Biomass in eastern Ontario during 1989 was similar tothat in the United States. Biomass was much higher in western Ontario, butdeclined more than 50% between 1990 and 1992.
Fig. 31. Total annual mortality (age-l-4 fish) and abundance (no. of fish.000 ha) oflarge (more than 200 mm long) rainbow smelt in United States waters of LakeSuperior, 1978-92.

The decline in rainbow smelt biomass is the result of high total mortality (Fig.31). Mortality was low in 1978, increased through 1981, and stabilized at relativelyhigh levels thereafter. Despite these high levels of mortality, a series of increasinglystrong year-classes occurred between 1981 and 1991 (Fig. 29). This series of strongyear-classes was partly because of inclusion of Ontario data between 1989 and 1992,where year-classes have been relatively stronger than in the United States.
The decline of biomass was accompanied by the loss of older-aged fish and anincrease in mortality. As a result, there was a reduction in size composition of thepopulation between 1978 and 1992. The loss of larger fish from the populationoccurred throughout the United States and eastern Ontario. Substantial numbersof large individuals existed only in western Ontario.
Other Species
Abundance of deepwater ciscoes declined substantially in Lake Superior by 1984(MacCallum and Selgeby 1987), and this trend continued through 1992. Abundanceof deepwater ciscoes declined by approximately two-thirds in Michigan andWisconsin during a 20-year period. The decline is thought to be related toincreased predation by expanding siscowet (deepwater form) lake trout populations.
Three species of sculpin (slimy sculpin, Spoonhead sculpin, and deepwatersculpin) are relatively abundant. These demersal species are eaten by young laketrout. Deepwater sculpins are a major forage of siscowets.
Sculpin biomass is greatest in Ontario-approximately one-half the level inMichigan and one-fourth the levels in Minnesota and Wisconsin. In the UnitedStates, total sculpin biomass declined by two-thirds from the 1970s to 1990s, whilebiomass in Ontario is still at United States levels of the 1970s.
Predator-Prey Interactions
Changes in the abundance of predator and prey species in Lake Superior havecaused corresponding changes in their interactions:
- predator stocks have increased,
- forage-base composition has changed, and
- predator-prey dynamics have been altered as a result (Busiahn 1990).

Lake herring and deepwater ciscoes were the principal prey historically of lake troutin Lake Superior. Up to 90% of lake trout diet was composed of coregonines in theearly 1950s (Dryer et al. 1965). As lake herring declined during the 1950s and early1960s, rainbow smelt increased in abundance and replaced coregonines as the majorfood of lake trout (Dryer et al. 1965). By 1963, rainbow smelt composed 66% ofthe diet of lake trout, and coregonines composed only 8% (Dryer et al. 1965).
Rainbow smelt continued to dominate lake trout diets between 1981 and 1987.Lake trout consumed 71% rainbow smelt and 15% coregonines by weight (Conneret al. 1993). In the spring of 1991, inshore lake trout consumed (frequency ofoccurrence) 78% rainbow smelt and less than 5% coregonines lakewide (Bronte1992). Diets of wild lake trout were more diverse than those of hatchery-producedfish. Wild fish consumed more sculpins, opossum shrimp (Mysis r&&z), burbot, andterrestrial insects. Wild fish also consumed less rainbow smelt than hatchery-produced fish (Bronte 1992). In 1992, diets of lake trout in eastern Wisconsin(WI-2) and western Michigan (MI-2) were dominated by smelt only in the spring.Diets were dominated by coregonines in winter, summer, and fall (Gallinat 1993).
Between 1981 and 1987, rainbow smelt were the principal prey in the seasonaland annual diets of chinook salmon, inshore lake trout, Atlantic salmon, browntrout, brook trout, and splake (Conner et al. 1993). Lake trout, chinook salmon,and coho salmon of similar size also ate rainbow smelt of different sizes. Inshorelake trout consumed mostly adult rainbow smelt, coho salmon ate mostly juvenilesmelt, and chinook salmon ate equal numbers of juvenile and adult smelt. Diets ofcoho salmon, rainbow trout, and pink salmon were composed predominantly ofinvertebrates. Offshore lake trout consumed primarily coregonines, and siscowet atemainly deepwater sculpins and slimy sculpins.
Predators did not consume rainbow smelt and lake herring in proportion totheir abundance in Lake Superior. Rainbow smelt averaged 27% and coregoninesaveraged 68% of the spring-forage biomass during trawl surveys conducted by theU.S. Fish and Wildlife Service between 1981 and 1987 (Hansen 1990). Rainbowsmelt composed 43% and coregonines only 15% of the prey consumed by allsalmonine predators, although the consumption of lake herring by inshore lake troutnear the Apostle Islands increased from 8% (by weight) in 1985 to 23% in 1987(Conner et al. 1993). Conner et al. (1993) posed three possible explanations for thediscrepancy between relative abundance of prey fish in the wild and in predatordiets:
60

1) Predators may prefer familiar prey.
2) Predators may fail to recognize recently abundant prey as edible prey choices.
3) Lake herring may be better able to avoid predation by lake trout throughco-evolved defense mechanisms.
One of the fish-community objectives for predators in Lake Superior is tomaintain a predator-prey balance that allows normal growth of lake trout (Busiahn1990). Lake trout growth is directly related to changes in prey-fish abundance,species composition, and interspecific competition with other salmonines.Therefore, growth may be affected by changes in any of these aspects of the LakeSuperior fish community. Lake trout growth declined lakewide after 1980 becauseof a drastic decline in rainbow smelt abundance between 1978 and 1981 (Busiahn1985; Hansen 1990). Changes in lake trout growth directly affect restoration effortsby altering stock structure, mortality rates, and age at maturity. Achieving theoptimal balance between predator and prey stocks is critical to future fisheriesmanagement and lake trout restoration efforts on Lake Superior.
Strong year-classes of lake herring between 1988 and 1990 are expected to resultin an increase in lake herring biomass between 1992 and 1994 (Selgeby 1992). Ifrainbow smelt abundance is stable and lake herring abundance increases asexpected, trout and salmon predators may shift to more-abundant lake herring.Because of differences in size of these two prey species, growth rates of predatorsusing these prey may be altered (Negus 1992). Lake herring are capable of muchgreater production than rainbow smelt in Lake Superior based on historic yield. Amore stable predator-prey system may therefore result when salmonines shift fromeating smelt to eating lake herring (Conner et al. 1993).
Bioenergetics modeling can provide insight into predator-prey dynamics andforage needs of predators (Christie et al. 1987; Hewett and Johnson 1992). Foodconsumption of predators is estimated from diet composition, temperature, growth,and prey caloric density and abundance (Kitchell 1983; Hewett and Johnson 1992).Bioenergetics modeling of predator-prey relationships in the Minnesota portion ofLake Superior showed that stocked trout and salmon could potentially consume asignificant portion of the total forage base, and chinook salmon were likely to havethe greatest predatory impact (Negus 1992). Individual chinook salmon wereestimated to consume more than:
61

- 17 times the weight of rainbow smelt and coregonines by age 3 than lake trout,
- 18 times the weight of rainbow smelt and coregonines by age 4, and
- 12 times the weight of rainbow smelt and coregonines by age 5.
Model simulations showed that predator consumption of rainbow smelt andcoregonines in 1989 was 13 times more than the estimated biomass and productionof these species. Factors that could have contributed to the poor relation betweenconsumption and production included underestimates of forage-fish biomass,erroneous parameterization of predator-species models, and inaccurate estimates ofpredator-species populations.
1)
2)
3)
Recommendations
The following list of recommendations has been established:
Fishery-management agencies should institute and enforce regulations that limitcommercial harvest of lake herring to levels that allow stocks to rebuild whilesupporting increasing predation by lake trout.
Restored lake herring stocks should be composed of at least three year-classesof spawners, each of which compose at least 20% of the harvest.
Critical data on specific stocks needed to properly manage lake herring shouldbe obtained through interagency cooperative studies.
62

OTHER SPECIES
Wayne R. MacCallumOntario Ministry of Natural Resources
Lake Superior Management Unit435 James Street South
Thunder Bay, Ontario, CANADA P7C 5G6
Stephen T. SchramWisconsin Department of Natural Resources
Lake Superior Office141 South 3rd StreetBayfield, WI 54814
and
Richard G. SchorfhaarMichigan Department of Natural Resources
Marquette Fisheries Station484 Cherry Creek RoadMarquette, MI 49855
Introduction
The fishery objective for other species in Lake Superior is to preventoverharvest of nondepleted stocks of native species (lake whitefish, deepwaterciscoes, suckers, and walleye) and to reestablish depleted stocks of native species(lake sturgeon, brook trout, and walleye) (Busiahn 1990). Lake whitefish stockspresently support greater commercial harvest than at any other time in the twentiethcentury because of increased abundance and expanded fisheries. Unfortunately, laketrout restoration has been hindered by increased incidental catch of lake trout inexpanded lake whitefish fisheries (in some areas). Deepwater ciscoes declinedcontinuously through 1989 as siscowet stocks expanded (Selgeby et al., thispublication). Lake sturgeon and walleye populations are generally depressed andrestoration should continue. Brook trout restoration has not been successful.
Lake Whitefish
The fishery objective for lake whitefish in Lake Superior is to manage lakewhitefish (considering ecosystem productivity and target mortality rates) as self-sustaining stocks mostly for commercial harvest (Busiahn 1990). Historic harvestssuggest that the productivity of lake whitefish should be approximately 0.11 kg/ha,

and total annual mortality should be approximately 60%-65%. To compare fishingintensity among management areas, catches were summarized by zone and thendivided by the area of the zone assumed to be lake whitefish grounds. Because datawere readily available, it was assumed that lake whitefish grounds included all arealess than 73 m in the United States and less than 91 m in Canada. Hydrographiccharts show that the difference between the area of these two depths is notsignificant.
Commercial lake whitefish fisheries are conducted in all jurisdictions exceptMinnesota, where catches are almost nil. All of the catch in Ontario and themajority of the catch in the United States are taken in large-mesh gillnets (?114-mm stretch-measure gillnet). State-licensed commercial fisheries in Michigan useimpoundment gear exclusively. Tribal and state-licensed trapnet fisheries took 27%of the catch in eastern Michigan (MI-5 to MI-8) between 1985 and 1990.Approximately 50% of the catch in the Wisconsin state-licensed fishery is taken byimpoundment gear. Small, winter sport fisheries for lake whitefish take severalthousand kilograms in Whitefish Bay, the St. Marys River, and the Munising andMarquette areas.
Lake whitefish fisheries in Ontario and United States jurisdictions are manageddifferently. In Ontario, commercial fisheries have operated under individualtransferable quotas (ITQs) since 1985 and are allowed to fish throughout the year.Zone quotas are determined and divided among fishers licensed for the variousareas using pro rata formulae. Commercial fisheries in the United States are limited(depending on the jurisdiction) by total allowable catches, effort, and closure of thefishery during the November spawning season.
Lake whitefish commercial fisheries in all jurisdictions are constrained, to someextent, by the bycatch of lake trout. State-licensed fishers in Michigan are requiredto release lake trout caught in their trapnets. Wisconsin state-licensed and westerntribal fishers are allotted tags for a given number of lake trout and are prohibitedfrom possessing untagged lake trout. Eastern tribal members are required to haveless than 30% lake trout in catches from primary lake trout restoration areas (MI-6).In Ontario, lake whitefish fisheries:
- have relatively small ITQs for lake trout,
- are encouraged to avoid lake trout, and
- are required either to release lake trout alive or turn over proceeds of sales tothe government when ITQs are reached.
64
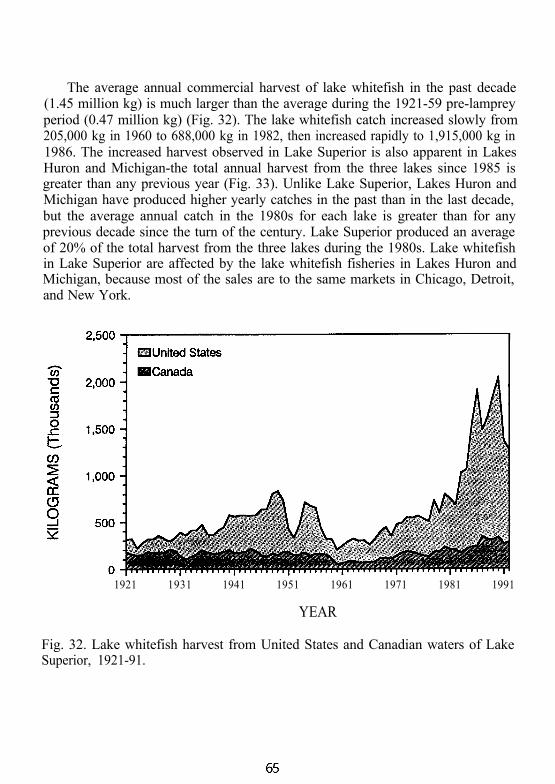
The average annual commercial harvest of lake whitefish in the past decade(1.45 million kg) is much larger than the average during the 1921-59 pre-lampreyperiod (0.47 million kg) (Fig. 32). The lake whitefish catch increased slowly from205,000 kg in 1960 to 688,000 kg in 1982, then increased rapidly to 1,915,000 kg in1986. The increased harvest observed in Lake Superior is also apparent in LakesHuron and Michigan-the total annual harvest from the three lakes since 1985 isgreater than any previous year (Fig. 33). Unlike Lake Superior, Lakes Huron andMichigan have produced higher yearly catches in the past than in the last decade,but the average annual catch in the 1980s for each lake is greater than for anyprevious decade since the turn of the century. Lake Superior produced an averageof 20% of the total harvest from the three lakes during the 1980s. Lake whitefishin Lake Superior are affected by the lake whitefish fisheries in Lakes Huron andMichigan, because most of the sales are to the same markets in Chicago, Detroit,and New York.
1921 1931 1941 1951 1961 1971 1981 1991
YEAR
Fig. 32. Lake whitefish harvest from United States and Canadian waters of LakeSuperior, 1921-91.

1921 1931 1941 1951 1961 1971 1981 1991
YEAR
Fig. 33. Lake whitefish harvest from Lakes Huron, Michigan, and Superior, 1921-91.
Most of the increased catch of lake whitefish in Lake Superior resulted fromfishing-up of previously unexploited or lightly exploited stocks. However, previouslyexploited stocks have also shown increased abundance or maintained theirabundance in spite of increased catches. Abundance of Whitefish Bay (MI-8) stocksvaried without apparent trend in the 1980s and early 1990s (Fig. 34). Abundanceof Apostle Islands (WI-2) stocks remained relatively stable between 1981 and 1987,but they increased and remained higher between 1988 and 1992. Abundance ofstocks on the western side of the Keweenaw Peninsula (MI-3) (which were notfished until the early 1980s) declined between 1984 and 1987 - probably fromfishing-up of previously unexploited stocks. Abundance subsequently fell to levelssimilar to Whitefish Bay and the Apostle Islands. Abundance in the fall of lakewhitefish in Canadian waters at opposite ends of the lake in Thunder Bay (zone 1)and Whitefish Bay (zone 34) follows the same trend. There were peaks in 1986followed by declines and then peaks again in 1991 and 1992 (Fig. 34). The patternin Whitefish Bay is similar in Canadian waters to that for the adjacent United Statesarea (MI-8).

Fig. 34. Catch per effort of lake whitefish in selected areas of United States (kg/kmnet round weight) and Canadian (kg/ha) waters of Lake Superior, 1981-92.

The 1992 harvest of lake whitefish (1,267,002 kg, round weight) expressed perunit area, was 0.15 kg/ha which exceeds the target harvest rate of 0.11 kg/ha. Ona lakewide basis, the target harvest rate (adjusted to include only lake whitefishwaters) would be 0.51 kg/ha. In 1992, the most-intensively fished area (3.8 kg/ha)was along the western side of the Keweenaw Peninsula (MI-3) (Fig. 35). The nextmost-intensively fished areas (all 1.0-2.0 kg/ha) were along the eastern side of theKeweenaw Peninsula (MI-4), Whitefish Bay (MI-8, ON-34), and Thunder Bay(ON-l, ON-4, and ON-6).
Since 1987, lake whitefish in commercial fisheries ranged in age from 2 to 15years, had mean ages from 5.0 to 9.2 years, and ranged in total annual mortalityfrom 51% to 72% (Table 3). Growth rates (size at age) varied considerably aroundthe lake from the fastest-growing stock in Whitefish Bay (MI-8) to the slowest-growing stock around the Apostle Islands (WI-2). The Black Bay stock (ON-7),which has the youngest mean age in Canada, grew as rapidly as the Whitefish Baystock from the United States (Fig. 36).
Table 3. Age range, mean age, and annual mortality of gillnetted lake whitefish inselected areas of Lake Superior, 1981-92.
Area Year
WI-2 1988WI-2 1992
Agerange
5-115-13
Meanage
7.67.7
Annualmortality (%)
7970
Ml-3 1991 4-13 6.8 78MI-4 1991 3-12 6.8 72MI-5 1991 4-13 6.9 69MI-8 1981 4-13 6.6 72MI-8 1 9 % 4-11 7.0 70MI-8 1992 5-12 7.2 60
ON-l 1987 6-14 8.5ON-l 1989 4-12 8.0 71ON-l 1991 4-15 9.2ON-7 1988 3-10 5.8ON-7 1990 2-12 5.0 54
ON-34 1986 5-12 6.7ON-34 1989 4-15 7.0 54ON-34 1991 4-15 7.0 51

Fig. 35. Yield per unit area (kg/ha) of lake whitefish in Lake Superior managementareas in 1991 and 1992 (see frontispiece for location names).

36. Size at age of lake whitefish in commercial gillnets from selectedmanagement areas (two stocks in MI-8) of Lake Superior.Fig.
Walleye
Walleye were of only local importance in Lake Superior. The maximumcommercial harvest from United States waters was 56,000 kg in 1885. Themaximum commercial harvest from Canadian waters was 170,000 kg in 1966. Manyof the walleye stocks in Lake Superior are slow growing, dominated by oldindividuals (Schram et al. 1992) and therefore unable to withstand high levels ofexploitation (Fig. 37). Overharvest is a primary reason for declining abundance ofseveral walleye populations (Schram et al. 1991). Exotic species have not beenshown to adversely impact walleye. However, effects may not be detectable withpresent monitoring programs.

AGE (YEARS)
Fig. 37. Age distribution of spawning walleyes sampled from the St. Louis River inwestern Lake Superior in 1981 (Schram et al. 1992).
Despite reductions in their abundance, Lake Superior walleye are actively soughtby anglers and tribal home-use fishers. Fishery managers have responded to thedemand for walleye fishing by attempting to restore stocks through restrictiveregulations, habitat restoration, and stocking (Table 4). Commercial fishing hasbeen eliminated except for a quota fishery in Ontario and a tribal fishery in theUnited States. Reduced angler-bag and size limits are in effect in Ontario andWisconsin. Habitat projects in Thunder Bay have been designed to increasespawning and nursery habitat. Relicensing criteria for hydroelectric dams on walleyespawning rivers should provide consistent spring river flows that may lead toincreased hatching success. Restoration attempts in the Nipigon River and NipigonBay included transferring and releasing 12,000 adult fish and designing criteria forrestoration of spawning shoals. Releases into the Goulais River included 1.3 millionfry between 1984 and 1988. Fingerling walleye stocked in Wisconsin and Michiganwaters have survived and grown well.
Walleye are being used in an attempt to control ruffe in the St. Louis River andestuary. Conservative regulations and fingerling stocking were designed to suppressthe ruffe population. Evaluation of the effectiveness of this program is under way.

Table 4. Management problems, objectives, strategies, and results for major LakeSuperior walleye populations.
PopulationManagement
problem Objective Strategy Result
St. LouisRiver
ChequamegonBay-KakagonRiver
Bad River
OntonagonRiver
Lac laBelle
KeweenawBay
WhitefishBay
NipigonBay
BlackBay
ThunderBay
Exploitationof old stock.High mercury.
Recoveringpopulation.
Spawning runreduced.Insufficientdata.
Spawning runreduced.
Insufficientdata.
Overharvest.Insufficientdata.
Overharvest.Insufficientdata.
Paper milleffluent.Overharvest.Insufficientdata.
Overharvest.Insufficientdata.
Excessivecontaminants.Habitat loss.
Maintain sizestructure.Control ruffe.
Provide sport andtribal fisheries.Rebuildstock.
Provide sport andtribal fisheries.Rebuild stock.
Rebuild stock.
Provide sportfishery.
Provide sportfishery.
Provide sportfishery.Rebuild stock.
Rebuild stock.
Rebuild stock.
Maintainpopulation andsupportinghabitats.
Stockfingerlings.Protect adults.
Stock fry andfingerlings.Protect adults.
Acquire data.
Monitorspawning run.
Stockfingerlings.
Stockfingerlings.Acquire data.
Stock fry andfingerlings.Acquire data.
Stock fry,fingerlings,and adults.Close fishery.Acquire data.
Stock adults.Acquire data.
Protect andrestorehabitat.
Nochange.
Goodsurvival.
Unknown.
Unknown.
Unknown.
Goodsurvival.
Unknown
Unknown.
Failed.
Nochange.
72

Lake Sturgeon
Lake sturgeon are a threatened species in North America (Williams et al. 1989)and have a restricted distribution in Lake Superior. Populations most oftenidentified in historic records were 64 records for the Sturgeon River (Michigan) and131 records for the Bad River (Moore and Braem 1965). Early explorers alsomentioned lake sturgeon runs in the Ontonagon River, Michigan (Schoolcraft 1821),and the St. Louis River where large numbers ascended for spawning (Kaups 1984).Commercial fishers reported lake sturgeon from:
- the ports of Brimley, Munising, Big Bay, Keweenaw Bay, and West Entry inMichigan;
- the Apostle Islands area in Wisconsin; and
- several points in Minnesota and Ontario.
Commercial landings for lake sturgeon exceeded 90,720 kg in 1885 and 45,360kg in 1889 and 1890; however, reporting was inconsistent in the United States.Commercial fishing for sturgeon was closed in all United States waters in 1928, butMichigan allowed-retention of sturgeon again in between 1951 and 1969.lakewide catch has been 454 kg or less since 1970 (Baldwin et al. 1979).
180
160
140
120
100
80
60
40
20
0
Number
4 6 8 1 0 1 2 1 4 1 6 1 8 2 0 2 2 2 4 2 6 2 8 3 0 3 2 3 4 3 6 3 8 4 0 4 2
AGE (YEARS)
38. Lake sturgeon length and number sampled in each age group in-Chequamegon Bay and western Lake Superior.

Spawning populations of lake sturgeon in Lake Superior are found in theSturgeon River (Michigan); Bad River (Wisconsin); and the Kaministikwia,Michipicoten, and Black Sturgeon Rivers (Ontario). In 1988, capture of age-0 lakesturgeon in the Sturgeon River indicated reproduction still occurred there (Auer1988). In the fall of 1992, three juvenile lake sturgeon caught in the Bad River were155-196 mm long (average 175 mm long)-indicating reproduction also occurredthere (U.S. Fish and Wildlife Service, Ashland Fisheries Resources Office, 2800Lake Shore Drive, East, Ashland, WI 54806, unpubl. data). Lake sturgeon from theSturgeon River included six adult males (22-30 years old) and five adult females(31-36 years old) (Auer 1987). Sturgeon from Chequamegon Bay and nearDuluth-Superior exceeded 130 cm for fish 30-40 years old (Wisconsin Departmentof Natural Resources, 141 South 3rd Street, Bayfield, WI 54814, unpubl. data) (Fig.38). In the Bad River, 8 adult males were 8-21 years old (average 16.3 years) and87-138 cm long (average 120 cm). There were 3 females 22-24 years old (average23.3 years) and 133-140 cm long (average 137 cm) (Shively and Kmiecik 1989). Alsoin the Bad River in 1992, 17 adult males were 89-183 cm long (average 114 cm) and4 females were 122-183 cm long (average 148 cm). An additional 13 fish ofundetermined sex were 61-144 cm long (average 103 cm) (U.S. Fish and WildlifeService, Ashland Fisheries Resources Office, 2800 Lake Shore Drive, East, Ashland,WI 54806, unpubl. data).
Dam construction on spawning streams and overharvest were the major factorshistorically limiting sturgeon populations (Priegel and Wirth 1971). Fishingmortality is currently composed of incidental catch in commercial nets, poaching onspawning grounds (Auer 1987), and tribal subsistence fishing-approximately 20 fishper year from the Bad River (J. D. Rose, Jr., Great Lakes Indian Fish and WildlifeCommission, P. 0. Box 9, Odanah, WI 54861, pers. commun.). Commercial andsport fisheries have restrictive regulations for most of Lake Superior.
Strategies for restoring depleted stocks of lake sturgeon include inventory,protection, restoration, and replacement of spawning and rearing habitat. Degradedhabitat in the Sturgeon River may be restored by requiring a hydroelectric damundergoing federal relicensing by the Federal Energy Regulatory Commission tooperate at run-of-the-river flows. Peaking flows were replaced by run-of-the-riverflows (1990-92) which reduced the length of time that lake sturgeon spawners spentin the river from 2-3 months to 2-3 weeks. More fish are caught annually,ripe-running fish are more common, and the number of large fish has increased (N.Auer, Michigan Technological University, Houghton, MI 49931, pers. commun.).Water quality has also improved through enactment of more-stringent water-pollution regulations.

Recent stocking efforts should help restore and enhance lake sturgeon in theSt. Louis River (by the states of Wisconsin and Minnesota) and in the Bad River(1,500 fingerlings in 1988) by the Bad River Tribe. Attempts to capture adults forassessment and hatchery purposes in the Bad River were mostly unsuccessfulbetween 1989 and 1992. All 22,900 lake sturgeon stocked by Minnesota in the St.Louis River between 1989 and 1991 were coded wire tagged. From 1971 to 1991,half of 238 fish captured in small-mesh-gillnet surveys in the river were tagged, andcatch rates were 3.6, 4.4, and 2.0 fish/1,000 m, respectively (Minnesota Departmentof Natural Resources, 5351 North Shore Drive, Duluth, MN 55804, unpubl. data).Summer assessment netting in the St. Louis River from 1971 to 1991 indicates thatlake sturgeon populations are building (Fig. 39) and that fish tend to leave the riverafter they reach a length of 53 cm (Wisconsin Department of Natural Resources,141 South 3rd Street, Bayfield, WI 54814, unpubl. data). Lake sturgeon in the St.Louis River are believed to be all stocked fish.
1971 1973 1975 1977 1979 1981 1983 1985 1987 1989 1991
YEAR
Fig. 39. Lake sturgeon catch in western Wisconsin waters of Lake Superior duringsummer assessment netting, 1971-91.

Recommendations
The following list of recommendations has been established:
1) The fishery objective for lake whitefish should be expanded to defineparameters associated with self-sustaining stocks, especially those related tomortality rates and environmental productivity.
2) Walleye and lake sturgeon populations should be restored in streams that oncehad significant populations by use of habitat protection and restoration,
judicious stocking, and harvest regulations.
3) Walleye and lake sturgeon stocking should be with fish of Lake Superior-watershed origin wherever possible.
4) Relicensing criteria for hydroelectric dams on walleye and lake sturgeonspawning rivers should provide spring flows that enhance recruitment.
5) Biological information about walleye and lake sturgeon populations should beobtained and used to develop restoration plans.

SEA LAMPREY
Gerald T. KlarU.S. Fish and Wildlife ServiceMarquette Biological Station
1924 Industrial ParkwayMarquette, MI 49855
and
Jerry G. WeiseDepartment of Fisheries and Oceans
Sea Lamprey Control Centre1 Canal Drive
Sault Ste. Marie, Ontario, CANADA P6A 6W4
Introduction
The fishery objective for sea lampreys in Lake Superior is to achieve a 50%reduction in current abundance of parasitic-phase sea lampreys by the year 2000 anda 90% reduction by 2010 (Busiahn 1990). Current control methods reduced sealamprey abundance by 90% from precontrol levels. Integration of additionalcontrol methods including sterile-male releases, barrier-dam construction, increasedchemical treatments, and additional trapping can be used to reduce populationstoward these goals. The integrated management of sea lamprey (IMSL) programwill define the objectives for sea lamprey abundance and recommend the optimalsea lamprey-control program. The IMSL initiative will include detailed evaluationsof data on sea lamprey abundance, salmonid wounding and mortality, and chemical-treatment history to link control efforts to levels of damage to the fishery. Planningunder the IMSL protocol is targeted to begin in 1994.
History
The first sea lamprey taken from Lake Superior was attached to a lake troutnetted near Marquette, Michigan, in 1939. Sea lamprey numbers increased greatlyduring the following 20 years and reached peak abundance by 1960. The firstattempts to control sea lampreys in Lake Superior occurred in 1950 and 1951 whenmechanical weirs were placed in two streams on the south shore. These weirs wereineffective because of floods which allowed sea lampreys to pass upstream andspawn. Preliminary tests in 1952 demonstrated that electric barriers were effectivein blocking spawning runs of sea lampreys, and by 1960 these barriers had beeninstalled in 97 tributary streams of Lake Superior. Many electric barriers stayed in
77

operation only a few years, but approximately 55 were operated between 1953 and1960. The efficiency of these barriers as control devices was limited by mechanical,physical, and biological factors. Electric barriers were operated to assess spawningruns in reduced numbers. There were:
- 24 between 1958 and 1967,
- 16 between 1968 and 1970, and
- 8 between 1971 and 1979.
No electric barriers were operated after 1979. Since 1976, assessment traps placedin index tributary rivers have been used to measure abundance of spawning-phasesea lampreys.
400
300
200
100
01958 1962 1966 1970 1974 1978 1982 1986 1990
YEAR
Fig. 40. Estimated number of spawning-phase sea lampreys in United States watersof Lake Superior, 1958-92.
The lampricide 3-trifhtoromethyl-4-nitrophenol (TFM) was developed by theU.S. Fish and Wildlife Service at the Hammond Bay Biological Station where 6,000chemical compounds were screened in search of a selective toxicant (Applegate etal. 1957). Lampricide treatments of Lake Superior tributaries began in 1958(Applegate et al. 1961), and 72 of the most-heavily infested streams were treated by
7 8

1960. Following these treatments, the number of adult sea lampreys estimated inLake Superior declined by 85%-a level maintained through 1992 (Fig. 40).Intensified treatments between 1973 and 1979 reduced the number of adult sealampreys to less than 10% of precontrol levels. Present abundance remainsrelatively similar to abundance from 1973 to 1979. Smith and Tibbles (1980)reviewed the sea lamprey invasion in Lake Superior and the control efforts andeffects through 1979.
1986 1987 1988 1989 1990 1991 1992
YEAR
Fig. 41. Estimated number of spawning-phase sea lampreys in United States watersof Lake Superior east and west of the Keweenaw Peninsula, 1986-92.
Adult Populations
Relative abundance of spawning-phase sea lampreys is estimated usingassessment traps fished in index tributary rivers. The number of traps variedbetween 1976 and 1992, but 9-23 Lake Superior streams have been trapped in mostyears. Traps were operated in 17 United States and 5 Canadian streams in 1992.
Between 1986 and 1992, the total abundance of adult sea lampreys in UnitedStates tributaries was projected from a relation between average stream dischargeand the number of spawning-phase sea lampreys estimated to have entered certainstreams. A single relation was developed for south-shore streams in 1986, and

independent more-precise relations for streams west and east of the KeweenawPeninsula were developed between 1987 and 1992 (Fig. 41). As a part of severalstudies preliminary to implementation of the sterile-male-lamprey technique in LakeSuperior, mark-recapture estimates showed approximately 10,000 adult sea lampreysin Canadian streams in 1987. The estimated number of adult sea lampreys in theUnited States between 1958 and 1992 was developed by comparison of catchesduring the years when assessment traps and electric barriers were operatedconcurrently, and by back-calculation of estimated values between 1986 and 1992through the previous years.
The number of sea lampreys in the lake during the early 1990s appears relativelyunchanged from the 1970s and 1980s. Between 1980 and 1992, catches of adult sealampreys taken in assessment traps varied similarly to catches at electric weirsbetween 1970 and 1979. Estimated numbers of adult sea lampreys in United Statesstreams between 1986 and 1992 ranged from 23,000 to 60,500 (Fig. 40). Abundancebetween 1958 and 1992 is estimated to have ranged from 185,000 to 377,500 duringthe precontrol years (1958-61) and from 13,500 to 82,500 between 1962 and 1992.
Production Areas
In Lake Superior, sea lampreys have been found in 62 Canadian and 90 UnitedStates rivers, and in lentic areas off 14 Canadian and 17 United States rivers. Mostsea lamprey larvae occur in:
- 14 Canadian river systems-the Goulais, Batchawana, Pancake, Michipicoten,Pic, Little Pic, Prairie, Pays Plat, Gravel, Jackfish, Nipigon, Wolf, Kaministikwia,and Pigeon, and
- 22 United States river systems-the Waiska, Two Hearted, Sucker, AuTrain,Chocolay, Salmon Trout, Huron, Ravine, Sturgeon, Traverse, Misery, EastSleeping, Firesteel, Ontonagon, Potato, Cranberry, Bad, Brule, Poplar, Middle,Amnicon, and Nemadji.
Major larval production also occurs in lentic areas off four Canadian river mouths(the Chippewa, Batchawana, Gravel, and Nipigon) and off two United States rivermouths (the Sucker and Falls). Larvae escape treatments in some rivers because ofoxbows, backwaters, and groundwater seeps where minimum lethal concentrationsof lampricide are difficult to maintain. Delays or postponements of treatmentsbecause water levels are too high or low also contribute to larval escapement.
80

Larval Populations
Assessments of larval sea lamprey populations are conducted to determine:
1) the need for and effectiveness of lampricide treatments, and
2) the basic productivity in estimated numbers of larvae for the major lamprey-producing streams of the lake.
Relative abundance of larval sea lamprey populations are evaluated to identifystreams that require lampricide treatments, areas within streams that needtreatments, effectiveness of treatments, numbers of larvae escaping treatment, andyear-class strength. Larval populations are sampled using backpack electroshockersin shallow water, and a bottom toxicant (Bayer 73) or deepwater electroshocker inwater deeper than 1 m.
Estimates of larval abundance have been conducted on many streams in theUnited States and Canada since 1983. These estimates involved the capture,marking, and release of larvae for recapture during lampricide treatments andhabitat-based assessments. Approximately 91,000 larvae were estimated in the BigGarlic River during the 1983 treatment. Estimates were made using mark-recapturemethods for various 9.66-km zones stratified by habitat types and qualitative larvalabundance. This effort was the first habitat-based estimate of a stream populationof larvae in the Lake Superior drainage.
An extended field study was initiated in 1988 to systematically conduct habitat-based estimates of larval abundance to determine basic-productivity potential in the32 primary lamprey-producing streams in the United States. Larval abundance wasestimated in 26 tributaries through 1992 (Table 5). These abundance estimatesrange from 101 in the Salmon Trout River (Houghton County) to 1,048,208 in theBad River (post-treatment abundance was 24,908). The information is an integralelement of the IMSL process and is essential to refine and validate predictionmodels. Habitat-classification and population estimates will be completed in UnitedStates streams during 1994.

Table 5. Estimated number of sea lamprey larvae, date of estimate, andmanagement area of 26 Lake Superior tributaries.
River Area Date Number
United States:Amnicon RiverMiddle RiverBrule RiverRed Cliff CreekBad RiverBad River
WI-1 SP1 523,077WI-1 6/89 38,800WI-1 7/89 131,564WI-2 6/89 5,421WI-2 7/91 1,071,872WI-2 8P2 24,904
Ontonagon RiverFiresteel RiverFiresteel RiverEast Sleeping RiverSalmon Trout RiverTraverse RiverSturgeon RiverFalls RiverHuron RiverSalmon Trout RiverIron RiverBig Garlic RiverLittle Garlic RiverHarlow CreekChocolay RiverMiners RiverSucker RiverBetsy RiverTahquamenon RiverGalloway CreekWaiska River
Ml-2 8P2 794,736MI-2 9P1 328,553MI-2 7P2 10,027MI-2 6P2 24,659MI-3 9P2 101MI-4 8PO 177,155MI-4 8f89 352,066MI-4 7/89 5,511MI-4 7/88 614,869MI-5 5Pl 236,866MI-5 SP1 69,859MI-5 9/89 16,788MI-5 5B9 27,292MI-5 8/88 62,023MI-5 8P1 458,126MI-6 5P2 7,375Ml-6 7PO 765,392MI-8 6PO 41,893MI-8 6PO 9,479MI-8 5PO 2,428MI-8 lOP2 524
Canada:Pancake River ON-33 6/89 181,401

Control Strategy
Between 1958 and 1992, 857 lampricide applications were made on 43 streamsin Canada (280 treatments) and 84 streams in the United States (577 treatments).Approximately 20% of these streams were treated only once, but some were treatedas many as 23 times. During the past ten years, treatments have been conductedregularly on 32 tributaries in Canada and 44 tributaries in the United States. Inaddition to stream treatments, lentic areas off the mouths of 13 Canadian rivershave been treated with granular Bayer 73.
Streams are scheduled for treatment to prevent metamorphosed larvae frommigrating into Lake Superior. Preliminary scheduling is done two years in advanceof treatment for administrative and logistical reasons, and schedules are establishedone year prior to treatment. Most streams are treated on a three- to four-yearrotation.
Funds were requested in 1992, 1993, and 1994 to increase lampricide treatmentson Lake Superior tributaries to assist in achieving the goal of a 50% reduction insea lamprey numbers. The proposed strategy is to apply lampricide to major sealamprey-producing streams two years in succession to eliminate the majority oflarvae that survive the first treatment. No funds have been received to date toinitiate this strategy.
Research at the Hammond Bay Biological Station indicated release of sterile-male sea lampreys may be an effective supplemental lamprey-control technique(Hanson and Manion 1980; Hanson 1981). In 1991, 3,434 sterile-male lampreyswere released into ten tributaries in eastern Lake Superior. Because of equipmentproblems and delays, the sterile lampreys were released past the time of optimumeffectiveness. In 1992, 21,299 sterile-male sea lampreys were released into 21United States Rivers and six Canadian streams (Table 6). Numbers of resident sealampreys and lampreys available for sterilization were estimated prior to the startof the field trial. A sterile-to-normal-male ratio of 1.8:1 was targeted and wouldtheoretically reduce the reproductive capacity of the lamprey population by 64%.The predicted ratio was achieved on a lakewide basis and ranged from 0.9:1 to 2.5:1among the 27 streams. Short- and long-term effectiveness of the technique is beingevaluated.

Table 6. Predicted and actual numbers of sterile-male sea lampreys released,normal resident males present, ratio of sterile to normal males, and the predictedprogeny in 27 tributaries of Lake Superior in 1992.
RiverPredicted
Resident SterileReleased
Resident SterileReduction
Ratio Percent
United States:NemadjiAmniconMiddlePoplarBadCranberryPotatoOntonagonEast SleepingFiresteelMiseryTraverseSturgeonSilverHuronSalmon TroutChocolayAu TrainSuckerTwo HeartedWaiska
800 1,418 1,574 1,417 0.9:1 47972 1,723 771 1,723 2.2:1 69202 359 161 318 2.0:l 67142 252 112 252 2.3:1 70
1,770 3,138 1,404 3,170 2.3:1 7026 47 19 47 2.5:1 7116 28 12 28 2.3:1 70
2,000 3,544 3,311 4,624 1.4:1 58105 186 84 186 2.2:1 69239 424 189 423 2.2:1 69198 352 157 352 2.2:1 6926 47 28 47 1.7:1 63
764 1,355 809 1,794 2.2:1 6986 154 92 154 1.7:1 63
137 243 145 243 1.7:1 6370 125 75 125 1.7:1 63
129 230 137 230 1.7:1 63134 239 143 239 1.7:1 6394 167 100 165 1.7:1 63
273 485 289 696 2.4:1 7168 121 72 121 1.7:1 63
Canada:PigeonWolfNipigonPancakeBatchawanaGoulais
80 142 80 160 2.0:1 67200 354 200 369 1.8:1 64
1,000 1,772 l,@Jo 2,611 2.6:1 72100 177 100 177 1.8:1 64400 709 400 709 1.8:1 64400 709 400 919 2.3:1 70
Total/Average 10,431 18,500 11,864 21,299 1.8:1 64

Low-head barrier dams are the only alternative to TFM treatments on lamprey-producing streams. Barriers act by:
- blocking upstream migration of spawning-phase sea lampreys,
- eliminating production of sea lampreys in streams or sections of streams,
- eliminating the need for TFM treatments and any associated nontarget effectsor water-use conflicts, and
- creating or enhancing trapping of spawning sea lampreys.
Barriers have been built on six Canadian and four United States streams to date.In addition, velocity barriers are being developed by the Canadian sea lampreycontrol agent. Velocity barriers exploit the relatively poor swimming ability of sealampreys compared to other fish species. Water velocity is increased above theburst swimming speed of sea lampreys to prevent their upstream passage whileallowing other fish species to pass. An experimental velocity barrier will beconstructed and tested on the McIntyre River in 1993.
Nontarget Effects
Lampricide can be applied without affecting most nontarget aquatic vertebratesfound in Lake Superior tributaries. Species such as stonecat, trout-perch, brownbullhead, mudpuppy (Necturus maculosus maculosus), and ruffe are sensitive to TFMand killed during treatment. The concentration of TFM that would begin to killage-0 lake sturgeon is 1.3 times higher than the concentration that would kill 99.9%of sea lampreys. Successful treatments of sea lamprey have been conducted at theseconcentrations with no observed mortality of lake sturgeon. Mortality ofless-sensitive fish species may occur if the lampricide is applied during theirspawning, and frequent treatments may impede full recovery of some sensitivespecies. Mechanical or electric barriers used as alternatives to chemical treatmentmay block passage of fish migrating upstream to spawn. Fish-passage provisions willallow some fish species to ascend upstream. Barriers may pose a hazard if notdesigned and constructed carefully.

Several short- and long-term studies have been conducted in United Statestributaries of Lake Superior between 1983 and 1992 to measure impacts oflampricide treatments to 64 taxa of nontarget macroinvertebrates. Short-termstudies were conducted during treatments by:
- placing organisms in cages (Huron, Silver, Potato, Bad, and Brule Rivers),
- collection of benthos drift (Brule River), and
- toxicity tests in a mobile laboratory (Sturgeon and Brule Rivers).
The long-term impact to riffle invertebrate communities is being measured in theBrule River. Long-term impact on populations of Hexagenia mayflies is beingmeasured in four Lake Michigan streams-indirectly relating to Lake Superior.
Most taxa of macroinvertebrates are not impacted during lampricide treatments.Of the 64 taxa, the numbers of Oligochaeta (aquatic worms), Simulidae (black flies),caddis flies (Chimarra, Dolophilodes, and Glossosoma), and mayflies (Hexagenia andLitobrancha) decline during treatments. In general, populations of impactedorganisms recover to pretreatment abundance within scheduled treatment cycles.Treatment techniques are modified when appropriate to minimize impacts oninvertebrates.
1)
2)
Recommendations
The following list of recommendations has been established:
Increased (sea lamprey) treatment frequency and barrier construction, improvedtreatment effectiveness, and implementation of experimental new technologyshould be used to meet the fish-community objective for sea lamprey in LakeSuperior.
Integrated approaches to sea lamprey control should be emphasized in westernwaters of Lake Superior to address the higher lake trout wounding in theseareas.
86

RUFFE
James H. SelgebyNational Biological Survey
Lake Superior Biological Station2800 Lake Shore Drive, East
Ashland, WI 54806
Introduction
The ruffe (a Eurasian percid) is found in fresh and brackish water (Lind 1977)in lakes and slow-flowing rivers in England, eastern and northern Europe, and Asia;in rivers flowing into the Arctic Ocean; and in the Caspian and Aral seas (Berg1949; Holcik and Mihalik 1968). The ruffe has become overly abundant where ithas been introduced in Europe, and its growth may be stunted (Fedorova andVetkasov 1973). Ruffe are highly fecund (Berg 1949; Bacmeister 1977) and prey onfish eggs and larvae (Nikolskii 1954; Mikkola et. al. 1979). European literature onthe ruffe indicates that this species is of little or no value as a food or recreationalfish and is frequently considered a pest and serious problem.
History
Ruffe were first found (31 small individuals) in North America in July 1987 andAugust 1987 at three locations in the 4,400-ha St. Louis River-Lake Superior’smost-western tributary (Pratt et al. 1992). Individuals who had recently sampled theSt. Louis River were notified of the discovery. Ichthyoplankton collections by anenvironmental consulting company included 66 ruffe larvae from three sites in theSt. Louis River during 1986 and 101 ruffe larvae from four sites in 1987 that hadbeen mistaken for johnny darters (Simon and Vondruska 1991). A single ruffe waskilled during a lampricide (TFM) treatment of the upper St. Louis River estuary onSeptember 1, 1987.
The likely vector for the exotic species was the ballast of an ocean-going vessel(Pratt et al. 1992). The Duluth-Superior Harbor is an international grain-shippingport located at the mouth of the St. Louis River. The harbor is used by manyin-ballast grain ships each year-a total of 181 transoceanic vessels entered theDuluth-Superior Harbor in 1988. Many of these ships previously loaded andunloaded in the seaports of northern Europe. These ports are typically located inthe lower reaches of large rivers where ruffe are common.

Between 1988 and 1991, ruffe spread slowly along the south shore of LakeSuperior and into the mouths of the Amnicon, Brule, and Iron Rivers-locatedapproximately 25,40, and 50 km east of the St. Louis River, respectively. An anglercaught a ruffe on August 14, 1991, in the Kaministiquia River at Thunder Bay,Ontario located 300 km northeast of the St. Louis River (W. MacCallum, OntarioMinistry of Natural Resources, 435 James Street South, Thunder Bay, Ontario,Canada, P7C 5G6, pers. commun.). Six more specimens were subsequently caughtin September and October 1991 in Thunder Bay-none were taken in 1992. It isunlikely that the ruffe moved along the shoreline from Duluth-Superior to ThunderBay because of the length and hostility (cold water) of the coastline between the twoareas. Instead, ruffe were most likely transported from Duluth-Superior to ThunderBay via intralake shipping (ballast). Ruffe were caught in 1992 in the Flag and SandRivers-60 and 80 km east of Superior, Wisconsin, suggesting that the ruffe isexpanding its range. Ruffe have not yet been taken in Chequamegon Bay,Wisconsin, although heavy sampling was conducted in 1992.
Fig. 42. Estimated ruffe abundance in the St. Louis River, Lake Superior, 1989-92.
88

Numbers of ruffe in the St. Louis River increased sharply between 1989 and1992 (Fig. 42). The estimated spawning population increased from 0.2 million in1989 to 1.8 million in 1992. As population density of ruffe increased, intraspecificand interspecific competition caused first-year growth of ruffe and the proportionof mature one-year-old ruffe to decline. Increasing population pressure within theSt. Louis River also caused a buildup of ruffe numbers in Lake Superior proper.Summer gillnetting took no ruffe in the lake before 1991 but took ruffe at severallocations in 1991 (Wisconsin Department of Natural Resources, 141 South 3rdStreet, Bayfield, WI 54814, unpubl. data). A commercial trawler took large numbersof ruffe off Duluth-Superior in spring 1992, and substantial numbers of ruffe wereconsistently caught during trawling in Lake Superior in 1992 near the Superior entryto Duluth Harbor.
Interactions With Native Species
Lake Superior fishery scientists met in 1988 to evaluate the likely effects of ruffeon the native-fish community and options for its control. Results of research inEurope and Russia suggested that ruffe were likely to be deleterious to recreationaland food fisheries. Chemical control was debated but then rejected as politicallyunfeasible, too expensive, and unlikely to succeed. Consequently, agencies chose toattempt top-down predator control-a technique used in the lower Great Lakes togreatly reduce overly abundant prey-fish species with Pacific salmon. During thewinter (1988-89), public meetings were held to describe the problem and thetop-down predator-control program. In spring 1989, emergency-harvest regulationswere implemented to reduce annual catches of walleye and northern pike. Intensivestocking of walleye, northern pike, and muskellunge was initiated.
In 1988, studies were begun in the St. Louis River estuary to:
- evaluate the effects of invading ruffe on a native cool-water fish community,
- determine the biological and population characteristics of ruffe and interactingspecies, and
- evaluate the effectiveness of the top-down control strategy.
To collect population data on all fish species present, trawling was conducted at 40randomly selected sites in the estuary during 9-11 cruises each year between 1989and 1992. Intensive sampling in the spring and fall of each year was used toestimate population sizes and collect specimens for laboratory analysis. Trawling,electrofishing, fykenetting, and creel surveys provided samples of predator stomachsfor determining food habits.
89

Ruffe are closely associated with the bottom. They are found in the deepestchannels (8-10 m deep) at ice-out, move into the shallows to spawn, remain mainlyin water l-3 m deep throughout the summer, and return to the deepest channels inSeptember and October. Ruffe occupy all habitats in the St. Louis River estuary butappear to prefer mid-depth (3-5 m deep) channels during the day and shallowerwater at night to feed. Within the St. Louis River system, ruffe are widelydistributed. They are most abundant in downstream sections of the river near LakeSuperior and least abundant in upstream river areas. Upstream migration in the St.Louis River is blocked by a dam located approximately 40.2 km from the rivermouth.
Ruffe in the estuary grow very rapidly and attain approximately 40%-50% oftheir ultimate length (approximately 180-200 mm) in their first year. Ruffe becomesexually mature at an early age-of several thousand fish examined in 1988, allexcept two very small females were mature at age 1. Between 1989 and 1991,first-year growth slowed each year and higher proportions of yearlings wereimmature. Fecundity is moderately high but much less than reported in Europeanliterature.
Ruffe eat microcrustaceans, mostly Cladocera, in their first two months of lifeand then switch to macrobenthos in the late summer and fall (D. Ogle, Universityof Minnesota, Twin Cities, MN, pers. commun.). Adult ruffe less than 120 mm longeat mostly Chironomidae, other macrobenthos, and microcrustaceans early in theyear. Adult ruffe more than 120 mm long eat mostly macrobenthos - especiallymidges and burrowing mayflies. Diel sampling showed that adult ruffe migrate intoshallow areas at dusk (where they feed throughout the night) and then move backto deeper channels at dawn. Age-O ruffe also feed most heavily at night but alsofeed during the day (mostly on microcrustaceans).
The major predators of ruffe have been large (more than 200 mm long) yellowperch and brown bullheads (both of which eat smaller ruffe) and northern pike(which eat larger ruffe). Abundance of large perch and bullheads declined sharplybetween 1989 and 1992 for uncertain reasons. However, pike and walleyeabundance increased slightly between 1989 and 1992 (Fig. 43), probably as a resultof restrictive harvest regulations and stocking.
90

YEAR
Fig. 43. Estimated abundance of northern pike, yellow perch, walleye, and bullheadsin the St. Louis River, Lake Superior, 1989-92.
Predation on ruffe was studied beginning in 1989. However, 1992 data coveronly the first six months of the year. Between 1989 and 1992, the contents pumpedfrom thousands of predator stomachs were examined (mostly from fish releasedalive) but only 1,269 contained fish. Predation on ruffe increased from almost nonein 1989 to over 20% of all fish eaten in 1992. In the early years of the invasion,ruffe found in predator stomachs were predominantly small and were consumedmostly by larger bullheads and yellow perch. Northern pike consumed increasingnumbers of ruffe between 1989 and 1992. By early summer (1992), northern pikeconsumed substantial numbers of ruffe. Between 1989 and 1991, no ruffe werefound in 356 walleye that ate fish. By early 1992, 28% of 18 walleye that ate fishhad eaten ruffe. These results suggest that predators in the St. Louis River have notyet checked the expansion of ruffe.
91

Recommendations
The following list of recommendations has been established:
1) Changes in fish-community structure in the St. Louis estuary should continueto be described and the causes of these changes should be determined.
2) Competitive relationships between ruffe and native species should beresearched.
3) Predation on ruffe by native species should be quantified using bioenergeticsmodels to determine if top-down predator control is a viable control option.
4) Other control options should be investigated and implemented to slow thespread and reduce the range of ruffe.
92

H A B I T A T
Donald R. SchreinerMinnesota Department of Natural Resources
Lake Superior Area Fisheries Program5351 North Shore Drive
Duluth, MN 55804
Introduction
The fishery objective for habitat in Lake Superior is to achieve no net loss ofthe productive capacity of habitats supporting Lake Superior fisheries, restore theproductive capacity of habitats that have suffered damage, and reduce contaminantsin all fish species to levels below consumption advisory levels (Busiahn 1990). Aninventory of habitat types, in conjunction with continued fish-population monitoring,will be required to achieve no net loss of fish productivity. Involvement of fisherymanagers in remedial efforts coordinated by the International Joint Commission(IJC) will be required to restore the productive capacity of damaged habitat.Implementation of Remedial Action Plans (RAPS) and reduction of airborne toxinswill be required to reduce contaminant levels in fish below consumption advisorylevels.
Maintain Existing Habitat
Fish habitats most critical to achieving no net loss of Lake Superior fisheryproduction include spawning grounds, wetlands, rivers, streams, and surroundingwatersheds. Spawning substrates (such as rocky shoals in Lake Superior) supportseveral of the most important species including lake trout, lake whitefish, and lakeherring. Rivers and streams flowing into Lake Superior provide spawning andnursery habitat for anadromous species such as walleye, brown trout, rainbow trout,Pacific salmon, and lake sturgeon. Habitat degradation in these watersheds willultimately affect the productivity and composition of the Lake Superior fishcommunity.
General inventories of important fish habitat have been completed for many ofthe important spawning grounds in Lake Superior (Coberly and Horrall 1980;Goodyear et al. 1982) but need to be expanded to specific sites where detailedmapping could determine quality and quantity of habitat. Few inventories exist forfish habitat in rivers, streams, and important wetlands. Changes in any of these fishhabitats need to be monitored and incorporated into fishery-management programsto determine if net losses occur. This will require those involved in fishery- and

environmental-management programs to work together more closely. Mitigationshould be a last resort when destructive works cannot otherwise be averted. Toachieve no net loss, mitigation will be required for any proposed development thatdisplaces or changes existing habitat. The potential for mitigation should not beconstrued as an opportunity to degrade fish habitat in Lake Superior.
Restore Damaged Habitat
To restore the productive capacity of damaged habitats in Lake Superior, sevenareas were identified by the IJC as Areas of Concern (AOCs) for development ofRAPS. In each AOC, Stage I of the RAP process defines and describes the intensityand scope of environmental problems, the causes for the impairment, and sourcesof the impairment. Stage II of the RAP process identifies remedial measuresrequired to restore beneficial uses-particularly the key actions, time frame, andresponsibilities needed to eliminate uncertainty of remediation.
In Ontario, AOCs include Peninsula Harbour, Jackfish Bay, Nipigon Bay, andThunder Bay. The RAP process in each of these areas has completed Stage I andhas proceeded to Stage II. In Michigan, the AOCs include Torch Lake and DeerLake-Carp Creek/River. The RAPS for these areas have been submitted to the IJCfor review and have progressed toward finalization. In Wisconsin and Minnesota,the AOC is shared for the St. Louis Bay and River system. This RAP hascompleted Stage I and proceeded to Stage II. Detailed information on the statusof the various RAPS can be found in the Review and Evaluation of the Great LakesRemedial Action Plan Program (International Joint Commission 1991).
In addition to these AOCs, several rivers flowing into Lake Superior havehydropower dams that block migration and reduce the productive capacity of thesesystems for anadromous species. Renewal of licenses for these facilities currentlyunder review by the Federal Energy Regulatory Commission (FERC) may becontingent on a change in operation to run-of-the-river flows that should benefitanadromous species. The following rivers have hydropower dams in the process ofFERC licensing that could improve degraded habitat for production of anadromousfishes:
9 4

St. Louis River-Minnesota
Data collection is essentially complete and the final application for licensing has beendistributed. The application is in the final consultation stage. Upon completion, theenvironmental review process will begin.
Iron River-Wisconsin
The dam was removed from the FERC relicensing process at the request of the powercompany. Subsequently, dam removal was approved.
White River--Wisconsin
Fisheries studies were conducted in 1989 and 1990. The draft application has beencompleted and the final application is under review.
Montreal River-Michigan, Wisconsin
Studies of the Saxon Barrier Falls have been completed and licensing has been approved.The Superior Falls Hydroelectric Project draft application has been completed and the finalapplication is being reviewed. Fisheries studies for both projects took place in 1987.
Autrain River-Michigan
Data collection is nearly complete. A draft application should be completed bymidwinter, 1992-93.
Dead River-Michigan
Data collection has been under way for some time but is currently held up because ofarcheological concerns. Data collection is expected to be completed in late 1993.
Ontonagon River-Michigan
Flow studies were completed at the Bond Falls Dam, and results are being reviewed.Entrainment is being studied at the Victoria Dam and is expected to take approximately oneyear.
Sturgeon River-Michigan
Data collection is complete and a license application has been accepted by FERC. Theapplication will undergo environmental review in winter, 1992-93.
9 5

Reduce Contaminant Levels
Excessive contaminant levels-especially of polychlorinated biphenyls (PCBs)and mercury-in Lake Superior fish require the setting of consumption advisoriesfor several important species. These species include lake trout, siscowet, walleye,chinook salmon, northern pike, white sucker, lake whitefish, and yellow perch(Busiahn 1990). The consumption advisories are most severe in the seven AOCs,although some contamination is associated with aerial inputs and sediment recyclingin the main lake.
A major area of point-source pollution not covered in the RAP process is theCopper Range Company in Ontonagon County, Michigan. This company emitsaerial discharges into the Lake Superior ecosystem of 544.2 kg mercury, 22,675.7 kglead, 8,163.3 kg copper, and annual deposition or more than 7.3 million kg ofcontaminated sediments (Michigan Department of Natural Resources, Air PollutionControl, Lansing, MI, file data). A lawsuit was filed by the National WildlifeFederation and Michigan United Conservation Clubs on August 14, 1992, fornon-compliance to the Clean Air Act. Other sources of pollution in the LakeSuperior watershed include Murphy Oil in Superior, Wisconsin, mining activity inMinnesota, and pulp- and paper-mill effluent in Ontario.
Concentrations of PCBs in lake trout have been declining since 1974-75 (D’Itri1988), apparently in response to restricted use of these compounds in the early1970s. Contaminant levels in fish associated with the AOCs will be reduced if RAPSare successfully implemented. Aerial inputs will continue to be a problem until in-and out-of-basin polluters are more fully regulated. Standardized health advisoriesamong agencies on Lake Superior are being developed and will clarify the risk tothe general public. Coordinated sampling and testing on a lakewide basis by allagencies may be more effective for comparing contaminant levels of various species.Standardized long-term monitoring must be initiated to document contaminantreductions.
Coordinate With Other Programs
A Binational Program to Restore and Protect the Lake Superior Basin(Binational Program) was initiated in September 1991 by the U.S. EnvironmentalProtection Agency (USEPA) and Environment Canada; the Province of Ontario;and the states of Minnesota, Michigan, and Wisconsin. The goal of the BinationalProgram is to achieve zero discharge and emission of designated persistent,bioaccumulative toxic substances that degrade the Lake Superior ecosystem. Thisgoal will be pursued through three types of actions including pollution prevention,special protection designations, and controls and regulations. After progress has

been made toward the goal of zero discharge and emissions, the governments planto undertake an integrated ecosystem-based program to protect and restore thebasin. A process to plan for a Lakewide Management Plan (LAMP) process isscheduled to begin in 1992 to provide a framework for all discharge and emission-control programs, and to set the stage for development of a LAMP. The HabitatAdvisory Board (HAB) of the Great Lakes Fishery Commission has advised theLake Superior Committee (LSC) to get involved in formulating the Lake SuperiorLAMP before it is finalized.
The USEPA developed the Environmental Monitoring and Assessment Program(EMAP) in 1988 to monitor ecological status and trends and to develop methodsfor anticipating emerging environmental problems before they reach a crisis.Objectives of the EMAP program include:
1) Estimate current status, extent, changes, and trends in indicators of thecondition of the nation’s ecological resources on a regional basis with knownconfidence.
2) Monitor indicators of pollutant exposure and habitat condition, and associatehuman-induced stresses with ecological condition.
3) Provide statistical summaries and interpretive reports on ecological status andtrends to resource managers and the public.
The Great Lakes is the newest of EMAP’s seven basic resource groups.Planning was initiated in 1990 (Hedtke 1992). As the EMAP sampling plan forLake Superior develops, it is imperative that all fishery agencies become involvedwith the project. It is important that previous work on the lake and expertise withthe Lake Superior fish community not be ignored during the planning process.Ultimately the EMAP program may be contracting for or soliciting assistance fromagencies to aid their project.
HAB has compiled documents that will be useful to the LSC, including draftsof habitat criteria for fish-community goals, a position statement on contaminantsin the Great Lakes, and materials and advice to assist managers in representingfishery issues to RAPS and LAMPS. Increased interaction between HAB, the LSC,and Lake Superior Technical Committee will be beneficial.
97

Habitat Projects, 1989-91
Most of the habitat work for fisheries in Ontario has centered on the AOCslocated at Thunder Bay, Nipigon Bay, Jackfish Bay and Peninsula Harbour. Theseprojects include restoring fish habitat and spawning grounds, improving fish accessto’ spawning areas, creating fish habitat, stocking fish, and increasing publicenvironmental awareness:
Thunder Bay
1)
2)
3)
4)
5)
6)
Habitat-restoration objectives defined and projects implemented (1989-91) include:
Restore walleye spawning habitat and increase access of anadromous fish to spawninghabitat in the Current River.
Construct an island-wetland complex, stabilize creek banks, and remove debris toenhance spawning and improve fish access to McVicar Creek.
Create fisheries habitat, increase productivity, and enhance the carrying capacity of theNeebing-McIntyre Floodway for aquatic life.
Create instream cover, stabilize banks, expand diversity of aquatic flora, and enhancerecreational use of the Kaministiquia River.
Excavate lagoons, extend the littoral zone, construct feeding and shelter areas, andimprove fishing access to the McKellar River-Mission Island area.
Monitor and assess all affected tributaries and determine effectiveness of workcompleted.
Nipigon Bay
Habitat-restoration objectives defined and projects implemented (1989-91) include:
1) Transfer adult walleye from inland lakes to Nipigon Bay and River.
2) Inventory and describe walleye spawning habitat in the Nipigon River.
3) Clean up debris at the old mill site at the mouth of the Nipigon River.
4) Develop a water-management plan that will determine flow regimes for the NipigonRiver.
5) Develop the Nipigon Creek Watershed Management Plan.
98

Jackfish Bay
Habitat-restoration objectives defined and projects implemented (1989-91) include:
1) Impose controls to improve effluent from the Kimberly-Clark pulp mill.
2) Develop a design to restore contaminated sediments and lost fish habitat.
Peninsula Harbor
The habitat-restoration objective defined and project implemented was to develop andevaluate ameliorative techniques for mercury and conduct an experimental treatment in theharbor.
In Michigan, FERC relicensing on the Sturgeon River has drawn attention tothe flow regime that affects lake sturgeon spawning and use of high-quality spawningareas in the river. Adequate flow regimes to improve the spawning area arepresently under debate with the power company. In Wisconsin, the U.S. Fish andWildlife Service has conducted detailed mapping of Gull Island Shoal using side-scan sonar and a remotely operated submersible vehicle. Mitigation involving a fillin Fish Creek Sloughs, Chequamegon Bay, continues with controversy over removalof a power-generating dam on the Iron River. The Wisconsin Department ofNatural Resources is investigating potential fishery benefits to the anadromous LakeSuperior fishery as a result of dam removal. In Minnesota, a detailed map of theGooseberry and Lester River watersheds has been completed, and a preliminarymap of the Lake Superior coastal zone was constructed using geographicalinformation system technology (Johnston et al. 1991). A North Shore Harbors Planwas completed, and the artificial reef located near the Duluth entry continues to bemonitored each fall for spawning activity by lake trout.
Recommendations
The following list of recommendations has been established:
1) The Lake Superior Committee should endorse the International JointCommission’s goal for zero toxic discharge for Lake Superior.
2) Each fishery agency on Lake Superior should ensure they are represented oneach of the Remedial Action Plans in their jurisdiction.
99

3) The Lake Superior Committee should support standard health advisories andlong-term contaminant monitoring by all agencies on Lake Superior.
4) The Lake Superior Committee should coordinate with the Binational Programto restore and protect the Lake Superior basin, and participate in developingthe Lake Superior lakewide management plan before it is final.
5) The Lake Superior Technical Committee should provide input to the fish-community objectives that will be addressed in the lakewide management plan.
6) The Lake Superior Committee should contribute to the EnvironmentalMonitoring and Assessment Program planning process on Lake Superior.
7) Members of the Lake Superior Committee should request the use of newtechnologies (including hydroacoustics, satellite imagery, geographicalinformation system mapping, and side-scan sonar) to identify, evaluate, andprotect critical fisheries habitat in the Lake Superior watershed

ACKNOWLEDGMENTS
Individuals too numerous to mention contributed their efforts to the acquisitionand summary of data presented-we are indebted to each of them and to all pastand present members of the Lake Superior Technical Committee who contributedin some way to the preparation of this report. In addition to those named asauthors of the various papers in this report, data were contributed by MichaelDonofrio (Biological Services Department of the Keweenaw Bay IndianCommunity), Michael P. Gallinat (Red Cliff Fisheries Department), and Joe DanRose, Jr. (Bad River Fisheries Department). The manuscript was reviewed andapproved by members of the Lake Superior Committee - Thomas K. Gorenflo(Chair), Richard L. Hassinger, Neil E. Kmiecik, Michael J. Talbot, Robert T.Thomson, and Bernard R. Ylkanen. Additional reviews of the manuscript wereprovided by John R. M. Kelso and Robert J. Young. Funding for the Michigan andMinnesota portions of this project was provided in part by the Federal Aid in SportFishery Restoration Act.
101

Applegate, V. C., J. H. Howell, A. E. Hall, Jr., and M. A. Smith. 1957. Toxicity of4,346 chemicals to larval lampreys and fishes. US Fish Wildl. Serv. Spec. Sci.Rep. Fish 207: l-157.
Applegate, V. C., J. H. Howell, J. W. Moffett, B. G. H. Johnson, and M. A. Smith.1961. Use of 3-trifluormethyl-4-nitrophenol as a selective sea lamprey larvicide.Great Lakes Fish. Comm. Tech. Rep. 1: 36 p.
Auer, N. A. 1987. Evaluation of an upper peninsula lake sturgeon population:performance report. Mich. Dept. Nat. Resour. Nongame Wildl. Fund andLiving Resour. Small Grants Prog. Final Rep. 39 p.
1988. Survey of the Sturgeon River, Michigan lake sturgeon population:performance report. Mich. Dept. Nat. Resour. Nongame Wildl. Fund andLiving Resour. Small Grants Prog. Final Rep. 31 p.
Bacmeister, A. 1977. The angler’s book of freshwater fish, vol. II. Atlas Publ. Co.Ltd., London. 136 p.
Bagdovitz, M. S., W. Taylor, W. C. Wagner, J. P. Nicolette, and G. R. Spangler.1986. Pink salmon populations in the U. S. waters of Lake Superior, 198184.J. Great Lakes Res. 12: 72-81.
Baldwin, N. S., R. W. Saalfeld, M. A. Ross, and H. J. Buettner. 1979. Commercialfish production in the Great Lakes 1867-1977. Great Lakes Fish. Comm. Tech.Rep. 3: 166 p.
Berg, L. S. 1949. Freshwater fishes of the U.S.S.R. and adjacent countries. Vol.III. 4th ed. Improved and augmented. Academy of Sciences, Moscow, USSR.(Transl. from Russian by Israel Program for Sci. Transl., Jerusalem, 1965).
Biette, R. M., D. P. Dodge, R. L. Hassinger, and T. M. Stauffer. 1981. Life historyand timing of migrations and spawning behavior of rainbow trout (Salmogairdneri) populations of the Great Lakes. Can. J. Fish. Aquat. Sci. 38:1759-1771.
Bronte, C. R. 1992. Results of the interagency assessment of the diet of lake troutin Lake Superior, 1991. Lake Superior Committee Annual Meeting (Minutes).March 18, 1992. Great Lakes Fish. Comm. (in press).

Busiahn, T. R. 1985. Predator responses to fish community changes in LakeSuperior, p. 39-56. In R. L. Eshenroder [ed.] Presented papers from thecouncil of lake committees plenary session on Great Lakes predator-prey issues,March 20, 1985. Great Lakes Fish. Comm. Spec. Pub. 85-3: 34 p.
- [ED.] 1990. Fish community objectives for Lake Superior. Great Lakes Fish.Comm. Spec. Pub. 90-l. 24 p.
Carl, L. M. 1984. Chinook salmon (Oncorhynchus tshawytscha) density, growth,mortality, and movement in two Lake Michigan tributaries. Can. J. Zool. 62:65-71.
Christie, W. J., J. J. Collins, G. W. Eck, C. I. Goddard, J. M. Hoenig, M. Holey, L.D. Jacobson, W. MacCallum, S. J. Nepszy, R. O’Gorman, and J. Selgeby. 1987.Meeting future information needs for Great Lakes fisheries management. Can.J. Fish. Aquat. Sci. 44(Suppl. 2): 439-447.
Close, T. L., and R. L. Hassinger. 1981. Evaluation of Madison, Donaldson andKamloops strains of rainbow trout in Lake Superior. Minn. Dept. Nat. Resour.Div. Fish Wildl. Sect. Fish. Invest. Rep. 372: 17 p.
Close, T. L., S. E. Colvin, and R. L. Hassinger. 1984. Chinook salmon in theMinnesota sport fishery of Lake Superior. Minn. Dept. Nat. Resour. Div. FishWildl. Sect. Fish. Invest. Rep. 380: 31 p.
Coberly, C. E., and R. M. Horrall. 1980. Fish spawning grounds in Wisconsinwaters of the Great Lakes. Marine Studies Cent. Univ. Wisc. Sea Grant Inst.WIS-SG-80-235. 43 p.
Coble, D. W., R. E. Brusewitz, T. W. Fratt, and J. W. Sheirer. 1990. Lake trout,sea lampreys, and overfishing in the upper Great Lakes: a review andreanalysis. Trans. Am. Fish. Soc. 119: 985-995.
Conner, D. J., C. R. Bronte, J. H. Selgeby, and H. L. Collins. 1993. Food ofsalmonine predators in Lake Superior, 1981-87. Great Lakes Fish. Comm.Tech. Rep. 59: 20 p.
D’Itri, F. M. 1988. Contaminants in selected fishes from the upper Great Lakes,p. 51-84. In N. W. Schmidtke [ed.] Toxic contamination in large lakes. Vol.II. Lewis Publishers, Chelsea, MI.
104

Dryer, W. R., L. F. Erkkila, and C. L. Tetzloff. 1965. Food of lake trout in LakeSuperior. Trans. Am. Fish. Soc. 94: 169-176.
Ebener, M. P. 1989. Summary of salmonid fish stocking in Lake Superior. GreatLakes Indian Fish and Wildl. Comm. Admin. Rep. 89-13: 17 p.
Emery, L. 1981. Range extension of pink salmon (Oncorhynchus gorbuscha) intothe lower Great Lakes. Fisheries (Bethesda) 6(2): 7-10.
Fedorova, G. V., and S. A. Vetkasov. 1973. The biological characteristics andabundance of the Lake Ilmen ruffe, Acerina cernua. J. Ichthyol. 14: 836-841.
Fielder, D. G. 1987. An assessment of the introduction of summer steelhead intoMichigan. Mich. Dept. Nat. Resour. Fish. Res. Rep. 1948: 68 p.
Gallinat, M. P. 1993. Food habits of lake trout in management units WI-2 andMI-2 of Lake Superior, 1992. Red Cliff Fish. Dept. Rep. 93-2: 14 p.
Goodyear, C. S., T. A. Edsall, D. M. Ormsby-Dempsey, G. D. Moss, and P. E.Polanski. 1982. Atlas of spawning and nursery areas of Great Lakes fishes.Vol. 2 - Lake Superior. US Fish Wildl. Serv. FWS/OBS-82/52, 114 p.
Great Lakes Fishery Commission. 1980. A joint strategic plan for management ofGreat Lakes fisheries. Great Lakes Fish. Comm. 24 p.
1985. Annual report for the year 1983. Great Lakes Fish. Comm., AnnArbor, MI. 164 p.
Hansen, M. J. [ED.] 1990. Lake Superior: the state of the lake in 1989. GreatLakes Fish. Comm. Spec. Pub. 90-3: 56 p.
Hansen, M. J., and T. M. Stauffer. 1971. Comparative recovery to the creel,movement and growth of rainbow trout stocked in the Great Lakes. Trans. Am.Fish. Soc. 100: 336-349.
Hanson, L. H. 1981. Sterilization of sea lampreys (Petromyzon marinus) byimmersion in an aqueous solution of bisazir. Can. J. Fish. Aquat. Sci. 38:1285-1289.
Hanson, L. H., and P. J. Manion. 1980. Sterility method of pest control and itspotential role in an integrated sea lamprey (Petromyzon marinus) controlprogram. Can. J. Fish. Aquat. Sci. 37: 2108-2117.

Hassinger, R. L. 1974. Evaluation of coho salmon (Oncorhynchus kisutch) as asport fish in Minnesota. Minn. Dept. Nat. Resour. Div. Fish Wildl. Sect. Fish.Invest. Rep. 328: 26 p.
Hassinger, R. L., J. G. Hale, and D. E. Woods. 1974. Steelhead of the Minnesotanorth shore. Minn. Dept. Nat. Resour. Div. Fish Wildl. Sect. Fish. Tech. Bull.11: 38 p.
Hedtke, S. [ED.] 1992. Environmental Monitoring and Assessment Program.EMAP - Great Lakes monitoring and research strategy. U.S. Env. Prot.Agency, Env. Res. Lab. Duluth, MN. 194 p.
Hewett, S. W., and B. L. Johnson. 1992. Fish bioenergetics model 2. Univ. Wisc.Sea Grant Inst. WIS-SG-91-250: 79 p.
Hile, R., P. H. Eschmeyer, and G. F. Lunger. 1951. Status of the lake trout fisheryin Lake Superior. Trans. Am. Fish. Soc. 80: 278312.
Hnath, J. G. [ED.] 1993. Great Lakes fish disease control policy and modelprogram (supersedes September 1985 edition). Great Lakes Fish. Comm. Spec.Pub. 93-l: l-38.
Holcik, J., and J. Mihalik. 1968. Freshwater fishes. The Hamlyn Publ. Group Ltd.,London, U.K. 126 p.
International Joint Commission. 1989. Great Lakes water quality agreement of1978. Int. Joint Comm. 84 p.
. 1991. Review and evaluation of the Great Lakes remedial action plan-program. Int. Joint Comm. 47 p.
Jensen, A. L. 1978. Assessment of the lake trout fishery in Lake Superior, 1929-1950. Trans. Am. Fish. Soc. 107: 543-549.
Johnston, C. A., B. Allen, J. Bonde, J. Sales, and P. Meysenbourg. 1991. Land useand water resources in the Minnesota North Shore drainage basin. Nat.Resourc. Res. Inst. NRRI/TR-91/07: 31 p.
Kaups, M. 1984. Ojibwa fisheries on St. Louis River, Minnesota: 1800-1885. J.Cult. Geog. 5: 61-72.
106

Kelso, J. R. M., and D. B. Nolte. 1990. Abundance of spawning Pacific salmon intwo Lake Superior streams, 1981-87. J. Great Lakes Res. 16: 209-215.
King, E. L., and T. A. Edsall. 1979. Illustrated field guide for the classification ofsea lamprey attack marks on Great Lakes lake trout. Great Lakes Fish. Comm.Spec. Pub. 79-l: 41 p.
Kitchell, J. F. 1983. Energetics, p. 312-338. In P. W. Webb, and D. Weihs [ed.]Fish biomechanics. Praeger Publ., New York, NY.
Klar, G. T., and L. P. Schleen. 1992. Sea lamprey management in the Great Lakesin 1992. Joint annual report of the U.S. Fish and Wildlife Service and theDepartment of Fisheries and Oceans Canada to the Great Lakes FisheryCommission, Ann Arbor, MI.
Kocik, J. F., W. W. Taylor, and W. C. Wagner. 1991. Abundance, size, andrecruitment of pink salmon (Oncorhynchus gorbuscha) in selected Michigantributaries of the upper Great Lakes. J. Great Lakes Res. 17: 203-213.
Krueger, C. C., and B. May. 1987a. Genetic comparison of naturalized rainbowtrout populations among Lake Superior tributaries: differentiation based onallozyme data. Trans. Am. Fish. Soc. 116: 795-806.
1987b. Stock identification of naturalized brown trout in Lake Superiortributaries: differentiation based on allozyme data. Trans. Am. Fish. Soc. 116:785-794.
Krueger, C. C., B. L. Swanson, and J. H. Selgeby. 1986. Evaluation ofhatchery-reared lake trout for reestablishment of populations in the ApostleIslands region of Lake Superior, 1960-84, p. 93-107. In R. H. Stroud [ed.] Fishculture in fisheries management, Am. Fish. Soc. Fish Culture Sect. Fish.Manage. Sect., Bethesda, MD.
Lake Superior Technical Committee. 1986. A lake trout rehabilitation plan forLake Superior. Lake Superior Committee Meeting (Minutes). March 20, 1986.Great Lakes Fish Comm. Appendix IX: 47-64.
Lawrie, A. H., and J. F. Rahrer. 1972. Lake Superior: effects of exploitation andintroductions on the salmonid community. J. Fish. Res. Board Can. 29: 765-776.
Lawrie, A. H., and J. F. Rahrer. 1973. Lake Superior: a case history of the lakeand its fisheries. Great Lakes Fish. Comm. Tech. Rep. 19: 69 p.
107

Lind, E. A. 1977. A review of pikeperch, Stizostedion lucioperca, Eurasian perch,Perca fluviatilis, and ruffe, Gymnocephalus cernua, in Finland. J. Fish. Res.Board Can. 34: 1684-1695.
MacCallum, W. R., and J. H. Selgeby. 1987. Lake Superior revisited 1984. Can.J. Fish. Aquat. Sci. 44(Suppl. 2): 23-36.
MacCrimmon, H. R. 1971. World distribution of rainbow trout (Salmo gairdneri).J. Fish. Res. Board Can. 28: 663-704.
Mikkola, H., H. Okssman, and P. Shemeikka. 1979. Experimental study ofmortality in vendace and whitefish eggs through predation by bottom fauna andfish. Aqua Fennica 9: 68-72.
Moore, H. H., and R. Braem. 1965. Distribution of fishes in U.S. streams tributaryto Lake Superior. U.S. Fish Wildl. Serv. Spec. Sci. Rep. Fish. 516: 61 p.
Negus, M. T. 1992. Evaluation of bioenergetics modeling in the study ofpredator-prey dynamics in Minnesota waters of Lake Superior. Minn. Dept.Nat. Res. Invest. Rep. 414: 65 p.
Nikolskii, G. V. 1954. Special ichthyology. Second revised and enlarged edition.Ministry of Culture, Moscow, USSR. 538 p. (Transl. from Russian by IsraelProgram for Sci. Transl., Jerusalem, 1961).
Peck, J. W. 1970. Straying and reproduction of coho salmon, Oncorhynchus kisutch,planted in a Lake Superior tributary. Trans. Am. Fish. Soc. 99: 591-595.
. 1992. The sport fishery and contribution of hatchery trout and salmon inLake Superior and tributaries at Marquette, Michigan, 1984-87. Mich. Dept.Nat. Res. Fish. Res. Rep. 1975: 62 p.
Peck, J. W., R. G. Schorfhaar, and A. T. Wright. 1974. Status of selected stocksin Lake Superior and recommendations for commercial harvest. Mich. Dept.Nat. Resour. Fish. Tech. Rep. 73-33: 248 p.
Pratt, D. M., W. H. Blust, and J. H. Selgeby. 1992. Ruffe, Gymnocephalus cernuus:newly introduced in North America. Can. J. Fish. Aquat. Sci. 49: 1616-1618.
Priegel, G. R., and T. L. Wirth. 1971. The lake sturgeon: its life history, ecologyand management. Wisc. Dept. Nat. Res. Publ. 240-70: 19 p.
108

Pycha, R. L., and G. R. King. 1975. Changes in the lake trout population ofsouthern Lake Superior in relation to the fishery, the sea lamprey, and stocking,1950-70. Great Lakes Fish. Comm. Tech. Rep. 28: 34 p.
Schleen, L. P., J. Popowski, and G. T. Klar. 1991. Sea lamprey management in theGreat Lakes. Joint annual report of the Department of Fisheries and OceansCanada and the U.S. Fish and Wildlife Service to the Great Lakes FisheryCommission, Ann Arbor, MI.
Scholl, D. K., P. J. Peeters, and S. T. Schram. 1984. Migratory brown trout andrainbow trout populations of the Brule River, Wisconsin. Wisc. Dept. Nat. Res.Fish Manage. Rep. 123: 93 p.
Schoolcraft, H. R. 1821. Narrative journal of travels through the northwest regionsof the United States; extending from Detroit through the great chain ofAmerican lakes to the sources of the Mississippi river, in the year 1820. E. andE. Hosford, Albany, N.Y. 419 p.
Schram, S. T., J. R. Atkinson, and D. L. Pereira. 1991. Lake Superior walleyestocks: status and management, p. 1-22. In P. J. Colby, C. A. Lewis, and R. L.Eshenroder [ed.] Status of walleye in the Great Lakes: case studies preparedfor the 1989 workshop. Great Lakes Fish. Comm Spec. Pub. 91-1.
Schram, S. T., T. L. Margenau, and W. H. Blust. 1992. Population biology andmanagement of the walleye in western Lake Superior. Wisc. Dept. Nat. Resour.Tech. Bull. 177: 28 p.
Seelbach, P. W. 1985. Smolt migration of wild and hatchery-raised coho andchinook salmon in a tributary of northern Lake Michigan. Mich. Dept. Nat.Res. Fish. Res. Rep. 1935: 19 p.
Selgeby, J. H. 1982. Decline of lake herring (Coregonus artedii) in Lake Superior:an analysis of the Wisconsin herring fishery, 1936-78. Can. J. Fish. Aquat. Sci.39: 554-563.
1992. Status of forage populations in Lake Superior, 1991. Lake SuperiorCommittee Meeting (Minutes). March 18, 1992. Great Lakes Fish. Comm. (inpress j.
Shively, J. D., and N. Kmiecik. 1989. Inland fisheries enhancement activities withinthe ceded territory of Wisconsin during 1988. Great Lakes Indian Fish Wildl.Comm. Biol. Serv. Div. Admin. Rep. 89-l: 16 p.

Simon, T. P., and J. T. Vondruska. 1991. Larval identification of the ruffe,Gymnocephalus cernuus (Linnaeus) (Percidae: Percini), in the St. Louis Riverestuary, Lake Superior drainage basin, Minnesota. Can. J. Zool. 69: 436441.
Smith, B. R., and J. J. Tibbles. 1980. Sea lamprey (Petromyzon marinus) in LakesHuron, Michigan, and Superior: history of invasion and control, 1936-78. Can.J. Fish. Aquat. Sci. 37: 1780-1801.
Smith, S. H., H. J. Buettner, and R. Hile. 1961. Fishery statistical districts of theGreat Lakes. Great Lakes Fish. Comm. Tech. Rep. 2: 24 p.
Stauffer, T. M. 1977. Numbers of juvenile salmonids produced in five LakeSuperior tributaries and the effect of juvenile coho salmon on their numbersand growth 1967-74. Mich. Dept. Nat. Res. Fish. Res. Rep. 1846: 29 p.
Swink, W. D., and L. H. Hanson. 1986. Survival from sea lamprey (Petromyzonmarinus) predation by two strains of lake trout (Salvelinus namaycush). Can. J.Fish. Aquat, Sci. 112: 2528-2531.
Wagner, W. C., and T. M. Stauffer. 1978a. Survival of rainbow trout stocked in aLake Superior tributary, 1971-73. Mich. Dept. Nat. Res. Fish. Res. Rep. 1859:18 p.
1978b. Threeyear-old pink salmon from Lake Superior. Mich. Dept. Nat.Res. Fish. Res. Rep. 1861: 7 p.
1982. Distribution and abundance of pink salmon in Michigan tributaries ofthe Great Lakes, 196780. Trans. Am. Fish. Soc. 111: 523-526.
Williams, J. E., J. E. Johnson, D. A. Hendrickson, S. Contreras-Balderas, J. D.Williams, M. Navarro-Mendoza, D. E. McAllister, and J. E. Deacon. 1989.Fishes of North America, endangered, threatened, or of special concern.Fisheries (Bethesda) 6: 2-20.
Wisconsin Department of Natural Resources. 1988. Lake Superior fisheriesmanagement plan, 1988-98. Wisc. Dept. Nat. Res. Bur. Fish. Manage. Admin.Rep. 28: 86 p.
110
