the state of learning disabilities - america's...
TRANSCRIPT

The State ofLearning Disabilities

Our Mission
Th e National Center for Learning Disabilities’ (NCLD) mission is to ensure success
for all individuals with learning disabilities in school, at work and in life. We:
• Connect parents and others with resources, guidance and support so they can
advocate eff ectively for their children.
• Deliver evidence-based tools, resources and professional development to educators to
improve student outcomes.
• Develop policies and engage advocates to strengthen educational rights and
opportunities.
381 Park Avenue South, Suite 1401, New York, NY 10016-8806
Telephone 212.545.7510 Facsimile 212.545.9665
www.LD.org

The State ofLearning DisabilitiesFacts, Trends and Indicators
A biennial publication of the National Center for Learning Disabilities.
Executive Director: James H. Wendorf, National Center for Learning Disabilities
Project Director: Laura Kaloi, National Center for Learning Disabilities
Author: Candace Cortiella, Th e Advocacy Institute
Publication Design: Deb Tanner
Citation: Cortiella, C. (2011). Th e State of Learning Disabilities. New York, NY: National
Center for Learning Disabilities.
© 2011 by National Center for Learning Disabilities, Inc. All rights reserved. Th is
publication is provided free of charge by the National Center for Learning Disabilities.
Wide dissemination is encouraged! Copies may be made and distributed in keeping with
the following guidelines: Th e publication must be reproduced in its entirety, including pages
containing information about the National Center for Learning Disabilities. Copies of the
publication may not be sold.

Forewordby Donald D. Deshler
Chairperson, NCLD Professional Advisory Board
Since 1977, the National Center for Learning Disabilities (NCLD) has provided essential
information to parents and teachers, developed key programs to promote best practice and
advocated for federal policies that strengthen and protect individuals’ rights. Two years ago, NCLD
published Th e State of Learning Disabilities 2009 — a groundbreaking report that captured key
information and data to help inform decisions made about individuals with learning disabilities
(LD). I am pleased to introduce this biennial update — Th e State of Learning Disabilities: Facts,
Trends and Indicators.
In this report, you’ll be re-introduced to what a learning disability is and what it is not.
Understanding this disorder is important because the public frequently confuses an LD with
conditions such as attention defi cit/hyperactivity disorder (AD/HD), autism, intellectual
disabilities, deafness and blindness, as evidenced by a recent survey conducted by GfK Roper.
New data are presented showing the number of school-age children with LD who receive
federally-authorized special education services has declined by 14 percent over the past decade.
State-by-state information about the number of students with LD is also presented. Despite
these data, the media frequently reports that the number of students identifi ed continues to show
signifi cant increases. When these two misperceptions are combined — that students with LD have
intellectual disabilities or autism and that identifi cation is on a steep and persistent rise — the
education debate about system reform, accountability and use of resources frequently turns against
embracing students with LD as worthy participants in our general education system. Hopefully, the
information in this report helps to correct these misperceptions.
NCLD’s mission is sharply defi ned by the experience of parents and their children. Th e data here
show that while students with LD are spending the majority of their school day in the general
education classroom, they continue to struggle to make adequate gains toward grade level standards.
Signifi cant academic defi cits put them at great risk for not completing high school with a regular
diploma, threatening their ability to pursue career training, go to college and do meaningful
work. High dropout rates continue to threaten the success of these students, particularly those
from minority groups. Ultimately, every individual with LD must be provided the opportunity to
graduate from high school, live an independent life and contribute to our society and economy in
the most meaningful ways.
At NCLD, we are very familiar with the struggles of the individuals with LD and their families and
this report highlights that the outcomes, while better than two years ago, still lag behind the general
population. It is our hope that by providing this information to the public, we can work together
to create the policies, programs and helpful information that parents and teachers need to ensure
individuals with LD achieve their goals.
Sincerely,
Donald D. Deshler, Ph.D. is the Williamson Family Distinguished Professor of Special Education and director of the Center for Research on Learning (CRL) at the University of Kansas. A former junior high school teacher, Deshler’s fi rst-hand experience with at-risk students inspired him to pursue better methods for teaching and helping these students succeed in school and beyond.

The State of Learning Disabilities 1
Key Facts . . . . . . . . . . . . . . . . . . . . . . . . . . . . . . . . . . . . . . . .2
Overview . . . . . . . . . . . . . . . . . . . . . . . . . . . . . . . . . . . . . . . .3Legal Protections for People with LD . . . . . . . . . . . . . . . . . . . . . . . . 4
What We Know About LD . . . . . . . . . . . . . . . . . . . . . . . . . . . . . . . . . . . 5
Common Types of Learning Disabilities . . . . . . . . . . . . . . . . . . . . . 6
LD in the U.S. . . . . . . . . . . . . . . . . . . . . . . . . . . . . . . . . . . . .7
LD in the Schools . . . . . . . . . . . . . . . . . . . . . . . . . . . . . . 10Prevalence . . . . . . . . . . . . . . . . . . . . . . . . . . . . . . . . . . . . . . . . . . . . . . . . 10
Disproportionality . . . . . . . . . . . . . . . . . . . . . . . . . . . . . . . . . . . . . . . . . 12
Gender . . . . . . . . . . . . . . . . . . . . . . . . . . . . . . . . . . . . . . . . . . . . . . . . . . . . 13
Instructional Environments . . . . . . . . . . . . . . . . . . . . . . . . . . . . . . . . 13
Curricula Modifi cations . . . . . . . . . . . . . . . . . . . . . . . . . . . . . . . . . . . . 14
Technology Use . . . . . . . . . . . . . . . . . . . . . . . . . . . . . . . . . . . . . . . . . . . 14
Teacher Training and Support . . . . . . . . . . . . . . . . . . . . . . . . . . . . . . 14
Academic Skill Defi cits . . . . . . . . . . . . . . . . . . . . . . . . . . . . . . . . . . . . . 15
Behavioral Challenges . . . . . . . . . . . . . . . . . . . . . . . . . . . . . . . . . . . . . 16
National Assessment of Educational Progress (NAEP) . . . . . . . 17
Retention . . . . . . . . . . . . . . . . . . . . . . . . . . . . . . . . . . . . . . . . . . . . . . . . . 18
Dropping Out . . . . . . . . . . . . . . . . . . . . . . . . . . . . . . . . . . . . . . . . . . . . . 18
Graduation . . . . . . . . . . . . . . . . . . . . . . . . . . . . . . . . . . . . . . . . . . . . . . . . 18
High School Exit Exams . . . . . . . . . . . . . . . . . . . . . . . . . . . . . . . . . . . . 19
Access to Accelerated Programs . . . . . . . . . . . . . . . . . . . . . . . . . . . 20
Cost of Special Education . . . . . . . . . . . . . . . . . . . . . . . . . . . . . . . . . . 20
Post School Aspirations . . . . . . . . . . . . . . . . . . . . . . . . . . . . . . . . . . . . 21
GfK Roper 2010 Study . . . . . . . . . . . . . . . . . . . . . . . . . . . . . . . . . . . . . 23
State-by-State LD Percent of Special Education . . . . . . . . . . . . 25
State-by-State Change in LD Rates, 2004-2009 . . . . . . . . . . . . . 26
LD beyond School . . . . . . . . . . . . . . . . . . . . . . . . . . . . . 27Postsecondary Education . . . . . . . . . . . . . . . . . . . . . . . . . . . . . . . . . . 27
Employment . . . . . . . . . . . . . . . . . . . . . . . . . . . . . . . . . . . . . . . . . . . . . . 29
Conclusion . . . . . . . . . . . . . . . . . . . . . . . . . . . . . . . . . . . . 31
Contents

Key Facts
■ 2.5 million public school students—or about
5% of all students in public schools—were
identifi ed as having learning disabilities in
2009 and were eligible to receive educational
assistance under the federal Individuals with
Disabilities Education Act (IDEA).
■ The number of school-age children with
learning disabilities who receive these
Federally-authorized special education services
escalated rapidly during the late 1980s and
1990s. However, during the last decade (2000-
2009) the number of children identifi ed as LD
in public schools has declined by 14%.
■ Males comprise almost two-thirds of school-
age students with LD who receive special
education services.
■ Conditions such as AD/HD, autism, intellectual
disabilities, deafness and blindness are
frequently confused with LD.
■ The cost of educating a student with LD is 1.6
times the expenditure for a general education
student. This is dramatically less than the
average cost for all students with disabilities,
which runs 1.9 times the cost for a general
education student.
■ In 2008, 62% of students with LD spent 80%
or more of their in-school time in general
education classrooms. In 2000, that fi gure was
just 40%.
■ Students with LD are retained in grade much
more often than those without disabilities. In
addition, they are involved in school disciplinary
actions at a much higher rate than their non-
disabled peers.
■ Only a small percentage—estimated at between
25% and 35%—of students with LD are being
provided with assistive technology to support
their instruction and learning.
■ The high school dropout rate among
students with LD was 22% in 2008, down from
40% in 1999.
■ More students with LD are graduating with a
regular high school diploma—64% in 2008—up
from 52% a decade earlier.
■ Students with LD go on to postsecondary
education at a much lower rate than their non-
disabled peers, and of those who do, few seek
supports in college and few earn undergraduate
or advanced degrees.
■ In 2005, 55% of adults with LD (ages 18-64) were
employed compared to 76% of those without LD,
6% were unemployed vs. 3%, and 39% were not
in the labor force vs. 21%.
■ Few adults with LD access workplace
accommodations or understand their rights
under disability anti-discrimination laws.
2 National Center for Learning Disabilities

The State of Learning Disabilities 3
It’s necessary to defi ne what a learning disability (LD)
is in order to understand how Americans with learning
disabilities are functioning today in schools, colleges and
workplaces.
Th e most commonly used defi nition, from the federal
special education law, the Individuals with Disabilities
Education Act (IDEA), uses the term specifi c learning
disability (SLD). According to the IDEA, SLD is “a
disorder in one or more of the basic psychological processes
involved in understanding or in using language, spoken
or written, which disorder may manifest itself in the
imperfect ability to listen, think, speak, read, write, spell,
or do mathematical calculations. Such term includes such
conditions as perceptual disabilities, brain injury, minimal
brain dysfunction, dyslexia, and developmental aphasia. Such
term does not include a learning problem that is primarily
the result of visual, hearing, or motor disabilities, of mental
retardation, of emotional disturbance, or of environmental,
cultural, or economic disadvantage.” (20 U.S.C. § 1401 (30))
Th e National Joint Committee on Learning Disabilities
(NJCLD), a national committee of representatives of
organizations committed to the education and welfare
of individuals with learning disabilities (see box), off ers
another defi nition of learning disabilities (LD). According
to NJCLD “Learning disabilities is a general term that refers
to a heterogeneous group of disorders manifested by signifi cant
diffi culties in the acquisition and use of listening, speaking,
reading, writing, reasoning, or mathematical skills. Th ese
disorders are intrinsic to the individual, presumed to be due to
central nervous system dysfunction, and may occur across the life
span. Problems in self-regulatory behaviors, social perception,
and social interaction may exist with learning disabilities
but do not, by themselves, constitute a learning disability.
Although learning disabilities may occur concomitantly with
other disabilities (e.g., sensory impairment, mental retardation,
serious emotional disturbance), or with extrinsic infl uences
(such as cultural diff erences, insuffi cient or inappropriate
instruction), they are not the result of those conditions or
infl uences.” (NJCLD, 1990).
Members of the National Joint Committee
on Learning Disabilities (NJCLD)
American Speech-Language-Hearing Association
(ASHA)
Association on Higher Education and Disability
(AHEAD)
Association of Educational Therapists (AET)
Council for Learning Disabilities (CLD)
Division for Communicative Disabilities and Deafness
(DCDD), Council for Exceptional Children (CEC);
Division for Learning Disabilities (DLD), Council for
Exceptional Children (CEC)
International Dyslexia Association (IDA)
International Reading Association (IRA)
Learning Ally (formerly Recording for Blind and
Dyslexic)
Learning Disabilities Association of America (LDA)
National Association of School Psychologists (NASP)
National Center for Learning Disabilities (NCLD)
Overview

Legal Protections for People with LD
students eligible for special education services under
the IDEA are also eligible under Section 504, while the
reverse is not true.
■ The Americans with Disabilities Act (ADA) is
another civil rights measure that protects people
with disabilities from discrimination in schools, the
workplace and other environments. Like Section 504,
the ADA is not a funding mechanism and it protects
people who have a physical or mental impairment
that heavily restricts one or more major life activities.
Since learning is considered such an activity under
the ADA, students served under IDEA also are covered
by this law.
In addition, people with disabilities are protected
from discrimination in employment by the ADA. While
the ADA doesn’t require employers to hire unqualifi ed
applicants with disabilities, it does prohibit
employers from using unnecessary qualifi cation
standards to weed out applicants with disabilities;
relying on inaccurate job descriptions to determine
that an employee with a disability can no longer
perform her job; and failing to provide reasonable
accommodations which do not cause undue
hardship on the employer.
Recent Update to the ADA: Since its passage in 1990,
courts had interpreted the defi nition of disability
under the ADA so narrowly that hardly anyone
could meet it. To correct this, Congress passed the
Americans with Disabilities Act (ADA) Amendments
Act of 2008, which became eff ective on January
1, 2009. The ADA Amendments Act achieved the
following:
- lowered the threshold for what constitutes
“substantially limits a major life activity.”
- clarifi ed that the benefi cial eff ects of “mitigating
measures” should not be considered when
determining the degree to which a disability
impacts a major life activity.
- expanded the list of “major life activities” to include
reading, thinking, concentrating.
As a result, more people are now able to satisfy
the defi nition of disability, gain access to
reasonable accommodations and be protected
from discrimination, including those with learning
disabilities.
Four federal laws—two that are education-specifi c
and two that are intended to prevent discrimination—
establish and undergird the rights of children and
adults with LD to receive special education services, as
well as fair treatment in public schools, postsecondary
education and the workplace.
■ Children and youth with disabilities, who are 3-21
years old, receive special education services through
the Individuals with Disabilities Education
Act (IDEA). This law guarantees each child a free,
appropriate public education tailored to his or her
individual needs, as well as the right of the children
and their parents or guardians to timely evaluation,
access to all meetings and paperwork, transition
planning and related services. IDEA specifi es that
children with any of 13 possible disabling conditions,
including LD, are eligible for these services.
■ Elementary and Secondary Education Act
(ESEA) (the current version is known as the No
Child Left Behind Act or NCLB) is the nation’s main
federal education law. First passed in 1965 as part of
President Johnson’s war on poverty, it now aff ects all
public school students from kindergarten through
grade 12. ESEA’s major strength is that it compels
schools to meet rigorous standards for educational
content and student achievement (i.e., what and how
well students should be learning). It also requires
schools to measure yearly student progress to see if it
is adequate. Under ESEA, schools must provide data
on overall student progress as well as progress made
by groups such as students with disabilities.
■ Discrimination against people with disabilities in
federally funded programs and activities is prohibited
under Section 504 of the Rehabilitation Act of
1973 (Section 504). While this civil rights law doesn’t
fund programs, it does permit the withdrawal of
funds from programs that fail to comply with the
law. Persons with a physical or mental impairment
that substantially restricts one or more major life
activities are eligible for services under Section
504. Some schools use Section 504 to support LD
students needing only simple accommodations or
modifi cations. Children and youth with AD/HD who
don’t need more comprehensive special education
support also are frequently served under this law. All
4 National Center for Learning Disabilities

What We Know About LD
Learning disabilities arise from neurological diff erences in
brain structure and function and aff ect the brain’s ability
to store, process or communicate information. While it is
unclear what creates the neurological disorders that lead to
learning disabilities, heredity is considered a major factor
because learning disabilities seem to occur within members
of the same families; someone with LD may have parents
or other relatives with similar diffi culties. Other possible
causes include pre-natal and birth problems—
a list that covers illness or injury, drug and alcohol use
during pregnancy, low birth weight, oxygen deprivation
and premature or prolonged labor—as well as childhood
experiences of traumatic injuries, severe nutritional
deprivation, and exposure to poisonous substances such
as lead.
Learning disabilities are not caused by visual, hearing or
motor disabilities, low intelligence, mental retardation,
emotional disturbance, or cultural, environmental or
economic disadvantages. However, there is a higher
incidence of learning disabilities among people living
in poverty—apparently because poor people are more
likely to be exposed to poor nutrition, ingested and
environmental toxins (e.g., lead, tobacco and alcohol)
and other risk factors during early and critical stages of
development.
Learning disabilities are both real and permanent, and
there is a growing body of data to support neurobiological
causes including new evidence documenting that families
are genetically linked to LD. Some people never learn
that learning disabilities are responsible for their lifelong
problems with reading, writing or comprehension. Others
aren’t identifi ed as having LD until they are adults. Many
suff er from low self-esteem, fall into juvenile delinquency
or fail academically because their LD is not discovered
and appropriate help provided until it’s too late to prevent
these and other psychological problems from happening.
Because learning disabilities are usually spotted in children
after they have started school, the public perception is that
LD mostly aff ects children and adolescents. It is true that
LD is common enough to aff ect an estimated 4%-6% of
public school students. (Th e percentage is much higher
when individuals who struggle with reading for other
reasons are considered.) Yet learning disabilities last a
lifetime and vary in the impact they have on those aff ected.
Th at said, individuals with LD are not powerless against
their disabilities. Over time, they can learn to compensate
for their weaknesses, and if they receive eff ective support
early enough, most people with LD can develop good
academic and related skills and enjoy great success
academically and professionally. Today’s plethora of
technology tools has been particularly helpful to both
children and adults with LD. Such technological supports
as screen readers, audio books, and speech-to-text software
enable people with LD to bypass their defi cits and enjoy
the same level of access to information as those without
LD.
Scientifi c inquiry is creating more reason for hope, too.
Top researchers and experts in the education, psychology,
speech-language and medical communities are using
methods like new imaging techniques such as fMRIs to
explore the brain for the origins of these disorders and how
brain activity maps onto such behaviors as learning to read,
counting, paying attention and organization and memory.
Th e result is a deeper understanding of diff erent types of
learning disabilities, and an expanding menu of eff ective
tools and strategies to support people with LD.
The State of Learning Disabilities 5

Common Types of
Learning Disabilities
Th e most prevalent LD is dyslexia, where people have
trouble understanding written language. Researchers have
learned the neurological basis of dyslexia—also known as
reading disability or reading disorder—by using separate
techniques to measure blood fl ow and electrical activity in
the brain. Th ey discovered that people with dyslexia do not
decipher printed words in the same way that non-dyslexic
readers do.
Dyslexia is a specifi c learning disability that
is neurological in origin. It is characterized by
diffi culties with accurate and/or fl uent word
recognition and by poor spelling and decoding
abilities. These diffi culties typically result from
a defi cit in the phonological component of
language that is often unexpected in relation
to other cognitive abilities and the provision
of eff ective classroom instruction. Secondary
consequences may include problems in reading
comprehension and reduced reading experience
that can impede growth of vocabulary and
background knowledge.
Formal defi nition of dyslexia developed by the International
Dyslexia Association. Also used by the National Institute of
Child Health and Human Development (NICHD).
Other common learning disabilities include the following:
■ Dyscalculia – where a person has trouble solving
arithmetic problems and grasping math concepts.
■ Dysgraphia – where a person struggles to form
letters or write within a defi ned space.
■ Auditory and Visual Processing Disorders
– where a person with normal hearing and vision
nevertheless has diffi culty understanding and using
verbal or written language.
■ Non-verbal Learning Disabilities – specifi c
disorders which originate in the right hemisphere
of the brain and cause problems with visual-spatial,
intuitive, organizational, evaluative and holistic
processing functions.
Attention-Defi cit/Hyperactivity Disorder (AD/HD) is
sometimes mistakenly thought to be a learning disability.
While this isn’t the case, AD/HD does occur in about
one third of people with LD. AD/HD results in diffi culty
concentrating, staying focused or paying attention to
specifi c tasks. Research has demonstrated that AD/HD
has a very strong neurobiological basis. Th e co-occurrence
of AD/HD and LD refl ects the eff ect of shared genetics
and environmental factors that contribute to the
development of both disorders.
6 National Center for Learning Disabilities

Overall, reliable information on the numbers of Americans
who have learning disabilities is scarce. While states are
required to report on the number of public school students
receiving special education due to LD, surveys based on
parent or self-reporting are the only source of information
about the prevalence of LD across all ages. Th e most recent
data comes from the 2005 U.S. Survey of Income and
Program Participation (SIPP), a sample of the U.S. civilian
non-institutionalized population. Th e SIPP is sponsored
by the U.S. Census Bureau to collect source and amount of
income, labor force information, program participation and
eligibility data, and general demographic characteristics
to measure the eff ectiveness of existing federal, state, and
local programs. It is also used to estimate future costs and
coverage for government programs, such as food stamps,
and to provide improved statistics on the distribution
of income and measures of economic well-being in the
LD in the U.S.
country. SIPP’s survey design is a continuous series of
national panels, with a sample size of 36,000 interviewed
households. Th e SIPP periodically asks all adults surveyed
the question, “Do you have a learning disability such as
dyslexia?”
Th e SIPP shows the LD prevalence rate among the U.S.
population (ages 6 and older) to be 1.8%, totaling 4.67
million Americans. Th is represents roughly one percent of
all those reporting some level of disability—18.7% of the
population. Th e SIPP found a parent-reported LD rate of
3% among school-age children (2.4% ages 6-11 and 3.4%
ages 12-17). Th is is slightly less than the rate reported by
schools, which is just under 4% of the resident school-age
population and over 5% of public school enrollment. Rates
of LD among adults range from 2.7% of the population
ages 18-24 to as low as .4% for those over age 85.
The State of Learning Disabilities 7
Source: H. Stephen Kaye, Unpublished tabulations of 2005 data from the U.S. Survey of Income and Program Participation
Prevalence of learning disability
by age group

Males are much more likely to have acknowledged learning
disabilities than females. Th e ratio is particularly high
among school-age children—with almost twice as many
boys than girls reported by family members as having LD
(3.9 % vs. 2.0 %). Among adults, the ratio is smaller —1.8
% male vs. 1.5% female among those ages 18-64 and .8%
male vs. .5% female among those 65 and older.
Learning disabilities aff ect Whites, Blacks, and Latinos
about equally across all ages. Th e rate of reported LD is
signifi cantly higher among other/multi-race populations
(such as Native Americans) and substantially lower among
Asians.
People living in poverty are more likely to report having
learning disabilities than the rest of the population.
Families below the poverty line reported that 4.1% of their
children (ages 6-17) have learning disabilities. For families
that were not poor, that fi gure was 2.7%. Th e same is
true for adults in poverty, who self-reported their learning
disabilities at twice the rate of adults who didn’t live in
poverty (3.1% vs. 1.5% for adults ages 18-64 and 1.2% vs.
.6% for those age 65 or older).
Source: H. Stephen Kaye, Unpublished tabulations of 2005 data from the U.S. Survey of Income and Program Participation
Prevalence of learning disability
by age group and poverty status
8 National Center for Learning Disabilities
Prevalence of acknowledged LD by
age group and race/ethnicity
Source: H. Stephen Kaye, Unpublished tabulations of 2005 data from the U.S. Survey of Income and Program Participation
Prevalence of learning disability
by age group and sex
Source: H. Stephen Kaye, Unpublished tabulations of 2005 data from the U.S. Survey of Income and Program Participation

The State of Learning Disabilities 9
Adults with LD face challenges with employment,
most likely due to a lack of educational attainment. Th e
unemployment rate for those with LD was twice (5.7%)
that of those without LD as well as for those reporting not
to be in the labor force (39.5% with LD vs. 20.9% without
LD). Just over half of adults with LD reported being
employed (54.8%) while the rate for those without LD was
76.4%.
Since many incidences of learning disabilities are never
diagnosed or admitted, surveys based on self-reporting,
such as SIPP, may sharply under-estimate how widespread
learning disabilities really are in the U.S.
While the SIPP data cited here indicates a prevalence
rate of just under 2% among Americans 5 years and
older, the true prevalence of learning disabilities in the
U.S. is estimated at between 4-6% —in both children
and adults—based on best available data. However, given
that there is currently no “gold-standard” approach to
identifying learning disabilities, reports of prevalence
range from 4-6% (students served in schools) to as high
as 17-20% (research sample). Th ere is, however, general
agreement that dyslexia (specifi c reading disability) is the
most common and, to date, the most well-researched type
of LD, aff ecting 80% or more of all individuals with LD.
Th e data also suggest that the diff erences in LD incidence
among boys and girls are exaggerated. Males of all ages
and their families report that they have learning disabilities
twice as often as females and their families. Th e school-
age population, as reported by states, shows even more
disparity between boys and girls. However, based on
anecdotal data from clinical settings, it is likely that
learning disabilities are present in roughly equal numbers
of males and females and that the higher rate among males
is due to males and their families being more willing to
reveal the presence of learning disabilities.
Source: H. Stephen Kaye, Unpublished tabulations of 2005 data from the U.S. Survey of Income and Program Participation
Labor force status of
working-age adults (18-64)
Much more is known about learning disabilities among the
school-age population. Information comes from both data
submitted annually to the U.S. Department of Education
as well as large-scale longitudinal studies that have
provided signifi cant information about students with LD.
Prevalence
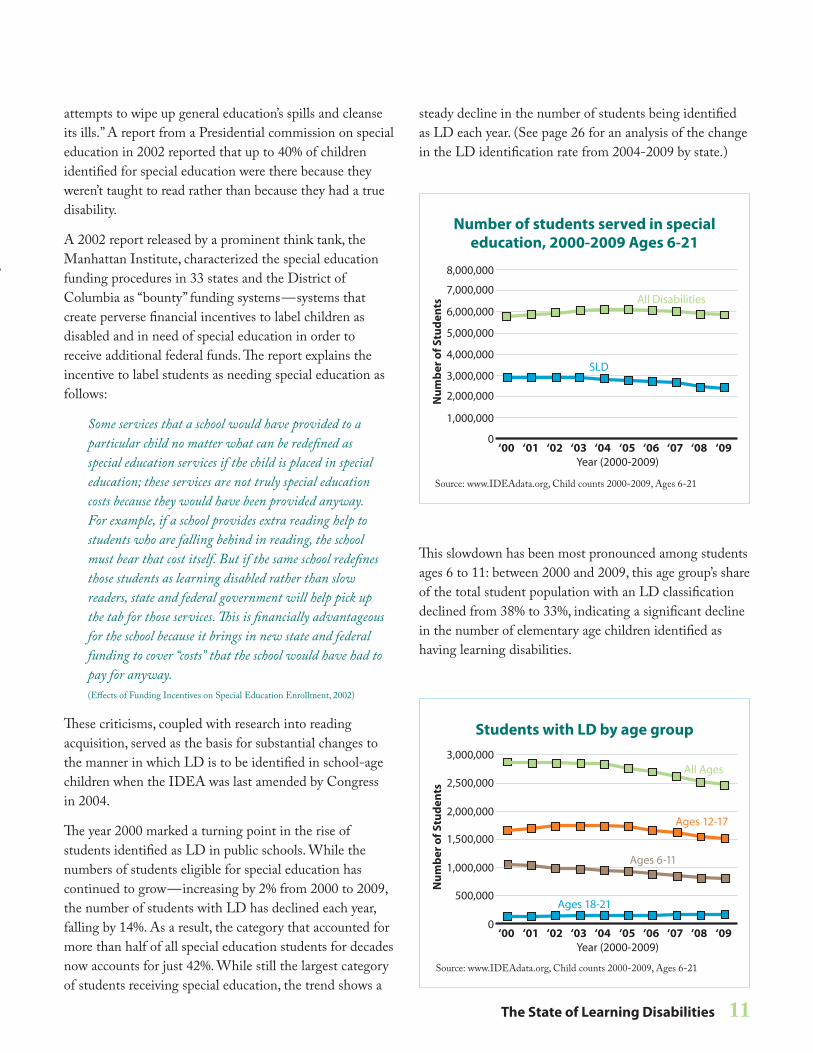
In 2009, there were 2.5 million American public school
students (approximately 5% of the total public school
enrollment) identifi ed with learning disabilities so
that they could be served under the Individuals with
Disabilities Education Act (IDEA). Th ese students
represented 42% of the 5.9 million school-age children
with all kinds of disabilities who receive special education
services. (Th is percentage varies across states. See page 25
for more information.)
Much has been written about the increase in the number
of children identifi ed as having LD in the years following
enactment of the nation’s special education law in 1975
–then known as the Education for All Handicapped
Children Act (EHA). In fact, the LD category grew
more than 300% between 1976 and 2000. Th e group also
represented over 50% of all students eligible for special
education during most of that time period.
Th is dramatic rise in numbers drew criticism from
researchers and policymakers alike. In a landmark paper
published in 2001, Rethinking Learning Disabilities,
researchers suggested that the category was a “catch-all”
for low-achieving students and that, from its inception as
a category, LD has served as a “sociological sponge that
LD in the Schools
School-age students eligible for special
education services are reported only by their
primary disability. However, many students have
multiple disabling conditions and may receive
a variety of services to address conditions that
interfere with their educational progress. A
2001 study found that schools reported 30% of
students with a primary disability of LD also had
a secondary disability while 7% had two or three
additional disabilities, such as Speech/Language
Impairments or Emotional Disturbance.
(Source: SEELS Wave 1 School Program Survey, 2001)
10 National Center for Learning Disabilities
Source: www.IDEAdata.org, 2009 Child Count, Ages 6-21
Special education students
by disability category, 2009
The State of Learning Disabilities 11
attempts to wipe up general education’s spills and cleanse
its ills.” A report from a Presidential commission on special
education in 2002 reported that up to 40% of children
identifi ed for special education were there because they
weren’t taught to read rather than because they had a true
disability.
A 2002 report released by a prominent think tank, the
Manhattan Institute, characterized the special education
funding procedures in 33 states and the District of
Columbia as “bounty” funding systems—systems that
create perverse fi nancial incentives to label children as
disabled and in need of special education in order to
receive additional federal funds. Th e report explains the
incentive to label students as needing special education as
follows:
Some services that a school would have provided to a
particular child no matter what can be redefi ned as
special education services if the child is placed in special
education; these services are not truly special education
costs because they would have been provided anyway.
For example, if a school provides extra reading help to
students who are falling behind in reading, the school
must bear that cost itself. But if the same school redefi nes
those students as learning disabled rather than slow
readers, state and federal government will help pick up
the tab for those services. Th is is fi nancially advantageous
for the school because it brings in new state and federal
funding to cover “costs” that the school would have had to
pay for anyway.
(Eff ects of Funding Incentives on Special Education Enrollment, 2002)
Th ese criticisms, coupled with research into reading
acquisition, served as the basis for substantial changes to
the manner in which LD is to be identifi ed in school-age
children when the IDEA was last amended by Congress
in 2004.
Th e year 2000 marked a turning point in the rise of
students identifi ed as LD in public schools. While the
numbers of students eligible for special education has
continued to grow—increasing by 2% from 2000 to 2009,
the number of students with LD has declined each year,
falling by 14%. As a result, the category that accounted for
more than half of all special education students for decades
now accounts for just 42%. While still the largest category
of students receiving special education, the trend shows a
steady decline in the number of students being identifi ed
as LD each year. (See page 26 for an analysis of the change
in the LD identifi cation rate from 2004-2009 by state.)
Th is slowdown has been most pronounced among students
ages 6 to 11: between 2000 and 2009, this age group’s share
of the total student population with an LD classifi cation
declined from 38% to 33%, indicating a signifi cant decline
in the number of elementary age children identifi ed as
having learning disabilities.
Students with LD by age group
Source: www.IDEAdata.org, Child counts 2000-2009, Ages 6-21
Source: www.IDEAdata.org, Child counts 2000-2009, Ages 6-21
Number of students served in special
education, 2000-2009 Ages 6-21

Why are fewer students being classifi ed as having LD in
the elementary grades? Several possible reasons for this
change include:
■ Expansion and attention to early childhood
education including universal preschool and the use
of early screenings and diagnostic evaluations to
support school readiness;
■ Improvements in reading instruction provided in
general education, making reading diffi culties—a
characteristic of most students classifi ed as LD
—less prevalent in our nation’s elementary schools;
■ Shift in identifi cation approaches, including the
use of Response-to-Intervention (RTI) (see box),
that might result in greater numbers of struggling
students receiving early assistance in general
education and reducing the need for special
education classifi cation;
■ Changes in the defi nitions of various special
education disability categories. In 1999, Attention
Defi cit Disorder (ADD) and Attention-Defi cit/
Hyperactivity Disorder (AD/HD) were added
to the list of conditions under the Other Health
Impairments (OHI) category in IDEA regulations.
Since this change, the number of students identifi ed
as eligible for special education services under
the OHI category has increased 207%. Th e OHI
category now represents 11% of all students
receiving special education. While students with
ADD or AD/HD do not represent the entire
population of the OHI category, much of this
increase is attributable to the regulatory change in
1999. Prior to 1999, many of these students may
have been assigned to the LD category.
Despite this slowdown in the numbers of students
identifi ed as LD, once identifi ed and found eligible
for special education services, few students lose that
distinction (i.e., are declassifi ed) during their school career.
In 2008 slightly less than 3% of students (ages 14-21) with
LD left special education.
What is Response-
to-Intervention (RTI)?
Response-to-Intervention (RTI) is a multi-tier
approach to the early identifi cation and support
of students with learning and behavior needs.
The RTI process begins with high-quality
instruction and universal screening of all children
in the general education classroom. Struggling
learners are provided with interventions at
increasing levels of intensity to accelerate
their rate of learning. These services may be
provided by a variety of personnel, including
general education teachers, special educators,
and specialists. Progress is closely monitored
to assess both the learning rate and level of
performance of individual students. Educational
decisions about the intensity and duration of
interventions are based on individual student
response to instruction. RTI is designed for use
when making decisions in preschool, general
education and special education, creating
a well-integrated system of instruction and
intervention guided by child outcome data.
For more information on Response-to-Intervention
visit the RTI Action Network at www.RTInetwork.org.
Disproportionality
Disproportionality is the over- or under-representation
of minority students in special education. In other words,
there is a disproportionate number—either a signifi cantly
larger or smaller percentage—of students from a specifi c
minority background receiving special education services
than the percentage of that minority in the population
generally.
According to school-reported data, learning disabilities
do not fall evenly across racial and ethnic groups. Both
Hispanic and Black students are over-represented while
Asian/Pacifi c Islander students are signifi cantly under-
represented.
12 National Center for Learning Disabilities

The State of Learning Disabilities 13
Th e National Longitudinal Transition Studies (see box)
found a signifi cant increase in the percent of students
with identifi ed LD ages 15-17 who did not use primarily
English at home— changing from just 1.3% in 1987
to 15.4% in 2001. Th e demands of communicating in
two languages and accommodating two cultures could
contribute to some degree in the disproportionate number
of Hispanic students classifi ed as LD.
Instructional Environments
Over the years, the trend has been for more and more
students with disabilities—including LD—to spend most
of their instructional time in general education classrooms.
Th e practice of educating students with disabilities in
general education classrooms along with typical students—
frequently referred to as “inclusion” —is associated with
better outcomes for students with disabilities. Th e IDEA
also requires that students with disabilities be educated
with students who are not disabled to the maximum
extent appropriate. Special classes, separate schooling, or
other removal from the regular educational environment
should occur only if the nature or severity of the disability
is such that education in regular classes with the use
of supplemental aids and services cannot be achieved
satisfactorily.
Between 2000 and 2008, the percentage of students with
LD who spent more than 80% of their time in regular
school classrooms rose steadily, from 40% to 62%. No
other category of special education students—except
National Longitudinal
Transition Studies
The U.S. Department of Education has funded
two groundbreaking studies on the experiences
of secondary school students with disabilities
nationwide. The National Longitudinal Transition
Study (NLTS) was conducted from 1985 through
1993 and tracked, collected data from, and
reported on the experiences of more than 8,000
secondary school students with disabilities
nationwide. The National Longitudinal Transition
Study-2 (NLTS2), a follow-up of the original NLTS,
includes 12,000 youth nationwide who were
ages 13 through 16 at the start of the study
(2000). Information collected over 10 years
from parents, youth, and schools is providing
a national picture of the experiences and
achievements of young people as they transition
into early adulthood.
For more information on the NLTS and NLTS2 visit
www.NLTS2.org.
Gender
Male students with LD who get special education services
far outnumber their female counterparts: almost two-
thirds of students ages 6-17 in this category are boys,
despite an almost even split among males (51.4%) and
females (48.6%) in the overall public school population.
Males with disabilities are known to have poorer classroom
engagement behaviors and are more likely to face in-school
disciplinary actions and arrest in the community.
Source: IDEAdata.org, 2007 Child Count, Ages 6-21
Race/ethnicity distribution

students with speech or language impairments—had
higher percentages spending more time in general
education than students with LD. However, examining
the rate of inclusion among states reveals signifi cant
variance. According to information collected by the U.S.
Department of Education, the percentage of students with
LD who spent 80% or more of their school day in general
education during the 2007-2008 school year ranged across
states from a high of 89% in Alabama to a low of 14% in
Hawaii.
Technology Use
Access to technology supports within general education
classes seems to be yet another diffi culty for students
with LD. Th e NLTS2 found that just 6% were using a
computer for activities (when computer use wasn’t allowed
for other students), only 8% were using recorded text
such as books on tape and just 1% were using computer
software designed for students with disabilities. In 1999,
AT researcher Diane Golden estimated that only 25%-
35% of students with LD were using any type of assistive
technology to support their instruction.
Teacher Training and Support
Th ough most students with LD receive most of their
instruction in general education classes, only 60% of
students with LD have general education teachers who
receive any information about their needs, indicating
a need for more teacher training on the characteristics
and instructional strategies essential to success for these
students. Only about half of all students have teachers who
receive advice from special educators or other staff on how
to meet those needs.
14 National Center for Learning Disabilities
Curricula Modifi cations
According to the NLTS2, few students with LD receive
substantial modifi cations to the curriculum in general
education classes. One-third (35%) use the general
education curriculum without any modifi cation while
half (52%) receive some modifi cation. Only 11% use the
general education curriculum with substantial modifi cation
and just 2% use a specialized curriculum.
Where students with LD spend their
school day, 2000-2008
Source: www.IDEAdata.org, Educational Environments by Disability, Ages 6-21, 2000, 2002, 2004, 2006, 2008
Source: National Longitudinal Transition Study 2, 2003
Extent of curriculum modifi cations
for students with LD in general education
academic classes

The State of Learning Disabilities 15
Academic Skills Defi cits
Academic achievement for students with LD at the
secondary level is signifi cantly below grade level in both
reading and mathematics according to the NLTS2.
■ In both academic areas, at least a fi fth of students
with LD are fi ve or more grade levels behind their
enrolled grade.
■ Close to half of students with LD (45% for reading,
44% for math) test more than three grade levels
behind.
■ Nearly a quarter (23% for both academic areas) are
at least one grade level behind.
On average, students with LD are 3.4 years behind their
enrolled grade level in reading and 3.2 years behind in
math. Th ese discrepancies validate researchers’ fi ndings that
the achievement gap between students with LD and those
without widens as students move from one grade to the
next.
Th ese discrepancies are also signifi cant given how
dependent learning in any subject is on sound skills
in reading and math. Accessing, understanding, and
mastering academic subjects when basic skills are
signifi cantly below grade level pose major challenges for
students with LD. Th e frustration and low self-esteem that
According to one national survey (Quality Counts 2004:
Count Me In, Education Week), just 57% of special
education teachers claimed to be “very” familiar with the
academic content their states require them to teach. Just
seven states mandate that the Individualized Education
Programs (IEPs) for students with disabilities conform
with state content standards. Receiving instruction from
teachers who are knowledgeable about state academic
content standards is crucial if students with LD are to be
able to perform profi ciently on state assessments.
Another study (Study of State and Local Implementation and
Impact of IDEA) took a look at the preparedness of general
and special education teachers as reported by school
principals in the 2004-2005 school year. In that study,
fewer than half of the principals surveyed (43%) reported
that most general educators were well prepared to improve
the performance of students with IEPs and increase access
to the general education curriculum (41%).
Quality instruction for students with LD also relies
on teachers trained and certifi ed in special education,
specifi cally learning disabilities. Latest data from the
U.S. Department of Education (2006) indicate that 11%
of special educators are not highly qualifi ed (as defi ned
by IDEA). According to the American Association for
Employment in Education, the nation has experienced a
shortage of special educators trained in learning disabilities
each year throughout the decade 1996-2006.
Th e shortage of qualifi ed special education teachers is
compounded by an attrition rate that signifi cantly outpaces
that for general education teachers. Attrition is particularly
high among beginning special education teachers. Districts
frequently cope with these chronic shortages and turnover
issues by:
■ Employing uncertifi ed/substitute teachers;
■ Raising caseloads;
■ Increasing use of paraprofessionals.
Achievement gap between students
with LD and students without LD

16 National Center for Learning Disabilities
Behavioral Challenges
Behavior is a major challenge for many youth with
learning disabilities. Th e NLTS2 found that one-third of
LD youths are suspended or expelled from school at some
point. According to school-reported data, students with
LD accounted for 52% of all students with disabilities
who experienced disciplinary actions (in or out of school
suspension or expulsion) during the 2007-2008 school
year. More than 613,000 students with LD faced such
actions—representing 24% of all students identifi ed with
LD. In some districts, students with disabilities are two
to three times more likely to be subject to discipline than
students without disabilities.
Th e zero tolerance approach to school discipline—such
as the expulsion or suspension of students as an automatic
consequence of serious acts of misconduct, particularly
the possession of weapons or drugs—negatively impacts
minority students and students with disabilities to a greater
degree than other students. Studies have shown that these
students constitute a disproportionately large percentage
of expulsions and suspensions. Meanwhile, the disciplinary
actions restrict access to appropriate education, often
exacerbating the problems of students with disabilities
and achievement diffi culties, and thereby increasing the
probability that these students will not complete high
school.
Many students both with and without disabilities who
pose serious behavior problems end up in the juvenile
justice system, where the problems are often exacerbated.
A disproportionately high rate of incarcerated juveniles
(over 14%) are identifi ed with LD. In fact, LD is the
second most common disability found among incarcerated
juveniles.
While the IDEA provides students with disabilities certain
protections from disciplinary actions such as expulsion
when their misconduct is directly related to their disability,
this high rate of disciplinary actions suggests the need for
more systemic approaches to controlling school conduct,
including school-wide systems of support that include
proactive strategies for defi ning, teaching, and supporting
appropriate student behaviors to create positive school
environments. Such approaches have been developed and
demonstrated to be highly eff ective—not just for students
with disabilities but for all students.
can result from incomplete or poorly developed reading
and math skills could contribute to the high dropout rate
among students with LD.
Discrepency between tested
and actual grade level in Reading
Source: National Longitudinal Transition Study 2, 2003
Discrepency between tested
and actual grade level in Math
Source: National Longitudinal Transition Study 2, 2003

The State of Learning Disabilities 17
National Assessment of Educational Progress (NAEP)
The only nationally administered measure of student
academic achievement in reading and math—the
National Assessment of Educational Progress, or
NAEP—indicates some improvement is occurring
among students with disabilities.
■ While students without disabilities performed
at the “basic or above” level twice the rate of
students with disabilities on the 2009 NAEP for
Grade 4 reading, those with disabilities made
substantially larger gains in their scores than non-
disabled students.
■ In 4th grade, 35% of students with disabilities
performed at the basic, profi cient or advanced
reading levels, up from 29% in 2003. 70% of
students without disabilities scored at or above
basic in 2009, up from 67% in 2003.
■ In 8th grade reading, students with disabilities
scoring at the basic, profi cient or advanced
levels increased from 32% to 38% while the
performance of students without disabilities was
essentially unchanged.
■ In math, 59% of 4th grade students with
disabilities performed at the basic, profi cient
or advanced levels— up from 51% in 2003. The
portion of the non-disabled student population
that was at or above the basic, profi cient or
advanced level improved 5% during the same
period.
■ Also in math, 36% of 8th grade students with
disabilities scored at the basic, profi cient or
advanced levels, up from 29% in 2003. Among
students without disabilities, the percentage who
did that well declined, from 77% to 73%.
There is a continuing concern that the NAEP
sampling does not include enough students
with disabilities to be considered nationally
representative of all students with disabilities. The
NAEP reported that 28% of those students with
disabilities selected to participate in the 2009
Reading sample were excluded for various reasons.
This issue and its underlying causes are currently
under investigation by the National Assessment
Governing Board, the group that oversees the NAEP.
Percent of students scoring at or above basic level
Source: National Assessment of Educational Progress, Reading and Mathematics Grades 4 and 8 National Results 2003, 2009, available at www.nationsreportcard.gov

Retention
Students with disabilities—including those with LD—
are much more likely to be retained in grades than their
peers who don’t have disabilities. According to parental
surveys in the NLTS2, almost one-third of students with
disabilities had been held back in a grade at least once.
Th e estimated retention rate for all students is signifi cantly
lower. In 2004, U.S. Census data revealed that 9.6 percent
of U.S. youth ages 16-19 had been retained in grade one or
more times.
School-age children with disabilities who are retained
in grade are disproportionately Black and from lower-
income households. Th e National Association of School
Psychologists (1998) noted that retention is linked
to increased behavior problems that become more
pronounced as children reach adolescence.
Retaining students who are struggling can delay the
prompt identifi cation of LD. Studies confi rm that
retention is sometimes used before diagnostic testing—
testing that can point schools toward eff ective remedial
help for specifi c learning problems. Retention is also
known to highly correlate with dropping out of school. In
fact, dropouts are fi ve times more likely to have repeated
a grade than high school graduates. Students who repeat
two grades have a possibility of dropping out that is near
100 percent. Th us, the high rate of grade retention among
students with disabilities may be directly related to the
unacceptably high drop-out rate of this group.
Dropping Out
Th e dropout rate for students with LD has fallen steadily
over the past decade. While 40% of students with LD
dropped out of school in 2000, 22% dropped out in 2009.
Some of this decline is due to the rise in awarding of
alternative types of certifi cates. While the dropout rate
has shown signifi cant improvement, students with LD
continue to drop out of school at a rate much higher than
students without disabilities. Among all students with
disabilities, those with LD experience one of the highest
dropout rates— only one other category of students —
Emotional Disturbance, or ED —has a higher dropout
rate.
Graduation
Th e rate at which students with LD leave high school with
a regular high school diploma has been gradually rising for
a decade, yet still remains well below the graduation rate
for students without special education status. Far more
students received a regular high school diploma in 2009
than in 2000 (64% vs. 52%).
At the same time, the number of students with LD
receiving a certifi cate of completion (something other than
a regular high school diploma) has increased dramatically
over the past decade. Just 7% of students received a
certifi cate in 2000; in 2009 that percentage rose to 13%.
Th is may be due in part to the increase in the number of
states instituting several diploma options (i.e., alternative
means of graduating from high school other than a regular
high school diploma) such as a “certifi cate of completion”
over the past decade. Th e expanding array of diff erentiated
or alternative diplomas is, to a large extent, a response
to the high school exit exams more and more states are
requiring all students to pass in order to receive a regular
high school diploma. Since such exams pose diffi culty
for several groups of students, including students with
disabilities, many states off er alternative diplomas. Some
alternatives are available to all students, while others are
reserved only for students with disabilities.
How students with disabilities exit high school varies
signifi cantly across racial/ethnic groups. According to
18 National Center for Learning Disabilities
Source: www.IDEAdata.org, Exiting by Disability, Ages 14-21+, 1999-2008
How students with LD exit high school

The State of Learning Disabilities 19
High School Exit Exams
A 2010 study by the Center on Education Policy found
that 28 states required high school exit exams in the 2009-
2010 school year (up from 26 in 2009). Th ese exams are
having a signifi cant impact on a substantial portion of the
nation’s 5.9 million school-age students with disabilities,
72% of whom are educated in states with exit exams
currently in place.
Several legal challenges have been raised regarding the
participation of students with disabilities in high stakes
exit exams. Th e more recent challenges have focused on
the provision of appropriate test accommodations for
students with disabilities, so that they may have an equal
opportunity to show their knowledge. Th ese challenges
have met with varied success.
■ In some cases, states have agreed to exempt students
with disabilities from exit exams—allowing them
to be awarded a diploma without meeting the
requirements.
■ Some states reduce the number of credits needed or
lower the performance criteria for a regular diploma
for students with disabilities.
school-reported data for the 2008-2009 school year,
White students with disabilities enjoyed the highest rate
of graduation with a regular diploma at 68%. Black and
Hispanic students with disabilities graduated at much
lower rates of 45% and 50% respectively. Dropout rates
among Black, Hispanic and American Indian/Alaska
Native students with disabilities far exceed that of White
or Asian students with disabilities.
Source: www.IDEAdata.org, Exiting by Race/Ethnicity and Basis of Exit, Ages 14-21+, 2008
How students with disabilities exit
high school by race/ethnic group,
school year 2008-2009
Source: Center on Education Policy, 2010
States with mandatory
exit exams in 2010:
AL,AK, AR, AZ, CA, FL, GA, ID, IN, IA, MA, MN, MS, NC1, NJ, NM, NV, NY, OH, SC, TN2, TX, VA, WA
States phasing in exit
exams by 2018 but not yet
withholding diplomas:
OK (2012), OR (2012), RI (2012)
States with no mandatory
exit exam:
CO, CT, DE, DC, HI, IL, IA, KS, KY, ME, MI, MO, MT, NE, NH, ND, PA, SD, UT, VT, WV, WI, WY
1NC will no longer withhold diplomas based on exit exam requirements beginning with the graduating class of 20112TN will no longer withhold diplomas based on exit exam requirements beginning with the graduating class of 2012
States with mandatory high school exit exams

Such approaches could set up situations that result in
less than adequate attention to the academic success of
students with disabilities and lead to lowered expectations.
Because students with LD have high dropout rates and
experience negative outcomes when they do not have
a high school diploma, the alternate types of diplomas
off ered in many states may provide some benefi t to
students. However, the impact of these alternative
diplomas on postsecondary education and employment
opportunities may be signifi cant. For example, whether
options such as certifi cates, IEP/special education
diplomas, occupational/vocational diplomas, and other
alternative types of diplomas equate to a high school
diploma—particularly in relation to future adult outcomes
and access to postsecondary education and to future
employment and earnings—is not well understood.
Equally relevant is the potential these alternatives pose
with regard to lowering expectations for students with
LD. For example, decisions about what type of diploma
students with LD should pursue might be made too early
in the student’s school career and might be based on
the path of least resistance versus a more rigorous path
required to obtain a regular diploma. Clearly, the impact
of high stakes exit exams and alternative diploma routes
on students with disabilities needs further study and closer
scrutiny.
Access to Accelerated Programs
In addition to graduation policies that might contribute to
lowered expectations for students with disabilities, in late
2007 the U.S. Department of Education(USED) acted
upon reports of school policies that restricted access for
students with disabilities to accelerated programs such
as Advanced Placement and International Baccalaureate
classes.
Specifi cally, it had been reported that some schools and
school districts had refused to allow qualifi ed students with
disabilities to participate in such programs. Reports also
indicated that schools and school districts, as a condition
of participation in such programs, had required qualifi ed
students with disabilities to give up any specialized services
that had been designed to meet their individual needs as
20 National Center for Learning Disabilities
a condition of their participation. In response, the USED
Offi ce for Civil Rights (OCR) issued a “Dear Colleague”
letter clarifying that limiting access by students with
disabilities to challenging academic programs on the
basis of their disability violates both Section 504 and the
ADA. Additionally, it was made clear that the imposition
of conditions on participation in accelerated classes or
programs by qualifi ed students with disabilities (e.g. the
forfeiture of necessary special education or related aids and
services) amounts to a denial of a free appropriate public
education under both IDEA and Section 504. (Source:
USED OCR, December 26, 2007)
Cost of Special Education
Th e cost of delivering special education is the subject of
much discussion and consternation. Because states are
charged with the responsibility of identifying and serving
children with disabilities by way of the federal law IDEA
yet receive federal funds to pay for only a portion of the
cost of serving students, some policy offi cials and school
administrators refer to special education as an “unfunded
mandate.” Th is presumption is, at best, an exaggeration
and, at worst, a misstatement given that students
with disabilities have an equal right to a free public
education under the Fourteenth Amendment of the U.S.
Constitution. Th e federal law mandating access to public
education for students with disabilities grew out of state-
Source: Total Expenditures for Students with Disabilities, 1999-2000: Spending Variation by Disability, Special Education Expenditures Project
Special education services

The State of Learning Disabilities 21
level litigation involving massive denial of access to schools
for students with disabilities.
Claims regarding the cost of special education can also be
somewhat exaggerated. A comprehensive study of special
education expenditures in the 1999–2000 school year
(Total Expenditures for Students with Disabilities, 1999-
2000: Spending Variation by Disability, Special Education
Expenditures Project or SEEP) found the cost to provide
education, including special education to students with
LD, was 1.6 times the expenditure for general education
students—the lowest expenditure of all disability
categories.
Of the amount spent on special education services for
students with LD, 49% was attributable to resource
specialist services—a way of serving students included
in general education classes by providing some level
of supplemental services, generally in basic skills such
as reading and math—rather than in separate special
education classes.
Given that this group represents a substantial portion of
all students receiving special education, the overall cost
of special education might be overstated by many states
and districts. Since students with disabilities are entitled
to the same per pupil expenditure as that spent on general
education students—regardless of what that expenditure
provides—only the excess cost of educating students with
disabilities should be considered as special education costs.
Post School Aspirations
Students with LD express goals for post high school life
that are very similar to students without LD. A majority
(54%) have the goal to attend a two- or four-year college,
43% would like to attend a vocational training program.
More than half (57%) want to obtain competitive
employment while half (50%) want to live independently.
Parents of students with LD express expectations diff erent
from those expressed by students. Among parents of
students with LD, few expressed confi dence that their
child would graduate from either a two- or four-year
college (14% and 10% respectively). Th is is in sharp
contrast to the 54% of students with LD who had a
stated goal of attending either a two- or four-year college.
Parental expectations are important because research
has found them to be associated with both student
achievement and post school outcomes. Unfortunately,
low parental expectations align more with current levels
of postsecondary success than do the expectations that
students with LD have for themselves.
Percentage of parents
who think the student:
Defi nitely/
Defi nitely Probably
Expected to: will won’t
Graduate from high school with a regular diploma 59 11
Graduate from a 2-year college 14 57
Graduate from a 4-year college 10 64
Get a paid job 93 1
Live independently 62 8
Source: National Longitudinal Transition Study 2, 2003
Parental expectations
According to the IDEA, planning for transition to
post school life is a required part of every student’s
Individualized Education Program (IEP) and must begin
no later than age 16. Transition planning involves the
development of appropriate measurable postsecondary
goals based on age-appropriate transition assessments
Post school goals of students with LD
Source: National Longitudinal Transition Study 2, 2003
related to training, education, employment, and, where
appropriate, independent living skills. Th e particular
services needed to assist in reaching those goals must also
be articulated in the student’s IEP. Services can include
course of study (such as those courses needed to qualify
for postsecondary education), related services, community
experiences, employment, daily living skills, and functional
vocational evaluations.
Th e development of a student’s transition plan, including
specifi c goals and services needed to achieve those goals,
is intended to be a team process that includes the teacher,
parent, student, and representatives from outside agencies
as required. However, according to the NLTS2 fi ndings,
almost half of parents (45%) reported that school staff
alone most often determined the student’s transition goals
and the team process determined the goals only about one-
third of the time. Th e majority (65%) of parents reported
that the transition planning for their child was either
somewhat useful, not very useful or not useful at all, while
35% reported it to be very useful. One-third of parents
reported that they would want more involvement in the
IEP and transition planning process while two-thirds felt
they had the right amount of involvement.
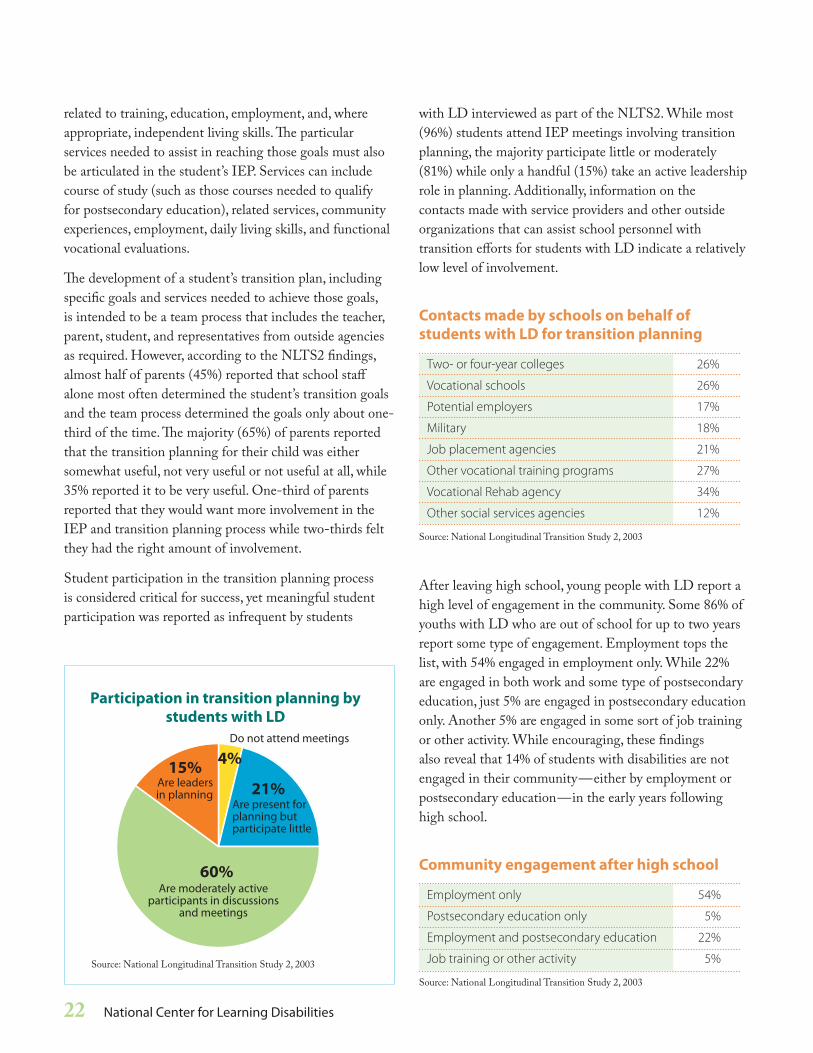
Student participation in the transition planning process
is considered critical for success, yet meaningful student
participation was reported as infrequent by students
with LD interviewed as part of the NLTS2. While most
(96%) students attend IEP meetings involving transition
planning, the majority participate little or moderately
(81%) while only a handful (15%) take an active leadership
role in planning. Additionally, information on the
contacts made with service providers and other outside
organizations that can assist school personnel with
transition eff orts for students with LD indicate a relatively
low level of involvement.
Contacts made by schools on behalf of
students with LD for transition planning
Two- or four-year colleges 26%
Vocational schools 26%
Potential employers 17%
Military 18%
Job placement agencies 21%
Other vocational training programs 27%
Vocational Rehab agency 34%
Other social services agencies 12%
Source: National Longitudinal Transition Study 2, 2003
After leaving high school, young people with LD report a
high level of engagement in the community. Some 86% of
youths with LD who are out of school for up to two years
report some type of engagement. Employment tops the
list, with 54% engaged in employment only. While 22%
are engaged in both work and some type of postsecondary
education, just 5% are engaged in postsecondary education
only. Another 5% are engaged in some sort of job training
or other activity. While encouraging, these fi ndings
also reveal that 14% of students with disabilities are not
engaged in their community—either by employment or
postsecondary education—in the early years following
high school.
Community engagement after high school
Employment only 54%
Postsecondary education only 5%
Employment and postsecondary education 22%
Job training or other activity 5%
Source: National Longitudinal Transition Study 2, 2003
22 National Center for Learning Disabilities
Source: National Longitudinal Transition Study 2, 2003
Participation in transition planning by
students with LD

The State of Learning Disabilities 23
GfK Roper 2010 Study on Public Attitudes about
Children with Learning Disabilities
increasingly embrace the foundational notion that
individuals have diff erences that lead them to learn
most eff ectively in diff erent ways—and that children
with learning disabilities have average or above average
intelligence. Th e 2010 study found that:
■ Americans and educators agree that children learn in
diff erent ways. Up nine points from 2004, eight in ten
Americans (79%) agree (strongly/somewhat) that kids
learn in diff erent ways. Virtually all educators (99%) say
the same.
■ Th e number of Americans who say they are familiar
with learning disabilities is on the rise. In 2010, the
general public is much more likely to say they have
heard or read “a lot” about learning disabilities now than
in both 2004 and 1999.
■ Th e general public is now more likely to recognize
the fact that children with learning disabilities are of
average or above average intelligence. Eight in ten
Americans (80%) consider the statement “children with
learning disabilities are just as smart as you and me” to
be accurate.
■ Almost all parents today agree children can learn
to compensate for a learning disability with proper
instruction.
“Americans and educators agree that
children learn in diff erent ways.”
Troubling Trends
While the public’s perception of learning disabilities
has improved, Tremaine Foundation President, Stewart
Hudson, noted that “our fi ndings show an alarming lack
of knowledge by parents and educators about learning
disabilities. Th is is extremely troubling. We talk a lot about
the achievement gap in our education system, but unless
parents, educators and school administrators understand
learning disabilities and proactively address them, the
Th e Emily Hall Tremaine Foundation has commissioned
studies by GfK Roper to examine the public’s attitudes
about learning disabilities (LD) since 1995. Th e 2010
report on Americans’ and educators’ understanding and
attitudes about LD was the fourth in the series, providing
periodic measurements that serve as important tools for
understanding the progress —or lack of progress—that
is being made in how both parents and the United States
educational system are addressing the needs of children
who learn diff erently.
Th e study conducted telephone interviews with a
nationally representative sample of American adults with
sub-samples of parents, teachers and school administrators.
It identifi ed some advances in people’s understanding
about learning disabilities—and support for tailoring
the educational process to match children’s diff ering
learning styles. Yet, the poll also highlighted persistent
misperceptions that present barriers for anyone interested
in ensuring that children with learning diff erences are
helped to achieve their full potential.
Gratifying Trends
Since 1995, when this research initiative began, the issue
of learning disabilities has gained some traction. Both
the general public and parents, as well as educators,
Source: Tremaine Foundation, 2010
Percent of Americans who say it’s accurate
that “children with learning disabilities
are just as smart as you and me”

■ A majority of the public and parents mistakenly believe
learning disabilities are often a product of the home
environment children are raised in. Four in ten teachers
and three in ten administrators also agree.
■ A majority (51%) think that what people call “learning
disabilities” are the result of laziness.
■ Many parents continue to ignore “potential signs of
trouble” – instead choosing to wait and see if their child
will “grow out of it.” A sizable number of parents believe
a 5-to-8 year-old child will grow out of such warning
signs as trouble using a pen or pencil, matching letters
with their sounds and making friends. Parents are
even more forgiving of these traits in 3-to-4 year-old
children, which makes early diagnoses and intervention
more diffi cult.
■ Th e vast majority of educators continue to consider that
a lack of support from parents in helping their children
learn is a major challenge confronting schools working
with children with LD.
■ Despite confusion among educators about learning
disabilities, eight in ten say they feel confi dent teaching
children with LD.
“Our fi ndings show an alarming lack of
knowledge by parents and educators about
learning disabilities.”
Stewart J. Hudson, President
Emily Hall Tremaine Foundation
achievement gap will never close.” Th e 2010 study found
that:
■ Seven out of ten parents, educators and school
administrators incorrectly link learning disabilities with
mental retardation and autism. Half or more of school
administrators do as well.
■ Almost four in ten mistakenly associate learning
disabilities with sensory impairments like blindness and
deafness.
24 National Center for Learning Disabilities
Established in 1986, the Emily Hall Tremaine Foundation focuses its grant-making in the areas of art, environment
and learning disabilities. Learn more about the foundation and the 2010 study on attitudes about learning disabilities at
www.TremaineFoundation.org
Source: Tremaine Foundation, 2010
Percent of parents saying how they would
assess each of the following behaviors
from a typical 3 to 4 year-old child
Source: Tremaine Foundation, 2010
Percent who think each of the following
are associated with learning disabilities

The State of Learning Disabilities 25
Source: IDEA Part B 2009 Child Count, Ages 6-21, www.IDEAdata.org
Specifi c Learning Disability percent of total special education by state in 2009

IDEA Part B Child Count, Specifi c Learning Disability, Ages 6-21 Percent ChangeState 2004-2005 2005-2006 2006-2007 2007-2008 2008-2009 2009-2010 ‘04-’09
Alabama 41,635 41,696 40,509 38,882 37,863 37,396 -10.0%Alaska 8,098 7,872 7,545 7,410 7,450 7,492 -7.5%Arizona 58,639 59,323 59,076 55,909 55,832 55,287 -5.7%Arkansas 22,475 22,845 22,568 20,912 19,663 19,289 -14.2%California 324,318 312,622 303,042 293,652 286,859 282,792 -12.8%Colorado 31,175 30,500 29,996 29,795 29,991 30,430 -2.4%Connecticut 25,875 24,537 22,960 22,960 21,867 21,634 -16.4%Delaware 9,192 9,173 9,297 9,230 9,060 8,980 -2.3%District of Columbia 6,132 5,384 4,987 4,608 4,624 4,644 -24.3%Florida 179,783 179,783 176,939 172,077 166,494 159,096 -11.5%Georgia 53,274 54,322 54,387 52,842 51,520 51,937 -2.5%Hawaii 9,801 9,455 9,061 8,634 8,404 8,400 -14.3%Idaho 11,940 11,320 10,447 9,400 8,888 8,329 -30.2%Illinois 141,131 140,904 140,798 135,745 130,080 124,450 -11.8%Indiana 62,909 62,969 62,187 60,741 59,258 56,892 -9.6%Iowa 37,469 37,106 36,972 36,322 37,038 36,438 -2.8%Kansas 23,936 23,992 23,785 23,374 23,229 23,188 -3.1%Kentucky 16,789 15,338 14,408 13,728 13,587 13,891 -17.3%Louisiana 34,071 29,475 27,919 26,469 25,104 24,391 -28.4%Maine 12,006 11,344 10,642 10,038 9,816 9,504 -20.8%Maryland 38,543 37,074 34,845 33,211 33,332 32,874 -14.7%Massachusetts 68,742 66,102 63,974 61,927 59,739 55,585 -19.1%Michigan 96,459 94,646 92,486 88,358 85,370 82,273 -14.7%Minnesota 35,185 33,875 32,385 31,320 30,525 30,626 -13.0%Mississippi 30,994 29,722 27,704 24,682 21,966 19,597 -36.8%Missouri 55,664 52,260 48,041 44,028 40,058 37,216 -33.1%Montana 9,299 8,826 8,368 7,955 7,454 7,087 -23.8%Nebraska 15,172 14,696 14,291 14,037 13,670 13,903 -8.4%Nevada 25,288 25,294 25,203 24,711 24,248 23,138 -8.5%New Hampshire 13,376 13,267 12,996 12,983 11,988 11,619 -13.1%New Jersey 106,306 104,134 100,022 96,519 84,480 86,585 -18.6%New Mexico 24,211 22,389 20,253 18,550 17,888 17,776 -26.6%New York 180,695 174,692 170,959 167,073 160,314 163,136 -9.7%North Carolina 67,010 64,535 63,006 62,476 62,659 63,133 -5.8%North Dakota 4,970 4,590 4,377 4,307 4,223 4,159 -16.3%Ohio 97,519 100,563 102,837 104,375 102,469 102,129 4.7%Oklahoma 46,717 46,587 45,371 44,106 41,414 40,658 -13.0%Oregon 31,104 30,060 28,992 28,042 27,664 27,681 -11.0%Pennsylvania 142,385 144,224 143,318 141,013 138,113 134,525 -5.5%Puerto Rico 45,929 51,349 52,295 53,211 56,239 62,927 37.0%Rhode Island 13,215 12,572 11,835 10,957 10,277 9,633 -27.1%South Carolina 47,764 47,708 46,872 45,587 44,296 43,334 -9.3%South Dakota 6,971 6,688 6,560 6,443 6,255 6,153 -11.7%Tennessee 48,279 46,558 45,866 45,166 43,576 43,171 -10.6%Texas 251,732 243,509 231,900 214,728 197,280 186,933 -25.7%Utah 28,493 28,216 27,601 27,617 27,909 28,928 1.5%Vermont 4,261 4,143 4,097 4,128 -3.1%Virginia 67,359 65,505 63,202 60,517 58,733 57,478 -14.7%Washington 47,740 46,470 44,852 44,002 44,134 44,375 -7.0%West Virginia 16,819 15,873 14,936 14,134 13,535 12,864 -23.5%Wisconsin 46,866 45,043 42,850 40,671 38,569 37,574 -19.8%Wyoming 4,910 4,763 4,686 4,524 4,451 4,370 -11.0%
Totals 2,830,625 2,775,893 2,704,505 2,609,958 2,519,455 2,480,028 -12.4%
Source: IDEA Part B Child Count, 2004-2009, Ages 6-21, www.IDEAdata.org
26 National Center for Learning Disabilities

LD beyond School
Although the number of students being identifi ed with
LD has declined for a decade, signifi cant numbers of
students with LD leave high school each year. Based
on the information presented here, a large number of
these students will begin their adult lives with signifi cant
defi cits in essential academic skills at a time when
reading and math requirements for today’s workplaces are
rising quickly, according to the American Management
Association. Th ese defi cits pose signifi cant challenges for
success in both postsecondary education and employment.
Postsecondary Education
Despite the requirements for transition planning in the
IDEA as discussed earlier, major obstacles remain for
students wishing to continue their education beyond high
school. Th ere are major disconnects between high school
and postsecondary education; most important among them
include:
■ Diff erent Legal Frameworks: While school-
age students are covered by the IDEA, the legal
framework for postsecondary education is quite
diff erent. Colleges and universities are guided by two
civil rights laws—Section 504 and the ADA (see box
on page 4). Neither of these laws requires any type
of individualized or specialized educational services
(such as those outlined in student IEPs under IDEA).
Protections and services guaranteed by Section 504
and the ADA are dependent on self-disclosure and
limited to reasonable accommodations.
■ Inconsistent Documentation Requirements:
Documentation of the presence of a disability and
its impact on learning is required to access supports
and services at colleges and universities. According to
a recent report by the National Joint Committee on
Learning Disabilities, current assessment practices in
high school do not always create documentation that
is consistent with the requirements of postsecondary
institutions. Furthermore, IDEA does not require that
high schools conduct or update evaluations in order
to generate documentation required by postsecondary
institutions. Consequently, students with LD often
fi nd themselves unable to fulfi ll a postsecondary
institution’s requirements with available assessment
information from high school. Complicating this
issue further is the lack of uniformity across colleges
and universities in determining whether an individual
qualifi es as a person with a disability under Section
504 or Title II of the ADA and is therefore eligible
to receive services and accommodations. Lastly,
there is a lack of consistency across postsecondary
education settings regarding the supports and services
available to students with documented LD, making it
challenging for students to identify institutions that
will provide appropriate services.
A lack of preparedness for success in postsecondary
education combined with the challenges mentioned above
result in relatively low numbers of students with LD
enrolling in postsecondary education.
MetLife’s 2010 “Survey of the American Teacher:
Preparing Students for College and Careers — Teaching
Diverse Learners” found that learning-challenged students
(defi ned as students who have been told by a teacher or
The State of Learning Disabilities 27

Median income for a high school graduate is $26,505
compared to $43,143 for a bachelor’s degree.
Th e NLTS2 found that only one in three (33%) students
with LD were enrolled in any postsecondary school within
two years of leaving high school. Th ose enrolled in a four-
year college were a mere 10%, while those enrolled in a
two-year/community college or vocational/business or
technical school were 27%. Students with disabilities—
including LD—enroll in two-year community colleges at
much the same rate as those without disabilities. Students
without disabilities are more than four and one-half times
as likely as youth with disabilities to attend four-year
institutions. Th is could be due in large part to the limited
ability of students with LD to satisfy admission criteria at
four-year colleges and universities.
According to the Offi ce for Civil Rights (OCR) at the U.S.
Department of Education, under Section 504 and Title II
of the ADA, postsecondary schools are required to provide
appropriate academic adjustments as necessary to ensure
that the institution does not discriminate on the basis of
disability. However, as noted earlier, students must disclose
their disability to the college in order to access academic
adjustments. Disclosure of a disability is always voluntary.
Th e NLTS2 found that more than half (52%) of students
who received special education services during high school
did not consider themselves to have a disability by the
time they transitioned to postsecondary education and,
therefore, did not seek any type of accommodations. An
additional 7% considered themselves to have a disability
but chose not to disclose it.
Given these low rates of self-disclosure, it is not surprising
that only one-third (35%) of students with disabilities in
postsecondary education received any type of adjustments,
accommodations, or learning aids from their schools.
Among those who did receive services or accommodations,
most found such supports to be very useful (29%) or
somewhat useful (64%) while 27% reported needing more
help.
A national survey of undergraduates enrolled in all
U.S. postsecondary institutions in 2007-2008 (2007-
2008 National Postsecondary Student Aid Study
or NPSAS:2010) indicated that just under 11% of
undergraduates reported having some type of disability. Of
that 11%, 9% reported having a learning disability, 19%
28 National Center for Learning Disabilities
other adult at school that they have learning problems or
a learning disability or AD/HD or that they should have
an Individualized Education Program or IEP) place the
same importance on a college education as other students.
However, they have lower aspirations regarding their own
postsecondary education and less confi dence that they will
achieve their goals for the future. Th ey are also less likely
to have received support or guidance from teachers and
school counselors about how to prepare for college.
In the face of this lack of both confi dence and
preparedness, the personal earning levels associated
with education attainment become even more pertinent.
Source: U.S. Census Bureau, 2004/06
Median personal income according to
education levels
Source: National Longitudinal Transition Study 2, 2003
Postsecondary school enrollment
for students with LD within 2 years

reported having attention defi cit disorder (a condition
often coexisting in students with LD), while 24% reported
mental illness or depression. Th e gender of those reporting
a disability mirrored the overall undergraduate gender
distribution—57% were female and 43% were male.
Among those reporting some type of disability, more
were White, had GEDs, and were attending two-year
institutions than those without any disabilities. Sixty-four
percent reported receiving some type of fi nancial aid (vs.
66% of those without disabilities). Students reporting a
disability were less likely to be attending full-time and
full-year (35%) as compared to those without a disability
(40%).
A 2005 study of experiences of adults with disabilities
in postsecondary education conducted by the Center
on Disability Studies at the University of Hawaii found
that many students face diffi culties requesting and
receiving supports and accommodations on college
campuses. Student disability services offi ces are often
understaff ed, forcing them to assist only those students
with the most urgent needs. Many students expressed
concern about disclosure, given the stigma associated with
accommodations, noting that both non-disabled peers and
faculty often questioned the need for accommodations
given to students with disabilities. Many faculty members
reportedly were unaware of the needs and rights of
The State of Learning Disabilities 29
students with disabilities, especially those with learning
and other hidden disabilities. Assistive technology and
faculty mentors were frequently cited by students as
important supports sometimes diffi cult to access. As
these results indicate, there is a clear need for increased
coordination of disability support services and programs to
educate faculty if success in postsecondary education is to
be improved.
Employment
While more than two-thirds (69%) of students with LD
had a transition goal of obtaining competitive employment
after high school, only 46% had regular paid employment
when surveyed within two years of leaving school
according to the fi ndings of the NLTS2.
As with youth in postsecondary education, young adults
with LD rarely disclose their disability to employers
or even consider themselves to have a disability at all.
Overall, only 4% of young adults who received special
education services in high school reported receiving any
accommodations or other help from an employer because
of a learning problem.
A comprehensive 2009 publication by the National
Institute for Literacy, “Learning to Achieve: A Review of
the Research Literature on Serving Adults with Learning
Disabilities,” reported on a 2003 study of the experiences
of adults with LD in the workplace with respect to their
view of the Americans with Disabilities Act (ADA). Th e
study found that disclosure was rare and that reasonable
accommodations were almost never a part of their
employment experience. Over half believed they no longer
had LD, and more than two-thirds had never heard of the
ADA or were not confi dent enough to use it in a self-
advocacy process.
Still, adults with LD are turning to Vocational
Rehabilitation (VR) agencies for assistance—one of the
publicly funded agencies required to serve people with
disabilities. Th e VR provides a wide range of services
designed to help individuals with disabilities prepare
for and engage in gainful employment consistent with
their strengths, resources, priorities, concerns, abilities,
capabilities, interests, and informed choice. Eligible
Source: 2007-2008 National Postsecondary Student Aid Study
Types of disabilities reported by
undergraduates who reported a disability

New ADA Regulations Clarify Documentation
for Testing Accommodations
In September 2010 the Department of Justice (DOJ)
fi nalized expansive new federal regulations governing
the ADA. The new regulations — the fi rst regulatory
update since 1991— took eff ect on March 15, 2011.
The ADA’s Title III, Section 309 is intended to ensure
that individuals with disabilities are not excluded
from educational, professional, or trade opportunities
because examinations or courses are off ered in a place
or manner that is not accessible. In issuing the proposed
new regulations, the DOJ stated that, through its
enforcement eff orts, it had discovered that the requests
made by testing entities for documentation regarding
the existence of an individual’s disability and her or his
need for a modifi cation or an auxiliary aid or service were
often inappropriate or burdensome. Students with LD
often experienced such inappropriate or burdensome
requests, for example, requests for recent evaluations. In
updating the ADA Title III regulations, the DOJ attempted
to address this problem.
The new regulations state that any private entity that
off ers examinations or courses related to applications,
licensing, certifi cation, or credentialing for secondary or
postsecondary education, professional, or trade purposes
shall off er such examinations or courses in a place and
manner accessible to persons with disabilities or off er
alternative accessible arrangements for such individuals.
Specifi cally, with regard to documentation, the new
regulations state that private entities must assure that:
■ Any request for documentation, if such
documentation is required, is reasonable and limited
to the need for the modifi cation, accommodation, or
auxiliary aid or service requested.
■ When considering requests for modifi cations,
accommodations, or auxiliary aids or services, the
entity gives considerable weight to documentation
of past modifi cations, accommodations, or auxiliary
aids or services received in similar testing situations,
as well as such modifi cations, accommodations, or
related aids and services provided in response to
an Individualized Education Program (IEP) provided
under the Individuals with Disabilities Education
Act or a plan describing services provided pursuant
to section 504 of the Rehabilitation Act of 1973, as
amended (often referred to as a Section 504 Plan).
■ The entity responds in a timely manner to requests
for modifi cations, accommodations, or aids to ensure
equal opportunity for individuals with disabilities.
These clarifi cations, coupled with the expanded
defi nition of disability brought about by the ADA
Amendments Act of 2008 (see page 4) will hopefully
make a real diff erence for students and adults with LD as
they seek to gain equal access to test accommodations
on a variety of exams, such as the SAT and ACT, critically
important to success in postsecondary education and
employment.
30 National Center for Learning Disabilities
individuals are those who have a physical or mental
impairment that results in a substantial impediment
to employment, who can benefi t from vocational
rehabilitation (VR) services for employment, and who
require VR services.
From 2002-2006 individuals with LD comprised the
largest number of VR consumers, according to VR records
as reported by the National Council on Disability. During
that time, 32% of transition-age youth ages 16-25 served
by VR had LD. While this is encouraging, VR counselors,
along with those working with adults with LD in other
settings such as adult education and the juvenile justice
system, are frequently unprepared to work eff ectively with
this population. Source: National Council on Disability, 2008
VR consumers by disability 2002-2006
While learning disabilities aff ect millions of Americans
across the age span, the number of identifi ed individuals
is most easily determined for school-age children and, to
some extent, college-age adults. Studies indicate that few
adults identify themselves as having LD, making it diffi cult
to ascertain just how such individuals are faring in key
areas such as attainment of higher education, employment
status and earnings.
Th e decline in the numbers of school-age children
being identifi ed as LD over the past several years
appears to be the result of multiple factors, including a
better understanding of reading acquisition, eff orts to
provide intervention activities before a special education
designation is made, and changes in the defi nitions
of disability categories in special education law and
regulations. While eff ective instruction and intervention
approaches—such as RTI—may provide early help for
children with LD, in some cases ameliorating the need for
special education, it also impacts our knowledge about the
numbers of young people who are aff ected.
Despite a decline in the number of school-age children
reported to have LD, those identifi ed continue to be
disproportionately poor and, to some degree, from
minority groups. Students with LD also continue to
experience disciplinary actions at a much higher rate than
those without LD and to encounter diffi culties as a result
of inappropriate behavior and conduct. Where evidence-
based practices shown to help ameliorate these issues
already exist — such as Positive Behavioral Instructional
Supports (PBIS)—pressure to implement them must be
increased. Where knowledge on eff ective practices and
strategies is still needed, these issues must continue to be
the focus of research and education agendas.
Increasing the graduation rate of students with LD and
reducing the dropout rate are among the many pressing
issues for this group. Given all that is known about the
detrimental and life-long eff ects of dropping out, eff orts to
implement eff ective dropout prevention programs should
be a top priority of the nation’s high schools. Dropout
prevention programs need to be adopted with fi delity on
a large scale in order to reduce this silent epidemic that
threatens to undermine the success of so many youths
with LD. Additionally, the impact of high stakes exit
exams and the expanding array of alternate diplomas needs
urgent attention to achieve a better understanding of the
particular issues challenging school completion.
Th e NLTS2 has uncovered signifi cant information
that should be used to improve instruction, academic
achievement, transition and post-school outcomes for
students with LD. Among the activities and eff orts
needing signifi cant improvement, the transition planning
process stands out. Transition planning activities must
be more heavily infl uenced by the student and better
connected to the skills needed to realize post-school goals.
Individuals from other agencies must be more frequently
involved in transition planning for students with LD,
particularly disability support services personnel in colleges
and universities.
Conclusion
The State of Learning Disabilities 31

Another area of need is the use of technology to support
the learning of students with LD. Few would argue the
tremendous value of technology, yet far too few students
are provided with the necessary assistive technology
devices and services as part of their special education
program. It seems strangely ironic that sophisticated
technologies—such as fMRIs—have advanced the
understanding of learning disabilities while those
struggling with the disorder do not have the benefi t of
using even the most basic technology tools to support and
enhance their learning.
Th e current level at which young people with LD access
and succeed in postsecondary education is unacceptably
low. While graduation rates among students with LD are
showing slow, yet steady, improvement, the share of jobs
requiring at least some college education has grown from
28% to more than 60% in the past three decades. In fact,
the U.S. Department of Education’s Commission on the
Future of Higher Education claims that “Ninety percent
of the fastest-growing jobs in the new knowledge-driven
economy will require some postsecondary education.” As
a college degree becomes more essential for employment
success, earnings for high school graduates and dropouts
will fall.
Adults with LD can take comfort in the newly restored
ADA. Self-identifi cation should be considered whenever
reasonable accommodations are essential for job
performance. New federal regulations, as well as future
court decisions, will help to further clarify and refi ne the
full impact of the ADA Amendments Act of 2008, and
there is already evidence that these important statutory
changes are having a positive impact on those with LD.
As the nature of LD continues to be better understood
and the particular needs of those with these neurological
diff erences are more well defi ned, success in all aspects of
life should become more achievable for a larger number of
Americans with LD. Both research and public policy must
continue to support such advances.
32 National Center for Learning Disabilities

The State of Learning Disabilities is published on a biennial basis to capture key
facts, trends and indicators about individuals with learning disabilities. NCLD’s
website, www.LD.org, provides essential information on key federal laws,
legislation, policy recommendations, podcasts, checklists and other tools on
the topics discussed in this publication. Updates to these data will be posted
at www.LD.org as they become available.