the state of montana manufacturing · 3 the state of montana manufacturing 2015 edition the state...
TRANSCRIPT

3 The State of Montana Manufacturing
2015 EditionThe State of Montana Manufacturing
By Paul Polzin, Emeritus Director, Bureau of Business and Economic ResearchUniversity of Montana, Missoula, MT 59812
ECONOMIC
BUREAU OFBUSINESS
RESEARCHAND

01 The State of Montana Manufacturing
This report was prepared by Montana State University Montana Manufacturing Extension Center and
the University of Montana Bureau of Business and Economic Research under award 70NANB10H144
from the National Institute of Standards and Technology Manufacturing Extension Partnership, U.S.
Department of Commerce. The statements, findings, conclusions, and recommendations are those
of the author(s) and do not necessarily reflect the views of the National Institute of Standards &
Technology Hollings Manufacturing Extension Partnership or the U.S. Department of Commerce.
Acknowledgments
02 The State of Montana Manufacturing
Contents03 Introduction
06 Future Trends Affecting Manufacturing
11 Measuring and Analyzing Manufacturing
14 Manufacturing and the Montana Economy
19 A Closer Look at Montana Manufacturing
19 Manufacturing Establishments
19 Employment Size
20 Composition of Manufacturing
21 Manufacturing Employment
22 Montana Manufacturing Employment by Industry
25 Manufacturing Earnings
27 Wage and Salary Employment and Per Worker Wages
29 Montana’s Manufacturing Exports

03 The State of Montana Manufacturing
U.S. manufacturing has been one of the few bright spots of the economy. Growth in durable goods production accounted for most of the comeback. Consumers should benefit from lower oil prices, and combined with improved confidence, may continue to make automobile and other major purchases. Similarly, a recovering housing market is stimulating the demand for furniture and appliances. Increased business and construction activity have also boosted demand for metals, machinery, and other equipment. There will be more about manufacturing exports later in this report, but the rising value of the dollar and slow worldwide growth may dampen foreign markets.
The U.S. economy has been mired in a slow growth mode since the business cycle trough in the second quarter of 2009. Annual growth in real GDP has consistently been below the long-run average of roughly 3.0 percent. The recent decline in the price of oil could spur consumer spending, but this stimulus has not yet appeared in the leading indicators released in the first half of 2015. One of the major causes of the slower growth has been the renewed recession and financial crisis in the EU combined with cooling of the growth rates in China and other developing countries. Nevertheless, a number of national forecasters are predicting the U.S. Federal Reserve will begin to raise short-term interest rates late in 2015.
INTRODUCTION
03 The State of Montana Manufacturing
04 The State of Montana Manufacturing
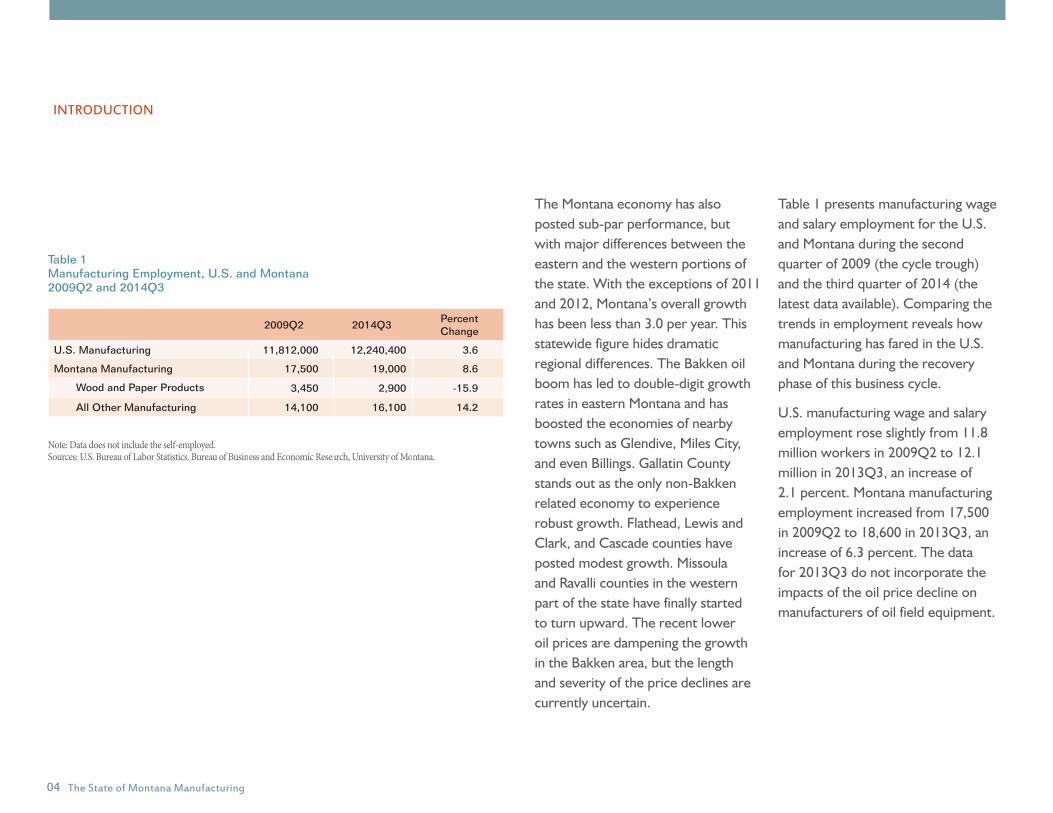
The Montana economy has also posted sub-par performance, but with major differences between the eastern and the western portions of the state. With the exceptions of 2011 and 2012, Montana’s overall growth has been less than 3.0 per year. This statewide figure hides dramatic regional differences. The Bakken oil boom has led to double-digit growth rates in eastern Montana and has boosted the economies of nearby towns such as Glendive, Miles City, and even Billings. Gallatin County stands out as the only non-Bakken related economy to experience robust growth. Flathead, Lewis and Clark, and Cascade counties have posted modest growth. Missoula and Ravalli counties in the western part of the state have finally started to turn upward. The recent lower oil prices are dampening the growth in the Bakken area, but the length and severity of the price declines are currently uncertain.
Table 1 Manufacturing Employment, U.S. and Montana 2009Q2 and 2014Q3
2009Q2 2014Q3Percent Change
U.S. Manufacturing 11,812,000 12,240,400 3.6
Montana Manufacturing 17,500 19,000 8.6
Wood and Paper Products 3,450 2,900 -15.9
All Other Manufacturing 14,100 16,100 14.2
Note: Data does not include the self-employed.Sources: U.S. Bureau of Labor Statistics. Bureau of Business and Economic Research, University of Montana.
Table 1 presents manufacturing wage and salary employment for the U.S. and Montana during the second quarter of 2009 (the cycle trough) and the third quarter of 2014 (the latest data available). Comparing the trends in employment reveals how manufacturing has fared in the U.S. and Montana during the recovery phase of this business cycle.
U.S. manufacturing wage and salary employment rose slightly from 11.8 million workers in 2009Q2 to 12.1 million in 2013Q3, an increase of 2.1 percent. Montana manufacturing employment increased from 17,500 in 2009Q2 to 18,600 in 2013Q3, an increase of 6.3 percent. The data for 2013Q3 do not incorporate the impacts of the oil price decline on manufacturers of oil field equipment.
INTRODUCTION

05 The State of Montana Manufacturing
As shown in Table 1, employment in the wood and paper products industry decreased by 550 workers between 2009Q2 and 2013Q3. Employment in all the other components of Montana manufacturing increased by about 1,600 workers, or 11.3 percent.
In summary, since the start of the recovery Montana manufacturing employment has increased considerably faster than the national rate. This strong performance was in spite of permanent closures in the wood and paper products industries.
The strong growth in Montana manufacturing employment occurred despite permanent closures in several manufacturing industries. The Smurfit-Stone paper mill near Missoula permanently closed in early 2010. This facility was the largest manufacturing plant in the state. In addition, there were shutdowns and closures in the wood products industry. Even though the closures in both industries occurred during a period of poor markets, the long-term cause was a significant decrease in the supply of raw material due to the diminished harvests on federal and some industrial land. The paper mill and some sawmills have been dismantled, and these jobs will not return even when the economy fully recovers.
The Columbia Falls Aluminum Company also closed during this period. Employment at this facility has been gradually declining for years as the supply of appropriately priced electricity has become scarcer. The plant is currently being dismantled.
INTRODUCTION

06 The State of Montana Manufacturing
FUTURE TRENDS AFFECTING MANUFACTURING
The future prospects for energy in the U.S. have significantly brightened and this will impact manufacturing. The shale energy revolution is using advances in geophysics, nanotechnology, engineering, and production to dramatically increase the country’s energy production. There have been significant increases in the supply of natural gas and crude oil from locations as varied as the mid-Atlantic states, the Bakken area on Montana-North Dakota border, and traditional supply areas such as Texas.
The growing supply of crude oil has dramatically reduced its price as well as the country’s dependence on imports. From summer 2014 to January 2015 the world price of oil dropped by more than 40 percent. How long the price of oil will remain depressed and its future trend is uncertain. One school of thought has oil prices gradually rising and returning to the $90/barrel level by 2019. Past oil price forecasts have proven to be very unreliable.
The country’s dependence on imported oil has been an important political and national security issue. As recently as 2005, the U.S. was importing 60 percent of our petroleum. The forecasts are for this figure to drop to 40 percent by 2017.
Increased U.S. supplies of natural gas have also reduced its price. From 2007 to 2013 the price of natural gas dropped from about $6.95 ($/MBtu) to roughly $3.71 ($/MBtu), a decrease of 53.3 percent. Unlike oil, there is no single worldwide price for natural gas because it is difficult to transport. There is some small international traffic in natural gas (after it has been liquefied) but most natural gas markets are limited to North America. The significant drop in the

07 The State of Montana Manufacturing
FUTURE TRENDS AFFECTING MANUFACTURING
U.S. price of natural gas has not been repeated elsewhere in the world.
The shale energy developments will impact manufacturing in a number of ways:
• The decrease in the price of natural gas will reduce energy costs;
• The availability of cheap natural gas will reduce other costs for manufacturers; and,
• Once the world oil prices return to former levels, the manufacturing firms producing drilling and other specialized equipment will see renewed demand for their products.
Each is described in detail below:
Reduced energy costs. The shale revolution will directly lower manufacturing energy costs via the price of natural gas and indirectly through the price of electricity.
Manufacturers purchase large quantities of natural gas to be used as an energy source. The decreased price of natural gas will be directly translated into lower costs for manufacturer’s. The U.S. Energy Information Agency reports that about 28 percent of the country’s natural gas consumption in 2013 was by the “industrial” sector, which is dominated by manufacturing but includes several other industries.
Natural gas is increasingly being used to generate electricity, both because of its decline in price and its reduced emissions relative to coal. In 2013, electricity generation was the largest single use of natural gas, accounting for about 31.0 percent of total gas consumption. Manufacturers purchase large quantities of electricity. The 2013 Survey of Manufacturers reports that the value of electricity purchases by manufacturers was about 36 percent larger than the combined value of all other fuels. The increased amount of natural gas available due to shale technology means that electricity prices will increase more slowly. The international implications of U.S. electricity costs will be discussed later.
Other cost reductions. Before natural gas can be transported efficiently and sold commercially, the impurities must be extracted. The by-products are known as natural gas liquids (NGL) and include methane, ethane, propane, and butane.

08 The State of Montana Manufacturing
Figure 1 Manufacturing Wages, China, India and U.S. (2002 =1.00)
Sources: U.S. Bureau of Labor Statistics.
0.0
0.5
1.0
1.5
2.0
2.5
3.0
3.5
U.S.
India
China
12111098765432
FUTURE TRENDS AFFECTING MANUFACTURING
NGLs are themselves valued raw materials for petrochemical markets. For example, methane can be converted into ammonia and methanol, both valuable manufacturing inputs. Ethane can be refined into ethylene and then into polyethylene glycol which is an input into many products ranging from adhesives to plastics to paint. Currently ethylene sells for about $1,000 per ton. This price could drop to $300 a ton due to the increased supply.
Specialized manufacturers. Shale-energy extraction requires sizable amounts of large and specialized equipment. These include firms manufacturing items such as drilling equipment, oil and gas field machines (NAICS 333132), fabricated pipe and pipe fittings (NAICS 332996), and similar industries. There is also the modification of specialized trucks (NAICS 336211) to bring water and other material to the well site and to carry the crude oil to the collecting stations. Finally, there is the plethora of measuring instruments and meters
(NAICS 334513 and others) used to guide the sophisticated drill bits down and then horizontal into the shale deposits. The 2014-2015 world oil price plummet quickly reduced drilling and exploration and there have been media reports of reductions by these upstream suppliers but detailed data are not yet available.
Rising Foreign Wages. Past offshore manufacturing moves were intended to take advantage of low wages in China, India, and other developing countries. The inevitable has happened. Increased domestic demand, labor militancy, more government regulations, and other factors led to rising local wages, and usually at a rapid rate. There still are significant differences between U.S. and foreign wages, but the differences are decreasing and providing less of an incentive to put up with lower productivity, higher transportation costs, and other issues associated with offshore production.
This situation is illustrated in Figure 1, which compares the growth (but

09 The State of Montana Manufacturing
FUTURE TRENDS AFFECTING MANUFACTURING
not levels) of manufacturing wages in the U.S., China, and India. Economic data from underdeveloped nations are out-of-date and incomplete. Nevertheless, the trend is obvious. Manufacturing wages in China and India doubled or even tripled while the U.S. increase was roughly 30 percent. Differential growth of this magnitude quickly erodes relative wage advantages.
Rising Energy Prices in Other Developed Countries. Emphasis on expensive alternative energy sources, concerns about nuclear power, and reluctance to develop shale resources are leading to much higher energy costs in other developed countries with large manufacturing sectors. This improves the attractiveness of the U.S. with its relatively lower and more stable energy costs.
As shown in Table 2, natural gas prices in developed countries were clustered together in a narrow range of $6 to $8 per million cubic feet as recently as 2007. By 2013, the U.S. price dropped to $3.71 per million Btus while the prices in the other countries rose 33 percent to more than 100 percent. Even allowing for a slow rise in the U.S. price, there are a significant cost differences between the developed countries.
Much the same disparity is emerging in electricity. As shown in Table 3, there are already significant differences between the U.S. and several European electricity prices. In the future, the U.S. will benefit from low-cost shale natural gas while the other countries will have to rely on much more expensive fuel sources.
Table 3 2014 Electricity Prices (U.S. cents per Kwh)
Country Price
U.S. 10.00
Germany 19.21
U.K. 15.40
Source: www. Statista.com.
Table 2 Natural Gas Prices ($/million Btu)
Country 2007 2013
U.S. (Henry Hub) 6.95 3.71
Japan 7.73 16.17
Germany 8.03 10.72
U.K. 6.01 10.63
Source: BP Statistical Review.
10 The State of Montana Manufacturing
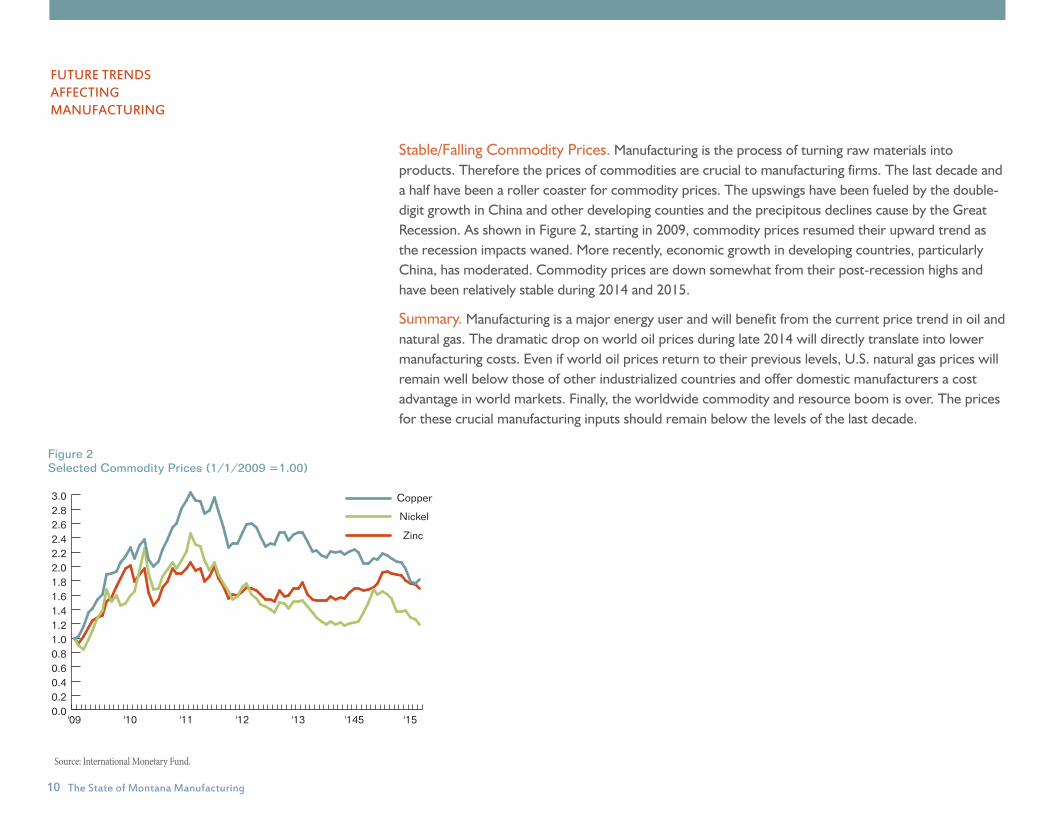
Stable/Falling Commodity Prices. Manufacturing is the process of turning raw materials into products. Therefore the prices of commodities are crucial to manufacturing firms. The last decade and a half have been a roller coaster for commodity prices. The upswings have been fueled by the double-digit growth in China and other developing counties and the precipitous declines cause by the Great Recession. As shown in Figure 2, starting in 2009, commodity prices resumed their upward trend as the recession impacts waned. More recently, economic growth in developing countries, particularly China, has moderated. Commodity prices are down somewhat from their post-recession highs and have been relatively stable during 2014 and 2015.
Summary. Manufacturing is a major energy user and will benefit from the current price trend in oil and natural gas. The dramatic drop on world oil prices during late 2014 will directly translate into lower manufacturing costs. Even if world oil prices return to their previous levels, U.S. natural gas prices will remain well below those of other industrialized countries and offer domestic manufacturers a cost advantage in world markets. Finally, the worldwide commodity and resource boom is over. The prices for these crucial manufacturing inputs should remain below the levels of the last decade.
Figure 2 Selected Commodity Prices (1/1/2009 =1.00)
0.00.20.40.60.81.01.21.41.61.82.02.22.42.62.83.0
Nickel
Zinc
Copper
'15'145'13'12'11'10'09
Source: International Monetary Fund.
FUTURE TRENDS AFFECTING MANUFACTURING
11 The State of Montana Manufacturing
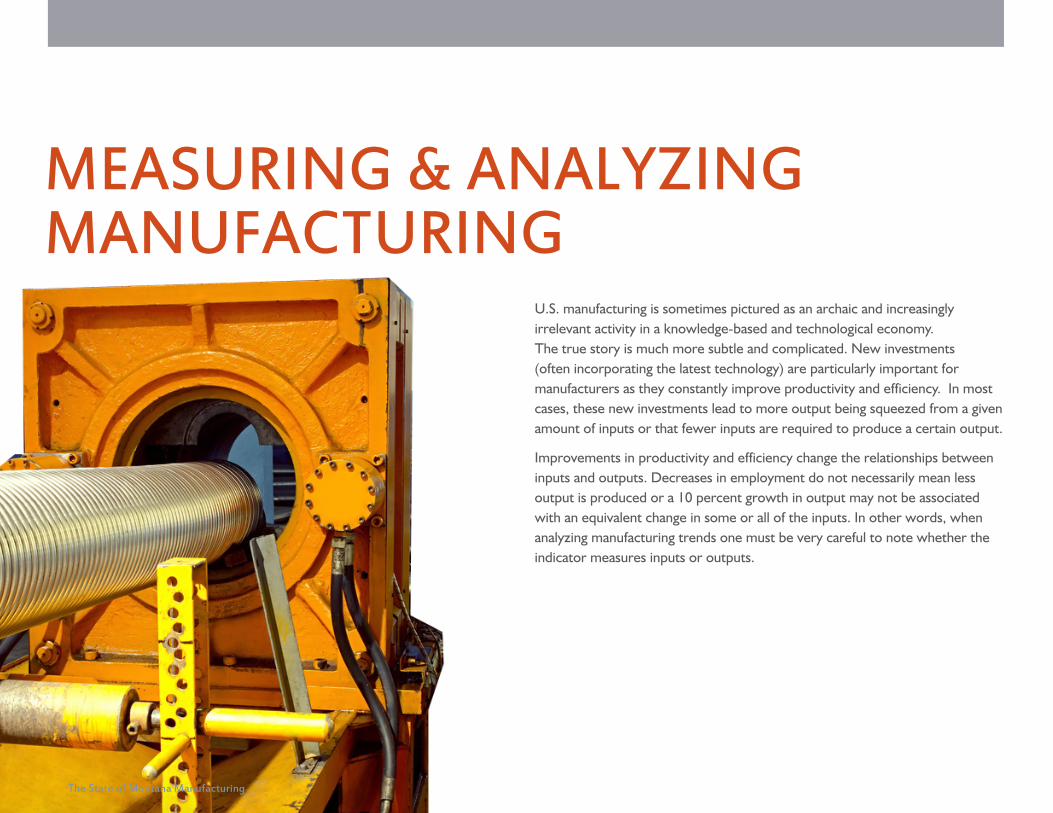
U.S. manufacturing is sometimes pictured as an archaic and increasingly irrelevant activity in a knowledge-based and technological economy. The true story is much more subtle and complicated. New investments (often incorporating the latest technology) are particularly important for manufacturers as they constantly improve productivity and efficiency. In most cases, these new investments lead to more output being squeezed from a given amount of inputs or that fewer inputs are required to produce a certain output.
Improvements in productivity and efficiency change the relationships between inputs and outputs. Decreases in employment do not necessarily mean less output is produced or a 10 percent growth in output may not be associated with an equivalent change in some or all of the inputs. In other words, when analyzing manufacturing trends one must be very careful to note whether the indicator measures inputs or outputs.
MEASURING & ANALYZING MANUFACTURING
The State of Montana Manufacturing

12 The State of Montana Manufacturing
The long-term decline in manufacturing employment is sometimes misinterpreted as an indicator of the overall health of the industry. Figure 3 presents U.S manufacturing employment. The graph is expressed in relative terms so that both employment and manufacturing’s share of total employment can be presented side by side. Both show a very definite downward trend from 2001 to 2013. In absolute terms, manufacturing employment decreased from 16.9 million workers in 2001 to 12.7 million in 2013 while its share of total employment dropped from 10.2 percent to 7.0 percent during the same period.
A decline in employment (which is the labor input) does not mean decreasing output or production of manufactured goods. Figure 4 (page 13) presents two measures of manufacturing real Gross Domestic Product (GDP), which represents the value of output or production in inflation-adjusted terms. The first is manufacturing GDP in billions of constant dollars and the second in manufacturing real GDP as a percent of total real GDP. They have also been converted to relatives in order to easily present them side by side.
Figure 3 U.S. Manufacturing Employment (2001 = 1.00)
MEASURING AND ANALYZING MANUFACTURING
0.0
0.2
0.4
0.6
0.8
1.0
1.2% of Total Employment
Employment
'13'12'11'10'09'08'07'06'05'04'03'02'01
Source: U.S. Bureau of Economic Analysis.
13 The State of Montana Manufacturing
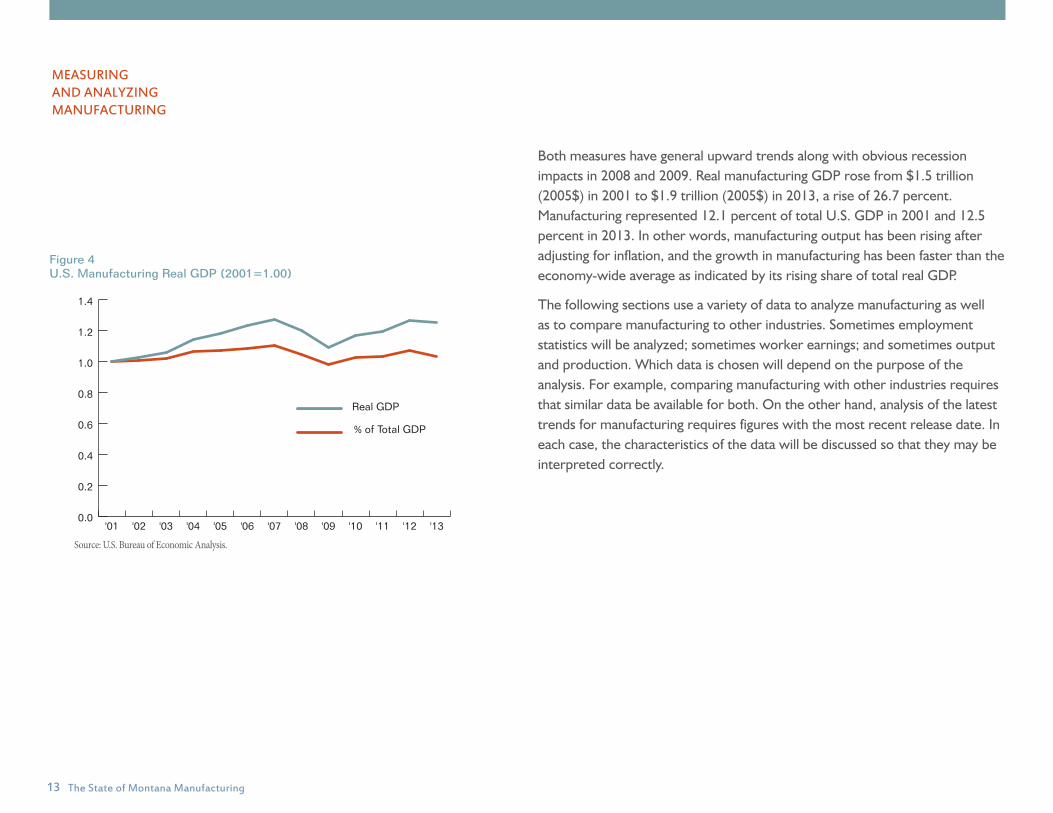
Figure 4 U.S. Manufacturing Real GDP (2001=1.00)
Both measures have general upward trends along with obvious recession impacts in 2008 and 2009. Real manufacturing GDP rose from $1.5 trillion (2005$) in 2001 to $1.9 trillion (2005$) in 2013, a rise of 26.7 percent. Manufacturing represented 12.1 percent of total U.S. GDP in 2001 and 12.5 percent in 2013. In other words, manufacturing output has been rising after adjusting for inflation, and the growth in manufacturing has been faster than the economy-wide average as indicated by its rising share of total real GDP.
The following sections use a variety of data to analyze manufacturing as well as to compare manufacturing to other industries. Sometimes employment statistics will be analyzed; sometimes worker earnings; and sometimes output and production. Which data is chosen will depend on the purpose of the analysis. For example, comparing manufacturing with other industries requires that similar data be available for both. On the other hand, analysis of the latest trends for manufacturing requires figures with the most recent release date. In each case, the characteristics of the data will be discussed so that they may be interpreted correctly.
0.0
0.2
0.4
0.6
0.8
1.0
1.2
1.4
% of Total GDP
Real GDP
'13'12'11'10'09'08'07'06'05'04'03'02'01
Source: U.S. Bureau of Economic Analysis.
MEASURING AND ANALYZING MANUFACTURING

14 The State of Montana Manufacturing
MANUFACTURING AND THE MONTANA ECONOMY
The trends in the Montana economy are primarily determined by the basic (or export) industries. Basic industries are those that are located in a state but sell most of their products elsewhere, or are otherwise influenced by factors beyond the state’s borders. Basic industries inject new funds into a state economy and are responsible for creating further income and jobs, and these dollars are spent and re-spent. Manufacturing, mining, and agriculture are basic industries in every state. The federal government and rail/truck transportation industries do not export products, but are dependent on factors external to a single state and are usually classified as basic. Service industries may also be basic. For example, financial services in New York, insurance in Connecticut and Indiana, and amusement places (casinos) in Nevada all serve non-local markets and are part of their state’s economic base.
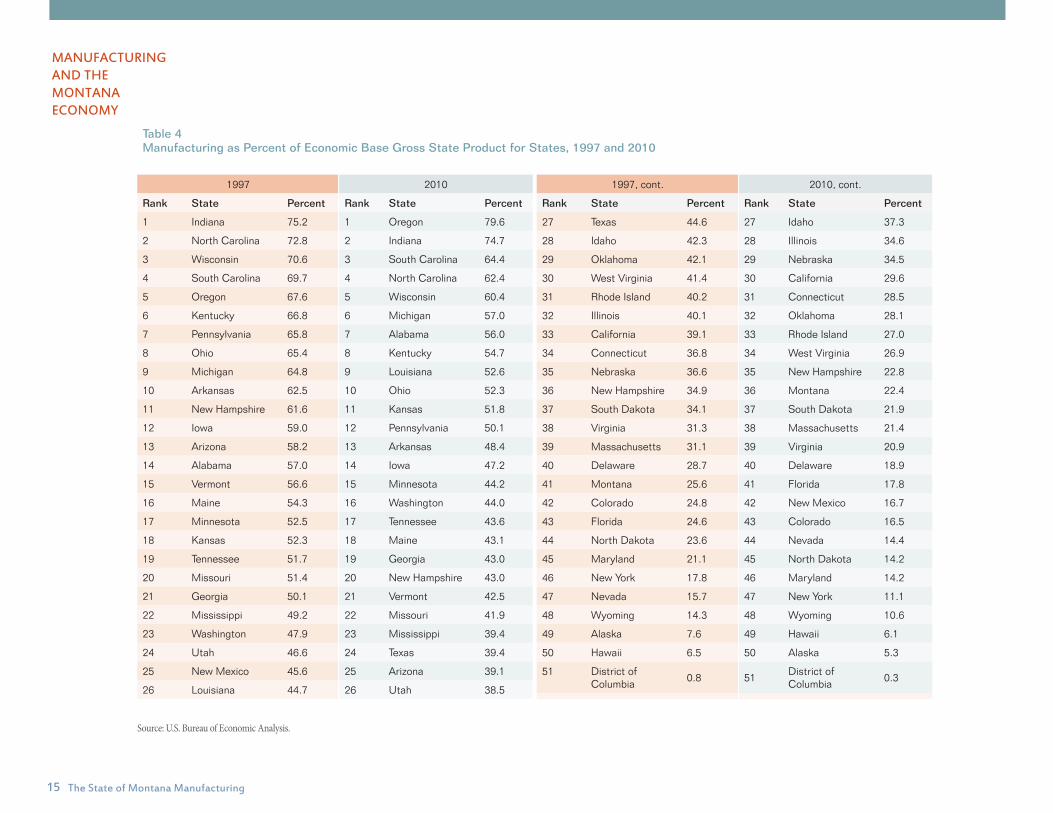
The role of manufacturing in every state (plus the District of Columbia) is shown in Table 4 (page 16). Manufacturing’s share of each state’s economic base as measured by GDP was calculated for 1997 and 2013. The economic base of each state was estimated using a method developed by the U.S. Bureau of Economic Analysis. There are other methods of identifying the basic industries, and they may yield slightly different findings.
14 The State of Montana Manufacturing
15 The State of Montana Manufacturing
Source: U.S. Bureau of Economic Analysis.
Table 4 Manufacturing as Percent of Economic Base Gross State Product for States, 1997 and 2010
27 Texas 44.6 27 Idaho 37.3
28 Idaho 42.3 28 Illinois 34.6
29 Oklahoma 42.1 29 Nebraska 34.5
30 West Virginia 41.4 30 California 29.6
31 Rhode Island 40.2 31 Connecticut 28.5
32 Illinois 40.1 32 Oklahoma 28.1
33 California 39.1 33 Rhode Island 27.0
34 Connecticut 36.8 34 West Virginia 26.9
35 Nebraska 36.6 35 New Hampshire 22.8
36 New Hampshire 34.9 36 Montana 22.4
37 South Dakota 34.1 37 South Dakota 21.9
38 Virginia 31.3 38 Massachusetts 21.4
39 Massachusetts 31.1 39 Virginia 20.9
40 Delaware 28.7 40 Delaware 18.9
41 Montana 25.6 41 Florida 17.8
42 Colorado 24.8 42 New Mexico 16.7
43 Florida 24.6 43 Colorado 16.5
44 North Dakota 23.6 44 Nevada 14.4
45 Maryland 21.1 45 North Dakota 14.2
46 New York 17.8 46 Maryland 14.2
47 Nevada 15.7 47 New York 11.1
48 Wyoming 14.3 48 Wyoming 10.6
49 Alaska 7.6 49 Hawaii 6.1
50 Hawaii 6.5 50 Alaska 5.3
51 District of Columbia
0.8 51District of Columbia
0.3
1997 2010
Rank State Percent Rank State Percent
1 Indiana 75.2 1 Oregon 79.6
2 North Carolina 72.8 2 Indiana 74.7
3 Wisconsin 70.6 3 South Carolina 64.4
4 South Carolina 69.7 4 North Carolina 62.4
5 Oregon 67.6 5 Wisconsin 60.4
6 Kentucky 66.8 6 Michigan 57.0
7 Pennsylvania 65.8 7 Alabama 56.0
8 Ohio 65.4 8 Kentucky 54.7
9 Michigan 64.8 9 Louisiana 52.6
10 Arkansas 62.5 10 Ohio 52.3
11 New Hampshire 61.6 11 Kansas 51.8
12 Iowa 59.0 12 Pennsylvania 50.1
13 Arizona 58.2 13 Arkansas 48.4
14 Alabama 57.0 14 Iowa 47.2
15 Vermont 56.6 15 Minnesota 44.2
16 Maine 54.3 16 Washington 44.0
17 Minnesota 52.5 17 Tennessee 43.6
18 Kansas 52.3 18 Maine 43.1
19 Tennessee 51.7 19 Georgia 43.0
20 Missouri 51.4 20 New Hampshire 43.0
21 Georgia 50.1 21 Vermont 42.5
22 Mississippi 49.2 22 Missouri 41.9
23 Washington 47.9 23 Mississippi 39.4
24 Utah 46.6 24 Texas 39.4
25 New Mexico 45.6 25 Arizona 39.1
26 Louisiana 44.7 26 Utah 38.5
1997, cont. 2010, cont.
Rank State Percent Rank State Percent
MANUFACTURING AND THE MONTANA ECONOMY

16 The State of Montana Manufacturing
During 1997, the top five states in terms of manufacturing’s share of the economic base were Indiana, North Carolina, Wisconsin, South Carolina, and Oregon. The major difference in the top-tier states between 1997 and 2013 was that Oregon vaulted to the top spot and North Carolina dropped to fourth. The reason for Oregon’s rise was the rapid growth of computer and electronics manufacturing in that state.
Montana manufacturing has traditionally ranked relatively low in terms of its contribution to the economic base. Montana was 41st in 1997 when manufacturing accounted for 25.6 percent of the economic base. Sixteen years later in 2013, Montana had risen to 36th with about 22.4 percent of the economic base in manufacturing. Almost all states (with Oregon being the major exception) experienced declines in manufacturing’s share of the economic base.
GDP data is not well-suited to analyzing trends in manufacturing from one year to the next. The disadvantages of GDP data is that it is not available prior to 1997, and the most current figures are usually several years old and do not provide detail for specific components of manufacturing.
Earnings data are more appropriate for examining trends from one year to the next and for periods of a decade or more. But, earnings data also has its own characteristics. For example, net farm income of family-owned farms and ranches (a major component of farm earnings) is extremely volatile and not a reliable measure of output, revenues, and overall economic conditions in the agricultural sector. Consequently, the following sections will report nonfarm earnings to identify overall economic trends. Using nonfarm earnings does not imply that agriculture is ignored. Earnings in agricultural services are
explicitly included. Excluding farm earnings eliminates an extremely volatile component that could mask important trends elsewhere in the economy.
Specific industries within manufacturing may themselves be changing due to evolving and improving practices. One example is the greater emphasis on supply chain management. Increased use of supply chain methods suggests that today’s production processes may be very different from those of only a few years ago.
Manufacturing is a basic industry because most its output and production is shipped out of Montana. As shown later in Table 9, about 50 percent of the state’s manufacturing earnings is produced in industries such as wood products, petroleum refining, and machinery where almost all of the products immediately leave the state. Even the smaller industries within manufacturing, such as fabricated
MANUFACTURING AND THE MONTANA ECONOMY

17 The State of Montana Manufacturing
metal products and chemicals, include many firms that sell nationwide or even worldwide.
The Montana Department of Labor and Industry reported that the employment multiplier for manufacturing is 3.58. This means that there will be 2.58 new jobs created elsewhere in the economy as a result of one new manufacturing job. The earnings multiplier is 2.72, suggesting that an additional $1.72 will be created in other Montana industries for each $1.00 in new manufacturing earnings.
Earnings in each of Montana’s basic
industries are shown in Figure 5. Manufacturing accounts for about 17 percent of total earnings in basic industries. This percentage differs from that reported in Table 3 because GDP is a measure of the value of production or output while the data in Figure 4 refers to the earnings of workers. Manufacturing and mining are tied as the second component of the state’s economic base ranking behind the federal government at 23 percent. Mining includes the oil and gas industry. The recent dramatic decline in oil prices will probably lead to fewer workers and reduce the size
Sources: Bureau of Business and Economic Research, Univer-sity of Montana-Missoula; Bureau of Economic Analysis, U.S. Department of Commerce.
Figure 5 Worker Earnings in Basic Industries, Montana 2011-2013
MANUFACTURING AND THE MONTANA ECONOMY
of this industry.
Manufacturing is a significant contributor to recent economic trends in Montana despite accounting for only 17 percent of the economic base. This importance is illustrated by the data in Figure 6, which presents the year-to-year changes in basic earnings by industry from 2009 to 2013. The changes in basic earnings may be decomposed by major sector, starting with the cycle trough in 2009, and are shown below.
2009-2010The economic recovery began.
Total nonfarm basic earnings grew $210 million. The largest increases were in mining ($133 million) and nonresident travel ($48 million) Manufacturing declined about $20 million.
2010-2011Total nonfarm basic earnings grew $355 million. The largest increases were in mining ($272 million) and transportation ($103 million). Manufacturing continued to decline (-$1 million) and the trend in the federal government turned negative (-$31 million).
2011-2012Total nonfarm basic earnings increased $288 million. The largest increases were in mining ($114 million) and nonresident travel ($90 million). Manufacturing began to grow ($44 million) and the declines in federal government continued (-$29 million).
Ag. and Related, 15%
Mining, 18%
Manufacturing, 17%
Nonresident Travel, 14% Transportation, 13%
Federal Civilian, 23%0
20
40
60
80
100 Military, 7%
2012-2013Total nonfarm basic earnings rose $204 million. The largest increase was in nonresident travel ($165 million). Mining, transportation and manufacturing each increased $30 to $38 million. The federal government continue to decline (-$64 million).

18 The State of Montana Manufacturing
Figure 6 Change in Nonfarm Basic Earnings, Montana
Source: U.S. Bureau of Economic Analysis.
$0
$100,000
$200,000
$300,000
$400,000
$500,000 Fed Gov'tTravelTransportationManufacturingMining
$-500,000
$-400,000
$-300,000
$-200,000
$-100,000
2010-11 2011-12 2012-13
This analysis illustrates a number of important points about the causes of economic growth in Montana. First, overall growth or decline in the basic industries is the net result of events in each of the basic industries. There are always some industries that are growing (or declining) faster or slower than others.
Secondly, there is usually no single cause of growth. None of the nonfarm basic industries was consistently the fastest (or slowest) growing during this period.
Finally, and perhaps most importantly, industries that represent a relatively small share of the economic base - such as manufacturing - can be major contributors to overall economic growth or decline during specific periods. For example, during 2011-12, manufacturing ranked right behind mining and nonresident travel in terms of its contribution to the total increase in basic earnings. On the minus side, manufacturing was the second largest declining industry in 2009-10.
MANUFACTURING AND THE MONTANA ECONOMY

19 The State of Montana Manufacturing
A CLOSER LOOK AT MONTANA MANUFACTURING
Manufacturing Establishments
There were 3,262 manufacturing establishments in Montana during 2013, as shown in Table 6 (page 20). The largest category is miscellaneous manufacturing (NAICS 339) with 680 establishments. The next largest categories were fabricated metal manufacturing (NAICS 332) with 482 establishments and food products (NAICS 312) with 360 establishments.
Employment Size
Montana manufacturers are mostly small businesses. As shown in Table 5, there were 636 establishments with one to four workers; they represented 51.7 percent of the 1,231 establishments with employees. There were 890 establishments with less than 10 workers, or 72.3 percent of the total. There were no Montana manufacturers with 500 employees or more. The 2013 Census Bureau data reports one establishment with more than 500 workers, but upon further investigation it was found to be incorrect.
EmploymentNumber of Establishments
Total 1,231
1 to 4 636
5 to 9 254
10 to 19 160
20 to 49 108
50 to 99 33
100 to 249 35
250 to 499 5
500 to 999 0
1,000 or more 0
Table 5 Manufacturing Establishments by Employment Size, Montana, 2012
Source: U.S. Bureau of the Census. Note: Does not include establishments with no employees.

20 The State of Montana Manufacturing
Composition of Manufacturing
The composition of the Montana manufacturing industry is not the same as its national counterpart. Industries that are important in Montana are not necessarily the same as those that are important nationwide.
Figures 7 and 8 present the composition of manufacturing earnings in Montana and the United States during 2013. The recent increases in world energy prices have distorted value of output measures for certain industries (such as petroleum refining), consequently earnings becomes the best measure of the composition of manufacturing because it is the amount earned by manufacturing workers in the state.
A CLOSER LOOK AT MONTANA MANUFACTURING
Table6 Manufacturing Establishments, Montana, 2012
NAICS Code
IndustryNumber of Establishments
Manufacturing 3,262
311 Food Products 360
312 Beverages & Tobacco 73
313 Textile Mills 19
314 Textile Product Mills 69
315 Apparel 129
316 Leather & Allied Products 128
321 Wood Products 344
322 Paper Manufacturing 6
323 Printing & Related 155
324 Petroleum & Coal Products 26
325 Chemicals 70
326 Rubber & Rubber Products 29
327 Nonmetalic Mineral Products 143
331 Primary Metals 39
332 Fabricated Metal Products 482
333 Machinery 111
334 Computer and Elec. Products 58
335 Elec. Equipment and Appliances
21
336 Transportation Equipment 62
337 Furniture and Related 258
339 Miscellaneous 680
Figure 7 Composition of Manufacturing, Montana, 2013 (Percent of Manufacturing Labor Income)
Figure 8 Composition of Manufacturing, United States, 2013 (Percent of Manufacturing Labor Income)
Source: U.S. Bureau of Economic Analysis.
FabricatedMetal 10.6
Wood Productsand Furniture 15.8
Petroleum andCoal Products17.3
Food Products10.5
Other26.4
Machinery7.0
Non-metallicminerals 7.2
Chemicals5.2
Computer& Electronics13.2
Other42.8
Machinery9.16.4
Food Products8.6
Fabricated Metal9.6
Chemicals10.4
Motor vehicles and parts
Source: U.S. Bureau of the Census. Note: Includes establishments with no employees.

21 The State of Montana Manufacturing
The largest component of U.S. manufacturing during 2013 was computers and electronics, which accounted for 13.1 percent of total manufacturing earnings. The next four industries were chemical products (10.4 percent), fabricated metals (9.6 percent), machinery (9.1 percent) and food products (8.6 percent).
The two largest Montana manufacturing industries in 2013 were associated with the processing of crude oil and forest resources. Petroleum and coal products (primarily oil refining) was the largest manufacturing industry; it accounted for 17.3 percent of total manufacturing earnings in 2013. The next largest industry was wood products and furniture (the paper products industry is now miniscule due to the 2010 shutdown of Smurfit-Stone), representing 15.8 percent of earnings. The wood products and furniture industry is still in first place when measured by employment (see Table 8). Fabricated metals and food products are the third and fourth largest sectors, account for 10.6 percent and 10.5 percent, respectively. Earnings in nonmetallic mines represented 7.2 percent of the total and machinery (which includes Applied Materials, formerly Semitool) accounted for 7.0 percent.
Manufacturing Employment
The number of manufacturing workers in the U.S. has declined steadily from 2003 to 2013, as shown in Table 7 (page 22). In Montana, manufacturing employment technically increased slightly between these two endpoints, but has remained relatively stable except for recession impacts in a few industries.
U.S. manufacturing employment decreased from 15.0 million workers in 2003 to 12.7 million in 2013, a drop of 28.1 percent. Manufacturing’s share of total employment declined from 9.0 percent to 7.0 percent during this period.
Montana manufacturing employment increased slightly from about 22,200 workers in 2003 to approximately 22,700 workers in 2013, an increase of roughly 3.2 percent. This modest overall increase masks decreases concentrated in a few industries: wood products, paper products, and primary metals refining. These declines occurred during the Great Recession of 2008 to 2010. As noted earlier, manufacturing employment has risen since the recession. The sectors experiencing the greatest increases will be identified later.
Manufacturing’s share of total statewide employment decreased from 3.9 percent in 2003 to 3.6 percent in 2013. Montana’s decrease in relative importance was 0.3 percentage points as compared to 2.0 percentage points nationwide.
A CLOSER LOOK AT MONTANA MANUFACTURING
22 The State of Montana Manufacturing
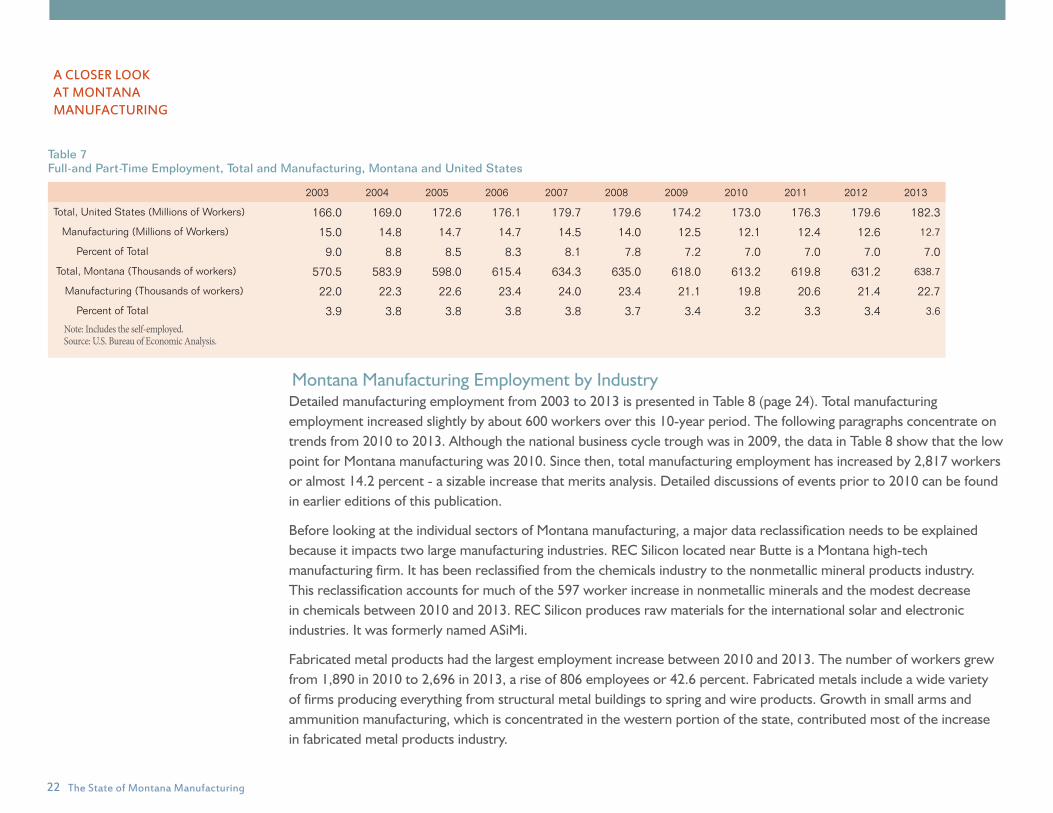
Table 7 Full-and Part-Time Employment, Total and Manufacturing, Montana and United States
2003 2004 2005 2006 2007 2008 2009 2010 2011 2012 2013
Total, United States (Millions of Workers) 166.0 169.0 172.6 176.1 179.7 179.6 174.2 173.0 176.3 179.6 182.3
Manufacturing (Millions of Workers) 15.0 14.8 14.7 14.7 14.5 14.0 12.5 12.1 12.4 12.6 12.7
Percent of Total 9.0 8.8 8.5 8.3 8.1 7.8 7.2 7.0 7.0 7.0 7.0
Total, Montana (Thousands of workers) 570.5 583.9 598.0 615.4 634.3 635.0 618.0 613.2 619.8 631.2 638.7
Manufacturing (Thousands of workers) 22.0 22.3 22.6 23.4 24.0 23.4 21.1 19.8 20.6 21.4 22.7
Percent of Total 3.9 3.8 3.8 3.8 3.8 3.7 3.4 3.2 3.3 3.4 3.6
Note: Includes the self-employed.Source: U.S. Bureau of Economic Analysis.
A CLOSER LOOK AT MONTANA MANUFACTURING
Montana Manufacturing Employment by IndustryDetailed manufacturing employment from 2003 to 2013 is presented in Table 8 (page 24). Total manufacturing employment increased slightly by about 600 workers over this 10-year period. The following paragraphs concentrate on trends from 2010 to 2013. Although the national business cycle trough was in 2009, the data in Table 8 show that the low point for Montana manufacturing was 2010. Since then, total manufacturing employment has increased by 2,817 workers or almost 14.2 percent - a sizable increase that merits analysis. Detailed discussions of events prior to 2010 can be found in earlier editions of this publication.
Before looking at the individual sectors of Montana manufacturing, a major data reclassification needs to be explained because it impacts two large manufacturing industries. REC Silicon located near Butte is a Montana high-tech manufacturing firm. It has been reclassified from the chemicals industry to the nonmetallic mineral products industry. This reclassification accounts for much of the 597 worker increase in nonmetallic minerals and the modest decrease in chemicals between 2010 and 2013. REC Silicon produces raw materials for the international solar and electronic industries. It was formerly named ASiMi.
Fabricated metal products had the largest employment increase between 2010 and 2013. The number of workers grew from 1,890 in 2010 to 2,696 in 2013, a rise of 806 employees or 42.6 percent. Fabricated metals include a wide variety of firms producing everything from structural metal buildings to spring and wire products. Growth in small arms and ammunition manufacturing, which is concentrated in the western portion of the state, contributed most of the increase in fabricated metal products industry.

23 The State of Montana Manufacturing
2003 2004 2005 2006 2007 2008 2009 2010 2011 2012 2013Change
2010-2013
Manufacturing 22,009 22,273 22,596 23,372 23,962 23,360 21,157 19,802 20,622 21,510 22,619 2,817
Durable goods 14,165 14,084 14,413 14,901 15,311 14,638 12,648 11,792 12,317 13,220 13,793 2,001
Wood products 5,324 5,292 5,288 5,219 4,956 4,390 3,354 3,065 3,094 3,087 3,278 213
Nonmetallic mineral products 1,138 1,109 1,114 1,096 1,169 1,088 997 938 1,016 1,468 1,517 579
Primary metals 445 332 341 338 487 439 278 173 200 190 209 36
Fabricated metal products 1,521 1,549 1,595 1,784 1,986 2,051 1,988 1,890 2,152 2,565 2,696 806
Machinery manufacturing 1,303 1,288 1,432 1,580 1,608 1,548 1,206 1,168 1,231 1,310 1,219 51
Computer and electronic products
482 479 502 582 583 593 452 435 560 568 628 193
Electrical equipment and appliances
129 194 200 216 228 259 234 206 200 191 162 -44
Motor vehicles and parts (D) (D) 342 402 409 (D) (D) 286 292 246 273 -13
Other transportation equipment
(D) (D) 237 222 208 (D) (D) 281 253 279 281 0
Furniture and related 1,310 1,348 1,331 1,305 1,233 1,251 1,085 971 965 911 957 -14
Miscellaneous 1,993 1,952 2,031 2,157 2,444 2,374 2,487 2,379 2,354 2,405 2,573 194
Nondurable goods 7,844 8,189 8,183 8,471 8,651 8,722 8,509 8,010 8,305 8,290 8,826 816
Food products 2,485 2,740 2,757 2,892 2,962 2,914 2,874 2,779 2,830 2,930 3,119 340
Beverage and tobacco 823 826 792 850 769 761 754 766 842 945 1,105 339
Textile mills (D) (D) (D) (D) 47 37 47 (D) (D) 47 (D) (D)
Textile product mills 230 223 201 209 238 238 238 226 219 211 213 -13
Apparel 272 298 314 338 (D) (D) (D) (D) (D) (D) 249 (D)
Leather and allied products 196 201 213 220 176 209 210 203 283 296 389 186
Paper (D) (D) (D) (D) (D) (D) (D) 180 (D) (D) (D) (D)
Printing and related 1,173 1,205 1,216 1,296 1,338 1,339 1,177 1,099 1,130 1,149 1,186 87
Petroleum and coal 938 903 939 962 988 1,076 1,113 1,088 1,140 1,098 1,085 -3
Chemical 766 800 773 754 885 954 969 997 1,122 859 962 -35
Plastics and rubber products 333 365 376 365 374 395 336 317 364 378 428 111
Note: Includes the self-employed. (D) denotes not shown to avoid disclosure of confidential information.Source: U.S. Burea of Economic Analysis.
Table 8 Full and Part-Time Manufacturing Employment, Montana 2003 to 2013
A CLOSER LOOK AT MONTANA MANUFACTURING
24 The State of Montana Manufacturing
The beverage and tobacco industry and food products are tied for second place, both increased about 340 workers between 2010 and 2012. Almost all of the increase in the beverage industry was in brewing and distilling of beer and liquor. Craft breweries, distilleries, and tasting rooms have opened in almost all the major urban areas and many of the smaller communities. The Hostess bakery in Billings closed in late 2012 but reopened under Franz ownership in early 2013.
Detailed data for the computer and electronic products and the leather and allied products industries are not available. Therefore, there is no further information concerning the 193 and 186 worker increases in these two sectors.
The Smurfit-Stone paper mill near Missoula, the largest manufacturing facility in the state, shut down in early 2010 due to a combination of market and structural factors. Although the exact number of jobs lost in the
paper industry is not reported in the data, there were 500-600 jobs at this facility. This plant has been scrapped and will not reopen.
The wood products industry experienced modest growth from 2010 and 2013. This industry declined by more than 50 percent in the 2002 to 2009 period. The decrease was the result of the Great Recession, which was disproportionately concentrated in housing and construction, and the long-term reduction in the supply of timber from federal lands and some industrial lands in Montana. The most recent increases reflect the recovery in the national housing market. Montana’s wood products industry in 2013 employed roughly 40 percent fewer workers than it did in 2003.
A CLOSER LOOK AT MONTANA MANUFACTURING

25 The State of Montana Manufacturing
Manufacturing Earnings
Montana manufacturing earnings from 2003 to 2013 are presented in Table 9 (page 27). The earnings figures have been corrected for inflation by converting them to 2013 dollars. Earnings are the wages and salaries plus certain employer-paid fringe benefits (such as retirement and health insurance) paid to full and part-time manufacturing workers.
A comparison of the data in Tables 8 and 9 reveal both similar and different trends in manufacturing earnings and employment. Trends in employment and earnings may diverge for a number of reasons. Employment trends reflect improvements in labor productivity and structural changes. On the other hand, earnings trends more closely mirror those of production and value of output rather than just the labor input.
Overall, manufacturing employment increased twice as fast as earnings in the post-recession period. From 2010 to 2013, employment rose 14.2 percent while earning were up 8.4 percent. There are no obvious causes for this discrepancy, but it may be one more example of a major feature of this business cycle where employment has been growing much faster than wages.
The reclassification of REC Silicon explains the 93.1 percent increase in nonmetallic mineral products and the 23.3 percent decrease in the chemical industry. The 76.7 percent growth in the relatively small other transportation equipment industry is mostly due to the purchase by Boeing of a Helena firm and its subsequent expansion.
The 46.7 percent increase in fabricated metal products reflects the armaments industry and just about equals the 42.6 percent rise in employment during the 2010 to 2013 period. The 26.5 percent increase in beverages and tobacco can be attributed to the new craft breweries and distilleries appearing around the state.
The 1.3 percent decrease in food products earnings is surprising given the sizable growth in employment from 2010 to 2013. The detailed data are not yet available so there are no information on the 37.5 percent decline in electrical equipment or the 22.5 percent increase in plastics and rubber products.
A CLOSER LOOK AT MONTANA MANUFACTURING

26 The State of Montana Manufacturing
2003 2004 2005 2006 2007 2008 2009 2010 2011 2012 2013Percent Change2010-13
Manufacturing 1,086,124 1,091,829 1,121,223 1,162,837 1,199,100 1,167,317 1,033,143 1,005,504 1,016,681 1,058,394 1,089,971 8.4
Durable goods 647,910 645,081 669,263 685,006 713,216 668,681 537,814 520,038 537,441 593,600 626,606 20.5
Wood product 262,332 266,496 264,942 254,620 242,384 209,705 146,381 135,338 138,027 138,587 151,001 11.6
Nonmetallic minerals 56,318 54,168 55,462 51,523 57,360 54,050 45,027 41,908 43,224 76,983 80,935 93.1
Primary metals 26,605 17,858 17,710 18,370 30,582 28,036 13,907 4,899 6,894 6,389 7,707 57.3
Fabricated metals 62,071 61,868 64,660 73,514 84,467 88,317 79,458 79,886 89,862 112,017 117,122 46.6
Machinery manufacturing 68,900 70,749 79,087 91,024 84,967 84,087 68,655 74,937 73,343 74,457 73,901 -1.4
Computer and electronics
24,679 23,773 29,971 28,522 31,302 29,986 22,265 22,145 27,674 29,566 31,664 43.0
Electrical equipment and appliances 8,120 10,271 10,828 11,690 12,382 14,804 13,130 12,924 11,758 11,134 8,082 -37.5
Motor vehicles and parts
(D) (D) 17,916 20,863 21,874 (D) (D) 16,623 17,360 13,354 15,300 -8.0
Other transportation equipment (D) (D) 9,889 9,641 9,237 (D) (D) 10,675 13,873 18,166 18,864 76.7
Furniture and related 40,113 40,499 40,636 40,893 39,934 40,058 30,736 27,480 27,214 26,368 27,675 0.7
Miscellaneous 73,521 72,051 78,162 84,345 98,726 93,015 95,166 93,222 88,212 86,578 94,355 1.2
Nondurable goods 438,214 446,747 451,960 477,831 485,884 498,635 495,329 485,467 479,240 464,794 463,365 -4.6
Food 99,895 108,815 108,239 113,059 114,337 115,168 115,052 115,552 112,467 111,579 114,091 -1.3
Beverages and tobacco
34,773 35,823 34,423 35,697 31,901 32,164 32,098 35,121 36,284 39,962 44,419 26.5
Textile mills (D) (D) (D) (D) 787 633 699 (D) (D) 649 (D) (D)
Textile product mills 5,610 5,730 5,328 5,621 6,343 6,545 6,230 6,333 6,162 5,716 5,537 -12.6
Apparel 7,785 10,175 9,680 10,456 (D) (D) (D) (D) (D) (D) 2,473 (D)
Leather and allied products
9,914 5,730 3,189 3,566 2,717 2,698 2,850 2,894 2,776 2,973 3,678 27.1
Paper manufacturing (D) (D) (D) (D) (D) (D) (D) 23,694 (D) (D) (D) (D)
Printing and related 40,716 41,230 42,002 45,649 49,574 50,353 41,890 39,053 40,916 42,124 42,826 9.7
Petroleum and coal 125,622 119,656 127,939 148,026 145,744 156,945 168,123 167,687 172,040 182,983 173,204 3.3
Chemical manufacturing 52,188 55,879 58,724 52,961 65,761 68,148 69,406 73,965 82,690 53,051 56,745 -23.3
Plastics and rubber products 9,634 10,817 11,557 12,648 14,255 14,208 13,383 14,488 15,731 16,385 17,754 22.5
Table 9 Manufacturing Earnings, Montana (Thousands of 2013 Dollars)
Note: Includes the income of the self-employed. (D) denotes not shown to avoid disclosure of confidential information.Source: U.S. Bureau of Economic Analysis.
A CLOSER LOOK AT MONTANA MANUFACTURING
27 The State of Montana Manufacturing
Wage and Salary Employment and Per Worker Wages
This section examines Montana employment and per worker wages and salaries in manufacturing and compares them to other industries in the state and to corresponding nationwide data. Montana 2013 employment and per worker wages and salaries are presented in Table 10 (page 29). These employment figures differ from those reported in Tables 7 and 8 because they do not include the self-employed.
Wages and salaries directly measure the payments to workers and represent the amount they have available for current spending. Other compensation measures (such as earnings) include estimates of employer-paid benefits that may not lead to local spending by workers.
The average Montana manufacturing worker earned $44,781 in 2013, about 18.8 percent higher than the average of $37,707 for all workers. The highest wages within manufacturing reported in Table 10 were the $107,151 in petroleum and coal products. This industry is dominated by highly skilled workers at the oil refineries near Billings and Great Falls.
After petroleum and coal products, the highest per worker wages and salaries were the $57,984 earned in other transportation equipment. Next was the $57,363 earned in machinery manufacturing. The lowest paying manufacturing jobs were in leather and allied products ($25,075) and textile product mills ($22,172), both very small sectors employing less than 200 Montanans.
Montana incomes are generally less than their corresponding U.S. averages. This is also true for wages and salaries per worker. Average wages and salaries for all Montana workers were $37,707 in 2013, about 75.4 percent of the national average. Montana manufacturing wages per worker were about 70.3 percent of the U.S. figure. Within manufacturing, only wood products and apparel workers had average wages above their respective national average. The apparel industry employed only 39 workers in 2013. The lowest was for computer and electronics workers, who earned only 41.4 percent of their national counterparts.
A CLOSER LOOK AT MONTANA MANUFACTURING

28 The State of Montana Manufacturing
Wage and Salary
Employment
Wages and Salaries Per
Worker(Current Dollars)
Wages and Salaries Per
Worker(Percent of
U.S.)
Leather and allied products 80 25,075 60.3
Paper (D) (D) (D)
Printing and related 954 35,404 76.2
Petroleum and coal 1,068 107,151 99.2
Chemical 868 46,423 51.6
Plastics and rubber products 402 34,455 69.7
Wholesale trade 17,139 50,792 73.1
Retail trade 56,545 25,856 90.0
Transportation and warehousing 15,036 49,599 98.2
Information 6,916 43,991 50.1
Finance and insurance 15,961 55,558 60.0
Real estate and rental and leasing 5,433 30,432 60.8
Professional and technical services 20,261 54,362 64.6
Management of companies 1,973 73,024 66.0
Administrative and waste services 17,780 28,761 80.4
Educational services 5,924 21,712 55.7
Health care and social assistance 63,355 41,071 90.0
Arts, entertainment, and recreation 11,332 20,887 56.8
Accommodation and food services 49,077 16,996 83.4
Other services 20,643 26,835 82.8
Federal, civilian 13,076 61,794 84.2
Military 8,299 35,465 75.5
State and local 73,423 36,891 79.8
Note: ((D) denotes not shown to avoid disclosure of confidential information.Source: U.S. Burea of Economic Analysis.
Table 10 Employment and Wages and Salaries per Worker, By Industry, Montana, 2013
Wage and Salary
Employment
Wages and Salaries Per
Worker(Current Dollars)
Wages and Salaries Per
Worker(Percent of
U.S.)
Total, All Industries 466,710 37,707 75.4
Farm 5,758 39,900 118.1
Nonfarm 460,952 37,679 75.2
Forestry, fishing, and Other 3,428 30,101 106.1
Mining 8,825 83,430 84.8
Utilities 3,178 78,702 81.0
Construction 24,983 44,781 83.3
Manufacturing 18,365 43,670 70.3
Durable goods 11,127 42,872 65.4
Wood products 2,789 42,063 105.3
Nonmetallic minerals 1,291 50,403 95.7
Primary metals 165 35,297 55.9
Fabricated metal products 2,236 39,574 75.1
Machinery 1,029 57,363 87.8
Computer and electronics 580 42,286 41.4
Electrical equipment and appliances 112 52,098 81.5
Motor vehicles and parts 271 43,649 73.3
Other transportation equipment 246 57,984 69.0
Furniture and related 626 33,644 81.7
Miscellaneous 1,782 35,803 60.4
Nondurable goods 7,238 44,897 79.9
Food 2,561 32,688 75.3
Beverage and tobacco 1,014 28,603 54.0
Textile mills (D) (D) (D)
Textile product mills 186 22,172 58.7
Apparel 39 46,564 127.1
A CLOSER LOOK AT MONTANA MANUFACTURING

29 The State of Montana Manufacturing
Montana’s Manufacturing Exports
Montana manufacturers are competitive in international markets and have over the long-term been expanding internationally to broaden their markets and enhance their sales. Recently, however, deteriorating economic conditions in Europe and Asia have stunted demand in these important markets for Montana manufacturing exports.
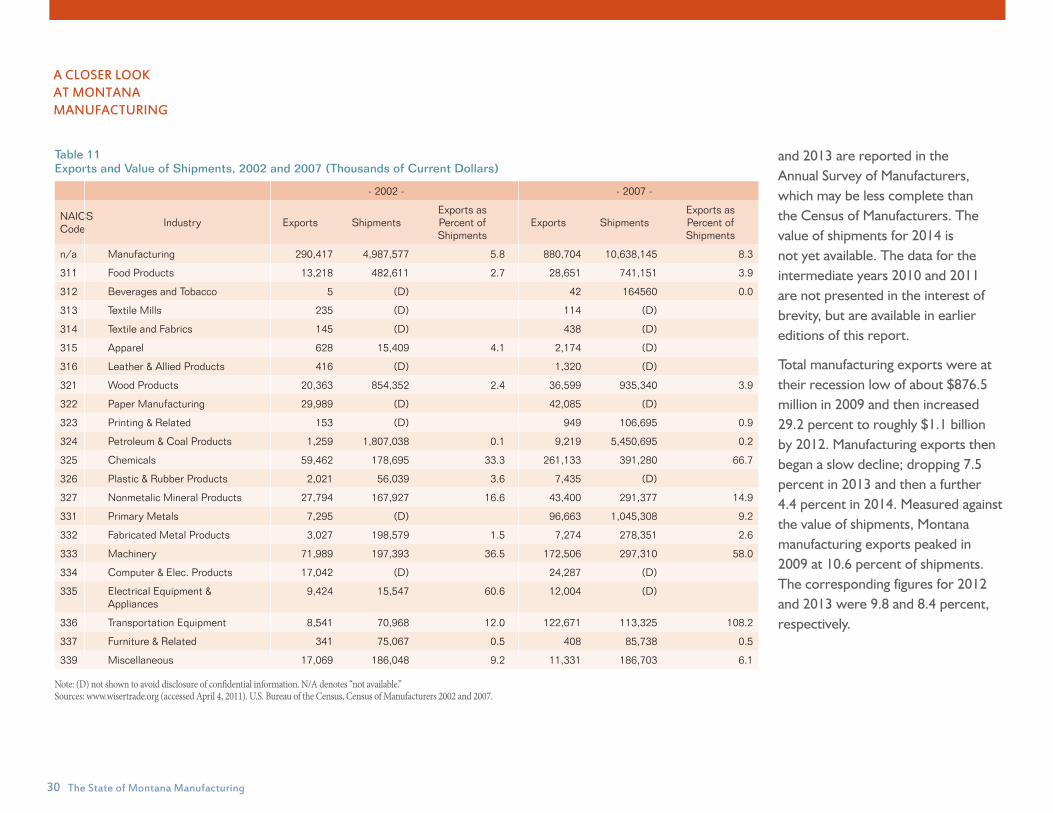
Table 11 (page 30) presents manufacturing exports by industry for 2002 and 2007 along with the value of shipments for many of the same industries. The shipment data were reported in the Census of Manufacturers for 2002 and 2007. Montana manufacturing exports rose from $290.4 million in 2002 to $880.7 million in 2007, about tripling in nominal dollars. Overall, exports rose from 5.8 percent of shipments in 2002 to 8.3 percent of shipments in 2007.
The chemical industry exported 33.3 percent of it shipments in 2002 and
66.7 percent in 2007. There are no data for individual firms, but REC Silicon was then classified in chemicals and exports much of its production of polysilicon. Fertilizer and agricultural chemical manufacturers are also classified in chemicals, and they have traditionally served certain Canadian markets. Machinery exported about 36.5 percent of it shipments in 2002 and 58.0 percent in 2007. Applied Materials (formerly Semitool) is classified in machinery and sells its high-tech products to customers worldwide. Electrical equipment exported 60.6 percent of its shipments in 2002, but the value of shipments is not disclosed in 2007. This category includes an electrical power tool maker (Jore Corp), which underwent financial reorganization.
There may be a data error for the transportation equipment industry (NAICS 337). Reported exports exceed the value of shipments ($122.7
million vs. $113.3 million). Since the value of exports is derived from a sample while the value of shipments is based on a census, the error is more likely in the former than the latter.
With only a few exceptions, all Montana manufacturing industries increased exports between 2002 and 2007, both in nominal dollars and as a share of shipments. Chemical industry exports (which include REC Silicon) grew more than four-fold in nominal value, and their share of shipments doubled from 33.3 percent to 66.7 percent. Machinery industry exports (which include Applied Materials) more than doubled, and their share of shipments rose from 36.5 percent in 2002 to 58.0 percent in 2007.
Export data for 2009 and 2012 to 2014 are presented in Table 12. The value of shipments for 2012 is reported in the just released Census of Manufacturers. The value of shipments data for 2009
A CLOSER LOOK AT MONTANA MANUFACTURING
30 The State of Montana Manufacturing
Note: (D) not shown to avoid disclosure of confidential information. N/A denotes “not available.”Sources: www.wisertrade.org (accessed April 4, 2011). U.S. Bureau of the Census, Census of Manufacturers 2002 and 2007.
- 2002 - - 2007 -
NAICS Code
Industry Exports ShipmentsExports as Percent of Shipments
Exports ShipmentsExports as Percent of Shipments
n/a Manufacturing 290,417 4,987,577 5.8 880,704 10,638,145 8.3
311 Food Products 13,218 482,611 2.7 28,651 741,151 3.9
312 Beverages and Tobacco 5 (D) 42 164560 0.0
313 Textile Mills 235 (D) 114 (D)
314 Textile and Fabrics 145 (D) 438 (D)
315 Apparel 628 15,409 4.1 2,174 (D)
316 Leather & Allied Products 416 (D) 1,320 (D)
321 Wood Products 20,363 854,352 2.4 36,599 935,340 3.9
322 Paper Manufacturing 29,989 (D) 42,085 (D)
323 Printing & Related 153 (D) 949 106,695 0.9
324 Petroleum & Coal Products 1,259 1,807,038 0.1 9,219 5,450,695 0.2
325 Chemicals 59,462 178,695 33.3 261,133 391,280 66.7
326 Plastic & Rubber Products 2,021 56,039 3.6 7,435 (D)
327 Nonmetalic Mineral Products 27,794 167,927 16.6 43,400 291,377 14.9
331 Primary Metals 7,295 (D) 96,663 1,045,308 9.2
332 Fabricated Metal Products 3,027 198,579 1.5 7,274 278,351 2.6
333 Machinery 71,989 197,393 36.5 172,506 297,310 58.0
334 Computer & Elec. Products 17,042 (D) 24,287 (D)
335 Electrical Equipment & Appliances
9,424 15,547 60.6 12,004 (D)
336 Transportation Equipment 8,541 70,968 12.0 122,671 113,325 108.2
337 Furniture & Related 341 75,067 0.5 408 85,738 0.5
339 Miscellaneous 17,069 186,048 9.2 11,331 186,703 6.1
and 2013 are reported in the Annual Survey of Manufacturers, which may be less complete than the Census of Manufacturers. The value of shipments for 2014 is not yet available. The data for the intermediate years 2010 and 2011 are not presented in the interest of brevity, but are available in earlier editions of this report.
Total manufacturing exports were at their recession low of about $876.5 million in 2009 and then increased 29.2 percent to roughly $1.1 billion by 2012. Manufacturing exports then began a slow decline; dropping 7.5 percent in 2013 and then a further 4.4 percent in 2014. Measured against the value of shipments, Montana manufacturing exports peaked in 2009 at 10.6 percent of shipments. The corresponding figures for 2012 and 2013 were 9.8 and 8.4 percent, respectively.
Table 11 Exports and Value of Shipments, 2002 and 2007 (Thousands of Current Dollars)
A CLOSER LOOK AT MONTANA MANUFACTURING

31 The State of Montana Manufacturing
Table 12 Exports and Value of Shipments, 2009 to 2013 (Thousands of Current Dollars)
- 2009 - -2012- -2013- -2014*-
NA-ICS Code
Industry Exports ShipmentsExports as Percent of Shipments
Exports ShipmentsExports as Percent of Shipments
Exports ShipmentsExports as Percent of Shipments
Exports
n/a Manufacturing 876,500 8,293,186 10.6 1,132,600 11,535,236 9.8 1,047,011 12,443,029 8.4 1,012,772
311 Food Products 32,135 772,217 4.2 65,396 879,231 7.4 66,326 1,031,950 6.4 57,569
312 Beverages and Tobacco 28 (D) 10,876 170,855 6.4 42,499 217,318 19.5 45,375
313 Textile Mills 401 (D) 497 (D) 1,271 (D) 1,355
314 Textile and Fabrics 391 (D) 500 25,601 2.0 717 (D) 684
315 Apparel 1,793 (D) 2,887 577 3,658 1,087 4,521
316 Leather & Allied Products 2,855 (D) 2,713 (D) 3,843 (D) 4,721
321 Wood Products 19,751 580,252 3.4 36,105 616,712 5.9 33,291 917,912 3.6 35,178
322 Paper Manufacturing 32,805 (D) 455 (D) 379 (D) 236
323 Printing & Related 959 (D) 1,591 (D) 1,108 102,860 1.1 3,210
324 Petroleum & Coal Products
22,800 4,117,780 0.6 148,973 (D) 91,643 6,804,582 1.3 69,589
325 Chemicals 302,928 (D) 326,674 (D) 278,815 554,892 50.2 313,404
326 Plastic & Rubber Products
3,716 (D) 11,620 59,369 19.5 21,320 (D) 30,590
327 Nonmetalic Mineral Products
39,500 244,985 16.1 72,715 (D) 70,592 (D) 84,931
331 Primary Metals 121,453 (D) 28,371 (D) 50,235 (D) 50,119
332 Fabricated Metal Products
7,311 277,670 2.6 18,765 331,262 5.7 38,558 365,288 10.5 34,181
333 Machinery 156,425 195,022 80.2 219,288 326,465 67.1 163,292 244,460 66.8 120,526
334 Computer & Elec. Products
22,293 (D) 37,826 (D) 34,863 45980 75.8 43,968
335 Electrical Equipment & Appliances
16,305 (D) 14,702 (D) 16,058 (D) 17,006
336 Transportation Equipment
76,731 (D) 104,663 (D) 103,883 (D) 65,624
337 Furniture & Related 680 (D) 1,426 49,666 2.9 1,369 (D) 2,177
339 Miscellaneous 15,239 205,714 7.4 26,557 246,859 10.8 23,291 (D) 27,810
A CLOSER LOOK AT MONTANA MANUFACTURING
* 2012 shipments and exports as percent of shipments data not available. Note: (D) not shown to avoid disclosure of confidential information. NA denotes not available.Sources: www.wisertrade.org. U.S. Bureau of the Census, Annual Survey of Manufacturers 2009 and 2010.

32 The State of Montana Manufacturing
The disappointing trends in both value of exports and their percentage of shipments are mostly due to international exchange rates and conditions in Montana’s export markets rather than the ability of our firms to compete in the world market. Other data, which will be presented shorty, will show that Montana’s major export markets are in Europe and Asia. Both of these regions are currently experiencing near recession conditions or much slower growth. In addition, the value of the U.S. dollar has risen sharply since mid-2014, which makes our products more expensive in foreign markets.
A closer look at the exports for individual manufacturing industries reveals a mixture of trends. Montana’s largest exporting industry continues to be chemicals, consisting mostly of agricultural-related products to Canada. The reclassification of REC Silicon probably caused the slight
decline between 2012 and 2013. The second largest exporter is machinery manufacturing, which includes Applied Materials in Kalispell. After peaking in 2012, these exports have declined almost 45.2 percent by 2014. The REC Silicon reclassification had the effect of lifting nonmetallic mineral products to third place among export industries. There is probably a data error in the 2013 entries for the apparel industry, where reported exports are great than reported shipments.
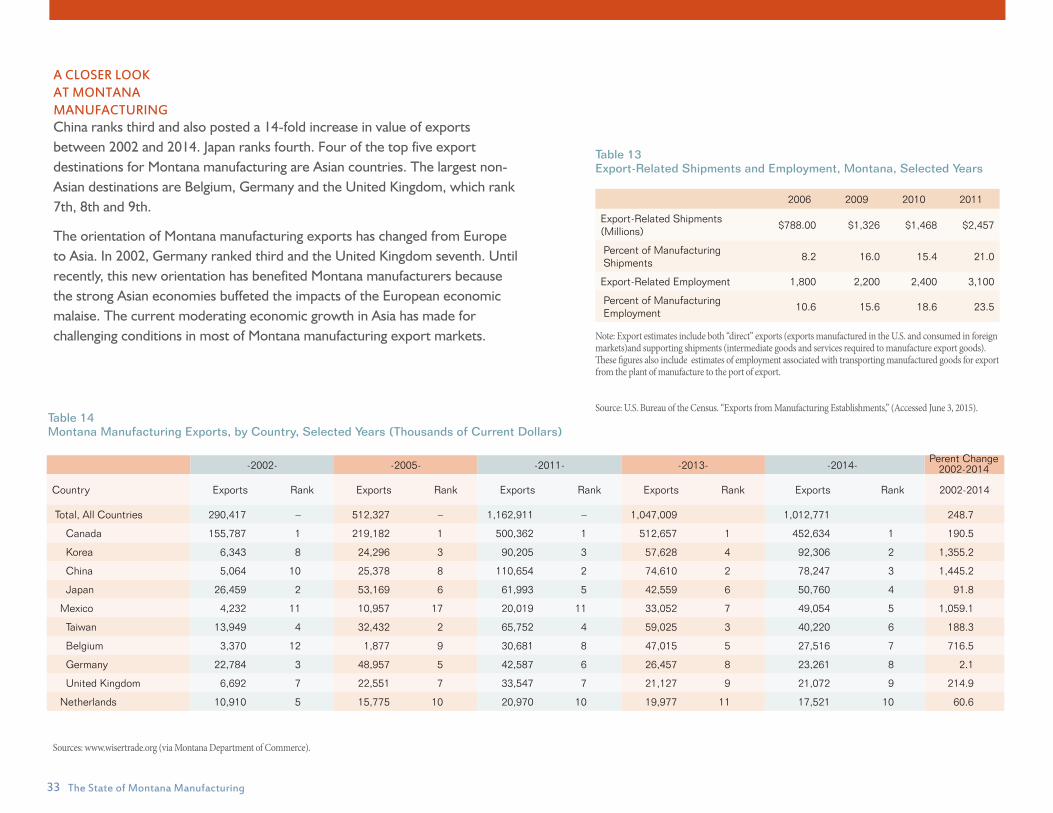
A somewhat different perspective of Montana manufacturing exports is presented in Table 13 which reports data prepared by the U.S. Census Bureau. These figures provide a somewhat broader picture of manufacturing exports and include export shipments themselves and also the value of supporting activities. The employment associated with these exports and supporting services
are also presented. The shipments and employment data presented in Table 13 are not comparable to the figures elsewhere in this report. The value of manufacturing exports (plus supporting activities) rose from 8.2 percent of total shipments in 2006 to 21.0 percent in 2011. Similarly, the employment associated with these exports and supporting activities increased from 10.6 percent of total manufacturing employment in 2006 to 23.5 percent in 2011. The Census Bureau does not regularly update these estimates and the data for 2011 are the latest available. The 2011 data predate the slowdown in Montana’s export markets and the recent rise in the value of the U.S. dollar.
Table 14 identifies the destination of Montana manufacturing exports. Canada consistently ranks number one as the major destination. Korea is second with an almost 14-fold increase between 2002 and 2014.
A CLOSER LOOK AT MONTANA MANUFACTURING
33 The State of Montana Manufacturing
Table 13 Export-Related Shipments and Employment, Montana, Selected Years
2006 2009 2010 2011
Export-Related Shipments (Millions)
$788.00 $1,326 $1,468 $2,457
Percent of Manufacturing Shipments
8.2 16.0 15.4 21.0
Export-Related Employment 1,800 2,200 2,400 3,100
Percent of Manufacturing Employment
10.6 15.6 18.6 23.5
Note: Export estimates include both “direct” exports (exports manufactured in the U.S. and consumed in foreign markets)and supporting shipments (intermediate goods and services required to manufacture export goods). These figures also include estimates of employment associated with transporting manufactured goods for export from the plant of manufacture to the port of export.
Source: U.S. Bureau of the Census. “Exports from Manufacturing Establishments,” (Accessed June 3, 2015).
China ranks third and also posted a 14-fold increase in value of exports between 2002 and 2014. Japan ranks fourth. Four of the top five export destinations for Montana manufacturing are Asian countries. The largest non-Asian destinations are Belgium, Germany and the United Kingdom, which rank 7th, 8th and 9th.
The orientation of Montana manufacturing exports has changed from Europe to Asia. In 2002, Germany ranked third and the United Kingdom seventh. Until recently, this new orientation has benefited Montana manufacturers because the strong Asian economies buffeted the impacts of the European economic malaise. The current moderating economic growth in Asia has made for challenging conditions in most of Montana manufacturing export markets.
-2002- -2005- -2011- -2013-
Country Exports Rank Exports Rank Exports Rank Exports Rank Exports Rank 2002-2014
Total, All Countries 290,417 – 512,327 – 1,162,911 – 1,047,009 1,012,771 248.7
Canada 155,787 1 219,182 1 500,362 1 512,657 1 452,634 1 190.5
Korea 6,343 8 24,296 3 90,205 3 57,628 4 92,306 2 1,355.2
China 5,064 10 25,378 8 110,654 2 74,610 2 78,247 3 1,445.2
Japan 26,459 2 53,169 6 61,993 5 42,559 6 50,760 4 91.8
Mexico 4,232 11 10,957 17 20,019 11 33,052 7 49,054 5 1,059.1
Taiwan 13,949 4 32,432 2 65,752 4 59,025 3 40,220 6 188.3
Belgium 3,370 12 1,877 9 30,681 8 47,015 5 27,516 7 716.5
Germany 22,784 3 48,957 5 42,587 6 26,457 8 23,261 8 2.1
United Kingdom 6,692 7 22,551 7 33,547 7 21,127 9 21,072 9 214.9
Netherlands 10,910 5 15,775 10 20,970 10 19,977 11 17,521 10 60.6
Table 14 Montana Manufacturing Exports, by Country, Selected Years (Thousands of Current Dollars)
Sources: www.wisertrade.org (via Montana Department of Commerce).
A CLOSER LOOK AT MONTANA MANUFACTURING
-2014-Perent Change
2002-2014

34 The State of Montana Manufacturing