the state of the humanities 2018: graduates in the ... a more nuanced discussion about the...
TRANSCRIPT

american academy of arts & sciences
THE STATE OF THE HUMANITIES 2018:
GRADUATES IN THEWORKFORCE & BEYOND
humanitiesindicators.org

136 Irving Street Cambridge, MA 02138
Telephone: 617-576-5000 Email: [email protected]
Website: www.amacad.org

THE STATE OF THE HUMANITIES 2018: WORKFORCE & BEYOND
Table of Contents
3 Introduction
4 A Note on Interpreting the Information
5 Earnings Comparison: Workers with a Terminal Bache-lor’s Degree (by Field) Versus Those Without a Four-Year Degree, 2015
6 Earnings of Workers with a Bachelor’s Degree, by Highest Degree and Field of Bachelor’s, 2015
7 Gender Earnings Gap among Workers with at Least a Bachelor’s Degree, by Highest Degree and Field of Bachelor’s, 2015
8 The Effect of Work Experience on the Relative Earnings of Humanities Graduates: Comparing the Earnings Gap for Younger Workers with That for Older Workers, 2015
9 Amount Borrowed by Bachelor’s Degree Holders to Finance Undergraduate Education, by Age and Field of Bachelor’s Degree, 2015
10 Bachelor’s Degree Holders’ Financial Satisfaction, by Field of Bachelor’s Degree, 2014
11 Unemployment among Humanities Bachelor’s Degree Holders, by Highest Degree and Age, 2013 and 2015
12 Unemployment among Bachelor’s Degree Holders, by Highest Degree and Field of Bachelor’s, 2015
13 Humanities Bachelor’s Degree Holders’ Satisfaction with Various Aspects of Their Principal Job (Compared with All Bachelor’s Holders), 2015
14 Occupational Distribution of Humanities Bachelor’s De-gree Holders, by Highest Degree, 2015
15 Percentage and Number of Workers with a Humanities Bachelor’s Degree, by Occupation, 2015
16 Activities Engaged in as Part of Principal Job by Human-ities Bachelor’s Degree Holders (as Compared to All Bachelor’s Degree Holders), 2015
17 Employer Ratings of Four-Year College Graduates Enter-ing Workforce on Readiness in Certain “Basic” Skills, 2006
18 Bachelor’s Degree Holders’ Perception of Relationship between Job and Degree, 2015
19 Bachelor’s Degree Holders Indicating They Are “Very” or “Somewhat” Satisfied with Their Job, by Highest Degree and Field of Bachelor’s, 2015
20 Bachelor’s Degree Holders’ Job Satisfaction, by Field of Bachelor’s Degree, 2014
21 Bachelor’s Degree Holders Who Agree That “At Work, I Have the Opportunity to Do What I Do Best Every Day,” by Graduation Cohort and Field of Bachelor’s Degree, 2014
22 Bachelor’s Degree Holders’ Satisfaction with Aspects of Their Principal Job, by Field of Bachelor’s Degree, 2015
23 Satisfaction of Humanities Bachelor’s Degree Holders with Aspects of Their Principal Job, by Highest Degree, 2015
24 “My Best Possible Life”: Bachelor’s Degree Holders’ Belief in Attainment, by Field of Degree and Point in Time, 2014
25 Endnotes
The State of the Humanities 2018: Graduates in the Workforce & Beyond 1


THE STATE OF THE HUMANITIES 2018: WORKFORCE & BEYOND
Introduction
Discussions about the value of a college degree in the humanities have become something of a cottage industry of late. Opinions range from enthusiastic support of the long-term
benefits of humanities degrees to resigned acceptance or acid humor regarding the ostensibly grim career outcomes of graduates from the field. As the number of students graduating with degrees in the humanities started to drop in recent years, these conversations appeared to take on increased urgency.1
Much of the conversation rests on certain basic assumptions about how to measure the value of a degree and a career, starting with the belief that the earnings of a college graduate are the foremost gauge of a degree’s worth. This report, based largely on original research commissioned by the American Academy of Arts and Sciences’ Humanities Indicators, exam-ines a broader range of measures about holders of four-year bachelor’s degrees, including graduates’ satisfaction with their jobs, finances, and lives generally. The evidence shows that humanities graduates earn less and have slightly higher levels of unemployment relative to science and engineering majors. With respect to perceived well-being, however, humanities majors are quite similar to graduates from other fields. The data cannot explain the dispar-ity between the objective and subjective measures, but they should provide a starting point for a more nuanced discussion about the relationship between field of undergraduate study, employment, and quality of life.
This report reflects the ongoing mission of the Humanities Indicators, a nationally recognized source of nonpartisan information on the state of the humanities. The Indicators website (www.HumanitiesIndicators.org) features 103 topics and includes more than 500 graphs and data tables detailing the state of the humanities. The project draws on data sources that meet the highest standards of social scientific rigor, relying heavily on the products of the U.S. federal statistical system. In producing this report, the Indicators staff also received crucial support from Louis Tay and Christopher Wiese (Purdue University), who provided special data runs from the Gallup-Purdue Index survey of college alumni.
The State of the Humanities 2018: Graduates in the Workforce & Beyond 3

This report supplies median earnings figures for each of the major academic fields. A median is valuable because it provides a succinct way of describing the middle of a population, but
it may also mask considerable differences among individuals. It is important to keep in mind that there are graduates from each field who make considerably more, and others who make considerably less than the median. Please see the Humanities Indicators website for more information about the range of earnings found among each field’s graduates.
The fields also differ with respect to their graduates’ demographics and other characteris-tics. Where these characteristics are correlated with an outcome we are interested in—for example, earnings or job satisfaction—these differences among the makeup of the graduate populations of these fields have what are known as “compositional effects” on group out-comes. For example, bachelor’s degree recipients in the humanities are substantially more likely than degree recipients in engineering to be women. Thus, to the extent there is a gender gap in earnings (as reported on page 7), the median earnings for all humanities graduates will be more affected by that gap than graduates from engineering programs. For more detailed breakdowns of earnings by age and gender, see the Indicators website.
A Note on Interpreting the Information
4 www.humanitiesindicators.org
THE STATE OF THE HUMANITIES 2018: WORKFORCE & BEYOND

$0
$20,000
$40,000
$60,000
$80,000
$100,000
$120,000
Med
ian
Annu
al E
arni
ngs
Field of Bachelor's Degree or Education Level
Workerswithout
Bachelor’sDegrees
Workers with Terminal Bachelor's Degrees
Engine
ering
Physic
al Scie
nces
Busine
ss
Health
& Med
ical S
cienc
es
All Fiel
ds
Behav
ioral
& Social
Scienc
es
Human
ities
Life S
cienc
es Arts
Educa
tion
Assoc
iate’s
or Som
e Coll
ege
Only H
igh Sch
ool D
iplom
a
Earnings Comparison: Workers2 with a Terminal Bachelor’s Degree (by Field) Versus Those Without a Four-Year Degree, 2015
Earnings are often the key data point in conversations about the value of college degrees—in part because they are relatively easy to measure. Median annual earnings for workers with just a terminal bachelor’s degree in the humanities stood at $52,000 in 2015, which was somewhat lower than the median for all col-lege graduates ($60,000) and substantially lower than the median for those in engineering ($82,000). Never-theless, the median for the humanities was equal to
the earnings for graduates from the life sciences and higher than those with a baccalaureate degree in the arts ($48,000) and education ($44,000).
While humanities earnings are lower than those among STEM and business graduates, they are higher than those of workers who lack bachelor’s degrees—either those with an associate’s degree or some college ($40,000) or those with only a high school diploma ($34,000).3
The State of the Humanities 2018: Graduates in the Workforce & Beyond 5
THE STATE OF THE HUMANITIES 2018: WORKFORCE & BEYOND

$0
$20,000
$40,000
$60,000
$80,000
$100,000
$120,000
Med
ian
Annu
al E
arni
ngs
Field of Bachelor's Degree
Bachelor's Degree
Advanced Degree (in Any Field)
Engine
ering
Physic
al Scie
nces
Busine
ss
Health
& Med
ical S
cienc
es
All Fiel
ds
Behav
ioral
& Social
Scienc
es
Human
ities
Life S
cienc
es Arts
Educa
tion
Earnings of Workers with a Bachelor’s Degree, by Highest Degree and Field of Bachelor’s, 2015
Obtaining an advanced degree makes a substantial difference in the earnings of college graduates. Among humanities graduates, advanced degree holders had median earnings that were 38% higher than those of workers with only a bachelor’s degree ($72,000 as compared to $52,000). In 2015, 41% of human-ities bachelor’s degree holders had also earned an advanced degree (which was 5 percentage points above the share of graduates in all fields combined).
Taking all fields together, advanced degree holders earned 33% more than their counterparts with just a bachelor’s degree.
For every humanities discipline, advanced degree hold-ers made substantially more than workers with only bachelor’s degrees. The earnings differential ranged from $15,000 (in communication) to $27,000 (for grad-uates from area studies, ethnic studies, and history).4
6 www.humanitiesindicators.org
THE STATE OF THE HUMANITIES 2018: WORKFORCE & BEYOND

Unfortunately, gender also makes a substantial dif-ference in graduates’ subsequent earnings. Across all fields, women earn substantially less than their male counterparts, though the 20% gender gap in earnings among holders of terminal bachelor’s degrees in the humanities was smaller than that for the science fields.
In most fields, including the humanities, the gap in earnings between men and women was larger for advanced degree holders, though the difference for graduates with a bachelor’s degree in the humanities was relatively modest.5
Gender Earnings Gap among Workers with at Least a Bachelor’s Degree, by Highest Degree and Field of Bachelor’s, 2015
Engine
ering
Physic
al Scie
nces
Busine
ss
Health
& Med
ical S
cienc
es
All Fiel
ds
Behav
ioral
& Social
Scienc
es
Human
ities
Life S
cienc
es Arts
Educa
tion
0
5
10
15
20
25
30
35
Perc
enta
ge G
ap in
Ear
ning
s
Field of Bachelor's Degree
Terminal Bachelor's Holders Advanced Degree Recipients (in Any Field)
The State of the Humanities 2018: Graduates in the Workforce & Beyond 7
THE STATE OF THE HUMANITIES 2018: WORKFORCE & BEYOND

20
15
10
5
0
5
10
15
20
Perc
enta
ge P
oint
s
Field of Bachelor's Degree
Worsening of Humanities—OtherMajor Earnings Gap
Improvement in Humanities—OtherMajor Earnings Gap
Each bar represents the extent to which the earnings gap between the humanities and the comparison field improves or worsens as a worker increases in age.
Engine
ering
Physic
al Scie
nces
Busine
ss
Health
& Med
ical S
cienc
es
All Fiel
ds
Behav
ioral
& Social
Scienc
es
Life S
cienc
es
Red & Black Bars: Terminal Bachelor’s Degree HoldersGrey & Pink Bars: Advanced Degree Holders
The Effect of Work Experience on the Relative Earnings of Humanities Graduates: Comparing the Earnings Gap for Younger Workers with That for Older Workers, 2015
The gap in earnings between humanities majors and several of the higher-earning majors is less pro-nounced for older workers. The figure above indicates how the gap for workers ages 24 to 34 compares with that found among workers ages 35 to 54. For example, the earnings gap between humanities and business majors is two percentage points smaller for
older workers with terminal bachelor’s degrees than younger workers with the same level of education. The gap is almost six-and-a-half percentage points nar-rower among advanced degree holders. The earnings differential between the humanities and the natural science fields, however, is larger among older workers, particularly for advanced degree holders.6
8 www.humanitiesindicators.org
THE STATE OF THE HUMANITIES 2018: WORKFORCE & BEYOND

Amount Borrowed by Bachelor’s Degree Holders7 to Finance Undergraduate Education, by Age and Field of Bachelor’s Degree, 2015
Another financial concern raised about humanities degrees, one closely related to the issue of earnings, is the burden of student debt acquired during college study. A comparison of debt levels among college graduates in 2015, however, shows only negligible differences between humanities and non-humanities graduates across all age cohorts. In the humanities, as is true for the larger college graduate population,
graduates tend to have either no debt or a consider-able amount early in life. Even among those age 55 and older, almost 6% of graduates reported they still carried more than $10,000 in debt from their under-graduate studies (as compared to 66% without debt). Here again, there was no difference between human-ities graduates and graduates generally.8
0
10
20
30
40
50
60
70
80
90
100
Under 35 35-54 55 and older Under 35 35-54 55 and older
No Debt Over $10,000 in Debt
Perc
ent
Age Cohort and Debt
Humanities All Fields
The State of the Humanities 2018: Graduates in the Workforce & Beyond 9
THE STATE OF THE HUMANITIES 2018: WORKFORCE & BEYOND

0
10
20
30
40
50
60
70
80
90
100
Engineering NaturalSciences
Humanities Education Business SocialSciences
Arts
Perc
ent A
gree
ing
with
Sta
tem
ent
Field of Bachelor's Degree
I have enough money to do everything I want to do.
In the last seven days, I have worried about money.
Bachelor’s Degree Holders’ Financial Satisfaction, by Field of Bachelor’s Degree, 2014
Despite the variations in earnings between the fields, there was considerable similarity in graduates’ per-ceptions of their personal financial situation, as col-lege graduates from most fields appeared to have sim-ilar levels of comfort (and discomfort). Even among workers holding bachelor’s degrees in the highly paid field of engineering, only a bare majority (51%) said they had enough money to “do everything I want to do.” In comparison, 45% of graduates in the natural
sciences and 42% of respondents in the humanities indicated they had enough money. Conversely, more than half of arts graduates (51%) reported they had worried about money in the past seven days, and 47% of the graduates from the social sciences shared that concern. The share of humanities graduates who had recently worried about money (42.4%) was close to the shares of graduates from the natural sciences, education, and business.9
10 www.humanitiesindicators.org
THE STATE OF THE HUMANITIES 2018: WORKFORCE & BEYOND

Unemployment among Humanities Bachelor’s Degree Holders, by Highest Degree and Age, 2013 and 2015
Relative unemployment rates can also play an impor-tant part in the overall financial picture for human-ities graduates. Like graduates from every other field, holders of bachelor’s degrees in the humanities expe-rienced a sharp increase in unemployment during the Great Recession. Using data for the 2009–2010 time period, Georgetown University’s Center for Edu-cation and the Workforce put the unemployment rate
for college graduates with degrees in the humanities at 9.4%. The unemployment rate has fallen sharply from that point, with unemployment now at or below 4% among those in their prime working years (ages 24 to 55). Among humanities graduates with only a bachelor’s degree, the unemployment rate fell a full percentage point from 2013 to 2015.10
0%
1%
2%
3%
4%
5%
6%
7%
8%
9%
10%
Ages 24 to 34 Ages 35 to 54 Ages 24 to 34 Ages 35 to 54
Une
mpl
oym
ent R
ate
2013 2015
Bachelor's Degree Advanced Degree (in Any Field)
The State of the Humanities 2018: Graduates in the Workforce & Beyond 11
THE STATE OF THE HUMANITIES 2018: WORKFORCE & BEYOND

While their unemployment rate has declined since the Great Recession, humanities graduates had a level of unemployment in 2015 that was modestly higher than the rate for the bachelor’s-holding population as a whole. The 4.3% unemployment rate among terminal bachelor’s degree holders in humanities compares to 3.6% among graduates from all fields combined.
The lowest levels of unemployment (below 3%) were found among bachelor’s degree holders in education and the health and medical sciences.11
Unemployment among Bachelor’s Degree Holders, by Highest Degree and Field of Bachelor’s, 2015
0%
1%
2%
3%
4%
5%
6%
7%
8%
9%
10%
Une
mpl
oym
ent R
ate
Field of Bachelor's Degree
Bachelor's Degree
Advanced Degree (in Any Field)
Engine
ering
Educa
tion
Human
ities
Arts
Physic
al Scie
nces
Busine
ss
Health
& Med
ical S
cienc
es
All Fiel
ds
Behav
ioral
& Social
Scienc
es
Life S
cienc
es
12 www.humanitiesindicators.org
THE STATE OF THE HUMANITIES 2018: WORKFORCE & BEYOND

0
10
20
30
40
50
60
70
80
90
100
Opportunities forAdvancement
Salary Benefits Job Security Job Location
Perc
ent S
atis
fied
All Fields Humanities Arts Business Education Engineering Health or Medical Sciences
Aspects of Principal Job
Humanities Bachelor’s Degree Holders’ Satisfaction with Various Aspects of Their Principal Job (Compared with All Bachelor’s Holders), 2015
Despite disparities in median earnings and smaller differences in unemployment rates, when college graduates were asked about their satisfaction with particular financial aspects of their job in 2015, humanities majors’ responses were generally similar to their peers. The figure above highlights only a few of the fields against which the humanities is often com-
pared. On every measure, the share of humanities majors reporting satisfaction was within five percent-age points. On the salary question specifically, 71.7% of humanities graduates expressed satisfaction with that aspect of their job, as compared to 76.2% among all college graduates.12
The State of the Humanities 2018: Graduates in the Workforce & Beyond 13
THE STATE OF THE HUMANITIES 2018: WORKFORCE & BEYOND
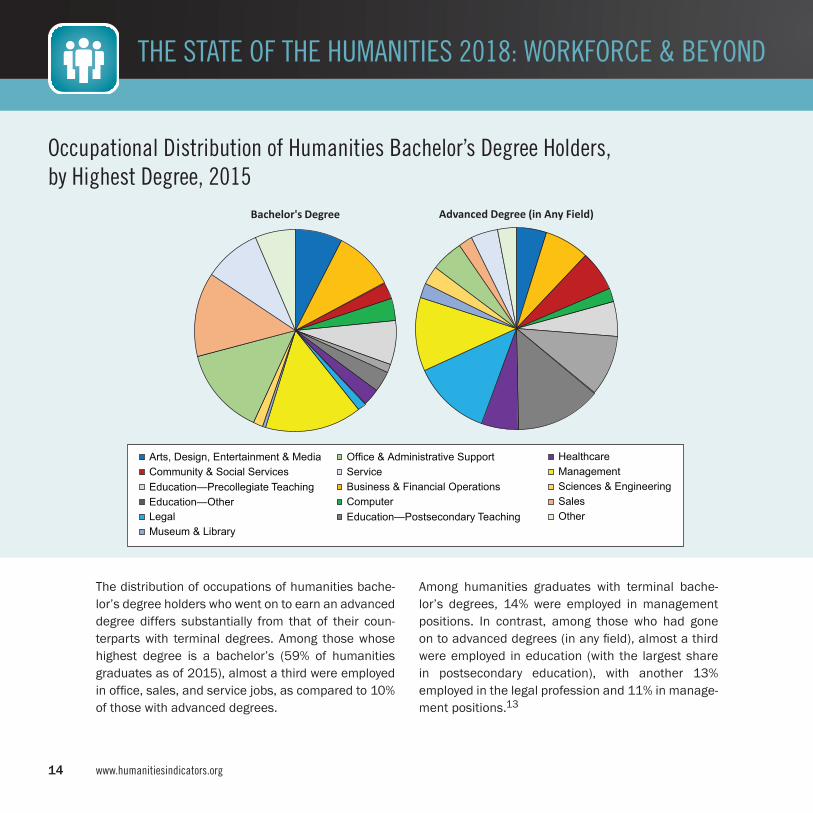
The distribution of occupations of humanities bache-lor’s degree holders who went on to earn an advanced degree differs substantially from that of their coun-terparts with terminal degrees. Among those whose highest degree is a bachelor’s (59% of humanities graduates as of 2015), almost a third were employed in office, sales, and service jobs, as compared to 10% of those with advanced degrees.
Among humanities graduates with terminal bache-lor’s degrees, 14% were employed in management positions. In contrast, among those who had gone on to advanced degrees (in any field), almost a third were employed in education (with the largest share in postsecondary education), with another 13% employed in the legal profession and 11% in manage-ment positions.13
Occupational Distribution of Humanities Bachelor’s Degree Holders, by Highest Degree, 2015
Bachelor's Degree Advanced Degree (in Any Field)
Arts, Design, Entertainment & MediaCommunity & Social ServicesEducation—Precollegiate TeachingEducation—OtherLegalMuseum & Library
Office & Administrative SupportServiceBusiness & Financial OperationsComputerEducation—Postsecondary Teaching
HealthcareManagementSciences & EngineeringSalesOther
14 www.humanitiesindicators.org
THE STATE OF THE HUMANITIES 2018: WORKFORCE & BEYOND

Approximately five million people employed in man-agement and professional jobs in 2015 had bache-lor’s degrees in the humanities. More than a million humanities graduates were employed as managers, and 1.3 million graduates from the field were employed in education positions (at the secondary and postsec-ondary level). The next largest areas of employment for holders of humanities bachelor’s degrees were office and administrative support positions (with 754,000 employees) and sales (with 696,000).14
The numbers do not fully account for the role human-ities majors play in each field, however, as they account for more than 10% of the people employed in every occupational category except those that are specifi-cally STEM-related (where they account for almost 5% of employees in science, engineering, and healthcare, and 7% of employees in the computer occupations).
Percentage and Number of Workers with a Humanities Bachelor’s Degree, by Occupation, 2015
0 500,000 1,000,000 1,500,000
Service
Sales
Office & Administrative Support
Sciences & Engineering
Museum & Library
Management
Legal
Healthcare
Education—Other
Education—Postsecondary Teaching
Education—Precollegiate Teaching
Computer
Community & Social Services
Business & Financial Operations
Arts, Design, Entertainment & Media
Number in Occupation with a HumanitiesBachelor's Degreee (with Share of All)
Man
agem
ent a
nd P
rofe
ssio
nal
(23% of workers in occupation)
(11%)
(14%)
(7%)
(16%)
(20%)
(13%)
(5%)
(27%)
(11%)
(39%)
(5%)
(15%)
(14%)
(12%)
The State of the Humanities 2018: Graduates in the Workforce & Beyond 15
THE STATE OF THE HUMANITIES 2018: WORKFORCE & BEYOND

Humanities graduates are similar to the entire popu-lation of bachelor’s degree holders with respect to the likelihood that they engage in key work activities. The share of humanities majors who reported spending more than 10% of their time on managerial and super-visory activities was identical to the share among all fields (58%). Humanities majors were somewhat more
likely to be engaged in teaching as well as sales and marketing work and somewhat less likely to be doing STEM-related activities (basic and applied research, design, computer programming, and production), though the share of humanities majors engaged in each of those activities was close to the percentage for all graduates.15
Activities Engaged in as Part of Principal Job by Humanities Bachelor’s Degree Holders (as Compared to All Bachelor’s Degree Holders), 2015
0 10 20 30 40 50 60 70 80 90 100
Production, Operations
Computer Programming
Design
Basic Research
Applied Research
Quality or Productivity Management
Development
Human Resources
Accounting/Finance
Professional Services
Teaching
Sales, Purchasing, Marketing, Customer Service
Managing or Supervising
Percent Spending at Least 10%of Their Time on Activity
Activ
ity
Humanities
All Fields
16 www.humanitiesindicators.org
THE STATE OF THE HUMANITIES 2018: WORKFORCE & BEYOND

Given the range of occupations and activities per-formed by college graduates, further research is needed about how humanities study connects to their subsequent work lives. Existing research on the skills that potential employers find desirable is gen-erally imperfect given the range of possible employ-ers and differing job characteristics. The surveys that do exist, however, tend to highlight the value of a range of humanities skills. For instance, although not
nationally representative, a 2006 Conference Board survey of 431 employers noted substantial perceived deficiencies in college-educated employees’ skills in key areas of humanities learning. These “basic skills” included foreign languages, writing in English, and reading comprehension. The responding employers identified the latter two skills as particularly important for successful job performance.16
Employer Ratings of Four-Year College Graduates Entering Workforce on Readiness in Certain “Basic” Skills, 2006
0 10 20 30 40 50 60 70 80 90 100
English Language
Reading Comprehension
Humanities/Arts
Mathematics
Science
History/Geography
Government/Economics
Writing in English
Foreign Languages
Percent
Bas
ic S
kills
Deficient Adequate Excellent
The State of the Humanities 2018: Graduates in the Workforce & Beyond 17
THE STATE OF THE HUMANITIES 2018: WORKFORCE & BEYOND

Regardless of the specific skills employers are seek-ing, there appears to be a wide gap between human-ities majors and graduates from certain professional and STEM fields in their perceptions of the relation-ship between job and degree (graduates from the arts and the behavioral and social sciences were similar to humanities graduates in this regard). More than a
third of bachelor’s degree holders from the human-ities saw no relationship between their job and their degree, as compared to less than 15% of graduates from engineering and the health and medical sci-ences. Among humanities graduates who were dis-satisfied with their job, a majority felt there was no relationship to their degree.17
Bachelor’s Degree Holders’ Perception of Relationship between Job and Degree, 2015
0
10
20
30
40
50
60
70
80
90
100
Behavioral& SocialSciences
Humanities Arts PhysicalSciences
All Fields Business LifeSciences
Engineering Education Health &Medical
Sciences
Perc
ent D
escr
ibin
g Jo
b an
d B
ache
lor’s
Deg
ree
as .
. .
Field of Bachelor's Degree
Closely Related
Somewhat Related
Not Related
18 www.humanitiesindicators.org
THE STATE OF THE HUMANITIES 2018: WORKFORCE & BEYOND

0
10
20
30
40
50
60
70
80
90
100
Perc
ent S
atis
fied
Field of Bachelor's Degree
Terminal Bachelor's Degree Advanced Degree (in Any Field)
Engine
ering
Educa
tion
Human
ities
Arts
Physic
al Scie
nces
Busine
ss
Health
& Med
ical S
cienc
es
All Fiel
ds
Behav
ioral
& Social
Scienc
es
Life S
cienc
es
Despite the uncertainty about the connection between their degree and their job, humanities graduates reported job satisfaction at levels comparable to grad-uates from almost every other field. Almost 87% of all workers with a bachelor’s degree in the humanities reported they were satisfied with their job in 2015.
Earning an advanced degree made a slight difference in overall job satisfaction for bachelor’s degree recip-ients. Among graduates from every field, the overall level of job satisfaction was three to five percentage points higher among those who had gone on to earn an advanced degree.18
Bachelor’s Degree Holders Indicating They Are “Very” or “Somewhat” Satisfied with Their Job, by Highest Degree and Field of Bachelor’s, 2015
The State of the Humanities 2018: Graduates in the Workforce & Beyond 19
THE STATE OF THE HUMANITIES 2018: WORKFORCE & BEYOND

0
10
20
30
40
50
60
70
80
90
100
Education NaturalSciences
Arts Engineering Humanities SocialSciences
Business
Perc
enta
ge W
ho A
gree
Field of Bachelor's Degree
I am deeply interested in the work I do.
At work, I have the opportunity to do what I do best every day.
As one measure of job satisfaction, the 2014 Gallup- Purdue Index study of alumni shows little correspon-dence between job satisfaction and median earnings. On the contrary, roughly equal shares of bachelor’s degree holders in the humanities and engineering reported they were “deeply interested in the work
that I do” (about 72%) and that their job provided the “opportunity to do what I do best every day” (about 70%). Even larger shares of bachelor’s degree hold-ers from the fields with the lowest median earnings (education and the arts) reported that they felt this way about their work.19
Bachelor’s Degree Holders’ Job Satisfaction, by Field of Bachelor’s Degree, 2014
20 www.humanitiesindicators.org
THE STATE OF THE HUMANITIES 2018: WORKFORCE & BEYOND

Experience in the workforce appeared to play an important role in measures of satisfaction with the work humanities graduates perform. There were substantial differences among graduation cohorts in response to the prompt, “At work, I have the opportu-nity to do what I do best every day.” The humanities was not alone in showing a difference between young and old on this question, but it did have the widest gap. While 60% of those who earned humanities degrees
from 2000 to 2014 expressed satisfaction about the opportunity to best use their talents and skills at work, 84% of graduates in the oldest cohort (1960 to 1979) reported similar satisfaction.
In the oldest cohort, humanities graduates were near the highest levels of reported satisfaction on this measure.20
Bachelor’s Degree Holders Who Agree That “At Work, I Have the Opportunity to Do What I Do Best Every Day,” by Graduation Cohort and Field of Bachelor’s Degree, 2014
0
10
20
30
40
50
60
70
80
90
100
Arts Business Education Engineering Humanities NaturalSciences
SocialSciences
Perc
ent
Field of Bachelor's Degree
1960–1979 1980–1999 2000–2014
The State of the Humanities 2018: Graduates in the Workforce & Beyond 21
THE STATE OF THE HUMANITIES 2018: WORKFORCE & BEYOND

0
10
20
30
40
50
60
70
80
90
100
Intellectual Challenge Contribution to Society Level of Responsibility Degree ofIndependence
Perc
ent S
atis
fied
All Fields Humanities Arts Business Education Engineering Health or Medical Sciences
Aspects of Principal Job
Humanities graduates’ satisfaction with a range of intangible aspects of their job was similar to the share for all fields on most measures. The shares of graduates with bachelor’s degrees in the humanities who expressed satisfaction about their contribution to society, their degree of independence, and their level
of responsibility in their job were similar to the shares among graduates with degrees in business and engi-neering. Graduates from education and the health and medical sciences tended to have the highest lev-els of satisfaction on these aspects of their job.21
Bachelor’s Degree Holders’ Satisfaction with Aspects of Their Principal Job, by Field of Bachelor’s Degree, 2015
22 www.humanitiesindicators.org
THE STATE OF THE HUMANITIES 2018: WORKFORCE & BEYOND

Those who had earned both their bachelor’s and higher degree in the humanities had the highest per-centage of satisfaction with their degree of indepen-dence but the lowest percentage of satisfaction with their salary and benefits. Graduates with an advanced degree in another field were the most likely to be satis-
fied with their salary and job security. When it came to satisfaction with various aspects of their job, earning an advanced degree appeared to make only a mod-est difference for holders of humanities bachelor’s degrees, and the disparities were less pronounced than the differences in earnings.22
Satisfaction of Humanities Bachelor’s Degree Holders with Aspects of Their Principal Job, by Highest Degree, 2015
0 10 20 30 40 50 60 70 80 90 100
Opportunities forAdvancement
Salary
Benefits
Intellectual Challenge
Contribution to Society
Job Security
Level of Responsibility
Degree of Independence
Job Location
Percent Satisfied
Aspe
ct o
f the
Job
HumanitiesBachelor’sDegree
AdvancedDegree in theHumanities
AdvancedDegree in a Non-HumanitiesField
The State of the Humanities 2018: Graduates in the Workforce & Beyond 23
THE STATE OF THE HUMANITIES 2018: WORKFORCE & BEYOND

0
10
20
30
40
50
60
70
80
90
100
Education Engineering NaturalSciences
Humanities Business SocialSciences
Arts
Shar
e W
ho B
elie
ve T
hey
Are
at L
east
70%
of
the
Way
to th
e "B
est P
ossi
ble
Life
"
Field of Bachelor's Degree
Today In Five Years
Work life is but one aspect of well-being. When asked to reflect on their lives generally, a 2014 Gallup survey found modest differences among majors with respect to the share who believed that they had or soon would realize their “best possible” life. At the time of the survey, over three-quarters of humanities graduates saw themselves at least 70% of the way to this goal, which was similar to the shares of engineering and natural science graduates who believed this. Educa-
tion majors were the most likely to feel they were close to attaining such a life.
In every field, an even larger share of respondents expected to be well on their way to their best life or to have attained that life in five years. Ninety percent of humanities majors reported believing this, alongside similarly large shares of graduates from every other field.23
“My Best Possible Life”: Bachelor’s Degree Holders’ Belief in Attainment, by Field of Degree and Point in Time, 2014
24 www.humanitiesindicators.org
THE STATE OF THE HUMANITIES 2018: WORKFORCE & BEYOND

1. As an example of the former, see Jeffrey Dorfman, “Surprise: Humanities Degrees Provide Great Return on Investment,” Forbes (November 20, 2014), https://www.forbes.com/sites/jeffreydorfman/2014/11/20/surprise-humanities-degrees-provide-great-return -on-investment/#745a203a2031. For an example of the second category, see Randye Hooder, “Why I Let My Daughter Get a ‘Useless’ College Degree,” Time (January 16, 2014), http://ideas.time.com/2014/01/ 16/why-i-let-my-daughter-get-a-useless-college -degree/. For the third category, see Derek Thompson, “Fear of a College-Educated Barista,” The Atlantic (September 20, 2016), https://www.theatlantic.com/ business/archive/2016/09/fear-of-a-col lege -educated-barista/500792/.
2. In this and succeeding figures based on the National Survey of College Graduates and the American Community Survey, “workers” are defined as those employed in full-time, year-round positions.
3. U.S. Census Bureau, 2015 American Community Survey Public-Use Microdata Sample.
4. Ibid.
5. Ibid. In keeping with the practice of the Organisation for Economic Co-operation and Development, the gap was calculated by dividing the difference between men’s and women’s median earnings by men’s median earnings.
6. U.S. Census Bureau, 2015 American Community Survey Public-Use Microdata Sample. The earnings gap is calculated as the difference between the median earnings of humanities majors and the median earnings of majors of the comparison field, expressed as a share of the comparison field’s median earnings. The American Community Survey, which yields the data on which this figure is based, does not ask respondents about the amount of their work experience. Thus the Humanities Indicators uses age to distinguish between workers who are in the first years of their career and those who are more experienced. Age and work experience are not perfectly correlated, but age does provide an approximate measure of work experience that allows the Humanities Indicators to examine the effect of this experience on unemployment and earnings of humanities majors.
7. In this and subsequent figures, “bachelor’s degree holders” include alumni who have terminal bachelor’s degrees and those who went on to obtain an advanced degree (in the humanities or another field).
Endnotes
The State of the Humanities 2018: Graduates in the Workforce & Beyond 25
THE STATE OF THE HUMANITIES 2018: WORKFORCE & BEYOND

8. Original analysis by the Humanities Indicators of data from the National Science Foundation, National Survey of College Graduates, 2015. For an example of the sorts of analyses of student debt that emphasize the challenges for humanities majors, see Brad Hershbein, Benjamin H. Harris, and Melissa S. Kearney, Major Decisions: Graduates’ Earnings Growth and Debt Repayment (Washington, D.C.: Hamilton Project, 2014), http://www.hamiltonproject .org/papers/major_decisions_graduates_earnings_growth_debt_repayment/.
9. Christopher Wiese and Louis Tay, “Gallup Purdue Data Report on Humanities and Well-Being” (special data runs prepared for the Humanities Indicators, 2017), Table 29.
10. Anthony P. Carnevale, Ban Cheah, and Jeff Strohl, Hard Times: Not All College Degrees Are Created Equal (Washington, D.C.: Center on Education and the Workforce, 2012). Data for figure from U.S. Census Bureau, 2015 American Community Survey Public-Use Microdata Sample.
11. U.S. Census Bureau, 2015 American Community Survey Public-Use Microdata Sample. The unem-ployment rates presented in this graph are for graduates of all ages, who have rates that are substantially higher than for the two age groups discussed on page 11.
12. Original analysis by the Humanities Indicators of data from the National Science Foundation, National Survey of College Graduates, 2015.
13. U.S. Census Bureau, 2015 American Community Survey Public-Use Microdata Sample.
14. Ibid.
15. Original analysis by the Humanities Indicators of data from the National Science Foundation, National Survey of College Graduates, 2015.
16. Are They Really Ready to Work? Employers’ Perspectives on the Basic Knowledge and Applied Skills of New Entrants to the 21st Century U.S. (New York: Conference Board, 2006). For an example of proactive efforts in this area, see the American Historical Association’s Tuning Project at https://www.historians.org/teaching-and-learning/tuning-the -history-discipline.
17. Original analysis by the Humanities Indicators of data from the National Science Foundation, National Survey of College Graduates, 2015.
18. Ibid.
19. Wiese and Tay, “Gallup Purdue Data Report on Humanities and Well-Being,” Table 2.
Endnotes (continued)
26 www.humanitiesindicators.org
THE STATE OF THE HUMANITIES 2018: WORKFORCE & BEYOND
20. Ibid., Table 7. We are using graduation cohort as a proxy for work experience because data of that kind were not available.
21. Original analysis by the Humanities Indicators of data from the National Science Foundation, National Survey of College Graduates, 2015.
22. Ibid.
23. Wiese and Tay, “Gallup Purdue Data Report on Humanities and Well-Being,” Table 17.
The State of the Humanities 2018: Graduates in the Workforce & Beyond 27
THE STATE OF THE HUMANITIES 2018: WORKFORCE & BEYOND

Humanities Indicators
Project DirectorNorman M. Bradburn, National Opinion Research Center; University of Chicago
Project StaffRobert Townsend
Carolyn Fuqua
John Garnett
Advisory CommitteeJack Buckley, American Institutes for ResearchJonathan R. Cole, Columbia UniversityJohn Dichtl, American Association for State and Local HistoryRonald G. Ehrenberg, Cornell UniversityMichael Hout, New York UniversityFelice J. Levine, American Educational Research AssociationEsther Mackintosh, Federation of State Humanities CouncilsJudith Tanur, Stony Brook University Steven C. Wheatley, American Council of Learned Societies
The Academy gratefully acknowledges the financial support of The Andrew W. Mellon Foundation, the primary funder of the Humanities Indicators, as well as the National Endowment for the Humanities.
28 www.humanitiesindicators.org
THE STATE OF THE HUMANITIES 2018: WORKFORCE & BEYOND


american academy of arts & sciences
@americanacad www.amacad.org
humanitiesindicators.org