the state of the nation: how children eat in 2016 findings...
TRANSCRIPT

1
The State of the Nation:
How children eat in 2016
Findings from surveys of parents and children
Children’s Food Trust Sheffield
December 2016

2
Contents List of tables ............................................................................................................................... 3
Introduction ................................................................................................................................ 4
Parent survey ............................................................................................................................. 4
Parents’ concerns about their children’s eating habits .......................................................... 4
Changing eating habits .......................................................................................................... 6
Frequency of consumption of certain foods and drinks ......................................................... 7
Pestering for foods and drinks ............................................................................................... 8
Rating of foods and drinks ................................................................................................... 10
School meals ........................................................................................................................ 11
Eating out ............................................................................................................................. 11
Favourite meals .................................................................................................................... 12
Children’s survey ..................................................................................................................... 12
Eating habits ......................................................................................................................... 12
Favourite meals .................................................................................................................... 14
Comment .................................................................................................................................. 14
Annex 1 .................................................................................................................................... 15
Annex 2 .................................................................................................................................... 16

3
List of tables Table 1. Parents’ level of worry about their child’s diet. ............................................................ 4 Table 2. Parent’s views on what would be most likely to help their child to eat more healthily in the future. ............................................................................................................................... 5 Table 3. Parents’ views on whether their child eats too much sugar. ...................................... 6 Table 4. Parents’ views on the changes most likely to help them reduce their child’s sugar intake. ......................................................................................................................................... 6 Table 5. Reasons why parents had not made the changes they identified as being helpful to reduce their child’s sugar intake. ............................................................................................... 7 Table 6. Parents’ views on where they found it most difficult to help their child eat healthily. . 7 Table 7. How often parents allowed children to have certain types of foods and drinks. ........ 8 Table 8. Frequency parents reported being pestered by their child for certain types of foods and drinks. .................................................................................................................................. 8 Table 9. Places where children are most likely to pester parents for certain types of foods and drinks. .................................................................................................................................. 9 Table 10. Parents’ reported difficulty in saying no when being pestered by their child for foods and drinks. ........................................................................................................................ 9 Table 11. Parents’ rating of healthiness of certain food and drink products. ......................... 10 Table 12. Parents’ views on how often dessert should be offered as part of a school lunch. 11 Table 13. How often parents eat out with their children. ......................................................... 11 Table 14. Parents’ views on the one thing they would like restaurants to do to make children’s menus healthier. ...................................................................................................... 12 Table 15. Children’s views on what they would like to do to make their diet healthier. ......... 13 Table 16. Children’s responses on when they were most likely to eat foods like crisps, chocolate or sweets. ................................................................................................................ 13 Table 17. Sample characteristics for 2,001 UK parents of children aged 4-16 years responding to the Opinium online survey. ............................................................................... 15 Table 18. Age of children of 2,001 UK parents responding to the Opinium online survey. ... 15 Table 19. Sample characteristics for 1,130 GB children aged 8-15 years responding to the YouGov online survey. ............................................................................................................. 16

4
Introduction As part of our ‘State of the Nation’ work to gain insight into how children are eating in 2016, the Children’s Food Trust commissioned Opinium Research to survey parents about their children’s eating habits. To complement this survey the Trust used the YouGov children’s omnibus to ask children about their eating habits. This report presents the findings of both surveys.
Parent survey An Opinium Research online survey ran from 31st October to 4th November 2016. Responses were received from 2,001 UK adults with a child (or children) aged 4-16 years. In total, 3,148 children were associated with the parent sample. For some survey questions (for design reasons) parents’ response was restricted to reflect their youngest child. Sample characteristics for the 2,001 UK parents in relation to gender, age, geographical region and social grade are shown in Annex 1. Age distributions for the 3,148 children aged 4-16 associated with the parent sample, and the 2,001 youngest children are also shown in Annex 1. Findings are presented below. Base numbers are shown for each table. Percentages reported are percentage of respondents for each question, and may not add to 100% due to rounding or where multiple responses were permitted. Differences in response for subgroups (based on parent gender, age, region and social grade, and child age) are described where appropriate.
Parents’ concerns about their children’s eating habits Most parents (86%) reported that they worried to some extent about what their child eats and their diet in general (Table 1), with nearly half (49%) worrying a lot or a fair bit. Younger parents, and parents with younger children were more likely to worry a lot (29% of parents aged 18-34 worried a lot compared with 15% aged 35-54; 24% of parents with children aged 4-7 worried a lot compared with 16% and 11% of those with children aged 8-11 and 12-16 respectively). Regionally, 44% of parents in the North East worried a lot compared with 10% of parents in East Midlands. Table 1. Parents’ level of worry about their child’s diet.
Level of worry n %
I worry about it a lot 356 17.8
I worry about it a fair bit 624 31.2
I worry about it a little 735 36.7
I don’t worry about it at all 286 14.3
Base: 2,001 UK parents of children aged 4-16 years Question asked: Compared with other parenting worries and concerns, how much do you worry about what your child eats and your child’s diet in general? (Select one option)

5
Parents thought that giving children more opportunities to learn to cook was most likely to help their child to eat more healthily in the future (Table 2). Not selling sweets, chocolate, crisps and sugary drinks in places where children go to be active and supermarkets having fewer special offers on less healthy foods and more on healthier foods were selected by nearly one-quarter as likely to help. Responses amongst subgroups were generally similar, with cooking identified as the top reason for all. Unsurprisingly, banning the use of characters which appeal to children in the advertising of less healthy foods and on packaging of less healthy products, and the cost of healthy meals and snacks being included in free childcare and were more likely to be selected by parents with younger children (22% and19% of parents of 4-7 year olds compared with 11% and 9% of parents of 12-16 year olds). Other responses most commonly mentioned healthier food being cheaper, and education for children and families as likely to be helpful. Table 2. Parent’s views on what would be most likely to help their child to eat more healthily in the future.
Most likely to help child eat more healthily in future n %
Giving children more opportunities to learn to cook 626 31.3
Not selling sweets, chocolate, crisps and sugary drinks in places where children go to be active
487 24.3
Supermarkets having fewer special offers on less healthy foods, and more special offers on healthier foods
466 23.2
Shops not having foods like sweets and crisps on checkouts or at eye level for children
443 22.1
Tighter rules on advertising of junk food to children on TV, online or at events
392 19.6
Only offering fruit and yoghurt for pudding in school canteens on at least a few days each week
380 19.0
Ban the use of characters which appeal to children in the advertising of less healthy foods, and on packaging of less healthy products
331 16.5
Nutrition labels on food which are easier to understand 331 16.5
More funding for schools to improve their dining rooms 301 15.0
Cost of healthy meals and snacks included in free childcare 288 14.4
Tighter planning laws to limit the number of new takeaways and fast food outlets opening near schools
199 9.9
Help for every nursery and school to bring in a packed lunch policy so that sweets, chocolate, crisps and sugary drinks can’t come to school
188 9.4
Other 52 2.6
None of the above 199 9.9
Base: 2,001 UK adults of children aged 4-16 years Question asked: Which of the following do you think would be most likely to help your child to eat more healthily in future? (Select up to three options)

6
More than half of parents (54%) thought that their child ate too much sugar, equating to 50% of children overall (Table 3). Eating too much sugar was most likely amongst 12 year olds (58%) and lowest amongst 5, 7 and 15 year olds (43%). Table 3. Parents’ views on whether their child eats too much sugar.
Child eats too much sugar n %
Yes 1566 49.7
No 1343 42.6
Don’t know 239 7.6
Base: 2,001 UK parents responding for 3,148 children aged 4-16 years Question asked: Do you believe that your child currently eats too much sugar as part of their everyday diet? (Select one option per child)
Changing eating habits Table 4 shows that cutting down on how many sweets and chocolates (27%) and cakes and biscuits (16%) they buy were the two changes that parents thought would help most to cut the amount of sugar eaten by their children, followed by getting rid of sugary soft drinks at home (14%). Of those who identified a change, the most common reasons for not making that change were that the habit was hard to change (26%) and their child would complain too much (18%) (Table 5). Amongst the ‘other’ responses, 2% of parents overall said that nothing was stopping them from making the change, they didn’t need to make a change, or they had already made it. Table 4. Parents’ views on the changes most likely to help them reduce their child’s sugar intake.
What would help to cut child’s sugar intake n %
Cutting down on how many sweets and chocolates we buy 847 26.9
Cutting down on how many cakes and biscuits we buy 489 15.5
Getting rid of sugary soft drinks and squash in the house 448 14.2
Buying different breakfast cereals 282 8.9
Taking chocolate biscuits and sugary drinks out of their packed lunches
227 7.2
Buying plain yoghurt and sweetening it with fruit, instead of yoghurts made for kids
186 5.9
Other 123 3.9
None of these 546 17.3
Base: 2,001 UK parents responding for 3,148 children aged 4-16 years Question asked: What do you believe would be most likely to help you cut the amount of sugar your child eats? (Select one option per child)

7
Table 5. Reasons why parents had not made the changes they identified as being helpful to reduce their child’s sugar intake.
Reason for not making the change n %
It’s a habit that would be hard to change 435 26.2
My child would complain too much 303 18.2
My child wouldn’t eat an alternative 285 17.1
It would be more expensive 241 14.5
I wouldn’t know what to buy as an alternative 228 13.7
Other 172 10.3
Base: 1,663 UK parents of children aged 4-16 who identified an action to reduce sugar Question asked: What is stopping you from making that change to cut the amount of sugar your child eats. (Select one option) Parents reported that they found it most difficult to help their child eat healthily when they’re at a friend’s house (22%), at the cinema and theatre (21%) or when another family member is looking after them (20%), as well as at home (20%) (Table 6). Table 6. Parents’ views on where they found it most difficult to help their child eat healthily.
Location n %
When they’re playing at a friend’s house 682 21.7
At the cinema and theatre 672 21.3
When another family member is looking after them 641 20.4
At home 645 20.5
Out shopping 524 16.6
On the way home from school 413 13.1
At nursery/other childcare/at school 251 8.0
At children’s soft play centres 247 7.8
At your local leisure/sports centre 215 6.8
Going to watch sport e.g. a football game 156 5.0
N/A 416 13.2
Base: 2,001 UK parents responding for 3,148 children aged 4-16 years Question asked: Where do you find it most difficult to help your child eat healthily? (Select up to 3 options)
Frequency of consumption of certain foods and drinks Parents were asked how often their child was allowed to have certain foods and drinks. The most common frequency for children to be allowed cakes and biscuits, crisps, sweets and chocolate and sugary soft drinks was a few times a week (Table 7). More than a quarter of parents allowed their child to have cakes and biscuits (25%), crisps (29%), and sweets and chocolate (26%) at least once a day. More than one-third of parents (39%) allowed their child to have fast food at least once a week. Nearly one in five parents (17%) never allowed their child to have sugary soft drinks. Younger parents allowed children to have all items more frequently than older parents, with more than one-third of parents aged 18-34 allowing cakes and biscuits, crisps and sweets and chocolates at least once a day. Frequency was highest in the North East for all foods and drinks, with nearly half of parents (48%) allowing sweets and chocolate at least once a day, and 45% allowing cakes and biscuits at least once a day. Younger children were more likely to have these foods and drinks at least once

8
a day, except for crisps which 12-16 year olds were most likely to have that often (32% at least once a day). Female parents were more likely to never allow sugary soft drinks than male parents (20% vs. 12%). Table 7. How often parents allowed children to have certain types of foods and drinks.
Frequency items
allowed
Cakes and
biscuits Crisps
Sweets and
chocolate Ice cream
Sugary soft
drinks Fast food
n % n % n % n % n % n %
More than once a day
127 6.3 111 5.5 135 6.7 77 3.8 144 7.2 60 3.0
Once a day 383 19.1 476 23.8 388 19.4 130 6.5 253 12.6 86 4.3
A few times a week
783 39.1 743 37.1 791 39.5 363 18.1 475 22.2 166 8.3
Once a week 356 17.8 322 16.1 379 18.9 423 21.1 280 14.0 474 23.7
A few times a month
212 10.6 190 8.0 197 9.8 462 23.1 211 10.5 436 21.8
Once a month 52 2.6 46 2.3 35 1.7 210 10.5 104 5.2 377 18.8
Less than once a month
58 2.8 68 3.4 46 2.3 289 14.4 194 9.7 323 16.1
Never 30 1.5 45 2.2 30 1.5 47 23.4 340 17.0 79 3.9
Base: 2,001 UK parents responding for their youngest child Question asked: How often do you allow your child to have each of these products? (Select one option)
Pestering for foods and drinks Parents reported that more than one-quarter of children (28%) pestered them for these foods and drinks a few times a week, with one-third pestering them at least once a day (Table 8). One in eight children (13%) never pestered their parents. Table 8. Frequency parents reported being pestered by their child for certain types of foods and drinks.
Frequency of pestering by child n %
More than once a day 481 15.3
Once a day 555 17.6
A few times a week 866 27.5
Once a week 392 12.5
A few times a month 251 8.0
Once a month 64 2.0
Less than once a month 143 4.5
Never 396 12.6
Base: 2,001 UK parents responding for 3,148 children aged 4-16 years Question asked: How often would you say your child pesters you for products like sweets, chocolate, ice cream, crisps, fast food, sugary soft drinks etc.? (Select one option per child)

9
Parents who said they were pestered for foods and drinks were asked where that was most likely to happen and how difficult it was to say no. At the supermarket (33%) and watching TV (21%) were the most common times to be pestered by their child (Table 9). Nearly four out of ten parents found it difficult or very difficult to say no when being pestered (37% of parents for 41% of children), compared with parents for just over one-quarter of children who found it easy or very easy (Table 10). Table 9. Places where children are most likely to pester parents for certain types of foods and drinks.
Location n %
At the supermarket 909 32.7
Watching TV 585 21.1
At a shopping centre 319 11.5
When you’re with other family members and friends 228 8.2
At the cinema 203 7.3
On a journey 193 7.0
At a children’s soft play centre 66 2.4
At a leisure centre 43 1.5
Other 230 8.3
Base: UK parents responding for 2,776 children aged 4-16 years Question asked: Where is your child most likely to pester you for products such as sweets and fast food? (Select one option per child) Table 10. Parents’ reported difficulty in saying no when being pestered by their child for foods and drinks.
Difficulty of saying no n %
Very difficult 310 11.2
Difficult 821 29.6
Neither difficult nor easy 878 31.6
Easy 517 18.6
Very easy 250 9.0
Base: UK adults responding for 2,776 children aged 4-16 years Question asked: How difficult do you find it to say no when your child is pestering you for products such as sweets and fast food? (Select one option per child)

10
Rating of foods and drinks Parents were asked to rate the healthiness of a number of food and drink products commonly marketed to children. Table 11 shows that Kelloggs Rice Krispies Multigrain Cereal and Bear Yoyos were rated as healthy by more than half of parents (58% and 56% respectively), compared with Cocopops cereal bars and Nutella which were rated healthy by one in five parents (18% and 20% respectively). Younger parents and parents in the North East were the most likely to rate the items as healthy. Table 11. Parents’ rating of healthiness of certain food and drink products.
Parent rating of healthiness
Dairylea Lunchables
Ham ‘N Cheese
Nutella Spread Pom-Bears
Snacks
Kelloggs Rice Krispies
Multigrain Cereal
My5 Fruit Shoot
Cocopops Cereal Bars
Bear Yoyos
n % n % n % n % n % n % n %
Very healthy 188 9.4 71 3.5 108 5.4 236 11.8 151 7.5 82 4.1 299 14.9
Quite healthy 670 33.4 335 16.7 518 25.9 921 46.0 602 30.1 276 13.8 826 41.3
Not very healthy 776 38.7 846 42.3 875 43.8 575 28.7 74 3.7 730 36.5 534 26.7
Not at all healthy 272 13.6 680 33.9 416 20.8 199 9.9 433 21.6 845 42.2 242 12.1
Don’t know 95 4.7 69 3.4 84 42.0 70 3.5 71 3.5 68 3.4 100 5.0
Base: 2,001 UK parents of children aged 4-16 years Question asked: How healthy would you say each of the following products are? (Select one option)

11
School meals Parents were asked their views on the type and frequency of dessert served as part of a school meal. Of the eight out of ten who thought that dessert should be provided every day, half stated that it should be limited to only fruit and yoghurt on at least a few days each week (Table 12). Nine out of ten parents in the North East (92%) thought that dessert should be provided every day compared with fewer than six out of ten (57%) in Northern Ireland. Table 12. Parents’ views on how often dessert should be offered as part of a school lunch.
Frequency of dessert at school n %
Yes, dessert should be provide every day 425 21.2
Yes, dessert should be provided every day, but should be limited to only fruit or yoghurt on at least a few days each week
804 40.2
Yes, dessert should be provided every day bit only fruit or yoghurt
382 19.1
No, children should not be offered dessert every day 390 19.5
Base: 2,001 UK parents of children aged 4-16 years Question asked: Thinking about school meals, do you think that children should be offered a dessert every day? (Select one option)
Eating out One-third of parents reported eating out with their children once a month, with one-quarter eating out once a week, and one in ten more than once a week (Table 13). Male parents were more likely than females to eat out more than once a week (17% vs. 10%), and more than one-fifth of parents aged 18-34 reported eating out more than once a week compared with one in ten parents aged 35-54. Table 13. How often parents eat out with their children.
Frequency of eating out n %
More than once a week 264 13.2
Once a week 508 25.4
Once a month 676 33.8
Less than once a month 516 25.8
Never 37 1.8
Base: 2,001 UK parents of children aged 4-16 years Question asked: How often do you eat out with your children? (Select one option) The most regularly chosen restaurant to eat out at was McDonalds (43%), followed by KFC (18%) and Pizza Hut (16%). Wetherspoons, Harvester, Nando’s and Pizza Express were all chosen regularly by more than one in ten parents (13%, 11%, 11% and 10% respectively). ABC1 parents were less likely than C2DE parents to visit McDonalds regularly (39% vs. 52%), and more likely to visit Nando’s (13% vs. 7%) or Pizza Express (13% vs. 5%).

12
Offering more fruit and vegetables as part of children’s meals and offering children’s portions of dishes from the adult menu were the top two things that parents (26% and 23% respectively) would most like restaurants to do to make children’s menus healthier (Table 14). The third most common response, from one in ten parents, was that restaurants did not need to make menus healthier. C2DE parents were more likely to say that restaurants did not need to make menus healthier (18% compared with 11% of ABC1 parents). Table 14. Parents’ views on the one thing they would like restaurants to do to make children’s menus healthier.
Action to make menus healthier n %
Offer more fruit and veg in children’s meals 519 25.9
Offer children’s portions of dishes from the adult menu 459 22.9
Only offer healthier drinks 219 11.4
Get rid of unlimited soft drink refills 229 10.9
Get rid of unlimited desserts 160 8.0
Reduce portion sizes 137 6.8
Other 18 0.9
N/A – Restaurants do not need to make children’s menus healthier
260 13.0
Base: 2,001 UK parents of children aged 4-16 years Question asked: Which one thing would you most like restaurants to do to make children’s menus healthier? (Select one option)
Favourite meals According to parents, pasta was their child’s favourite meal at home (identified by 27% of parents), of which nearly half (42%) was spaghetti Bolognese. Other favourite meals were pizza and roast dinners, (identified by 12% and 8% of parents respectively. Pizza was identified by nearly one in five parents (17%) as their child’s favourite meal when eating out, followed by burgers (12%), chicken nuggets (9%) and pasta (8%).
Children’s survey A YouGov online survey ran from 4th to 7th November 2016. Responses were received from 1,130 GB children aged 8-15 years. Figures have been weighted and are representative of all GB children (aged 8 to 15). Sample characteristics of the 1,130 GB children in relation to gender, age, geographical region and social grade (weighted figures) are shown in Annex 2. Findings are presented below. Base numbers are shown for each table. Percentages reported are percentage of respondents for each question, and may not add to 100% due to rounding or where multiple responses were permitted. Differences in response for subgroups (based on gender, age, region and social grade) are described where appropriate.
Eating habits Nearly half of children (45%) said that eating more fruit and vegetables was the thing they would like to do to make their diet healthier, with four out of ten (40%) saying that they would like to drink more water (Table 14). One in ten said that they wouldn’t like to do anything to make their diet healthier. Regionally, more children in London selected drink more water

13
(52%) compared with other regions (all less than 41%). More boys than girls said that they wouldn’t like to do anything to make their diet healthier (17% vs 11%). Table 15. Children’s views on what they would like to do to make their diet healthier.
Action n %
Eat more fruit and vegetables 512 45.3
Drink more water 452 40.0
Eat less sweets or chocolate 429 38.0
Eat less cakes and biscuits 307 27.2
Drink less squash/fizzy drinks 272 24.1
Choose healthier snacks rather than chocolate, sweets or crisps after physical activity
272 24.1
Eat less crisps 262 23.2
Choose healthier things for breakfast 243 21.5
Choose fruit or yoghurt for pudding at school 191 16.9
Eat less takeaway food 174 15.4
Something else 32 2.8
I don’t know 29 2.6
I wouldn’t like to do anything in particular to make my diet healthier
155 13.7
Base: 1,130 GB children aged 8-15 years (weighted to reflect all GB children) Question asked: Which of these things would you like to do to make your diet healthier? (Select as many options as apply)
Table 16 shows that one-quarter of children (27%) said that they were most likely to eat foods like crisps, chocolate or sweets when they were with other family members or friends, with one-fifth (20%) most likely to eat them at the cinema, and one in ten on the way to/from school (11%), or on a journey somewhere (10%). ‘Another time’ included at home (6%), after school (4%), with or after tea (3%) and watching TV/gaming/online (3%). Table 16. Children’s responses on when they were most likely to eat foods like crisps, chocolate or sweets.
When children are most likely to eat certain foods n %
When I’m with other family members or friends 302 26.7
When I’m at the cinema 229 20.3
When I’m on the way to/from school 125 11.1
When I’m on a journey somewhere 115 10.2
When I’m out shopping 40 3.5
When I’m at a leisure centre 16 1.4
Another time 271 24.0
Don’t know 31 2.7
I never eat any of these foods 8 0.7
Base: 1,130 GB children aged 8-15 years (weighted to reflect all GB children) Question asked: When are you most likely to eat foods like crisps, chocolate or sweets? (Select one option)

14
Favourite meals One-quarter of children (25%) identified that pasta was their favourite meal to eat at home. Other popular meals were pizza (12%) and roast dinners (9%). Pizza was their favourite meal when eating out (chosen by 24% of children), followed by pasta and burgers (both 9%), and chicken nuggets (5%).
Comment It is clear from the survey responses that parents have some level of concern about their children’s diets, with nearly half worrying ‘a lot’ or ‘a fair bit’. Parents were also concerned about sugar intakes, with 54% thinking that their child ate too much sugar. They identified that changing their food purchasing habits (to reduce the amounts of sweets, chocolate, cakes, and biscuits bought) would be most likely to help reduce their child’s sugar intake, but many hadn’t made the change, mainly due to habit and because they felt their child would complain. Indeed, children were allowed, according to parents, to have foods high in fat, salt and sugar on a regular basis with more than one-quarter of parents allowing their child to have sweets and chocolate, cakes and biscuits, and crisps at least once a day. This pattern of consumption is consistent with data released this year on children’s dietary intakes which shows that children are eating too much sugar and saturated fat and not enough fruit and vegetables and fibre.1 It does not reflect government healthy eating advice which states that these types of foods should be eaten ‘less often’ and ‘in small amounts’.2 It may be that children would be more receptive to change than parents believe – more than one-third of 8-15 year olds recognised that eating less sweets and chocolate (together with eating more fruit and vegetables and drinking more water) would make their diet healthier. Another common element identified from the survey responses was that parents felt they were not always in control of what their children ate. Parents reported finding it most difficult to help their child to eat healthily when they were at a friend’s house or when another family member was looking after them. This was reinforced by children who said that they were most likely to eat foods like crisps, chocolate or sweets when they were with other family members or friends. Parents also identified that the food environment was an issue, with one-third saying that their child was most likely to pester then for items such as sweets and fast food when at the supermarket. Changes to the environment such as sweets, chocolate, crisps and sugary drinks not being sold in places where children go to be active, or not being available at checkouts or at children’s eye level were considered by parents to be important in supporting them to help their child to eat more healthily. Parents of all ages, in all regions, and of all social grades identified cooking as an important element in helping their children to eat more healthily in the future. This is consistent with the feedback we get from the volunteers that run our Let’s Get Cooking clubs who highlight the difference that learning to cook can make to a child and their wider family.
1 National Diet and Nutrition Survey: results from Years 5 and 6 (combined) https://www.gov.uk/government/statistics/ndns-results-from-years-5-and-6-combined 2 Eatwell Guide https://www.gov.uk/government/uploads/system/uploads/attachment_data/file/528193/Eatwell_guide_colour.pdf
15
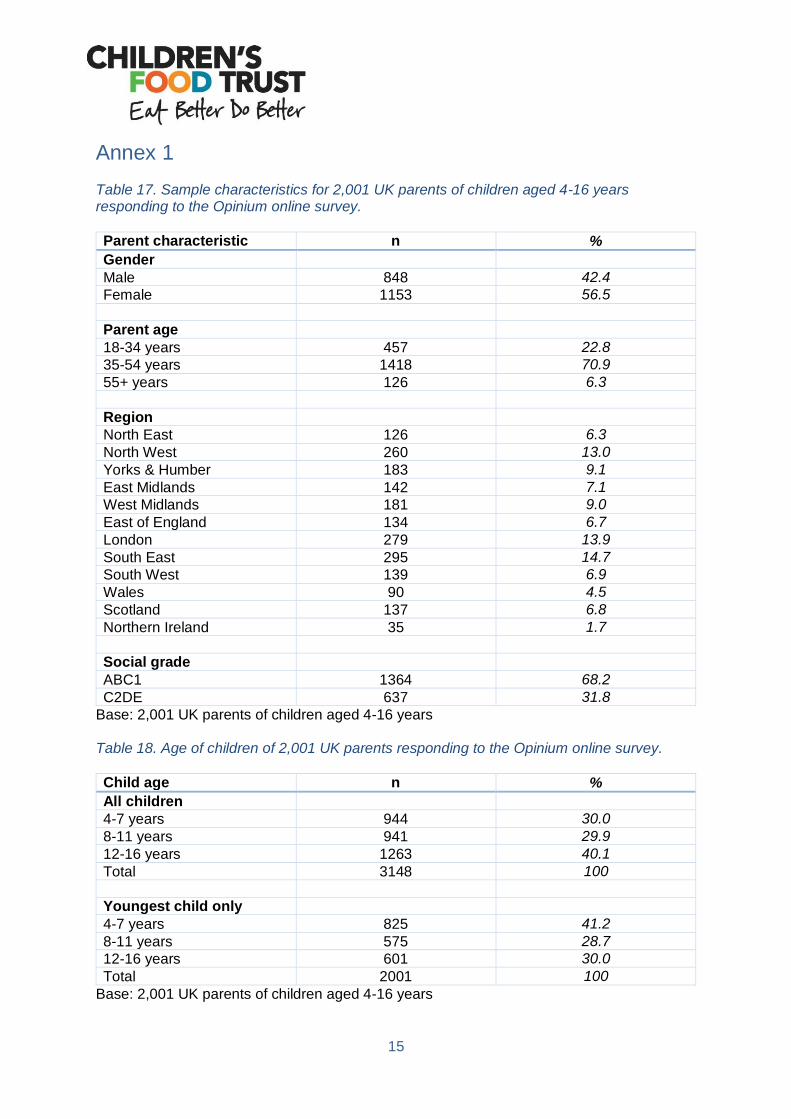
Annex 1 Table 17. Sample characteristics for 2,001 UK parents of children aged 4-16 years responding to the Opinium online survey.
Parent characteristic n %
Gender
Male 848 42.4
Female 1153 56.5
Parent age
18-34 years 457 22.8
35-54 years 1418 70.9
55+ years 126 6.3
Region
North East 126 6.3
North West 260 13.0
Yorks & Humber 183 9.1
East Midlands 142 7.1
West Midlands 181 9.0
East of England 134 6.7
London 279 13.9
South East 295 14.7
South West 139 6.9
Wales 90 4.5
Scotland 137 6.8
Northern Ireland 35 1.7
Social grade
ABC1 1364 68.2
C2DE 637 31.8
Base: 2,001 UK parents of children aged 4-16 years Table 18. Age of children of 2,001 UK parents responding to the Opinium online survey.
Child age n %
All children
4-7 years 944 30.0
8-11 years 941 29.9
12-16 years 1263 40.1
Total 3148 100
Youngest child only
4-7 years 825 41.2
8-11 years 575 28.7
12-16 years 601 30.0
Total 2001 100
Base: 2,001 UK parents of children aged 4-16 years

16
Annex 2 Table 19. Sample characteristics for 1,130 GB children aged 8-15 years responding to the YouGov online survey.
Child characteristic n %
Gender
Male 579 51.2
Female 551 48.8
Age
8-11 years 550 48.7
12-15 years 579 51.2
Region
North/Scotland 378 33.5
Midlands/Wales 250 22.1
East 110 9.7
London 132 11.7
South 259 22.9
Social grade
ABC1 739 65.4
C2DE 391 34.6
Base: 1,130 GB children aged 8-15 years (weighted figures)
The Children’s Food Trust The Children’s Food Trust is the national charity on a mission to get every child eating well: at home, in childcare, at school and beyond. That means spreading the skills, knowledge and confidence to cook from scratch, helping anyone who provides food for children to do a great job and encouraging industry to help families make better food choices. Contact us
Children’s Food Trust, 3rd Floor, 1 East Parade, Sheffield S1 2ET Tel: 0114 299 6901 Email: [email protected] Website: www.childrensfoodtrust.org.uk Children’s Food Trust registered charity (England and Wales) number 1118995 Registered charity (Scotland) SC046695