the state of the uk’s birds 2015 · 8 the state of the uk’s birds 2015 an update on common...
TRANSCRIPT

The state of the UK’s birds 2015

2 The state of the UK’s birds 2015
Contents4 Introduction - An introduction to the sixteenth
The state of the UK’s birds report: a one-stop shop for all the latest results of surveys and monitoring projects from across the UK.
6 Wild bird indicators - Wintering waterbirds continue
to decline. - European farmland bird indicator
hits lowest ever level.
8 An update on common breeding birds
- The long-term declines of farmland birds continue.
- Habitat-specific data reveal varying trends.
18 Farmland bird update - A deeper look at the fortunes
of farmland birds over the last 40 years.
22 Trends of scarce and rare breeding birds
- Conservation success stories, including the recovery of ospreys, white-tailed eagles and stone-curlews.
- UK extinction concerns for wrynecks and golden orioles.
26 Recent surveys - Chough population remains
stable, despite some severe regional declines.
- Nightingale counts indicate a considerable decline in the UK population.
30 Powerful partnerships - A showcase of some of the
innovative partnership projects aiming to improve the status of birds in the UK and its Overseas Territories.
34 Breeding seabirds - Arctic skuas, kittiwakes and
roseate terns have declined by at least 50% since 1986.
- Who’s behind the seabird monitoring programme?
38 Wintering waterbirds - Estuarine waders and dabbling
ducks in decline. - New plans for long-tailed duck conservation.
46 UK Overseas Territories update
- New Important Bird Areas identified on Ascension Island and St Helena.
- First steps towards mouse eradication on Gough Island.
Throughout this report species names are colour-coded according to their conservation status, as identified by Birds of Conservation Concern 3, published in 2009.
All bird species are shown in bold. The 52 species identified as being of the greatest concern are Red-listed, the 126 species of moderate concern are Amber-listed and the 68 species of least concern are Green-listed. Note that new assessments of conservation status will be published in December 2015, in Birds of Conservation Concern 4. A number of species referred to in this report will change status.

3The state of the UK’s birds 2015
50 Current and planned surveys
- Details of the range of bird monitoring schemes that depend on volunteer participation, and how you can take part.
52 Acknowledgements - Monitoring of birds in the UK
wouldn’t be possible without the collaboration of a wide range of organisations and individuals.
54 Who we are - Details of the organisations
involved in the making of this report.
Long-tailed duck by Edw
in Kats (rspb-im
ages.com)

4 The state of the UK’s birds 2015
IntroductionThe state of the UK’s birds 2015 (SUKB), is the sixteenth edition of this annual report. It provides a one-stop shop for all the latest results from annual, periodic and one-off surveys and monitoring programmes.
This report should be referenced as Hayhow DB, Bond AL, Eaton MA, Grice PV, Hall C, Hall J, Harris SJ, Hearn RD, Holt CA, Noble DG, Stroud DA and Wotton S (2015) The state of the UK’s birds 2015. RSPB, BTO, WWT, JNCC, NE, NIEA, NRW and SNH, Sandy, Bedfordshire.
SUKB provides an in-depth overview of the status of bird populations in the UK and its Overseas Territories (OTs), and gives an update on trends for as many of the UK’s regularly occurring species as possible. The report also includes indicators showing broad trends for species grouped
within four main habitats: farmland, woodland, wetland and coastal/marine.
This year’s SUKB gives an update on the status of the UK’s farmland birds, and highlights a selection of innovative, positive partnership projects. Throughout the report
you will find inspiring examples of organisations, from within and outside the conservation sector, joining forces. We have tried to illustrate the wide variety of partnerships that exist, including: collaborations with industry, multi-organisation monitoring programmes and landscape-scale conservation schemes.
A special thank you to volunteersThe volunteering community represents a significant element in all of these partnership projects. Bird monitoring in the UK is led by non-governmental organisations (NGOs) and the UK’s statutory nature conservation bodies, in collaboration with the UK Government and devolved administrations. But it relies on the efforts of many thousands of volunteers. Without their time and dedication, the evidence base on which bird conservation depends in the UK would simply not exist.
While the amount of time each person spends varies, from the commitment of carrying out monthly counts, to the casual records submitted by a travelling BirdTrack user, every contribution is valuable. Indeed, a recent JNCC report assessed the value of time spent by volunteers on monitoring biodiversity in the
UK; it is worth in excess of £8.6 million per annum.
All of the monitoring schemes that contribute data to this report every year appeal to people in different ways: for some it may be about observing the natural world, for others a chance to contribute to something purposeful. While the number of people with specialist knowledge is inevitably limited, the potential for mass public involvement is evident from the 40,000 individuals who submitted records to Bird Atlas 2007–11.
Nurturing the involvement of children from an early age in observing, and ultimately monitoring, biodiversity will be key to ensuring schemes like those outlined here continue into the future. So this is the ideal opportunity to recognise and celebrate the huge role that volunteers play in bird monitoring,
and to thank them for the time and effort they devote to the schemes described within the report. If you are one of these volunteers, then thank you; if not, why not consider getting involved in one of the wide variety of monitoring opportunities outlined on pages 50–51?
The SUKB partnershipSUKB 2015 is produced by a coalition of three NGOs: the Royal Society for the Protection of Birds (RSPB), the British Trust for Ornithology (BTO) and the Wildfowl & Wetlands Trust (WWT), together with the UK’s statutory nature conservation bodies: the Joint Nature Conservation Committee (JNCC), Natural England (NE), Natural Resources Wales (NRW), Northern Ireland Environment Agency (NIEA) and Scottish Natural Heritage (SNH).

5The state of the UK’s birds 2015
Time spent by volunteers on monitoring biodiversity in the UK is worth in excess of £8.6 million per annum
David Tipling (B
TO)

6 The state of the UK’s birds 2015
Wild bird indicatorsThe UK wild bird indicator is a high-level measure of the state of this important element of biodiversity. Along with indicators for other well-monitored groups, such as butterflies and bats, it is used as a proxy for the overall state of biodiversity.
It is also used to assess progress towards sustainable development goals. The indicator is typically broken down by broad habitat type, presenting the average
The UK holds internationally important populations of swans, geese, ducks and wading birds every winter. The wintering waterbird indicator shows steady increases in numbers of these birds from the mid-1970s to the late 1990s. A period of stability followed, before numbers entered a shallow decline, and now the wading bird indicator has fallen to its lowest level since 1990. See page 42 for trends in individual species and more discussion of the indicator.
UK wintering waterbird indicator
population trends for bird species associated with farmland, woodland and wetlands, and for seabirds, as well as for all species combined.
It is important to note that there is considerable variation in the individual species’ trends that go into the indicator. To see which species are thriving and which are declining, see pages 12–13 for common breeding bird trends included in the farmland,
woodland and wetland indicators, and page 34 for seabirds.
The latest wild bird indicators for the UK were published in autumn 2015. The indicators for wetland birds, and seabirds, continue to decline, while the farmland bird indicator remains at less than half its 1970 starting value. Fluctuations over the last two years demonstrate year-on-year variability of bird populations.
Ind
ex (
1970
= 1
00)
Wet
lan
d b
ird
s (1
975
= 10
0) S
eab
ird
s (1
986
= 10
0)
120
110
100
90
80
70
60
50
40
Seabirds (19)
Woodland (38)
All (128)
Wetland (26)
Farmland (19)
1970
1972
1974
1976
1978
1980
1982
1984
1986
1988
1990
1992
1994
1996
1998
2000
2002
2004
2006
2008
2010
2012
2014
1975
/76
1977
/78
1979
/80
1981
/82
1983
/84
1985
/86
1987
/88
1989
/90
1991
/92
1993
/94
1995
/96
1997
/98
1999
/00
2001
/02
2003
/04
2005
/06
2007
/08
2009
/10
2011
/12
2013
/14
250
300
150
Wildfowl (27)All native waterbirds (46)
Waders (15)
Ind
ex (
1975
/76
= 10
0)
100
50
0
200
UK wild bird indicator

7The state of the UK’s birds 2015
Europe-wide indicators have been produced for a number of years through the Pan-European Common Bird Monitoring Scheme (PECBMS), and common bird monitoring in Europe is expanding all the time.
Since we last featured the European wild bird indicator in SUKB 2010, six new countries have started submitting data to the scheme, meaning that trends can be produced for an additional 31 species.
Pan-European trends Pan-European population trends between 1980 and 2013 can be generated for 167 species; these indices are then combined to produce indicators for farmland birds (39 species) and forest birds (34 species).
Wild bird indicators
European wild bird indicator The downward trend of the indicators for all common species and common farmland species in Europe is disheartening; both hit their lowest index values in 2013. The common forest species indicator shows a more stable trend over the last decade after some fluctuation in the 1990s. Since 1980, 13 species in this group have been shown to be increasing and 13 declining.
PECBMS partnershipPECBMS is a collaboration involving the European Bird Census Council (EBCC), BirdLife International, the RSPB, Statistics Netherlands, the Czech Society for Ornithology (CSO, BirdLife International Partner in the Czech Republic), the British Trust for Ornithology (BTO), the Dutch Organisation for Field Ornithology (SOVON) and country partners.
The European wild bird indicators have been adopted as the biodiversity indicators for the European Union’s set of tools to monitor progress towards sustainable development goals. This clearly demonstrates their importance.
Bird indicators are now used across the European Union and by other international institutions as measures of the state of economic development and the wider environment. They are also included in the Living Planet Index (LPI).
More information on the indicators and the species indices included can be found on the European Bird Census Council website at ebcc.info.
Ind
ex (
1980
= 1
00)
120
80
100
60
40
20
0
All (167)
Forest (34)
Farmland (39)
1980
1982
1984
1986
1988
1990
1992
1994
1996
1998
2000
2002
2004
2006
2008
2010
2012
2014
All of the indicators start at a value of 100. If an index rises to 200 then, on average, populations of species in the indicator have doubled. If it falls to 50, then they have halved.

8 The state of the UK’s birds 2015
An update on common breeding birdsWild bird populations are an important indicator of the health of the countryside, and knowing to what extent bird populations are increasing or decreasing is fundamental to bird conservation. Since its inception in 1994, the Breeding Bird Survey (BBS) has been the main scheme for monitoring the population changes of the UK’s common breeding birds.
The BBS is coordinated by the BTO, in partnership with the JNCC and the RSPB, and has been monitoring widespread breeding birds across the UK for over 20 years. Volunteers are the backbone of the scheme and collectively walk almost 15,000 km each year, counting more than a million individual birds!
Since 1994, the number of 1-km squares surveyed for the BBS has increased almost three-fold, to 3,639 in 2014.
Later in this report, we review the latest research and conservation measures aimed at turning around the long-term declines of many farmland birds. Patterns of decline vary between species, and some have actually increased over recent decades. Turtle doves, grey partridges, corn buntings and starlings have experienced declines nationally since the mid-1970s, with skylarks, yellowhammers and linnets suffering the steepest declines through the 1980s. For all but starlings and turtle doves, the rate of these declines has eased somewhat in more recent years. There are marked regional differences in trends for some species, such as the yellowhammer,
Each breeding season, thousands of dedicated volunteers make two early-morning visits to a local 1-km square, where they count all the birds they see or hear while walking two 1-km lines across the square. This process is carried out each year along the same route, ideally by the same observer, making the survey consistent and the data collected robust.
The BBS trend (1995–2013) and the long-term trend (1970–2013) for common and widespread
breeding birds in the UK are examined here and presented in the table on pages 12–13.
The long-term trend is based on the results of four bird surveys: the BBS from 1994 onwards, its predecessor the Common Bird Census (CBC) from 1970 to 2000, and for some species the Waterways Breeding Bird Survey (WBBS) from 1998 onwards and its predecessor the Waterways Bird Survey (WBS) from 1974.
Farmland bird round-up
Unlike some species, starlings have not shown any signs of recovery and numbers continue to drop following declines that began in the 1970s and 80s
Ray
Ken
nedy
(rsp
b-im
ages
.com
)

9The state of the UK’s birds 2015
In the UK, yellowhammers declined by 15% overall between 1995 and 2013, but increased by 40% in Scotland
Ernie Janes (rspb-im
ages.com)

10 The state of the UK’s birds 2015
Tree sparrows are beginning to recover, but their numbers are still very low
Oliv
er S
mar
t (r
spb-
imag
es.c
om)

11The state of the UK’s birds 2015
Common breeding birds
Using the BBS to inform conservation
Improving winter seed availability has helped to reduce the rate of decline in linnets
David J S
later (rspb-images.com
)
which is continuing to decline in England and Wales, but has been increasing in Scotland since 2003.
Despite some fluctuations since the mid-1960s, kestrel numbers declined by 40% overall across the UK from 1995 to 2013, with Scotland seeing the largest decrease of 67%. Ongoing research suggests that agricultural intensification has played a major role in the decline in England, whereas the causes of the decline in Scotland are largely unknown.
Large fluctuationsIn contrast to these long-term declines, a number of species’ trends show large fluctuations. There was a large increase in reed bunting numbers up to 1976, followed by a rapid crash to the mid-1980s, with shallower
Data from the BBS and other surveys are used to inform policy and to direct research into the conservation of farmland birds. The highest-profile use of BBS data is in the wild bird indicators (see pages 6–7), which illustrate the massive declines in farmland birds that occurred in the 1970s and 1980s.
BBS data have also been used to assess the effectiveness of agri-environment schemes (AES)in each of the UK’s four countries. Research is ongoing to determine which management options have been successful, for example whether improving winter seed availability has had a positive impact on seed-eating species, such as yellowhammers and linnets (see pages 17–20).
BBS data has been invaluable in setting conservation priorities and revising national lists of species of conservation concern. Looking
fluctuations since then, resulting in an overall increase of 19% during the BBS period.
Resident tree sparrows and migratory whitethroats both saw large declines in the early years of common bird monitoring. The tree sparrow population plummeted between the late 1970s and 1990s, possibly due to agricultural changes in the UK affecting food supplies. The 70% drop in numbers of whitethroats between 1968 and 1969 was linked to a severe drought in their wintering grounds in the western Sahel.
Since these declines, population trends for both tree sparrows and whitethroats have increased, with some fluctuations. Such increases are good news, but do not yet bring them
to the future, analyses of the BBS data have detected current impacts of climate change and enabled predictions of how birds will respond in coming decades.
close to recovering from their original population crashes.
Since 1966, the trends for stock doves and jackdaws have fluctuated. However, these fluctuations have been fairly shallow and overall both populations increased between 1995 and 2013. An initial recovery from the use of organochlorine pesticides (which were used as a seed dressing), followed by an increase in breeding performance, is thought to be behind the increase in stock dove numbers.
Both goldfinches and woodpigeons showed increasing trends over the BBS period; with the increase starting in the mid-1980s for goldfinches and the mid-1970s for woodpigeons.
Such research will inform the development of suitable strategies to adapt to, as well as mitigate, the impacts of climate change.

12 The state of the UK’s birds 2015
Mute swan 196 28
Greylag goose n/a 215Canada goose n/a 66Shelduck* 127 -9Gadwall n/a 99Mallard 92 14Tufted duck 47 32Red grouse n/a 10Red-legged partridge -23 12 Grey partridge -92 -59Pheasant* 71 31Grey heron -10 -25Little grebe -61 16Great crested grebe n/a 4Red kite n/a 874Sparrowhawk 69 -15Buzzard* 439 75Kestrel* -52 -40Hobby n/a -11Peregrine n/a -19Moorhen -30 -15Coot 56 17Oystercatcher n/a -16Golden plover n/a -17Lapwing -65 -45Snipe n/a 5Curlew* -63 -46Common sandpiper -50 -15Redshank n/a -45Feral pigeon n/a -17Stock dove* 102 15Woodpigeon 126 37Collared dove 343 11Turtle dove -97 -91Ring-necked parakeet n/a 1181Cuckoo* -59 -46Barn owl n/a 219Little owl -62 -55Tawny owl -30 -20
Swift n/a -42Kingfisher -11 -21Green woodpecker* 102 31Great spotted woodpecker 357 136Lesser spotted woodpecker -82 n/aMagpie 99 -1Jay 14 24Jackdaw 146 53Rook n/a -20Carrion crow* 97 18Hooded crow n/a 11
Trends in common breeding birds in the UK
Long-term trend %
(1970–2013)
BBS trend % (1995–2013)
Species BOCC31
Common breeding birds

13The state of the UK’s birds 2015
Common breeding birds
All BBS trends are based on smoothed estimates of change in the UK between 1995 and 2013, except for seven riverine species (little grebe, tufted duck, grey wagtail, sand martin, dipper, kingfisher and common sandpiper) for which a similar measure is calculated by combining the WBS and WBBS data, and the grey heron, which is based on the Heronries Census.
For most species, the long-term trends are based on the smoothed estimates of change between 1970 and 2013 in a combined CBC–BBS analysis. However, for species with evidence of marked differences in the population monitored by the BBS and its predecessor the CBC (coded *), we use the CBC results until 1994, and solely the BBS from 1994 to 2014. Hence, long-term trends for these species may not be representative of the UK population prior to 1994, due to the more limited geographical and habitat coverage of the CBC (mainly farmland and woodland sites in England).
Long-term trends for the seven riverine species are based on smoothed WBS–WBBS estimates of change between 1975 and 2013. Although all data, including the most recent from 2014, are included in these analyses, we report measures of change from 1970 to 1995 to the penultimate year (2013), to avoid unreliable effects due to smoothing at the endpoints of time series. Long-term trends cover shorter timeperiods for three other species due to the later availability of reliable data, as follows: 1972–2013 for collared doves, 1975–2013 for sparrowhawks and 1977–2013 for house sparrows.
More details on the BBS, including The Breeding Bird Survey 2014 report, can be found at bto.org/bbs.
1 Note that new assessments of conservation status will be published in December 2015, in Birds of Conservation Concern 4. A number of species referred to in these tables will change status.
Raven n/a 42Goldcrest* -25 -5Blue tit 24 4Great tit 84 39Coal tit 23 6Willow tit -94 -81Marsh tit -71 -29Skylark* -60 -24Sand martin 12 18Swallow* 15 26House martin -47 -10Long-tailed tit* 87 10Wood warbler n/a -58Chiffchaff 85 90Willow warbler* -39 -4Blackcap 289 143Garden warbler -5 -19Lesser whitethroat 14 -1Whitethroat 12 38Grasshopper warbler n/a -16Sedge warbler -23 -2Reed warbler 108 15Nuthatch 253 92Treecreeper -10 8Wren 38 8Starling* -81 -50Dipper -31 -22Blackbird -16 21Song thrush -56 8Mistle thrush -59 -31Spotted flycatcher -87 -47Robin 37 11Nightingale n/a -37Pied flycatcher n/a -60Redstart 74 47Whinchat n/a -54Stonechat n/a 17Wheatear n/a -6Dunnock -30 21House sparrow* -65 -3Tree sparrow* -90 122Yellow wagtail -67 -41Grey wagtail -54 -21Pied wagtail 29 -7Tree pipit* -68 13Meadow pipit* -39 -15Chaffinch 31 7Greenfinch -33 -32Goldfinch* 146 111Siskin n/a 54Linnet* -60 -29Lesser redpoll* -85 40Common crossbill n/a 29Bullfinch -41 6Yellowhammer -55 -15Reed bunting -38 19Corn bunting -90 -40

14 The state of the UK’s birds 2015
Habitat-specific trends
Green woodpeckersFor a species which is increasing nationally, it is interesting to look at how the rate of increase varies between habitats. For example, green woodpeckers (31% BBS), have increased most rapidly in arable habitats but are also increasing in rural settlements and mixed farmland. In their preferred habitat of deciduous woodland, the rate of increase slowed around the year 2000, as numbers reached saturation point, leading to overspill into less preferred habitat. This pattern of increase could be explained by later colonisation of sub-optimal habitats.
The wild bird indicators show trends for species grouped by broad habitat associations, but here we show trends for individual species based solely on data from particular habitats. In 2014, species’ trends by habitat
type could be produced for 85 species, using BBS data.Of these, 24 showed opposing trends, with populations increasing in one or more habitats while decreasing in others. Ecological theory predicts that
species will decline slowest in their most preferred habitats; this theory is known as the “buffer effect” and is used to describe patterns of population change across favourable and less favourable habitats.
Common breeding birds
In deciduous woodland, the green woodepecker’s favoured habitat, population growth slowed around the year 2000
Mik
e R
ead
(rsp
b-im
ages
.com
)
Ara
ble
Ru
ral s
ettl
emen
t
Mix
ed f
arm
lan
d
Flo
win
g w
ater
Urb
an/s
ub
urb
an
Dec
idu
ou
s w
oo
dla
nd
Low
lan
d g
rass
lan
d/h
eath
Past
ure
Mix
ed w
oo
dla
nd
Tren
d
- 50
0
50
100
150
200
Habitat-specific trend 1995–2011for green woodpeckers

15The state of the UK’s birds 2015
Common breeding birds
Green woodpeckers are increasing most rapidly in arable habitats
Ernie Janes (rspb-im
ages.com)

16 The state of the UK’s birds 2015
Goldfinches and tree sparrows on the upTwo other species with positive BBS trends are the tree sparrow and the largely ubiquitous goldfinch. Goldfinches have increased most in urban and suburban habitats; it is likely that provision of supplementary food in gardens has helped to drive this increase. Meanwhile, tree sparrows have shown the greatest increase in rural settlements. A full recovery for tree sparrows is a long way off, however. Despite recent increases as a result of local projects and agri-environment scheme provisions, the population has declined by 90% since 1970.
Kestrels declineMonitoring population change across habitats can give an early warning signal of future problems, as declines are predicted to be apparent in less favourable habitats first.
The bar chart shows steeper kestrel declines in urban/suburban and mixed woodland habitats over the whole BBS period, but this species declined only in urban and suburban areas until 2006, with declines in other farmland and woodland habitats occurring later.
Habitat-specific trend figures show population trends with error bars showing 95% confidence intervals.
Urb
an/s
ub
urb
an
Low
lan
d g
rass
lan
d/h
eath
Past
ure
Ara
ble
Mix
ed f
arm
lan
d
Dec
idu
ou
s w
oo
dla
nd
Mix
ed w
oo
dla
nd
Co
nif
ero
us
wo
od
lan
d
Ru
ral s
ettl
emen
t
Tren
d
0
50
100
150
200
250
300
350
400Habitat-specific trend 1995–2011
for goldfinches
Ara
ble
Ru
ral s
ettl
emen
t
Mix
ed f
arm
lan
d
Urb
an/s
ub
urb
an
Dec
idu
ou
s w
oo
dla
nd
Low
lan
d g
rass
lan
d/h
eath
Past
ure
Mix
ed w
oo
dla
nd
Tren
d
-80
-100
-60
-20
-40
0
20
Habitat-specific trend 1995–2011for kestrel
Ru
ral s
ettl
emen
t
Mix
ed f
arm
lan
d
Ara
ble
Past
ure
Tren
d
0
50
100
150
250
350
300
400
200
Habitat-specific trend 1995–2011for tree sparrows

17The state of the UK’s birds 2015
Linnet trends varyThe trends for linnets are negative in nearly all habitats, except arable, where there have been signs of population growth in recent years, and in pasture and mixed farmland habitats, where population change has been minimal since 1995. The increase in arable areas could be a result of the increased use of oil seed rape as a food source and the provision of winter seed through AES. It has been difficult to identify the drivers of population change in linnets, as environmental effects show complex spatial variation.
The buffer effectUnderstanding and identifying when habitat-specific population trends do or do not support the buffer effect theory is a key component in understanding how some populations are regulated.
It also helps us to predict how populations may respond to future environmental change. Directing conservation action to habitats that will have the greatest impact on population trends will be a key application of this research.
Statistically robust habitat-specific trends for 68 species from this study are available on the BTO BirdTrends web pages at bto.org.uk/birdtrends.
Kestrels have declined nationally by 40% across all habitats since 1995
Mark S
isson (rspb-images.com
)
Ara
ble
Ru
ral s
ettl
emen
t
Mix
ed f
arm
lan
d
Urb
an/s
ub
urb
an
Dec
idu
ou
s w
oo
dla
nd
Low
lan
d g
rass
lan
d/h
eath
Past
ure
Mix
ed w
oo
dla
nd
Tren
d
-200
-150
-100
-50
50
100
0
150
200
Habitat-specific trend 1995–2011for linnets
18 The state of the UK’s birds 2015
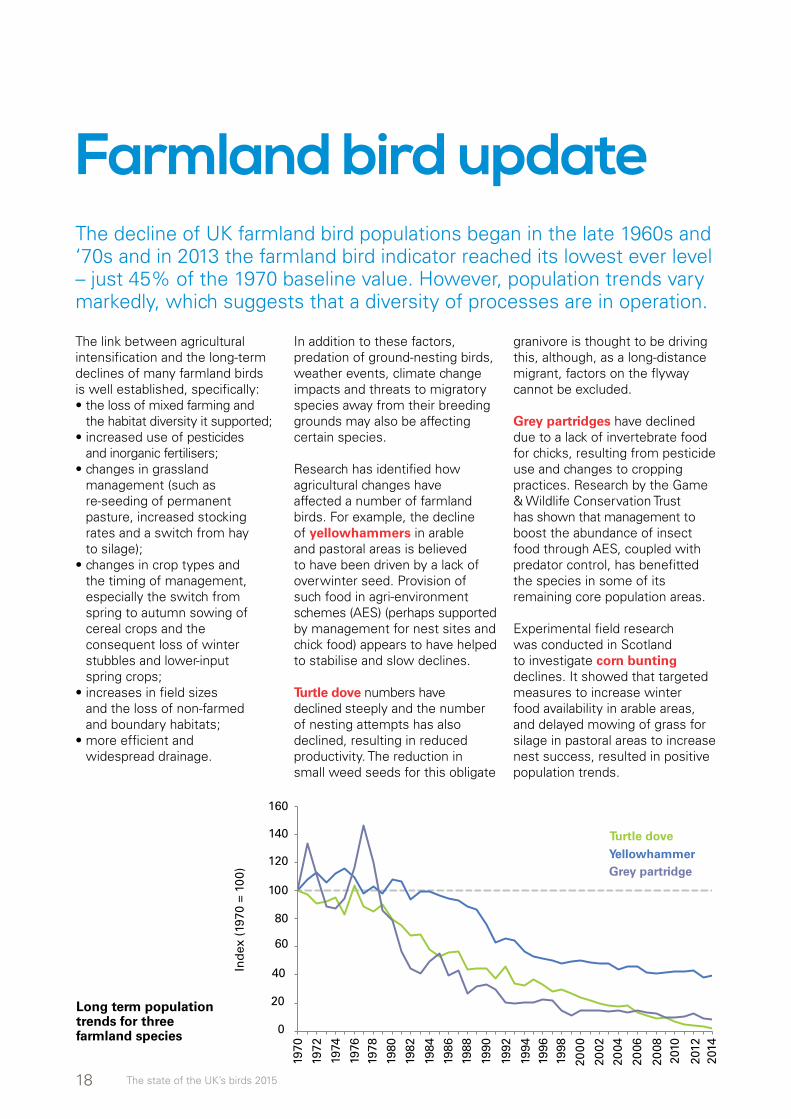
Farmland bird updateThe decline of UK farmland bird populations began in the late 1960s and ‘70s and in 2013 the farmland bird indicator reached its lowest ever level – just 45% of the 1970 baseline value. However, population trends vary markedly, which suggests that a diversity of processes are in operation.
The link between agricultural intensification and the long-term declines of many farmland birds is well established, specifically:• the loss of mixed farming and
the habitat diversity it supported;• increased use of pesticides
and inorganic fertilisers;• changes in grassland
management (such as re-seeding of permanent pasture, increased stocking rates and a switch from hay to silage);
• changes in crop types and the timing of management, especially the switch from spring to autumn sowing of cereal crops and the consequent loss of winter stubbles and lower-input spring crops;
• increases in field sizes and the loss of non-farmed and boundary habitats;
• more efficient and widespread drainage.
granivore is thought to be driving this, although, as a long-distance migrant, factors on the flyway cannot be excluded.
Grey partridges have declined due to a lack of invertebrate food for chicks, resulting from pesticide use and changes to cropping practices. Research by the Game & Wildlife Conservation Trust has shown that management to boost the abundance of insect food through AES, coupled with predator control, has benefitted the species in some of its remaining core population areas.
Experimental field research was conducted in Scotland to investigate corn bunting declines. It showed that targeted measures to increase winter food availability in arable areas, and delayed mowing of grass for silage in pastoral areas to increase nest success, resulted in positive population trends.
In addition to these factors, predation of ground-nesting birds, weather events, climate change impacts and threats to migratory species away from their breeding grounds may also be affecting certain species.
Research has identified how agricultural changes have affected a number of farmland birds. For example, the decline of yellowhammers in arable and pastoral areas is believed to have been driven by a lack of overwinter seed. Provision of such food in agri-environment schemes (AES) (perhaps supported by management for nest sites and chick food) appears to have helped to stabilise and slow declines.
Turtle dove numbers have declined steeply and the number of nesting attempts has also declined, resulting in reduced productivity. The reduction in small weed seeds for this obligate
140
160
100
Ind
ex (
1970
= 1
00)
80
60
20
0
40
120
1970
1972
1974
1976
1978
1980
1982
1984
1986
1988
1990
1992
1994
1996
1998
2000
2002
2004
2006
2008
2010
2012
2014
Turtle doveYellowhammerGrey partridge
Long term population trends for three farmland species

19The state of the UK’s birds 2015
Farmland birds
Agri-environment schemes: working together for nature
How well does Environmental Stewardship work for birds?
Agri-environment schemes (AES) provide payments to farmers to encourage wildlife-friendly farming.
Between 2005 and 2014, Environmental Stewardship (ES) was the scheme open to applicants in England. It consisted of two complementary elements: a more intensive and targeted Higher Level Scheme (HLS) and the less intensive and widely taken up Entry Level Scheme (ELS). At its peak, around 70% of English farmed land was under ES agreements.
There have now been three assessments of the performance of ES in England using nationwide BBS data; in 2008, 2010 and the latest, as yet unpublished, in 2015.
The first assessment revealed little evidence of effects on birds, but there had not been much time for management to take effect. The study in 2010 used more sensitive analytical techniques and revealed that ES management options that addressed the known limiting factors for bird populations had significant positive effects.
One such factor is insufficient winter seed availability, and ES management options, such as overwinter stubbles and sacrificial
In Wales, Tir Gofal and Tir Cynnal have been replaced by Glastir, while Northern Ireland is covered by the Countryside Management Scheme and Scotland by the Rural Development Programme. There are also a number of schemes that support organic farming.
AES are jointly funded by the EU Common Agricultural Policy (CAP) and the UK Government.
All these schemes have been developed by the Government and its agencies, in partnership with stakeholders from the
crops sown for bird food that enhanced seed availability, had generally positive effects. However, these positive effects were small and the decline of species of conservation concern had not reversed.
These studies helped inform revisions of the management options, including the incorporation of some particularly effective options from HLS into ELS. These included fallow nesting plots for lapwings and maintaining overwintered stubbles until the following summer. A new option to pay for supplementary feeding during the late winter/early spring “hungry gap” for seed-eating birds was also introduced.
farming industry, and wildlife and environmental organisations. The individual agri-environment agreements represent a partnership between individual land managers and the Government, with the payments based purely on the costs of undertaking the specified sympathetic management and the profit forgone by doing so.
Experience suggests that the best agreements are those where the agreement holders are supported with dedicated environmental advice.
The latest study tested the impact on farmland birds of three more years of ES in England, as well as the impact of new management options and improved guidance to farmers introduced in 2008–2010. This work is ongoing and details are yet to be published. Net positive effects on population growth rates were found in some target species, particularly as a result of stubble management options, but effects on others were negative.
The pattern of differences between species suggests that while some management options have helped farmland birds, further revisions to the scheme design and delivery are needed if we are to see greater effects on national population levels.
There are a number of good examples of AES enhancing the abundance of rare farmland birds as part of targeted species recovery programmes, such as for cirl buntings and stone-curlews, often with bespoke habitat management
and high levels of advisory support for farmers.
A field-based study was carried out to test whether higher-tier AES agreements targeted at multiple species and with standard levels of advisory
support could enhance the breeding densities of more widespread farmland birds, outside of targeted species’ recovery programmes.
This study found evidence that changes in bird abundance were
Benefits of HLS for farmland birds
20 The state of the UK’s birds 2015
Farmland birds
more positive on farms under HLS than those lacking AES interventions, in at least one region, for six of 15 species tested. Five of these species (grey partridge, tree sparrow, house sparrow, reed bunting and yellowhammer) have mixed diets, feeding on seeds in winter and insects in summer, and are
New threats to farmland birds have emerged in recent years. One of the most dramatic has been the rapid spread of the disease trichomonosis in greenfinches since 2005 and their subsequent population crash. The trichomonas infection has been detected in over 95% of the turtle doves tested in a study of the disease and could be an additional factor in their continued rapid decline.
Pesticides, new and old, also remain an issue. A recent Dutch study highlighted that bird population trends were significantly more negative in areas with higher surface-water concentrations of neonicotinoid pesticides.
Following reviews of the EU CAP and the efficacy of AES at the EU and country level, many Member States have introduced revised schemes for the period up to 2020. In England, for example, a new agri-environment scheme to replace ES was launched on 1 July 2015, called Countryside Stewardship (CS).
Although mainly focussed on biodiversity, addressing water quality issues will have more prominence, and the whole scheme will be more targeted. There are three main elements: a Mid Tier for environmental improvements in the wider countryside; a Higher Tier for environmentally-significant
predominantly associated with field edges; whereas lapwings were thought to be benefitting from field-centre fallow plots.
There were no improvements in populations of other species, but no species showed negative effects. This demonstrates that standard AES management,
sites where more complex management requires support from Natural England or the Forestry Commission; and a range of one- to two-year capital grants for hedgerows and boundaries, improving water quality, developing implementation plans and feasibility studies, and creating and improving woodland and tree health.
Key elements that should help farmland birds are the new Wild Pollinator and Farm Wildlife Packages, a development of the Farmland Bird Package approach that was part of ES from 2010. These aim to provide the essential resources needed by wild pollinators and farmland birds (such as pollen and nectar sources, insect and seed food for birds, and sites for nesting and sheltering) through bundles of options suited to different farm types.
Agreements with farmers will vary depending on the delivery of relevant option packages on their holding, and their location in relation to “hotspots” for farmland biodiversity. In the Higher Tier, there will be the opportunity for bespoke management for priority species.
CS therefore has the potential to build on the benefits to farmland birds delivered by ES, but uncertainties remain as to whether this potential will be
delivered outside the confines of a targeted species recovery programme, can increase or maintain local densities of some widespread declining farmland birds. Analysis is now underway of a resurvey in 2014, which will determine whether results are maintained over longer periods of time.
realised, especially in the Mid Tier element, which represents a new approach compared to previous AE schemes.
It is vital, therefore, that the new scheme is monitored to the same degree as ES, so that its effectiveness can be properly assessed and to provide the necessary evidence upon which to base future changes to the scheme’s design or operational delivery.
Further readingBaker DJ, et al. (2012) Journal of Applied Ecology 49: 871–882.
Bright JA, et al. (2015) Agriculture, Ecosystems and Environment 203: 69–79.
Chamberlain DE, et al. (2000) Journal of Applied Ecology 37(5): 771–788.
Davey CM, et al. (2010) Ibis 152: 459–474.
Lawson B, et al. (2012b) Philosophical Transactions of the Royal Society B 367: 2852–2863.
Newton I (2004) Ibis 146: 579–600.
O’Brien M (2011) Bird Study 58: 399–408.
Perkins AJ, et al. (2011) Journal of Applied Ecology 48: 514–522.
Siriwardena GM, et al. (1998) Journal of Applied Ecology 35: 24–43.
Stockdale JE, et al. (2014) Parasitology 142: 490–498.
Future challenges and opportunities for farmland birds

21The state of the UK’s birds 2015
Turtle dove numbers have declined steeply
Steve K
nell (rspb-images.com
)

22 The state of the UK’s birds 2015
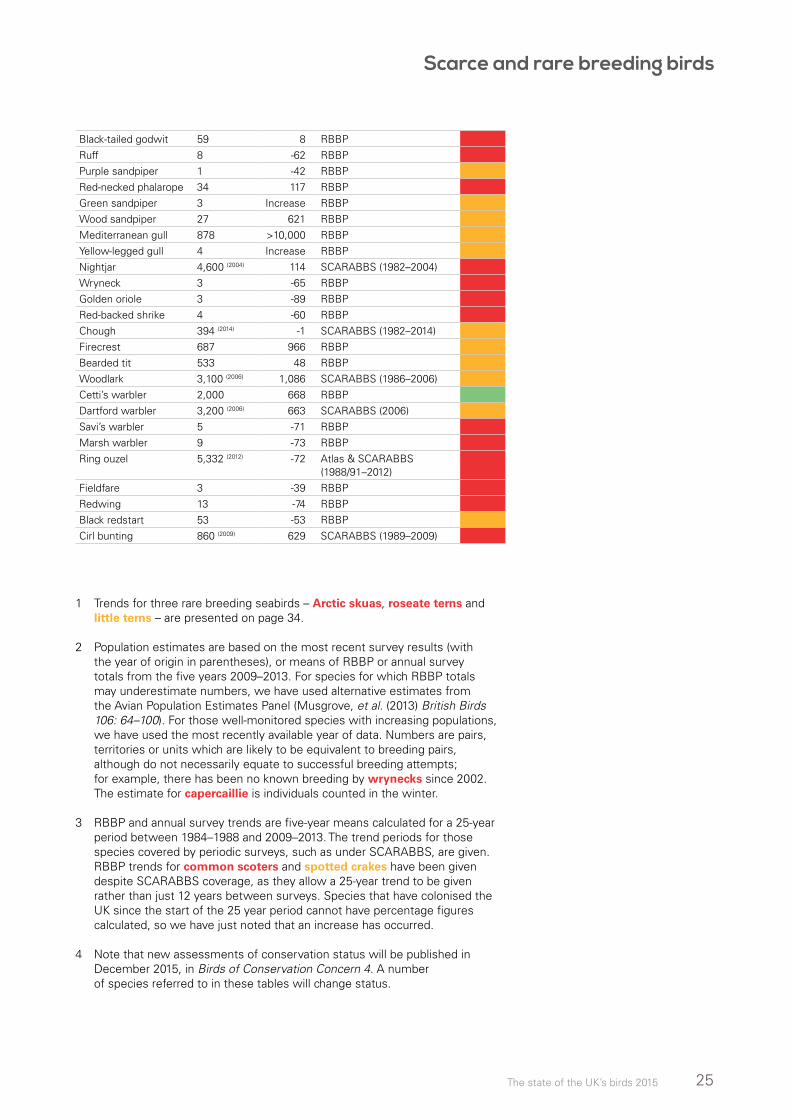
Trends of scarce and rare breeding birds
Here we summarise the latest information on the status of 60 of our rarest breeding species, drawing on data recorded up to 2014.
These data are mainly provided by the Rare Breeding Birds Panel (RBBP), an independent body supported by the JNCC, the RSPB and the BTO. Since 1973, the Panel has collated information from a range of sources, relying mainly on reports of breeding birds by birdwatchers through the county bird recorder network.
The RBBP reports annually on the fortunes of over 80 breeding species, as well as on a range of species that only occasionally attempt to breed in the UK.
Some of these occasional breeders may simply be lost individuals. Others, such as the little bitterns, black-winged stilts and bee-eaters that have bred successfully in recent years, may be the forerunners of colonisation events as these species move north in response to Europe’s warming climate.
Bespoke surveysFor some species, coverage by the RBBP, although informative, is not complete enough to allow robust estimates and trends to be calculated. Bespoke surveys are conducted for some of these species, usually at intervals of either six or 12 years, under the Statutory Conservation Agency and RSPB Annual Breeding Bird Scheme (SCARABBS), or as BTO surveys.
These surveys derive populationestimates from either a complete count of the breeding population or a scientifically-robust sample. When carried out more than once using the same or similar methods, population trends over the intervening years between surveys can be calculated.
Extinction concernsThe rare breeding birds reported on in the table on pages 24–25 include many of our greatest conservation priorities: 20 of them were Red-listed by Birds of Conservation Concern 3.
A number of these birds are perilously close to extinction in the UK: one species, the wryneck, may already be
extinct, as the last known breeding record was in 2002.
Another bird, the golden oriole, has not bred since 2009. However, singing males do occur at a few sites every spring, so there is hope that it may yet recolonise, especially if climate change improves the attractiveness of the south of the UK to this Mediterranean species.
Red-backed shrikes appeared to be going the same way, but successful breeding in Devon and the Highlands in recent years gives us some cause for hope.
While red-backed shrikes and wrynecks were once found breeding across large parts of the UK, other extreme rarities such as purple sandpipers, Savi’s warblers, marsh warblers, redwings and fieldfares have never, to the best of our knowledge, been anything more than rare breeders. The UK lies at the edge of their breeding ranges, and so to a certain degree, their fortunes here have been dependent on how they fare elsewhere in Europe, and there is relatively little we can do to help them, other than protect the few pairs that do breed.
While population trends for our common and widespread breeding birds are provided by the BBS (pages 8–13), the scheme is unable to provide trends for the many species with smaller populations and/or restricted ranges. These species, which include some of our greatest conservation priorities, are monitored in a number of different ways, many of them involving bespoke effort to monitor a single species.

23The state of the UK’s birds 2015
Dean B
ricknell (rspb-images.com
)Scarce and rare breeding birds
Ospreys have recovered steadily to more than 200 pairs
Conservation successesElsewhere in this group of rare breeders are those birds for which we believe conservation can have a positive impact, if properly informed, targeted and resourced. Here we can provide a heartening list of conservation successes:
• Black-throated divers have benefitted from the provision of nesting rafts, which allow them to breed successfully on the fluctuating waters of hydro-lochs.
• Numbers of white-tailed eagles have increased following reintroduction projects in western Scotland (from 1975 to 1985, and 1993 to 1998) and more recently in eastern Scotland (2007 to 2012). In 2015, 99 years after the species became extinct in the UK, the breeding population exceeded 100 pairs.
• Marsh harriers have recovered from the low of a single breeding male in 1971 to in
excess of 350 pairs spread across much of southern England, west to Wales and north to Scotland. This recovery is thanks to the banning of organochlorine pesticides, a reduction in persecution and the creation of new freshwater wetland habitat.
• Red kites are now a familiar sight across much of the UK due, largely, to reintroduction projects from 1989 onwards. The population is now thought to be in excess of 2,500 pairs.
• Ospreys have recovered steadily to over 200 pairs, following natural recolonisation of Scotland in the 1950s. Breeding resumed in England in 2001 and in Wales in 2004.
• Corncrake numbers are now at their highest since population monitoring began, although a severe dip in 2013 caused by cold spring weather gave cause for concern. The population
remains largely restricted to the Western Isles of Scotland, a small fraction of its former range.
• As with corncrakes, stone-curlews were badly hit by the cold spring of 2013. However, conservation effort over three decades has enabled this species to recover slowly, aided by the improved management of semi-natural grassland and intensive work to protect and provide habitat for pairs on arable farmland.
• Red kite and woodlark numbers have increased to the extent that, despite some regional declines for the woodlark, these species are no longer reported on by the RBBP.
This list is just a sample of the good news stories – elsewhere in this report we touch on other partnership conservation projects that have delivered success for species such as bitterns, cranes and cirl buntings.

24 The state of the UK’s birds 2015
Whooper swan 23 1,457 RBBPPintail 30 38 RBBPGarganey 89 80 RBBPPochard 653 207 RBBPCommon scoter 52 (2007) -60 RBBPGoldeneye 200 (APEP) 72 RBBPQuail 839 443 RBBPBlack grouse 5,100 (2005) -80 SCARABBS (1991/92–2005)Capercaillie 1,300 (2009/10) -42 SCARABBS (1992/93/94–
2009/10)Red-throated diver 1,300 (2006) 38 SCARABBS (1994–2006)Black-throated diver 220 (2006) 16 SCARABBS (1985–2006)Bittern 153 (2015) 660 Annual monitoring
(1990/94–2011/15)Little egret 816 Large
increaseRBBP
Slavonian grebe 27 -62 Annual surveysBlack-necked grebe 51 59 RBBPHoney buzzard 43 634 RBBPRed kite 1,600 2,000+ RBBPWhite-tailed eagle 106 (2015) 760 Annual surveysMarsh harrier 351 770 RBBPHen harrier 630 (2010) 15 SCARABBS (1988/89–2010)Montagu’s harrier 13 42 RBBPGoshawk 469 336 RBBPGolden eagle 440 (2003) 5 SCARABBS (1982–2003)Osprey 206 397 RBBPMerlin 1,100 (2008) 94 SCARABBS (2008)Hobby 2,800 (APEP) 284 RBBP
Peregrine 1,505 (2014) 5 SCARABBS (1992–2014)
Spotted crake 28 (2012) 189 RBBPCorncrake 1,311 (2014) 75 Annual surveysCrane 19 1,800 RBBPStone-curlew 390 244 Annual surveysAvocet 1,747 470 RBBPLittle ringed plover 1,200 (2007) 80 Surveys (1984–2007)Dotterel 423 (2011) -57 SCARABBS (1987/88–2011)Whimbrel 300 (2009) > -50 Surveys (1995–2007)
Population estimate2
Trend(% change)
Species1 Trend source and period3
BOCC34
Trends in scarce and rare breeding birds in the UK
That said, there is much yet to be done if many species are to recover to the levels of abundance seen just a few decades ago, and there are a number for which the corner has not yet been turned. In Scotland, concerted effort on capercaillie may have halted a steep decline and prevented it from going extinct in the UK for
Scarce and rare breeding birds
Work still to doa second time, but the species remains at perilously low levels. Both common scoters and Slavonian grebes have declined in recent years; research is ongoing to identify the causes.
The table below draws on the best sources of information, whether from the RBBP or
dedicated species surveys (note that some species are covered by both).
Where possible, we have given trends for the most recent 25 years, but in many cases different trend periods (some considerably shorter than 25 years) are used.
25The state of the UK’s birds 2015
Black-tailed godwit 59 8 RBBPRuff 8 -62 RBBPPurple sandpiper 1 -42 RBBPRed-necked phalarope 34 117 RBBPGreen sandpiper 3 Increase RBBPWood sandpiper 27 621 RBBPMediterranean gull 878 >10,000 RBBPYellow-legged gull 4 Increase RBBPNightjar 4,600 (2004) 114 SCARABBS (1982–2004)Wryneck 3 -65 RBBPGolden oriole 3 -89 RBBPRed-backed shrike 4 -60 RBBPChough 394 (2014) -1 SCARABBS (1982–2014)Firecrest 687 966 RBBPBearded tit 533 48 RBBPWoodlark 3,100 (2006) 1,086 SCARABBS (1986–2006)Cetti’s warbler 2,000 668 RBBPDartford warbler 3,200 (2006) 663 SCARABBS (2006)Savi’s warbler 5 -71 RBBPMarsh warbler 9 -73 RBBPRing ouzel 5,332 (2012) -72 Atlas & SCARABBS
(1988/91–2012)Fieldfare 3 -39 RBBPRedwing 13 -74 RBBPBlack redstart 53 -53 RBBPCirl bunting 860 (2009) 629 SCARABBS (1989–2009)
1 Trends for three rare breeding seabirds – Arctic skuas, roseate terns and little terns – are presented on page 34.
2 Population estimates are based on the most recent survey results (with the year of origin in parentheses), or means of RBBP or annual survey totals from the five years 2009–2013. For species for which RBBP totals may underestimate numbers, we have used alternative estimates from the Avian Population Estimates Panel (Musgrove, et al. (2013) British Birds 106: 64–100). For those well-monitored species with increasing populations, we have used the most recently available year of data. Numbers are pairs, territories or units which are likely to be equivalent to breeding pairs, although do not necessarily equate to successful breeding attempts; for example, there has been no known breeding by wrynecks since 2002. The estimate for capercaillie is individuals counted in the winter.
3 RBBP and annual survey trends are five-year means calculated for a 25-year period between 1984–1988 and 2009–2013. The trend periods for those species covered by periodic surveys, such as under SCARABBS, are given. RBBP trends for common scoters and spotted crakes have been given despite SCARABBS coverage, as they allow a 25-year trend to be given rather than just 12 years between surveys. Species that have colonised the UK since the start of the 25 year period cannot have percentage figures calculated, so we have just noted that an increase has occurred.
4 Note that new assessments of conservation status will be published in December 2015, in Birds of Conservation Concern 4. A number of species referred to in these tables will change status.
Scarce and rare breeding birds

26 The state of the UK’s birds 2015
The range of nightingales is contracting, with most birds now found in south-east England
Roger W
ilmshurst (rspb-im
ages.com)
Recent surveysIn 2012, the fourth national nightingale survey was undertaken by the BTO, with supplementary coverage in 2013. Previous surveys took place in 1976, 1980 and 1999. A total of 2,700 tetrads (2-km x 2-km squares) were identified for inclusion, consisting of 2,400 that had been occupied in 1999 or more recently. A further 300 random tetrads were selected from apparently unoccupied areas within the known breeding range in south-eastern and central Britain.
The raw survey count (ie. not corrected for detectability) for 2012/2013 was 3,300 singing males. Comparison with raw totals of
Nightingales4,770 and 4,565 males counted in 1980 and 1999 respectively, indicates a considerable decline in the population (31% and 28% respectively). However, the actual decline may have been greater as field methods in earlier surveys were likely to have under-recorded paired males. The core breeding range is increasingly concentrated in south-east England, with notable populations in Kent, Suffolk and Sussex. This follows ongoing range contraction from the west and north, which is evident both from survey data and the Bird Atlas 2007–11.
A range of population estimates was calculated using permutations
of different analyses. These accounted for detectability during the survey, the number of birds in un-surveyed nightingale sites and for nightingales missed outside of known sites. The resulting best estimate suggests a population of around 5,500 singing males.
There has been a noticeable shift in habitat use by nightingales over recent decades. In 1976, over 71% of males were associated with woodland, especially coppice and young plantations, which decreased to 37% of males by 2012. However, over the same period, use of scrub has increased considerably, from 28% in 1976 to 55% of territories in 2012.

27The state of the UK’s birds 2015
Peregrines
Recent surveys
The sixth UK breeding survey of peregrines was carried out in 2014, providing a provisional estimate of 1,505 pairs in the UK and Isle of Man. This figure indicates that the peregrine population has remained largely stable since the last national survey in 2002.
Survey coverage was largely achieved by volunteers. The main organisations involved were the BTO and the Scotland and Northern Ireland Raptor Study Groups, without whom the survey would not have been possible.
The picture of overall stability belies marked variation in different parts of the British Isles over the past 12 years. There have been decreases in Scotland, Wales and the Isle of Man, and increases in England and Northern Ireland (see table below). For the first time, the estimated number of breeding peregrines in England is greater than that in Scotland.
These country-level changes, together with regional trends in peregrine breeding numbers and territory occupancy, show a consistent pattern across the surveyed area. Broadly speaking, peregrine numbers have decreased in upland areas, and have remained stable or increased in many lowland and coastal areas. The association of peregrines with remote places grows increasingly tenuous, as numbers nesting on traditional inland crags decline, and numbers occupying lowland quarries and man-made structures grow.
This redistribution of peregrines across the British Isles is probably being driven by multiple factors. Food supply is likely to be important; changes in the number and availability of prey are likely to be having an effect in many areas.
Illegal persecution continues to restrict the numbers and output of breeding peregrines in some regions, particularly where pigeon racing is practised and where there is intensive management for red grouse shooting. In contrast, decreases in lowland persecution during the 20th century, and the ban on organochlorines, have had
`Steve K
nell (rspb-images.com
)
Peregrines are now distributed more widely and evenly than ever in the UK
positive influences on numbers and allowed peregrines to expand into areas where they were previously absent. More work is needed, particularly on food supply and its role in limiting peregrine numbers, in order to diagnose the cause of regional declines, and identify measures to halt or reverse them.
Provisional estimates of the UK and Isle of Man peregrine population (numbers of breeding pairs) in 2014
Area Number of breeding pairs % change 2002 2014
Wales 283 249 -12
Scotland 571 509 -11
England 470 628 34
Isle of Man 31 23 -26
Northern Ireland 82 96 17
Total 1437 1505 5

28 The state of the UK’s birds 2015
ChoughsThe fourth full breeding survey of choughs was carried out in 2014, providing a provisional estimate of 394 pairs in the UK and the Isle of Man. This initial figure indicates that the chough population in the UK has remained largely stable since the last national survey in 2002; however, there have been some regional changes over the intervening 12 years.
The UK chough population ismade up of distinct breedingpopulations in Cornwall, Wales,the Isle of Man and the Western Isles (mainly on Islay), with justa single pair breeding in NorthernIreland. As in previous surveys, the majority of the population in 2014 was found in Wales (55%) and the Isle of Man (30%). The conditions and habitats used by choughs vary widely
between these areas. Nest sites are traditionally associated with sea cliffs, although birds do nest inland and in built structures (particularly on Islay).
Some areas have seen declines since 2002*. In Scotland, on Islay, the estimate is down by 18% since the last national survey, confirming the decline reported from annual monitoring on the island in recent years.
Choughs do not usually breed until their third or fourth year, so trends in the abundance of breeding birds can be influenced by the survival rates of the pre-breeding element of the population. The well-studied population on Islay has shown declines in the survival of pre-breeders and this has been
linked to the changes in prey abundance and availability.
Initial analyses of counts in north and mid-Wales show a drop of 7%, but overall, the population in Wales shows no substantial change (a 1% increase) since 2002, due to small increases in numbers in Pembrokeshire and Glamorgan. In England, the Cornish population has increased from one pair in 2002 to seven in 2014. A large number of volunteers monitor known sites here annually, and in 2014 this effort was extended to cover nearly all suitable habitat in an attempt to find any previously un-located pairs. Despite this extra coverage in the national survey year, no new pairs were found.
Ste
ve K
nell
(rsp
b-im
ages
.com
)
Wales is home to 55% of the UK’s chough population
Recent surveys

29The state of the UK’s birds 2015
Recent surveys
Area Number of breeding pairs % change 2002 2014
Wales 212 215 1
Scotland 71 53 -25
England 1 7 600
Isle of Man 114 118 4
Northern Ireland 1 1 0
Total 399 394 -1
One and all for choughsLike other charismatic species, choughs attract a lot of attention. But the dedication of chough supporters across the UK is noteworthy; members of the Scottish Chough Study Group, the Manx Chough Group, the Cross & Stratford Chough Colour-ring Project, the Pembrokeshire Chough Study Group and the Cornwall Chough Project are all committed to helping these iconic corvids.
Every year, volunteers and researchers spend April to June covering miles of coastline, as well as known inland sites, in search of choughs.
Partnerships between specialist groups such as these, bringing together academics, enthusiastic volunteers, land owners and farmers, have provided a wealth of information on the status of choughs. Much of what we know about the demographics
of the population comes from these detailed studies over many decades.
In addition to monitoring, research is also ongoing, including projects investigating the impacts of chemical treatments on invertebrates. The supplementary feeding scheme on Islay has been running for a number of years to test whether a reduction in food availability is the cause of the chough’s decline on the island.
RSPB staff provide advice and support to farmers, as well as helping to prepare agri-environment scheme applications.
In Cornwall, staff and volunteers monitor the growing population and protect nests from disturbance. Project partner, Natural England, ensures the most important places for choughs are targeted for agri-environment agreements – this includes the current
territories and areas where they are most likely to colonise next. Local farmers are wonderfully supportive and eager to take on chough-friendly management of the coastal fringe.
In addition, the National Trust in Cornwall has put in place measures to safeguard the birds on their coastal holding and implements grazing initiatives to provide good habitat. They also encourage the public to find out more about these fascinating birds.
The thousands of sightings sent in by local people and visitors really helps the groups to keep track of all the birds year round, providing fantastic data. Cornwall’s motto “One and all” neatly sums up the attitude towards choughs across the country!
Provisional estimates of the UK chough population in 2014*
* Population estimates are subject to ongoing analyses. Inclusion of data from detailed annual monitoring in 2014, alongside the national survey coverage, may mean that the final result is slightly higher than presented here.
30 The state of the UK’s birds 2015
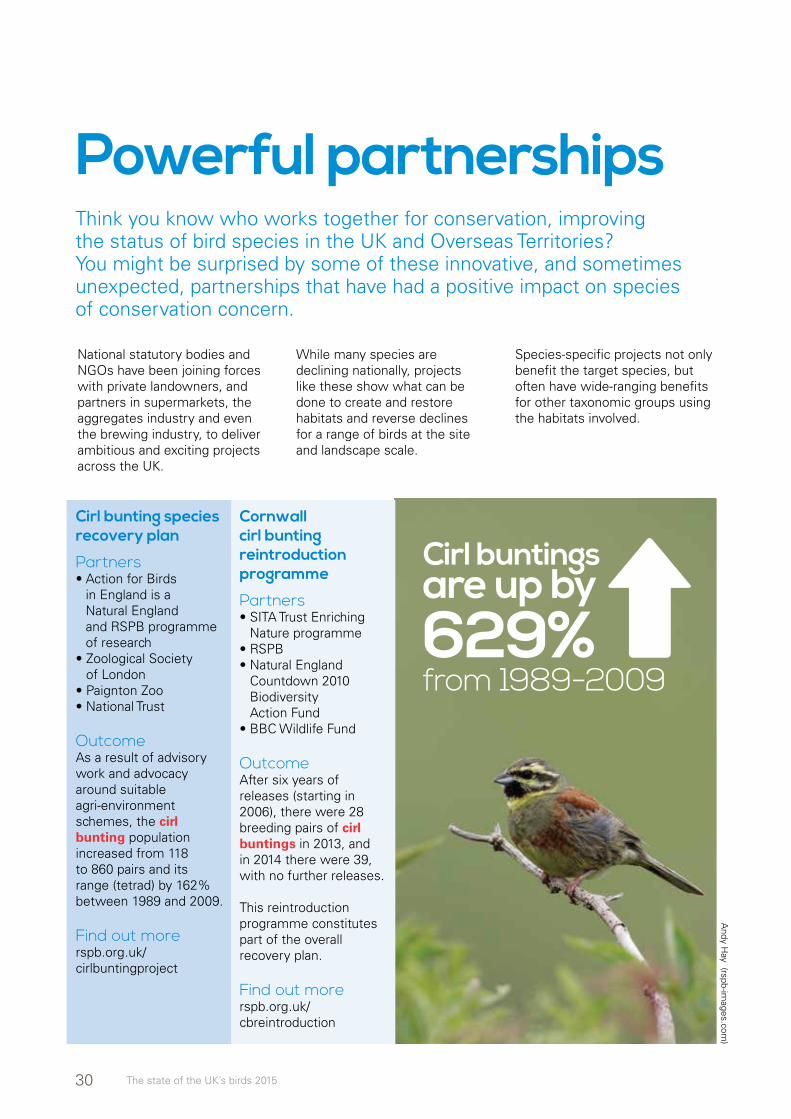
Powerful partnershipsThink you know who works together for conservation, improving the status of bird species in the UK and Overseas Territories? You might be surprised by some of these innovative, and sometimes unexpected, partnerships that have had a positive impact on species of conservation concern.
Cirl bunting species recovery plan
Partners• Action for Birds
in England is a Natural England and RSPB programme of research
• Zoological Society of London
• Paignton Zoo• National Trust
OutcomeAs a result of advisory work and advocacy around suitable agri-environment schemes, the cirl bunting population increased from 118 to 860 pairs and its range (tetrad) by 162% between 1989 and 2009.
Find out morerspb.org.uk/cirlbuntingproject
Cornwall cirl bunting reintroduction programme
Partners• SITA Trust Enriching
Nature programme• RSPB• Natural England
Countdown 2010 Biodiversity Action Fund
• BBC Wildlife Fund
OutcomeAfter six years of releases (starting in 2006), there were 28 breeding pairs of cirl buntings in 2013, and in 2014 there were 39, with no further releases.
This reintroduction programme constitutes part of the overall recovery plan.
Find out morerspb.org.uk/cbreintroduction
National statutory bodies and NGOs have been joining forces with private landowners, and partners in supermarkets, the aggregates industry and even the brewing industry, to deliver ambitious and exciting projects across the UK.
While many species are declining nationally, projects like these show what can be done to create and restore habitats and reverse declines for a range of birds at the site and landscape scale.
Species-specific projects not only benefit the target species, but often have wide-ranging benefits for other taxonomic groups using the habitats involved.
Cirl buntings are up by629%from 1989-2009
Andy H
ay (rspb-images.com
)

31The state of the UK’s birds 2015
Powerful partnerships
Great Crane Project
Partners• WWT• RSPB• Pensthorpe
Conservation Trust• Viridor Credits
OutcomeSince 2010, 93 birds have been reintroduced into the Somerset Levels and Moors. In 2015, 16 pairs held territories in south-west England and two pairs raised chicks to fledging for the first time in 400 years.
Find out morethegreatcraneproject.org.uk
Langholm Moor
Partners• Buccleuch Estates• Scottish Natural Heritage• Game & Wildlife Conservation Trust• RSPB• Natural England
OutcomeBetween 2008 and 2014, the number of breeding female hen harriers increased from one to 12, fledging 47 chicks.
The number of lekking black grouse increased from five to 29 between 2008 and 2015.
Much of this is a result of the dedication of gamekeepers to habitat management and legal predator control, as well as estate commitments to reduce grazing impacts on heather moorland.
Find out morelangholmproject.com
Lekking black grouse increased from 5 to 29 birds
Black grouse by A
ndrew Parkinson (rspb-im
ages.com)
Crane by D
avid Tipling (rspb-images.com
)
The Famous Grouse, Smoky Black funding for conservation
Partners• The Famous Grouse• RSPB
OutcomeThis nine-year partnership is delivering over £600,000 for conservation. In Geltsdale, it helped fund a project involving woodland planting and changes to the grazing regime, which saw the number of lekking black grouse increase from 18 in 2009 to 59 in 2015.
Funding has also been provided for research projects into black grouse population changes and how woodland changes can benefit the species.
Find out morerspb.org.uk/famousgrouse

32 The state of the UK’s birds 2015
Ruabon Moor
Partners• Natural Resources
Wales• RSPB Cymru• Wynnstay Home
Farm Partnership
OutcomeNumbers of lekking black grouse in Wales met the 2015 biodiversity target of 270 males four years early, thanks in large part to increases on Ruabon Moor. Breeding curlews and golden plovers also benefit from this partnership between game managers and conservationists. Numbers of black grouse continue to recover; in 2015 just over 300 males were recorded on the moor.
Greater Thames Nature Improvement Area (NIA)
Partners• Natural England• RSPB• Thames Estuary Partnership• Essex County Council• Greater London Authority• DEFRA• Environment Agency• Kent Wildlife Trust• Greening the Gateway Kent and Medway
OutcomeIn the Greater Thames NIA, 158 ha of agricultural land are being restored to traditional grazing marsh with the help of a local landowner. After the first year of work, 10 redshank pairs and 17 lapwing pairs bred on site, with a whopping productivity of 1.68 chicks per pair (exceeding the target of 0.7).
Find out moregreaterthamesmarshes.com Across all NIAs, actions to improve priority habitat are ongoing or planned on 24,000 hectares. Visit bit.ly/1h2J5ZU to find out more.
Avalon Marshes Partnership
Partners• Natural England• RSPB• Somerset Wildlife Trust• Hawk and Owl Trust• Environment Agency• Historic England
OutcomeReedbed management is improving habitat for bitterns, bearded tits, Cetti’s warblers and water voles. Booming bittern counts show that the population is up from 25 to 45 between 2011 and 2014. The Avalon Marshes are now home to a third of the UK’s booming bitterns.
Find out moreavalonmarshes.org
of farmland are being restored to traditional grazing marshbenefitting redshanks and lapwings in the Greater Thames
158 ha
Richard B
edford (rspb-images.com
)

33The state of the UK’s birds 2015
Support for nightingales by Anglian Water
Partners• BTO• Anglian Water• Bedfordshire, Cambridgeshire and Northamptonshire Wildlife Trust• Survey volunteers
OutcomeAnglian Water has been working in partnership with the BTO since 2000 to research why nightingales have declined by more than 80% in the UK since the 1960s. The partnership also shares the effective habitat managment practices developed on Anglian Water sites.
As a result, advisory guidance for managing scrub and woodland habitat for nightingales was produced in 2001. An updated habitat management guidance booklet was then produced in 2015.
Find out more bit.ly/1O4XO5b
Halting Environmental Loss Project (HELP)
Partners• BirdWatch Ireland• Dept of the Environment NI• Dept of Environment,
Heritage and Local Government in ROI
• EU Regional Development Fund• RSPB Scotland
OutcomeSince 2011, the project has influenced the management of 4,488 ha of breeding wader habitat in NI – including 824 ha of scrub and rush clearance, and the creation of 15 scrapes. Between 2011 and 2014, there was a 78% increase in breeding wader pairs.
Find out morerspb.org.uk/haltingenviroloss
Great Fen Project
Partners• Wildlife Trust for Bedfordshire, Cambridgeshire
and Northamptonshire • Natural England• Environment Agency • Huntingdonshire District Council • Middle Level Commissioners
The Heritage Lottery Fund has been the main sponsor, awarding £7.2 million for the purchase and restoration of over 1,317 ha of land; heritage and memories projects; and schools and community work across the local area.
OutcomeThe project began in 2001, and the first land was purchased in 2002. Since then, active restoration has begun on more than 866 ha of habitat (mostly freshwater wetland and wet grassland) between and around Woodwalton Fen and Holme Fen National Nature Reserves. This will provide much needed habitat for a range of wetland birds of conservation concern.
Find out moregreatfen.org.uk
Curlews bucking national trends thanks to HELP
Andy H
ay(rspb-images.com
)

34 The state of the UK’s birds 2015
Breeding seabirds Since 1986, breeding seabirds at colonies around Britain and Ireland have been monitored annually via the Seabird Monitoring Programme (SMP). The SMP is co-ordinated by the JNCC and monitoring is undertaken by a number of partner organisations and volunteers.
Data are collected on breeding abundance and productivity for all 25 species that regularly breed in the UK. Between 300 and 500 different sites are surveyed annually throughout the UK, as well as in the Republic
of Ireland, Isle of Man and the Channel Islands. Trends produced from these data are used as a measure of the state of seabird populations, with a view to making inferences about the wider marine environment.
The table shows the differing fortunes of 17 species monitored by the SMP over the short and long term. Results are only presented for the UK and for species where trends are considered to be robust.
Fulmar -21 -18Gannet* 77 26Cormorant 2 -12Shag -49 -38Arctic skua -80 -71Great skua* 50 19Kittiwake -63 -47Black-headed gull 68 102Herring gull -39 -38Great black-backed gull 6 -6Little tern -27 -9Sandwich tern -10 -3Common tern -27 -20Roseate tern -67 127Arctic tern 39 34Guillemot 60 22Razorbill 49 6
Trends in breeding seabird numbers in the UK
1986 – 2014 trend %
2000 – 2014trend %
Species
*trends derived from census interpolations and extrapolations
For more information on the SMP, please see jncc.defra.gov.uk/page-1550. You can view the full report at jncc.defra.gov.uk/page-3201.
1 Note that new assessments of conservation status will be published in December 2015, in Birds of Conservation Concern 4. A number of species referred to in these tables will change status.
BOCC31

35The state of the UK’s birds 2015
Roseate terns increased by 127% between 2000 and 2014 C
hris Gom
ersall (rspb-images.com
)

36 The state of the UK’s birds 2015
Breeding seabirds in the UK
Between 1986 and 2014, Arctic skuas, kittiwakes and roseate terns have declined by at least 60%, with shags, herring gulls, little terns and common terns declining in the region of 25–50%. Various factors are responsible for these declines.
Contributory factors in the decline of Arctic skuas include competition for nesting territories with, and predation by, great skuas (which have increased markedly) and reductions in sandeel stocks in seas adjacent to breeding grounds. Reductions in sandeel stocks have been well documented in the long-term decline in kittiwakes, which apparently continues despite more successful breeding seasons in recent years.
The SMP is led and co-ordinated by the JNCC, in partnership with 18 other organisations.
Within the UK, the partnership includes the four statutory nature conservation agencies (SNH, NE, NRW and NIEA) and conservation NGOs (the RSPB, BTO, The National Trust, The National Trust for Scotland and the Scottish Wildlife Trust), together with the Seabird Group, the Centre for Ecology and Hydrology (CEH) and the Shetland Oil Terminal Environmental Advisory Group (SOTEAG).
Both CEH and SOTEAG have been operating long-running seabird monitoring schemes, on the Isle of May and in Shetland respectively, bringing a wealth of experience and skills to the partnership.
Shag abundance has been affected by periodic winter “wrecks” from which numbers appear to have struggled to recover before the next event.
Little terns suffer from disturbance and tidal inundation when breeding, but these problems are currently being tackled by intensive management at many colonies.
Management at colonies has also benefitted roseate terns, which, since 2000, have shown a slow recovery from the large declines they experienced in the 1980s. Conservation measures have included providing shelter and protection from avian predators in the form of nest boxes at breeding sites, although the increase
From outside the UK, interests are represented by BirdWatch Ireland and the National Parks and Wildlife Service; Manx National Heritage and Manx BirdLife; the Isle of Man Government; and the State of Guernsey Government. About 100 volunteers also contribute data annually.
Detailed monitoringTo effectively understand the impact of changes in the wider environment on seabirds, data on breeding success, survival, diet and phenology are required. There is a considerable lag in the impacts that environmental change has on population size, as seabirds are long-lived, have high adult survival rates and can delay breeding until they are between three and nine years old (depending on species).Although these additional data
in numbers is largely confined to one main colony.
Long-term increases have been recorded between 1986 and 2014 for gannets, great skuas, black-headed gulls, Arctic terns, guillemots and razorbills.
However, for some of these species (Arctic terns, guillemots and razorbills), abundance has been declining steadily in northern colonies for a number of years. This has been offset by greater increases in England, Wales and Northern Ireland.
Gannet numbers continue to rise; most of the smaller colonies are increasing at substantial rates (with larger ones stable or increasing slightly) while new colonies continue to be formed.
are more difficult and labour intensive to collect, they are more responsive than measures of abundance. Such long-term data collection is invaluable for identifying why a species has declined.
A recent study has used SMP data to assess the 50% decline in the number of puffins on Fair Isle over a 27-year period. Analyses showed that reduced recruitment of young birds into the breeding population was the likely cause of these declines. For more information, please visit bit.ly/1KNSp1c.
Data sharingData sharing is equally important, allowing further collaboration between SMP partners and others, including students, researchers and
Long term and severe declines
The SMP Partnership

37The state of the UK’s birds 2015
Breeding seabirds in the UK
Between 2000 and 2013, the UK shag population declined by 38%
Chris G
omersall (rspb-im
ages.com)
interested members of the public. Data and information can then be disseminated to a wider audience interested in the fortunes of seabirds.
One of the key purposes of SMP data collection is to contribute to assessments of the state of our seabird populations and to provide information that aids the assessment of the condition of designated sites. It is used as a component of headline indicators relating more widely to the status of UK bird populations and as part of measuring progress towards European Union and Convention on Biological Diversity targets.
Nationally, SMP data also forms an important component of the UK wild bird indicators.
Seabirds CountAnnual data are put into context by periodic complete censuses of breeding seabirds in the UK and Ireland: Operation Seafarer (1969–70), Seabird Colony Register (1985–88) and Seabird 2000 (1998–2002).
Since the end of Seabird 2000, many of our seabirds have declined. Another national census is needed to provide updated population estimates and trends.
SMP partners are currently working together for the next national census, named Seabirds Count. The provisional start date of the census is summer 2016, although this and the extent of coverage achieved is subject to appropriate funding being attained.

38 The state of the UK’s birds 2015
Wintering waterbirds
Birds breed throughout the Arctic terminus of this flyway, over an extensive area from Canada in the west to mid-northern Siberia in the east. Many species and populations using the East Atlantic Flyway spend the winter in Western Europe, or pass through the region to overwinter in West Africa.
During cold winters, the UK assumes even greater conservation importance, when more birds seek refuge on the relatively mild Atlantic fringe of north-west Europe. It is therefore vital to
understand if changes in the number of birds using the UK’s wetlands reflect changes in the status of total populations of species; or represent changing distributions.
The wetlands that wintering waterbirds depend on are the subject of extensive site protection and management, which allow us to meet the requirements of international agreements.
The Agreement on the Conservation of African-Eurasian Migratory Waterbirds (or AEWA – Africa Eurasian Waterbird
Agreement), is the most important flyway conservation strategy focusing specifically on the requirements of waterbirds.
Many wetlands are designated under the Ramsar Convention as wetlands of international importance, and as Special Protection Areas (SPAs) under the EU Birds Directive, recognising the critical role that wetlands play in the lifecycle of waterbirds.
See page 44 for a review of the importance of SPAs for smews in the face of climate change.
Each year, millions of waterbirds on the East Atlantic Flyway take advantage of the UK’s extensive wetland habitats and relatively mild winter climate.
Ric
hard
Rev
els
(rsp
b-im
ages
.com
)
Special Protection Areas provide vital habitat for smews

39The state of the UK’s birds 2015
Wintering waterbird indicatorThe wintering waterbird indicator on page 6 illustrates the composite trend for 46 native species/populations, using data from Wetland Bird Survey (WeBS) Core Counts and the Goose & Swan Monitoring Programme (GSMP).
It is important to note that indicators illustrate the overall change in abundance. If individual species, populations, or groups of species are examined separately, different trends become apparent.
The indicator shows a steady increase in the overall number of wintering waterbirds in the UK, from the mid-1970s to the late-1990s. This is due, in part, to the establishment of a network of protected wetlands, while for some species a reduction in hunting pressure also contributed to increases. However, since the mid-1990s, the wintering waterbird indicator has shown evidence of a decline for both wildfowl
and waders. Species showing consistent, long-term declines are of most concern; 10 of the native species listed on page 42 have declined by more than 20% over both the 25-year and 10-year trend periods.
Working together for waterbirdsThe monitoring and conservation of waterbirds is usually undertaken at a population scale, using the distinct migratory flyways followed by the birds. Collaboration between national waterbird monitoring schemes is therefore essential, and data from both WeBS and GSMP feed into the International Waterbird Census (IWC), co-ordinated by Wetlands International.
The IWC is a collation of waterbird counts undertaken in January each year in countries across the globe, and is crucial for the assessment of species’ population status at the flyway level. Volunteer counters are the lifeblood of these schemes.
Without the dedication of volunteers and their willingness to go out in all weathers to monitor the UK’s waterbirds, these schemes simply would not function.
In 2013/14, WeBS counts were carried out at 2,651 wetlands across the UK, and at least 500 sites were covered for the key GSMP surveys.
More informationFor extensive information about UK waterbird populations visit bto.org/webs-reporting.
The online report includes sections on numbers and trends, WeBS Low Tide Counts and the triennial WeBS Alerts, which assess trends at protected and other important sites. The information is also summarised in a paper report, which is sent to all WeBS volunteers and is available to download.
Steve K
nell (rspb-images.com
)
Pink-footed geese are one of the increasing species included in the wintering waterbird indicator

40 The state of the UK’s birds 2015
Wintering waterbirds
Inland wetlandsAn increase in the number offlooded gravel pits and reservoirs across the UK during the last half century, as well as improvedmanagement of sites such as the Nene Washes and Somerset Levels, has undoubtedly benefitted many waterbirds that are dependent on freshwater wetlands.
These include dabbling ducks, such as shovelers, teals and gadwalls, all of which have shown long-term increases in the UK. Gadwalls have certainly made great use of gravel pits in recent years and numbers have regularly exceeded the thresholds for national and even international importance for this species at a large number of sites. Diving species, such as tufted ducks, goosanders, great crested and little grebes, and coots, have also increased
over the long term, although coots have shown a shallow decline more recently.
Declining ducksIn contrast, it is clear from WeBS trends that pochards and goldeneyes are declining at a steady rate. Large increases in the number of goldeneyes reported from the Baltic Sea would seem to indicate that short-stopping to the east is driving the UK trend, but the population-scale trend for pochards suggests this species is genuinely in decline. Wintering mallards have also exhibited a steady long-term decline in the UK. This is likely to be the result of a complex combination of factors, such as reduced winter immigration from the continent, and possible changes in the use of UK wetlands by mallards.
Reassessing golden ploversLapwings and golden plovers make extensive use of inland sites during the winter, often frequenting agricultural fields and river valleys. As a result, these two species are especially difficult to monitor accurately in the UK through wetland-focussed surveys, such as WeBS.
A co-ordinated pan-European count of golden plovers was therefore undertaken in October 2014, which gathered important data away from wetland sites to enable reassessment of the size of the population. The counts have not yet been fully collated, but early indications are that numbers present in the UK were slightly lower than expected, due to mild conditions in and around their breeding areas.
Ray
Ken
nedy
(rsp
b-im
ages
.com
)
Numbers of mallards wintering in the UK have steadily been declining

41The state of the UK’s birds 2015
Estuaries and other coastal habitatsThe UK’s estuaries are hugely important for non-breeding waterbirds. However, the latest results from WeBS, published earlier this year in Waterbirds in the UK 2013/14, show that a number of familiar estuarine waders are declining in the UK. Numbers of ringed plovers, dunlins, redshanks, curlews, oystercatchers, knots, grey plovers and bar-tailed godwits are all decreasing to varying degrees. The drop in the number of ringed plovers is a cause of particular concern, as the UK wintering population has declined by 58% in the last 25 years. On the positive side, numbers of avocets have increased in line with an expansion of the UK’s breeding population, in part due to the establishment of nature reserves around our coast and positive management for the species. Black-tailed godwits wintering in the UK originate from Iceland, where breeding numbers have increased in the last two decades, and the associated rise in the WeBS trend continues.
Dabbling ducks declineAmong estuarine wildfowl, population trends based on WeBS information indicate that three of the UK’s most familiar dabbling ducks – shelducks, wigeons and pintails – have declined in the last 10 years (by 26%, 16% and 43%).
Research using data from across north-west Europe has suggested that dabbling ducks are less affected by winter temperatures than diving ducks, so it is unclear whether these downward dabbling duck trends are a direct response to climate change, or to a combination of factors.
Shifting distributionsThe numbers of wintering dark-bellied brent geese tend to fluctuate in response to productivity on their Arctic breeding grounds; following a dip in the mid-2000s, increased numbers have spent the winter in the UK in recent years. However, a recent review of the status of the flyway population indicated that the population distribution has shifted in the last decade;
France now supports over 50% of the mid-winter population, compared to 35–40% in Britain. The shift is potentially due to more birds utilising the extensive beds of eelgrass (Zostera spp.) present on the French coast.
Widespread declinesAway from the UK’s estuaries, rocky shores also provide important habitats for wintering waterbirds, such as turnstones and purple sandpipers, both of which have declined in recent years. The winter of 2015/16 will see the Non-Estuarine Waterbird Survey (NEWS) being carried out across the UK. The survey was last undertaken in 2006/07, and showed declines in the numbers of ringed plovers, sanderlings and turnstones over the previous decade. Offshore, flocks of divers, seaducks and grebes occur in important numbers, but evidence of declines in velvet scoters and long-tailed ducks mirror the situation elsewhere in their flyways. See page 44 for plans to address the decline of long-tailed ducks.
WeBS trends for mallards and shelducks
Wintering waterbirds
1966
/67
1968
/69
1970
/71
1972
/73
1974
/75
1976
/77
1978
/79
1980
/81
1982
/83
1984
/85
1986
/87
1988
/89
1990
/91
1992
/93
1994
/95
1996
/97
1998
/99
2000
/01
2002
/03
2004
/05
2006
/07
2008
/09
2010
/11
2012
/13
250
300
350
400
150
Ind
ex (
1966
/67
= 10
0)
100
50
0
200
Shelduck
Mallard

42 The state of the UK’s birds 2015
Wintering waterbirds
1 Long-term trends are the percentage changes between the smoothed index values for 1987/88 and 2012/13.
2 Ten-year trends are the percentage changes between the smoothed index values for 2002/03 and 2012/13. Calculation of smoothed indices by use of a generalised additive model is detailed further at bto.org/webs-alerts.
3 Note that new assessments of conservation status will be published in December 2015, in Birds of Conservation Concern 4. A number of species referred to in these tables will change status.
4 British eiders comprise two populations, trends here exclude birds in Shetland that are of the race faeroeensis.
5 National monitoring of little grebes started later than for other species, so only 10-year trends are shown.
Mute swan 66 -6Bewick's swan -42 -8Whooper swan 48 40Pink-footed goose 100 25European white-fronted goose -71 -38Greenland white-fronted goose -11 -41Icelandic greylag goose -13 16British greylag goose 164 28Canada goose 55 7Greenland barnacle goose 150 39Svalbard barnacle goose 183 29Dark-bellied brent goose 5 33Canadian light-bellied brent goose 79 50Svalbard light-bellied brent goose 120 2Shelduck -23 -26Wigeon 33 -16Gadwall 206 20Teal 67 -3Mallard -39 -18Pintail -40 -43Shoveler 69 1Pochard -60 -41Tufted duck 14 5Scaup -39 -47Eider (except Shetland)4 -7 -7Goldeneye -45 -32Red-breasted merganser -15 -20Goosander 26 9Ruddy duck -98 -99Little grebe5 n/a -12Great crested grebe 19 -25Cormorant 74 -1Coot 8 -16Oystercatcher -21 -19Avocet >1000 58Ringed plover -58 -42Golden plover 129 -25Grey plover -5 -12Lapwing 41 -26Knot -7 -9Sanderling 29 4Purple sandpiper -55 -10Dunlin -27 -24Black-tailed godwit 370 49Bar-tailed godwit -2 -11Curlew -3 -13Redshank -23 -26Turnstone -44 -11
Long-term trend %1 (1987/88–2012/13)
Ten-year trend %2 (2002/03–2012/13)
Species BOCC33
Trends in wintering waterbirds

43The state of the UK’s birds 2015
The UK wintering population of Svalbard barnacle geese reached record levels in 2013/14
Steve K
nell (rspb-images.com
)

44 The state of the UK’s birds 2015
Smews, climate change and SPAs
Long-tailed duck action planning
Recent research using data from across the European flyway, including WeBS data, has revealed how wintering smews are responding to climate change.
These data show that the species has redistributed north-eastwards in response to milder winter conditions in the region over the last 25 years.
In the UK, a small population of typically less than 200 smews (and in mild winters just a few dozen birds) can be found at favoured gravel pits and reservoirs in lowland England. On average,
In 2012, following the publication of Waterbird populations and pressures in the Baltic Sea, the long-tailed duck, a common and widespread seaduck, was up-listed to Vulnerable on the IUCN Red List. The majority of the global population overwinters in the Baltic Sea, and surveys across the sea in 2007–09 indicated that numbers there had declined by around two-thirds since the mid-1990s, from around 4.2 million to 1.4 million birds.
numbers have approximately halved since the late 1990s.
Currently, one third of the total flyway population of smews winters in Scandinavia and the Baltic region, compared to just 6% two decades ago. Over the last 20 years, numbers there have increased twice as fast inside SPAs as those at unprotected sites. This indicates that well-designed protected area networks can help to mitigate the effects of climate change on biodiversity, by safeguarding high quality habitats that allow species to adopt new distributions.
This is equivalent to a 59% decline in the global population size over three generations (ie 27 years, 1993–2020), even when factoring in uncertainty regarding trends outside the Baltic. As a result, a draft Single Species Action Plan has now been prepared and will be submitted for approval to the next Meeting of Parties in November 2015. There is considerable uncertainty about the causes of long-tailed
Gaps in the EU’s SPA network were also highlighted, particularly in the newly occupied northern parts of the wintering range.
Furthermore, despite such range shifts, it is important to maintain networks of protected sites at the southern end of the winter ranges of migratory waterbirds, so that they still have somewhere to retreat to during particularly harsh winters. Studies such as this can help policymakers review protected area networks to ensure they keep pace with the conservation needs of non-breeding waterbirds.
duck declines. The rate of decline in the UK, based on WeBS counts, has also been marked, with numbers having declined significantly in the last 25 years. There is also evidence from their Arctic breeding grounds that reproductive success has decreased to the point where it is insufficient to replace annual mortality. Whether this is the most important factor affecting abundance is, however, unknown.
The threats affecting the species are also poorly understood. Certainly, many die each year in fishing nets, and more still succumb to oiling from small-scale oil pollution incidents in the Baltic Sea (major spills are much less frequent nowadays, but small accidents and intentional illegal discharges remain relatively common). An even more poorly understood, but potentially significant, threat could be related to climate and ecosystem change in the Arctic.
Wintering waterbirdsS
teve
Kne
ll (r
spb-
imag
es.c
om)
Long-tailed duck numbers have declined by two-thirds since the mid-1990s

45The state of the UK’s birds 2015
Goose and Swan Monitoring ProgrammeGeese on the upPopulations of pink-footed geese and Svalbard barnacle geese are doing well, with numbers of both reaching record levels in 2013/14. Typically, during the autumn, pink-footed geese arrive at key sites in north-east Scotland before rapidly dispersing south through Scotland to north-west and eastern England. By contrast, almost the entire population of Svalbard barnacle geese arrive at the Solway Firth in autumn, where they remain until their return migration in the spring.
As the barnacle goose population has increased, so has its distribution on the Solway, although the core feeding areas have remained largely the same. One vitally important area, Rockliffe Marsh at the eastern end of the Firth, sees a rapid turnover of birds during late April/early May, as the majority of the individuals within the population visit for at least a week to feed before migrating. As the population has increased, an increasing proportion stay longer on the Solway, with over a quarter remaining until the middle of May, and sometimes beyond, before departing to their staging areas in Norway and Svalbard.
Population declinesFor several decades, the population of Canadian light-bellied brent geese has been increasing, with a particularly rapid period of growth from 2000 to a peak in 2011. Since then, two very poor breeding seasons have resulted in a sharp fall in numbers of 28% since 2011, reducing the population to a smaller level than recorded in 2006.
Similarly, numbers of Icelandic greylag geese have also fallen for two years in a row, with the count in 2013 being over 20% lower than the 2011 peak. While reasons for the decline are unknown, greylags are a favoured quarry species in Iceland, and the average number shot there per year has increased in the past five years from c. 35,000 to c. 47,000. However, assessing the abundance of Icelandic greylag
geese is difficult nowadays, as the number of British greylag geese in core wintering areas, such as Orkney, Shetland and the Moray Firth, is increasing. This means extra surveys are now needed in these areas during late summer, to better estimate the number of British greylags; these figures are then subtracted from winter counts to provide a better estimate of the number of Icelandic birds present.
Population trends for Svalbard barnacle geese, Canadian light-bellied brent geese, pink-footed geese and Icelandic greylag geese, 1960/61 to 2013/14
Wintering waterbirds
0
50,000100,000
150,000200,000
250,000300,000350,000400,000
60/6
1
65/6
6
70/7
1
75/7
6
80/8
1
85/8
6
90/9
1
95/9
6
00/0
1
05/0
6
10/1
1
0
10,000
20,000
30,000
40,000
60/6
1
65/6
6
70/7
1
75/7
6
80/8
1
85/8
6
90/9
1
95/9
6
00/0
1
05/0
6
10/1
1
0
10,000
20,000
30,000
40,000
50,000
60/6
1
65/6
6
70/7
1
75/7
6
80/8
1
85/8
6
90/9
1
95/9
6
00/0
1
05/0
6
10/1
1
0
20,000
40,000
60,000
80,000
100,000
120,000
60/6
1
65/6
6
70/7
1
75/7
6
80/8
1
85/8
6
90/9
1
95/9
6
00/0
1
05/0
6
10/1
1
Nu
mb
er o
f g
eese
Pink-footed geese
Svalbard barnacle geese
Canadian light-bellied brent geese
Icelandic greylag geese

46 The state of the UK’s birds 2015
UK Overseas Territories updateWhile small in area, the 14 UK Overseas Territories (OTs) hold bird populations of extremely high value on a global scale. As in the UK, most conservation in the OTs is delivered by a range of partnerships.
Eight new Important Bird and Biodiversity Areas (IBAs) were identified across the UK OTs of St Helena and Ascension Island in 2015 – highlighting the importance of these islands for endemic species and internationally important congregations of seabirds.
The RSPB has been working with the St Helena National Trust, St Helena Government Environmental Management Division (EMD), Ascension Island Government Conservation Department and BirdLife International over the last year to review and update the IBAs of these UK OTs, leading to the designation of new sites.
Ascension frigatebirds nest againFor Ascension Island, the new sites include the Wideawake Fairs IBA, which supports over 350,000 nesting sooty terns; and the Letterbox Peninsula IBA – the recolonisation site of the endemic Ascension frigatebird. Following the successful island restoration project from 2002 to 2004, two pairs of Ascension frigatebirds nested on the main island in 2012, for the first time in over 180 years. This has increased every year since, with 44 pairs nesting at the Letterbox Peninsula IBA in 2014–15. So far, 20 chicks have fledged.
Wirebirds reach 16-year highThree of the new IBAs for St Helena have been identified as key sites for the Critically Endangered endemic St Helena plover (known locally as the wirebird). The new Fishers Valley Flat IBA supports the majority of the wirebird population, with over 220 birds. In 2014–15, the wirebird population stood at 437 birds – the highest population count since 1998.
The other three new IBAs for St Helena all support internationally important
New IBAs on Ascension Island and St Helenaseabird populations, including the most southerly breeding populations of red-billed tropicbirds in the Atlantic. The new West Coast IBA supports two seasonally-distinct populations of band-rumped storm petrels which, if confirmed through genetic studies, may represent a population of an endemic globally-restricted species.
For full details of the newly-designated IBAs of Ascension and St Helena, please visit the BirdLife International website Data Zone at birdlife.org/datazone/site.
pop_jop (istockphoto.com)

47The state of the UK’s birds 2015
44 pairs of the endemic Ascension frigatebird are now nesting on the Letterbox Peninsula IBA
Kevin Schafer (naturepl.com
)

48 The state of the UK’s birds 2015
UK Overseas Territories
The devastating effects of introduced house mice on Tristan albatrosses on Gough Island are well known. But burrowing petrels are also severely affected.
In 2013–14, the RSPB looked at the breeding success of MacGillivray’s and broad-billed prions, soft-plumaged petrels, grey petrels, common diving petrels and great shearwaters. Less than half of all breeding
attempts were successful, and for the prions, it was very low. Only 15% of MacGillivray’s prion pairs successfully reared a chick, and all broad-billed prion nests failed, most due to mouse predation. Video cameras placed in seven Atlantic petrel burrows revealed the rapidity and intensity of mouse predation for the first time. All the chicks were eaten within 24 hours of hatching, and survived only seven hours on average.
Mice threaten Gough’s burrowing petrelsIn 2015, the first steps were taken towards eradicating mice from Gough Island, beginning an 18-month period of fundraising and building support. Working with partners, the project aims to restore this UNESCO World Heritage and Ramsar Site to its rightful place as a jewel in the crown of globally important seabird islands, securing the future of the wildlife living there.
Dog Island in Anguilla is designated as an IBA and Key Biodiversity Area (KBA) of critical importance to over 100,000 pairs of nesting seabirds, including brown boobies, masked boobies and magnificent frigatebirds.
In 2011, the Dog Island restoration project – which aimed to rid the island of non-native black rats – was launched by a partnership that included the Department for Environment, Anguilla National Trust (ANT), Fauna & Flora International (FFI) and the RSPB.
The operation to eradicate black rats from Dog Island took place between October 2011 and 2012, and involved cutting over 42 km of trails through dense thorn scrub and applying over two tonnes of rodenticide by hand.
The last rat was removed on 18 March 2012, and following two years of intensive monitoring, Dog Island was officially declared rat-free in June 2014. The successful eradication of black rats here is a significant achievement, and a wonderful example of successful collaboration between government, civil society and the private sector.
Rats removed from Dog Island Dog Island is the largest island in the Caribbean (207 ha) to be successfully cleared of rats, and this will go a long way to restoring the reptile, invertebrate, bird and plant communities on the island.
The project was supported by the National Fish and Wildlife Foundation, Syngenta and the Governor’s Discretionary Fund. The operation on the ground was led by Wildlife Management International Ltd, with a team of dedicated volunteers and staff. For more information, please visit birdlife.org.
Tristan da Cunha is home to more than 80% of the world’s northern rockhopper penguins, breeding on five islands in the group. Since 2009, the RSPB has joined forces with the Tristan da Cunha Conservation Department and Percy Fitzpatrick Institute of African Ornithology (University of Cape Town) to monitor penguin populations annually on Tristan da Cunha, Nightingale, Alex and Gough Islands, with occasional visits to Inaccessible Island.
The 2011 wreck of the MS Olivia off Nightingale resulted in many oiled penguins, and four years on we have found some disturbing trends.
The northern rockhopper penguin population on Alex and Nightingale Islands has essentially halved, while numbers on Tristan have dropped slightly, and numbers on Gough appear to be stable. Alex Island is the largest northern rockhopper penguin
Northern rockhopper penguins in troublecolony in the world, so this is particularly worrying. Work is ongoing with our project partners to investigate the causes and mechanisms of the penguins’ decline. A new collaboration, hopefully starting in 2016, between the RSPB, the British Antarctic Survey, Royal Zoological Society of Scotland, Tristan Conservation Department and South African Department of Environmental Affairs, should shed further light on this issue.

49The state of the UK’s birds 2015
A B
ond
80% of the world’s northern rockhopper penguins live on the Tristan da Cunha islands

50 The state of the UK’s birds 2015
Current and planned surveysThe information summarised in The state of the UK’s birds 2015 is drawn from the annual and periodic monitoring programmes described below, as well as from the work of individual ornithologists. Anyone interested or wishing to take part in these surveys should contact the relevant organisation at the addresses given on page 54.
The more data we gather, the greater the potential for effective conservation strategies
And
y H
ay (r
spb-
imag
es.c
om)

51The state of the UK’s birds 2015
The Breeding Bird Survey (BBS) is run by the British Trust for Ornithology (BTO) and is funded jointly by the BTO, the Joint Nature Conservation Committee (JNCC) (on behalf of the statutory nature conservation bodies: Council for Nature Conservation and the Countryside [CNCC], Natural England [NE], Natural Resources Wales [NRW] and Scottish Natural Heritage [SNH]) and the Royal Society for the Protection of Birds (RSPB). Contact BTO.
The Wetland Bird Survey (WeBS) is a partnership between the BTO, the RSPB and the JNCC (the latter on behalf of the statutory nature conservation bodies: NE, NRW, SNH and the Department of the Environment Northern Ireland [DOENI]) in association with the Wildfowl & Wetlands Trust (WWT). Contact BTO.
The Non-Estuarine Waterbird Survey (NEWS) will take place in winter 2015/16. This is the periodic monitoring scheme for rocky shores and other non-estuarine coastal habitats not monitored annually by WeBS. It is organised and run by the BTO and endorsed by WeBS partners – the BTO, RSPB and JNCC, in association with the WWT. It is funded by the BTO, JNCC, NE, NRW, SNH and Northern Ireland Environment Agency (NIEA). Contact BTO.
The Goose & Swan Monitoring Programme (GSMP) comprises a suite of surveys, funded under the WWT/JNCC/SNH partnership, designed to accurately assess the abundance and breeding success of the UK’s native geese and migratory swans during the non-breeding season. Contact WWT.
The Waterways Breeding Bird Survey (WBBS) has been running since 1998. This scheme and its predecessor, the Waterways Bird Survey (WBS), which ran from 1974 to 2007, aim to monitor riverside breeding birds, particularly waterway specialists, across the UK. Contact BTO.
The Heronries Census collects counts of apparently occupied nests each year from as many heronries as possible throughout the UK. It also aims to monitor populations of colonial waterbirds, especially grey herons, little egrets and cormorants. Contact BTO.
The Seabird Monitoring Programme gathers information on breeding numbers, breeding success and other parameters to help us understand drivers of change and to target conservation action. Co-ordinated by the JNCC, it is a partnership between the statutory nature conservation agencies, research and conservation organisations. Contact JNCC.
The Big Garden Birdwatch is the largest wildlife survey in the world. Its simple design (one hour watching birds in the garden each January) attracts the participation of around half a million people every year. The data provide an excellent mid-winter snapshot of garden bird numbers across the UK. Contact the RSPB.
Garden BirdWatch is a year-round scheme recording the weekly occurrence and numbers of birds in participants’ gardens. The data collected provide valuable information on annual and seasonal changes in bird use of rural and urban habitats. These can be related to population trends in the wider countryside. Contact BTO.
BirdTrack is a year-round bird recording system run by the BTO, the RSPB, BirdWatch Ireland, the Scottish Ornithologists’ Club and the Welsh Ornithological Society. The collection of species list data from a large number of observers will enable the fulfilment of a range of national research and monitoring objectives. Contact BTO.
The Ringing Scheme is run by the BTO and covers Britain and Ireland. It is funded by a partnership of the BTO, the JNCC (on behalf of DOENI, NE, NRW and SNH), the National Parks and Wildlife Service (Ireland) and the ringers themselves. Volunteer bird ringers collect data on the survival, productivity, movements and condition of birds. Project ringing, such as the Constant Effort Sites Scheme, the Ringing Adults for Survival project, and other targeted ringing, forms an important part of the Scheme. Contact BTO.
The BTO Nest Record Scheme (NRS) gathers vital information on the breeding success of Britain’s birds by asking volunteer nest recorders to find and follow the progress of individual birds’ nests. The scheme is funded by a partnership of the BTO and the JNCC (on behalf of DOENI, NE, NRW and SNH). Contact BTO.
An advance programme of UK-wide surveys of other priority breeding species has been established under the Statutory Conservation Agencies and RSPB Breeding Birds Scheme (SCARABBS) Programme. Golden eagles were surveyed in 2015; capercaillie will be surveyed in the winter of 2015/16, and hen harriers will be surveyed in spring 2016. Contact the RSPB.
What you can do to help

52 The state of the UK’s birds 2015
Anglian Water, BirdLife International, BirdWatch Ireland, British Birds, British Trust for Ornithology, British Waterways, Centre for Ecology & Hydrology, CJ WildBird Foods, Cornwall Chough Project, Cross & Stratford Chough Colour-ring Project, Department of the Environment Northern Ireland, Department for Environment, Food and Rural Affairs (Defra), Environment Agency, Environment Wales, European Bird Census Council, European Social Fund, European Union Life Programme, Falklands Conservation, Forestry Commission, Forest Enterprise, Game & Wildlife Conservation Trust, Greenland White-fronted Goose Study, Hawk and Owl Trust, Irish Brent Goose Research Group, Irish Whooper Swan Study Group, Joint Nature Conservation Committee, Manx BirdLife, Manx Chough Study Group, Ministry of Defence, Montserrat Environment Programme, National Trust, National Trust for Scotland, Natural England,
AcknowledgementsMonitoring of birds in the UK and the Overseas Territories, such as that covered in this report, involves a broad partnership of government agencies, NGOs, sponsors and independent ornithologists, including:
In particular, we thank the thousands of volunteers who have contributed time and expertise to developing, running and managing the monitoring programmes and surveys included in this report. We also thank the landowners and their agents, tenants and employees who have allowed surveyors to visit their land to count birds.
Natural Resources Wales, Northern England Raptor Forum, Northern Ireland Environment Agency, Northern Ireland Raptor Study Group, Northumbrian Water, Pembrokeshire Chough Survey Group, Pembrokeshire Coast National Park Authority, Raptor Study Groups, Rare Breeding Birds Panel, Royal Society for the Protection of Birds, Scottish Executive Rural Affairs Department, Scottish Natural Heritage, Scottish Ornithologists’ Club, St Helena National Trust, Scottish Chough Study Group, Scottish Raptor Study Groups, Seabird Group, Severn Trent Water, Shetland Oil Terminal Environmental Advisory Group, Thames Water, Tristan da Cunha Conservation Department, University of Cambridge, University of Exeter Centre for Ecology and Conservation, University of Oxford, Wales Raptor Study Group, Welsh Kite Trust, Welsh Ornithological Society, the Wildfowl & Wetlands Trust, the Wildlife Trusts, and the Woodland Trust.

53The state of the UK’s birds 2015
By joining forces, we can work more effectively for nature
Gre
y he
rons
by
And
rew
Par
kins
on (r
spb-
imag
es.c
om)

54 The state of the UK’s birds 2015
The British Trust for Ornithology (BTO) UK HeadquartersThe Nunnery, Thetford, Norfolk IP24 2PU. Tel: 01842 750050
BTO Scotland School of Biological and Environmental Sciences, Cottrell Building, University of Stirling, Stirling FK9 4LA. Tel: 01786 466560
BTO Wales Thoday Building, Deiniol Road, Bangor, Gwynedd LL57 2UW. Tel: 01248 383285bto.org @_BTO Registered charity no 216652 in England & Wales; SC039193 in Scotland.
The Royal Society for the Protection of Birds (RSPB)
UK HeadquartersThe Lodge, Sandy, Bedfordshire SG19 2DL. Tel: 01767 680551 Fax: 01767 692365
Northern Ireland HeadquartersBelvoir Park Forest, Belfast BT8 7QT. Tel: 028 9049 1547 Fax: 028 9049 1669
Scotland Headquarters2 Lochside View, Edinburgh Park, Edinburgh EH12 9DH. Tel: 0131 317 4100 Fax: 0131 311 6569
Wales Headquarters2nd Floor, Sutherland House, Castlebridge, Cowbridge Road East, Cardiff CF11 9AB. Tel: 029 2035 3000 Fax: 029 2035 3017rspb.org.uk @RSPBScience @Natures_Voice Registered charity in England & Wales 207076, in Scotland SC037654
Who we areThe state of the UK’s birds 2015 is also available online on the websites of the RSPB, BTO and WWT (see addresses below).
Designed and published by the RSPB on behalf of:
Joint Nature Conservation Committee (JNCC)Monkstone House, City Road, Peterborough PE1 1JY. Tel: 01733 562626 Fax: 01733 555948jncc.defra.gov.uk @JNCC_UK
Natural England (NE)4th Floor, Foss House, Kings Pool, 1-2 Peasholme Green, York YO1 7PX Tel: 0300 060 1911naturalengland.org.uk @NaturalEngland
Natural Resources Wales (NRW)T≈ Cambria, 29 Newport Road, Cardiff CF24 0TP. Tel: 0300 065 3000 Fax: 0300 065 3001naturalresourceswales.gov.uk @NatResWales
Northern Ireland Environment Agency (NIEA) Klondyke Building, Cromac Avenue, Gasworks Business Park, Lower Ormeau Road, Belfast BT7 2JA. Tel: 0845 302 0008 Fax: 028 90546660doeni.gov.uk/niea @nieaevents
Scottish Natural Heritage (SNH)Great Glen House, Leachkin Road, Inverness IV3 8NW. Tel: 01463 725000snh.org.uk @SNH_Tweets
The Wildfowl & Wetlands Trust (WWT)Slimbridge, Gloucestershire GL2 7BT. Tel: 01453 891900 Fax: 01453 890827monitoring.wwt.org.uk @WWTconservation Registered charity no. 1030884 in England and Wales, SC039410 in Scotland

55The state of the UK’s birds 2015
Thank you to all our partner organisations and volunteers
Lesser spotted woodpecker by D
anny Green (rspb-im
ages.com)

Working together to give nature a homePantones
Full Colour CMYK
CMYK
White out
White out with Black BG
Front cover image: lapwing by Ray Kennedy (rspb-images.com)
Produced by the RSPB, a registered charity in England & Wales 207076, in Scotland SC037654 210-0423-15-16