the state of working america, 2002-03 the labor market recession, which began in october 2000...
TRANSCRIPT


The State of Working America, 2002-03• The labor market recession, which began in October 2000
remains with us.
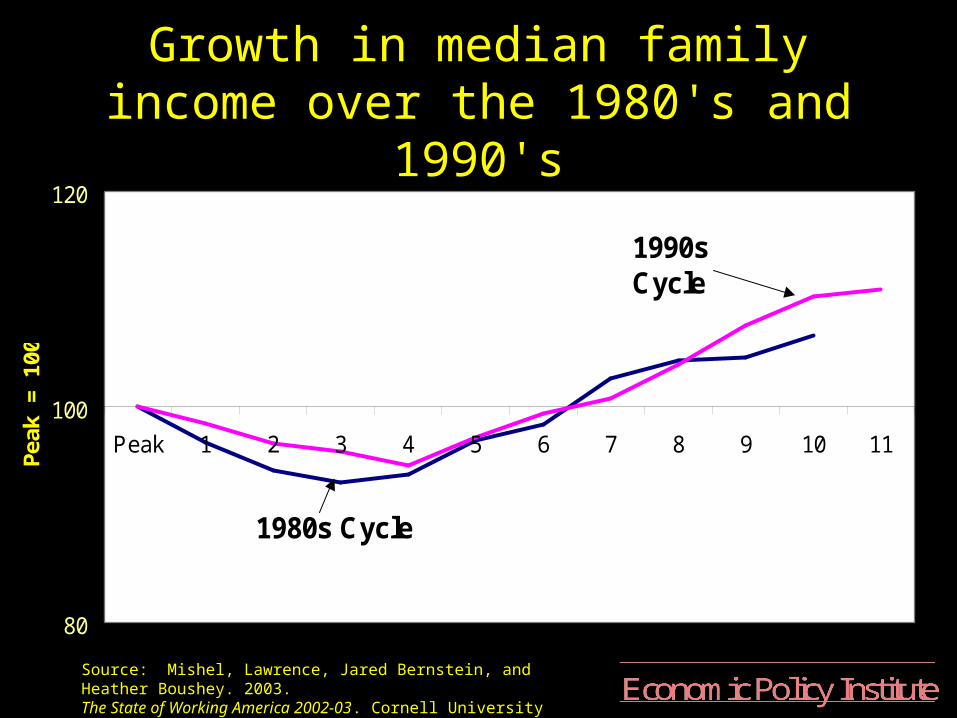
• This recession marks the end of the long economic boom of the 1990s, which brought the first, broad-based increase in wages and incomes in decades.
• Low-wage workers especially benefited, as poverty rates dipped to historic lows.
• The 1990s also brought, however, substantial increases in household debt.
• The long-term trend towards increased hours of work continues and having a “working mom” remains a salient fact of American family life.

The 5.7% unemployment rate obscures the recession’s true depth
• Employment losses are steeper during this recession than in the early 1990s recession.– Higher unemployment has been more broadly
shared by education and by gender.– Long-term unemployment has increased,
especially for women workers.
• Slower wage growth is already occurring, especially among low-wage workers.– Expect to see increased inequality as a result.

Source: Mishel, Lawrence, Jared Bernstein, and Heather Boushey. 2003. The State of Working America 2002-03. Cornell University Press.
The unemployment rate and its trend, 1947-2000
0.0%
2.0%
4.0%
6.0%
8.0%
10.0%
12.0%
1948
1951
1954
1957
1960
1963
1966
1969
1972
1975
1978
1981
1984
1987
1990
1993
1996
1999
Average, 1947-67: 4.7%
Average, 1967-95: 6.4%
Average, 1995-00: 4.8%
Trend
Unemployment rate

Source: Mishel, Lawrence, Jared Bernstein, and Heather Boushey. 2003. The State of Working America 2002-03. Cornell University Press.
Monthly payroll employment growth from unemployment’s low-point
over the past three recessions
96.0
97.0
98.0
99.0
100.0
101.0
102.0
103.0
1 2 3 4 5 6 7 8 9 10 11 12 13 14 15 16 17 18 19 20 21 22 23 24
Mo
nth
1=
100
May 79
June 90
October 00

Source: Mishel, Lawrence, Jared Bernstein, and Heather Boushey. 2003. The State of Working America 2002-03. Cornell University Press.
Percentage point change in unemployment during recession
6.0
3.2
2.0
4.6
1.9 2.1
3.3
1.92.3
1.51.0
1.4
0.0
1.0
2.0
3.0
4.0
5.0
6.0
7.0
Early 1980s recession Early 1990s recession Early 2000s recession
less than a high school high school graduates some college college graduates
(1st quarter of 1980 to the 1st quarter of 1983)
(2nd quarter of 1990 to the 1st quarter of 1993)
(3rd quarter of 2000 to the 2nd quarter of 2002)

Source: Mishel, Lawrence, Jared Bernstein, and Heather Boushey. 2003. The State of Working America 2002-03. Cornell University Press.
Percentage point change in unemployment during recession for men.
5.8
2.82.0
11.7
4.8
3.3
8.9
5.9
2.0
0.0
2.0
4.0
6.0
8.0
10.0
12.0
14.0
Early 1980s recession (May 1979-Dec 1982)
Early 1990s recession (June 1990-June 1992)
Early 2000s recession(Oct 2000-June 2002)
White
African American
Hispanic

Source: Mishel, Lawrence, Jared Bernstein, and Heather Boushey. 2003. The State of Working America 2002-03. Cornell University Press.
Percentage point change in unemployment during recession: women.
3.5
1.71.4
5.0
3.53.3
5.3
2.5
3.0
0.0
1.0
2.0
3.0
4.0
5.0
6.0
Early 1980s recession (May 1979-Dec 1982)
Early 1990s recession (June 1990-June 1992)
Early 2000s recession(Oct 2000-June 2002)
White
African American
Hispanic

Source: Mishel, Lawrence, Jared Bernstein, and Heather Boushey. 2003. The State of Working America 2002-03. Cornell University Press.
Nominal growth in average hourly earnings, 1995-2002
0.0%
1.0%
2.0%
3.0%
4.0%
5.0%
6.0%

Source: Mishel, Lawrence, Jared Bernstein, and Heather Boushey. 2003. The State of Working America 2002-03. Cornell University Press.
Nominal earnings growth for men,comparing first halves of the year
1.6%
5.1%
2.1%2.0%
5.1%
2.6%
3.4%
5.9%
3.9%
0.0%
1.0%
2.0%
3.0%
4.0%
5.0%
6.0%
7.0%
1995-96 1998-99 2001-02
10th Median 90th

Source: Mishel, Lawrence, Jared Bernstein, and Heather Boushey. 2003. The State of Working America 2002-03. Cornell University Press.
Nominal earnings growth for women,comparing first halves of the year
3.9%
4.5%
2.7%
3.5%
2.9%
5.0%
3.9%3.7%
4.0%
0.0%
1.0%
2.0%
3.0%
4.0%
5.0%
6.0%
1995-96 1998-99 2001-02
10th Median 90th

Full Employment: Love it when you've got it, miss it when it's gone…
• What is it? Close to full utilization of economic resources, including the un- and underemployed. Corresponds to unemployment rate in the neighborhood of 4%.
• Full employment led to sharp reversals in real wage and income growth; these gains were broad-based.
• Full employment is not, however, a cure-all (especially as it was short-lived). Racial, gender, and poverty gaps still exist.
• Inequality's growth slowed-an important source of poverty reduction-but it did not stop, as top continued to pull away.
Source: Mishel, Lawrence, Jared Bernstein, and Heather Boushey. 2003. The State of Working America 2002-03. Cornell University Press.
Growth in median family income over the 1980's and 1990's
80
100
120
Peak 1 2 3 4 5 6 7 8 9 10 11
Pea
k =
100
1980s Cycle
1990s Cycle

Source: Mishel, Lawrence, Jared Bernstein, and Heather Boushey. 2003. The State of Working America 2002-03. Cornell University Press.
Ratio to white median family income by race/ethnicity,1947-00.
40.0%
45.0%
50.0%
55.0%
60.0%
65.0%
70.0%
75.0%
1947 1951 1955 1959 1963 1967 1971 1975 1979 1983 1987 1991 1995 1999
Hispanic
African-American

Source: Mishel, Lawrence, Jared Bernstein, and Heather Boushey. 2003. The State of Working America 2002-03. Cornell University Press.
Low (20th percentile), middle (50th), and high-income (95th) growth
40
60
80
100
120
140
160
1947
1950
1953
1956
1959
1962
1965
1968
1971
1974
1977
1980
1983
1986
1989
1992
1995
1998
1979
=10
0
`
95th percentile
20th percentile
Median

Source: Mishel, Lawrence, Jared Bernstein, and Heather Boushey. 2003. The State of Working America 2002-03. Cornell University Press.
Ratio of average family income of the richest 5% of families to the poorest 20%
12.0 11.3 11.4
15.7
19.1
14.0
0.0
5.0
10.0
15.0
20.0
25.0
1947 1967 1973 1979 1989 2000
Source: Mishel, Lawrence, Jared Bernstein, and Heather Boushey. 2003. The State of Working America 2002-03. Cornell University Press.
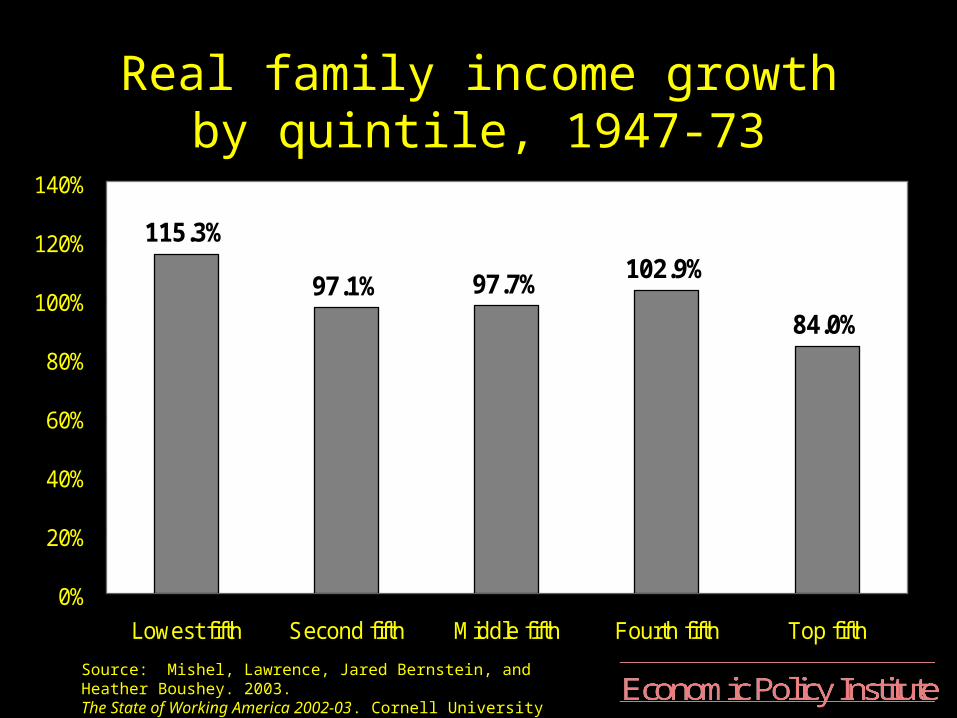
Real family income growth by quintile, 1947-73
115.3%
97.1% 97.7%102.9%
84.0%
0%
20%
40%
60%
80%
100%
120%
140%
Lowest fifth Second fifth Middle fifth Fourth fifth Top fifth

Source: Mishel, Lawrence, Jared Bernstein, and Heather Boushey. 2003. The State of Working America 2002-03. Cornell University Press.
Real family income growth by quintile, 1973-00
10.3%15.5%
24.1%
33.6%
61.6%
0%
10%
20%
30%
40%
50%
60%
70%
Lowest fifth Second fifth Middle fifth Fourth fifth Top fifth

Source: Mishel, Lawrence, Jared Bernstein, and Heather Boushey. 2003. The State of Working America 2002-03. Cornell University Press.
Changes in unemployment and income during recent recessions and recoveries
-12.0%
-8.0%
-4.0%
0.0%
4.0%
8.0%
12.0%
16.0%
20.0%
24.0%
1979-1982Recession
1982-1989Recovery
1989-1992Recession
1992-2000Recovery P
erce
nta
ge
po
int
(un
emp
loym
ent)
an
d p
erce
nt
(in
com
e) c
han
ges
Change in Unemployment Rate20th PercentileMedian Income95th Percentile

Source: Mishel, Lawrence, Jared Bernstein, and Heather Boushey. 2003. The State of Working America 2002-03. Cornell University Press.
Poverty rate, 1959-2000
8.0%
10.0%
12.0%
14.0%
16.0%
18.0%
20.0%
22.0%
24.0%
1959 1963 1967 1971 1975 1979 1983 1987 1991 1995 1999
Per
cent
in p
over
ty
1973: 11.1%
2000:11.3%
Source: Mishel, Lawrence, Jared Bernstein, and Heather Boushey. 2003. The State of Working America 2002-03. Cornell University Press.
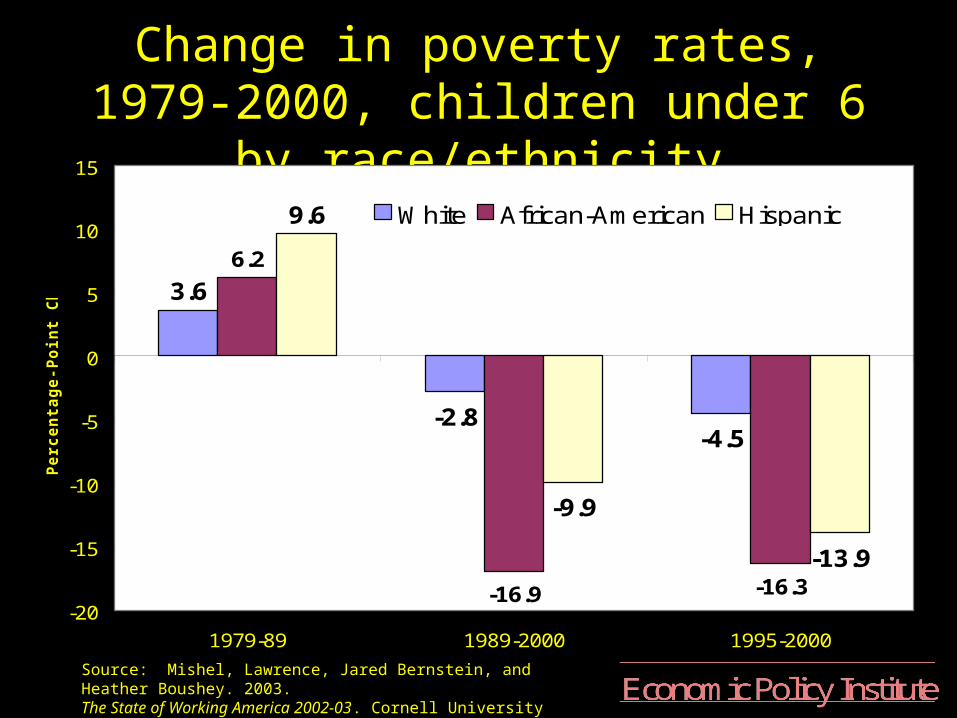
Change in poverty rates, 1979-2000, children under 6 by race/ethnicity
3.6
-2.8-4.5
6.2
-16.9 -16.3
9.6
-9.9
-13.9
-20
-15
-10
-5
0
5
10
15
1979-89 1989-2000 1995-2000
Perc
en
tag
e-P
oin
t C
ha
ng
e
White African-American Hispanic

Source: Mishel, Lawrence, Jared Bernstein, and Heather Boushey. 2003. The State of Working America 2002-03. Cornell University Press.
Employment rates for mothers, 1985-2000
30.0%
35.0%
40.0%
45.0%
50.0%
55.0%
60.0%
65.0%
70.0%
75.0%
80.0%
1985
1986
1987
1988
1989
1990
1991
1992
1993
1994
1995
1996
1997
1998
1999
2000
Per
cen
t em
plo
yed
Married mothers
Single mothersNever married

Source: Mishel, Lawrence, Jared Bernstein, and Heather Boushey. 2003. The State of Working America 2002-03. Cornell University Press.
Share of poor families with no work, by race/ethnicity, 1979-2000
39.1%36.9% 37.2%
46.1%48.1%
37.1%
41.9%
36.2%
24.3%
0.0%
10.0%
20.0%
30.0%
40.0%
50.0%
60.0%
1979 1989 2000
White African-American Hispanic

Source: Mishel, Lawrence, Jared Bernstein, and Heather Boushey. 2003. The State of Working America 2002-03. Cornell University Press.
Income components, low income single mothers, 1979-2000
0.0%
10.0%
20.0%
30.0%
40.0%
50.0%
60.0%
70.0%
80.0%
1979
1981
1983
1985
1987
1989
1991
1993
1995
1997
1999
Sh
are
of
inc
om
e
Earnings Share
Public Assistance Share

Source: Mishel, Lawrence, Jared Bernstein, and Heather Boushey. 2003. The State of Working America 2002-03. Cornell University Press.
Income of low-income single mother families, gross and net of work expenses,
1979-2000
$0
$2,000
$4,000
$6,000
$8,000
$10,000
$12,000
$14,000
$16,000
$18,000
Gross Net Gross Net Gross Net Gross Net
(200
0 d
olla
rs)
Earnings OtherPub Asst Food StampsEITC
1979 1989 1995 2000

Source: Mishel, Lawrence, Jared Bernstein, and Heather Boushey. 2003. The State of Working America 2002-03. Cornell University Press.
Real hourly wages of low-wage workers (20th percentile)
6.00
6.50
7.00
7.50
8.00
8.50
9.00
9.50
10.00
1973 1976 1979 1982 1985 1988 1991 1994 1997 2000
2001
dol
lars
Male
Female
Poverty-level wage

A little wealthier, much more indebted
• Over the 1990s, even as the stock market boomed, most Americans held little or no stocks.– By 1998, only 36.3% of households owned more than
$5,000 in stock either directly or indirectly, through a 401k or mutual fund.
– The bottom 40% saw their stock market holdings rise by only 1.1%.
• For many families, it was the run-up in debt that was most dramatic over the 1990s,

Source: Mishel, Lawrence, Jared Bernstein, and Heather Boushey. 2003. The State of Working America 2002-03. Cornell University Press.
Change in assets and liabilities of middle-wealth households, 1989-98
$2,200
$5,500
$8,500
$11,800
$-
$2,000
$4,000
$6,000
$8,000
$10,000
$12,000
$14,000
Net worth Stocks All other assets Total debt
Source: Mishel, Lawrence, Jared Bernstein, and Heather Boushey. 2003. The State of Working America 2002-03. Cornell University Press.
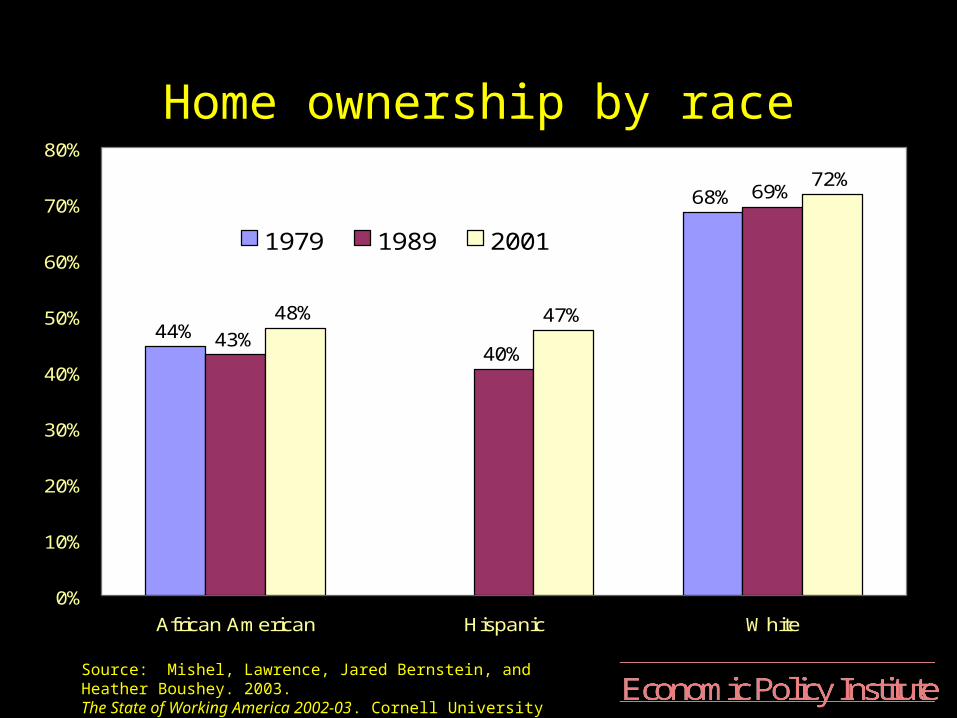
Home ownership by race
44%
68%
43%40%
69%
48% 47%
72%
0%
10%
20%
30%
40%
50%
60%
70%
80%
African American Hispanic White
1979 1989 2001

Source: Mishel, Lawrence, Jared Bernstein, and Heather Boushey. 2003. The State of Working America 2002-03. Cornell University Press.
Debt as a percent of personal disposable income, 1947-2001
0%
20%
40%
60%
80%
100%
120%
19
47
19
51
19
55
19
59
19
63
19
67
19
71
19
75
19
79
19
83
19
87
19
91
19
95
19
99
All debt
Home equity
Mortgage debt
Consumer debt

Source: Mishel, Lawrence, Jared Bernstein, and Heather Boushey. 2003. The State of Working America 2002-03. Cornell University Press.
Consumer bankruptcies per 1,000 adults
0.0
1.0
2.0
3.0
4.0
5.0
6.0
7.0
8.0
1980
1981
1982
1983
1984
1985
1986
1987
1988
1989
1990
1991
1992
1993
1994
1995
1996
1997
1998
1999
2000
2001
Per
1,0
00 a
du
lts

Americans are working longer
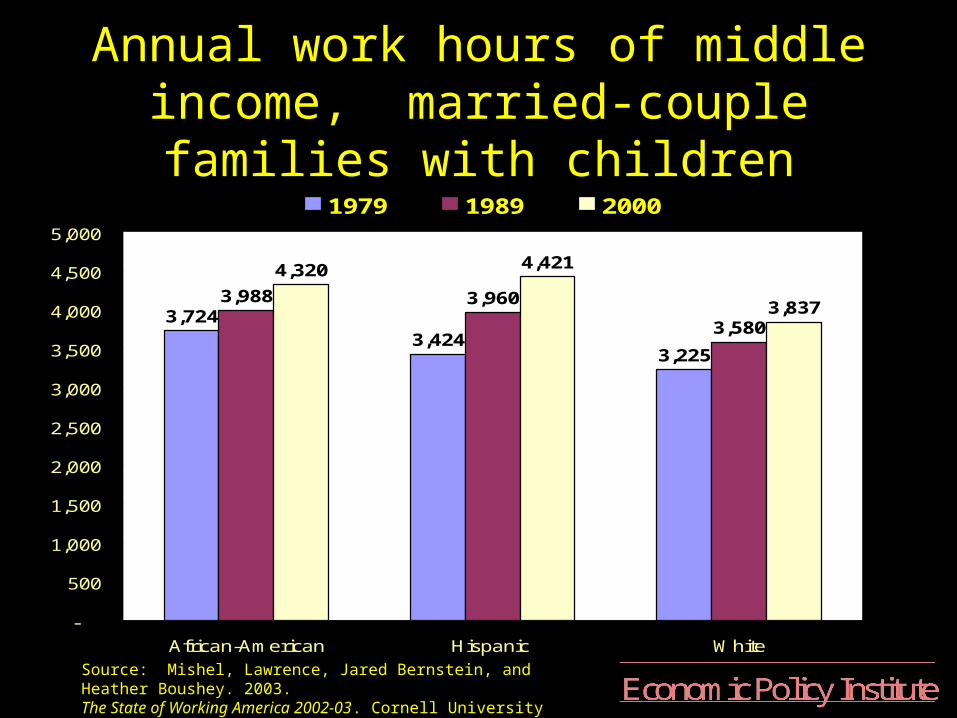
• Over the 1990s, we saw a continuation of the trend toward longer hours of work.
• This was driven by the increase in women’s labor supply, and in particular, there are more working mothers.– Nearly three-quarters of all moms work.
• The average two-parent family has one worker at full-time and one at a little over 30 hours per week.
Source: Mishel, Lawrence, Jared Bernstein, and Heather Boushey. 2003. The State of Working America 2002-03. Cornell University Press.
Annual work hours of middle income, married-couple families with children
3,7243,424
3,225
3,988 3,960
3,580
4,320 4,421
3,837
-
500
1,000
1,500
2,000
2,500
3,000
3,500
4,000
4,500
5,000
African-American Hispanic White
1979 1989 2000

Source: Mishel, Lawrence, Jared Bernstein, and Heather Boushey. 2003. The State of Working America 2002-03. Cornell University Press.
Average annual hours worked among selected OECD countries, 2000
1,877
1,840
1,480
1,562
1,634
1,708
1,801
1,860
1,721
1,817
1,376
1,812
1,624
1,588
0 500 1000 1500 2000
United States
Japan*
Germany**
France*
Italy*
United Kingdom
Canada
Australia
Finland
New Zealand
Norway
Spain
Sweden
Switzerland*

Source: Mishel, Lawrence, Jared Bernstein, and Heather Boushey. 2003. The State of Working America 2002-03. Cornell University Press.
Change in average annual hours worked, selected OECD countries, 1979-2000
32
-286
-489
-244
-88
-107
-31
-44
-116
-138
-210
108
-600 -500 -400 -300 -200 -100 0 100 200
United States
Japan*
Germany**
France*
Italy*
United Kingdom
Canada
Australia
Finland
New Zealand
Norway
Spain
Sweden
Switzerland*

Source: Mishel, Lawrence, Jared Bernstein, and Heather Boushey. 2003. The State of Working America 2002-03. Cornell University Press.
Percent of workers with access to paid vacation, by industry, 1997
63%
91%
92%
89%
64%
86%
79%
0% 20% 40% 60% 80% 100%
Construction
Manufacturing
Transportation andpublic utilities
Wholesale trade
Retail trade
Finance, insurance,and real estate
Services

Source: Mishel, Lawrence, Jared Bernstein, and Heather Boushey. 2003. The State of Working America 2002-03. Cornell University Press.
Percent of workers with access to paid holidays, by industry, 1997
68%
90%
86%
91%
50%
91%
77%
0% 20% 40% 60% 80% 100%
Construction
Manufacturing
Transportation andpublic utilities
Wholesale trade
Retail trade
Finance, insurance,and real estate
Services

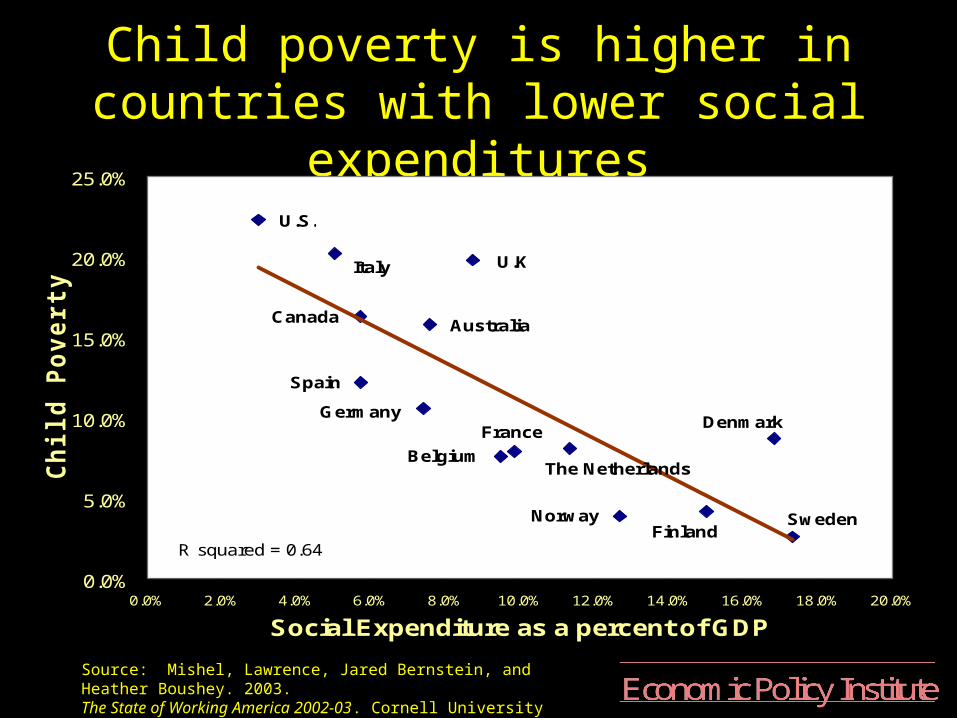
Americans are more likely to be poor
• The United States has more children in poverty than in any other OECD nation.
• The exit rate from poverty is much lower in the United States than in other OECD nations.
• In the United States, entry into poverty is nearly twice as likely as other OECD nations to be associated with a new child in the family.

Source: Mishel, Lawrence, Jared Bernstein, and Heather Boushey. 2003. The State of Working America 2002-03. Cornell University Press.
Percent of population remaining poor for at least three years, mid 1990s
9.5%
4.3%
3.0%
5.6%
2.4%
5.1%
2.8%
0.8%
6.5%
1.3%
1.6%
7.8%
3.7%
0.0% 2.0% 4.0% 6.0% 8.0% 10.0%
U.S.
Germany
France
Italy
U.K.
Canada
Belgium
Denmark
Finland
Ireland
Netherlands
Portugal
Spain
Source: Mishel, Lawrence, Jared Bernstein, and Heather Boushey. 2003. The State of Working America 2002-03. Cornell University Press.
Child poverty is higher in countries with lower social expenditures
0.0%
5.0%
10.0%
15.0%
20.0%
25.0%
0.0% 2.0% 4.0% 6.0% 8.0% 10.0% 12.0% 14.0% 16.0% 18.0% 20.0%
Social Expenditure as a percent of GDP
Ch
ild
Po
ve
rty
Ra
te Italy
Canada
Spain
U.K
Australia
Belgium
France
The Netherlands
NorwayFinland
Denmark
Sweden
R squared = 0.64
Germany
U.S.

Source: Mishel, Lawrence, Jared Bernstein, and Heather Boushey. 2003. The State of Working America 2002-03. Cornell University Press.
Percent of wages replaced during maternity leave (weeks of paid leave)
0% 20% 40% 60% 80% 100%
United States (0)
Japan (14)
Germany (14)
France (16)
Italy (21.5)
United Kingdom (18)
Canada (15)
Australia (0)
Austria (16)
Belgium (15)
Denmark (30)
Finland (52)
Ireland (14)
Netherlands (16)
New Zealand (0)
Norway (42)
Portugal (24.3)
Spain (16)
Sweden (64)