the statistically meaningful display of analog data robert a. warner, md laboratory of logic and...
Post on 20-Dec-2015
216 views
TRANSCRIPT

The Statistically Meaningful
Display of Analog Data
Robert A. Warner, MD
Laboratory of Logic and Experimental Philosophy
Simon Fraser University
Vancouver, BC, Canada

Interpreting Analog Displays
• Do any parts of the display differ from a reference standard?
• Are the differences genuine or merely variants of normal?

An Individual Value vs. A Reference Population
PopulationMean
A
Individ.Value
A
Individ.Value
B
PopulationMean
B
Measurement Units
1.0SD
1.0SD
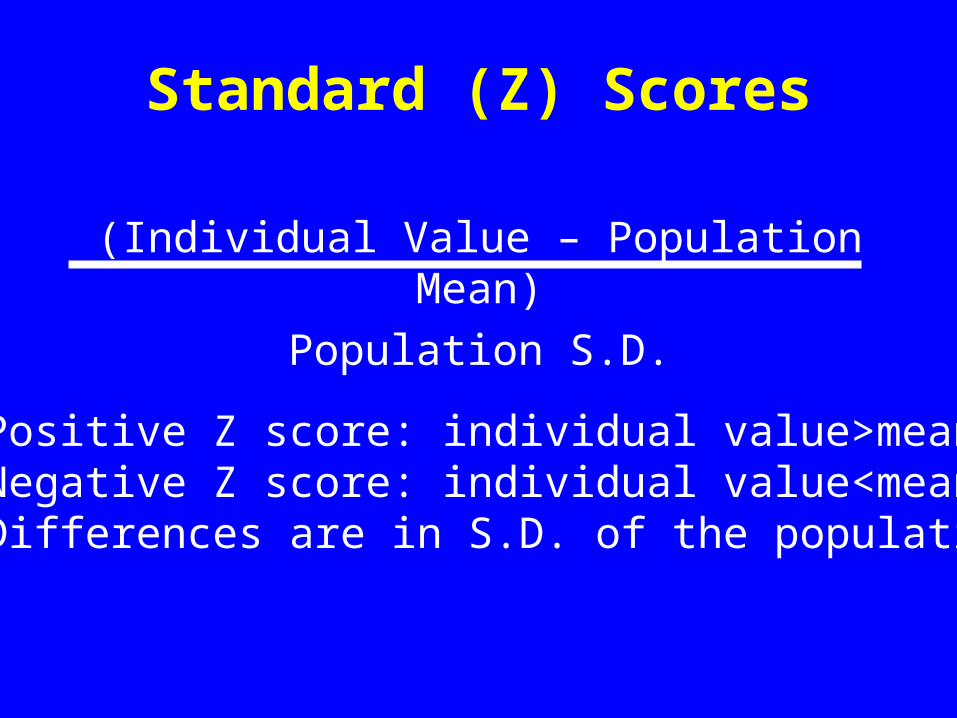
Standard (Z) Scores
(Individual Value – Population Mean)
Population S.D.
• Positive Z score: individual value>mean• Negative Z score: individual value<mean• Differences are in S.D. of the population

Advantages of Z Scores
• All parameters are on the same scale (the S.D. of the population)
• No compression at the extremes of a distribution (unlike percentiles)
• Can use demographically specific normal reference populations
• Directly translatable to P values

Z Scores, P Values & Coding
Z Score P Value B&W Code
>3.08 0.001
>2.33 0.01
>1.65 0.05
-1.64 to 1.64 NS
<-1.65 0.05
<2.33 0.01
<3.08 0.001

Colors On the Tracing Refer To Amplitudes Colors Above the Tracing Refer to Durations
Analog ECG Display
COLOR CODES Z Score P Value
3.08 .001 2.33 .01 1.65 .05
-1.64 to 1.64 NS -1.65 .05 -2.33 .01 -3.08 .001
PR = 230Msec.
Q = 34Msec.
S = 0Msec.
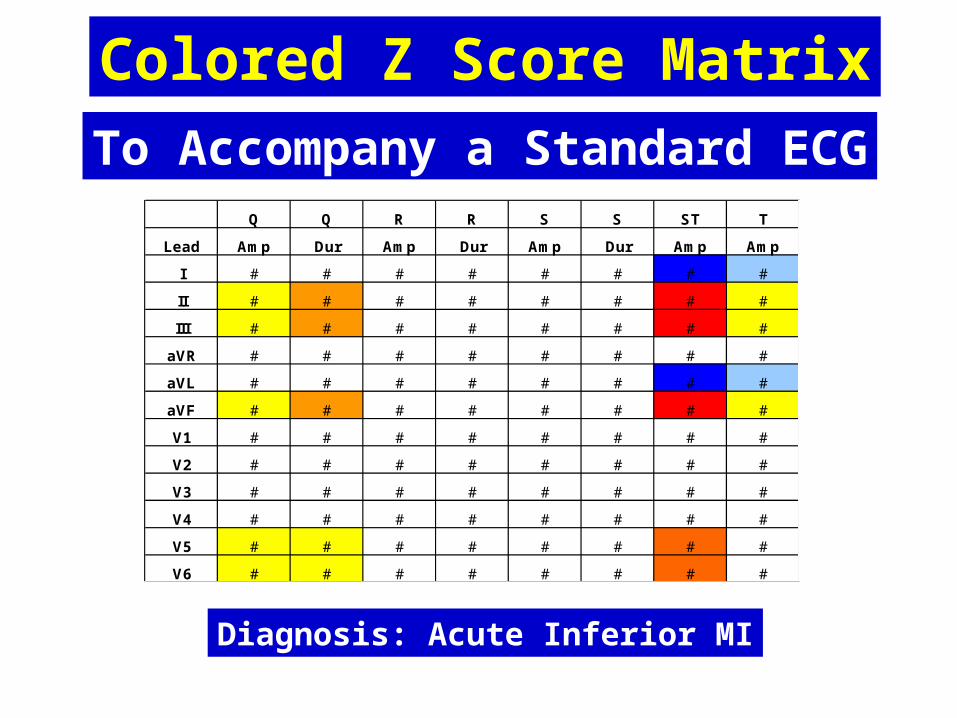
Colored Z Score Matrix
To Accompany a Standard ECG
Diagnosis: Acute Inferior MI
Q Q R R S S ST T
Lead Amp Dur Amp Dur Amp Dur Amp Amp
I # # # # # # # #
II # # # # # # # #
III # # # # # # # #
aVR # # # # # # # #
aVL # # # # # # # #
aVF # # # # # # # #
V1 # # # # # # # #
V2 # # # # # # # #
V3 # # # # # # # #
V4 # # # # # # # #
V5 # # # # # # # #
V6 # # # # # # # #

B&W Z Score MatrixTo Accompany a Standard ECG
Diagnosis: Acute Inferior MI
Q Q R R S S ST T
Lead Amp Dur Amp Dur Amp Dur Amp Amp
I # # # # # #
II # # # #
III # # # #
aVR # # # # # # # #
aVL # # # # # #
aVF # # # #
V1 # # # # # # # #
V2 # # # # # # # #
V3 # # # # # # # #
V4 # # # # # # # #
V5 # # # # #
V6 # # # # #

Validation of the Z Score Method
• Compared abilities of Z scores vs. 2 widely-used commercial ECG algorithms to detect prior inferior and anterior MI
• 1138 patients (mean age 53, 426 females), 497 cath-proven normals, 366 prior inferior MI, 275 prior anterior MI
• Used Z scores of Q waves in aVF and initial R waves in V2
• The commercial algorithms use voltages, not Z scores.
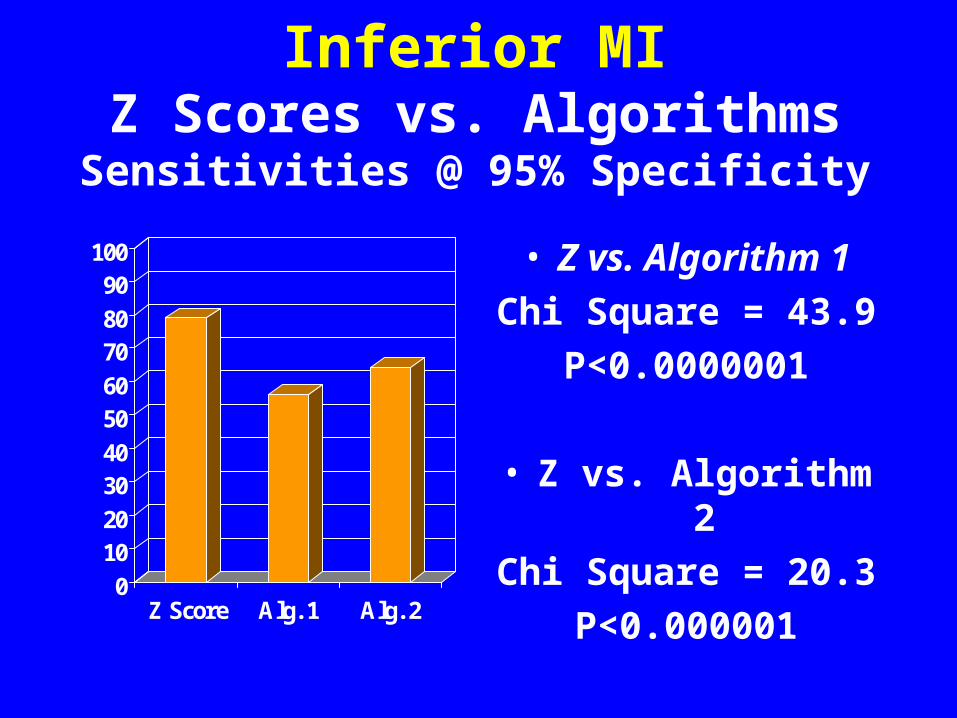
Inferior MIZ Scores vs. AlgorithmsSensitivities @ 95% Specificity
0
1020
3040
5060
7080
90100
Z Score Alg. 1 Alg. 2
• Z vs. Algorithm 1
Chi Square = 43.9
P<0.0000001
• Z vs. Algorithm 2
Chi Square = 20.3
P<0.000001

Anterior MIZ Scores vs. AlgorithmsSensitivities @ 95% Specificity
0
1020
3040
5060
7080
90100
Z Score Alg. 1 Alg. 2
• Z vs. Algorithm 1
Chi Square = 24.1
P<0.000001
• Z vs. Algorithm 2
Chi Square = 9.2
P<0.002

Z Scores in Long Recordings
• Objective and quantifiable comparisons to normal reference and baseline data
• Statistically meaningful results• Cost-Effective
– Rapid interpretation– Doesn’t require highly trained personnel
• Full disclosure of data• Permits multiparameter recordings

Rapid Review of Data
10 11 12 1 2 3 4 5 6 7 8 9AM AM AM PM PM PM PM PM PM PM PM PM
10 11 12 1 2 3 4 5 6 7 8 9PM PM PM AM AM AM AM AM AM AM AM AM
6PM
7:00PM
PM PM6:20 6:25
PM
6:30 6:45
PM6:05 6:10 6:15PM
PM6:35PM
6:40PM PM
6:50PM
6:55PM
Ischemia Monitoring – 24 Hour DisplayMarch 4 to March 5, 2010
Colors = Maximum ST Segment Displacement
Ischemia Monitoring – 1 Hour DisplayMarch, 2010 – 6:00 to 7:00 PM

Multiparameter Monitoring
• Maximizes the types of useful data provided
• Concordant orthogonal parameters increase the accuracy of diagnosis
• Parameters measured in different units are hard to display simultaneously and to interpret

Importance of Similar Scales
0.00
5.00
10.00
15.00
20.00
25.00
1 5 9
13
17
21
25
29
33
37
41
45
49
53
57
61
65
69
73
77
81
85
89
93
97
-2.50
-2.00
-1.50
-1.00
-0.50
0.00
0.50
1.00
1.50
2.00
2.50
1 5 9
13
17
21
25
29
33
37
41
45
49
53
57
61
65
69
73
77
81
85
89
93
97
Raw Data A
Raw Data B
Z Scores AZ Scores B

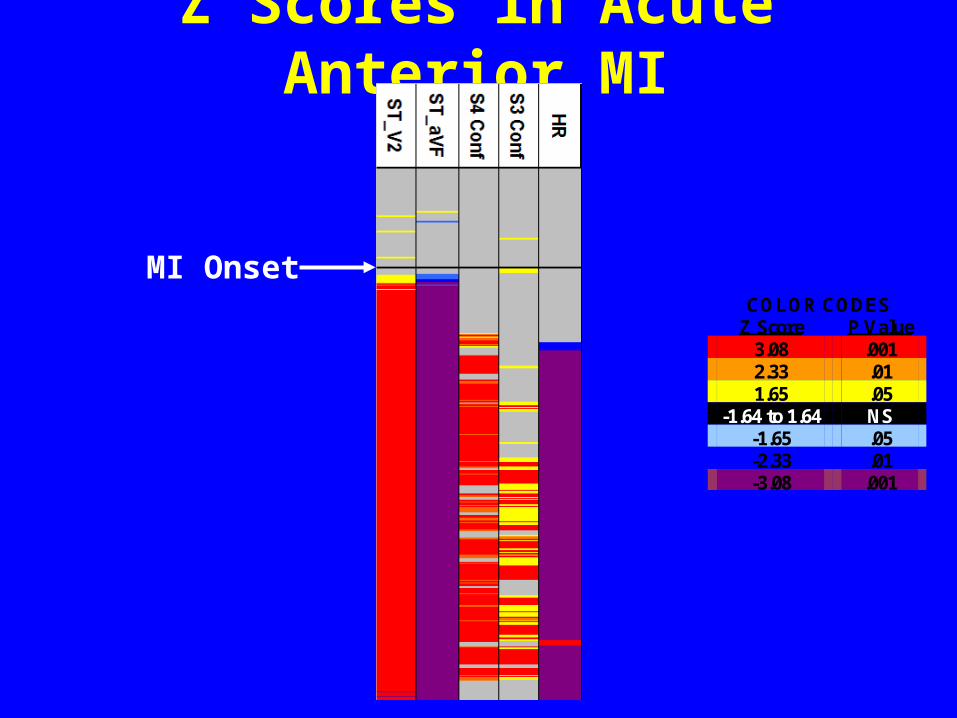
Z Scores in Acute Anterior MI
-30.00
-20.00
-10.00
0.00
10.00
20.00
30.00
Time
Z S
core
ST_V2
ST_aVF
S4 Conf
S3 Conf
HEARTRATE
MI Onset
Z Scores in Acute Anterior MI
COLOR CODES Z Score P Value
3.08 .001 2.33 .01 1.65 .05
-1.64 to 1.64 NS -1.65 .05 -2.33 .01 -3.08 .001
MI Onset

Exploratory AnalysisWhat can Z scores teach us?
Absolute Z scores of 159 known normals vs. 103 known healed anterior MI’s. Which parts of which leads discriminate the best?
Some Uses of Z Scores• Medical practice and research• Physical, biological and behavioral science• Engineering, industrial processes and quality
control• Assessing the performance of mechanical
and electrical equipment • Economics, finance and investing• Teaching the interpretation of analog displays• Biofeedback

Thank you!