the status of food security and vulnerability in …...acknowledgements the status of food security...
TRANSCRIPT

The Status of Food
Security and Vulnerability
in Egypt, 2009
December
2011

ACKNOWLEDGEMENTS
The Status of Food Security and Vulnerability in Egypt for 2009 is Part I of the food security and
vulnerability assessment reports for Egypt. It draws on household data collected for the national
Household Income, Expenditure and Consumption Survey (HIECS) for Egypt during 2009 that was
produced by the Central Agency for Public Mobilization and Statistics (CAPMAS), and presents for
the first time an assessment of the prevalence of food insecurity in Egypt, across all governorates.
The World Food Programme (WFP) and CAPMAS entered into a partnership agreement in 2010,
and included additional questions on food security and nutrition as part of 2011 HIECS. Using data
from HIECS 2011, Part II of the food security and vulnerability reports for Egypt is expected by end
of 2012.
WFP Egypt Country Office would like to express its deep appreciation to our partners in this
study; CAPMAS, for sharing the invaluable data on which the study is based, and for the
collaboration at all stages of the study. WFP would also like to thank the Ministry of Agriculture
for providing the study with supplemental data that enriched the analysis.
This report could not have been implemented without the active support of the Embassy of the
Kingdom of Netherlands in Egypt, the main funding contributor for this study, in addition to the
support from the Global Alliance for Improved Nutrition (GAIN).
Thanks to Dr. Heba El Laithy, Professor of Statistics at Cairo University Faculty of Economics
and Political Science for her lead role in designing the study methodology, analyzing data and
excellent report writing, and thanks to Dr. Dina Armanious, Associate Professor of Statistics at
Cairo University Faculty of Economics and Political Science for her enormous efforts in
statistical analysis and co-writing of the report.
Finally, thanks to WFP Regional Bureau in Cairo for the support provided by the VAM team and
thanks to WFP Egypt Country Office VAM and Nutrition units for playing an important role in
overseeing all technical details and ensuring cooperation amongst the different partners.
GianPietro Bordignon
WFP Representative and Country Director, Egypt


World Food Programme (WFP) i
TABLE OF CONTENTS
ACRONYMS ............................................................................................................................................................. I
EXECUTIVE SUMMARY ...................................................................................................................................... 1
1 INTRODUCTION .............................................................................................................................................. 5
1.1 BACKGROUND: WHAT IS FOOD SECURITY? .............................................................................................. 5 1.2 SOURCES OF DATA .................................................................................................................................... 6 1.3 THE FOOD AND NUTRITION SECURITY CONCEPTUAL FRAMEWORK .......................................................... 6 1.4 EGYPT‘S MACROECONOMIC CONTEXT ..................................................................................................... 7
2 THE MACRO AVAILABILITY OF FOOD IN EGYPT ............................................................................. 11
2.1 FOOD IMPORTS AND DOMESTIC SUPPLIES ................................................................................... ………....11 2.2 SELF-SUFFICIENCY FOR SELECTED FOOD ITEMS...................................................................................... 12
3 ACCESS TO FOOD ......................................................................................................................................... 16
3.1 PREVALENCE OF CALORIC DEPRIVATION ................................................................................................. 18 3.2 DIETARY DIVERSITY WITHIN FOOD GROUPS .......................................................................................... 21 3.3 OVERALL ASSESSMENT OF ACCESS TO FOOD .............................................................................................................. 26
3.4 SOURCES OF ENERGY AND AVAILABILITY OF DIETARY NUTRIENTS ......................................................... 29 3.4.1 Sources of Energy ........................................................................................................................ 29 3.4.2 Indications of Deficiency in Key Nutrient Elements .................................................................... 31
4 MALNUTRITION AMONG CHILDREN AND YOUTH ............................................................................ 35
4.1 THE NUTRITIONAL STATUS OF CHILDREN UNDER 5 YEARS OF AGE ....................................................... 35 4.1.1 Measuring Children’s Nutritional Status .................................................................................... 36 4.1.2 The Malnutrition Index for Children (Under 5 years of age) in 2008 ......................................... 38
4.2 THE NUTRITIONAL STATUS OF YOUTH (10 TO 19 YEARS OF AGE) .......................................................... 41 4.2.1 Development of the Malnutrition Index for Youth ....................................................................... 44
5 VULNERABILITY AND ITS CORRELATES ............................................................................................. 48
5.1 THE STATE OF POVERTY ......................................................................................................................... 48 5.1.1 Income Poverty ............................................................................................................................ 49 5.1.2 Consumption Patterns and Consumer Prices for the Poorest Quintiles ..................................... 52 5.1.3 Multi-Dimensional Poverty ......................................................................................................... 54 5.1.4 Multidimensional Poverty in Egypt ............................................................................................. 55
5.2 VULNERABILITY AND VULNERABILITY PROFILES ................................................................................... 57 5.2.1 Risks of Caloric Deprivation ....................................................................................................... 57 5.2.2 Constructing the Vulnerability Index .......................................................................................... 62
6 CONCLUSIONS & MAIN RECOMMENDATIONS ................................................................................... 68
REFERENCES ....................................................................................................................................................... 71
ANNEXES .............................................................................................................................................................. 72
ANNEX 1: CALCULATION OF FOOD POVERTY LINE AND TOTAL POVERTY LINE .......................................... 72 ANNEX 2: MULTIDIMENSIONAL POVERTY .................................................................................................. 72 ANNEX 3: MAPS OF DEFICIENCY IN NUTRIENT ELEMENTS AVAILABLE FOR HOUSEHOLD INTAKE ............. 74

ii World Food Programme (WFP)
TABLE OF TABLES
Table 2.1: Imports versus Domestic supplies ........................................................................................................................ 12
Table 2.2: Self Sufficiency Ratio for Selected Crops ............................................................................................................ 13
Table 2.3: Per Capita Production in Kg. ................................................................................................................................ 14
Table 3.1: Caloric Deprivation by Governorate, 2009 .......................................................................................................... 19
Table 3.2: Caloric Requirements by Age, Sex and Location ................................................................................................. 20
Table 3.3: Food Groups and Weights Used to Construct an Index for ―Dietary Diversity Within Food Groups‖ ................ 22
Table 3.4: Dietary Diversity by Governorate (Percent of Population), 2009 ........................................................................ 23
Table 3.5: Food Access Indicators by Household Characteristics, 2009 ............................................................................... 25
Table 3.6: Cross Tabulation of Income Poverty and Food Consumption .............................................................................. 28
Table 3.7.a: Share of Food Groups to Total Energy Intake in Urban Areas, 2009 .......................................................................... 29
Table 3.7.b: Share of Food Groups to Total Energy Intake in Rural Areas, 2009 ................................................................. 30
Table 3.8: Percent of Population Suffering Nutrient Deficiency, 2009 ................................................................................. 31
Table 3.9: Nutrient Deficiency Rate by HH Characteristics, 2009 ........................................................................................ 32
Table 3.10: Nutrient Deficiency Rate by Different Deprivation Indicators........................................................................... 33
Table 4.1: Percentage of Children (Under 5 years of age) Suffering from Severe Stunting, Wasting or Underweight in
2008 .............................................................................................................................................................................. 38
Table 4.3 Governorates Ranked by their Malnutrition Index for Children (Under 5 Years), 2008 ....................................... 40
Table 4.2: Malnutrition Index for Children Under 5 Years, by Region, 2008 ....................................................................... 40
Table 4.4: Percent of Underweight, at Risk of Overweight and Obese Youth by Governorate, 2008 .................................. 43
Table 4.5: Percent of Malnourished Youth (Underweight, at Risk of Overweight or Obesity), by Governorate, 2008 ........ 45
Table 5.1: Estimated Average Per Capita Food and Total Poverty Line (LE per year), and Corresponding Poverty Measures
by Region, 2009 ............................................................................................................................................................ 51
Table 5.2: Poverty Rate by Governorate; 2009 ..................................................................................................................... 52
Table 5.3: Consumption Patterns by Decile, 2009 ................................................................................................................ 53
Table 5.4: Percent of Multidimensional Poor by Governorate, 2009 .................................................................................... 56
Table 5.5: Percent of Correct Classification for Logistic Regression .................................................................................... 58
Table 5.6: Logistic Regression Results ................................................................................................................................. 58
Table 5.7 Risk to Caloric Deficiency by Governorate, 2009 ................................................................................................ 59
Table 5.8: Risk of Caloric Deficiency, by Various Characteristics ....................................................................................... 61
Table 5.9: Distribution of Vulnerability ................................................................................................................................ 63
by Governorate, 2009 ............................................................................................................................................................ 63
Table 5.10: Vulnerability Group Characteristics ................................................................................................................... 65
Table 5.11: Child Labor & Enrolment Rate by Vulnerability Categories ............................................................................. 66


World Food Programme (WFP)
TABLE OF FIGURES
Figure 2.1: Self-Sufficiency of Selected Crops .........................................................................................................................
Figure 2.2: Cereal Imports and Production ................................................................................................................................
Figure 2.3: Wheat Imports and Production ................................................................................................................................
Figure 3.1: Daily Per Capita Caloric Intake by Vulnerability Quintiles (2009) ........................................................................
Figure 3.2: Daily Per Capita Caloric Intake by Poverty Status (2009) ......................................................................................
Figure 3.3: Daily Per Capita Caloric Intake by Governorate, 2009 ...........................................................................................
Figure 3.4: Prevalence of Caloric Deprivation by Governorate, 2009 ......................................................................................
Figure 3.5: Prevalence of Caloric Deprivation by Household Characteristics ..........................................................................
Figure 3.6: Dietary Diversity Classification by Poverty Status .................................................................................................
Figure 3.7: Dietary Diversity Classification by Education of HH Head....................................................................................
Figure 3.8: Percent of Population with Poor Dietary Diversity in 2009 ....................................................................................
(Using Results from Dietary Diversity Score) ...........................................................................................................................
Vulnerability Quintile ................................................................................................................................................................
Figure 3.9: Dietary Diversity Classification by Vulnerability Quintiles ...................................................................................
Figure 4.1: Malnutrition in Children (Under 5 years of Age), by Region, 2008 ................................................................... 36
Figure 4.2: Severe Stunting Rates for Children (Under 5 years of age) by Governorate, 2008 ............................................ 37
Figure 4.3: Malnutrition Index Results: Percentage of Children Under 5 Suffering from Malnutrition (Severe Stunting,
Wasting or Underweight), 2008 .................................................................................................................................... 39
Figure 4.4: Malnutrition Index Values: Percentage of Children (Under-5 Years of Age) Suffering from Severe Stunting,
Wasting or Underweight, by Governorate, 2008 .......................................................................................................... 39
Figure 4.5: Children‘s Malnutrition Index: Children (Under 5) Suffering Severe Stunting, Wasting or Underweight by
Economic Status, 2008 ................................................................................................................................................. 41
Figure 4.6: Percent of Underweight, Those at Risk of Overweight and Obese Youth by Region, 2008 ............................... 42
Figure 4.7: Percent of Male and Female Youth Suffering from Underweight and Obesity, by Economic status, 2008 ....... 42
Figure 4.8: Percent of Underweight Youth by Governorate, 2008 ........................................................................................ 44
Figure 4.9: Percent of Obese Youth by Governorate, 2008 ................................................................................................... 44
Figure 5.1: Poverty Rate by Governorate, 2009 ........................................................................................................................
Figure 5.2: CPI and Food Price Index by Quintiles .............................................................................................................. 53
Figure 5.3: Percent of Deprived Individuals by Dimension, 2009 ............................................................................................
Figure 5.4: Multidimensional Poverty Rate ...............................................................................................................................
Figure 5.5.a Risks of Caloric Deficiency by Household Characteristics ............................................................................... 60
Figure 5.5.b Risks of Caloric Deficiency by Household Characteristics (Continued) .......................................................... 60
Figure 5.6: Educational Status of Persons in Vulnerability Groups .........................................................................................
Figure 5.7 Employment of Persons in Vulnerability Groups ....................................................................................................
Figure 5.8: Child Labour and Enrolment Rate by Vulnerability Categories .............................................................................
iii

World Food Programme (WFP) i
ACRONYMS
CAPMAS Central Agency for Public Mobilization and Statistics
CBE Central Bank of Egypt
CPI Consumer Price Index
DEC Dietary Energy Consumption
DDS Dietary Diversity Score
DHS Demographic and Health Survey
FAO Food and Agriculture Organization
FCS Food Consumption Score GoE Government of Egypt
HH Household
HIECS Household Income, Expenditure and Consumption Survey
IMF International Monetary Fund
MDER Minimum Dietary Energy Requirement
MDGs Millennium Development Goals SSR Self Sufficiency Ratio
UNU United Nations University
WFP World Food Programme
WFS World Food Summit WHO World Health Organization
v


World Food Programme (WFP) 1
EXECUTIVE SUMMARY
This report is produced by the World Food Programme (WFP) in Egypt, in partnership with the Central
Agency for Public Mobilization and Statistics (CAPMAS), and it represents Part I of the Food Security and
Vulnerability Assessment Report for Egypt. The objectives of the study were to: a) define food-insecure or
vulnerable individuals in Egypt; b) identify how many are vulnerable or food-insecure; c) identify where they
live; and d) identify the underlying causes and repercussions of food insecurity and vulnerability. The main
sources of data for the study were the Household Income, Expenditure and Consumption Survey (HIECS
2009); and the Demographic and Health Survey for Egypt (DHS 2008).
The report is divided into six chapters. Chapter One provides a contextual introduction to the study,
including an introduction to the Food and Nutrition Security Conceptual Framework. Chapter Two
provides a brief overview of food availability at the macro-level, including domestic production of
essential foods, self sufficiency ratios and the ability to sustain food imports. It demonstrates that Egypt
is highly dependent on imported foods, particularly food commodities that feature heavily in the
regular diets of the poor (wheat, cereals, vegetable oil and sugar), and the availability of imported
food is highly sensitive to external shocks in the balance of payments. Moreover, Egypt‘s
potentials for expanding domestic food production are constrained by a variety of economic,
social, and environmental factors. Food availability in Egypt is seen as vulnerable mainly to
international food price shocks on the one hand and shocks to balance of payments on the other. The
focus on securing foreign inflows while increasing net domestic production is currently needed, especially
with the recent deterioration in balance of payments since January 2011 and the drop in net foreign
reserves.
Chapter Three provides an analysis of household access to food by focusing on the quantity and diversity
of household food consumption. The quantitative sufficiency of food intake is indicated by caloric intake
as compared to the recommended intake for the household. Estimates of daily per capita caloric intake
show that the national average for Egypt (2,783 calories) is close to the global average in 2009 (2,800
calories), however, disparities exist between governorates and, as expected, the average per capita caloric
intake in most of the governorates in Upper Egypt is actually below the national average. Dietary
diversity is examined using the number of consumed items within each food group. Food consumption
data derived from HIECS indicates that seventeen million persons or one-fifth of Egyptians suffer caloric
deprivation i.e. they receive less than 80 percent of their required caloric intake. The prevalence of caloric
deprivation (the proportion of people whose dietary energy consumption falls below the minimum energy
requirement) was 20.4 percent of the total population. Disparities in caloric deprivation between
governorates and regions, and between urban and rural areas are large. Generally, governorates in Upper
Egypt have higher rates of caloric deprivation compared to other regions, and according to most of the
deprivation indices, Upper Rural Egypt is the most deprived region. Also, within each governorate the
prevalence of caloric deprivation is higher in its rural areas compared to its urban counterparts. Caloric
deprivation is highly correlated with monetary and non-monetary poverty. Nine persons out of 10 multi-
dimensional poor are food-deprived and half of the income-poor are also deprived from their minimum
caloric needs. The education level of the household head is negatively correlated with caloric deprivation
but to a lesser extent. Moreover, one household out of every four households whose head is in casual
employment is likely to experience caloric deprivation. Households that have multiple income sources are
less likely to experience caloric deprivation compared to those with a single source (19.9 percent as
opposed to 23.6 percent, respectively). However, households that have sufficient access to their caloric
needs do not necessarily have access to a nutritious and balanced dietary intake. The data shows that
there are significant differences in mean dietary diversity score among governorates and between urban
and rural areas within each governorate.
Both the income poor and the multidimensional poor suffer from poor dietary diversity, and low
income levels are not the only correlate to poor dietary intake. Lack of awareness of what constitutes
an appropriate and nourishing diet is also an important factor affecting dietary balance at the

2 World Food Programme (WFP)
household level. Generally, governorates in Upper Egypt have a higher prevalence of poor dietary
diversity compared to other regions, and as reflected by most of deprivation indices, Rural Upper Egypt is
the most deprived region.
An overall assessment of household access to food is provided using a) an overlay analysis technique; and
b) cross tabulation of data on caloric deprivation, poor dietary diversity and income poverty. The cross
tabulation results show that 16.3 percent of the total population demonstrates poor food consumption and
at the same time suffer income poverty (mainly in Upper Egypt, Beheira and Menoufia), while 26.1
percent are non-income poor demonstrating poor food consumption. Those that are income poor but have
adequate food consumption represent a mere 5.3 percent of the population while 52.3 percent of the
population are neither poor nor suffering poor food consumption. Upper Egypt, Beheira and Menoufia
require programs that focus on income generation, sufficient food intake and nutritional awareness, while
the focus in Frontier governorates and the rest of Lower Egypt should be on nutritional awareness
programs. The study indicates that economic access to food continues to be the most significant food
security concern complicated by food price increases and a drastic reduction of livelihoods.
Chapter Four provides a brief review of malnutrition indicators for children (under-five years of age) and
youth (10 to 19 years f age) in 2008, and compares the results to the status of food security in all regions.
A malnutrition index for under-fives is developed that combines the indicators of severe stunting, wasting
and underweight, while a second index for malnutrition among youth is developed combining the
indicators of underweight and overweight. Malnutrition indicators for children (under-five years of age)
and youth show that the most pressing and prevalent form of malnutrition among children in Egypt is
severe stunting (14 percent) while overweight is the most prevalent form of malnutrition among youth
(17.2 percent). The incidence of both chronic and short-term malnutrition among Egyptian children under
the age of 5 has increased over time. The prevalence of malnutrition for children below five years of age
across governorates and regions suggests that the nutritional status of children in Egypt is not directly
related to food access indicators and it is not significantly related to the socioeconomic characteristics of
the household and is possibly explained by other factors, such as the availability of health services, clean
water and sanitation. The results do not conform to common knowledge of regions/districts in Egypt and
show that Upper Egyptian governorates performed better than urban governorates and Lower Egypt. The
governorates demonstrating the worst utilization of food are located in Lower Egypt. The utilization of
food amongst children (under-five years of age) is not significantly correlated to the economic status of
the household, or to educational level of mothers. There is no significant difference in food utilization
between under-fives in urban areas compared to those in rural areas, however, male children are more
likely to suffer from stunting than female children. Further in-depth investigation of the prevalence and
causes of malnutrition among children is still needed as EDHS 2008 did not empirically explain causal
factors of malnutrition among children. Malnutrition among youth appears more related to the
socioeconomic characteristics of the household and is more consistent with food access indicators.
While malnutrition levels are for the most part equivalent, female youth are more likely to suffer from the
risks of overweight and obesity than male youth; youth in the wealthiest quintile are most likely to suffer
from obesity; and the percent of overweight and obese youth increased in proportion to the educational
level of the mother. Marked discrepancies are observed in the nutritional status of youth between
governorates.
One of the most significant threats to household access to food is persistent inflation in domestic prices of
food. Chapter Five provides a vulnerability analysis that initially reviews income and multi-dimensional
poverty, as they are both likely to affect the vulnerability of households to food insecurity. This is
followed by in-depth analysis of the probability/risk of being food insecure using two approaches. The
first approach studies the probability of suffering caloric deprivation and this is expressed as a function of
various household characteristics using logistic regression. The results are used to show the percent of
population at risk of caloric deprivation. The second approach studies the relationship among variables
that are believed to be strongly correlated to food insecurity using principal component analysis, and uses
the estimated weights for each variable to calculate the vulnerability score for all households. The scores

World Food Programme (WFP) 3
are then distributed into quintiles and households are classified according to their scores into ―very high‖,
―high‖, ―medium‖, ―low‖ or ―very low‖ vulnerability classes. The vulnerability index for 2009 shows that
households facing ―very high‖ levels of vulnerability to food insecurity make up 20 percent of the
population. Governorates in Upper Egypt have the greatest risk to higher food insecurity and Assiut has
an alarming level of vulnerability, since 59 percent of the population living in Assiut are classified among
the ―highest vulnerability‖ category. Also, the estimated probability of caloric deficiency across
governorates indicates that 9.4 percent of the total population are at high risk of becoming caloric
deficient, 28.1 percent are at moderate risk, while 62.5 percent are at low risk; and rural residents have a
greater risk of becoming caloric deficient (10.5 percent are at high risk and 30.6 percent are at moderate
risk) than urban residents (7.8 percent are at high risk and 24.5 percent are at moderate risk). HIECS 2009
data reveals that vulnerability to food insecurity is associated with harmful coping strategies such as child
labour and low school enrolment.
Chapter Six provides a summary of the main conclusions, and recommendations. The recommendations
include revisiting the targeting of food insecure and vulnerable populations based on a careful assessment
of the attributes and determinants of food insecurity across all regions. Given the cumulative deterioration
in key sources of foreign exchange since February 2011, food availability in Egypt is a point of concern.
Accordingly, the focus on securing foreign inflows while increasing net domestic production is required.
Upper Egypt, Beheira and Menoufia require programs that focus on income generation, sufficient food
intake and nutritional awareness, while the focus in Frontier governorates and the rest of Lower Egypt
should be on nutritional awareness programs. Since malnutrition is an area of main concern in Egypt that
deserves wider attention and further analysis, the report recommends a more in-depth investigation to
explore and explain the higher prevalence of child malnutrition in Lower Egypt, as well as the sudden
structural change in prevalence rates between 2005 and 2008. Furthermore, since price stabilization of
essential food items is vital for the poor, an in-depth study of market structure, market integration and the
price chain of essential foods are both required and highly recommended. Finally, growing recognition
that reducing vulnerability means increasing access to productive and decent employment supports the
recommendation that policies aiming at reducing risks to food insecurity should be concerned about
creating more stable and sustainable jobs, and providing social assistance to those who are unable to
work.

4 World Food Programme (WFP)
CHAPTER ONE:
INTRODUCTION AND BACKGROUND
Key Messages:
Inflation in Egypt has remained at double digit levels since 2008.
The Egyptian economy is highly vulnerable to any global food price shocks.
The GoE has implemented several measures to reduce the adverse impact of price
increases on the living standards of the population in general and the poor in
particular.
The Food subsidy system is a part of a broader consumer welfare program
subsidizing transport, housing, and energy.

World Food Programme (WFP) 5
Main Pillars of Food Security Analysis
Food Availability: The food that is physically present in the area of study, encompassing all forms of domestic production, commercial imports and food aid. This may be aggregated at the regional, national, district or community level.
Food Access: A household‘s ability to regularly acquire adequate amounts of food, through a combination of its own home production and stocks, purchases, barter, gifts, borrowing or food subsidies.
Food Utilization: A household‘s use of the food to which it has access, and an individual‘s ability to absorb and metabolize the nutrients, i.e. the conversion efficiency of the body.
Food Security
When all people, at all
times, have physical, social
and economic access to
sufficient, safe and
nutritious food which meets
their dietary needs and food
preferences for an active
and healthy life
1 INTRODUCTION
1.1 BACKGROUND: WHAT IS FOOD SECURITY?
Reflecting a growing realization of the importance of nutrition to health,
and health to economic growth, the United Nations Food and Agriculture
Organization (FAO) organized the World Food Summit (WFS) in Rome in
1996. One of the key documents resulting from the WFS is the Rome
Declaration on World Food Security, which set the goals of reducing the
number of chronically undernourished people in the world by half by the
year 2015; achieving food security for all; and supporting ―an on-going
effort to eradicate hunger in all countries, with an immediate view to
reducing the number of undernourished people to half their present level no
later than 2015" (FAO, 1996). Four years later in 2000, The Millennium
Summit integrated hunger and poverty reduction into the first of the
Millennium Development Goals (MDGs). Recently, the United Nations Development Assistance
Framework (UNDAF) for 2013-2017 in Egypt has acknowledged the food security and nutrition problems
as a priority area that requires direct intervention.
Over the years, national governments and multilateral development organizations have come to recognize
that beyond hunger and famine, there is the more complex concept of Food Security, which is defined as
existing: ―When all people, at all times, have physical, social and economic access to sufficient, safe and
nutritious food which meets their dietary needs and food preferences for an active and healthy life.‖ 1
There is no single measure to analyse the level of food security of a population, a community or an
individual. Food security is determined by a range of interrelated agro-environmental, socio-economic and
biological factors, all of which must be addressed to ascertain whether or not food security exists. Food
Insecurity, on the other hand, is defined as existing:
“When people lack secure access to sufficient amounts of safe and nutritious food for
normal growth and development, and an active and healthy life. Food insecurity may be
caused by the unavailability of food, insufficient purchasing power, inappropriate
distribution, or inadequate use of food at the household level.”2
Identifying how many people are food-insecure,
how many are vulnerable to the risk of food
insecurity, where they live, their socio-economic
profiles and the main risks they face are all
fundamental factors required for the design of an
effective national food security strategy.
Accordingly, the World Food Programme (WFP) in
Egypt has embarked on this study, which represents
Part I of the Food Security and Vulnerability
Assessment Report for Egypt. The objectives of
this study are to: a) define food-insecure and
vulnerable individuals in Egypt; b) identify how
many are vulnerable and food-insecure; c) identify
where they live; and d) identify the underlying
causes and repercussions of food insecurity and
vulnerability. 1 Glossary of Monitoring and Evaluation Terms, United Nations World Food Programme, Office of Evaluation & Monitoring, p.9.
http://documents.wfp.org/stellent/groups/public/documents/ko/mekb_glossary.pdf
2 Ibid.

6 World Food Programme (WFP)
The report is divided into six chapters. The first chapter represents the introduction to the study and the
report. The second chapter provides a brief overview of food availability at the macro-level, including
domestic production of essential food items, self sufficiency ratios and the ability to sustain food imports.
The third chapter provides an analysis of household access to food by focusing on the quantity and
diversity of household food consumption. The quantitative sufficiency of food intake is indicated by
caloric intake as compared to the recommended intake for the household. Dietary diversity is examined
using the number of consumed items within each food group, and finally, an overall assessment of the food
security situation is provided through an overlay analysis technique and cross tabulation of data on caloric
deprivation, poor dietary diversity and income poverty. Furthermore, the impact of increases in food prices
on different income groups is addressed by examining the changes in prices of the different commodity
baskets consumed by each group.
The fourth chapter of the report provides a brief review of malnutrition indicators for children (under-five
years of age) and youth (10 to 19 years of age) in 2008, and compares the results to the status of food
security in all regions. A malnutrition index for under-fives is developed that combines the indicators of
stunting, wasting and underweight, while a second index for malnutrition among youth is developed
combining the indicators of underweight and overweight. The fifth chapter provides a vulnerability analysis
that initially reviews income and multi-dimensional poverty, as they are both likely to affect the vulnerability of
households to food insecurity. This is followed by in-depth analysis of the risk of being food insecure using two
approaches. The first approach studies the probability of suffering caloric deprivation and this is expressed as a
function of various household characteristics using logistic regression. The results are used to show the percent
of population at risk of caloric deprivation. The second approach studies the relationship among variables that
are believed to be strongly correlated to food insecurity using principal component analysis, and uses the
estimated weights for each variable to calculate the vulnerability score for all households. The scores are then
distributed into quintiles and households are classified according to their scores into ―very high‖, ―high‖,
―medium‖, ―low‖ or ―very low‖ vulnerability classes. The sixth and final chapter provides concluding remarks
and a summary of the main findings of the report.
1.2 SOURCES OF DATA
This study mainly relies on two types of nationally representative surveys: the Household Income,
Expenditure and Consumption Survey (HIECS 2009); and the Demographic and Health Survey for Egypt
(EDHS 2008), which are implemented by the Central Agency for Public Mobilization and Statistics
(CAPMAS) and by El-Zanaty and Associates on behalf of the Ministry of Health, respectively.
HIECS 2009 follows a multi-stage stratified cluster sampling technique, covering 46.8 thousand
households (nearly 220 thousand individuals) across all governorates over a twelve month period, from
April 2008 to March 2009. The sample is divided proportional to size between urban areas (47.2 percent)
and rural areas (52.8 percent), distributed among 2,526 area segments. The survey includes three main
questionnaires; on consumption and expenditure and on income, in addition to diary questions for
consumption and expenditure that show actual household consumption and expenditure during the
reference period (last 15 days).
EDHS 2008 also follows a multi-stage stratified cluster sampling technique covering 18.9 thousand
households and it involves three main questionnaires: household questionnaire, ever-married woman
questionnaire and a health issues questionnaire. The survey also includes biomarkers, including
anthropometric measurements.
1.3 THE FOOD AND NUTRITION SECURITY CONCEPTUAL FRAMEWORK
The Food and Nutrition Security Conceptual Framework considers three distinct, but also highly
interrelated dimensions: a) food availability; b) food access; and c) food utilization as core elements of
food security, and links them to household asset endowments, livelihood strategies, and the political,
social, institutional, and economic environments. While the Food and Nutrition Security Conceptual

World Food Programme (WFP) 7
Inflation has remained at
double digit levels since
2008.
Framework considers malnutrition and mortality to be the final outcome or manifestation of insufficient
food intake and/or disease at the individual level, this study builds its analysis mainly on data from the
national ―Household Income, Expenditure and Consumption Survey‖ (HIECS) for 2009 which lacks any
direct reference to nutrition indicators. Therefore, in this study we focus on food deprivation at the
household level, in addition to a brief review of nutrition indicators for children (under 5) and youth (10-19
years) developed by another separate survey ―Egypt Demographic and Health Survey‖ (EDHS) for 2008.
1.4 EGYPT’S MACROECONOMIC CONTEXT
The macroeconomic context in Egypt has both direct and indirect impacts on the status of food security in
Egypt. In 2005 Egypt began actively implementing a macroeconomic structural reform program designed
to move Egypt towards a more market-oriented economy. The reforms have targeted fiscal/monetary
policies, privatization and new business legislation, improved management of the exchange rate,
reductions in the fiscal deficit and public debt, the enhancement of public financial management,
improvements to the investment climate and trade reforms to enhance economic competitiveness (ENCC,
2009).
At the macro-level, the economy achieved high levels of real GDP growth
during 2005-2008 that was accompanied by increasing investment inflows,
improving balance of payments, a decline in fiscal deficit to GDP and
domestic debt ratios and stability in foreign exchange market, however little change has trickled down to lower
income groups, poverty rates remained high and persistent inflation in consumer prices continued to threaten the
real purchasing power of the lowest income deciles.
In spite of the economic growth achieved, little structural change was felt, and inflation in food prices
became a point of major concern. The Central Bank of Egypt (CBE) followed a tighter monetary policy
and announced price stability as the principal target of the monetary policy in Egypt; nevertheless,
inflation has remained at double digit levels since 2008. CPI inflation for urban areas reached a peak of
23.6 percent in August 2008, driven by inflation in the food and beverages index, which recorded 30.9 percent
during the same month. Although prices started to decelerate afterwards for almost one year, inflation started
picking up again in September 2009, but this time from a higher base value than that in 2008. Food prices, the
main driver of domestic inflation in consumer prices, widely fluctuated, and for some food groups like
vegetables‘ inflation recorded 88 percent. Figure 1.1 below demonstrates the fluctuations in Egypt‘s Consumer
Price Index and Food Price Index during the period from January 2005 to December 2009. The figures also
reflect the rigidity in domestic prices that never returned back to their base values and thus, every inflationary
wave had a compounded impact on consumers. It should be noted that although food subsidies are a significant
component of the Poor‘s dietary intake, households in Egypt (even in rural areas) are net food buyers, and
consumption of home-grown food represents only 9 percent of total food consumption (1.9 percent in urban
areas and 17 percent in rural areas). Therefore, households are highly sensitive to inflation in food prices.

8 World Food Programme (WFP)
The Egyptian Economy is
highly vulnerable to global
food price shocks.
Source: Calculated using monthly price indices from Central Agency of Public Mobilization and Statistics in Egypt
(CAPMAS).
The impact of fluctuations in world food prices on inflation and the cost of
living in Egypt is strong. The country is a net food importer and relies
heavily on costly consumer food subsidies.3 According to International
Monetary Fund (IMF) estimates, changes in world commodity prices account for approximately 43 percent
of the variation in headline inflation in Egypt, with world food prices playing a much larger role at 39.8
percent than fuel prices at 3.3 percent (IMF 2009b). Accordingly, the Egyptian economy is highly
vulnerable to global food price shocks.
Egypt has been hit by such shocks twice in the last 5-year period. The global food and fuel crises of 2007–
2008 led to a spike in inflation rates, deterioration in current account balances, and increases in
government deficits. The global financial crisis affected macroeconomic performance through a decline in
direct foreign investment (after several years of steady and steep growth) as well as revenues from the
Suez Canal, tourism, and remittances (which represent the country‘s second biggest source of foreign
revenue after tourism, accounting for almost 6 percent of GDP in 2007). Growth rates in other economic
sectors were also significantly reduced. The GoE has implemented several measures to reduce the
adverse impact of price increases on the living standards of the population in general and the poor in
particular (see Box 1.1. below). Many of these measures are related to improvements to the existing food
subsidy system.
The Food subsidy system is a part of a broader consumer welfare program subsidizing transport,
housing, and energy. By providing citizens with their minimum level of food requirements at subsidized
prices, the GoE aims to protect them from malnutrition and help them cope with individual and household
food insecurity. There are two Food Subsidy programs: 1) subsidised baladi bread, which is the largest
component of food subsidies, is available to all Egyptians; and 2) ration cards, which cover over two-thirds
of Egyptians and provide fixed monthly quotas of cooking oil, sugar, rice and tea to households holding
these cards.
3 ―Egypt is the world‘s largest wheat importer with an estimated import requirement of 10 million tonnes for the current 2010/11
marketing year, and a total cereal import requirement of 15.6 million tonnes‖ FAO/GIEWS Global Watch, 11 March 2011
North Africa Brief, p2 http://www.fao.org/giews/english/shortnews/nafria110311.pdf
4.0%
12.9%
6.9%
23.6%
9.0% 6.3%
11.6%
17.1%
30.9%
22.2%
0.0%
5.0%
10.0%
15.0%
20.0%
25.0%
30.0%
35.0%
Jan
-05
Mar
-05
May
-05
Jul-
05
Sep
-05
No
v-0
5
Jan
-06
Mar
-06
May
-06
Jul-
06
Sep
-06
No
v-0
6
Jan
-07
Mar
-07
May
-07
Jul-
07
Sep
-07
No
v-0
7
Jan
-08
Mar
-08
May
-08
Jul-
08
Sep
-08
No
v-0
8
Jan
-09
Mar
-09
May
-09
Jul-
09
Sep
-09
No
v-0
9
Headline CPI Food & Beverages
Figure 1.1: Annual Inflation in Headline CPI and Food & Beverages
(Jan 2005 - Dec 2009)

World Food Programme (WFP) 9
Box 1.1 GoE Responses to the Food Crisis
GoE measures to deal with the food crisis:
Fiscal measures include raising the level
of subsidies allocated for food items from
L.E. 12 billion to LE 21.4 billion (ration
card subsidies were increased from L.E. 4.2
billion to L.E. 5.4 billion; while the baladi
bread subsidy jumped from L.E. 7.8 billion
to L.E. 16 billion);
Administrative measures have been
instituted to separate the bread production
and distribution processes;
Trade policy measures were introduced;
and
Targeting mechanisms have been revised
and households are now allowed to apply
for new ration cards.
Since 2005, there have been changes in the
eligibility criteria, the number and prices of
ration card food items, and the production and
distribution of baladi bread. But, the system is
still costly, accounting for almost 2 percent of
GDP and suffering from large leakages.
The fiscal cost of food subsidies reached about 2
percent of GDP in 2008/09 (LE 21.1 billion, or
US$ 3.8 billion) after stabilizing at around 0.9
percent of GDP between fiscal years 1996/97 and
2000/01. The rising cost of food subsidies can be
explained by increased international commodity
prices, exchange rate depreciation, increased
numbers and/or quantities of subsidized food
items, and expanding coverage of ration cards.
Unfortunately, in the absence of well-designed
targeted programmes, a significant amount of the
recently increased resources are still leaked, and a
significant number of the poor remain unreached.
Food prices continue to remain a challenge to
overall food security in Egypt in 2011. Events
challenging the status of food security in Egypt
include not only the ongoing socio-economic
impacts of the 25th January Revolution in Egypt,
but also the repercussions of the Libyan
Revolution. According to FAO/GIEWS Global
Watch, 11 March 2011 North Africa Brief, ―The
large influx of people from Libyan Arab
Jamahiriya [to Egypt] since 19 February 2011,
currently estimated at 90306, has increased the
need for food, and other emergency supplies.‖
The report also highlights the potential impacts of
spiking food product prices (particularly wheat and
rice) on the cost of the GoE‘s food subsidy
program, and the impact on rising inflation.

10 World Food Programme (WFP)
CHAPTER TWO:
THE MACRO AVAILABILITY OF FOOD IN EGYPT
Key Messages:
Despite the fact that Egypt is generally vulnerable to shocks in the balance of
payments, it actually became less vulnerable in the period from 2000 to 2007.
Egypt is highly dependent on imported foods, particularly food commodities that
feature heavily in the regular diets of the poor (wheat, cereals, vegetable oil and
sugar).
There is no significant variation in Egypt‘s SSR in the period between 2000 and
2007
The focus on securing foreign inflows while increasing net domestic production is
currently needed, especially with the recent deterioration in balance of payments
since January 2011 and the drop in net foreign reserves.

World Food Programme (WFP) 11
2 THE MACRO AVAILABILITY OF FOOD IN EGYPT
From a macroeconomic perspective, the availability of food mainly depends on domestic production of
food and the ability of a country to finance its food imports. Analysis of food availability is especially
important for countries like Egypt that are highly dependent on food imports. In that respect, it is important
to note that secure availability of food is conceptually different from self-sufficiency in food production.
A country that is highly dependent on food imports can be food secure if it exports enough goods and
services to finance its food imports. Generally, the ability to finance food imports depends on a number of
factors, including the balance of payments position, exports of goods and services, and sufficiency of
foreign exchange reserves.
This section followed WFP food security analysis guidelines4, and used several food availability related
indicators to help assess the underlying risks to food availability in Egypt. These indicators include: the
food trade balance (ratio of total exports to food imports); the agricultural potential; per capita food
production; and self-sufficiency ratio.
2.1 FOOD IMPORTS AND DOMESTIC SUPPLIES
The ratio of total exports to total food imports is an indicator of a nation‘s ability to finance its food
imports from its total export revenues. Some analysts argue that as long as the relation between
exports (agricultural and non-agricultural) and food imports is within a certain range, (that is, the
country exports enough to afford food imports) the country is then considered to have secure
availability of food.5
Measuring the access to world food supply by an individual country is a more relevant indi cator for
food security analysis than the net food trade position (food exports minus food imports). The latter
only provides information on whether a country is a net food importer or exporter, but does not
reflect the relative cost of access to food for that country, and therefore, how vulnerable it may be to
changes in food prices and international food availability. A country that is a net food exporter but
whose total food bill takes a large percentage of total exports is likely to be more vulnerable than a
country that is a substantial net food importer but whose food bill takes only a small percentage of
its total exports.
The ratio of food import costs to total exports also presents a broader and more complete picture of
the role of trade, and the potential impact of trade policies, on food security. Focusing exclusively
on the costs of importing food (whether gross or net) does not take into account the broader
contribution of trade to food security, which includes both the availability of food in world markets
and the generation of the export revenue required to finance imports. A country whose food import
bill increases may not be more vulnerable than in the past if its total exports have increased
proportionately. Conversely, a country may become more vulnerable even as its food import bills
are decreasing, if its export revenues have also decreased. Therefore, in the context of trade
policies, the important issue is whether these policies encourage total exports to increase faster than
food import costs.
Using the latest available food balance sheets for Egypt prepared by the Food and Agriculture
Organization (FAO), we find that despite the fact that Egypt is highly vulnerable to shocks in the
balance of payments, it actually became less vulnerable in the period from 2000 to 2007. Food
availability, as measured by the trade indicator discussed above, was low in Egypt over the period
from 2000 to 2007, classifying Egypt as highly dependent on food imports. Egypt is highly
4 ―Comprehensive Food Security and Vulnerability Analysis Guidelines‖, World Food Programme, January 2009 5 Diaz Bonilla et al. 2002 and Yu et al., 2009

12 World Food Programme (WFP)
dependent on imported foods, particularly food commodities that feature heavily in the regular diets
of the poor (wheat, cereals, vegetable oil and sugar). Table 2.1, below, provides data on Egyptian
food imports versus food exports for the period from 2000 to 2007.
Table 2.1: Imports versus Domestic supplies
2000 2001 2002 2003 2004 2005 2006 2007
Wheat 44.11 37.16 47.56 35.33 36.57 44.13 44.23 44.72
Cereals 36.99 35.05 37.91 30.30 25.21 36.87 34.87 36.81
Fruits 1.42 1.92 1.07 0.97 1.09 1.41 1.44 1.51
Oils 36.36 33.54 34.04 38.14 25.52 44.43 43.88 63.62
Pulses 34.92 43.58 48.26 47.73 53.23 61.76 66.52 56.00
Spices 12.03 12.57 14.16 12.27 19.12 20.32 28.25 20.29
Starchy Roots 3.52 1.80 2.69 3.19 1.00 2.33 2.67 2.58
Sugar &
Sweeteners 20.29 26.76 22.27 17.48 15.64 27.92 20.16 21.04
Vegetable
Oils 90.99 71.44 46.82 36.01 79.95 83.74 86.50 71.15
Vegetables 0.05 0.07 0.10 0.06 0.11 0.10 0.19 0.13
Source: FAO website database
With regards to locally produced agricultural crops, there are many challenges that currently limit
the potentials for increasing crop production. These include land fragmentation and agricultural land
being lost to urbanization. In ―old lands‖, land fragmentation is the main problem that hinders
cultivation of strategic staple crops such as wheat. For these small farms, cultivation has a
subsistence nature, to satisfy the family‘s basic needs in cereals and fodder for the animals. Plot
sizes are larger in ‗new lands‘. Large farms on these lands are more market -oriented and specialize
in cash crops such as vegetables and fruits (as well as fodder crops and livestock), in great part for
exports.‖6
There are also numerous environmental factors that entail risks to food production, including
increasing desertification, increasing soil salinity (partially due to water logging which resulted
from the construction of the High Dam in Aswan); limited and irregular supply of irrigation water;
and reduced natural fresh water resources other than the Nile, which is the only perennial water
source. Climate change impacts include decreases in the total fresh-water supply, which has a direct
impact on availability of irrigation water, and rises in sea level (which in addition to increasing soil
salinity, and increasing the salinity of groundwater used for agricultural irrigation has also led to
the erosion of amount of arable land available). Finally, rising temperatures have had an increasing
impact on the growth cycles of various crops, with cereal yields expected to decrease.
2.2 SELF-SUFFICIENCY FOR SELECTED FOOD ITEMS
Table 2.2, below, provides the Self-Sufficiency Ratio (SSR) for selected crops.7 Results show that
over the seven year period, food import costs were approximately 11.5 percent lower than export
earnings, (international average), indicating that non-food expenditures are excessively high,
leaving little room for food imports. Accordingly, the availability of imported food is highly
sensitive to external shocks in the balance of payments. However, there has been a steady
6 Agnès Dhur ‖Secondary data analysis of the food security situation in Egypt‖, World Food Programme, May 2011.
7 The self-sufficiency ratio expresses the magnitude of production in relation to domestic utilization. It is defined as: SSR = ___________ Production_________ x 100
Production + imports – exports
Food Balance Sheets: A Handbook, FAO, Rome 2001, http://www.fao.org/docrep/003/x9892e/x9892e00.htm

World Food Programme (WFP) 13
improvement in the ratio of food imports to export earnings between 2000 and 2007, indicating that
Egypt‘s ability to finance its food imports improved over this period. At end of 2007, the self -
sufficiency ratio in food production was estimated to reach 58 percent8.
Table 2.2: Self Sufficiency Ratio for Selected Crops
2000 2001 2002 2003 2004 2005 2006 2007
Wheat 58.67 52.23 56.37 59.49 60.00 62.08 62.70 55.73
Cereals 69.07 62.75 66.53 68.75 69.03 68.84 72.50 67.32
Fruits 100.72 102.90 102.00 103.38 105.06 105.10 104.07 105.04
Oils 69.70 70.97 64.88 59.56 75.34 59.02 59.14 48.26
Pulses 56.23 60.67 57.35 51.76 50.76 42.26 38.94 52.53
Spices 110.57 98.91 96.80 97.51 93.58 89.37 84.58 95.89
Starchy Roots 104.48 106.84 107.87 109.51 115.01 110.53 114.12 112.70
Sugar & Sweeteners 70.03 70.35 69.97 74.30 77.66 77.81 85.51 91.86
Sugar crops 100.02 100.02 100.02 100.02 100.02 100.00 100.00 100.01
Vegetable Oils 17.47 21.67 23.81 22.73 13.37 16.63 13.68 30.66
Vegetables 101.63 102.14 103.01 103.12 103.27 103.13 102.74 102.60
Source: FAO website database.
Figure 2.1, below, provides a graphic representation of the SSR of selected crops. Vegetable oil,
followed by wheat, pulses, oil crops and other cereals are crops with the lowest self -sufficiency.
The average share of imports in total domestic consumption of wheat in 2000 reached 44.11 percent,
fluctuated between 2001 and 2004 and stabilized at a rate above 44 percent between 2005 and 2007.
Egypt consumes over 14 million tons of wheat every year and grows nearly 7 million tons. This
means Egypt imports at least 7 million tons per year (Baker and Maitra 2008). The country has one
of the world‘s highest per capita wheat consumption rates, with an average of 196 kilograms in
2008 (FAPRI 2009).
Source: FAO website database.
8
Government of Egypt, FAO, WFP, World Bank, IFAD and NEPAD, ―Increasing Productivity in the Agricultural Sector‖, Working Paper No. 3,
Inter-Agency Assessment Mission (17 November – 4 December 2008).
30
35
40
45
50
55
60
65
70
75
80
2000 2001 2002 2003 2004 2005 2006 2007
Figure2.3: Self-Sufficiency of selected crops
Wheat Cereals Oil crops Pulses Vegetable Oils
Figure 2.1: Self-Sufficiency of Selected Crops SSR

14 World Food Programme (WFP)
Figures 2.2 and 2.3 below highlight the ratio of import to production between 2000 and 2007 for cereal and
wheat, respectively.
Source: FAO website database.
There is no significant variation in Egypt‘s SSR in the period between 2000 and 2007, as the
volume of per capita net production of wheat changed from 100.7 Kg per person per year in 2000 to
97.5 Kg in 2007 (Table 2.3), while total production increased from 6.6 million tons in 2000 to 7.4
million tons in 2007 (see Figure 2.2 above). Imports also increased from 4.9 million tons in 2000 to
5.9 million tons in 2007. Therefore, the SSR for wheat declined by approximately 3 percent (from
58.7 to 55.7 percent) between 2000 and 2007. However, as many Egyptian analysts point out, there
is reason to believe that the actual SSR is lower by 5 to 6 percent due to overestimation of the
domestic production (see SSR in figure 2.1). This is corroborated by the fact that in 2008, even
after the implementation of major price reforms to the advantage of wheat farmers, only 2.5 million
tons of wheat were delivered to the Government.
Table 2.3: Per Capita Production in Kg.
2000 2001 2002 2003 2004 2005 2006 2007 Average Annual
Growth
Wheat 100.74 93.95 97.39 98.48 101.08 112.22 111.66 97.51 1.00
Cereals 277.90 252.66 266.99 267.98 263.46 280.82 273.33 254.70 0.99
Fruits 106.91 110.47 113.29 111.61 115.56 114.24 125.76 123.63 1.02
Oil crops 13.27 15.86 14.03 11.34 14.85 12.89 11.95 12.08 0.99
Pulses 6.52 7.75 7.23 6.13 5.82 5.03 4.51 5.18 0.97
Starches
Roots
31.70 34.04 33.63 35.36 41.37 49.92 37.70 43.16 1.05
Source FAO Website Database
Despite the market availability of food, its sufficiency is very much determined by fluctuations in
international prices and the availability of foreign exchange. Therefore, food availability in Egypt is seen
as vulnerable mainly to international food price shocks on the one hand and shocks to balance of payments
on the other. The focus on securing foreign inflows while increasing net domestic production is
currently needed, especially with the recent deterioration in balance of payments since January 2011
and the drop in net foreign reserves.
0
5000
10000
15000
20000
25000
30000
35000
20
00
20
01
20
02
20
03
20
04
20
05
20
06
20
07
Th
ou
san
ds
of
Ton
s
Figure 2.1: Cereal Imports and Production
Production Imports
0
2000
4000
6000
8000
10000
12000
14000
16000
20
00
20
01
20
02
20
03
20
04
20
05
20
06
20
07
Th
ou
san
ds
of
Ton
s
Figure 2.2:Wheat Imports and Production
Production Imports
Figure 2.2: Cereal Imports and Production Figure 2.3: Wheat Imports and Production

World Food Programme (WFP) 15
CHAPTER THREE:
ACCESS TO FOOD
Key Messages:
Economic access to food continues to be the most significant food security concern
complicated by food price increases and a drastic reduction of livelihoods. The
coexistence of income poverty, caloric deprivation and poor dietary diversity is
highest in Upper Egypt, followed by Beheira and Menoufia in Lower Egypt.
Significant disparities exist in caloric deprivation between governorates and between
urban and rural areas.
Caloric deprivation is highly correlated with monetary and non-monetary poverty.
Both the income poor and the multidimensional poor suffer from poor dietary
diversity.
Governorates in Upper Egypt have a higher prevalence of poor dietary diversity
compared to other regions, and Rural Upper Egypt is the most deprived region.
People living in rural areas consume an undiversified diet and are at higher risk of
micronutrient deficiencies than people in urban areas.
Economic access to food continues to be the most significant food security concern.

16 World Food Programme (WFP)
3 ACCESS TO FOOD
Economic access to food continues to be the most significant food security concern complicated by food
price increases and a drastic reduction of livelihoods. Reduced cash incomes and low consumer
purchasing power should be considered as forms of ―market-induced shock‖ for vulnerable households.
Household food consumption is a reflection of both food availability in markets as well as the ability of
households to access food. Therefore, food consumption is used as one of the main proxy indicators of the
food security situation in 2009. Together, dietary diversity and frequency of food intake of various food
types, according to WFP‘s standard methodology, are considered to be reliable proxy indicators of the
accessibility of households to food. Three principal approaches are used in analysing adequacy of food
consumption at the household level:
1. The first approach is per capita caloric intake and the share of each food group in total
generated calories, also compared to the recommended intake for every age group.
2. The second assesses the consumption of calories relative to calorie requirements and thus
focuses on the sufficient consumption of food in quantitative terms. This approach is
usually applied by FAO and relies on data from food balance sheets, that are typically
related to an average calorie requirement (for example, 2,100 kcal per capita per day).
Alternatively, per capita calorie consumption can be estimated from detailed household
expenditure surveys. Furthermore, data on household age and gender composition can be
used to calculate household-specific calorie requirements per capita using standard
requirement levels as suggested by the World Health Organization (FAO-WHO-UNU
2001). The calorie deprivation status is then determined by relating calorie consumption
amounts to calorie requirements.
3. The third approach looks at the nutritional composition of diets and thus it considers
aspects of dietary quality. This approach is used by the WFP to calculate the Food
Consumption Score, which is based on the frequency of consumption of specific food
groups. These frequencies are weighted according to their nutritional importance.
Adequacy of food consumption is then typically identified by using a universal cut off
benchmark. However, data from HIECS 2009 does not include information on the daily
frequency of household food intake of a specific food group, it rather provides
information on the total quantity of food items consumed by the household during the
reference period (15 days) and this is carried out for all governorates throughout the
whole year. Therefore, in this study the quantitative analysis of food consumption is
complemented with a brief analysis of dietary diversity of food intake at household level.
HIECS surveys provide information on household purchases of 195 food items and information on
household food consumption over the questionnaire reference period (the last 15 days). In order to express
food consumption as a monetary value, the unit value of the purchased items is used. The collected
information on household food purchases includes monetary value, quantity, unit of measurement and
location of purchase. Estimates of daily per capita caloric intake show that the national average for Egypt
(2,783 calories) is close to the global average in 2009 (2,800 calories), however, disparities exist between
governorates and, as expected, the average per capita caloric intake in most of the governorates in Upper
Egypt is actually below the national average. Table 3.1 in the following section provides data on caloric
deprivation by governorate in 2009.

World Food Programme (WFP) 17
Source: Calculated using HIECS 2009.
Figure 3.3, below, highlights caloric intake by governorate. The data demonstrates that the energy
consumption per person per day is lowest in the governorate of Assiut, followed by Beni Suef and
Menoufia. There are 10 governorates that experienced a high daily per capita caloric intake of over 3,000
calories, while there are only 5 governorates whose average daily per capita caloric intake was less than
2,500 calories. In general, with the exception of Luxor, governorates in Upper Egypt are either below the
national average of daily per capita caloric intake (2,783 calories) or close to the border line. Menoufia
was the only governorate in Lower Egypt with a below average per capita caloric intake. As shown in
Figure 3.1, above, individuals in the lowest vulnerability quintile had an average per capita intake of 2,081
calories per day, representing only two-thirds of the highest quintile caloric intake (3,136 calories per
person per day). The correlations between per capita calorie intake and other deprivation dimensions are
also apparent. The average per capita caloric intake of an income-poor individual represents 71 percent of
that of the non–poor (See Figure 3.2, above). The correlation with multi-dimensional poverty is also
significant, where per capita caloric intake for someone defined as multi-dimensionally poor is 59 percent
of the non-poor.
Source: Calculated using HIECS 2009.
The simple measurement of average daily caloric intake per person across governorates provides
information on governorates with the least caloric intake and a rough measurement of the intensity of the
0
500
1000
1500
2000
2500
3000
3500
1 2 3 4 5
Vulnerability Quintiles
Figure 3.8: Daily percapita Caloric Intake by Vulnerability Quintiles
0
500
1000
1500
2000
2500
3000
Multi dimensional poverty
Income poor
Figure3.7 : Daily percapita Caloric Intake by Poverty Status
Non poor Poor
0
500
1000
1500
2000
2500
3000
3500
4000
Ass
iut
Ben
i Su
ef
Men
ou
fia
Fayo
um
Giz
a
Soh
ag
Ism
ailia
Asw
an
Men
ia
Tota
l
Ale
xan
dri
a
Qen
a
Beh
eira
Qu
alio
bia
Po
rt S
aid
Dak
ahlia
Cai
ro
Shar
kia
Gh
arb
eya
Dam
iett
a
Kaf
r el
Sh
eikh
Luxo
r
Suez
Figure 3.3: Daily Per Capita Caloric Intake by Governorate, 2009
Calories
Figure 3.1: Daily Per Capita Caloric
Intake by Vulnerability Quintiles (2009)
Figure 3.2: Daily Per Capita Caloric
Intake by Poverty Status (2009)
Calories Calories

18 World Food Programme (WFP)
deprivation incidence when compared to average required intake and when compared to other
governorates. However, daily per capita caloric intake fails to: a) provide an estimate of the prevalence of
this incidence (i.e. what is the percent of population suffering this deprivation in each governorate and
which nutrient elements are most needed to bring their diet to a healthy and acceptable balance); and b)
identify how far the deprived population is from both the mean intake and the recommended intake.
Accordingly, the following sections examine three main aspects: 1) prevalence of caloric deprivation
across governorates; 2) dietary diversity of food intake within each food group as an indicator for food
diversity; and 3) sufficiency of nutrient/energy intake per household as an indicator of sufficient and
balanced food intake.
3.1 PREVALENCE OF CALORIC DEPRIVATION9
Caloric deprivation is based on a standard and implicit assumption: a person in a household is
considered calorie deficient if the surveyed household reports (at the household-level) calorie
consumption below the sum of standard individual calorie intake requirements for all household
members, otherwise a person is considered as sufficiently supplied with calories. The main data
limitation of this approach is that the true intra-household distribution of food cannot be determined.
Empirical evidence suggests that in some countries (with male-dominated societies), females and
young children in particular are disadvantaged. This is one reason for the use of child anthropometrics
to analyze the nutritional status of children.
The prevalence of food deprivation (caloric deficiency) based on the FAO methodology depends on two
components: 1)the amount of dietary energy contained in the food consumed and, 2) the minimum energy
requirement for performing a minimum acceptable level of light physical activity for different groups of
age and sex. The weighted overall minimum dietary energy requirement (MDER) is used as the cut-off
point of the distribution function of dietary energy consumption for estimating the prevalence of food
deprivation or the proportion of the population consuming less energy than the MDER.
The Dietary Energy Consumption (DEC), per person per day refers to dietary energy from food acquired
for consumption by (or available to) the sampled households rather than from actual food consumption or
intake of the individual household members. Calories generated for each food item were calculated using
tables from ―Food Consumption Tables for Near East‖, (2000) that list calories generated from the edible
part of 100 grams of purchased food and also calories for food as purchased. The HIECS contains food
data as purchased weight or volume. The dietary energy value is multiplied by the quantity of acquired
food on the purchased weight basis.
Average household kilocalorie unit price is used for estimating the dietary energy values of food items
when household food data are only available in terms of monetary value (such as for food eaten outside of
the home). The dietary energy values are obtained by dividing the monetary value by the kilocalorie unit
price at the household level. In other words,
HH DEC from food eaten away from home = HH monetary value of food eaten away from home
HH kilocalorie unit price.
The total household dietary energy consumption is obtained by adding up calories generated from all
commodities, either eaten at home or outside. The total household DEC and per person per day caloric
intake is calculated taking into account the sampling weights. Total caloric consumption is compared to
total caloric requirements for each household, and if caloric consumption is less than 80 percent of caloric
requirements, all household members are considered food deprived, i.e., consume insufficient calories
(caloric deficiency), otherwise all members are non-deprived; i.e., consume sufficient calories. Food
consumption data derived from HIECS indicates that seventeen million persons or one-fifth of Egyptians
suffer caloric deprivation i.e. they receive less than 80 percent of their required caloric intake. The
prevalence of caloric deprivation (the proportion of people whose dietary energy consumption falls below
9 Food deprivation refers to individuals suffering from caloric deficiency.

World Food Programme (WFP) 19
the minimum energy requirement) was 20.4 percent in total population. Table 3.1, below, demonstrates
that caloric deprivation is more widespread in rural areas than in urban areas (22 percent in rural areas as
compared with 17 percent in urban areas).
Table 3.1: Caloric Deprivation by Governorate, 2009
Governorates Prevalence of Caloric Deprivation, % Daily Per Capita Caloric Intake
Urban Rural Total Urban Rural Total
Urban Governrates 15.32 15.32 3013 3013
Cairo 20.09 20.09 2980 2980
Alexandria 17.32 17.32 2824 2824
Port Said 0.19 0.19 2945 2945
Suez 0.00 0.00 3784 3784
Lower Egypt 11.62 13.84 13.36 3000 2869 2907
Damietta 0.38 0.26 0.31 3152 3166 3160
Dakahlia 5.33 12.23 10.34 3065 2910 2952
Sharkia 8.08 6.79 7.08 2932 3035 3011
Qualiobia 18.79 8.75 12.87 3149 2670 2867
Kafr el Sheikh 6.26 9.13 8.55 3389 3124 3177
Gharbeya 15.92 12.66 13.60 2939 3062 3027
Menoufia 20.44 37.51 34.31 2644 2428 2468
Beheira 20.55 20.10 20.19 2928 2834 2851
Ismailia 0.00 1.07 0.61 2723 2458 2572
Upper Egypt 24.80 31.18 29.25 2608 2528 2552
Giza 31.37 46.57 37.91 2591 2350 2487
Beni Suef 31.44 41.81 39.28 2405 2273 2305
Fayoum 17.68 30.86 28.10 2479 2475 2476
Menia 15.19 19.46 18.78 2972 2744 2780
Assiut 33.02 54.12 48.96 2332 2106 2162
Sohag 21.52 26.78 25.69 2549 2548 2548
Qena 21.11 17.97 18.62 2659 2892 2843
Aswan 5.53 4.87 5.14 2717 2701 2708
Luxor 2.53 13.90 8.26 3403 3602 3504
Frontier Governorates* 3.17 5.10 4.80 2983 3000 2987
Total 17.93 22.03 20.35 2876 2718 2783 Source: Calculated by authors using HIECS 2009.
* HIECS coverage of frontier governorates in 2009 is not sufficiently representative, and calculations based on HIECS data for
these governorates require further validation. Therefore, all indicators used for these governorates must be regarded with great
caution.
Disparities in caloric deprivation between governorates and between urban and rural areas are large,
reaching an alarming level in Assiut. Table 3.1, above, demonstrates that the prevalence of caloric
deprivation strongly varies between governorates and between urban and rural areas within each
governorate, and is alarmingly high in Assiut. One in two persons was found to suffer from caloric
deprivation in the rural areas of Assiut; followed by Giza and Beni Suef. The data also reveal large
differences in the spread of caloric deprivation across regions. Assiut is also the most deprived
governorate in terms of both income poverty and multi-dimensional poverty. Generally, governorates in
Upper Egypt (with the exception of Aswan and Luxor) have a higher rate of caloric deprivation compared
to other regions, and according to most of the deprivation indices, Upper Rural Egypt is the most deprived
region, nevertheless, Beheira, Menoufia and Cairo all have a high prevalence of caloric deprivation. Also,

20 World Food Programme (WFP)
within each governorate the prevalence of caloric deprivation is higher in its rural areas compared to its
urban counterparts.
Source: Calculated using HIECS 2009.
As demonstrated in Figure 3.4, above, caloric deprivation rates indicate that governorates suffering from
the lowest average per capita caloric intake are also suffering from the highest prevalence rates of caloric
deprivation among their populations (Assiut, Beni Suef, Giza, Menoufia, Fayoum, and Sohag). Table 3.2,
below, provides caloric requirements by age, sex and location.
Table 3.2: Caloric Requirements by Age, Sex and Location
Urban Rural
Age Group Males Females Males Females
<1 820 820 820 820
1—2 1150 1150 1150 1150
2—3 1350 1350 1350 1350
3—5 1550 1550 1550 1550
5—7 1850 1750 1850 1750
7—10 2100 1800 2100 1800
10—12 2200 1950 2200 1950
12—14 2400 2100 2400 2100
14—16 2600 2150 2600 2150
16—18 2850 2150 2850 2150
18—30 3150 2500 3500 2750
30—60 3050 2500 3400 2750
>60 2600 2200 2850 2450
The following discussion highlights the most prominent factors found to be significantly associated with
households challenged by caloric deprivation. This does not, however, purport to provide any conclusive
evidence of causal relationships among these factors. Rather, it offers indications and tendencies, which
could be used as targeting criteria for interventions.
As Figure 3.5 below shows; caloric deprivation is highly correlated with monetary and non-monetary
poverty. Nine persons out of 10 multi-dimensional poor are calorie-deprived and half of the income-poor
are also deprived from their minimum caloric needs. The education level of the household head is
negatively correlated with caloric deprivation but to a lesser extent. Moreover, male-headed households
are more likely to suffer from caloric deprivation than female-headed households (17 percent versus 9
0
5
10
15
20
25
30
35
40
45
50
Figure 3.1: Prevalence of Caloric Deprivation by Governorate Figure 3.4: Prevalence of Caloric Deprivation by Governorate, 2009
% of Population

World Food Programme (WFP) 11
percent, respectively), and one household out of every four households whose head is in casual
employment is likely to experience caloric deprivation. Households that have multiple income sources
are less likely to experience caloric deprivation compared to those with a single source (19.9 percent as
opposed to 23.6 percent, respectively).
Source: Calculated using data from HIECS 2009.
It is noteworthy that the investigation of food insecurity using caloric deprivation indicators is likely to
underestimate the intensity and spread of the phenomenon; the most vulnerable and highly insecure people
tend to increase their consumption of cheaper foods which in the case of Egypt happen to be key staples
and subsidized foods which have a high caloric content (baladi bread, rice, oil and sugar). Therefore,
households that have sufficient access to their caloric needs do not necessarily have access to a nutritious
and balanced dietary intake.
3.2 DIETARY DIVERSITY WITHIN FOOD GROUPS
Even if people are found to have sufficient access to dietary energy, they may not necessarily have
sufficient access to nutritious food. Evidence from other studies has demonstrated that a diet adequate in
terms of energy is not necessarily sufficiently diversified and healthy. Therefore, households that have
secure access to foods that satisfy their basic caloric needs may indeed consume diets lacking in sufficient
amounts of essential micronutrients such as iron, iodine, Vitamin A, zinc, and Folate.
The Food Consumption Score (FCS) is the standard tool used by WFP to reflect dietary diversity as well as
frequency of consumption and it is generally one of the most commonly used food consumption indicators.
This proxy indicator reflects dietary diversity, energy, and macro and micro (content) value of the food
people eat. The calculation of the FCS takes into consideration the number of food groups consumed by a
household over a reference period of seven days (dietary diversity); the number of days, a particular food
group is consumed (food frequency); and the relative nutritional importance of different food groups. Each
food group is allocated a score (weight) based on its nutrient density10
(see Table 3.3, below). The
maximum possible FCS is 112. The higher the FCS, the more diverse and nutritional is the diet.
Although the FCS is a simple tool that provides essential information on people‘s current dietary intake, it
has many shortcomings that prevent in-depth analysis of food consumption patterns:
10
Animal proteins, milk and eggs in the diet receive the highest score of 4; pulses receive a score of 3; cereals and
bread receive a score of 2; vegetables and fruits a score of 1; and, sugar/oils/fat/butter receive a score of 0.5. Sweets
and beverages are excluded.
0
20
40
60
80
100
on
e o
r tw
o
thre
e o
r fo
ur
five
or
six
seve
n t
o n
ine
mo
reth
an n
ine
No
ne
Bas
ic
Seco
nd
ary
Seco
nd
ary+
No
n p
oo
r
Po
or
No
n p
oo
r
Po
or 1
2
3
4
5
household size education of head Multi dimensional
poverty
Income poor Quintile of vulnerability index
Figure 3.2:Prevalence Caloric deprivation by some household characteristics Figure 3.5: Prevalence of Caloric Deprivation by Household Characteristics
%

22 World Food Programme (WFP)
It is based on a seven-day recall period only. This is insufficient for a full analysis of food
consumption over longer periods, which is likely to vary according to season, for example.
It provides no indication of the quantity of each foodstuff consumed.
It does not give information on intra-household food consumption, such as who eats first
and last.
It does not show how food consumption has changed as a result of the crisis, unless
previous food consumption scores for the same types of households are available.
In addition, data provided by HIECS 2009 cannot be used for calculating the FCS as defined by the WFP,
as according to WFP CSFVA Guidelines (2009), FCS requires reporting the frequency of daily
consumption for commodity groups over seven days. This information is not available in HIECS surveys,
which record total consumption of 195 food items over 15 days. Therefore, relying on the FCS as a proxy
indicator of access to food is not attainable using HIECS 2009.
Instead of using the FCS, the study of caloric deprivation was complemented with an investigation of
dietary diversity within food groups. Various empirical findings support the underlying argument that
diversity within and across food groups is correlated to per capita expenditure on food on one side and per
capita nutrient adequacy on the other. (Megan A McCrory et al. (1999), John Hoddinott & Yisehac
Yohannes (2002); LE Torheim et al (2004); Parvin Mirmiran et al (2006)).
This study used the number of food items that belong to a certain group and consumed during the 7
days recall period as a proxy for diet diversification. The assumption behind this is that the number
consumed from each commodity group during 7 days reflects the frequency of daily consumption of
this group, as households are likely to consume few items from each commodity group daily (e.g.
oranges and apples). This index has been termed ―Dietary Diversity within Food Groups‖. In other
words, the number of commodities consumed by a household within each commodity group is
counted, and then the weighted sum of these numbers is caluculated; these weights are tabulated in
Table 3.3, below. The assigned weights are in line with WFP methodology and guidelines for the
calculation of the food consumption score.
Table 3.3: Food Groups and Weights Used to Construct an Index for “Dietary Diversity Within
Food Groups”
Food Item Food Group Weight
Maize, Rice, Sorghum, Millet, Bread and Other Cereals Cereals, Tubers, and Roots 2
Cassava, Potatoes, and Sweet Potatoes
Beans, Peas, Groundnuts, and Cashew Nuts Pulses 3
Vegetables, Relish, and Leaves Vegetables 1
Fruits Fruit 1
Beef, Goat, Poultry, Pork, Eggs, and Fish Meat and fish 4
Milk, Yoghurt, and Other Dairy Milk 4
Sugar and Sugar Products Sugar 0.5
Oils, Fats, and Butter Oil 0.5
Source: Comprehensive Food Security and Vulnerability Analysis Guidelines WFP (2009)
Table 3.4 below, provides a number of statistics on food consumption and dietary diversity by governorate,
in urban and rural areas. Households were classified according to their dietary diversity score (DDS) into
three categories; poor, moderate, or high. The table shows that 33.3 percent of individuals (27 million
people) suffer poor dietary diversity, 59 percent are on border line and 7.7 percent have high diversity in
their food intake. The data shows that there are significant differences, in mean dietary diversity score

World Food Programme (WFP) 13
among governorates and between urban and rural areas within each governorate, where Sohag and Assiut
had the lowest scores in both urban and rural areas while Alexandria had the highest score.
Table 3.4: Dietary Diversity by Governorate (Percent of Population), 2009
Governorates Urban Rural Total
Poor Moderate High Poor Moderate High Poor Moderate High
Urban Governorates 16.16 64.07 19.73 16.16 64.07 19.73
Cairo 22.60 64.50 12.80 22.60 64.50 12.80
Alexandria 6.50 66.60 26.90 6.50 66.60 26.90
Port Said 15.80 55.10 29.10 15.80 55.10 29.10
Suez 10.60 63.50 25.90 10.60 63.50 25.90
Lower Egypt 23.07 69.00 7.94 24.96 70.10 6.95 24.39 69.90 5.70
Damietta 13.30 57.50 29.30 24.20 62.60 13.20 20.00 60.60 19.40
Dakahlia 19.60 71.90 8.50 13.20 77.70 9.20 14.90 76.10 9.00
Sharkia 18.40 78.40 3.20 19.50 74.70 5.80 19.20 75.60 5.20
Qualiobia 23.00 72.00 5.00 31.90 64.40 3.70 28.30 67.50 4.20
Kafr el Sheikh 28.20 65.00 6.80 24.70 73.70 1.60 25.40 72.00 2.60
Gharbeya 13.80 77.70 8.50 17.70 74.30 8.00 16.60 75.30 8.10
Menoufia 44.00 55.00 1.00 41.90 56.60 1.50 42.30 56.30 1.40
Beheira 40.00 59.00 1.00 31.70 67.70 0.50 33.30 66.10 0.60
Ismailia 15.50 63.70 20.80 18.60 72.00 9.40 17.30 68.40 14.30
Upper Egypt 48.82 45.69 5.48 51.04 43.61 5.34 50.36 31.71 5.41
Giza 50.60 44.60 4.80 68.90 26.70 4.40 58.50 36.90 4.60
Beni Suef 48.10 49.90 2.00 49.40 49.90 0.70 49.10 49.90 1.00
Fayoum 24.20 67.90 7.80 25.70 72.10 2.20 25.40 71.20 3.40
Menia 22.20 55.10 22.70 20.90 60.40 18.70 21.10 59.50 19.40
Assiut 64.30 34.80 0.80 82.10 17.70 0.20 77.70 21.90 0.40
Sohag 63.30 36.70 0.00 64.10 35.50 0.40 63.90 35.70 0.40
Qena 47.30 46.60 6.20 54.40 41.60 4.00 52.90 42.60 4.50
Aswan 54.70 41.20 4.10 51.90 45.00 3.10 53.10 43.40 3.50
Luxor 54.30 44.20 1.50 60.80 38.40 0.80 57.50 41.30 1.20
Frontier
Governorates* 37.94 52.49 9.54 43.05 53.62 3.37 39.16 53.17 7.66
All Egypt 28.10 60.50 11.50 37.00 58.00 5.00 33.30 59.00 7.70
Source: Calculated by authors using HIECS 2009. * Frontier governorates. HIECS coverage of frontier governorates in 2008/2009 is not sufficiently representative, and calculations
based on HIECS data for these governorates require further validation. Therefore, all indicators used for these governorates must
be regarded with high caution.
Disparities exist between urban and rural residents, where poor dietary diversity is far more
widespread in rural areas (37 percent of the population in rural areas suffer poor dietary diversity
compared to 28.1 percent in urban areas). Estimates reveal an urban-rural divide in dietary diversity,
with a strong tendency toward a considerably higher prevalence in rural areas; however, rural areas of
both Dakahlia and Kafr El Sheikh had lower prevalence of poor dietary diversity compared to their
urban counterparts. Moreover, while 11.5 percent of the population in urban areas have sufficiently
high diversity in their food intake, only 5 percent enjoy this diversity in rural areas.
Both the income poor and the multidimensional poor suffer from poor dietary diversity (Figure
3.6). As expected, income-poor households are the largest proportion of those classified as having

24 World Food Programme (WFP)
poor dietary diversity (58.7 percent), and they have the lowest percent of those with high diversity
levels (1.5 percent).
Source: Calculated using data from HIECS 2009.
Surprisingly, 23 percent of non-poor households suffer poor dietary diversity as well. Also, 60
percent of the most vulnerable persons suffer poor dietary diversity , as opposed to 18.6 percent of
the least vulnerable. These results suggest that low income levels are not the only correlate to poor
dietary intake. Lack of awareness of what constitutes an appropriate and nourishing diet is also an
important factor affecting dietary balance at the household level. As Figure 3.7 demonstrates, poor
dietary diversity is more prevalent in households whose heads have not received any education
(37.3%).
Source: Calculated using data from HIECS 2009.
Table 3.5 below demonstrates that household size is consistently positively correlated with the level of
caloric deprivation. While the prevalence rate is only 4 percent for households with one or two
members; it increases as household size increases to reach 32.6 percent for households with seven to
nine members, and 39 percent for households with more than nine members. However, as the size of
the household increases, dietary diversity of the household improves; nearly half of households with 1
to 2 members have poor dietary diversity while less than 30 percent of households with more than 9
members have poor dietary diversity. Male headed households tend to diversify their food
consumption more than female headed households as 33 percent of male headed households have poor
DDS versus 44.4 percent for female headed households. Households whose head is out of labour force
have lower likelihood to diversify their food, as 41 percent are classified in poor DDS category, so as
0%
50%
100%
Non poor Poor Non poor Poor
Multi dimensional poverty Income poor
Figure3.5: Food security classifications by Poverty Status
poor borderline acceptable
0%
20%
40%
60%
80%
100%
None Basic Secondary Secondary+
Figure3.4: Food security classifications by Education of head
poor borderline acceptable
Figure 3.6: Dietary Diversity Classification by Poverty Status
Figure 3.7: Dietary Diversity Classification by Education of HH Head

World Food Programme (WFP) 15
households whose head is casual worker. Also, households with only one income source are poorer
in terms of dietary diversity score.
Table 3.5: Food Access Indicators by Household Characteristics, 2009
Category
Prevalence of
Caloric
Deprivation, %
Daily per
capita Caloric
Intake
Share of DDS Categories
Poor Moderate High
Gender of the Household Head
Male 17.47 2730 33.51 58.78 7.70
Female 9.07 3177 44.44 50.45 5.11
Household Size
1 to 2 4.25 4292 47.65 47.99 4.36
3 to 4 10.73 3093 33.22 58.73 8.05
5 to 6 19.31 2677 31.28 60.68 8.05
7 to 9 32.56 2390 34.98 57.98 7.03
Over 9 39.19 2209 29.06 62.39 8.55
Education of Household Head
None 23.18 2763 37.35 57.23 5.43
Primary-Preparatory 21.08 2729 32.70 59.26 8.04
Secondary 16.65 2735 30.92 60.73 8.35
Secondary + 15.25 2956 23.14 62.68 14.18
Employment Status of Household Head
Wage Earner 18.09 2665 34.93 57.37 7.70
Employer 15.37 2827 28.06 63.84 8.10
Self-employed 14.92 2765 38.03 56.27 5.71
Unpaid Worker11
11.86 2842 33.33 65.00 1.67
Unemployed 18.46 2785 39.53 53.49 6.98
Out of Labour Force12
12.81 3084 41.64 51.91 6.44
Work Stability of Household Head
Permanent 16.18 2751 31.98 60.08 7.94
Temporary 17.26 2644 38.51 54.71 6.78
Seasonal 7.86 2711 38.57 58.57 2.86
Casual 24.63 2487 48.87 47.71 3.43
Economic Activity of Household Head
Non Agriculture 16.01 3084 34.82 57.17 8.01
Agriculture 16.28 2725 37.13 58.21 4.65
Multi-Dimensional Poverty
Non poor 10.71 2924 29.45 62.07 8.48
Poor 92.21 1734 62.01 36.35 1.65
Income Poverty
Non poor 12.23 2969 26.32 64.31 9.38
Poor 49.88 2107 58.69 39.82 1.49
Quintile of Vulnerability Index
1 52.21 2082 60.15 38.39 1.46
2 26.31 2477 38.62 57.39 3.99
3 13.48 3058 30.53 63.22 6.25
4 4.73 3144 22.08 67.09 10.83
5 6.47 3137 18.61 67.80 13.59
All Egypt 20.35 2783 33.30 59.03 7.68
Income Diversity
Single Income Source 23.55
29.26 59.71 11.50
Multiple Income
Sources 19.99
33.76 58.95 7.25
Source: Calculated by using HIECS 2009
11
Unpaid workers are those who work without any return, like interns and those working in family business. 12
Individuals out of labour force are those who belong to the age group of the labour force but willingly decide not to
work.

26 World Food Programme (WFP)
Generally, governorates in Upper Egypt have a higher prevalence of poor dietary diversity compared to
other regions, and as reflected by most of deprivation indices, Rural Upper Egypt is the most deprived
region. At the governorate level, and as indicated by Figure 3.8, below, more than three quarters of
Assiut‘s residents suffer poor dietary diversity. Assiut is followed by Sohag and Giza, also Menoufia and
Beheira have a high prevalence of poor dietary diversity, whereas Alexandria and Suez have the lowest
prevalence of poor dietary diversity among their residents.
Source: Calculated using data from HIECS 2009.
Figure 3.9, below, depicts the dietary diversity classification by vulnerability quintiles. Similar to results
from classification by income poverty, the first quintile (the most vulnerable population) has the widest
prevalence of poor dietary diversity.
Source: Calculated using data from HIECS 2009.
3.3 OVERALL ASSESSMENT OF ACCESS TO FOOD
Food Security assessments usually rely on proxy indicators of food consumption, studied against other
socioeconomic indicators that reflect the purchasing power of households before they can classify the
population into food security groups. Typically, the FCS is used by WFP as proxy indicator for food
consumption and in many cases indicators of income/poverty levels are used to reflect the purchasing power
0
10
20
30
40
50
60
70
80
0%
20%
40%
60%
80%
100%
1 2 3 4 5
Figure 3.6: Food security classifications by vulnerability Quintiles
poor borderline acceptable
Figure 3.8: Percent of Population with Poor Dietary Diversity in 2009
(Using Results from Dietary Diversity Score)
Figure 3.9: Dietary Diversity Classification by Vulnerability Quintiles
%
Vulnerability Quintile

World Food Programme (WFP) 17
of households. An overall assessment of the prevalence of high food insecurity across governorates was
developed in Map 1, below, using the overlay analysis technique.
Overlay analysis is the most common GIS technique used in urban and regional studies to derive new
information from two or more layers (maps) of data covering the same areas. The different layers are
combined by being ‗layered‘ over each to form a new map that provides new information using the
attributes of input maps. Overlay analysis ranks attribute values and then adds them to produce an overall
rank for each location. Map 1, below, overlays poor dietary diversity with high caloric deprivation and
income poverty, reflecting the distribution of population with high levels of food insecurity across Egypt‘s
governorates.
Map 1: The Prevalence of High Food Insecurity in Egypt, 2009
Map 1 classifies governorates according to five categories of food insecurity (Very Low, Low, Medium,
High and Very High), showing the prevalence of high levels of food insecurity across governorates. The
map demonstrates that the highly insecure population is concentrated in Upper Egypt, most critically in
Assiut, Sohag, Qena, Beni Suef and Giza. There are however, other governorates from Lower Egypt
(Beheira and Menoufia) that also have a significant prevalence of high food insecurity among their
populations and are classified in the second category of high food insecurity. It should be noted that South
Sinai, which is a relatively rich governorate, is classified as highly insecure (i.e. placed in the second
category), because of poor food consumption patterns practiced by the Bedouins in South Sinai, clearly
reflected in their caloric deprivation rates, poor dietary diversity and insufficient access to sources of iron
and Vitamin A. Cairo, which includes a mix of affluent areas, poor slums, middle-income neighbourhoods,
and accommodates a high percentage of internal migrants is classified as moderately food insecure, all
other urban governorates are classified as having low food insecurity (Suez, Port Said and Alexandria).

28 World Food Programme (WFP)
The cross tabulation of income poverty, caloric deprivation and dietary diversity shows that 42.4 percent of
the total population demonstrates poor food consumption, of which 16.3 percent are income poor and 26.1
percent are non-income poor. The coexistence of income poverty together with poor food consumption is
highest in governorates of Upper Egypt (58.2 percent in Assuit, 39.2 percent in Sohag and 36.1 percent in
Bani Suef) followed by Beheira and Menoufia in Lower Egypt, and lowest in Damietta, Suez and Port
Said. On the other hand, the percent of non-income poor demonstrating poor food consumption is highest
in Menoufia (45 percent), Giza (44.8 percent), Luxor (43.4 percent) and the Frontier Governorates (33.9
percent). Those that are income poor but have adequate food consumption represent a mere 5.3 percent of
the population while 52.3 percent of the population are neither poor nor suffering poor food consumption.
The results in Table 3.6 below indicate that Upper Egypt as a whole (and particularly Assiut, Sohag and
Beni Suef) together with Beheira and Menoufia require programs that focus on income generation,
sufficient food intake and nutritional awareness, while the focus in Frontier governorates and the rest of
Lower Egypt should be on nutritional awareness programs. A district level analysis would yield more
comprehensive results that would allow for sub-governorate interventions, and a more accurate assessment
of the food insecure.
Table 3.6: Cross Tabulation of Income Poverty and Food Consumption
Governorate
Income Poor
with Poor Food
Consumption
Non-Poor with
Poor Food
Consumption
Income Poor, with
Adequate Food
Consumption
Non-Poor, with
Adequate Food
Consumption
Cairo 6.62 28.00 1.00 64.38
Alexandria 4.01 17.32 2.40 76.27
Port Said 2.78 13.01 1.63 82.58
Suez 1.07 9.62 0.85 88.46
Damietta 0.87 19.11 0.23 79.79
Dakahlia 5.78 18.14 3.52 72.56
Sharkia 9.02 14.20 10.14 66.64
Qualiobia 6.37 29.31 4.96 59.37
Kafr el Sheikh 7.28 22.97 3.92 65.83
Gharbeya 5.16 21.76 2.48 70.61
Menoufia 16.13 44.99 1.80 37.08
Beheira 16.14 28.28 7.37 48.21
Ismailia 7.64 10.26 11.23 70.87
Giza 21.33 44.77 1.64 32.26
Beni Suef 36.06 25.57 5.38 32.99
Fayoum 19.69 23.79 9.01 47.51
Menia 18.80 15.11 12.12 53.96
Assiut 58.17 26.90 2.80 12.13
Sohag 39.19 29.82 8.36 22.63
Qena 28.78 29.17 10.24 31.81
Aswan 26.69 26.92 14.24 32.16
Luxor 15.18 43.42 3.20 38.20
Frontier
Governorates 5.95 33.91 5.14 55.00
All Egypt 16.31 26.13 5.25 52.31
Source: Calculated by authors using HIECS 2009.

World Food Programme (WFP) 19
3.4 SOURCES OF ENERGY AND AVAILABILITY OF DIETARY NUTRIENTS
This section complements the previous section on dietary diversity and presents an indicative analysis of the
main sources of dietary energy and essential nutrient elements as calculated from household consumption data
using the food composition tables for Egypt (National Nutrition Institute, May 2006) and compared to
international recommended nutrient intake guidelines (Dietary Guidelines for Americans, 2010). The results
provide a rough estimate of the available sources of energy and nutrients at the household level, however,
they do not assess or reflect the actual nutritional status of the population being surveyed, i.e. results do
not indicate the degree of iron deficiency anaemia or other macro or micronutrient deficiencies that
might be present within the surveyed households.
3.4.1 Sources of Energy
Food types were classified into the following groups based on their nutrient density: cereals and bread;
legumes; vegetables; fruits; animal proteins; milk and eggs; and sugar and oils. The share of energy
generated by each food group was subsequently calculated. Based on this classification, study results
indicate that people living in rural areas consume an undiversified diet and are at higher risk of
micronutrient deficiencies than people in urban areas. In addition to lower dietary energy content, diets
in rural areas are considerably less diversified than diets in urban areas, exposing consumers to a much
higher risk of micronutrient deficiencies. Residents of rural areas are more vulnerable to dietary energy
shortages, and accordingly, their diet is geared more towards satisfying their calorie needs. Rural diets
therefore contain more staple products and fewer vitamin- and mineral-rich foods such as vegetables and
fruits, meat, fish, and dairy products.
Table 3.7.a: Share of Food Groups to Total Energy Intake in Urban Areas, 2009
Governorates Cereals Tubers Pulses Vegetables Fruit Meat & Fish Milk Sugar Oil
Urban
Governorates 46.03 1.73 1.41 3.15 3.13 10.68 5.86 9.85 18.16
Cairo 46.28 1.75 1.49 3.03 2.95 10.35 4.99 9.94 19.22
Alexandria 45.58 1.65 1.15 3.63 3.73 11.79 7.23 8.87 16.36
Port Said 46.29 1.34 1.11 2.56 2.94 11.59 6.69 9.99 17.49
Suez 45.74 2.21 2.05 3.04 2.52 8.31 5.61 12.06 18.46
Lower Egypt 50.91 2.06 1.33 3.39 3.17 8.32 4.73 10.05 16.04
Damietta 54.55 1.39 2.06 2.63 3.29 9.43 5.83 8.57 12.25
Dakahlia 54.25 1.96 1.82 3.26 2.91 8.20 3.83 9.39 14.38
Sharkia 52.18 2.42 1.34 3.73 2.76 7.34 2.73 11.60 15.90
Qualiobia 48.24 2.02 1.02 3.39 3.25 9.70 3.74 9.31 19.32
Kafr el Sheikh 52.40 1.86 1.68 2.87 3.18 7.97 11.35 7.59 11.11
Gharbeya 45.64 2.07 1.46 3.85 4.03 9.27 4.10 10.95 18.64
Menoufia 52.96 2.09 0.96 3.50 2.97 8.84 3.20 9.62 15.86
Beheira 50.63 2.08 0.60 3.22 3.29 6.80 5.96 10.94 16.48
Ismailia 48.43 2.13 1.98 3.52 2.83 8.60 3.88 11.23 17.40
Upper Egypt 52.13 1.76 1.86 3.09 2.70 7.14 3.46 11.59 16.27
Giza 49.41 1.82 1.36 3.25 2.59 9.47 4.58 9.77 17.75
Beni Suef 53.14 1.63 1.13 3.12 2.03 8.88 3.61 11.20 15.25
Fayoum 55.69 1.65 1.72 3.09 2.94 6.55 2.87 10.05 15.44
Menia 47.85 1.72 1.94 3.03 3.21 6.96 3.27 13.22 18.81
Assiut 54.55 2.18 1.73 3.18 2.66 6.72 2.88 12.07 14.01
Sohag 56.82 1.37 1.77 3.06 2.79 5.54 2.75 12.05 13.84
Qena 52.42 1.86 3.24 3.07 2.51 5.70 3.45 12.79 14.95
Aswan 51.02 1.74 2.74 2.38 2.38 4.79 3.63 12.02 19.31
Luxor 49.69 2.18 1.65 3.62 3.31 6.28 2.78 14.70 15.78
Frontier
Governorates 49.02 1.96 2.70 3.52 4.35 8.48 4.23 10.61 15.13
Source: Calculated by authors using HIECS 2009.

30 World Food Programme (WFP)
The data shows that over half of the average diet (in caloric intake terms) in rural areas consists of calorie-dense
cereal products, with sugars and sweets comprising approximately 10 percent of the total calories consumed in
the average rural diet (and even slightly higher in the urban diet). A main reason for the high percentage is the
frequent consumption of sweetened tea. The average Egyptian diet, especially in rural areas, is poorly balanced
across food groups and is lacking in considerable quantities of vegetables and fruit. Tables 3.7.a and 3.7.b also
demonstrate that taken together, vegetables and fruit; milk and dairy; and meat and fish, account for a much
smaller share of the average urban /rural energy intake (about 18 percent) while cereals provide almost half of
total energy intake and oil together with sugar provide about 26 percent of total energy intake. The high
dependency on cereals, sugar and oil is easily explained by the components of the food subsidy system which
focuses on providing those three food types.
Table 3.7.b: Share of Food Groups to Total Energy Intake in Rural Areas, 2009
Governorates Cereals Tubers Pulses Vegetables Fruit
Meat
&
Fish
Milk Sugar Oil
Lower Egypt 54.10 2.09 1.59 3.35 2.80 7.40 3.57 9.94 15.17
Damietta 55.94 1.54 2.11 2.44 3.25 8.96 5.28 7.98 12.50
Dakahlia 54.80 2.05 1.91 3.36 2.75 7.79 3.52 9.35 14.46
Sharkia 53.00 2.30 2.04 3.41 2.27 6.52 2.80 11.40 16.26
Qualiobia 55.36 1.92 1.06 3.32 2.67 6.95 2.21 9.91 16.61
Kafr el Sheikh 59.26 1.91 1.99 3.07 3.18 7.46 4.23 7.71 11.18
Gharbeya 50.52 2.08 1.65 3.53 3.16 7.42 4.07 9.74 17.84
Menoufia 52.17 2.38 1.09 3.54 2.76 8.27 3.04 10.01 16.73
Beheira 54.92 2.08 0.92 3.34 2.98 6.85 4.56 10.84 13.50
Ismailia 49.38 2.05 2.53 3.54 2.50 9.39 3.93 10.73 15.94
Upper Egypt 55.77 1.54 2.03 2.89 2.35 6.02 2.96 11.41 15.02
Giza 56.76 1.58 0.94 3.05 2.27 6.97 2.85 9.21 16.36
Beni Suef 55.03 1.45 1.41 3.00 2.16 8.11 1.99 11.45 15.40
Fayoum 59.50 1.56 1.00 2.90 2.41 6.09 3.10 9.04 14.39
Menia 53.52 1.56 2.26 2.76 2.64 6.04 3.66 11.88 15.68
Assiut 54.93 1.95 2.74 3.26 2.54 5.74 2.24 12.30 14.31
Sohag 59.02 1.15 1.97 2.82 2.42 5.15 2.59 11.36 13.52
Qena 53.02 1.48 3.56 2.69 2.01 5.30 3.59 14.06 14.29
Aswan 53.95 1.60 2.55 2.30 1.80 4.33 3.72 12.11 17.63
Luxor 52.43 2.28 1.69 3.61 2.73 6.39 3.17 13.22 14.48
Frontier
Governorates 55.04 1.67 3.01 2.84 2.99 7.23 3.45 9.40 14.38
Source: Calculated by authors using HIECS 2009.
It is noteworthy that people derive most of their energy intake from cereals and much less from tubers
(1.9 percent) and pulses (1.7 percent) which are also rich in carbohydrates. Also, access to animal
sources of protein is relatively expensive and many tend to consume less protein than required. Taking
into consideration that pulses are rich in both proteins and carbohydrates, increasing household intake
of pulses could increase household access to proteins without sacrificing energy intake. The GoE
could support increased dietary diversity for a significant percentage of the population by revising the
food subsidy component to include pulses as one of the commodities covered by the Food Ration
Card. This suggestion has previously been made by the WFP (WFP Vam 2008, WFP Consumer
Profile Study 2009).

World Food Programme (WFP) 31
3.4.2 Indications of Deficiency in Key Nutrient Elements
The sufficiency of essential nutrient elements in household dietary intake refers to the main nutritious
elements in the foods available for consumption at the household level. The term ‗Nutrient Deficiency‘
indicates that the amount of nutrient elements in the foods consumed at the household level is below the
recommended level. Nutrient deficiency was estimated using the Dietary Guidelines for Americans (2010)
which provides the nutrient needs that should be met primarily through food consumption, and the Food
Composition Tables for Egypt (2006). The result is referred to as the ―deficiency‖ in nutrient elements,
which differs from deficiency rates that are derived from individual health/nutritional tests. Household
needs are estimated according to household age and gender composition, while the household intake of
macronutrients (protein, carbohydrates), minerals (iron, zinc) and vitamin A, is calculated based on the
quantity of food available for consumption and the food composition of each food item. Households that
do not meet their requirements from macronutrients, minerals and vitamin A are said to have a
―deficiency‖ in that nutrient item, i.e., an insufficient supply for dietary intake of that nutrient at the
household level. Protein deficiency, carbohydrate deficiency, iron deficiency, zinc deficiency and vitamin
A deficiency were all estimated using food quantity data from HIECS 2009 (Table 3.8).
Table 3.8: Percent of Population Suffering Nutrient Deficiency, 2009
Governorates Protein Deficiency Carbohydrate
Deficiency Iron Deficiency
Zinc
Deficiency
Vitamin A
Deficiency
Urban Governorates 5.80 6.52 21.42 25.61 16.05
Cairo 8.85 9.10 28.82 34.75 21.85
Alexandria 4.22 6.30 22.33 26.56 14.83
Port Said 0.19 0.19 1.58 0.91 4.97
Suez 0.09 0.05 0.24 0.09 0.47
Lower Egypt 2.15 0.79 13.68 14.98 20.85
Damietta 0.51 0.15 3.32 2.55 13.84
Dakahlia 1.51 0.00 13.91 14.23 32.07
Sharkia 0.90 0.28 10.04 13.36 11.94
Qualiobia 5.95 2.30 22.49 28.46 19.10
Kafr el Sheikh 0.79 0.15 10.92 8.24 24.87
Gharbeya 1.88 0.50 9.78 11.13 13.74
Menoufia 4.41 2.65 23.32 23.94 31.07
Beheira 1.16 0.55 14.36 13.77 25.15
Ismailia 0.24 0.00 1.73 2.60 2.70
Upper Egypt 10.67 10.09 28.06 29.24 36.44
Giza 22.64 22.99 46.45 49.87 40.30
Beni Suef 8.29 9.54 28.69 32.50 30.11
Fayoum 3.15 5.70 22.89 18.34 35.54
Menia 6.88 5.81 22.39 27.18 20.70
Assiut 17.29 16.44 39.95 41.09 59.12
Sohag 7.60 4.27 21.92 16.95 44.25
Qena 3.02 1.03 17.33 9.48 35.80
Aswan 2.36 1.26 17.33 15.69 16.99
Luxor 2.35 0.97 12.78 12.61 19.47
Frontier
Governorates 0.69 1.93 6.88 7.51 10.40
Total 6.24 5.58 21.63 23.03 26.50

32 World Food Programme (WFP)
* HIECS 2009 coverage of frontier governorates
is not sufficiently representative. Calculations
based on HIECS data for these governorates
requires further validation. Therefore, all
indicators used for these governorates must be
regarded with high caution.
The results indicate that at the national
level, 6.2 percent of the population do
not have sufficient access to protein,
and 5.6 percent are deficient in
carbohydrates. The corresponding
rates for iron, zinc and vitamin A are
21.6 percent, 23 percent, and 26.5
percent respectively. However, wide
disparities exist between regions and
governorates (see maps in Annex 3).
Governorates in Upper Egypt have a
higher prevalence of nutrient
deficiencies in general, most notably
in Giza and Assiut. Nearly one half of
Giza‘s population have insufficient
access to sources of iron and zinc, 40
percent lack sufficient access to
vitamin A and nearly 23 percent lack
sufficient access to sources of protein
and carbohydrates. The situation in
Assiut is not very different from Giza,
except for deficiency in vitamin A,
which reached 59 percent in Assiut.
Also, a significant percentage of
residents in Cairo, Qualiobia and
Alexandria have insufficient access to sources of iron, zinc and vitamin A. On the other hand, Canal
governorates of Suez, Port Said and Ismailia have the lowest rate of nutrient deficiency among their
populations.
As demonstrated in Table 3.9, household size is consistently positively correlated with all nutrient
deficiency indicators. For instance, the protein deficiency rate is only 3 percent for households with
one or two members; it increases as household size increases to reach almost 10 percent for
households with seven or more members. Furthermore, the educational attainment level of the head of
household is negatively correlated with nutrient deficiencies, but to a lesser extent.
The data also demonstrates that male-headed households are more likely to suffer from nutrient
deficiencies than female-headed households (for example, the vitamin A deficiency rate is 22.6
percent for male-headed households compared to 14.9 percent among female-headed households).
Contrary to poverty measures, households whose head works in agriculture are less likely to
experience nutrient deficiencies compared to other households, with the exception of vitamin A
deficiency.
Table 3.10, below, demonstrates that nutrient deficiency is highly correlated with both monetary and
non-monetary poverty. At 28.8 percent, the protein deficiency rate for the ultra poor is approximately
5 times the national rate, and 7 times the rate for the non-poor (4.6 percent). Similarly, the prevalence
rate for protein deficiency among the multi-dimensional poor is nine times that of the non poor (28
percent versus 3 percent, respectively).
Table 3.9: Nutrient Deficiency Rate by HH Characteristics,
2009 Gender of
the
Household
Head
Nutrient Deficiency Rate
Protein Carbohydrate Iron Zinc
Vitamin
A
Male 5.55 4.99 18.89 21.31 22.58
Female 4.14 2.88 14.22 13.06 14.87
Size of Household
1 to 2 3.28 1.28 5.38 8.19 7.81
3 to 4 3.55 3.21 14.07 15.56 13.96
5 to 6 5.98 5.91 22.17 24.96 24.93
7 to 9 9.68 8.47 30.02 30.12 41.26
Over 9 9.98 7.20 32.23 29.02 48.94
Educational Status of Household of Head
None 6.06 4.45 18.67 20.69 25.71
Primary-
Preparatory 6.33 5.66 21.14 23.70 21.68
Secondary 4.18 4.31 17.40 18.34 16.83
Secondary+ 3.87 4.97 15.37 17.31 13.49
Economic Activity of Household Head
Non-
Agriculture 5.94 5.27 19.79 22.17 20.55
Agriculture 3.06 2.37 12.12 11.97 23.96

World Food Programme (WFP) 33
Table 3.10: Nutrient Deficiency Rate by Different Deprivation Indicators
Protein
Deficiency
Carbohydrate
Deficiency
Iron
Deficiency
Zinc
Deficiency
Vitamin A
Deficiency Multi Dimensional Poverty
Non Poor 3.32 2.72 16.59 17.63 20.79
Poor 28.02 26.90 59.22 63.25 69.06
Income Poor
Non Poor 3.17 3.27 15.05 16.80 17.35
Poor 17.43 14.00 45.57 45.69 59.79
Extreme Income Poor
Non Poor 4.61 4.49 18.61 20.28 22.72
Poor 28.81 20.70 63.34 61.02 78.72
DDS
Poor 14.55 12.39 36.61 37.93 43.05
Moderate 2.32 2.36 15.15 16.56 19.84
High 0.33 0.82 6.44 8.09 5.94
Caloric Deprivation
Don’t Suffer 2.32 1.60 13.35 14.05 17.38
Suffer 21.59 21.18 54.03 58.16 62.21
All Egypt 6.24 5.58 21.63 23.03 26.50
Furthermore, as Table 3.10 demonstrates, food security indicators are highly correlated to each other,
individuals suffering from poor dietary diversity and high caloric deprivation are the most likely to suffer
nutrient deficiency and the poor are clearly more deprived in terms food security indicators than the non
poor.
Economic access to food continues to be the most significant food security concern. At the regional
level, indicators used to assess the status of food insecurity are consistent in showing a biased divide
towards rural areas and Upper Egypt. The quantitative deficiency in caloric intake is notable (20
percent of the total population) however, the deficiency in dietary diversity is even more compelling
(33 percent of the total population). At the governorate level, Assiut demonstrates the worst standards
in terms of both the sufficiency and diversity of dietary intake and is estimated to be the second most
deprived governorate in sources of iron, zinc and protein, and the most deprived in vitamin A.
The analysis indicates that there is a strong positive correlation between proxy indicators of food
insecurity and both monetary and non-monetary poverty levels; as well as between food insecurity
indicators and household size. At the same time, multiple sources of income and educational level are
negatively correlated to indicators of food insecurity. Results show that casual labourers are more
exposed to the risks of food insecurity than others, and workers in the agricultural sector are slightly
more inclined to be food insecure than others.
One of the most significant threats to household access to food is persistent inflation in domestic
prices of food. In fact, food prices largely explain the food consumption patterns for the poor and near
poor in Egypt. In section 5 we present a brief review of the impact of price shocks on the consumption
patterns of the poor between 2008 and 2009.

34 World Food Programme (WFP)
CHAPTER FOUR: MALNUTRITION AMONG CHILDREN AND YOUTH
Key Messages:
Malnutrition indicators for children under 5 and youth show that the most pressing and
prevalent form of malnutrition among children in Egypt is stunting while overweight is the
most prevalent form of malnutrition among youth.
The prevalence of malnutrition for children below five years of age across
governorates and regions suggests that the nutritional status of children in Egypt is
not directly related to food access indicators and it is not significantly correlated to
the socioeconomic characteristics of the household and is possibly explained by
other factors, such as the availability of health services, clean water and sanitation.
Malnutrition among youth appears more related to the socioeconomic characteristics
of the household and is more consistent with food access indicators.
The incidence of both chronic and short-term malnutrition among Egyptian children
under the age of 5 has increased over time.
There is no significant difference in food utilization between under-fives in urban
areas compared to those in rural areas.
Male children are more likely to suffer from stunting than female children.
The utilization of food amongst children under five years of age is not significantly
correlated to the economic status of the household, or to maternal educational level.
Further in-depth investigation of the prevalence and causes of malnutrition among children
is still needed as the EDHS 2008 did not empirically explain causal factors of malnutrition
among children.
The percent of overweight and obese youth increased in proportion to the
educational level of the mother.
While malnutrition levels are for the most part equivalent, female youth are more
likely to suffer from the risks of overweight and obesity than male youth, and youth
in the wealthiest quintile are most likely to suffer from obesity.
Marked discrepancies are observed in the nutritional status of youth between
governorates.

World Food Programme (WFP) 35
4 MALNUTRITION AMONG CHILDREN AND YOUTH
The third essential pillar of food security analysis is ‗utilization‘, which refers to household use of the food
it has access to, as well as the individual‘s ability to absorb and metabolize nutrients. This type of analysis
also addresses the ways in which foods are stored and processed; feeding practices; food sharing within the
household; and the health status of household members, reflected in nutrition indicators (EFSA Guidelines,
WFP 2009).
Data from HIECS 2009 lacks direct information on malnutrition; therefore, this study uses data from Egypt
DHS 2008 for nutrition indicators related to children below the age of five and youth between 10 to 19
years of age13
. Given that this section builds its analysis on a sample that is different from that of HIECS
2009, it is not possible to use nutrition data from DHS 2008 in assessing the causality between
malnutrition indicators and household profiles or other access indicators of the household. Accordingly,
this review only compares the main nutritional outcomes to the assessed status of food security across
regions and governorates.
The prevalence of malnutrition for children below five years of age across governorates and regions
suggests that the nutritional status of children in Egypt is not directly related to food access indicators and it is not significantly related to the socioeconomic characteristics of the household and is possibly
explained by other factors, such as the availability of health services, clean water and sanitation.
Nevertheless, the Egypt DHS 2008 report suggests that the general deterioration in child nutrition may be
related to ―the abrupt disruption in the supplies of poultry and eggs that followed the culling of millions of
chickens and other poultry in response to the avian influenza outbreak Egypt experienced in 2006‖.
Malnutrition among youth, on the other hand, seems more related to the socioeconomic characteristics
of the household and is therefore more consistent with food access indicators. Generally, the deterioration
in malnutrition in Egypt is a critical issue that has not been adequately explained to date. Further
investigation is required, especially in Frontier governorates, for which the data sample was excessively
small.
4.1 THE NUTRITIONAL STATUS OF CHILDREN UNDER 5 YEARS OF AGE
To acknowledge the important role of children in societal and economic development, account for their
high vulnerability to food shortages and adverse health conditions, and focus attention on the population
group most in need of care and potential intervention, this study complements the analysis of food intake
and household economic access to food with the analysis of the nutritional status of infants and young
children. Analyzing child nutrition may also yield critical information about intra-household food
distribution and the risk of food insecurity among other vulnerable household members, considering that -
according to the food security definition given earlier - a household is food secure only when all its
members are secure.
Nutritional status is a primary determinant of health and well-being for both children and youth.
Malnutrition and stunting in early childhood can lead to life-long learning difficulties and poor health
which affect both educational attainment and the potential for future development. Poor nutrition occurs
both in developing and developed countries. Not only are as many as 800 million persons worldwide are
affected by malnutrition, but also more than half of all childhood deaths in developing countries are related
to malnutrition. Malnutrition is not only caused by lack of food, but also may occur as a result of illness,
and young children who experience diarrhoea or dysentery are liable to lose weight in the short term.
Malnutrition caused by lack of food or ill health, is unequivocally linked to poverty (Osmani 1992;
Svedberg 2000). Thus malnutrition may be the outcome of many risk factors for children: it can be the
consequence of income poverty, lack of food or of food that is contaminated, poor living conditions,
inadequate health services, water and sanitation deprivation, or a combination of these elements.
13 Results from Egypt DHS 2008 demonstrate a standard error of between 3-5 % for regional data. The Standard Error increases at
the governorate level, however ir remains with the acceptable range.

36 World Food Programme (WFP)
Standard Indices of Physical Growth
Stunting: the height for age index, and
it is a result of a failure to receive
adequate nutrition over a long period of
time or the effect of chronic illness.
Wasting: the weight for height index,
and it is the result of a failure to receive
adequate nutrition during the period
immediately before the survey or acute
food shortage.
Underweight: the weight for age index,
and it is a composite index of stunting
and wasting.
4.1.1 Measuring Children’s Nutritional Status
The anthropometric measurements obtained in the EDHS
2008 for children less than five years of age were used to
construct the three standard indices of physical growth:
stunting, wasting and underweight.
Low height for age indicates stunting (insufficient height
relative to age) and implies long-term malnutrition and
poor health. Stunting reflects a process of failure to reach
linear growth potential as a result of suboptimal nutritional
conditions, health conditions, or both. However, this
indicator fails to differentiate between a deficit associated
with a past event and one associated with a long-term,
continuing process. Low weight for height describes
wasting and implies recent or continuing current severe
weight loss. Wasting which means gaining insufficient
weight relative to height or losing weight, is usually a
consequence of acute starvation, severe disease, or both
(WHO 1995).
Figure 4.1: Malnutrition in Children (Under 5 years of Age), by Region, 2008
Source: Calculated using data from EDHS 2008.
0.0
5.0
10.0
15.0
20.0
25.0
12.0
21.2 18.2
8.8 9.7
15.0
0.0
1.0
2.0
3.0
4.0
5.0 4.1
2.8 3.4
2.8 2.7 3.3
0.0
0.2
0.4
0.6
0.8
1.0
1.2
1.4
1.6
Urban gov.
Urban Lower
Rural Lower
Urban Upper
Rural Upper
Frontier gov.
1.4 1.5
1.2
1.4
1.1
0.7
a. Percentage of Severe Stunting in Children b. Percentage of Severe Wasting in Children
c. Percentage of Severe Underweight in Children
% %
%

World Food Programme (WFP) 37
Children whose measures (height for age, weight for height and weight for age) are below minus three
standard deviations (-3 SD) from the median of the reference population are considered severely
stunted or severely wasted or severely underweight, respectively. EDHS 2008 data shows that 14
percent of children less than 5 years of age are severely stunted, and 3.2 percent are severely wasted,
while 1.3 percent are severely underweight. Looking at the variation with children's characteristics,
the data shows that there are no significant differences between children living in urban and rural
areas. However, great disparities are observed between regions, where children in the urban areas of
Lower Egypt were most likely to suffer from chronic malnutrition (21.2 percent are severely stunted)
compared to those in urban Upper Egypt (9 percent). The prevalence of wasting and underweight are
far less worrying, and the data shows that children in urban governorates suffer the most from short
term malnutrition (4.1 percent are severely wasted) as shown in Figure 4.1.
Results indicate that male children are more likely to suffer from stunting than female children (16
percent stunting for males, as opposed to 12 percent stunting for females). Considering the wealth
status of children and its effect on their nutritional level, EDHS 2008 data shows that no great
differences are observed according to wealth status. However, the wealthiest children are somewhat
more likely to suffer from chronic malnutrition, where 15 percent of children less than 5 years of age
in the wealthiest quintile are stunted children, compared to 13 percent among those in the first
quintile. These figures reached 3 percent and 4 percent respectively for wasted children. Surprisingly,
the educational attainment level of mothers has no significant impact on the nutritional status of
children.
Figure 4.2: Severe Stunting Rates for Children (Under 5 years of age) by Governorate, 2008
Source: Calculated using data from EDHS 2008.
Figure 4.2 and Table 4.1 demonstrate that Qualiobia (Kalyubia) has the highest rate of severe stunting,
while Fayoum has the lowest. Investigating the differences between governorates, the results show that
Fayoum governorate has lowest rate of stunted children (4.4 percent) followed by Suez and Luxor.
Alternatively, the governorates with the highest stunting rate are those in Lower Egypt (Qualiobia, Sharkia
and Damietta). It is noteworthy that despite the fact that Fayoum has the lowest rate of stunting for
children, it demonstrates a high rate of wasting in children. Finally, the majority of governorates in Lower
Egypt demonstrate low rates of wasting in children and high rates of stunting.
0.0
5.0
10.0
15.0
20.0
25.0
30.0
35.0
40.0
45.0
%

38 World Food Programme (WFP)
Table 4.1: Percentage of Children (Under 5 years of age) Suffering from Severe Stunting,
Wasting or Underweight in 2008
Governorates Severe Stunting
(Height for Age)
Severe Wasting
(Weight for Height)
Severe Underweight
(Weight for Age)
Urban Governorates 12.0 4.1 1.4
Cairo 14.2 5.8 1.6
Alexandria 6.8 1.2 0.8
Port Said 28.4 3.0 1.5
Suez 4.9 3.7 0.0
Lower Egypt 18.8 3.2 1.3
Damietta 29.7 1.4 0.7
Dakahlia 13.7 0.5 0.5
Sharkia 32.4 1.4 1.1
Qualiobia 41.6 0.2 0.0
Kafr El-Sheikh 10.3 11.2 5.7
Gharbeya 13.6 0.0 0.2
Menoufia 8.8 0.2 0.0
Beheira 7.2 11.9 3.2
Ismailia 6.2 2.3 0.0
Upper Egypt 9.5 2.8 1.2
Giza 8.7 1.5 2.0
Beni Suef 8.3 0.8 0.3
Fayoum 4.4 8.9 0.6
Menia 8.3 4.0 2.0
Assiut 11.5 2.2 1.0
Sohag 10.1 0.9 0.6
Qena 14.8 2.5 0.6
Aswan 9.9 4.2 2.1
Luxor 6.0 0.0 0.0
Frontier Governorates 15.0 3.3 0.7
Total 14.0 3.2 1.3
Source: Calculated by authors using EDHS 2008.
The incidence of both chronic and short-term malnutrition among Egyptian children under the age of 5
has increased over time. Data on the nutritional status of young children presented in the 2005 and 2008
EDHS show chronic malnutrition is notably prevalent amongst Egyptian children, while other indicators of
short-term malnutrition are less worrying. The prevalence of stunting in children increased from 6 percent
in 2005 to 14 percent in 200814
.
4.1.2 The Malnutrition Index for Children (Under 5 years of age) in 2008
In order to develop a Malnutrition Index representing the utilization of food among children less than five
years of age, data on the nutritional status (severe stunting, severe wasting and underweight rates) of these
children is combined. This index identifies whether children suffer from any kind of chronic or short-term
malnutrition, or both; or stunting, wasting, or being underweight. Using this index, the data demonstrates
no significant difference in food utilization between under-fives in urban areas compared to those in rural
areas, as the average percentage of malnourished children is approximately 17 percent for both areas. The
14
Egypt DHS used the new growth curves developed by WHO for 2008; this partially explains the significant change
in nutrition indicators between 2005 and 2008.

World Food Programme (WFP) 39
governorates demonstrating the worst utilization of food are located in Lower Egypt, as shown in Figure 4.3,
below. While malnutrition is the least in both urban and rural Upper Egypt, Figure 4.3 shows that nearly one
quarter of children under five in urban Lower Egypt (24 percent) suffered from malnutrition, compared to only
11 percent among children in urban Upper Egypt.
Figure 4.3: Malnutrition Index Results: Percentage of Children Under 5 Suffering from
Malnutrition (Severe Stunting, Wasting or Underweight), 2008
Source: Calculated using data from EDHS 2008.
With regards to disparities between governorates, the results of the malnutrition index for 2008 show that the
governorates of Luxor and Suez demonstrate the best utilization of food among children in 2008, followed by
Ismailia and Alexandria (see Figure 4.4, below). This result is not surprising, given that these governorates also
demonstrate the lowest stunting rates in children under five years of age, as well as the lowest rates of wasting
and underweight. Table 4.2 provides the Malnutrition Index for Children Under 5, by region.
Figure 4.4: Malnutrition Index Values: Percentage of Children (Under-5 Years of Age) Suffering
from Severe Stunting, Wasting or Underweight, by Governorate, 2008
Source: Calculated using data from EDHS 2008. Note: The sample size for the Frontier governorates was very small, accordingly, their results are not taken as
conclusive.
0
5
10
15
20
25
Urb
an
gov.
Urb
an
Low
er
Ru
ral
Low
er
Urb
an
Up
pe
r
Ru
ral
Up
pe
r
Fro
nti
er
gov.
Urb
an
Ru
ral
15.3
23.7 20.9
11.3 12.4
18.0 16.4 16.9
0
5
10
15
20
25
30
35
40
45
%
%

40 World Food Programme (WFP)
On the other hand, Damietta, Sharkia, Qualiobia, and
Port Said have the highest malnutrition scores, and
demonstrate the worst utilization of food among
children in 2008. Against expectations, Upper Egypt
governorates performed better than urban
governorates and Lower Egypt, Table 4.3 shows that
Beni Suef, Giza, Sohag, Menia, Fayoum and Assiut
demonstrate lower malnutrition scores than
governorates in Lower Egypt and Cairo. These
results highly contradict the results of income
poverty and food consumption indicators; we
therefore recommend further investigation of stunting
rates in children (under 5), which will be measured in
Phase II of this study using anthropometric data
collected in HIECS 2011.
Table 4.3 Governorates Ranked by their Malnutrition Index for Children (Under 5 Years), 2008
Governorate Rank in 2008
Cairo 17
Alexandria 3
Port Said 19
Suez 1
Damietta 20
Dakahlia 12
Sharkia 21
Qualiobia 22
Kafr El-Sheikh 18
Gharbeya 9
Menoufia 5
Beheira 16
Ismailia 2
Giza 6
Beni Suef 4
Fayoum 10
Menia 8
Assiut 11
Sohag 7
Qena 14
Aswan 13
Frontier Governorates 15 Source: Calculated by authors using EDHS 2008.
The utilization of food amongst children less than five years of age is not significantly related to the
economic status of the household (see Figure 4.5, below). Although malnutrition is slightly lower
among the poorest quintiles than the richest quintiles, it is lowest for the middle quintile. Data
presented in Figure 4.5 shows that the percentage of children who suffered from severe stunting or
wasting or underweight in the poorest quintile reached 16 percent, which is less than the average,
while this percentage increased to almost 18 percent amongst those in the highest quintiles, while the
middle quintile recorded 15.4 percent.
Table 4.2: Malnutrition Index for Children
Under 5 Years, by Region, 2008
Region Malnutrition
Scores*
Urban Governorates 15.3 Urban Lower 23.7 Rural Lower 20.9 Urban Upper 11.3 Rural Upper 12.4 Frontier governorates 18.0 Total Egypt 16.7 Source: Calculated by authors using EDHS 2008. *The
utilization score reflects the gap in nutritional status
among children, thus higher scores indicate higher levels
of malnutrition among children.

World Food Programme (WFP) 11
Figure 4.5: Children’s Malnutrition Index: Children (Under 5) Suffering Severe Stunting, Wasting
or Underweight by Economic Status, 2008
Source: Calculated using data from EDHS 2008.
The maternal educational level does not affect the utilization of food among children under five years of
age, with the data demonstrating that regardless of the mother‘s educational level, the percentage of
malnourished children is around the national level. Household size also does not appear to have any impact
on the utilization of food among children.
4.2 THE NUTRITIONAL STATUS OF YOUTH (10 TO 19 YEARS OF AGE)
Data on height and weight measurements for male and female youth between the ages of 10 and 19 were
collected by EDHS 2008. The Body Mass Index (BMI) was then calculated using these measurements, and
the results were evaluated using the age and sex-specific BMI growth charts. Youth whose BMI values are
between the 85th and 95
th percentile are at risk for overweight; those above the 95
th percentile are
overweight or obese; and those whose values are below the 5th percentile are underweight.
Table 4.4 shows that the most prevalent form of malnutrition among youth is overweight (17.2
percent) while the prevalence of obesity and underweight are of less concern (5.4 percent and 3.8
percent respectively). From a gender-sensitive perspective, female youth are more likely to suffer
from the risks of overweight and obesity than male youth, and are less likely to suffer from
underweight. Data from the EDHS 2008 shows that 20 percent of female youth aged between 10 and
19 suffer from the risk of overweight, while this percentage decreased to 15 percent among male
youth. On the other hand, 2.5 percent of female youth suffered from underweight, while this
percentage increased to 5 percent among male youth.
Figure 4.6, below, shows that male youth in both the urban and rural areas of Upper Egypt and
Frontier governorates are more likely to suffer from underweight than those in other regions. On the
other hand, the prevalence of overweight reached its highest value among male youth in Lower Egypt
and urban governorates. The prevalence of malnutrition among female youth mirrors their male
counterparts.
14.0
14.5
15.0
15.5
16.0
16.5
17.0
17.5
18.0
Poorest Poorer Middle Richer Richest Total
16.0
17.0
15.4
17.5 17.7
16.7
%
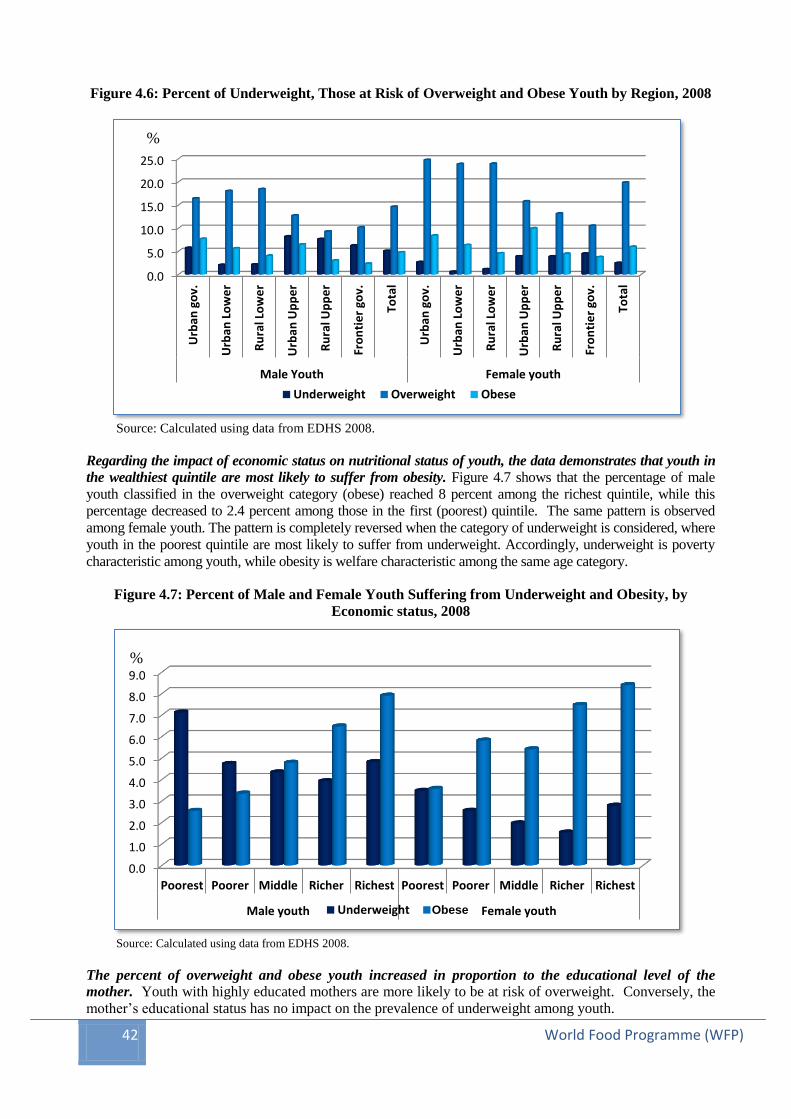
42 World Food Programme (WFP)
Figure 4.6: Percent of Underweight, Those at Risk of Overweight and Obese Youth by Region, 2008
Source: Calculated using data from EDHS 2008.
Regarding the impact of economic status on nutritional status of youth, the data demonstrates that youth in
the wealthiest quintile are most likely to suffer from obesity. Figure 4.7 shows that the percentage of male
youth classified in the overweight category (obese) reached 8 percent among the richest quintile, while this
percentage decreased to 2.4 percent among those in the first (poorest) quintile. The same pattern is observed
among female youth. The pattern is completely reversed when the category of underweight is considered, where
youth in the poorest quintile are most likely to suffer from underweight. Accordingly, underweight is poverty
characteristic among youth, while obesity is welfare characteristic among the same age category.
Figure 4.7: Percent of Male and Female Youth Suffering from Underweight and Obesity, by
Economic status, 2008
Source: Calculated using data from EDHS 2008.
The percent of overweight and obese youth increased in proportion to the educational level of the
mother. Youth with highly educated mothers are more likely to be at risk of overweight. Conversely, the
mother‘s educational status has no impact on the prevalence of underweight among youth.
0.0
5.0
10.0
15.0
20.0
25.0
Urb
an g
ov.
Urb
an L
ow
er
Ru
ral L
ow
er
Urb
an U
pp
er
Ru
ral U
pp
er
Fro
nti
er
gov.
Tota
l
Urb
an g
ov.
Urb
an L
ow
er
Ru
ral L
ow
er
Urb
an U
pp
er
Ru
ral U
pp
er
Fro
nti
er
gov.
Tota
l
Male Youth Female youth
Underweight Overweight Obese
0.0
1.0
2.0
3.0
4.0
5.0
6.0
7.0
8.0
9.0
Poorest Poorer Middle Richer Richest Poorest Poorer Middle Richer Richest
Male youth Female youth Underweight Obeise Obese
%
%

World Food Programme (WFP) 13
Marked discrepancies are observed in the nutritional status of youth between governorates. Table 4.4,
and Figures 4.8 and 4.9 below show that underweight represents less than 2 percent of youth in Lower
Egypt, moving up to almost 6 percent in Upper Egypt, and peaking at 11.5 percent in Fayoum.
Table 4.4: Percent of Underweight, at Risk of Overweight and Obese Youth by Governorate, 2008
Governorate Underweight Overweight Obese
Urban Governorates 4.2 20.5 8.1
Cairo 5.8 20.7 8.2
Alexandria 1.8 15.3 7.9
Port Said 0.9 43.5 13.9
Suez 2.0 31.8 2.7
Lower Egypt 1.6 21.1 4.8
Damietta 0.0 46.3 12.7
Dakahlia 0.4 21.9 6.6
Sharkia 1.5 23.9 2.6
Qualiobia 0.6 20.6 4.1
Kafr El-Sheikh 4.0 17.6 3.5
Gharbeya 0.7 27.1 5.0
Menoufia 2.4 13.9 6.0
Beheira 2.1 18.2 4.4
Ismailia 1.3 13.4 4.2
Upper Egypt 5.9 12.1 5.0
Giza 4.3 15.7 8.7
Beni Suef 2.5 12.4 4.3
Fayoum 11.5 6.7 1.6
Menia 6.7 10.4 3.0
Assiut 7.5 9.6 5.4
Sohag 4.8 11.8 4.2
Qena 5.8 13.3 5.4
Aswan 3.4 18.5 4.8
Luxor 6.5 11.8 3.2
Frontier Governorates 5.4 10.3 3.1
Total 3.8 17.2 5.4
Source: Calculated using data from EDHS 2008.

44 World Food Programme (WFP)
Figure 4.8: Percent of Underweight Youth by Governorate, 2008
Source: Calculated using data from EDHS 2008.
Figure 4.9: Percent of Obese Youth by Governorate, 2008
Source: Calculated using data from EDHS 2008.
Regarding trends in the nutritional status of youth between 2005 and 2008, the EDHS data shows that
there is a slight improvement in the numbers of youth at risk of overweight or obesity between 2005
and 2008. Almost 19 percent of youth were at risk of overweight in 2005, while this percentage
decreased to 17 percent among youth in 2008. These percentages reached 7 percent and 5 percent
respectively for the risk of obesity. However, the percentage of underweight among youth increased
by slightly more than one percentage point during the observed period.
4.2.1 Development of the Malnutrition Index for Youth
In order to develop a Malnutrition Index representing the utilization of food among youth between 10 and
19 years of age, data on the malnutrition status (i.e., underweight, risk of overweight and obesity) of youth
was combined. Table 4.5, below, shows that the prevalence of malnutrition among youth is highest in
Damietta and Port Said, followed by Suez and Cairo. On the other hand, malnutrition among youth was the
lowest in Ismailia, Beni Suef and Fayoum.
0.0
2.0
4.0
6.0
8.0
10.0
12.0 D
amie
tta
Dak
ahlia
Kal
yub
ia
Gh
arb
ia
Po
rt S
aid
Ism
ailia
Shar
kia
Ale
xan
dri
a
Sue
z
Be
he
ra
Me
no
ufi
a
Be
ni S
ue
f
Asw
an
Kaf
r El
-Sh
eik
h
Giz
a
Sou
hag
Qe
na
Cai
ro
Mat
roh
Luxo
r
Me
nya
Ass
uit
Fayo
um
Tota
l 0.0
2.0
4.0
6.0
8.0
10.0
12.0
14.0
Fayo
um
Mat
roh
Shar
kia
Sue
z
Me
nya
Luxo
r
Kaf
r El
-Sh
eik
h
Kal
yub
ia
Sou
hag
Ism
ailia
Be
ni S
ue
f
Be
he
ra
Asw
an
Gh
arb
ia
Ass
uit
Qe
na
Me
no
ufi
a
Dak
ahlia
Ale
xan
dri
a
Cai
ro
Giz
a
Dam
iett
a
Po
rt S
aid
Tota
l
%
%

World Food Programme (WFP) 15
Table 4.5: Percent of Malnourished Youth (Underweight, at Risk of Overweight or Obesity), by
Governorate, 2008
Governorate Malnutrition Index
Cairo 34.8
Alexandria 24.8
Port Said 57.9
Suez 36.9
Damietta 59.0
Dakahlia 28.9
Sharkia 28.1
Qualiobia 25.3
Kafr El-Sheikh 25.1
Gharbia 32.7
Menoufia 22.3
Beheira 24.7
Ismailia 18.8
Giza 28.7
Beni Suef 19.2
Fayoum 19.8
Menia 20.1
Assiut 22.5
Sohag 20.8
Qena 24.5
Aswan 27.0
Luxor 21.5
Frontier Governorates 18.5
Total 26.4 Source: Calculated using data from EDHS 2008.
Malnutrition indicators for children under 5 and youth show that the most pressing and prevalent form of
malnutrition among children in Egypt is stunting while overweight is the most prevalent form of
malnutrition among youth. The prevalence of stunting is not specific to certain governorates or regions,
however stunting among children is more prevalent in Lower Egypt (Qualiobia, Damietta and Sharkia). As
for overweight, it is more prevalent among youth in Lower Egypt and Urban Governorates, where poverty
rates, food insecurity and caloric deprivation are generally lower.
Various studies that investigate the underlying causes of malnutrition among children (under five years) in
Egypt confirm a non-significant correlation between the prevalence of malnutrition (and specifically
stunting) among children and the area of residence or other socioeconomic variables. However, they
suggest a positive relation between the height of the mother, sex of child, young age of mother,
overweight/underweight of mother, antenatal visits and prevalence of diarrhoea. This means that other –
non socioeconomic- factors are possibly related to the wide prevalence of stunting among children like
environmental factors, availability of health facilities, unhealthy feeding habits and lack of awareness on
proper dietary diversity (N.D. Doodoo 2011, UNICEF 2011, Khalid Khatab 2010 and Zottarelli et al
2007). Generally, most of the studies are based on data from EDHS 2008 and the results do not conform to
common knowledge of the situation in the studied regions/governorates in Egypt. Further in-depth
investigation of the prevalence and causes of malnutrition among children is still needed as the EDHS
2008 did not empirically explain causal factors of malnutrition among children. At the same time,
malnutrition indicators for youth appear more consistent with the status of food insecurity and poverty
across regions and governorates.

46 World Food Programme (WFP)
Generally, malnutrition is an area of major concern in Egypt that deserves wider attention. The GoE has
structured a National Nutrition Strategy (2007-2017) that was translated into an operational plan during
2010. WFP has been working with the GoE in various projects related to the operational plan, mainly the
fortification of subsidized balady bread with iron and folic acid, and fortification of subsidized cooking oil
with vitamin A and vitamin D. Nevertheless, concerted and intensified efforts to implement the national
operational plan are needed.

World Food Programme (WFP) 17
CHAPTER FIVE: VULNERABILITY AND ITS CORRELATES
Key Messages:
Rural areas in all regions have higher poverty measures than their urban
counterparts, and poverty measures in Rural Upper Egypt are above the national
average.
The likelihood of experiencing income poverty increases as household size
increases.
The gender of the household head alone does not result in significant differences in
poverty rates.
The data indicates that approximately 11.8 percent of the population in Egypt is in
extreme multi-dimensional poverty, i.e., deprived in at least three out of the eight
dimensions of deprivation, regardless of which dimensions were identified.
The ability of households to withstand shocks declines as they expand in size.
Data from HIECS 2009 reveals that vulnerability is associated with harmful coping
strategies such as child labour and low school enrolment.

48 World Food Programme (WFP)
Box 5.1: Aggregate Poverty Measurements
Three aggregate poverty measures are
commonly used: incidence, depth, and
severity. These are captured by the standard
three Foster-Greer-Thorbecke (1984)
decomposable poverty measurements: P0, P1,
and P2.
1. The head count index (P0), which
measures the prevalence of poverty,
denotes the percentage of population that
is poor - as defined by the poverty line - as
a proportion of total population. This
measure is insensitive to the distribution
of the poor below the poverty line.
2. The poverty gap index (P1), which
measures the depth of poverty, indicates
the gap between the observed expenditure
levels of poor households and the poverty
line. Assuming perfect targeting of
transfers, this poverty gap index reflects
the minimum amount of consumption that
need to be transferred to pull all the poor
up to the poverty line.
3. The poverty severity index (P2) measures
the degree of inequality in distribution
below the poverty line, giving greater
weight to households at the bottom of the
expenditure (or income) distribution.
5 VULNERABILITY AND ITS CORRELATES
Vulnerability is a forward-looking concept aimed at assessing community and household exposure and
sensitivity to future shocks. Ultimately, the vulnerability of a household or community is determined by its
ability to cope with various types of risks such as droughts, floods, crop blight or infestation, economic
fluctuations, and political conflicts. The ability to withstand these shocks is largely determined by the
characteristics of households and their communities; such as their poverty level, ownership of assets, type
of livelihood, stability of main sources of income, educational and skill level as well as the frequency and
intensity of previous shocks. While an understanding of how households cope is important, knowing how
resilient they are in the face of future shocks is even more important.
This section is divided into two parts: 1) the study of poverty and its determinants, and 2) an assessment of
vulnerability to food insecurity at the governorate level. In order to assess vulnerability to food insecurity
it is essential to study poverty, whether income poverty or multi-dimensional poverty because as chapter
two of the report demonstrates, household access to food remains the most significant food security
concern, and the purchasing power of households is a key determinant of food security in Egypt.
Accordingly, the ability of households to cope with risks and shocks is believed to be highly correlated
with their poverty levels.
The second part provides an assessment of
vulnerability to food insecurity in all
governorates. This is carried out using two
methods; the first applies logistic regression in
estimating the probability of a household being
at high risk of caloric deprivation, as a proxy
indicator of food insecurity. The second
method combines various dimensions
(indicators) that are associated with food
insecurity using principal component analysis,
and uses the results to calculate vulnerability
scores for households which are then
distributed into quintiles that classify them into
very high, moderate, low or very low
vulnerability groups.
5.1 THE STATE OF POVERTY
There is no uniform approach to defining,
identifying or measuring poverty. The
poverty debate is concerned with the
different potential causes of poverty, and
the various ways by which poverty can be
measured and compared, nationally and
internationally.
The monetary approach is the most
traditional and widely used approach in
identifying and measuring poverty. It
defines poverty based on individual income
and consumption levels, makes use of a
standardized poverty line, and reduces
poverty reduction strategies to increasing
individual income levels (Vandemoortele,
2000).

World Food Programme (WFP) 19
Standard monetary approaches to poverty which focus on increasing the individual income level
ignore the fact that some household members are discriminated against and may not be given a
proportional share of household income. For instance, when children work, a family‘s income often
rises above the poverty line, however these children have no decision-making power regarding how
this money is spent. Despite the fact that these children are deprived, according to the traditional
income approach, they would not be considered poor.
Furthermore, the monetary approach neglects to note that human well -being also depends on non-
market-based goods. Access to basic services and a safe environment for play are generally more
dependent on the level of local provision than on household income. Thus, individuals cannot
purchase these goods even if they have sufficient income.
Over time, several development organizations and scholars have argued that poverty is a
phenomenon that cannot be defined solely in monetary terms. They recognize that poverty is
multifaceted and cannot be measured and resolved through purely monetary means. In particular,
organizations working in human development view poverty as a problem that requires
comprehensive strategies in order to effectively address its many features. These recent
developments augment the monetary approach to measuring poverty by considering other non -
monetary factors, including household structure, gender, and age. This approach considers the
social context as a whole, including the distribution of power and resources.
The monetary and non-monetary approaches to defining poverty should be seen as complementary
approaches that, used together, provide a richer range of information than either approach alone.
Therefore, in the following section, the report reviews both income and multidimensional poverty in
and across all governorates.
5.1.1 Income Poverty
The income approach views poverty as income (or consumption) deprivation. Hence, poverty is
caused because some people have low income levels that cannot satisfy their minimum basic needs
as defined by the poverty line. The poverty line is the cost of basic food and non-food needs that
reflect the consumption patterns of the poor. The consumption-based measure is produced
according to internationally accepted standards and is based on data collected in HIECS. The focus
is placed on consumption – rather than income – because it is much easier to measure. Both food
and non-food items are included, but public services are not addressed.
The poverty line in Egypt is constructed using the ‗cost of basic needs‘ methodology. This
methodology yields household-specific, regionally consistent, and unbiased absolute poverty lines
(World Bank, 2007). Two poverty lines were constructed to measure poverty in Egypt. One is based
on the cost of a minimum diet, called the food poverty line and individuals who live in households
below this line are considered extremely poor. The second poverty l ine constructed combines the
cost of food with essential non-food expenditures. This is referred to as the total poverty line and
individuals in households that spend less than this amount are considered poor (see Annex 1).
In 2009, an individual who spent less than LE 2,223 per year (LE 185 per month) in Egypt was
defined as poor, while an individual who spent less than LE 1,648 per year (LE 137 per month) was
defined as extremely poor. There are various poverty lines estimated for various household size s,
the age of household members, and regional differences in relative prices. Data from HIECS 2009
shows that there are 16.3 million people who live in households that spend less than the minimum
level needed to meet basic needs, representing 21.6 percent of the population.
Overall poverty masks differences in welfare among regions and among governorates. The
incidence of poverty is highest in rural Upper Egypt where 43.7 percent of the population is

50 World Food Programme (WFP)
classified as poor. However, poverty in the urban counterpart of Upper Egypt declines to 21.3
percent and it declines to further to 6.9 percent in Metropolitan Governorates, see Map 2, below.
Map 2: Income Poverty in Egypt, 2009.
Differences in poverty measures across regions are statistically significant . The ranking of regions
remains unchanged for other measures of poverty, indicating that not only do poor households in
Rural Upper Egypt represent large proportions of the population in that region, but also that their
expenditure levels are far below the poverty line. In general, rural areas in all regions have higher
poverty measures than their urban counterparts, and the highest prevalence of income poverty is
found in the rural areas of Assiut (68.2 percent).
The likelihood of experiencing income poverty increases as household size increases. Households
with seven or more members have the highest poverty rate, at nearly 45.5 percent. The risk of poverty
is high among households with three or more children, where risk to poverty is as high as 40.7
percent. Poor persons living in households with three or more children comprised nearly one third of
the overall poor. The educational level of the household head is inversely correlated with poverty,
regardless of household type (having children or not). Household heads who have not completed a
primary education are three times more likely to be poor than household heads who have at least a
secondary education.
The gender of the household head alone does not result in significant differences in poverty rates.
Poverty rates of female-headed households (18.5 percent) are only slightly lower than male-headed
households (21.9 percent). Female-headed households with more than three children however, were
twice as likely to be poor in both urban and rural areas (36 percent and 37percent, respectively).
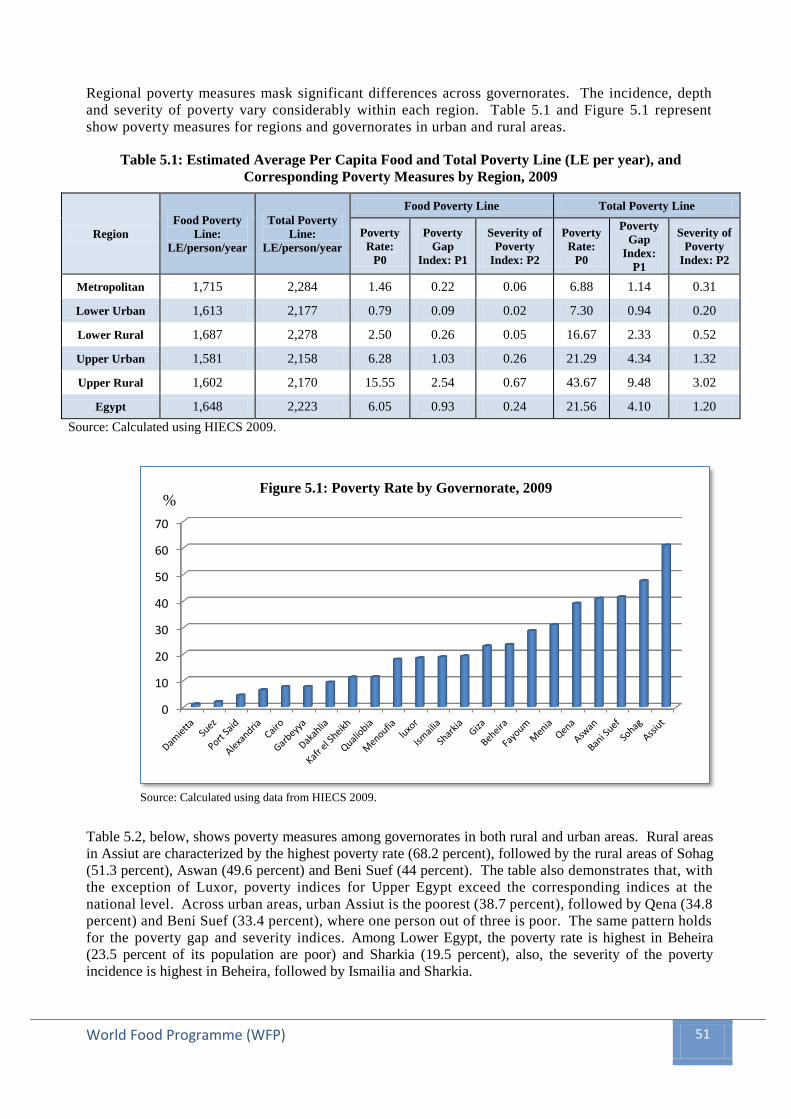
World Food Programme (WFP) 51
Regional poverty measures mask significant differences across governorates. The incidence, depth
and severity of poverty vary considerably within each region. Table 5.1 and Figure 5.1 represent
show poverty measures for regions and governorates in urban and rural areas.
Table 5.1: Estimated Average Per Capita Food and Total Poverty Line (LE per year), and
Corresponding Poverty Measures by Region, 2009
Region
Food Poverty
Line:
LE/person/year
Total Poverty
Line:
LE/person/year
Food Poverty Line Total Poverty Line
Poverty
Rate:
P0
Poverty
Gap
Index: P1
Severity of
Poverty
Index: P2
Poverty
Rate:
P0
Poverty
Gap
Index:
P1
Severity of
Poverty
Index: P2
Metropolitan 1,715 2,284 1.46 0.22 0.06 6.88 1.14 0.31
Lower Urban 1,613 2,177 0.79 0.09 0.02 7.30 0.94 0.20
Lower Rural 1,687 2,278 2.50 0.26 0.05 16.67 2.33 0.52
Upper Urban 1,581 2,158 6.28 1.03 0.26 21.29 4.34 1.32
Upper Rural 1,602 2,170 15.55 2.54 0.67 43.67 9.48 3.02
Egypt 1,648 2,223 6.05 0.93 0.24 21.56 4.10 1.20
Source: Calculated using HIECS 2009.
Source: Calculated using data from HIECS 2009.
Table 5.2, below, shows poverty measures among governorates in both rural and urban areas. Rural areas
in Assiut are characterized by the highest poverty rate (68.2 percent), followed by the rural areas of Sohag
(51.3 percent), Aswan (49.6 percent) and Beni Suef (44 percent). The table also demonstrates that, with
the exception of Luxor, poverty indices for Upper Egypt exceed the corresponding indices at the
national level. Across urban areas, urban Assiut is the poorest (38.7 percent), followed by Qena (34.8
percent) and Beni Suef (33.4 percent), where one person out of three is poor. The same pattern holds
for the poverty gap and severity indices. Among Lower Egypt, the poverty rate is highest in Beheira
(23.5 percent of its population are poor) and Sharkia (19.5 percent), also, the severity of the poverty
incidence is highest in Beheira, followed by Ismailia and Sharkia.
0
10
20
30
40
50
60
70
Figure 5.1: Poverty Rate by Governorate, 2009 %

52 World Food Programme (WFP)
Table 5.2: Poverty Rate by Governorate; 2009
Governorates P0 P1 P2
Urban Rural Total Urban Rural Total Urban Rural Total
Urban Governorates 6.39
6.39 1.07
1.07 0.29
0.29
Cairo 7.62
7.62 1.27
1.27 0.34
0.34
Alexandria 6.41
6.41 1.02
1.02 0.27
0.27
Port Said 4.43
4.43 0.93
0.93 0.31
0.31
Suez 1.94
1.94 0.28
0.28 0.08
0.08
Lower Egypt 7.55 16.65 14.16 0.99 2.33 1.97 0.21 0.52 0.44
Damietta 1.20 1.05 1.11 0.23 0.11 0.16 0.06 0.02 0.03
Dakahlia 4.82 10.99 9.30 0.66 1.28 1.11 0.13 0.25 0.22
Sharkia 10.76 21.61 19.15 1.16 2.84 2.46 0.18 0.59 0.50
Qualiobia 3.43 16.83 11.33 0.46 2.52 1.68 0.11 0.59 0.40
Kafr el Sheikh 5.56 12.61 11.20 0.63 1.99 1.72 0.08 0.48 0.40
Gharbeya 5.24 8.60 7.64 0.54 1.02 0.88 0.09 0.20 0.17
Menoufia 9.39 19.90 17.93 1.26 2.91 2.60 0.27 0.66 0.59
Beheira 17.64 24.87 23.51 2.60 3.56 3.38 0.66 0.80 0.77
Ismailia 12.14 23.90 18.84 1.76 4.06 3.07 0.39 1.06 0.77
Upper Egypt 21.49 43.73 37.02 4.39 9.49 7.95 1.34 3.02 2.51
Giza 11.84 37.69 22.97 2.17 8.26 4.79 0.61 2.63 1.48
Beni Suef 33.44 44.03 41.45 5.66 8.07 7.48 1.42 2.22 2.03
Fayoum 15.85 32.12 28.71 2.20 5.48 4.79 0.50 1.36 1.18
Menia 16.13 33.73 30.93 2.89 5.97 5.48 0.71 1.58 1.44
Assiut 38.65 68.21 60.97 9.09 19.16 16.70 3.08 7.14 6.15
Sohag 32.99 51.34 47.54 7.91 11.53 10.78 2.62 3.73 3.50
Qena 34.82 40.12 39.02 7.80 8.08 8.03 2.48 2.53 2.52
Aswan 28.72 49.60 40.92 6.21 11.03 9.03 2.04 3.44 2.85
Luxor 8.39 28.33 18.44 1.22 5.31 3.28 0.25 1.74 1.00
Frontier Governorates 4.32 26.15 10.67 0.81 5.08 2.03 0.21 1.29 0.52
Total 10.98 28.94 21.56 1.97 5.58 4.10 0.56 1.66 1.20
Source: Calculated using HIECS 2009.
The above analysis is very important if geographical targeting of the poor is adopted. The data shows that
both urban and rural areas in Upper Egypt (particularly the governorates of Assiut, Sohag and Beni Suef)
as well as Beheira in Lower Egypt are the best candidates for targeting the poor. Further desegregation of
poverty measures to the district level is needed and will be carried out in Phase II of the study.
5.1.2 Consumption Patterns and Consumer Prices for the Poorest Quintiles
The average expenditure on consumption of persons in the poorest decile is LE 1,466; less than half
of the national average, and only 15 percent of the consumption of persons in the richest decile.
Food is the dominant item in total expenditure for every decile, in both urban and rural areas (see Table
5.3, below). Expenditure on food represents 44.2 percent of total expenditure for the whole population,
however the share of food expenditure increases to 52.6 for the poorest decile, as opposed to 33 percent for
the richest decile.

World Food Programme (WFP) 53
Table 5.3: Consumption Patterns by Decile, 2009
Commodity Group Deciles
Total 1 2 3 4 5 6 7 8 9 10
Food and Beverages 52.6 52.0 51.3 50.6 49.9 48.7 47.7 46.3 44.0 33.0 44.2
Alcoholic Beverages &
Cigarettes 3.1 2.9 3.0 2.9 3.1 2.9 2.9 2.7 2.3 1.5 2.5
Clothing, Footwear & Textiles 6.6 6.6 6.5 6.3 6.2 6.2 6.1 6.0 5.8 4.9 5.8
Housing and its Accessories 16.7 16.8 17.0 17.2 17.2 17.3 17.4 17.3 17.3 19.7 17.9
Furniture, House equipment, &
Regular Home Maintenance 3.3 3.2 3.2 3.2 3.2 3.2 3.3 3.4 3.6 4.2 3.6
Health Care and Services 3.9 4.3 4.5 4.6 4.9 5.3 5.7 6.0 7.2 9.1 6.5
Transportation 2.3 2.6 2.7 2.9 3.2 3.2 3.4 3.7 4.2 7.6 4.5
Telecommunications 1.3 1.5 1.7 1.9 2.0 2.2 2.4 2.6 3.0 3.6 2.6
Culture and Entertainment 0.9 1.0 1.0 1.2 1.3 1.4 1.5 1.8 1.9 4.1 2.1
Education 1.5 1.9 2.0 2.2 2.3 2.6 2.6 3.0 3.7 5.5 3.4
Restaurants and Hotels 4.8 4.4 4.3 4.1 4.1 4.1 4.1 4.2 4.3 3.9 4.1
Miscellaneous Services and
Commodities 3.0 2.9 2.8 2.8 2.7 2.8 2.9 2.9 3.0 2.9 2.9
Total 100 100 100 100 100 100 100 100 100 100 100
Source: Calculated by authors using HIECS 2009 and CPI database, CAPMAS.
Domestic consumer prices are generally characterized by the following: first; prices are rigid, meaning that
with every inflationary wave there is a step up in domestic prices and therefore every wave bears a
compounded impact on consumers. Second, inflationary waves – specifically in food prices- have become
more frequent, and third; domestic prices have become highly correlated with global prices, meaning that the
pass-through of global inflation in food prices to domestic prices is high. Naturally, persistent inflation in
consumer prices is likely to have a more adverse impact on the poor. In the following discussion we
investigate inflation in consumer prices of commodities purchased by the poor compared to the non-poor, and
we find that inflation in the consumer basket of the poorest quintile is higher than that for the richest quintile.
The CPI for each expenditure quintile was constructed, using the actual commodity basket consumed by each
quintile. Thus, price changes reported by CAPMAS in its monthly bulletin were weighted by the commodity
basket of each quintile and the CPI for each quintile was calculated (see Figure 5.2 below).
Figure 5.2: CPI and Food Price Index by Quintiles
1- Overall CPI 2- Food Price Index
Source: Calculated using data from CAPMAS.
125
127
129
131
133
135
137
139
141
143
145
4--2
00
9
5--2
00
9
6--2
00
9
7--2
00
9
8--2
00
9
9--2
00
9
10
--20
09
11
--20
09
12
--20
09
1--2
01
0
2--2
01
0
Quintile 1 Quintile 2 Quintile 3
Quintile 4 Quintile 5
140
150
160
170
4--2
00
9
5--2
00
9
6--2
00
9
7--2
00
9
8--2
00
9
9--2
00
9
10
--20
09
11
--20
09
12
--20
09
1--2
01
0
2--2
01
0
3--2
01
0
Quintile 1 Quintile 2 Quintile 3
Quintile 4 Quintile 5

54 World Food Programme (WFP)
The results show that the poorest deciles experienced a faster decline in their living standards as a result of
price hikes. For example, in March 2010, CPI inflation for the bottom quintile was approximately 43.5
percent, while the richest quintile experienced lower inflation of 39 percent. Generally, CPI for the poorest
two quintiles was the highest and their indices were almost identical, CPI for third and fourth quintiles
showed milder increases than the first two quintiles and CPI for the richest (fifth) quintile showed the least
inflation rate. However, the food price index shows that inflation in food prices was almost the same for all
five quintiles.
We conclude that inflation in consumer prices is a greater threat for the poor not only because of their
limited resources but also due to the tendency of their consumer baskets to experience higher increases
than the richer quintiles. It is important in that respect to monitor inflation in consumer prices of baskets
consumed by the lower quintiles, rather than national or regional price indices, and target price stability of
key commodities consumed by the poor. Deeper investigation of markets, trade flows and consumer
preferences is needed to explain why CPI for the poorest quintiles has been experiencing higher inflation
than richer quintiles.
5.1.3 Multi-Dimensional Poverty
One of the leading non-monetary approaches currently being used is the Multidimensional Poverty
Index (MPI), developed by the Oxford Poverty and Human Development Initiative in coordination
with the United Nations Development Programme (UNDP) in 2010. The MPI addresses health,
education and standard of living, and measures the level of deprivation in these dimensions using
ten different weighted indicators.15
The MPI was introduced in the Global Human Development Report (HDR) of 2010. It is a simple
and policy relevant index that complements monetary-based methods by taking a broader approach,
identifying overlapping deprivations at the household level across the same three dimensions as the
HDI and shows the average number of people who are poor (suffering a given number of
deprivations) and the number of deprivations with which poor households typically contend. It can
be deconstructed by region, ethnicity and other groupings as well (see Box 5.2 for more details).
The MPI is grounded in the ―capability‖ approach. It includes an array of dimensions from
participatory exercises among poor communities and an emerging international consensus.
However, because the measure requires that all data pertain to the same household, the options of
dimensions for the measure were limited. Egypt has an advantage in this respect since HIECS
collects the information necessary to assess other important dimensions of living standards; on
work, empowerment, education, food security and consumption. It is the product of the
multidimensional poverty headcount (the share of people who are multi -dimensionally poor) and the
average number of deprivations each multi-dimensionally poor household experiences (the intensity
of their poverty).
Calculating the MPI requires household level data on all variables included in it. Each household is
classified as deprived or not in every dimension (eight), and then the number of dimensions in
which a household is deprived is counted. A household is multi -dimensionally poor if it is deprived
in at least three out of ten indicators (the cut-off depends on the weight of the specific indicator in
the overall measure). The thresholds of cut-offs within each dimension reflect acute deprivations,
and are mostly linked to MDGs. Given that HIECS does not provide any information about child
mortality and malnutrition, therefore the MPI was constructed without measuring deprivation in
those two indicators.
15 Oxford Poverty and Human Development Initiative, University of Oxford,
http://www.ophi.org.uk/policy/multidimensional-poverty-index/

World Food Programme (WFP) 55
5.1.4 Multidimensional Poverty in Egypt
The data indicates that approximately 11.8 percent of the population in Egypt is in extreme multi-
dimensional poverty, i.e., deprived in at least three out of the eight dimensions of deprivation, regardless
of which dimensions were identified. Figure 5.3, below, shows that deprivation in assets is the most
widespread dimension (14 percent), followed by the proportion of people who lack sanitation facilities (9.1
percent). Furthermore, 6.5 percent of Egyptians live in families with at least one child not enrolled in basic
education, and 6.2 percent live in households whose members have no basic or higher education. These
rates rise considerably if we refine our analysis to capture the poor alone, where 22 percent are deprived of
assets, 14 percent are deprived of sanitation facilities, 18 percent live in households where at least one
child is not enrolled in basic education, and 13 percent live in households where the head of household is
uneducated. Accordingly, utilising the MPI clearly depicts the deteriorated standard of living of the poor.
Box 5.2 Calculating the Multidimensional Poverty Index
The MPI uses micro data from household surveys, and all the indicators needed to construct the measure must come
from the same survey. Each person in a given household is classified as poor or non-poor depending on the number of
deprivations his or her household experiences. These data are then aggregated into the national measure of poverty. A
household is identified as multidimensional-poor if, and only if, it is deprived in some combination of 10 indicators (also
called dimensions and denoted by ) whose weighted sum exceeds a cut-off or 30 percent of deprivations. The
dimensions and their pertinent weights in the MPI are:
1. Health (each indicator is weighted equally)
a. Child Mortality: If child of any age has died in the family
b. Nutrition: If any adult or child in the family is malnourished.
2. Education (each indicator is weighted equally)
a. Years of Schooling; if no household member has completed 5 years of schooling
b. Child Enrolment; if any school-aged child is out of school in years 1 to 8.
3. Standard of Living (each of the six indicators weighted equally)
a. Electricity; no electricity is poor
b. Drinking water; MDG definitions
c. Sanitation; MDG definitions, including that toilet is not shared
d. Flooring; dirt/sand/dung are poor
e. Cooking Fuel; wood/charcoal/dung are poor
f. Assets; poor if do not own more than one of: radio, TV, telephone, bike, motorbike
Each person is assigned a score according to his or her household‘s deprivations in each of the 10 component indicators,
(d). The maximum score is 10, with each dimension equally weighted (thus the maximum score in each dimension is
3⅓). The health and education dimensions have two indicators each, so each component is worth 5/3 (or 1.67). The
standard of living dimension has six indicators, so each component is worth 5/9 (or 0.56). The sum of the weights adds
up to the number of dimensions and the MPI is calculated as the product of two numbers: the headcount or proportion
of people who are multidimensional-poor, and the average intensity of multidimensional-deprivation – which reflects
the proportion of dimensions in which households are deprived.:
The headcount ratio is , where is the number of multidimensional-poor people in the population,
represents the incidence of multidimensional-poverty. As such the MPI defines the proportion of the multidimensional-
poor adjusted by the intensity of their poverty and thus satisfies many desirable properties, including monotonicity,
transfer, focus, etc. Moreover, the can be at most equal to the headcount ratio, , when all households that are
deprived in or more dimensions are indeed deprived in dimensions, thus making the average intensity reach the
maximum of 1.
To identify the multi-dimensionally poor, the deprivation scores for each household are summed to obtain the household
deprivation, c. A cut-off of 3, which is the equivalent of one third of the indicators, is used to distinguish between the
poor and non-poor. If c is 3 or greater, that household (and everyone in it) is multi-dimensionally poor. Households with
a deprivation count between 2 and 3 are vulnerable to or at risk of becoming multi-dimensionally poor.

56 World Food Programme (WFP)
Source: Calculated using data from HIECS 2009.
The attributes and levels of multidimensional poverty differ by Governorate. Table 5.4, and Figure 5.4, below,
both show that there is a wide gap in human development indicators and standard of living between governorates.
Table 5.4: Percent of Multidimensional Poor by Governorate, 2009
Governorates Urban Rural All
Urban Governorates 8.12
8.12
Cairo 10.72
10.72
Alexandria 8.75
8.75
Port Said 0.72
0.72
Suez 0.21
0.21
Lower Egypt 5.11 6.46 6.15
Damietta 0.67 1.08 0.92
Dakahlia 1.88 4.52 3.79
Sharkia 4.04 2.15 2.58
Qualiobia 7.36 3.58 5.13
Kafr el Sheikh 3.44 4.45 4.25
Gharbeya 8.42 4.84 5.86
Menoufia 7.39 18.45 16.38
Beheira 9.16 11.74 11.26
Ismailia 0.05 0.70 0.42
Upper Egypt 15.02 21.07 19.24
Giza 19.62 33.79 25.72
Beni Suef 18.70 26.75 24.79
Fayoum 10.31 19.45 17.54
Menia 5.55 11.88 10.87
Assiut 18.64 39.59 34.46
Sohag 12.61 17.19 16.24
Qena 15.68 12.30 13.00
Aswan 3.60 2.68 3.07
Luxor 3.38 7.55 5.48
Frontier Governorates 1.53 6.61 3.60
Total 9.68 13.31 11.82
Source: Calculated using HIECS 2009
0
5
10
15
20
25
MPI poor All population
Figure 5.3: Percent of Deprived Individuals by Dimension, 2009 %

World Food Programme (WFP) 57
Source: Calculated using data from HIECS 2009.
Assiut has the highest prevalence of multidimensional poverty (34.5 percent of the population) where the
proportion of those deprived of school enrolment, education and sanitation dimensions is high. Assiut is
followed by Giza (25.7 percent) and Beni Suef (24.8 percent) and at the lowest end Suez had the least
prevalence of multidimensional poverty among its population (0.21 percent). As was the case with
income poverty within governorates, multidimensional poverty is generally more prevalent in rural areas
than in urban ones. Both income poverty and multi-dimensional poverty threaten the ability of households
to cope with risks to food insecurity, therefore in the next section the relation between those two aspects
and vulnerability of households will be thoroughly analyzed.
5.2 VULNERABILITY AND VULNERABILITY PROFILES
Vulnerability to food insecurity defines the possibility of becoming or remaining materially food insecure
in the future. The concept of vulnerability emphasizes the uncertainty a household faces about its future
well-being, and thus, it refers to a state of insufficient access to economic, social and human assets that
provide the basis for generating income and production, either now or in the future. Unlike food security –
which is a static view of food availability, accessibility and utilization of food- vulnerability analysis
provides dynamic and forward-looking analysis of the impact of shocks on household access to food and
the impact on the nutritional status of household members.
The objective of this section is to distinguish between vulnerable and non-vulnerable households and to
define the criteria for targeting the highly vulnerable population, in addition to highlighting the key factors
contributing to increased vulnerability among households. According to WFP, vulnerability analysis is
used to predict the likely impact of a specific shock on the status of food security in different areas, on
different livelihoods, and so forth. This study focuses on the likely deterioration in the food security
situation of households based on their characteristics, rather than relating the analysis to a specific shock.
This is achieved using two methods: one reflects risks to one of the food security indicators (caloric
deprivation), and the other combines the key characteristics associated with vulnerability into one index,
all weighted according to their relative explanatory power.
5.2.1 Risks of Caloric Deprivation
This section estimates the probability of a household being at high risk to caloric deprivation as a proxy
indicator of food insecurity. Using logistic regression, the risk that caloric deprivation will occur in
households that are not currently deprived is estimated by fitting caloric deprivation as a function of
0
5
10
15
20
25
30
35
Suez
Ism
ailia
Po
rt S
aid
Dam
iett
a
Mat
rou
h
Shar
kia
Asw
an
Dak
ahlia
Kaf
r el
Sh
eikh
Qu
alio
bia
luxo
r
Gar
bey
ya
Ale
xan
dri
a
Cai
ro
Men
ia
Beh
eira
Qen
a
Soh
ag
Men
ou
fia
Fayo
um
Ban
i Su
ef
Giz
a
Ass
iut
Tota
l
Figure 5.4: Multidimensional Poverty Rate %

58 World Food Programme (WFP)
household size, main economic
activity, employment status, sex of
head of household as well as household
expenditure level and access to ration
cards and baladi bread.
Box 5.3 provides greater detail on the
use of logistic regression to estimatee
the probability of caloric deprivation.
The estimated model has a satisfactory
forecasting power in identifying
individuals with high risk to caloric
deprivation.
The results in Table 5.5, below, show
that 72.4 percent of caloric deficient
individuals were also identified by the
model as caloric deficient. However,
the model has a less satisfactory
(though acceptable) result in forecasting non-deficiency in caloric intake, which implies higher
homogeneity in the characteristics of the caloric deprived population.
Table 5.5: Percent of Correct Classification for Logistic Regression
Observed Caloric
Deficiency
Predicted Caloric Deficiency
No Yes Percentage Correct
No 119595 54655 68.6
Yes 12273 32236 72.4
Overall Percentage
69.4
Source: Calculated using HIECS 2009.
One of the benefits of this type of analysis is the ability to assess the impact a change in a particular factor
would have on the probability of an individual being caloric-deficient, if all other factors are kept constant.
The results of the logistic models are given in Table 5.6, below, including the estimated coefficients, the
odds ratio, and marginal effects for explanatory variables included in the model.
Table 5.6: Logistic Regression Results
B S.E. Wald df Sig. Exp(B)
Gender of Household Head 0.421 0.023 344.483 1 0 1.524
Purchases Subsidized Bread -.578- 0.014 1593.067 1 0 0.561
Holds Ration Card -.468- 0.014 1180.606 1 0 0.626
Household Head Unemployed 0.385 0.015 666.485 1 0 1.269
Per Capita Expenditure -2.227- 0.017 17452.98 1 0 0.108
Household Size 0.103 0.002 1964.634 1 0 1.109
Household Head Employed in
Agriculture 0.235 0.019 152.99 1 0 1.265
Urban/Rural 0.362 0.014 668.305 1 0 1.436
Single Source of Income -.295- 0.021 198.547 1 0 7.45E-01
Constant 16.264 0.141 13369.47 1 0 1.16E+07
Source: Calculated using HIECS 2009.
The logistic coefficient could be interpreted as the change in log odds associated with one unit change in the
explanatory variable. While the odds ratio has a simpler interpretation in the case of a categorical explanatory
variable with two categories, in this case it is just the odds ratio for one category compared to the other. As Table
5.6 indicates, the odds of caloric deficiency for a household with a ration card holder is about half that of a
household without a ration card. Similarly, the purchase of subsidized bread has a positive impact on caloric
Box 5.3 Using Logistic Regression in Estimating the
Probability of Caloric Deprivation
Logistic regression is a generalized linear model used for
prediction of the probability of the occurrence of a binary
variable. Logistic models are useful in estimating the impact of a
number of independent variables on the binary variable
expressed using probability of occurrence. The coefficients of
the independent variables reflect the magnitude of the risk factor
born by each independent variable and the sign shows the
direction of the relation between the independent variable and
the binary variable.
Logistic function:
Logistic regression: z = + + + + ….
The z variable is shows the probability of particular outcome
that is measured by the total contribution of the independent
variables used ( ,

World Food Programme (WFP) 59
intake. The more that household livelihood depends on agricultural production and agricultural labour, the higher
the probability it will suffer from caloric deficiency. The ―risk management aspect‖ is shown by the fact that (all
other factors being equal) households with only a single source of cash income are more likely to be caloric
deficient compared to households with several cash sources. The odds ratio increases with household size, and
naturally decreases with expenditure (one percent change in expenditure reduces the odds ratio by 2.2 percent).
The results of the logistic regression were used to estimate the probability of being caloric deficient, and to
identify households at risk of caloric deprivation. Households scoring 50 percent or more are considered at high
risk, and households scoring less than 20 percent are classified as having no risk. Households lying between
these two categories are considered to have moderate risk to caloric deprivation. As shown in Table 5.7, below,
9.4 percent of the total population are at high risk of becoming caloric deficient, 28.1 percent are at moderate
risk, while 62.5 percent are at low risk. Rural residents have a greater risk of becoming caloric deficient (10.5
percent are at high risk and 30.6 percent are at moderate risk) than urban residents (7.8 percent are at high risk
and 24.5 percent are at moderate risk)
Table 5.7 Risk to Caloric Deficiency by Governorate, 2009
Governorates
Urban Rural All Egypt
No Risk of
Caloric
Deficiency
Moderate
Risk of
Caloric
Deficiency
High Risk of
Caloric
Deficiency
No Risk of
Caloric
Deficiency
Moderate
Risk of
Caloric
Deficiency)
High Risk
of Caloric
Deficiency
No Risk of
Caloric
Deficiency
Moderate
Risk of
Caloric
Deficiency
High Risk of
Caloric
Deficiency
Urban
Governorates 77.35 18.18 4.47 77.35 18.18 4.47
Cairo 75.59 19.17 5.24 75.59 19.17 5.24
Alexandria 74.24 21.20 4.56 74.24 21.20 4.56
Port Said 82.40 14.22 3.39 82.40 14.22 3.39
Suez 90.31 8.40 1.28 90.31 8.40 1.28
Lower Egypt 71.34 23.86 4.80 69.99 25.34 4.67 70.47 24.86 4.68
Damietta 90.63 7.89 1.47 94.97 5.03 0.00 93.30 6.13 0.57
Dakahlia 77.00 19.93 3.07 81.80 16.49 1.71 80.48 17.43 2.09
Sharkia 59.29 33.42 7.29 64.29 30.89 4.82 63.16 31.46 5.38
Qualiobia 77.89 19.54 2.57 62.87 31.12 6.01 69.04 26.37 4.60
Kafr el
Sheikh 76.17 21.92 1.91 68.95 24.00 7.05 70.40 23.58 6.02
Gharbeya 76.82 19.02 4.16 79.30 18.80 1.90 78.59 18.86 2.55
Menoufia 66.59 27.26 6.15 68.93 27.38 3.69 68.49 27.36 4.15
Beheira 49.21 39.52 11.27 61.45 30.45 8.10 59.15 32.16 8.69
Ismailia 71.27 23.27 5.46 61.41 32.40 6.19 65.65 28.47 5.87
Upper Egypt 50.74 33.44 15.82 45.80 36.85 17.35 47.29 35.82 16.89
Giza 60.84 28.56 10.60 48.95 34.09 16.95 55.72 30.94 13.34
Beni Suef 43.66 42.85 13.49 47.49 41.44 11.07 46.56 41.78 11.66
Fayoum 59.64 32.12 8.24 55.77 33.43 10.79 56.58 33.16 10.26
Menia 58.51 31.87 9.62 59.66 32.91 7.44 59.47 32.74 7.79
Assiut 35.23 36.55 28.23 23.94 37.93 38.12 26.71 37.59 35.70
Sohag 35.36 39.35 25.28 39.17 41.14 19.69 38.38 40.77 20.85
Qena 35.14 32.82 32.03 41.17 39.88 18.95 39.91 38.42 21.67
Aswan 38.47 41.07 20.47 43.02 37.46 19.51 41.13 38.96 19.91
Luxor 55.86 40.92 3.23 59.03 30.60 10.37 57.46 35.72 6.82
Frontier
Governorates 72.24 14.32 8.29 57.08 33.30 9.62 67.70 26.16 6.15
All Egypt 67.62 24.54 7.84 58.95 30.60 10.45 62.51 28.11 9.38
Source: Calculated by authors using HIECS 2009
The results above depict wide disparities between governorates. As demonstrated in Figure 5.4 below,
residents in Assiut, Sohag, Qena and Aswan are the most vulnerable to caloric deprivation, having highest
prevalence of individuals with high risk to caloric deprivation. On the other hand, Damietta and Suez have
the lowest prevalence of risks to caloric deprivation among their populations.

60 World Food Programme (WFP)
Source: Calculated using data from HIECS 2009.
Figure 5.5 a and b demonstrate the risks of caloric deprivation by household characteristics, based on the
tabulations of risk levels according to household characteristics, provided in Table 5.8.
Figure 5.5.a Risks of Caloric Deficiency by Household Characteristics
Source: Calculated using data from HIECS 2009.
Figure 5.5.b Risks of Caloric Deficiency by Household Characteristics (Continued)
Source: Calculated using data from HIECS 2009.
0.0
10.0
20.0
30.0
40.0
Dam
ietta
Suez
Dakah
lia
Garb
eyya
Po
rt Said
Men
ou
fia
Alexan
dria
Qu
aliob
ia
Cairo
Sharkia
Ismailia
Kafr el Sh
eikh
luxo
r
Men
ia
Beh
eira
Fayou
m
Ban
i Suef
Giza
Asw
an
Soh
ag
Qen
a
Assiu
t
All Egyp
t
0 10 20 30 40 50 60 70 80
Mal
e
Fem
ale
no
n p
oo
r
Po
or
no
n p
oo
r
Po
or
po
or
Mo
der
ate
Hig
h
No
ne
Bas
ic
Sec
on
dar
y
Sec
on
dar
y+
per
man
ent
tem
po
rary
sea
son
al
Cas
ual
Gender of head
Income Poverty
Multi-dim
Poverty
MFCS Education of the head
Job Stability
0 10 20 30 40 50 60 70 80
one or
two
three or
four
five or six
seven to
nine
more than nine
no ration card
Have ration card
no sub
bread
No Yes No
Household Size Ration card holding
Purchase Subsidized
Bread
Have Social Insurance
Figure 5.4: Percent of Population at Risk of Caloric Deficiency, 2009 %
%
%

World Food Programme (WFP) 11
Table 5.8: Risk of Caloric Deficiency, by Various Characteristics
No Risk of Caloric
Deficiency
Moderate Risk of
Caloric Deficiency
High Risk of
Caloric Deficiency All
Gender of Head
Male 68.03 25.17 6.80 100
Female 85.14 11.84 3.02 100
Extreme Income Poverty
Non-Poor 66.97 28.04 4.98 100
Poor 0.89 29.02 70.09 100
Income Poverty
Non-Poor 76.97 21.59 1.44 100
Poor 9.91 51.84 38.24 100
Multidimensional Poverty
Non-Poor 68.21 26.22 5.56 100
Poor 20.00 42.19 37.81 100
DDS
Poor 45.16 36.25 18.59 100
Moderate 69.26 25.58 5.16 100
High 85.92 12.21 1.87 100
Educational Status of Household Head
None 67.02 25.23 7.74 100
Primary-Preparatory 67.51 25.77 6.72 100
Secondary 76.10 19.83 4.07 100
Secondary+ 77.90 18.32 3.78 100
Employment Status of Household Head
Wage Earner 65.92 26.91 7.18 100
Employer 73.87 21.03 5.10 100
Self-Employed 73.22 21.56 5.22 100
Unpaid Worker 75.00 20.00 5.00 100
Unemployed 76.15 16.15 7.69 100
Out of Labour Force 77.74 16.82 5.45 100
Job Stability
Permanent Employment 70.88 23.39 5.73 100
Temporary Employment 64.33 29.92 5.75 100
Seasonal Employment 65.00 30.00 5.00 100
Casual Employment 52.11 35.08 12.81 100
Household Size
1 to 2 Members 93.80 4.96 1.23 100
3 to 4 Members 80.64 17.25 2.12 100
5 to 6 Members 66.56 27.60 5.84 100
7 to 9 Members 39.80 42.59 17.61 100
Over 9 Members 21.45 43.52 35.03 100
Ration Card
No Ration Card 67.20 25.76 7.04 100
Ration Card 72.63 21.62 5.75 100
Subsidized Bread
Doesn‘t Purchase Subsidized Bread 62.01 27.10 10.89 100
Purchases Subsidized Bread 72.95 21.99 5.06 100
Social Insurance
Yes 73.41 21.12 5.48 100
No 67.73 25.25 7.02 100
Health Insurance
Yes 70.49 23.50 6.01 100
No 71.10 22.63 6.26 100
All Egypt 70.87 22.96 6.17 100
Source: Calculated using HIECS 2009

62 World Food Programme (WFP)
Box 5.4: Principal Component Analysis
Principal component analysis PCA is used to reduce
the complexity of the data set for exploratory
purposes. It uses a factor extraction method to form
uncorrelated linear combinations of the observed
variables. The first component explains maximum
variance. Successive components explain
progressively smaller portions of the variance and are
all uncorrelated with each other.
PCA is one technique of multivariate analysis that
applies to continuous variables. The objective of
PCA is twofold: to identify and describe the
underlying relationships among the variables by
creating new indicators (called ―factors‖ or ―principal
components‖) that capture the essence of the
associations between variables; and to reduce the
complexity of the data, saving a limited number of
these new variables that is sufficient to keep the most
relevant aspects of the description with a minimal
loss of detail.
PCA yields as many principal components as there
are initial variables. However, the contribution of
each principal component to explaining the total
variance found among all variables will progressively
decrease from the first principal component to the
last. As a result, a limited set of principal
components explains the majority of the matrix
variability, and principal components with little
explanatory power can be removed from the analysis.
The result is data reduction with relatively little loss
of information.
It is recommended to use the rotated solution in most
circumstances. Rotation of the result will give a new
solution: the new factors explain the same variance
and can be much better interpreted as the underlying
dimensions. The analyst can understand the
―meaning‖ of each dimension and then decide which
of the uncovered dimensions he wants to use in
subsequent analyses.
Table 5.8, above, shows that male-headed households have a higher risk of caloric deprivation than
female-headed households; likewise households whose head is uneducated are at higher risk than
households whose head is educated. While there does not appear to be any clear causal relationship
between the employment status of the household head and vulnerability to caloric deprivation,
nevertheless, the stability of the head‘s job is highly correlated to the forecasted risk, where 12.8 percent of
casual workers are estimated to have high risks of caloric deprivation, opposed by only 5.7 percent of those
with a permanent job. The risk increases with larger households and higher poverty levels; 70 percent of
the extreme income poor are highly vulnerable to risks of caloric deprivation and 38 percent of the poor are
at high risk to caloric deprivation. Similarly, the multi-dimensional poor have higher risk to caloric
deprivation but to a lesser extent; 37.8 percent of the multi-dimensional poor are highly vulnerable.
Finally, vulnerability is also higher among households with poor DDS (18.6 percent).
5.2.2 Constructing the Vulnerability Index
The second method of defining vulnerability
combines various dimensions (indicators) that are
associated with food insecurity and are therefore
chosen to indicate the vulnerability of households to
risks of food insecurity. These indicators are
combined using principal component analysis into
factors that have different variances; the factor with
the highest variance best explains the relation
between chosen indicators and is therefore used to
estimate the weights to be assigned to each of the
indicators. The estimated weights are used to
calculate the vulnerability score for each household
and all scores are then distributed into quintiles that
classify households into very high, moderate, low or
very low vulnerability groups.
Vulnerability is by definition a multidimensional
concept, therefore it is useful to incorporate multiple
dimensions and indicators into the analysis, which
will expand and enrich the number of vulnerability
dimensions. Thus, constructing the index requires:
1. Identifying the underlying dimensions of
vulnerability and investigating the
interrelationships between different aspects
of each dimension;
2. Choosing the most relevant indicators or
variables that reflect those dimensions of
human development; and
3. Combining these variables in a smaller number
of composite indices, preferably one.
This type of analysis always contains a level of
subjectivity, whether in selecting the dimensions of
vulnerability, or the set of variables that measure
each dimension or even the way these variables are
combined. Nevertheless, it reflects the capacity of
households to manage (prevent, mitigate, and cope)
with shocks, which often depends on the use of more
―resistant‖ strategies, alternative sources of income,
reserves, savings, social networks, etc.

World Food Programme (WFP) 13
In the Vulnerability Index (VI),
weighting is used to linearly combine
selected variables into a smaller number
of indices. Weights may be arbitrarily
chosen as equal or, they may be
determined through multivariate
statistical techniques such as the
Principal Component Analysis (PCA).
Principal Component Analysis is
commonly used to obtain the
appropriate weights for the different
variables of the proposed index. The
first extracted principal component is
the factor that explains the largest
percentage of total variance (see Box
5.4, above, on Principal Component
Analysis).
Variables in the new vulnerability index
include: Food share; Poverty rate and
gap; Extreme poverty rate; Multi-
dimensional poverty rate; and Absence
of health or social insurance. These
variables were included in the index by
their raw values at the household level.
The first principal factor extracted from
the PCA was used as the vulnerability
index, and it explained 69 percent of the
total variation of the included variables.
Households were then classified
according to their vulnerability index
score into 5 quintiles, where each
quintile represents 20 percent of the
households in the sample, weighted by
household size. The first quintile
represents the highest vulnerability
category, while the last quintile
represents the least vulnerable category.
Table 5.9, and Map 3 demonstrates that
governorates in Upper Egypt have the greatest risk of high food insecurity. The population of Assiut
has an alarming level of vulnerability, with 59 percent classified among the highest vulnerability
category, and only 10 percent classified among the least vulnerable category. Conversely, people
living in Damietta and Suez are the least vulnerable to risks of food insecurity, with only 1.2 percent
and 1.9 percent, respectively, classified within the highest vulnerability category. Although urban
governorates like Cairo and Alexandria show a low prevalence of highly vulnerable categories,
nevertheless they encompass very poor neighbourhoods and slum areas that can best be identified
through a district level analysis, rather than a governorate level analysis.
Table 5.9: Distribution of Vulnerability
by Governorate, 2009
Governorate Very
High
High Medium Low Very
Low
Urban
Governorates 6.12 10.97 14.68 20.70 47.55
Cairo 7.19 11.48 14.39 23.15 43.80
Alexandria 6.24 12.45 16.91 18.92 45.48
Port Said 4.41 10.88 12.58 17.11 55.02
Suez 1.92 4.21 11.90 16.61 65.36
Lower Egypt 12.04 19.70 16.23 20.50 27.92
Damietta 1.20 6.79 18.34 42.61 31.06
Dakahlia 7.55 16.33 17.24 23.72 35.16
Sharkia 15.78 24.75 17.08 17.03 2.36
Qualiobia 9.49 17.83 14.33 17.32 41.03
Kafr el
Sheikh 9.67 18.95 18.22 29.07 24.09
Gharbeya 5.96 14.97 13.40 21.96 43.71
Menoufia 15.74 22.61 17.10 12.88 31.67
Beheira 20.92 25.72 17.45 17.80 18.11
Ismailia 16.25 19.60 12.06 15.52 36.57
Upper Egypt 35.46 24.16 13.43 10.84 16.11
Giza 22.14 20.00 14.78 17.32 25.77
Beni Suef 39.55 27.33 12.78 7.88 12.46
Fayoum 27.24 30.50 15.55 10.30 16.41
Menia 29.69 27.58 16.10 11.78 14.85
Assiut 59.37 17.57 7.01 5.77 10.28
Sohag 45.62 23.83 12.22 8.22 10.11
Qena 36.98 27.09 14.93 9.54 11.46
Aswan 37.76 24.54 10.57 7.98 19.15
Luxor 17.69 20.47 17.69 12.38 31.76
Frontier
Governorates 10.27 16.46 17.75 15.32 40.20
All Egypt 20.00 20.00 15.03 16.85 28.12
Source: Calculated using HIECS 2009

64 World Food Programme (WFP)
Map 3: Distribution of Population with “Very High” Vulnerability, 2009
0
10
20
30
40
50
60
70
None Secondary+
Very High
High
Medium
Low
Very Low
Source: Calculated using data from HIECS 2009.
Table 5.10, below, displays various characteristics associated with different categories of vulnerability.
The results indicate that the ability of households to withstand shocks declines as they expand in size; in
general highly vulnerable households have the largest number of individuals (6.55 persons on average).
The data also indicates a link between human capital assets (including education and skills) and
vulnerability; there is high correlation between the education of household head and vulnerability (Figure
5.6); more than half of the households with illiterate heads are classified as highly vulnerable to risks of
food insecurity.
Figure 5.6: Educational Status of Persons in Vulnerability Groups %

World Food Programme (WFP) 15
Table 5.10: Vulnerability Group Characteristics
Characteristics Very
High High Medium Low
Very
Low
Average Household Size 6.55 5.47 3.69 4.25 4.21
Prevalence of Food Deprivation (%) 52.21 26.31 13.48 4.73 6.47
Share of DDS Categories
Poor 36.10 23.20 13.80 11.20 15.70
Moderate 13.00 19.40 16.10 19.20 32.30
High 3.80 10.40 12.20 23.80 49.80
Gender of Head of Household
Male 20.40 20.34 14.49 16.07 28.70
Female 17.03 17.51 18.95 22.66 23.85
Educational Status of Household Head
None 29.41 25.37 16.87 15.19 13.16
Primary-Preparatory 15.05 20.13 15.34 21.04 28.44
Secondary 11.12 15.54 13.95 20.72 38.67
Secondary+ 3.55 7.69 10.00 14.25 64.51
Job Stability of Household Head
Permanent 18.029 20.020 12.497 19.176 30.277
Temporary 20.678 21.260 58.062
Seasonal 32.444 32.296 35.259
Casual 42.040 26.680 31.280
Employment Status of Household Head
Wage Earner 14.40 16.95 16.45 13.08 39.12
Self-employed with Employees 16.81 21.55 19.11 26.32 16.21
Self employed Working Alone 14.39 18.76 21.98 29.83 15.04
Unpaid Worker 18.33 16.67 31.67 23.33 10.00
Unemployed 14.62 10.00 14.62 43.08 17.69
Out of Labour Force 11.34 12.12 22.91 16.43 37.21
Source of Income
Income from Wages and Salaries 14.50 17.05 16.48 13.15 38.81
Income from Private Business in Agriculture 20.09 23.73 21.20 19.83 15.14
Income from Non-Agricultural Activities 10.26 14.95 15.68 28.72 30.41
Participation Rate in Labour Force 44.86 47.82 49.51 45.86 43.75
Source: Calculated using HIECS 2009.
In Egypt, as in many other developing countries, labour is the primary asset of many households, on which
they depend for a living. Whether they are able to use this asset to decrease their exposure to risks depends
on how successful they are in finding work, and how much they are able to earn. Therefore, even when
households revert to a coping strategy that improves their access to other resources such as land and
capital, the process of reducing vulnerability does not depend on the creation of an entitlement to rent or
annuity for those households but on the enhancement of their opportunity to be employed more intensively,
productively and remuneratively.
HIECS data reveals that job stability for the household head is a strong determinant of household exposure
to risk; nearly 69 percent of casual labourers are classified as being highly vulnerability to food insecurity,
while none are classified among the lowest vulnerability classes. This link between work stability of the
household head and vulnerability is confirmed by data in Table 5.10, as well as by Figure 5.7, below.

66 World Food Programme (WFP)
Source: Calculated using data from HIECS 2009.
Given that food insecurity in Egypt is in
principal an issue of accessibility and
lack of sufficient purchasing power,
unemployment and underemployment
become a serious threat to food security,
and therefore directly affect the
vulnerability status of households. It has
been increasingly acknowledged
worldwide that reducing vulnerability
means increasing access to productive
and decent employment. However, the
highly vulnerable have limited access to jobs. The lack of ability to participate in income-generating
activities by households members is a driver of vulnerability. Thus policies aiming at reducing risks to
food insecurity should be concerned about creating more stable and sustainable jobs, and providing social
assistance to those who are unable to work.
HIECS data also reveals that vulnerability is associated with harmful coping strategies such as child
labour and low school enrolment. As suggested by Table 5.11 and Figure 5.8, below, children in highly
vulnerable households have a higher risk of work and a lower probability of school enrolment. The
probability of work for the most vulnerable children is 5.17 percent, reduced to a negligible percentage for
children in the least vulnerable households. Moreover, basic school enrolment is almost universal for the
least vulnerable households, while the enrolment rate for the very high vulnerable households is 83
percent, lower by 14 percentage point than the least vulnerable.
Source: Calculated using data from HIECS 2009.
0
10
20
30
40
50
permanent occasional
Very High
High
Medium
Low
Very Low
0.00
5.00
10.00
15.00
20.00
Child Labour non Enrolment
Figure 5.8: Child labour and enrolment rate by vulnerability categories
very high
high
moderate
low
very low
Table 5.11: Child Labor & Enrolment Rate by Vulnerability
Categories
Vulnerability Category Child Labour School Enrolment
Very High 5.17 83.32
High 3.85 88.95
Moderate 4.11 87.79
Low 0.46 96.55
Very Low 0.18 97.07
All 2.70 90.79
Source: Calculated using HIECS 2009
Figure 5.7 Employment of Persons in Vulnerability Groups
Figure 5.8: Child Labour and Enrolment Rate by
Vulnerability Categories
%
%

World Food Programme (WFP) 17
CHAPTER SIX:
CONCLUSIONS AND MAIN RECOMMENDATIONS
Key Recommendations:
The targeting of food insecure and vulnerable populations must be revisited based
on a careful assessment of the attributes and determinants of food insecurity across
all regions.
Given the cumulative deterioration in key sources of foreign exchange since
February 2011, food availability in Egypt is a point of concern. Accordingly, the
focus on securing foreign inflows while increasing net domestic production is
required.
Upper Egypt, Beheira and Menoufia require programs that focus on income
generation, sufficient food intake and nutritional awareness, while the focus in
Frontier governorates and the rest of Lower Egypt should be on nutritional
awareness programs.
A more in-depth investigation is needed to justify the higher prevalence of child
malnutrition in Lower Egypt as well as the sudden structural change in prevalence
rates between 2005 and 2008. Malnutrition is an area of main concern in Egypt that
deserves wider attention and further analysis.
Since price stabilization of essential food items is vital for the poor, an in-depth
study of market structure, market integration and the price chain of essential foods is
both required and highly recommended.
It has been increasingly acknowledged worldwide that reducing vulnerability means
increasing access to productive and decent employment. Accordingly, policies
aiming at reducing risks to food insecurity should be concerned about creating more
stable and sustainable jobs, and providing social assistance to those who are unable
to work.

68 World Food Programme (WFP)
6 CONCLUSIONS & MAIN RECOMMENDATIONS
Although Egypt is a middle-income country that placed itself on a high growth track speared by
economic reform during 2005-2010, nevertheless, income poverty, food insecurity and multi-
dimensional poverty are widely prevalent, most severely in the rural areas of Upper Egypt.
The macroeconomic context in Egypt has both direct and indirect impacts on the status of food
security in Egypt. In 2005 Egypt began actively implementing a macroeconomic structural reform
program designed to move Egypt towards a more market-oriented economy. At the macro-level, the
economy achieved high levels of real GDP growth during 2005-2008 that was accompanied by
increasing investment inflows, improving balance of payments, a decline in fiscal deficit to GDP and
domestic debt ratios and stability in foreign exchange market, however little change has trickled down
to lower income groups. Poverty rates remained high and persistent inf lation in consumer prices
continued to threaten the real purchasing power of the lowest income deciles.
The results of the study show that although poverty and food insecurity are strongly correlated in
Egypt, not all the poor are food insecure. Therefore, the targeting of food insecure and vulnerable
populations must be revisited based on a careful assessment of the attributes and determinants of food
insecurity across all regions.
In-depth analysis of the main pillars of food insecurity analysis shows that economic access to food
continues to be the most significant food security concern in Egypt, however food availability – which
is currently secured- is highly sensitive to fluctuations in international prices and the availability of
foreign exchange. Furthermore, Egypt is highly dependent on imported foods, particularly food
commodities that feature heavily in the regular diets of the poor (wheat, cereals, vegetable oil and
sugar). Despite the market availability of food, its sufficiency is very much determined by fluctuations in
international prices and the availability of foreign exchange. Therefore, food availability in Egypt is seen
as vulnerable mainly to international food price shocks on the one hand and shocks to balance of payments
on the other. The focus on securing foreign inflows while increasing net domestic production is currently
needed, especially with the recent deterioration in balance of payments since February 2011 and the drop
in net foreign reserves. Accordingly, the focus on securing foreign inflows while increasing net
domestic production is currently needed. However, a variety of factors continue to constrain Egypt‘s
potential for increasing domestic food production. These include land fragmentation and agricultural
land being lost to urbanization. In ―old lands‖, land fragmentation is the main problem that hinders
cultivation of strategic staple crops such as wheat. There are also numerous environmental factors
that entail risks to food production, including increasing desertification, increasing soil salinity;
reduced natural fresh water resources; and rising temperatures have had an increasing impact on the
growth cycles of various crops, with cereal yields expected to decrease.
The food security assessment involved close investigation of caloric deprivation, dietary diversity,
deficiency in essential nutrient elements and income poverty. The results show that the prevalence of
caloric deprivation is notable (20 percent of the total population) however, the deficiency in dietary
diversity is even more compelling (33 percent of the total population), while income poverty
represents 21.6 percent of the population.
The cross tabulation of caloric deprivation, dietary diversity and income poverty shows that 16.3
percent of the population is suffering income poverty and poor food consumption while 26.1 percent
of the population is non-poor yet suffering poor food consumption. The coexistence of income poverty
together with poor food consumption is highest in the governorates of Upper Egypt (58.2 percent in
Assiut, 39.2 percent in Sohag and 36.1 percent in Beni Suef) followed by Beheira and Menoufia in
Lower Egypt. On the other hand, the percent of non-income poor having poor food consumption is
highest in Menoufia (45 percent), Giza (44.8 percent), Luxor (43.4 percent) and Frontier Governorates
(33.9 percent).

World Food Programme (WFP) 19
There is a strong positive correlation between proxy indicators of food insecurity and both monetary
and non-monetary poverty levels; as well as between food insecurity indicators and household size. At
the same time, multiple sources of income and educational level are negatively correlated to indicators
of food insecurity. Results show that casual labour are more exposed to the risks of food insecurity
than others, and workers in the agricultural sector are slightly more inclined to be food insecure than
others.
The results indicate that Upper Egypt and partially Beheira and Menoufia require programs that focus
on income generation, sufficient food intake and nutritional awareness, while the focus in Frontier
governorates and the rest of Lower Egypt will be on nutritional awareness programs. District level
analysis is expected to yield more comprehensive results that will allow for sub-governorate
interventions and a more accurate assessment of food insecurity.
As for indicators of food utilization; the prevalence of malnutrition for children below five years of
age across governorates and regions suggests that the nutritional status of children in Egypt is not
directly related to food access indicators and it is not significantly related to socioeconomic
characteristics of the household and is possibly explained by other factors, such as the availability of
health services, clean water and sanitation. Further in-depth investigation of the prevalence and causes of
malnutrition among children is still needed as the EDHS 2008 did not empirically explain causal factors of
malnutrition among children and did not explain the reasons for higher prevalence of child malnutrition
in Lower Egypt as well as the sudden structural change in prevalence rates between 2005 and 2008.
On the other hand, malnutrition indicators for youth (10-19) seem more consistent with the status of
food insecurity and poverty in Egypt. Generally, malnutrition is an area of main concern in Egypt that
deserves wider attention and further analysis.
A close look at income poverty and multi-dimensional poverty shows that there are 16.3 million
people who live in households that spend less than the minimum level needed to meet basic needs,
representing 21.6 percent of the population. The incidence of poverty is highest in rural Upper Egypt
where 43.7 percent of the population is classified as poor. Also, the data indicates that approximately
11.8 percent of the population in Egypt is in extreme multi-dimensional poverty, i.e., deprived in at
least 3 out of eight dimensions of deprivation, regardless of which dimensions were identified.
Deprivation in assets is the most widespread dimension (14 percent), followed by the proportion of
people who lack sanitation facilities (9.1 percent). Furthermore, 6.5 percent of Egyptians live in
families with at least one child not enrolled in basic education, and 6.2 percent live in households
whose members have no basic or higher education. These rates rise considerably if we refine our
analysis to capture the poor alone, where 22 percent are deprived of assets, 14 percent deprived of
sanitation facilities, 18 percent live in households where at least one child is not enrolled in basic
education and 13 percent live in households that have uneducated heads. In general, both income
poverty and multi-dimensional poverty threaten the ability of households to cope with risks to food
insecurity.
The vulnerability index for 2009 shows that households facing ―very high‖ levels of vulnerability to
food insecurity make up 20 percent of the population. Governorates in Upper Egypt have the greatest
risk to higher food insecurity and Assiut has an alarming level of vulnerability, since 59 percent of its
population are classified among the highest vulnerability‖ category. Conversely, people living in
Damietta and Suez are the least vulnerable to risks of food insecurity, 1.2 percent in Damietta and 1.9
percent in Suez are classified within the highest vulnerability category. Although urban governorates
like Cairo and Alexandria show low prevalence of highly vulnerable categories, nevertheless they
encompass very poor neighbourhoods and slum areas that can be more clearly illuminated through a
district level analysis rather than a governorate level analysis.
Also, the estimated probability of caloric deficiency across governorates indicates that 9.4 percent of
the total population are at high risk of becoming caloric deficient, 28.1 percent are at moderate risk,
while 62.5 percent are at low risk; and rural residents have a greater risk of becoming caloric deficient

70 World Food Programme (WFP)
(10.5 percent are at high risk and 30.6 percent are at moderate risk) than urban residents (7.8 percent
are at high risk and 24.5 percent are at moderate risk).
One of the most significant threats to household access to food is persistent inflation in domestic
prices of food. In fact, food prices largely explain the food consumption patterns for the poor and near
poor in Egypt. Price stabilization of essential food items is vital for the poor, thus in -depth study of
market structure, market integration and the price chain of essential foods is both required and highly
recommended.
Given that food insecurity in Egypt is in principal an issue of accessibility and lack of sufficient
purchasing power, unemployment and underemployment become a serious threat to food security, and
it therefore affects the vulnerability status of households. It has been increasingly acknowledged
worldwide that reducing vulnerability means increasing access to productive and decent employment.
However, the highly vulnerable have limited access to jobs. The lack of ability to participate in
income-generating activities by household members is a driver of vulnerability. Thus policies aiming
at reducing risks to food insecurity should be concerned about creating more stable and sustainable
jobs, and providing social assistance to those who are unable to work.

World Food Programme (WFP) 71
REFERENCES
Baker, Marcia Merry and Ramtanu Maitra (2008), ―Egypt can attain food sufficiency once WTO
globalization is shut down‖, Executive Intelligence Review (EIR), July.
Breisinger, C., et, al (2010), ―Food Security and Economic Development in the Middle East and
North Africa‖, International Food Policy Research Institute, Discussion Paper No. 00985.
Diaz-Bonilla, E.M. Thomas and S. Robinson (2002), ―Trade liberalization, WTO and Food
Security”, International Food Policy Research Institute, Trade and Macroeconomics Division,
Discussion Paper No. 82. Washington, D.C.
Food and Agriculture Organization (2007), ―Guidelines For Measuring Household and Individual
Dietary Diversity‖, Nutrition and Consumer Protection Division, FAO.
Food and Agriculture Organization, World Health Organization and United Nations University
(2001), ―Energy and protein requirements‖, WHO, Joint FAO/WHO/UNU Expert Consultation,
WHO Technical Report No. 724.
Food and Agriculture Policy Research Institute (2009), ―U.S. and World Agricultural Outlook‖,
FAPRI, Staff Report, January.
Khalid Khatab (2010), ―Childhood Malnutrition in Egypt using Geoadditive Gaussian and Latent
Variable Models‖, Am. J. Trop. Med. Hyg., 82(4), pp. 653–663.
L.K. Zottarelli, T.S. Sunil and S. Rajaram (2007), ―Influence of Partental and Socioeconomic
Factors on Stunting in Children Under 5 Years in Egypt‖, La Revue de Sante de la Mediterranee
Orientale, Vol. 13, No 6.
Naa Dodua Dodoo (2011), ―Simultaneous Stunting and Obesity in Egypt‘s Children‖, Population
Association of America 2011 Annual Meeting Program, Washington D.C., March 31 – April 2.
United Nations Children‘s Fund (2011), ―Malnutrition Booklet for Egypt‖, UNICEF Egypt,
March.
United Nations World Food Programme (2009), ―Comprehensive Food Security & Vulnerability
Analysis Guidelines‖, WFP Food Security Analysis Service, Rome, January.
United Nations World Food Programme (2010), ―Comprehensive Food Security Survey CFSS;
Republic of Yemen‖, WFP Yemen, March.
United Nations World Food Programme (2009), ―Vulnerability analysis and review of food
subsidy program in Egypt‖, WFP Egypt, February.
Vandemoortele, J. (2000), ―Absorbing Social Shocks, Protecting Children and Reducing Poverty‖,
United Nations Children’s Fund, New York.
Wiesmann, D., et al. (2008), ―Validation of Food Frequency and Dietary Diversity as Proxy
Indicators of Household Food Security‖, International Food Policy Research Institute , May.
World Bank (2007), ―A Poverty Assessment Update; Arab Republic of Egypt‖, WB, Report No.
39885 – EGT.
Yu, B., L. You, and S. Fan. (2009), ―Towards a typology of food security in developing countries”,
International Food Policy Research Institute, Washington, D.C, Discussion Paper No. 945.

72 World Food Programme (WFP)
ANNEXES
ANNEX 1: CALCULATION OF FOOD POVERTY LINE AND TOTAL POVERTY LINE
a) The Food Poverty Line (FPL)/Extreme Poverty Line. The first step is to choose a food bundle that
reaches the predetermined calorie requirements, with a composition that is consistent with the
consumption behaviour of the poor. This bundle was defined for individuals in different age brackets,
gender, and activity levels (using tables from the World Health Organization). Then, FPLs were set at the
cost of the required calories, by how they are actually obtained in the sample (on average) by the second
quintile. This food basket of the second quintile is thus priced using the differing prices for the food in
each region and at each date16. Thus the relative quantities observed in the diet of the poor (proxied by the
second quintile), and the prices they face, were maintained in constructing the FPL for each household in
the sample. Households whose expenditure is below the FPL are referred to as the "extreme poor".
b)The Total Poverty Line (TPL). When the FPL is augmented by an allowance for expenditure on essential
non-food goods, it defines the total poverty line in terms of those households who have to displace food
consumption to allow for non-food expenditures, deemed a minimum indispensable level of non-food
requirements. Following Engel's Law, the non-food allowance can be estimated by identifying the share of
non-food expenditure for households whose total expenditure was equivalent to the food poverty line (See
Box 5.1 for more details on P0 and other poverty measurements). Any household that spends less than the
TPL is considered poor. Therefore, the extreme poor are just a sub group of the poor.
ANNEX 2: MULTIDIMENSIONAL POVERTY
As stated in the global HDR 2010:Equity and the human development are systematically related: countries
that do well on the human development tend to be more equitable. This result is consistent with research
that shows how reducing inequality—both in the population as a whole and across gender and other
groups—can improve overall outcomes in health and education, as well as economic growth. Multi-
dimensional poverty is concerned about measuring deprivations in several dimensions of well-being.
Comparisons between human development and multi-dimensional poverty are two different methods to
assess development. One of these methods is the ―overall perspective‖ which concentrates on progress
aspects achieved by the society as a whole, poor and rich. An alternative point of view to this method is the
―deprivation perspective‖ by which development is judged based on the poor and underprivileged way of
life in society. Any considerable progress – of any size – achieved by the rich in a society which will
increase the human development index for the whole society but it does not necessarily signify an
improvement in reducing deprivation amongst the underprivileged categories.
At the macro level, the focus is on the life and success of the whole population. It would be wrong – in our
understanding of the development process – not to fully grasp the gains and losses of those more fortunate
than others. That will be in contradiction with the right of each citizen to be taken into account; it also
contradicts with the overall considerations of public ethics. Nonetheless, the general concern in the
progress achieved by any country should focus specifically on the status of underprivileged categories‖.
16 The food baskets represent a balanced diet of calories, proteins, fats, and carbohydrates for various groups of individuals: Food
basket includes 273 foods and ensures 2470 daily calories intake, 43.4 percent of which come from cereals (200 gm), 10.4 percent
from oil and butter (30 gm), and 6.6 percent from sugar (40 gm). The basket includes also small amounts of fresh fish (20 gm),
meat and poultry (40 gm), eggs (180gm), milk and milk products (60 gm) and a range of local vegetables (170 gm) and fruits (70
gm).

World Food Programme (WFP) 73
Over the last two decades there has been widespread acceptance of the view that poverty is more than a
lack of material resources; material resources are necessary but not sufficient to escape poverty. In the
word of Amartya Sen (1999) ‗income is only a means to reduce poverty and not the end of it‘.
Well-being is also a reflection of individual‘s rights and responsibilities. Individual well-being can be
thought as the realization of these rights, whilst individual deprivation, or poverty, results from the
denial of these rights.
Like development, poverty is multidimensional. The Multi-dimensional Poverty Index (MPI) complements
money-based measures by considering multiple deprivations and their overlap. The index identifies
deprivations three dimensions; Education, health and living standards, and shows the number of people
who are poor (suffering a given number of deprivations) and the number of deprivations with which poor
households typically contend. It can be deconstructed by region, ethnicity and other groupings as well as
by dimension, making it an apt tool for policymakers.
Identifying poverty as a multidimensional phenomenon is the main key issue in improving living
standards. The multi dimensional approach of welfare emphasizes that deprivation can be seen as a state of
lacking assets; economic, social and human assets. Economic and physical assets include land, livestock,
housing, skills, good health, labour and other sorts of financial capital that provide basis of generating
income and production, either now or in the future. Human assets also include skills and talents. So
people‘s ability to attack poverty can be strengthened by education and training that opens a wider range
of opportunities. People without formal education have many skills–traditional knowledge and other
physical and intellectual skills–that can be tapped to fight poverty. People‘s ability to draw on relationship
with other people on the basis of trust is a social asset. People borrow from one another to meet immediate
needs for food or faced with an illness, women in poor neighbourhoods may share cooking and childcare.
Such relationships of trust can be the basis of community organizations to take collective social and
political action. However, all these assets are linked. Social assets can reinforce economic assets. The
community solidarity that leads to collective political action to negotiate for better schools can improve
economic assets by increasing the chances of employment. People, households and communities use their
assets to develop strategies to attack poverty. The more assets they have, the less their vulnerability and
the greater their ability to cope with poverty. But any erosion of these assets increases their vulnerability
and insecurity. Building on and reinforcing the assets of poor people helps them fight poverty themselves.

74 World Food Programme (WFP)
ANNEX 3: MAPS OF DEFICIENCY IN NUTRIENT ELEMENTS AVAILABLE FOR HOUSEHOLD INTAKE
Map A1: Iron Deficiency by Governorate, 2009
Map A2: Protein Deficiency by Governorate, 2009

World Food Programme (WFP) 75
Map A2: Protein Deficiency by Governorate, 2009

76 World Food Programme (WFP)
Map A3: Vitamin -A- Deficiency by Governorate, 2009

World Food Programme (WFP) 77
Map A4: Zinc Deficiency by Governorate, 2009