the steel construction institute - blindbolt.co.uk · performed at the university of manchester on...
TRANSCRIPT


© The Steel Construction Institute 2 Printed 16/07/09 P:\CDA\CDA203\RT1303\RT1303v01d02.doc
The Blind Bolt Company Design resistances of Blind Bolts
The Steel Construction Institute Silwood Park Ascot Berkshire, SL5 7QN. Telephone: +44 (0) 1344 636525 Fax: +44 (0) 1344 636570 Email: [email protected] For information on publications, telephone direct: +44 (0) 1344 636560 or Email: [email protected] For information on courses, telephone direct: +44 (0) 1344 636500 or Email: [email protected] World Wide Web site: http://www.steel-sci.org/

The Blind Bolt Company Design resistances of Blind Bolts
© The Steel Construction Institute P:\CDA\CDA203\RT1303\RT1303v01d02.doc Printed 16/07/09 3
EXECUTIVE SUMMARY
In order to verify the load carrying capabilities of blind bolts, a series of tests have been performed at the University of Manchester on M10, M20 and M24 bolts. This report details the testing and analysis of these bolts for design to both the British Standards and the Eurocodes.
A total of 77 tests were performed: 9 coupon tests to determine the material strength; 14 pure tension tests to determine the tensile resistance of the bolts; 15 pure shear tests to determine the shear resistance of the bolts; 18 combined tension and shear tests to validate the design equations in BS 5950-1 and BS EN 1993-1-8; and 21 bearing tests to establish the performance of the bolts in bearing.
An analysis of each type of test was performed using the methodology in BS EN 1990, and a series of design rules, based on current practice for standard bolts, has been proposed. In general, these follow the current rules using modified areas as appropriate, except for the tensile resistance of blind bolts where a reduced strength, determined from the tests, is used. The test results also showed that the combined tension and shear equations in both BS 5950-1 and BS EN 1993-1-8 can be adopted for blind bolts.
The design capacities in tension and shear of blind bolts to BS 5950-1 are presented in the following table. Values for the bolt types that were not tested have been calculated using the equations developed from the tests.
Bolt type Tension capacity (kN) Shear capacity of slotted region (kN)
M8* 6.91 9.27
M10 12.94 15.85
M12* 18.81 21.95
M16* 40.16 42.94
M20 57.88 63.41
M24 82.38 87.81
* Tests were not performed on these bolt types
A suggested presentation of the technical information for direct use by structural designers has been proposed in Appendix A.
This report has been prepared by Mr Andy Smith and reviewed by Mr David Brown, both of the SCI.

© The Steel Construction Institute 4 Printed 16/07/09 P:\CDA\CDA203\RT1303\RT1303v01d02.doc
The Blind Bolt Company Design resistances of Blind Bolts

The Blind Bolt Company Design resistances of Blind Bolts
© The Steel Construction Institute P:\CDA\CDA203\RT1303\RT1303v01d02.doc Printed 16/07/09 5
CONTENTS Page No.
EXECUTIVE SUMMARY 3
1 INTRODUCTION 7
2 TEST PROCEDURES 9 2.1 Introduction 9 2.2 Shear resistance 9 2.3 Tension Resistance 9 2.4 Tension and Shear 10 2.5 Bearing resistance 11
3 TEST RESULTS 13 3.1 Coupon tests 13 3.2 Tension tests 14 3.3 Shear tests 14 3.4 Combined tension and shear tests 15 3.5 Bearing tests 17
4 CURRENT PRACTICE 21 4.1 Design of bolts in tension 21 4.2 Design of bolts in shear 22 4.3 Design of bolts in combined tension and shear 23 4.4 Design of bolts in bearing 24
5 DERIVATION OF CHARACTERISTIC AND DESIGN VALUES 27 5.1 Tension resistance 27 5.2 Shear resistance 30 5.3 Combined tension and shear 33 5.4 Bearing resistance 34
6 SUMMARY OF DESIGN RULES FOR BLIND BOLTS 43 6.1 Design of bolts in tension 43 6.2 Design of bolts in shear 43 6.3 Design of bolts in combined tension and shear 44 6.4 Design of bolts in bearing 45 6.5 Bolt dimensions 46
7 CONCLUSIONS 47
8 REFERENCES 49
APPENDIX A TECHNICAL INFORMATION 51 A.1 DESIGN TO BS 5950-1 51 A.2 DESIGN TO BS EN 1993-1-8 51 A.3 GENERAL NOTE 51
APPENDIX B TEST RESULTS 53 B.1 COUPON TESTS 53 B.2 TENSION TESTS 54 B.3 SHEAR TESTS 56 B.4 COMBINED TENSION AND SHEAR TESTS 58

© The Steel Construction Institute 6 Printed 16/07/09 P:\CDA\CDA203\RT1303\RT1303v01d02.doc
The Blind Bolt Company Design resistances of Blind Bolts
B.5 BEARING TESTS 61

The Blind Bolt Company Design resistances of Blind Bolts
© The Steel Construction Institute P:\CDA\CDA203\RT1303\RT1303v01d02.doc Printed 16/07/09 7
1 INTRODUCTION
In order to verify the load carrying capabilities of blind bolts, a series of tests have been performed at the University of Manchester on M10, M20 and M24 bolts. This report details the testing and analysis of these bolts for design to both the British Standards and the Eurocodes.
Section 2 summarises the test procedures that were used at the University of Manchester and the results are presented in Section 3. Section 4 details the current design rules to both the British Standards and the Eurocodes. The analysis of the test results is presented in Section 5, and the resulting design equations are summarised in Section 6.
Figure 1.1 Blind bolts

© The Steel Construction Institute 8 Printed 16/07/09 P:\CDA\CDA203\RT1303\RT1303v01d02.doc
The Blind Bolt Company Design resistances of Blind Bolts

The Blind Bolt Company Design resistances of Blind Bolts
© The Steel Construction Institute P:\CDA\CDA203\RT1303\RT1303v01d02.doc Printed 16/07/09 9
2 TEST PROCEDURES
2.1 Introduction Four types of test were performed on the blind bolts, as follows:
Shear
Tension
Combined Tension and Shear
Bearing
The testing procedure for each test is described in the following Sections.
Although the aim of the current proposal is to determine resistances to BS 5950-1[1], the testing regime and procedures have followed that prescribed in the Eurocodes, so that, if CE Marking is progressed at some future date, the test results may be used. In particular, the Eurocodes demand a formal statistical analysis to determine characteristic resistances and design resistances.
Requirements for testing are given in BS 4190[2], which in turn demands that mechanical testing is undertaken in accordance with ISO 898-1[3].
2.2 Shear resistance Testing the shear resistance of a bolted assembly is straightforward. The tests involve placing sample bolts in appropriate material, such that the shear plane is in the required location. Applied load and deformation are measured.
Plates are made strong and substantial, to minimise the deformation due to bearing in the plates.
Shear at 90° to the slot has not been tested at this time, as the failure mechanism is likely to be complex, involving Vierendeel bending within the shank of the bolt. In any event, the resistance according to BS 5950-1 is likely to be limited by the deformation of the assembly, which is notionally set at 1.5 mm at serviceability loads.
2.3 Tension Resistance Testing the tensile resistance of a bolted assembly is straightforward. It is relatively common to test bolts in tension by applying a compressive force to an assembly consisting of two “U” shaped blocks, bolted together across their tips. A photo of the test arrangement is shown in Figure 2.1.

© The Steel Construction Institute 10 Printed 16/07/09 P:\CDA\CDA203\RT1303\RT1303v01d02.doc
The Blind Bolt Company Design resistances of Blind Bolts
2.4 Tension and Shear Rather than calculating a resistance, the testing has been performed simply to demonstrate the appropriateness of the interaction equation in BS 5950-1 and BS EN 1993-1-8[4]. To demonstrate this, tests have been performed with a tension force at angles of 30°, 45° and 60° to the pure tension direction. A photo of the test arrangement is shown in Figure 2.2
Figure 2.1 Test arrangement for tensile tests

The Blind Bolt Company Design resistances of Blind Bolts
© The Steel Construction Institute P:\CDA\CDA203\RT1303\RT1303v01d02.doc Printed 16/07/09 11
2.5 Bearing resistance Bearing resistance is complicated by the variables involved, which include plate thickness and steel grade.
The test arrangement consists of two plates with a third between, as shown in Figure 2.3. The plate of interest is the central, single plate.
Figure 2.2 Test arrangement for combined shear and tension
Figure 2.3 Test arrangement to determine bearing resistance

© The Steel Construction Institute 12 Printed 16/07/09 P:\CDA\CDA203\RT1303\RT1303v01d02.doc
The Blind Bolt Company Design resistances of Blind Bolts
Bolts were specially manufactured with a longer slot to enable sheet thicknesses of up to 15 mm to be used in the test. The failure modes for M10 and M20 bolts are shown in Figure 2.4 and Figure 2.5 respectively.
Figure 2.4 Failure of M10 bolts in bearing
Figure 2.5 Failure of M20 bolts in bearing

The Blind Bolt Company Design resistances of Blind Bolts
© The Steel Construction Institute P:\CDA\CDA203\RT1303\RT1303v01d02.doc Printed 16/07/09 13
3 TEST RESULTS
Testing on the blind bolts was undertaken by the University of Manchester in February 2009. The results are summarised in the following sections, and plots of every test are presented in Appendix B.
3.1 Coupon tests Samples were taken from each size of bolt to establish the yield strength and ultimate tensile strength of the material. A typical plot of stress against strain is presented in Figure 3.1, and the results are summarised in Table 3.1. The remaining plots are shown in Appendix B.1.
Table 3.1 Yield stress, fyb, and ultimate stress, fub, from coupon tests
Bolt type Test number fyb (N/mm²) fub (N/mm²)
M10 1 1059.3 1113.1
2 1053.9 1107.9
3 1047.2 1101.4
Mean 1053.5 1107.5
M20 1 976.9 1039.9
2 960.6 1056.1
3 1013.0 1075.9
Mean 983.5 1057.3
M24 1 906.2 1002.5
2 927.5 1026.0
3 924.0 1013.8
Mean 919.2 1014.1
0
200
400
600
800
1000
1200
Strain
Str
ess
(N/m
m²)
Figure 3.1 Stress-strain relationship for M10 material

© The Steel Construction Institute 14 Printed 16/07/09 P:\CDA\CDA203\RT1303\RT1303v01d02.doc
The Blind Bolt Company Design resistances of Blind Bolts
3.2 Tension tests Five tensile tests were performed on each of the three bolt sizes. A typical plot of load-deformation is shown in Figure 3.2, and the results of each test are presented in Table 3.2. The remaining plots are shown in Appendix B.2.
Table 3.2 Tension test results
Bolt type Test number Maximum tensile force (kN)
M10 1 18.63
2 19.73
3 -*
4 18.26
5 18.11
M20 1 80.41
2 81.19
3 84.00
4 81.38
5 85.53
M24 1 115.20
2 114.09
3 117.11
4 111.53
5 122.29
* Test failed
3.3 Shear tests Shear tests were performed on each of the three bolt sizes, with the shear plane generally through the slotted region. However, additional tests were also performed on the M10 bolts with the shear plane through the threaded region. A
0
5
10
15
20
25
0 1 2 3 4 5 6 7 8 9
Extension
Lo
ad (
kN
)
Figure 3.2 Load-deformation plot for M10 tension tests

The Blind Bolt Company Design resistances of Blind Bolts
© The Steel Construction Institute P:\CDA\CDA203\RT1303\RT1303v01d02.doc Printed 16/07/09 15
typical plot of load-deformation is shown in Figure 3.3, and the results are summarised in Table 3.3. The remaining plots are shown in Appendix B.3.
Table 3.3 Shear test results
Bolt type Shear plane Test number Maximum shear force (kN)
M10 Slotted region 1 40.25
2 33.77
3 32.45
Threaded region 1 58.90
2 58.35
3 58.16
M20 Slotted region 1 157.49
2 150.91
3 161.16
M24 Slotted region 1 259.98
2 251.80
3 261.07
4 251.57
5 273.38
6 267.13
3.4 Combined tension and shear tests Tests for combined tension and shear were only performed for the M10 and M20 bolts. In each case three tests were performed at each of three angles, 30º, 45º and 60º. A typical load-deformation plot is given in Figure 3.4, and the
0
5
10
15
20
25
30
35
40
45
0 1 2 3 4 5 6 7 8
Shear displacement
For
ce (
kN)
Figure 3.3 Load-deformation plot for M10 shear tests (shear plane
through slotted region)

© The Steel Construction Institute 16 Printed 16/07/09 P:\CDA\CDA203\RT1303\RT1303v01d02.doc
The Blind Bolt Company Design resistances of Blind Bolts
results are summarised in Table 3.4. The remaining plots are shown in Appendix B.4.
Table 3.4 Combined tension and shear test results
Bolt type
Angle Test number
Maximum force (kN)
Tension component (kN)
Shear component (kN)
M10 30º 1 22.88 19.82 11.44
2 22.70 19.66 11.35
3 22.22 19.24 11.11
45º 1 26.53 18.76 18.76
2 29.57 20.91 20.91
3 28.12 19.88 19.88
60º 1 38.66 19.33 33.48
2 39.48 19.74 34.19
3 37.86 18.93 32.78
M20 30º 1 100.53 87.06 50.27
2 97.88 84.77 48.94
3 96.32 83.42 48.16
45º 1 125.11 88.46 88.46
2 122.53 86.64 86.64
3 129.31 91.44 91.44
60º 1 154.42 77.21 133.73
2 154.53 77.27 133.83
3 153.68 76.84 133.09
The tension component is calculated as Fcos, and the shear component as Fsin.
0
5
10
15
20
25
0 1 2 3 4 5 6 7 8 9 10
Displacement
Lo
ad (
kN
)
Figure 3.4 Load-deformation plot for M10 bolts at 30º

The Blind Bolt Company Design resistances of Blind Bolts
© The Steel Construction Institute P:\CDA\CDA203\RT1303\RT1303v01d02.doc Printed 16/07/09 17
3.5 Bearing tests Tests to determine the bearing resistance were performed on each of the three bolt sizes with three thicknesses of plate, each at two different steel grades. A plot of the results from the M10 tests with a 6 mm, S275 plate is shown in Figure 3.5, and the results are summarised in Table 3.5, Table 3.6 and Table 3.7 for the M10, M20 and M24 tests respectively. Plots of all the tests are presented in Appendix B.5.
0
10
20
30
40
50
60
70
0 2 4 6 8 10 12 14
Bearing deformation
Fo
rce
(kN
)
Figure 3.5 Load-deformation plot for bearing test on M10 bolts in
6 mm, S275 plate

© The Steel Construction Institute 18 Printed 16/07/09 P:\CDA\CDA203\RT1303\RT1303v01d02.doc
The Blind Bolt Company Design resistances of Blind Bolts
Table 3.5 Bearing test results for M10 bolts
Plate thickness (mm)
Steel grade Test number Failure mode Maximum force (kN)
6 S275 1 Bolt shear 58.60
2 Bolt shear 55.08
3 Bolt shear 59.14
S355 1 Bolt shear 56.10
2 Bolt shear 55.44
3 Bolt shear 54.76
10 S275 1 Bolt shear 53.75
2 Bolt shear 59.67
3 Bolt shear 56.07
S355 1 Bolt shear 56.16
2 Bolt shear 57.26
3 Bolt shear 53.65
15 S275 1 Bolt shear 51.53
2 Bolt shear 53.72
3 Bolt shear 52.57
S355 1 Bolt shear 54.22
2 Bolt shear 50.20
3 Bolt shear 51.30
Table 3.6 Bearing test results for M20 bolts
Plate thickness (mm)
Steel grade Test number Failure mode Maximum force (kN)
6 S275 1 Plate bearing 148.41
2 Plate bearing 146.72
3 Plate bearing 140.21
S355 1 Plate bearing 166.49
2 Plate bearing 172.29
3 Plate bearing 165.28
10 S275 1 Bolt shear 151.91
2 Bolt shear 180.08
3 Bolt shear 155.17
S355 1 Bolt shear 172.09
2 Bolt shear 183.98
3 Bolt shear 151.91
15 S275 1 Bolt shear 135.18
2 Bolt shear 139.75
3 Bolt shear 138.04
S355 1 Bolt shear 133.03
2 Bolt shear 142.70
3 Bolt shear 133.82

The Blind Bolt Company Design resistances of Blind Bolts
© The Steel Construction Institute P:\CDA\CDA203\RT1303\RT1303v01d02.doc Printed 16/07/09 19
Table 3.7 Bearing test results for M24 bolts
Plate thickness (mm)
Steel grade Test number Failure mode Maximum force (kN)
6 S275 1 Plate bearing 176.61
2 Plate bearing 176.68
3 Plate bearing 179.73
S355 1 Plate bearing 200.39
2 Plate bearing 203.64
3 Plate bearing 212.41
10 S275 1 Plate bearing 267.18
2 Plate bearing 273.30
3 Plate bearing 261.97
S355 1 Plate bearing 282.57
2 Plate bearing 296.69
3 Plate bearing 287.46
15 S275 1 Bolt shear 280.84
2 Bolt shear 244.83
3 Bolt shear 245.37
S355 1 Bolt shear 278.98
2 Bolt shear 288.38
3 Bolt shear 272.49

© The Steel Construction Institute 20 Printed 16/07/09 P:\CDA\CDA203\RT1303\RT1303v01d02.doc
The Blind Bolt Company Design resistances of Blind Bolts

The Blind Bolt Company Design resistances of Blind Bolts
© The Steel Construction Institute P:\CDA\CDA203\RT1303\RT1303v01d02.doc Printed 16/07/09 21
4 CURRENT PRACTICE
Currently bolt design is carried out to either BS 5950-1, Section 6 or BS EN 1993-1-8, Table 3.4. The rules in each Standard for the four design cases are summarised in the following Sections. Note that the design values quoted are for standard bolts, rather than for blind bolts.
4.1 Design of bolts in tension 4.1.1 BS 5950-1
The tension resistance of bolts to BS 5950-1 is calculated from:
ttt ApP (1)
where:
Pt is the tension capacity
At is the tensile stress area of the bolt
pt is the tension strength of the bolt, calculated from
bbt 7.0 YUp (2)
where:
Ub is the specified minimum tensile strength of the bolt (1000 N/mm² for grade 10.9)
Yb is the specified minimum yield strength of the bolt (900 N/mm² for grade 10.9)
4.1.2 BS EN 1993-1-8 The tension resistance of bolts to BS EN 1993-1-8 is calculated from:
M2
sub2Rdt,
AfkF (3)
where:
Ft,Rd is the tension resistance
k2 = 0.9 for non-countersunk bolts
fub is the ultimate tensile strength of the bolt (1000 N/mm² for grade 10.9)
As is the tensile stress area of the bolt
M2 = 1.25, from the UK National Annex
4.1.3 Design values for grade 10.9 bolts The design tension resistance of size M10, M20 and M24 bolts in grade 10.9 are given in Table 4.1.

© The Steel Construction Institute 22 Printed 16/07/09 P:\CDA\CDA203\RT1303\RT1303v01d02.doc
The Blind Bolt Company Design resistances of Blind Bolts
Table 4.1 Design tension resistance of grade 10.9 bolts
Size Tensile stress area (mm²) Pt (kN) Ft,Rd (kN)
M10 58.0 40.6 41.8
M20 245 171.5 176.4
M24 353 247.1 254.2
4.2 Design of bolts in shear 4.2.1 BS 5950-1
The shear resistance of bolts to BS 5950-1 is calculated from:
sss ApP (4)
where:
Ps is the shear capacity
As is the shear area, taken as At when the shear plane passes through the threaded region and A when the shear plane does not pass through the threaded region
A is the shank area
ps is the shear strength, calculated from:
bs 4.0 Up (5)
4.2.2 BS EN 1993-1-8 The shear resistance of bolts to BS EN 1993-1-8 is calculated from:
M2
ubvRdv,
AfF (6)
where:
Fv,Rd is the shear resistance
v = 0.5 for grade 10.9 when the shear plane passes through the threaded region
v = 0.6 when the shear plane passes through the unthreaded region
A is the shear area, taken as As when the shear plane passes through the threaded region and A when the shear plane passes through the unthreaded region
4.2.3 Design values for grade 10.9 bolts The design shear resistance of size M10, M20 and M24 bolts in grade 10.9 are given in Table 4.2.

The Blind Bolt Company Design resistances of Blind Bolts
© The Steel Construction Institute P:\CDA\CDA203\RT1303\RT1303v01d02.doc Printed 16/07/09 23
Table 4.2 Design shear resistance of grade 10.9 bolts
Size Shear plane Shear area (mm²) Ps (kN) Fv,Rd (kN)
M10 Threaded region 58.0 23.2 23.2
Unthreaded region 78.5 31.4 37.7
M20 Threaded region 245 98.0 98.0
Unthreaded region 314 125.6 150.7
M24 Threaded region 353 141.2 141.2
Unthreaded region 452 180.8 217.0
4.3 Design of bolts in combined tension and shear 4.3.1 BS 5950-1
When bolts are subject to combined tension and shear, the following equation from BS 5950-1 should be satisfied in addition to the separate equations for tension and shear:
4.1t
t
s
s PF
PF
(7)
4.3.2 BS EN 1993-1-8 When bolts are subject to combined tension and shear, the following equation from BS EN 1993-1-8 should be satisfied in addition to the separate equation for tension:
0.14.1 Rdt,
Edt,
Rdv,
Edv, F
F
F
F (8)
4.3.3 Design envelopes for grade 10.9 bolts The envelopes shown in Figure 4.1 have been generated from the above equations and the values given in Table 4.1 and Table 4.2.

© The Steel Construction Institute 24 Printed 16/07/09 P:\CDA\CDA203\RT1303\RT1303v01d02.doc
The Blind Bolt Company Design resistances of Blind Bolts
4.4 Design of bolts in bearing 4.4.1 BS 5950-1
The bearing resistance of bolts to BS 5950-1 is taken as the minimum of Pbb, the bearing resistance of the bolt, and Pbs, the bearing resistance of the plate. These are calculated from the following equations:
bbpbb pdtP (9)
where:
d is the nominal diameter of the bolt
tp is the thickness of the connected part
pbb is the bearing strength of the bolt, calculated from:
bbbb 7.0 YUp (10)
bspbsbspbsbs 5.0 petkpdtkP (11)
where:
kbs = 1.0 for standard clearance holes
e is the end distance, measured from the edge of the sheet to the centre-line of the hole
pbs is the bearing strength of the connected part, taken as 460 N/mm² for S275 steel and 550 N/mm² for S355 steel
Note that these expressions are based on limiting the deformation at working load to 1.5 mm, rather than the stress-carrying capability of the bolt
0
50
100
150
200
250
300
0 10 20 30 40 50 60 70 80 90
Angle relative to tension direction (º)
Max
imu
m a
pp
lied
fo
rce
(kN
)
M10 EC3 M20 EC3 M24 EC3 M10 BS M20 BS M24 BS Figure 4.1 Design envelopes for combined bending and shear

The Blind Bolt Company Design resistances of Blind Bolts
© The Steel Construction Institute P:\CDA\CDA203\RT1303\RT1303v01d02.doc Printed 16/07/09 25
4.4.2 BS EN 1993-1-8 The bearing resistance of bolts to BS EN 1993-1-8 is calculated from:
M2
ub1Rdb,
dtfkF (12)
where:
Fb,Rd is the bearing resistance
fu is the ultimate tensile strength of the plate material, taken as 430 N/mm² for S275 steel and 510 N/mm² for S355 steel
d is the nominal diameter of the bolt
t is the thickness of the plate
b and k1 are coefficients calculated from the following equations:
0.1;;minu
ubdb f
f (13)
0
1d
3de
(14)
5.27.18.20
21
de
k (15)
where:
e1 is the edge distance in the direction of the applied load, measured from the edge of the sheet to the centre-line of the hole
e2 is the edge distance perpendicular to the direction of the applied load, measured from the edge of the sheet to the centre-line of the hole
d0 is the diameter of the hole (taken as 11 mm for M10 bolts, 22 mm for M20 bolts and 26 mm for M24 bolts)
4.4.3 Design values for grade 10.9 bolts The design bearing resistance of size M10, M20 and M24 bolts in grade 10.9 are given in Table 4.3 for plate thicknesses of 6 mm, 10 mm and 15 mm, and steel grades of S275 and S355. The edge distances, e1 and e2, are taken as 25 mm for M10 bolts, 50 mm for M20 bolts and 60 mm for M24 bolts (the same dimensions that were used in the tests).

© The Steel Construction Institute 26 Printed 16/07/09 P:\CDA\CDA203\RT1303\RT1303v01d02.doc
The Blind Bolt Company Design resistances of Blind Bolts
Table 4.3 Design bearing resistance of grade 10.9 bolts
Size Plate thickness (mm) Pbs (kN) Fv,Rd (kN)
S275 S355 S275 S355
M10 6 27.6 33.0 39.1 43.4
10 46.0 55.0 65.2 77.3
15 69.0 82.5 97.7 115.9
M20 6 55.2 66.0 78.2 92.7
10 92.0 110.0 130.3 154.6
15 138.0 165.0 195.5 231.8
M24 6 66.2 79.2 95.3 113.0
10 110.4 132.0 158.8 188.3
15 165.6 264.0 238.2 282.5

The Blind Bolt Company Design resistances of Blind Bolts
© The Steel Construction Institute P:\CDA\CDA203\RT1303\RT1303v01d02.doc Printed 16/07/09 27
5 DERIVATION OF CHARACTERISTIC AND DESIGN VALUES
The resistances that are derived in this section ignore any effect from the connected parts – i.e. the tension resistance in the wall of a hollow section will almost certainly be limited by the deformation of the hollow section wall, not the resistance of the bolt itself. It is recommended that the presentation of the bolt resistances should be accompanied by a warning that designers will have to address any possible effects of the supporting material themselves.
5.1 Tension resistance The failure loads presented in Table 3.2 must first be normalised to the nominal ultimate tensile strength of the material to take account of the variability of the material strength between batches. This is done using the following equation:
obsu,
nomu,obsadj f
fRR (16)
where:
Radj is the normalised failure load
Robs is the observed test results
fu,nom is the nominal ultimate tensile strength of the material
fu,obs is the observed ultimate tensile strength of the material
The normalised failure loads are presented in Table 5.1.
Table 5.1 Normalised tension test results
Bolt type Test number Robs (kN) fu,obs (N/mm²) fu,nom (N/mm²) Radj (kN)
M10 1 18.63 1107 1000 16.82
2 19.73 1107 1000 17.81
4 18.26 1107 1000 16.49
5 18.11 1107 1000 16.35
M20 1 80.41 1057 1000 76.06
2 81.19 1057 1000 76.79
3 84.00 1057 1000 79.44
4 81.38 1057 1000 76.97
5 85.53 1057 1000 80.89
M24 1 115.20 1014 1000 113.60
2 114.09 1014 1000 112.51
3 117.11 1014 1000 115.48
4 111.53 1014 1000 109.98
5 122.29 1014 1000 120.59
In the equations given in Section 4.1, the tensile resistance is related to the tensile area of the bolt. For the blind bolts, the minimum area occurs at the

© The Steel Construction Institute 28 Printed 16/07/09 P:\CDA\CDA203\RT1303\RT1303v01d02.doc
The Blind Bolt Company Design resistances of Blind Bolts
location of the pivot pin, where the cross-section is as shown in Figure 5.1. The relevant dimensions for each size of bolt are given in Table 5.2, together with the calculated cross-sectional area, At (calculated from Equation (17)).
Table 5.2 Bolt dimensions
Bolt type d (mm) c (mm) p (mm) At (mm²)
M10 10 4 1.6 30.1
M20 20 8 2.0 134.6
M24 24 10 2.0 191.6
dp
dc
prdpddcdd
A
sin;sin
22
cos
22cos
4
222
t
(17)
By comparing the normalised test results, Radj, to the predicted resistance, Rpred (taken as Atfu,nom), a correction factor, b, can be calculated for each test and the mean and standard deviation of the entire set of tests can be determined. These correction factors are presented in Table 5.3.
d
c
p
Figure 5.1 Dimensions of tensile area of blind bolts

The Blind Bolt Company Design resistances of Blind Bolts
© The Steel Construction Institute P:\CDA\CDA203\RT1303\RT1303v01d02.doc Printed 16/07/09 29
Table 5.3 Correction factors for tension test results
Bolt type Test number Radj (kN) Rpred (kN) b
M10 1 16.82 30.10 0.559
2 17.81 30.10 0.592
4 16.49 30.10 0.548
5 16.35 30.10 0.543
M20 1 76.06 134.60 0.565
2 76.79 134.60 0.571
3 79.44 134.60 0.590
4 76.97 134.60 0.572
5 80.89 134.60 0.601
M24 1 113.60 191.58 0.593
2 112.51 191.58 0.587
3 115.48 191.58 0.603
4 109.98 191.58 0.574
5 120.59 191.58 0.629
Mean 0.580
Standard Deviation 0.0234
Figure 5.2 shows a comparison of Radj and Rpred, and it is clear from this that the data from the three different sizes of bolt can be treated as a single population, as a line through the origin also passes through each set of test data.
The design resistance is calculated using Equation (18), based on BS EN 1990[5], Equation (D.1).
0
20
40
60
80
100
120
140
0 50 100 150 200 250
Nominal Tensile Resistance (kN)
No
rmal
ise
d M
axim
um
Lo
ad
(kN
)
Figure 5.2 Comparison of the normalised maximum load and the
nominal tensile resistance

© The Steel Construction Institute 30 Printed 16/07/09 P:\CDA\CDA203\RT1303\RT1303v01d02.doc
The Blind Bolt Company Design resistances of Blind Bolts
m
bnb1b
m
kd
skmXXX
(18)
where:
Xd is the design resistance of property X
Xk(n) is the characteristic resistance of property X, derived from n tests
m is the relevant partial safety factor, in this case M2
Xb=1 is the resistance of property X corresponding to a correction factor of b = 1
mb is the mean correction factor
kn is an adjustment coefficient that depends on the number of tests that have been undertaken, taken from BS EN 1990, Table D1
sb is the standard deviation of the correction factor
For a set of 14 tests, kn = 1.856 from Table D1 of BS EN 1990 (Vx unknown has been used, as there is no prior knowledge of the variation of the tests). Applying this to the values given in Table 5.3 gives the following design equation:
M2
tnomu,
M2
Rkt,Rdt,
537.0
AfF
F (19)
Note that this is equivalent to Equation (3) with k2 = 0.537, using the minimum tensile area of the blind bolts.
For design to the British Standards, Equation (1) can be used with pt
= 430 N/mm² (calculated from Equation (19) with M2 = 1.25).
The design tension resistances for the blind bolts are presented in Table 5.4.
Table 5.4 Design tension resistances for blind bolts
Bolt size Design tension resistance, Pt,Rd (kN)
M10 12.93
M20 57.82
M24 82.31
5.2 Shear resistance The failure loads presented in Table 3.3 are again normalised using Equation (16). These are presented in Table 5.5.

The Blind Bolt Company Design resistances of Blind Bolts
© The Steel Construction Institute P:\CDA\CDA203\RT1303\RT1303v01d02.doc Printed 16/07/09 31
Table 5.5 Normalised shear test results
Bolt type
Shear plane Test number
Robs (kN) fu,obs (N/mm²)
fu,nom (N/mm²)
Radj (kN)
M10 Slotted region 1 40.25 1107 1000 36.35
2 33.77 1107 1000 30.49
3 32.45 1107 1000 29.30
Threaded region 1 58.90 1107 1000 53.19
2 58.35 1107 1000 52.69
3 58.16 1107 1000 52.51
M20 Slotted region 1 157.49 1057 1000 148.96
2 150.91 1057 1000 142.73
3 161.16 1057 1000 152.42
M24 Slotted region 1 259.98 1014 1000 256.37
2 251.80 1014 1000 248.30
3 261.07 1014 1000 257.44
4 251.57 1014 1000 248.07
5 273.38 1014 1000 269.58
6 267.13 1014 1000 263.41
For the shear tests, the predicted resistance is calculated using Equation (6), taking v as 0.5 for the threaded region and 0.6 for the slotted region, M2 as 1.0 and A as the shear area of the region in question (so for the slotted region, A is calculated from Equation (17) with p = 0). The predicted resistances and the corresponding correction factors are given in Table 5.6.
Table 5.6 Normalised shear test results
Bolt type
Shear plane Test number
Radj (kN) A (mm²) Rpred (kN) b
M10 Slotted region 1 36.35 39.6 23.78 1.69
2 30.49 39.6 23.78 1.42
3 29.30 39.6 23.78 1.36
Threaded region 1 53.19 58.0 29.00 2.03
2 52.69 58.0 29.00 2.01
3 52.51 58.0 29.00 2.01
M20 Slotted region 1 148.96 158.5 95.12 1.66
2 142.73 158.5 95.12 1.59
3 152.42 158.5 95.12 1.69
M24 Slotted region 1 256.37 219.5 131.72 1.97
2 248.30 219.5 131.72 1.91
3 257.44 219.5 131.72 1.98
4 248.07 219.5 131.72 1.91
5 269.58 219.5 131.72 2.08
6 263.41 219.5 131.72 2.03

© The Steel Construction Institute 32 Printed 16/07/09 P:\CDA\CDA203\RT1303\RT1303v01d02.doc
The Blind Bolt Company Design resistances of Blind Bolts
The correlation between different sets of test results is again compared by plotting Radfj against Rpred. This is shown in Figure 5.3.
In the shear case it is clear that the different bolt sizes and shear regions do not belong to the same set of data, as each set is distant from the line. A characteristic shear resistance is calculated for each combination individually, using Equation (18). These are shown in Table 5.7.
Table 5.7 Normalised shear test results
Bolt type
Shear plane Test number
b Xb=1 mb sb kn bk Xk
M10 1 1.69
2 1.42
Slotted region
3 1.36
23.78 1.49 0.176 3.37 0.90 21.42
1 2.03
2 2.01
Threaded region
3 2.01
29.00 2.02 0.013 3.37 1.97 57.17
M20 1 1.66
2 1.59
Slotted region
3 1.69
95.12 1.65 0.055 3.37 1.46 139.02
M24 1 1.97
2 1.91
3 1.98
4 1.91
5 2.08
Slotted region
6 2.03
131.72 1.98 0.065 2.18 1.84 242.19
bk is the characteristic correction factor
0
50
100
150
200
250
300
0 20 40 60 80 100 120 140 160
Nominal Shear Resistance (kN)
No
rmal
ise
d M
axim
um
Lo
ad
(kN
)
Figure 5.3 Comparison of the normalised maximum load and the
nominal shear resistance

The Blind Bolt Company Design resistances of Blind Bolts
© The Steel Construction Institute P:\CDA\CDA203\RT1303\RT1303v01d02.doc Printed 16/07/09 33
In general, the characteristic correction factors are all greater than 1.0 and so are showing an enhancement over the values given by the Eurocode equations. The exception is for the M10 bolts in the slotted region, where an exceptionally high variation between the three tests results in a characteristic correction factor of 0.9. Based on the variability of the other tests, it is felt that this variation is extreme, and that further tests would reduce this variability and improve the characteristic correction factor to a value greater than 1.0. It is therefore recommended that the design rules from BS EN 1993-1-8 be adopted for all the bolt sizes, rather than specifying shear resistances based on the test results. The design values in each case are given in Table 5.8.
For design to the British Standards, the test results again show an enhancement over the rules in BS 5950-1, so the rules defined in the Standard should be used with the shear areas taken as shown in Table 5.2. The design capacities are shown in Table 5.8.
Table 5.8 Design shear resistances for blind bolts
Bolt size
Shear plane
Design shear resistance, Pv,Rd, from tests (kN)
Design shear resistance, Pv,Rd, according to BS EN 1993-1-8 (kN)
Design shear capacity, Ps, according to BS 5950-1 (kN)
M10 Slotted region
17.13 19.02 15.85
Threaded region
45.74 23.20 23.20
M20 Slotted region
111.21 76.1 63.41
M24 Slotted region
193.75 105.37 87.81
5.3 Combined tension and shear The equations for combined tension and shear presented in Section 4.3 can be rearranged into the following general form:
0.1Rdv,
Edv,
Rdt,
Edt, BF
F
AF
F (20)
where:
Ft,Ed is the design tension force on the bolt
Ft,Rd is the design tension resistance of the bolt
Fv,Ed is the design shear force on the bolt
FE,Rd is the design shear resistance of the bolt
A is a constant, taken as 1.4 in both the British Standard and Eurocode
B is a constant, taken as 1.4 in the British Standard and 1.0 in the Eurocode
Equation (20) can then be rearranged into the following form:

© The Steel Construction Institute 34 Printed 16/07/09 P:\CDA\CDA203\RT1303\RT1303v01d02.doc
The Blind Bolt Company Design resistances of Blind Bolts
Rdv,
Edv,
Rdt,
Edt,
F
F
BA
AF
F (21)
By comparing the results of the combined tension and shear tests in Table 3.4 to the mean results from the pure tension and pure shear tests, the validity of the current design rules can be verified (note that the safety factors will be incorporated by using design resistances and forces, so mean values can be used here to assess the design rules). The results are plotted in Figure 5.4.
As none of the test results fall within the design region, there is no reason to believe that the current design rules do not apply to blind bolts. The test results indicate that more favourable rules might be appropriate, but further testing would be required to establish these rules as most of these tests have failed in tension rather than a combined mechanism. For now it is recommended that the current rules, as shown in Equations (7) and (8), are adopted for blind bolts.
5.4 Bearing resistance For design to the Eurocodes, the bearing resistance is a function of the ultimate strength of the connection, whereas for British Standard design it is defined by restricting the deformation of the connection to 1.5 mm. The two cases are considered separately.
5.4.1 Bearing resistance to BS EN 1993-1-8 The connection used in the test can either fail through bearing of the plate, bearing of the bolt, or through double shear. Table 5.9 compares the calculated bearing resistances for each test setup with the calculated resistance of the bolt in double shear.
0
0.2
0.4
0.6
0.8
1
1.2
0 0.2 0.4 0.6 0.8 1 1.2
Shear component ÷ Mean shear resistance
Ten
sio
n c
om
po
nen
t ÷
Mea
n t
ens
ion
res
ista
nce
M10 M20 EC3 Line BS Line
Design region
Figure 5.4 Results of combined tension and shear tests

The Blind Bolt Company Design resistances of Blind Bolts
© The Steel Construction Institute P:\CDA\CDA203\RT1303\RT1303v01d02.doc Printed 16/07/09 35
Table 5.9 Design bearing resistance of grade 10.9 bolts
Size Plate thickness (mm) Fv,Rd (kN) 2Pv,Rd (kN)
S275 S355
M10 6 39.1 43.4 38.0
10 65.2 77.3 38.0
15 97.7 115.9 38.0
M20 6 78.2 92.7 152.2
10 130.3 154.6 152.2
15 195.5 231.8 152.2
M24 6 95.3 113.0 210.7
10 158.8 188.3 210.7
15 238.2 282.5 210.7
From Table 5.9 it is clear that, based on the dimensions in the test setup, the bearing failure would only be expected to dominate for M20 bolts in 6 mm S275 & S355 plate and in 10 mm S275 plate, and for M24 bolts in 6 mm and 10 mm S275 & S355 plate. Reference to Table 3.5, Table 3.6 and Table 3.7 shows that this is confirmed by the tests, except for the M20 bolts in 10 mm S275 plate, which failed in bolt shear. The tests that failed in bearing are summarised in Table 5.10.
Table 5.10 Bearing test results for M20 bolts
Bolt type Plate thickness (mm)
Steel grade Test number Maximum force (kN)
M20 6 S275 1 148.41
2 146.72
3 140.21
S355 1 166.49
2 172.29
3 165.28
M24 6 S275 1 176.61
2 176.68
3 179.73
S355 1 200.39
2 203.64
3 212.41
M24 10 S275 1 267.18
2 273.30
3 261.97
S355 1 282.57
2 296.69
3 287.46
The actual material properties of the plate steel are not known, so the nominal ultimate tensile strength has been assumed and the test results cannot be normalised. A plot of the maximum observed load against the bearing resistance

© The Steel Construction Institute 36 Printed 16/07/09 P:\CDA\CDA203\RT1303\RT1303v01d02.doc
The Blind Bolt Company Design resistances of Blind Bolts
is shown in Figure 5.5, and it is clear a line through the origin does not pass through all of the data, so each set must be treated individually.
The characteristic resistance in each case is calculated in the same way as the shear resistance. This process is shown in Table 5.11.
0
50
100
150
200
250
300
350
400
0 50 100 150 200 250 300
Nominal Bearing Resistance (kN)
Ma
xim
um
Lo
ad (
kN)
Figure 5.5 Comparison of the maximum load with the nominal bearing
resistance

The Blind Bolt Company Design resistances of Blind Bolts
© The Steel Construction Institute P:\CDA\CDA203\RT1303\RT1303v01d02.doc Printed 16/07/09 37
Table 5.11 Bearing test results for M20 bolts
Bolt type
Plate thickness (mm)
Steel grade
Test number
b Xb=1 mb sb kn bk Xk
M20 6 S275 1 1.52
2 1.50
3 1.43
97.73 1.48 0.044 3.37 1.34 130.51
S355 1 1.44
2 1.49
3 1.43
115.91 1.45 0.032 3.37 1.34 155.39
M24 6 S275 1 1.48
2 1.48
3 1.51
119.08 1.49 0.015 3.37 1.44 171.67
S355 1 1.42
2 1.44
3 1.50
141.23 1.45 0.044 3.37 1.31 184.53
M24 10 S275 1 1.35
2 1.38
3 1.32
198.46 1.35 0.029 3.37 1.25 248.37
S355 1 1.20
2 1.26
3 1.22
235.38 1.23 0.030 3.37 1.12 264.74
As the characteristic correction factors are all greater than 1.0, they are showing an enhancement over the values given by the Eurocode equations. It is therefore recommended that the design rules from BS EN 1993-1-8 be adopted for all bolt sizes, rather than specifying bearing resistances based on the test results. The design values in each case are given in Table 5.12.
Table 5.12 Design bearing resistance for blind bolts
Size Plate thickness (mm)
Design bearing resistance, Fb,Rd, from tests (kN)
Design bearing resistance, Fb,Rd, according to BS EN 1993-1-8 (kN)
S275 S355 S275 S355
M10 6 - - 39.1 43.4
10 - - 65.2 77.3
15 - - 97.7 115.9
M20 6 104.4 124.3 78.2 92.7
10 - - 130.3 154.6
15 - - 195.5 231.8
M24 6 137.3 147.6 95.3 113.0
10 198.7 211.8 158.8 188.3
15 - - 238.2 282.5

© The Steel Construction Institute 38 Printed 16/07/09 P:\CDA\CDA203\RT1303\RT1303v01d02.doc
The Blind Bolt Company Design resistances of Blind Bolts
5.4.2 Bearing resistance to BS 5950-1 The bearing capacities in BBS 5950-1 are based on limiting the deformation of the connection at working load to 1.5 mm. In the tests there is a certain amount of the load and deflection that reflects the bedding-in of the connection, rather than actual deformation. To counteract this, the gradient of the load vs. deformation plot has been determined for the section after the bedding-in, as shown in Figure 5.6.
The gradients in each case are presented in Table 5.13.
0
5
10
15
20
25
0 0.5 1 1.5 2 2.5 3 3.5 4
Bearing deformation
Fo
rce
(kN
)
Figure 5.6 Initial gradients for M10 bolts in 6 mm S275 plate

The Blind Bolt Company Design resistances of Blind Bolts
© The Steel Construction Institute P:\CDA\CDA203\RT1303\RT1303v01d02.doc Printed 16/07/09 39
Table 5.13 Initial gradients from bearing tests
Initial gradient of each test (kN/mm) Bolt type Plate thickness (mm)
Steel grade
Test 1 Test 2 Test 3
M10 6 S275 11.23 10.88 12.14
S355 9.23 11.48 11.11
10 S275 21.97 25.53 26.69
S355 25.41 27.60 17.97
15 S275 21.16 19.46 27.56
S355 26.78 23.01 20.75
M20 6 S275 12.18 17.30 19.16
S355 18.54 21.78 20.89
10 S275 22.29 23.10 24.40
S355 21.24 25.97 25.53
15 S275 29.52 27.23 27.69
S355 26.73 26.97 26.36
M24 6 S275 21.25 21.90 21.17
S355 30.99 30.47 31.35
10 S275 41.50 41.70 40.06
S355 45.89 34.22 40.19
15 S275 59.52 50.85 41.81
S355 48.78 50.93 49.42
The initial gradients can be converted into a bearing capacity by multiplying by the limiting deformation (1.5 mm), and a factor of 1.5 to account for the difference between the design load and the working load (taken as the average of the dead load and live load factors). The resulting bearing capacities in each case are presented in Table 5.14.
© The Steel Construction Institute 40 Printed 16/07/09 P:\CDA\CDA203\RT1303\RT1303v01d02.doc
The Blind Bolt Company Design resistances of Blind Bolts
Table 5.14 Initial gradients from bearing tests
Bearing capacity from each test (kN)
Pbs (kN) Bolt type Plate thickness (mm)
Steel grade
Test 1 Test 2 Test 3
M10 6 S275 25.27 24.48 27.31 16.56
S355 20.78 25.83 24.99 19.80
10 S275 49.43 57.44 60.06 27.60
S355 57.17 62.10 40.44 33.00
15 S275 47.62 43.79 62.01 41.40
S355 60.24 51.76 46.68 49.50
M20 6 S275 27.40 38.93 43.11 33.12
S355 41.71 49.00 47.00 39.60
10 S275 50.15 51.98 54.89 55.20
S355 47.78 58.43 57.45 66.00
15 S275 66.41 61.26 62.29 82.80
S355 60.14 60.69 59.31 99.00
M24 6 S275 47.82 49.28 47.64 38.64
S355 69.72 68.55 70.53 46.20
10 S275 93.37 93.81 90.13 64.40
S355 103.25 77.00 90.42 77.00
15 S275 133.93 114.41 94.08 96.60
S355 109.76 114.59 111.20 115.50
Also shown in Table 5.14 are predicted bearing capacities, Pbs, using a modified version of the equation from BS 5950-1:
bspbsbspbsbs 5.0 petkptcdkP (22)
where:
kbs = 1.0 for standard clearance holes
d is the diameter of the bolt
c is the width of the slot
tp is the thickness of the plate
e is the end distance, measured from the edge of the sheet to the centre-line of the hole
pbs is the bearing strength of the connected part, taken as 460 N/mm² for S275 steel and 550 N/mm² for S355 steel
The modification has been made to Equation (11) to take account of the reduced area that the bearing force will transfer over. In the majority of cases in Table 5.14, the bearing capacities from the tests are greater than the prediction using Equation (22), as shown in Table 5.7 where the line shows a gradient of 1.0.

The Blind Bolt Company Design resistances of Blind Bolts
© The Steel Construction Institute P:\CDA\CDA203\RT1303\RT1303v01d02.doc Printed 16/07/09 41
Although there are a few cases below the equality line in Figure 5.7, it is felt that the rule proposed in Equation (22) should be adopted for the design of the blind bolts. The majority of the test evidence supports the modification to the BS 5950-1 equation, and the ultimate loads that the connections can support is vastly superior to the bearing capacities (the bearing capacities are approximately half of the maximum test loads). The bearing capacities that should be used for design are shown in Table 5.15, together with the bearing capacities calculated from the test results in Section 5.4.1.
Table 5.15 Design bearing resistance for blind bolts
Size Plate thickness (mm)
Design bearing resistance, Fb,Rd, from tests (kN)
Design bearing capacity, Pb, according to BS 5950-1 (kN)
S275 S355 S275 S355
M10 6 - - 16.56 19.80
10 - - 27.60 33.00
15 - - 41.40 49.50
M20 6 104.4 124.3 33.12 39.60
10 - - 55.20 66.00
15 - - 82.80 99.00
M24 6 137.3 147.6 38.64 46.20
10 198.7 211.8 64.40 77.00
15 - - 96.60 115.50
0
20
40
60
80
100
120
140
160
0 20 40 60 80 100 120 140 160
Nominal Bearing Resistance (kN)
Be
arin
g C
ap
acit
y F
rom
Tes
ts (
kN)
Figure 5.7 Comparison of the bearing capacities from tests with the
nominal bearing resistance

© The Steel Construction Institute 42 Printed 16/07/09 P:\CDA\CDA203\RT1303\RT1303v01d02.doc
The Blind Bolt Company Design resistances of Blind Bolts

The Blind Bolt Company Design resistances of Blind Bolts
© The Steel Construction Institute P:\CDA\CDA203\RT1303\RT1303v01d02.doc Printed 16/07/09 43
6 SUMMARY OF DESIGN RULES FOR BLIND BOLTS
This section summarises the design equations derived in Section 5, and can be used for blind bolts in the range M8 to M24, using grade 10.9 steel.
6.1 Design of bolts in tension 6.1.1 BS 5950-1
The tension resistance of bolts to BS 5950-1 is calculated from:
pintt ApP (23)
where:
Pt is the tension capacity
pt is the tension strength of the bolt, taken as 430 N/mm²
Apin is the tensile stress area of the bolt, calculated from:
dp
dc
prdpddcdd
A
sin;sin
22
cos
22cos
4
222
pin
(24)
where:
d is the diameter of the bolt
c is the width of the slot
p is the diameter of the pin
6.1.2 BS EN 1993-1-8 The tension resistance of bolts to BS EN 1993-1-8 is calculated from:
M2
pinub2Rdt,
AfkF (25)
where:
Ft,Rd is the tension resistance
k2 = 0.537 for blind bolts
fub is the ultimate tensile strength of the bolt (1000 N/mm² for grade 10.9)
Apin is the tensile stress area of the bolt, calculated using Equation (24)
M2 = 1.25, from the UK National Annex
6.2 Design of bolts in shear 6.2.1 BS 5950-1
The shear resistance of bolts to BS 5950-1 is calculated from:

© The Steel Construction Institute 44 Printed 16/07/09 P:\CDA\CDA203\RT1303\RT1303v01d02.doc
The Blind Bolt Company Design resistances of Blind Bolts
sss ApP (26)
where:
Ps is the shear capacity
As is the shear area, taken as At when the shear plane passes through the threaded region and Aslot when the shear plane does not pass through the threaded region
ps is the shear strength, taken as 400 N/mm²
At is the tensile area of the threaded region
Aslot is the area of the slotted region, calculated from:
dcdcdd
A
sin;22
cos4
22
slot (27)
6.2.2 BS EN 1993-1-8 The shear resistance of bolts to BS EN 1993-1-8 is calculated from:
M2
ubvRdv,
AfF (28)
where:
Fv,Rd is the shear resistance
v = 0.5 for grade 10.9 when the shear plane passes through the threaded region
v = 0.6 when the shear plane passes through the slotted region
A is the shear area, taken as As when the shear plane passes through the threaded region and Aslot when the shear plane passes through the unthreaded region
As is the tensile area of the threaded region
6.3 Design of bolts in combined tension and shear 6.3.1 BS 5950-1
When bolts are subject to combined tension and shear, the following equation from BS 5950-1 should be satisfied in addition to the separate equations for tension and shear:
4.1t
t
s
s PF
PF
(29)
6.3.2 BS EN 1993-1-8 When bolts are subject to combined tension and shear, the following equation from BS EN 1993-1-8 should be satisfied in addition to the separate equation for tension:

The Blind Bolt Company Design resistances of Blind Bolts
© The Steel Construction Institute P:\CDA\CDA203\RT1303\RT1303v01d02.doc Printed 16/07/09 45
0.14.1 Rdt,
Edt,
Rdv,
Edv, F
F
F
F (30)
6.4 Design of bolts in bearing 6.4.1 BS 5950-1
The bearing resistance of bolts to BS 5950-1 is taken as the minimum of Pbb, the bearing resistance of the bolt, and Pbs, the bearing resistance of the plate. These are calculated from the following equations:
bbpbb ptcdP (31)
where:
d is the nominal diameter of the bolt
tp is the thickness of the connected part
pbb is the bearing strength of the bolt, taken as 1300 N/mm²
bspbsbspbsbs 5.0 petkptcdkP (32)
where:
kbs = 1.0 for standard clearance holes
e is the end distance, measured from the edge of the sheet to the centre-line of the hole
pbs is the bearing strength of the connected part, taken as 460 N/mm² for S275 steel and 550 N/mm² for S355 steel
Note that these expressions are based on limiting the deformation at working load to 1.5 mm, rather than the stress-carrying capability of the bolt
6.4.2 BS EN 1993-1-8 The bearing resistance of bolts to BS EN 1993-1-8 is calculated from:
M2
ub1Rdb,
dtfkF (33)
where:
Fb,Rd is the bearing resistance
fu is the ultimate tensile strength of the plate material, taken as 430 N/mm² for S275 steel and 510 N/mm² for S355 steel
d is the nominal diameter of the bolt
t is the thickness of the plate
b and k1 are coefficients calculated from the following equations:
0.1;;minu
ubdb f
f (34)

© The Steel Construction Institute 46 Printed 16/07/09 P:\CDA\CDA203\RT1303\RT1303v01d02.doc
The Blind Bolt Company Design resistances of Blind Bolts
0
1d
3de
(35)
5.27.18.20
21
de
k (36)
where:
e1 is the edge distance in the direction of the applied load, measured from the edge of the sheet to the centre-line of the hole
e2 is the edge distance perpendicular to the direction of the applied load, measured from the edge of the sheet to the centre-line of the hole
d0 is the diameter of the hole (taken as 11 mm for M10 bolts, 22 mm for M20 bolts and 26 mm for M24 bolts)
6.5 Bolt dimensions There are currently 5 sizes of blind bolts, and the relevant dimensions of each bolt are presented in Table 6.1 for use with the above formulae.
Table 6.1 Blind bolt dimensions and areas
Bolt type d (mm) c (mm) p (mm) d0 (mm) Apin (mm²) Aslot (mm²) As (mm²)
M8 8.0 3.5 1.6 9.0 16.1 23.2 36.6
M10 10.0 4.0 1.6 11.0 30.1 39.6 58.0
M12 12.0 5.0 1.6 13.0 43.7 54.9 84.3
M16 16.0 6.0 1.4 18.0 93.4 107.4 156.7
M20 20.0 8.0 2.0 22.0 134.6 158.5 244.8
M24 24.0 10.0 2.0 26.0 191.6 219.5 352.5

The Blind Bolt Company Design resistances of Blind Bolts
© The Steel Construction Institute P:\CDA\CDA203\RT1303\RT1303v01d02.doc Printed 16/07/09 47
7 CONCLUSIONS
A series of tests were undertaken on M10, M20 and M24 blind bolts in grade 10.9 material to establish the tension, shear and bearing capabilities of the materials. Through a statistical analysis of the test results and a comparison with the current codes of practice, a series of design rules have been established, which are presented in Section 6. The design values for tension and shear for design to BS 5950-1 are summarised in Table 7.1. The bearing resistances are not quoted as they depend on the dimensions of the supporting material, but design equations are presented in Section 6.4.
Table 7.1 Summary of design tension and shear capacities to BS 5950-1
Bolt type Tension capacity (kN) Shear capacity of slotted region (kN)
M8* 6.91 9.27
M10 12.94 15.85
M12* 18.81 21.95
M16* 40.16 42.94
M20 57.88 63.41
M24 82.38 87.81
* Tests were not performed on these bolt types The characteristic values for tension and shear for design to BS EN 1993-1-8 are summarised in Table 7.2. These should be converted to design values by using the partial safety factor M2, which is defined as 1.25 in the UK National Annex.
Table 7.2 Summary of characteristic tension and shear capacities to BS EN 1993-1-8
Bolt type Ft,Rk (kN) Fv,Rk (kN)
M8* 8.63 13.91
M10 16.17 23.78
M12* 23.49 32.93
M16* 50.16 64.42
M20 72.29 95.12
M24 102.89 131.72
* Tests were not performed on these bolt types
The tests also showed that the current rules for combined tension and shear in both the British Standards and the Eurocodes can be used for the design of blind bolts.
Appendix A presents a suggested layout for the technical data of blind bolts.

© The Steel Construction Institute 48 Printed 16/07/09 P:\CDA\CDA203\RT1303\RT1303v01d02.doc
The Blind Bolt Company Design resistances of Blind Bolts

The Blind Bolt Company Design resistances of Blind Bolts
© The Steel Construction Institute P:\CDA\CDA203\RT1303\RT1303v01d02.doc Printed 16/07/09 49
8 REFERENCES
1. BS 5950-1: 2000 Structural use of steelwork in building. Code of practice for design – Rolled and welded sections. British Standards Institution, 2000
2. BS 4160: 2001 ISO metric black hexagon bolts, screws and nuts – specification. British Standards Institution, 2001
3. BS EN ISO 898-1: 2009 Mechanical properties of fasteners made of carbon steel and alloy steel. Bolts, screws and studs with specified property classes – Coarse thread and fine pitch thread. British Standards Institution, 2009
4. BS EN 1993-1-8: 2005 Eurocode 3: Design of steel structures. Design of joints. British Standards Institution, 2005
5. BS EN 1990: 2002 Eurocode – Basis of structural design. British Standards Institution, 2002
6. SCI & BCSA Joints in Steel Construction: Simple Connections, P212 The Steel Construction Institute, Ascot 2002

© The Steel Construction Institute 50 Printed 16/07/09 P:\CDA\CDA203\RT1303\RT1303v01d02.doc
The Blind Bolt Company Design resistances of Blind Bolts

The Blind Bolt Company Design resistances of Blind Bolts
© The Steel Construction Institute P:\CDA\CDA203\RT1303\RT1303v01d02.doc Printed 16/07/09 51
APPENDIX A TECHNICAL INFORMATION
A.1 Design to BS 5950-1 Bearing capacity in 10 mm plate
Tension capacity
Shear capacity over thread
Shear capacity over slot S275 S355
Diameter
Pt (kN) Ps,thread (kN) Ps,slot (kN) Pb (kN) Pb (kN) M8 6.9 14.6 9.3 20.7 24.8 M10 12.9 23.2 15.9 27.6 33.0 M12 18.8 33.7 22.0 32.2 38.5 M16 40.2 62.7 42.9 46.0 55.0 M20 57.9 97.9 63.4 55.2 66.0 M24 82.4 141.0 87.8 64.4 77.0
These values are suitable for design to BS 5950-1 and can be used without further reduction for comparison to factored loads. Bearing resistances for different plate thicknesses can be calculated by scaling the values in proportion to the thickness, but should only be used where the distance from the centre line of the hole to the end of the plate is greater than 1.25d. Combined tension and shear should satisfy the following equation:
4.1t
t
s
s PF
PF
A.2 Design to BS EN 1993-1-8 Tension resistance
Shear resistance over thread
Shear resistance over slot
Diameter
Ft,Rd (kN) Fv,Rd,thread (kN) Fv,Rd,slot (kN) M8 6.9 14.6 11.1 M10 12.9 23.2 19.0 M12 18.8 33.7 26.3 M16 40.1 62.7 51.5 M20 57.8 97.9 76.1 M24 82.3 141.0 105.4
These are design values for use with BS EN 1993-1-8, and a partial safety factor of M2 = 1.25 has already been applied. Bearing resistances should be calculated from BS EN 1993-1-8, Table 3.4, taking d as the nominal diameter of the bolt. Combined tension and shear should satisfy the following equation:
0.14.1 Rdt,
Edt,
Rdv,
Edv, F
F
F
F
A.3 General note The above tension resistances make no allowance for the deformation or yield of the connected parts. An appropriate design model for connections in hollow sections can be found in Joints in Steel Construction: Simple Connections[6].

© The Steel Construction Institute 52 Printed 16/07/09 P:\CDA\CDA203\RT1303\RT1303v01d02.doc
The Blind Bolt Company Design resistances of Blind Bolts

The Blind Bolt Company Design resistances of Blind Bolts
© The Steel Construction Institute P:\CDA\CDA203\RT1303\RT1303v01d02.doc Printed 16/07/09 53
APPENDIX B TEST RESULTS
B.1 Coupon tests
0
200
400
600
800
1000
1200
Strain
Str
ess
(N/m
m²)
Figure B.1 Stress-strain relationship for M10 material
0
200
400
600
800
1000
1200
Strain
Str
ess
(N/m
m²)
Figure B.2 Stress-strain relationship for M20 material

© The Steel Construction Institute 54 Printed 16/07/09 P:\CDA\CDA203\RT1303\RT1303v01d02.doc
The Blind Bolt Company Design resistances of Blind Bolts
B.2 Tension tests
0
200
400
600
800
1000
1200
Strain
Str
ess
(N/m
m²)
Figure B.3 Stress-strain relationship for M24 material
0
5
10
15
20
25
0 1 2 3 4 5 6 7 8 9
Extension
Lo
ad (
kN
)
Figure B.4 Load-deformation plot for M10 tension tests

The Blind Bolt Company Design resistances of Blind Bolts
© The Steel Construction Institute P:\CDA\CDA203\RT1303\RT1303v01d02.doc Printed 16/07/09 55
0
10
20
30
40
50
60
70
80
90
0 1 2 3 4 5 6 7 8 9 10
Extension
Lo
ad (
kN
)
Figure B.5 Load-deformation plot for M20 tension tests
0
20
40
60
80
100
120
140
0 2 4 6 8 10 12 14 16
Extension
Lo
ad (
kN
)
Figure B.6 Load-deformation plot for M24 tension tests

© The Steel Construction Institute 56 Printed 16/07/09 P:\CDA\CDA203\RT1303\RT1303v01d02.doc
The Blind Bolt Company Design resistances of Blind Bolts
B.3 Shear tests
0
5
10
15
20
25
30
35
40
45
0 1 2 3 4 5 6 7 8
Shear displacement
For
ce (
kN)
Figure B.7 Load-deformation plot for M10 shear tests (shear plane
through slotted region)
0
10
20
30
40
50
60
70
0 1 2 3 4 5 6
Shear displacement
Fo
rce
(kN
)
Figure B.8 Load-deformation plot for M10 shear tests (shear plane
through threaded region)

The Blind Bolt Company Design resistances of Blind Bolts
© The Steel Construction Institute P:\CDA\CDA203\RT1303\RT1303v01d02.doc Printed 16/07/09 57
0
20
40
60
80
100
120
140
160
180
0 1 2 3 4 5 6 7 8
Shear displacement
For
ce (
kN)
Figure B.9 Load-deformation plot for M20 shear tests (shear plane
through slotted region)
0
50
100
150
200
250
300
0 2 4 6 8 10 12 14 16 18 20
Shear displacement
For
ce (
kN)
Figure B.10 Load-deformation plot for M24 shear tests (shear plane
through slotted region)

© The Steel Construction Institute 58 Printed 16/07/09 P:\CDA\CDA203\RT1303\RT1303v01d02.doc
The Blind Bolt Company Design resistances of Blind Bolts
B.4 Combined tension and shear tests
0
5
10
15
20
25
0 1 2 3 4 5 6 7 8 9 10
Displacement
Lo
ad (
kN
)
Figure B.11 Load-deformation plot for M10 bolts at 30º
0
5
10
15
20
25
30
35
0 1 2 3 4 5 6 7 8 9 10
Displacement
Lo
ad (
kN)
Figure B.12 Load-deformation plot for M10 bolts at 45º

The Blind Bolt Company Design resistances of Blind Bolts
© The Steel Construction Institute P:\CDA\CDA203\RT1303\RT1303v01d02.doc Printed 16/07/09 59
0
5
10
15
20
25
30
35
40
45
0 1 2 3 4 5 6 7 8 9 10
Displacement
Lo
ad (
kN
)
Figure B.13 Load-deformation plot for M10 bolts at 60º
0
20
40
60
80
100
120
0 2 4 6 8 10 12
Displacement
Lo
ad (
kN
)
Figure B.14 Load-deformation plot for M20 bolts at 30º
© The Steel Construction Institute 60 Printed 16/07/09 P:\CDA\CDA203\RT1303\RT1303v01d02.doc
The Blind Bolt Company Design resistances of Blind Bolts
0
20
40
60
80
100
120
140
0 2 4 6 8 10 12 14
Displacement
Lo
ad (
kN
)
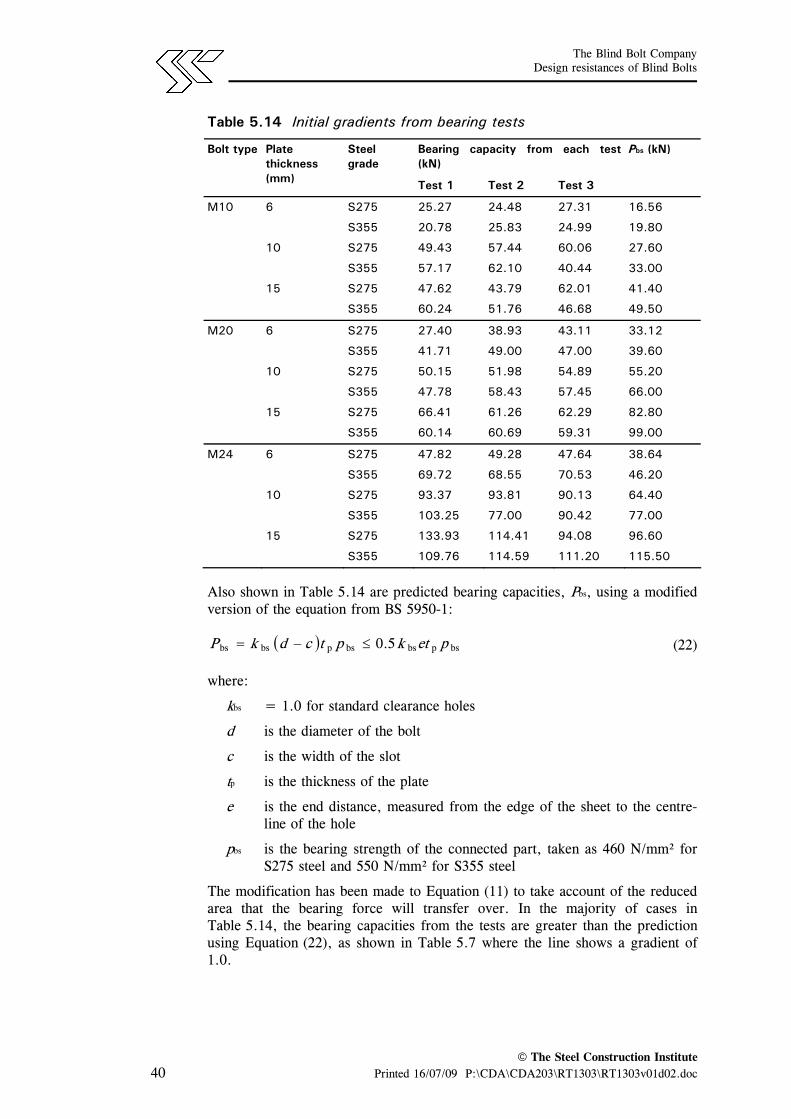
Figure B.15 Load-deformation plot for M20 bolts at 45º
0
20
40
60
80
100
120
140
160
180
0 2 4 6 8 10 12 14
Displacement
Lo
ad (
kN
)
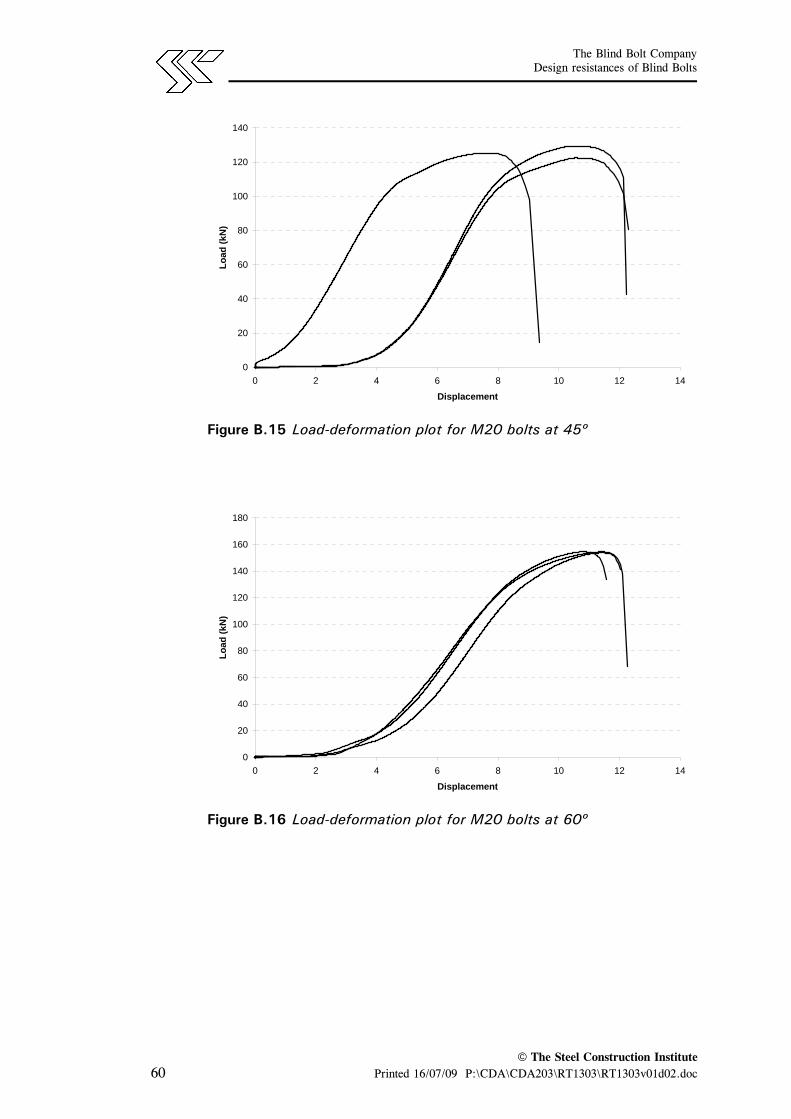
Figure B.16 Load-deformation plot for M20 bolts at 60º

The Blind Bolt Company Design resistances of Blind Bolts
© The Steel Construction Institute P:\CDA\CDA203\RT1303\RT1303v01d02.doc Printed 16/07/09 61
B.5 Bearing tests
0
10
20
30
40
50
60
70
0 2 4 6 8 10 12 14
Bearing deformation
Fo
rce
(kN
)
Figure B.17 Load-deformation plot for bearing test on M10 bolts in
6 mm, S275 plate
0
10
20
30
40
50
60
0 2 4 6 8 10 12
Bearing deformation
Fo
rce
(kN
)
Figure B.18 Load-deformation plot for bearing test on M10 bolts in
6 mm, S355 plate

© The Steel Construction Institute 62 Printed 16/07/09 P:\CDA\CDA203\RT1303\RT1303v01d02.doc
The Blind Bolt Company Design resistances of Blind Bolts
0
10
20
30
40
50
60
70
0 1 2 3 4 5 6 7
Bearing deformation
Fo
rce
(kN
)
Figure B.19 Load-deformation plot for bearing test on M10 bolts in
10 mm, S275 plate
0
10
20
30
40
50
60
70
0 1 2 3 4 5 6 7 8 9 10
Bearing deformation
Fo
rce
(kN
)
Figure B.20 Load-deformation plot for bearing test on M10 bolts in
10 mm, S355 plate

The Blind Bolt Company Design resistances of Blind Bolts
© The Steel Construction Institute P:\CDA\CDA203\RT1303\RT1303v01d02.doc Printed 16/07/09 63
0
10
20
30
40
50
60
0 1 2 3 4 5 6 7 8
Bearing deformation
Fo
rce
(kN
)
Figure B.21 Load-deformation plot for bearing test on M10 bolts in
15 mm, S275 plate
0
10
20
30
40
50
60
0 1 2 3 4 5 6 7 8
Bearing deformation
Fo
rce
(kN
)
Figure B.22 Load-deformation plot for bearing test on M10 bolts in
15 mm, S355 plate

© The Steel Construction Institute 64 Printed 16/07/09 P:\CDA\CDA203\RT1303\RT1303v01d02.doc
The Blind Bolt Company Design resistances of Blind Bolts
0
20
40
60
80
100
120
140
160
0 10 20 30 40 50 60 70 80
Bearing deformation
Fo
rce
(kN
)
Figure B.23 Load-deformation plot for bearing test on M20 bolts in
6 mm, S275 plate
0
20
40
60
80
100
120
140
160
180
200
0 10 20 30 40 50 60 70 80
Bearing deformation
Fo
rce
(kN
)
Figure B.24 Load-deformation plot for bearing test on M20 bolts in
6 mm, S355 plate

The Blind Bolt Company Design resistances of Blind Bolts
© The Steel Construction Institute P:\CDA\CDA203\RT1303\RT1303v01d02.doc Printed 16/07/09 65
0
20
40
60
80
100
120
140
160
180
200
0 5 10 15 20 25 30 35
Bearing deformation
Fo
rce
(kN
)
Figure B.25 Load-deformation plot for bearing test on M20 bolts in
10 mm, S275 plate
0
20
40
60
80
100
120
140
160
180
200
0 5 10 15 20 25 30
Bearing deformation
Fo
rce
(kN
)
Figure B.26 Load-deformation plot for bearing test on M20 bolts in
10 mm, S355 plate

© The Steel Construction Institute 66 Printed 16/07/09 P:\CDA\CDA203\RT1303\RT1303v01d02.doc
The Blind Bolt Company Design resistances of Blind Bolts
0
20
40
60
80
100
120
140
160
0 5 10 15 20 25 30
Bearing deformation
Fo
rce
(kN
)
Figure B.27 Load-deformation plot for bearing test on M20 bolts in
15 mm, S275 plate
0
20
40
60
80
100
120
140
160
0 5 10 15 20 25
Bearing deformation
Fo
rce
(kN
)
Figure B.28 Load-deformation plot for bearing test on M20 bolts in
15 mm, S355 plate

The Blind Bolt Company Design resistances of Blind Bolts
© The Steel Construction Institute P:\CDA\CDA203\RT1303\RT1303v01d02.doc Printed 16/07/09 67
0
20
40
60
80
100
120
140
160
180
200
0 10 20 30 40 50 60 70 80 90
Bearing deformation
Fo
rce
(kN
)
Figure B.29 Load-deformation plot for bearing test on M24 bolts in
6 mm, S275 plate
0
50
100
150
200
250
0 10 20 30 40 50 60 70
Bearing deformation
Fo
rce
(kN
)
Figure B.30 Load-deformation plot for bearing test on M24 bolts in
6 mm, S355 plate

© The Steel Construction Institute 68 Printed 16/07/09 P:\CDA\CDA203\RT1303\RT1303v01d02.doc
The Blind Bolt Company Design resistances of Blind Bolts
0
50
100
150
200
250
300
0 10 20 30 40 50 60 70
Bearing deformation
Fo
rce
(kN
)
Figure B.31 Load-deformation plot for bearing test on M24 bolts in
10 mm, S275 plate
0
50
100
150
200
250
300
350
0 10 20 30 40 50 60 70 80 90
Bearing deformation
Fo
rce
(kN
)
Figure B.32 Load-deformation plot for bearing test on M24 bolts in
10 mm, S355 plate

The Blind Bolt Company Design resistances of Blind Bolts
© The Steel Construction Institute P:\CDA\CDA203\RT1303\RT1303v01d02.doc Printed 16/07/09 69
0
50
100
150
200
250
300
0 5 10 15 20 25 30 35
Bearing deformation
Fo
rce
(kN
)
Figure B.33 Load-deformation plot for bearing test on M24 bolts in
15 mm, S275 plate
0
50
100
150
200
250
300
350
0 10 20 30 40 50 60 70 80
Bearing deformation
Fo
rce
(kN
)
Figure B.34 Load-deformation plot for bearing test on M24 bolts in
15 mm, S355 plate

© The Steel Construction Institute 70 Printed 16/07/09 P:\CDA\CDA203\RT1303\RT1303v01d02.doc
The Blind Bolt Company Design resistances of Blind Bolts