the stock market’s valuation of r&d and market ... stock market’s valuation of r&d and...
TRANSCRIPT

The Stock Market’s Valuation of R&D and Market Concentration in Horizontal
Mergers1
By
Ralph M. Sonenshine American University
4400 Massachusetts Avenue, NW Washington, DC 20016 Office: 119 Roper Hall
[email protected] (301) 581-0244
Fax: 301-581-9445
1 I am grateful to Robert Feinberg for significant contributions regarding the specifications and
explanation of the results. Kara Reynolds and Walter Parker also provided input into this paper.

The Stock Market’s Valuation of R&D and Market Concentration in
Horizontal Mergers
Abstract It is well documented that acquirers often pay a very large premium to acquire
companies in related industries. There are many explanations as to the source of this
premium. This study isolates two variables, R&D-intensity and market concentration,
and correlates their value individually and jointly to the value of the acquired company.
The results indicate that change in market concentration and R&D is positively correlated
to the merger deal premium in a horizontal merger. Furthermore, deal premiums tend to
follow an inverted U curve pattern relative to market concentration change. The study
also shows that cost synergies and macro economic growth impact deal premium values.
Key words: mergers, R&D, market concentration, deal premium
JEL classification: L10, L40

1
1. Introduction
A large body of research has examined the effect of mergers on the stock prices of
acquisition targets and acquiring firms. Study2 results have consistently shown that acquisition
candidates receive a large premium over market value to relinquish corporate control, while the
market value of acquirers declines or remains the same. These papers also assess the source (s)
of the deal premium, focusing on a variety of factors including cost synergies, management
effectiveness, market power, financing, R&D, etc. While some authors, such as Higgins and
Rodriguez (2006), have investigated the relationship between abnormal returns in a merger and
R&D, there has been little research examining how change in market concentration and R&D
intensity influence the perceived value of the merger.
The relationship between innovation and market concentration has been explored in a
variety of studies and theories dating back to Joseph Schumpeter (1950) and John Kenneth
Galbraith (1957). One hypothesis is that innovation increases with market concentration. It has
also been posited that the relationship between innovation and market structure may not be linear
over the total range of market concentration. A few researchers have promoted and sought to
test the theory that innovation follows a U shape, with innovation reaching its apex at
intermediate levels market of concentration with lower levels of innovation occurring at near
monopoly and atomistic levels of competition (Wright, 2007). It has also been argued that larger
firms have innovation advantages over small firms due to economies of scale and scope in
research, financing advantages, and knowledge complementarities.
This paper examines whether acquirers pay more for acquisition candidates with higher
levels of R&D. The hypothesis is that R&D activity of a rival is worth more to an acquirer than
2 Examples includes Jensen and Ruback, 1983, Eckbo and Weir (1985), and Caves, 1991.

2
is indicated in the current value of the company. The essay also explores whether acquirers pay
more for acquisition candidates as market concentration increases. This might be the case if
companies are seeking to gain market share to increase pricing power and / or increase barriers to
entry.
To investigate these issues, I construct a data set of 112 horizontal mergers that
occurred from 1997 to 2007. These mergers were used as they all were issued 2nd requests by
the Department of Justice or Federal Trade Commission for competition concerns3, and 95 of
these mergers were challenged by the government for concentration concerns. To analyze the
data, a model was developed that correlates the deal premium paid for the acquisition candidate
to R&D intensity, market concentration, cost synergies4, and other factors relating to the merger.
The paper is organized as follows: A literature review section covers merger research
relating to R&D and market value, innovation and market concentration, and deal premiums.
The next section covers the data set and provides a descriptive analysis of the merger data and
variables examined in this paper. A description of the models follows as well as an explanation
of the econometric analysis employed to determine the effect of R&D, market concentration, and
other covariates on the premiums paid for these mergers. The paper concludes with the results,
an analysis of findings, and conclusions and potential policy implications.
2. Literature Review
There have been numerous studies5 that examine the effect of R&D spending6 and
other intangibles (e.g. advertising) on market value. Researchers continually find that both
3 See the Appendix for a list of mergers. 4 These are claimed by the acquirers at the time of the merger announcement. 5 For example, Chauvin and Hirschey (1993) and Ho, Key, and Ong (2005) 6 R&D expenditures are expensed rather than capitalized per the 1974 FASB ruling, because, according to
Lev and Sougiannis (2003), there is an assumed absence of a relation between R&D expenditures and value.

3
advertising and R&D expenditures have a consistent positive effect on the long term market
value of the firm. They speculate that “spending on advertising and R&D can be viewed as a
form of investment in intangible assets with predictable positive effects on future cash flows.
However, the valuation effects of advertising and R&D investment are most uniformly apparent
in the case of large firms.” (Chauvin, 1993)
The first and most widely cited paper that examined the relationship between R&D and
stock market performance was Griliches’ 1981 study which found a positive correlation between
the Tobin’s q of a firm and the level of R&D spending and patents applied. Jaffe (1986) added
to Griliches’ approach in that he modeled the market value of the firm relative to the current
R&D intensity and R&D stock. His regression results, which include factoring in spillover from
R&D from other firms, indicated that investors placed a significantly larger emphasis on the
value of R&D versus tangible assets. He also finds that firms whose R&D activity is in areas
where there is a lot of research by other firms have a higher return on R&D, whether measured in
terms of accounting profits or market value. Jaffe speculates that this result may be due to either
a selection bias of studying only firms that report R&D or to the potential signaling that R&D
spending conveys about long run returns. (Jaffe, 1986)
Connelly and Hirschey (1984) also contributed to the literature in examining the
correlation between R&D, market concentration and the value of the firm. They theorize that a
positive R&D-concentration interaction effect exists if R&D gives rise to sustainable proprietary
advantage, while a negative R&D-concentration interaction effect would indicate that R&D may
be especially difficult for joint profit maximizing oligopolistic firms to coordinate and thus
undermine tendencies toward shared monopoly behavior. Connelly and Hirschey’s findings

4
appeared to support the negative interaction effect although they suggest that the result could be
due to other reasons (e.g. firms in more concentrated industries are more efficient researchers).
Hall (1988) performed a similar study when she correlated current and past R&D
expenditures along with profits (as a proxy for market power) to a firm’s market value. Her
model included an R&D stock term, and an assumed depreciation rate of 15%. Her findings
reject this hypothesis, as she finds current R&D, but not past R&D, to be a significant indicator
of firm value. Hall (1993) later added to her analysis by examining the relative value of
intangible versus tangible assets in firms over a 17 year period. She finds that the market
valuation changed over time in its valuation of tangible versus intangible assets, with intangible
assets declining by a factor of 3 or 4 to overall value. She provides a couple of explanations for
this change to include the possibility that the returns to R&D declined or that R&D capital
depreciated more rapidly in the later years studied. Finally, she considers the possibility that the
reduced valuation of R&D in the 1980s was due to waves of mergers and leveraged buyouts,
particularly in the consumer products industries, whereby these companies’ market values were
bid up. Thus, if the market value of R&D assets had been driven down in the 1980s and early
1990s, then it is possible that the increased premiums in this study that acquirers placed on R&D
in horizontal mergers could be due to the depressed value of these R&D assets.
Johnson and Pazderka (1993) follow Hall and others in their 1993 study in which they
correlated market value to R&D and R&D stock, as well as a market power term and a firm’s
book value. They hypothesize that the market places a positive value on R&D expenses as a sign
of future growth and profitability. They develop a model that explains market value as a
function of tangible assets, as measured by the firm’s book value (BV), and intangible factors to
include: 1) market power (E*/BV), 2) R&D intensity, which is measured as current R&D

5
expenditures divided by book value, and 3) investment (INV) over the last year. The market
power term (E*) is defined as current profits minus a firm’s cost of equity capital.7 Their model
is the following:
lnMV= β0 + β1lnBV + β2ln(E*/BV) + β3(R&D/BV) + β4(INV/BV) + Є (1)
Johnson and Pazderka chose not to use patents as an explanatory variable, like
Griliches and others8 did, because previous studies (e.g. Griliches, 1988 and Hall, 1990) did not
find patents to be significant in explaining market value, and they deem measuring the number of
patents to be of dubious value. Johnson and Pazderka found the coefficient of R&D intensity to
be positive and significant to the 5% level. They found mixed results in their market power and
investment terms.
There has been a lot written correlating a firm’s market value to its R&D activity, but
few have studied the relationship between the abnormal returns in a merger and R&D activity.
Higgins and Rodriguez (2006) examine acquisitions in the pharmaceutical industry from 1994 to
2001. They find evidence that acquirers realize significant positive returns on these acquisitions.
They provide three explanations for their findings. First, deteriorating R&D productivity could
be the motivation underlying the acquisition of research-intensive firms. The authors note that
the late 1990s and early 2000s was a period in which drugs were very rapidly coming off patents.
In response to their deteriorating patent-protected pipeline, pharmaceutical companies may have
responded by making more acquisitions thus bidding up the acquisition prices. Second,
biopharmaceutical firms supplement internal R&D efforts through acquisitions. This trend was
particularly evident in the early 2000s as companies sought to fill drug pipelines and research
gaps. This merger wave, they claim, has bid up acquisition prices. Third, acquirers can obtain
7 E*=NI – (k X BV), with NI being net income, k the cost of equity and BV the book value. 8 Johnson and Pazderka specifically refer to Zion (1984).
6
significant additional information through pre-acquisition alliances with the target firm or
alliances with firms conducting research that is similar to that of the potential target firm. By
obtaining this information, acquirers take out much of the risk inherent in an acquisition so they
can more confidently offer a higher takeover price.
2.1 Relationship between Innovation and Market Concentration
The correlation of firm size to innovation and market concentration to innovation were
first theorized by Schumpeter (1950) and Galbraith (1957). The rationale behind the innovation-
firm size correlation, is 1) R&D projects involve large fixed costs that can only be covered if
sales are sufficiently large (Syrneonidis, 1996), 2) Economies of scale and scope in the
production of innovation are needed (Syrneonidis, 1996), 3) Capital market imperfections confer
an advantage to large firms in securing financing for risky R&D projects (Cohen et al 1987), and
4) R&D is more productive in large firms due to complementarities between R&D and other
non-manufacturing activities (e.g. finance and marketing) (Cohen et al 1987).
In addition, Syrneonidis (1996) argues that innovative activity may be higher in
concentrated industries because firms with greater market power can more easily garner the
returns from innovation and thus have more incentive to innovative. The argument is that
patents become more valuable with greater market power. In addition, he states, other
mechanisms assuring appropriability, such as the secrecy, investment in marketing, learning by
doing, and control of distribution channel all play a role in a firm with market power benefiting
from innovation.
The problems that Syrneonidis points out with the literature include: 1) assumptions
that firm size and market structure are exogenous; recent work, he comments, points to
“endogeneity of innovation and market structure”, 2) lags between firm size and innovation, 3)

7
control of industry effects, and 4) the implicit assumption that market concentration equals
market power.
2.2 Explanations of the Deal Premium
Explanations of the deal premium vary significantly and include 1) efficiency gains, 2)
increased market power, 3) management improvement, 4) supply and demand for the stock, and
5) bidder’s pay too much. Efficiency gains refer primarily to economies of scale, economies of
scope, or other cost and/or marketing synergies. Efficiencies can be divided into static and
dynamic efficiencies. Static efficiencies refer to improvements, such as economies of scale that
occur once. Dynamic efficiencies, according to the Secretariat of the European Competition
Commission, enhance the ability or incentive to innovate. “Learning by doing, eliminating
redundant research and development expenditures, and economies of scale in R&D are examples
of dynamic efficiencies.” (OECD, 2007)
Market power refers to a firm’s ability to influence price, quantity, and the nature of the
product. In turn, market power may lead to excess returns. In related acquisitions, market power
may be increased through product or market extension acquisitions (Montgomery, 1985).
Premiums for management improvement in a merger stem from shifting business assets
into the hands of managers who can generate more value from them, thanks to a greater ability or
stronger incentives to maximize value (Slusky and Caves, 1991).
In addition, deal premiums can arise simply because of the limited supply of stock in
the company. If the buyer is demanding a large percent of the stock then the forces of supply
and demand will raise the stock market value. According to Stout (1990), this has been an often
overlooked factor, as most research has viewed the supply of stock to be perfectly elastic or that
stock prices do not vary with the size of the transaction. She adds that this explanation is often
8
overlooked because it is contrary to the traditional capital asset pricing model. “From the
perspective of the buyer, the supply function for outstanding shares is upward sloping. The
takeover bidder who wishes to purchase the stock of a target firm from its current shareholders
must offer a price that meets or exceeds the shareholders’ varying subjective estimates of value.
Thus, purchasing larger amounts requires the bidder to offer higher and higher prices.” (Stout,
1990)
Finally, it has been argued that there is a winner’s curse whereby bidders pay too much
as evidenced by their below average post acquisition returns.
There are a number of empirical studies relating to the determination of merger
premiums. The method employed in these studies is to regress certain factors, such as fit,
financial leverage, management change, etc. against the deal premium One example is Slusky
and Caves’ (1991) study of 100 acquisitions in which they seek to identify the source of the
acquisition premium using the following identity:
PR = (BRES[Xi]/MV)B(Zi) (2)
PR in this equation refers to the one plus the deal premium or the ratio of the
reservation price (BRES) paid by the successful acquirer divided by the market value of the firm.
The reservation price depends on factors [Xi] that “predict the increase in cash flows due to
combining the two firms’ assets.” (Slusky and Caves, 1991) Slusky and Caves further note that
the B(*) is a bargaining function that “determines where the actual price falls between the
reservation price of the would be acquirer (BRES) and the current owners (MV).” Zi are the
determinants, such as the presence of competing bidders, affecting the bargaining function. The
authors find in their study measures of synergy and managerial effectiveness as the primary
factors influencing the reservation price.

9
3. The Data Set
The dataset for the dissertation includes 112 horizontal mergers that received second
requests from the government per the Hart Scott Rodino (HSR) Act9 from 1997 through 2007. 95
of these mergers were challenged by the FTC or DOJ for violation of the Clayton Act Section VII
b for excess concentration, which per the recent merger guidelines is a change in HHI >50 and/or a
new HHI level >1,800.
During this 11 year time period 742 2nd requests per the HSR Act were issued, and 440
proposed mergers were publicly challenged by the Department of Justice and FTC (208 were
publicly challenged by the Department of Justice and 232 were challenged by the FTC).
“Challenged mergers” refer to mergers that are publicly challenged by the government after a HSR
2nd request. I use this data set, since it represents horizontal mergers that the government has
determined to involve significant increases in market concentration10.
The following chart shows the number of 2nd requests and challenged mergers that
occurred from 1997 to 200711 per the HSR Act.
Table 1: Breakdown of 2nd Requests and Merger Challenges
Insert Table 1 here
9 The HSR Act requires specific filings for all mergers over a certain size threshold. This amount, which
is adjusted annually based on the change in the gross national product, is $65.2 million as of February, 2009. After receiving the initial filings, the government then has 30 days to request additional information if the transaction appears to present anti competitive problems. The request for additional information is referred to as a 2nd request and typically extends the waiting period an additional 30 days. The government may then choose to allow the merger, seek injunctive relief, or negotiate a settlement that often involves disposition of key assets.
10 Mergers involving private companies, product lines, or divisions of public companies could not be
included because data was pulled from SEC filings. In addition, I needed mergers that occurred fairly recently, because SEC filings become harder to gather the further back in time one goes.
11 The numbers in the chart were taken from public filing reports found on the DOJ and FTC web sites.

10
Typically, per the merger review process, approximately 1,750 to 2,000 mergers are
reviewed a year. Roughly 95% of the mergers are cleared during the 30 day waiting period as
detailed in the HSR act and subsequent merger guidelines. 2nd requests are issued by the FTC
and DOJ for the other 5% of mergers if the government believes there is a strong possibility that
the transaction may be in violation of antitrust laws. The parties then submit further
documentation, and the government decides whether to challenge formally the merger. When a
merger is publicly challenged a complaint and / or competitive impact statement is issued. These
documents include evidence, such as market share, market concentration, and the definition of
the contested market (See Appendix A for a list of challenged mergers used in this study).
Mergers were deemed to have been challenged by the Federal Trade Commission or the
Department of Justice if a complaint was filed in court or a press release was issued by either
agency announcing that the transaction had been abandoned or restructured in response to the
Department’s concerns.12 In these cases a complaint and / or competitive impact statement is
issued, which includes some of the evidence, such as market share, market concentration, and
information concerning the relevant market behind the merger challenge.
The data set also includes 17 mergers in which a 2nd request was issued, but the merger
was not challenged. Presumably, the mergers that were challenged would have resulted in higher
market concentration than mergers that were not challenged. However, some of the non-
challenged mergers would have resulted in very high market concentration as well. Explanations
as to why mergers with apparent high market concentration results were not challenged include
1) the failed firm argument, in which one of the companies is no longer a competitive threat.
This argument was used in the merger of McDonnell Douglas and Boeing, when the FTC
12 See http://www.ftc.gov/os/2003/12/mdp.pdf for the full explanation of challenged mergers.

11
decided that “McDonnell Douglas, looking to the future, no longer constitutes a meaningful
competitive force in the commercial aircraft market.”13 A second argument is the efficiency
defense, in which the government deems that the positive effects of merger specific cost savings
outweighs the negative effects of potential price increases due to increased market concentration.
This was a key reason why Whirlpool’s acquisition of Maytag was approved.
The database is limited to mergers of standalone, public companies. I chose this data
set since I wanted recent mergers across many industries in which I could test how market
concentration is influencing the deal premium. Since these mergers were challenged, there is
data available in the government merger impact statements regarding the levels of market
concentration that result from the merger.
I recognize the selection bias in using this data set that primarily covers high levels of
market concentration; however, there is a significant range of market concentration in the data.
Another problem with testing the effect of market concentration is that most of the firms have
multiple products. Therefore, I had to weight the change in concentration by the target
company’s product sales as a percent of their total sales.14
The following table details each variable used in this study to determine the effect of
R&D, market concentration, and other factors on the deal premium.
13 See http://www.ftc.gov/opa/1997/07/boeingsta.shtm 14 A worksheet detailing the calculations of weighted change in HHI for each merger is available upon
request.

12
Table 2: Variable Description
Insert Table 2 here
3.1 Sources
The merger announcement date, deal size, and claimed cost synergies were gathered
from press releases. I then used the daily stock prices in the CRSP data base to determine the
deal premium. R&D intensities and profit margins were gathered from company financial
reports. The book value for Tobin’s q was gathered from company reports and the Compustat
database. Real economic growth rates were gathered from the Bureau of Economic Analysis
report. Weighted change in HHI amounts were gathered from government complaint documents.

13
3.2 Deal Premiums
Per Slusky and Caves’ (1991) technique, the premium is the difference between the
adjusted deal price offered for the acquisition candidate and the market price, one month prior.
The denominator is then the target’s stock price one month before the announcement. The
announcement date is the day in which the acquisition candidate received its first official bid.15
The adjusted deal price is the amount offered for the acquisition premium multiplied by (1- %
change in the S&P). By adjusting the deal price in this manner, the offer price is discounted to
the 30 day prior level by the change in the S&P 500 index.
I used the offered share price versus the actual stock market price in order to capture
the amount that the firm is worth to the acquirer. As such, this technique for calculating the deal
premium does not take account investor reactions to the deal. Often the stock price is lower than
the offered price in the days after the announcement as investors fear the deal may not occur due
to regulatory or financial concerns.
In a few cases (e.g. Oracle-Peoplesoft and Boston Scientific-Guidant) the initial offer
was rejected and later a second or third offer was accepted. In these cases I calculate the deal
premium as the percent change in stock price from the market value 30 days prior to the initial
offer to the final offer, and subtract out the change in the S&P 500 during that longer period.
The window in which the deal premium was calculated was three months in the case of Boston
Scientific and six months in the case of Oracle. I calculate the deal premium in this manner in
order to capture the total amount the acquirer is paying for the deal.
15 In a few cases (e.g. Oracle acquiring Peoplesoft) the first bid was rejected and subsequently a higher bid
was accepted. For the purposes of this study only the premium reflected in the first bid is included.

14
The data set includes only acquisitions of one company by another. I did not include
equal mergers of two companies (e.g. Smithline Beecham / Glaxo and Conoco / Philips) as there
no outright purchase so one cannot correlate factors to a purchase price or premium.
3.3 Explanatory Variables
R&D intensity is often used as a proxy for knowledge potential. In this model, I use
the average R&D intensity of the acquired firm for the two years prior to the merger. R&D
intensities were obtained from company financial statements.
Deal size refers to the amount that is paid by the acquirer for the acquisition. It is used
as a control variable and an interactive variable with R&D to test for part of the Schumpeterian
hypothesis. A positive, significant coefficient for the interactive variable would support
Schumpeter’s argument that size improves a company’s innovativeness.
Change in HHI refers to the weighted average change in HHI for the acquired firm.
This amount was calculated by taking the percent of a firm’s most recent annual sales that the
product line (s) of concern for excess concentration represents and multiplying by the change in
HHI as noted in the competitive impact statements or complaints.16 In many cases the weighted
average change in HHI included many product lines. Mergers are challenged based on change in
HHI and HHI levels. I chose to use change in HHI as it more accurately reflects the incremental
benefit that an acquirer might be gaining from the acquisition. In addition, change in HHI is
more readily available in the public documents than HHI level.
Weighted average change in HHI in some of the mergers is difficult to calculate for a
variety of reasons to include the following:
16 These documents list either the change in HHI, which is the product of the firms’ market shares, or the
market shares of the firms of interest.

15
Mergers were challenged for excess in concentration in the U.S., but the firm’s sales are
global. Thus, I assumed in some cases that the concentration levels in the U.S. applied
globally as well. In other cases I weighted change in HHI by U.S. sales.
In some cases (particularly with telecommunications mergers) the challenge was based
on regional market shares and sales were not available for the region. In these cases I
estimated regional sales on customer base or population level.
Implicit in the weighted change in HHI technique is that the company’s product line
sales that were not challenged result in zero change in market concentration from the
merger. Although this may often not be the case, the assumption is still valid because
the government, who has supposedly sifted through the companies internal documents,
has determined the other product lines do not constitute a threat to competition.
Change in HHI is a key variable in a structural analysis of a merger’s impact on
competition. In merger analysis the government examines the unilateral and coordinated effects
that are likely to occur. Change in HHI is a key variable used to examine a merger’s likely
coordinated effects, which antitrust agencies describe as the probability that firms in the market
will successfully coordinate their behavior or strengthen existing coordination causing significant
harm to the competition. In conducting merger analysis, the agencies then examine both pre-
market conditions and the impact of the merger on these conditions.17 (Ray)
Net profit margins can indicate the target firm’s ability to price above marginal cost and
thus shows its pricing power. Large or increased net profit margins between the merger
companies could indicate a firm’s ability to harm competition unilaterally. Agencies look at the
17 The descriptions of coordinated effects in this paragraph and unilateral effects in the succeeding
paragraph were taken from the Merger Working Group co-chaired by the Department of Justice’s (DOJ) Antitrust Division and the Irish Competition Authority as shown in Sheppard Mullin Richter & Hamilton LLP’s July 9, 2009 Antitrust Blog found at http://www.jdsupra.com/documents/d4cf75da-0d3b-4934-ba8d-6b818fa2d1bd.pdf.
16
potential for a horizontal merger to result in anti-competitive unilateral effects, or the likelihood
that a merger will harm competition “by creating or enhancing the merged firm’s ability or
incentives to exercise market power independently.” (Ray)
Economic growth refers to the real U.S. annual GDP growth. This variable is used to
control for macroeconomic effects under the assumption that the amount companies pay and
perhaps more significantly the stock market value of the company are influenced by the
macroeconomic environment, which is proxied by economic growth.
I use the actual growth rates in the year after the merger announcement. This variable
then accounts for managers expectations of growth in the economy, which will influence the
cash flows for the target company. The next year economic growth is also used because many
of the mergers occurred mid or even late in the year.
I use Tobin’s q as a measure of how much investors are willing to pay for a company’s
assets. Tobin’s q relies on strict accounting of company book value and the market capitalization
of the firm. However, book value (the denominator of Tobin’s q) ignores the replacement costs
of intangible assets, such as R&D and advertising (Carlton and Perloff, 1994). As such, one
might expect a high correlation between Tobin’s q and R&D intensity. However, these two
variables do not appear to have significant correlation in the mergers examined in this study (See
Appendix C for the correlation matrix of variables). A hypothesis regarding Tobin’s q is that it
will be positively correlated with merger premiums indicating that acquirers are willing to pay
more than the market value for control over intangible assets. Alternatively, it might be
negatively correlated with merger premiums suggesting that acquirers are seeking to purchase
poorly managed companies. Higher Tobin’s q amounts are often considered to indicate that
investors have confidence in the management of the company.

17
Cost synergies reflect anticipated cost reductions that are identified by the acquirer to
be achieved as a result of the merger. This variable is self reported by the acquirer often as a
justification for the merger. I am using this variable as a means to test directly for the efficiency
rationale for a merger.
3.4 Merger Data by Industry
Table 3: Breakout of Mergers by Industry
Insert Table 3 here The majority of the mergers covered were in the manufacturing sector, with roughly
20% to 25% of them being in the life sciences industry. After life sciences the industries covered
are well spread out between petroleum, high tech, chemical processing, consumer goods,
aerospace, and services, particularly the tele-communications industry.
There were merger waves in the petroleum (late 1990s) and life sciences (early 2000s)
sectors that were included in this data set. These merger waves do not appear to have influenced
the premiums paid, as I did not find any discernable difference in the merger premiums from the
beginning to the end of the merger wave.
Table 4: Average Merger Premiums by Industry
Insert table 4 here
As shown in the chart, challenged mergers appear to have a higher premium than non
challenged mergers in each industry, except for life sciences. However, since the data set
included only a small number of mergers in which 2nd requests were issued, but the merger was
not challenged, these differences are likely not to be statistically significant.

18
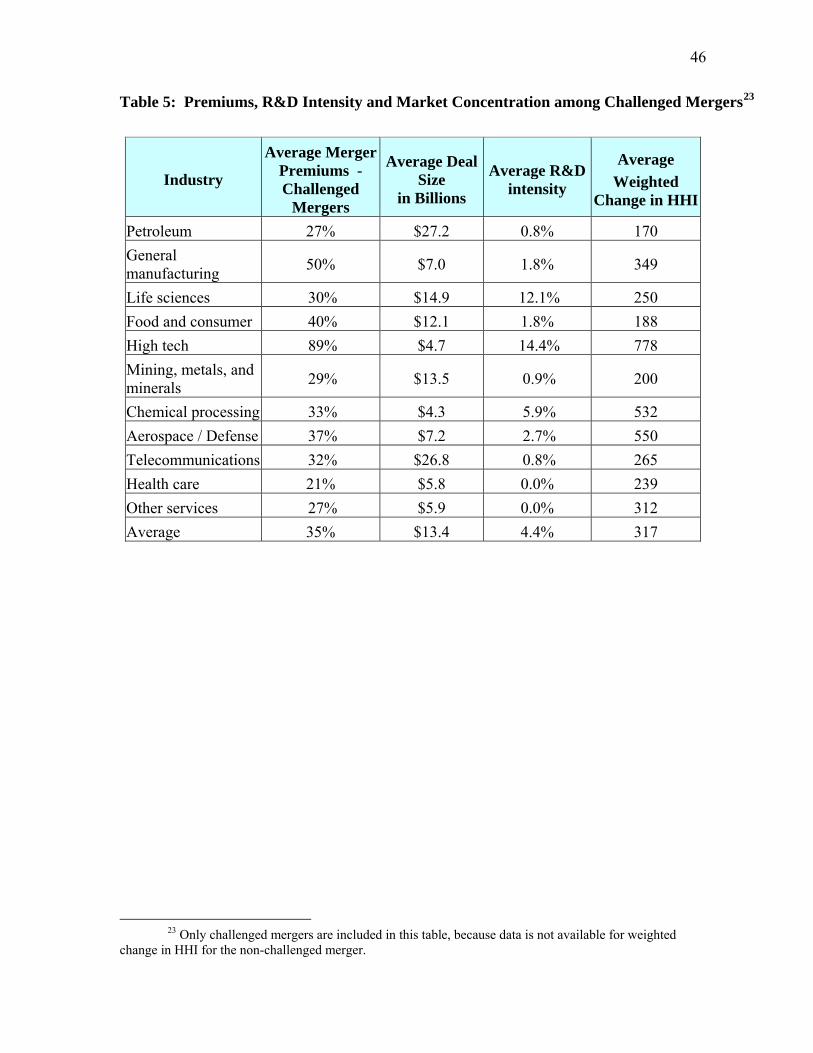
Table 5: Premiums, R&D Intensity and Market Concentration among Challenged Mergers18
Insert table 5 here
The high tech industry had the highest deal premium, R&D intensity and average
weighted HHI. In addition, the average deal size in the high tech industry was the lowest. Life
sciences had a below average deal premiums, high R&D intensity and lower HHI.
4. Methodology
The objective of this study is to investigate the relationship between innovation (as
proxied by R&D), market concentration, and the acquisition deal premium. The primary
hypothesis I am testing is whether R&D intensive acquisition candidates receive a larger deal
premium. In addition, I am testing whether the deal premium is positively impacted by increased
market concentration resulting from the merger. A positive answer to the first hypothesis
supports the efficiency (static and dynamic) argument relative to R&D, while an affirmative
answer to the second hypothesis provides evidence in support of the market power explanation
for the deal premium
In considering these hypotheses, I plot an average of deal premiums in the data set
versus the weighted change in HHI for three R&D categories.
18 Only challenged mergers are included in this table, because data is not available for weighted change in
HHI for the non-challenged merger.
19
Table 6: Average Deal Premiums versus Change in HHI by R&D Class
Insert graph here
The graph appears to indicate that for weighted average change in HHI above 50 and
lower than 250, the deal premiums are higher with a higher R&D intensity class. Specifically,
the deal premiums in the 50 to 250 change in HHI range are above the 34% average for
challenged mergers in the R&D classes of 5% - 10% and >10%, but below the average deal
premium in the R&D class <5%. Above 250 weighted change in HHI, the results are mixed.
4.1 Other Study Questions
In addition to testing for how R&D and market concentration influence the deal
premium, I also examine whether 1) the combination of higher R&D intensity and market
concentration or 2) deal size and R&D intensity result in a larger premium. In addition, I test
whether the relationship between the two explanatory variables, R&D intensity and market
concentration, and the deal premium differs depending on their level (e.g. low, medium, or high).
If imperfect competition favors innovations, then one would expect a higher value to be placed
on increased market concentration and R&D intensity. Similarly, if larger firms are more
innovative, then acquirers might pay more as firm size and R&D intensity increases.
In addition, to these questions, I will examine whether the deal premiums vary
significantly by industry. Significant deal premiums in a sector might indicate industry-specific
factors (e.g. over capacity or new regulations) that are motivating firms to merge.

20
4.2 Models
My approach is to investigate these patterns using econometric models that integrate
Griliches (1984) and Johnson and Pazderka’s (1993) methods into Slusky and Caves’ (1991)
model. To do so, I will assess the effect of R&D intensity, weighted average market
concentration, and profit margin (PM) on the deal premium (DP). I will also include terms for
cost synergy (Cost), Tobin’s q (Q), deal size (S), and economic growth (GRt+1). The analytical
framework for the study is based on Slusky and Caves’ structural equation presented earlier.
To answer the questions posed, I present a series of models as follows: 1) Base and
Interactive Model, 2) Industry and Merger Challenge Fixed Effects Models, and 3) HHI and
R&D Segment Models. The models were run for the 95 challenged mergers and all 112 mergers
(challenged and non-challenged).
It should be noted that there are likely other variables, such as financial leverage, that
affect the deal premium, but are not related to the questions of interest. The omission of these
other variables is not likely to bias the other coefficients in the results as they do not appear to be
correlated with the included explanatory variables.
Also, these models are reduced form equations. As such, I tested the models using a
number of specifications19 that are relevant to the study questions and chose equations 2.5 and
2.6 listed below as the primary models because they provided the best fit. I recognize that results
may be sensitive to specifications. I investigated a number of specifications and found most of
the results to be qualitatively similar to the ones reported.
19 I tested a number of interaction terms including (profit*log ΔHHI), (profit*log deal size), (log ΔHHI*log deal size), and (log R&D*profit). None of the interactive terms were found to be significant. In addition, I tested a linear versus log specification for both the base and interactive models and found a better fit when transforming the dependent and independent variables to logarithms.

21
Model 1: Base Model
lnDPi= β1 + β2lnCostm + β3lnSi + β4PMi + βln∆HHIm+ β6lnRi + β7lnQi + β8lnGRt+1 + Єi (3)
In this equation, i refers to the acquisition candidate, and m indexes the merger. (See
table 2 for a reference of variables) The variables were expressed in logs for all covariates
except for profit margin to assess a non-linear relationship. Average profit margins were left in
levels because approximately a third of the margins were negative.
Change in HHI variable is only available for challenged mergers. In order to compare
results between challenged and all mergers, the base model was run both for challenged (95) and
all mergers (112) without the change in HHI term. The results are presented in table 8.
To test the interaction between R&D intensity, change in market concentration, and
deal size, I developed a second model that adds interactive terms (lnR*ln∆HHI) and (lnR*lnS) to
Model 1. This model was run for the challenged merger sample and also for the full sample,
with a challenge dummy included and change in HHI dropped.
Model 2: Interactive Model
lnDPi= β1 + β2lnCostm+ β3lnSIZEi + β4PMi + β5ln∆HHIm + β6lnRi + β7lnQi + β8lnGRt+1 + β9(lnR*ln∆HHI) + β10(lnR*lnS) + Є (4)
Industry Models
Mergers in the data set were classified into 10 different industries. These industries
may have specific characteristics during the time frame under consideration that would cause the
deal premium to be higher or lower than average. As such, I ran a regression using fixed effects
alone to determine the sign and significance of the industry on the deal premiums. I also ran a

22
second regression adding the fixed effects to model 2.5 to assess how the covariates along with
the industry affect the deal premium.
In addition, I extended the base model to assess the effect of the merger challenge on
the deal premium. I did this by running another regression using a dummy variable for the
merger challenge, and an interactive term of the merger challenge dummy variable with R&D to
see if the effect of R&D is any different in challenged versus non challenged mergers.
HHI and R&D Segments
The purpose of these models is to look at different segments (low, medium, and high
concentration) of market concentration and R&D to assess the sign and significance of the effect
of these segments on the deal premium. To do so, I classified weighted change in HHI and
R&D-intensity into low, medium, and high ranges as follows:
Table 7: Change in HHI and R&D-Intensity Classes
Insert table 7 here
I then added dummy variables to equation 2.5 to assess the effect that each of the six
segments has on the deal premium along with the other covariates. In addition, I ran a second
regression to assess the impact of interacting each of the three R&D segments with each of the
three changes in HHI segments. In the model I drop two of the segments; the coefficients for
each of the variables are then compared to the dropped interactive terms.
23
5. Results
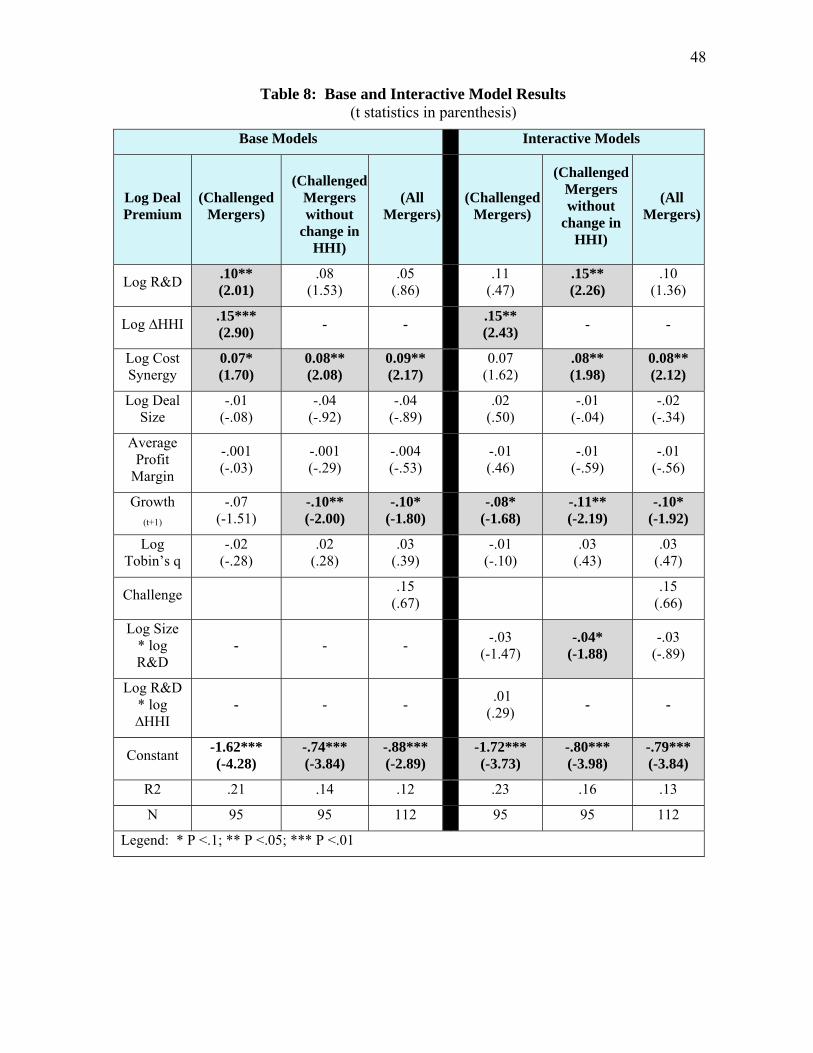
Table 8: Base and Interactive Model Results (t statistics in parenthesis)
Insert table 8 here
The coefficient for change in HHI in logs is positive and significant at the 1% level in
the base model. The coefficient (.15) of log change in HHI also explains a large amount of the
deal premium. A positive, significant coefficient for log weighted change in HHI in the base
model would appear to indicate that companies are paying more to gain market power via
increased market concentration. This finding lends support to the structural method of
evaluating mergers, as companies are motivated to acquire companies for gains in market share.
The coefficient for log cost synergy is positive and significant in each of the models.
This finding supports the notion that companies consider the potential cost synergies in their
acquisition price. This finding has important policy implications as it shows that acquirers
engage in horizontal mergers not only to gain market share but also to take advantage of cost
synergies.
The coefficient of growth one year in the future is significant and negative in both the
base and interactive models. This finding might be due to lower market values of the acquisition
candidates prior to the merger announcement as the economy slows. A possible explanation for
the negative coefficient on growth is that acquirers have a longer term time horizon when
considering the potential value of the firm than do investors.
I tested the macro growth rate for the current year and the next year and found only the
next year to be significant. It is reasonable that the next period growth rate would be significant
since stock prices supposedly are forward looking 3 to 6 months into the future.

24
The coefficient for log R&D is positive in all models and significant in the base model
and the interactive model for both challenged and non-challenged mergers. The coefficient of
log R&D also appears to be fairly large (.10 in the base and .15 in the second interactive model)
relative to the other coefficients.
These findings are particularly relevant since these mergers are all horizontal mergers
that received 2nd requests with the majority of the mergers being challenged for excess
concentration. These results would seem to show that companies are paying higher premiums
for firms with higher R&D intensity in concentrated industries. However, it is also noteworthy
that the coefficient for log R&D in the first interactive model is insignificant and small. It
appears from these findings that R&D intensity impacts the deal premium only when change in
HHI or the deal size interacted with R&D intensity is considered.
The coefficient for the interactive term (lnR*lnS) is negative in the interactive model of
challenged mergers and significant to the 10% level. The coefficient of the interactive term is
also negative when including all mergers but not quite significant. It is surprising that the
coefficient for (lnR*lnS) is negative since the coefficient for log R&D is positive and significant.
It appears to contradict the hypothesis that an acquisition candidate is worth more the larger its
size and R&D intensity. In fact, given that the term is significant and negative it would indicate
the opposite. This result, however, is very likely skewed because high tech industries have a
very large premium (average of 89%), high R&D-intensity, but small deal sizes. As such, some
of the results do not appear to generalize outside of one or a few industries.
(lnR * ln∆HHI) is not significant, which appears to contradict the hypothesis that firms
are paying more for the combination of R&D intensity and market concentration. We have to
look at Table 2-10, which breaks down R&D and change in HHI in several classes to find both

25
the range of R&D intensity that is significant when combined with change in HHI and the range
of HHI change that is significant when combined with R&D-intensity.
Finally, the coefficient for the challenge merger dummy is not significant in either the
base or interactive models.
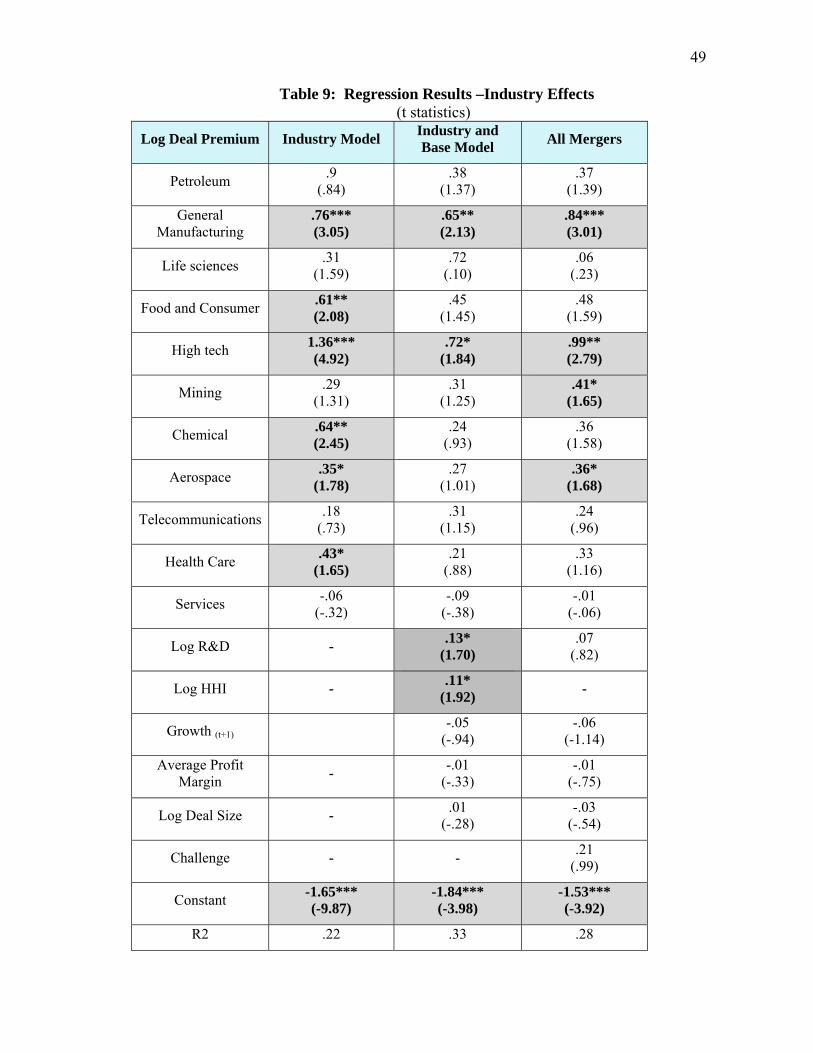
Table 9: Regression Results –Industry Effects
(t statistics)
Insert table 9 here
The first regression (Industry model) shows the results when regressing each of the
industries to the deal premium, while the second regression (Industry 2) adds the other covariates
from the base model. From the Industry model regression we see the effect of being in a specific
industry if none of the other factors are considered. The results show the coefficient for the high
tech industry to be positive, significant to the 1% level, and very large. The positive coefficient
for the high tech industry may be due to the timing of the data set from 1997 to 2007, which includes
the high tech bubble and bust. We also see the coefficients for general manufacturing industry to
be positive in each of the models. This might indicate that market share is of greater value to an
acquirer in the general manufacturing industry than other industries, perhaps due to barriers to
entry from economies of scale. Finally, we see the coefficients for the aerospace, food,
chemical, and health care industry positive and significant in the first model, but not significant
when including R&D intensity, change in HHI, etc.
26
The fit is the best in the second regression. The results from this model indicate that
R&D intensity and change in HHI are significant in their influence on the deal premium in
addition to being in the high tech and general manufacturing industry.
The third model differs slightly from the second model in that it includes all mergers.
The model has a dummy variable for the merger challenge and excludes change in HHI, since
non-challenged mergers are included. The fit in the third regression is worse than the second
one, most likely because change in HHI is not included. In the third regression, the coefficients
for mining and aerospace become significant in addition to the coefficients for high tech and
general manufacturing. It appears that as change in HHI is dropped from the model, acquirers
primarily consider the industry and cost synergies in determining the deal premium.
HHI and R&D Segments
The next model examines the regions of R&D and change in HHI that are significant in
determining the deal premium. In doing so, I break down the weighted change in HHI and
R&D-intensity into three segments each (nine in total) to approximate low, medium, and high.
The following chart shows the average premiums by segment.
Table 10: Average Deal Premiums by Market Concentration and R&D Segments
Insert table 10 here It is interesting to note that deal premiums are the highest in the middle and high range
of market concentration irrespective of R&D intensity. The one outlier is 73% deal premium for
high R&D intensity and medium levels of market concentration. The results from the following
regressions show the sign and significance of separate R&D and ∆HHI segments as well as
interacting R&D and ∆HHI segments.

27
Table 11: Regression Results – Fixed and Combination Segments (t statistics in parenthesis)
Insert table 11 here
I find in the fixed segment model that the deal premium in the middle change in HHI
range (100-250) is 48% higher than the high (>250) change in HHI range. The coefficient for
the low (<100) change in HHI range is also positive but not significant. Therefore, the results
show that not only does the change in HHI have a positive effect on the deal premium, and but
also that companies will pay the most for acquisition candidates when the change in market
concentration is in the middle range.
From the fixed segment model we also see that log R&D has a positive effect on the
deal premium. However, it is unclear whether any R&D segment has a larger effect on the deal
premium than another segment as neither of the R&D segment coefficients is significant.
In the combination segment model, I combine R&D segments with the range of change
in HHI, and combine change in HHI segments with the range of R&D. I find the middle ∆HHI
combined with R&D to have the highest deal premium (25% higher than the low segment), and
the deal premium in the high ∆HHI combined with R&D to be positive but not quite significant
in comparison to the low segment.
I also find significant differences in the R&D segments combined with change in HHI.
Here, the middle R&D range and high R&D range each combined with change in HHI results in
a 10% and 9% lower deal premium relative to the low R&D range combined with change in

28
HHI. This result again is counter to the notion that the deal premium is an increasing function of
R&D intensity combined with change in market concentration.
6. Summary
There have been many studies that have found a positive correlation between R&D
investment and market value. This study considers how an acquirer values a firm in a horizontal
merger. In particular, I focus on the value acquirers place on R&D intensity and market
concentration versus other factors. The study indicates that there is a high correlation between
the amount acquirers pay in effectuating a horizontal acquisition and cost synergies, the R&D
intensity of the acquired firm, and the resulting market concentration that ensues from the
merger. R&D intensity, however, only impacts the deal premium when it is consider along with
change in market concentration or is interacted with deal size. These results could be interpreted
as lending support for the Schumpeterian theory20 since if firms are paying more for R&D
intensity and change in market concentration then there is incremental value to the acquirer when
both factors exist. However, when R&D intensity is combined with market concentration the
interactive term is not significant while R&D intensity when combined with deal size is
negatively correlated to the deal premium. Both findings appear to counter the Schumpeterian
hypothesis.
To further explore this issue, I separate the range of market concentration change and
R&D-intensity into distinct segments. In doing so, I find significant positive correlation between
mid and high levels of market concentration and the deal premium. In addition, I find that
acquirers appear to value acquisition candidates the highest at mid levels of market concentration
change when combined with R&D and slightly less at high levels of market concentration
20 The study does not directly tie to Schumpeter’s hypothesis because it tests for the significance of change in market concentration to the deal premium versus concentration levels.
29
change when combined with R&D. Deal premiums are the lowest at low levels of market
concentration change when combined with R&D.
The results also show that macro economic conditions effect the deal premium as
higher premiums are paid in times of expected future low economic growth. In addition, I find
in some cases the industry affects the value of the deal premium. In particular, deal premiums
are higher in the high tech industry and the general manufacturing industry.
There are a few policy implications to consider from this study. First, it does appear
that change in HHI is relevant in viewing the potential pricing power that can result from a
merger since firms will pay a larger premium for mergers that result in higher changes in HHI.
Second, R&D-intensity is also a very important factor to consider, particularly when combined
with mid to high levels of market concentration. Acquirers appear especially interested in
acquiring companies that provide a unique mix of R&D intensity and increased market share in
order to gain monopoly positions. It is this mix, I believe, that facilitates the acquirer’s ability to
monetize R&D efforts and, therefore, gain a sustainable competitive advantage.
While this paper has provided evidence of the significant role that market concentration
and R&D intensity play in affecting the values placed on horizontal merger candidates, it does
not explain the effect on innovation that results from these mergers. It is left to future research to
assess the impact of R&D intensity that results from horizontal mergers.
30
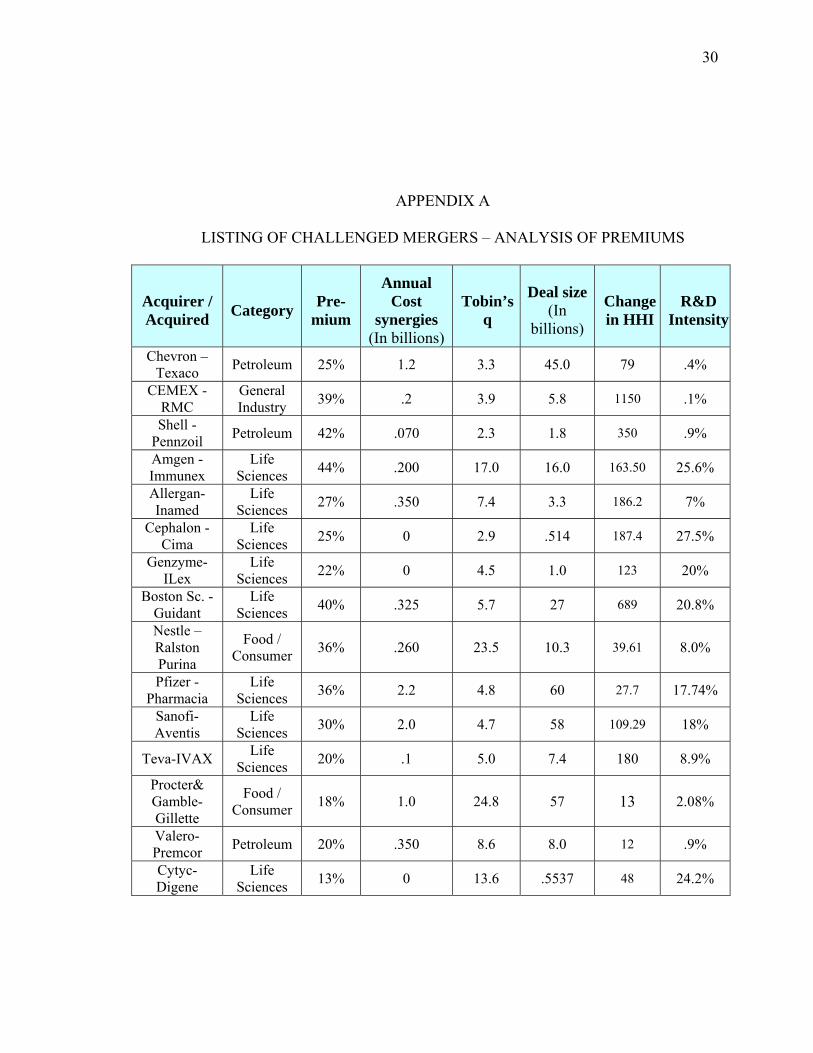
APPENDIX A
LISTING OF CHALLENGED MERGERS – ANALYSIS OF PREMIUMS
Acquirer / Acquired Category Pre-
mium
Annual Cost
synergies (In billions)
Tobin’s q
Deal size (In
billions)
Change in HHI
R&D Intensity
Chevron – Texaco Petroleum 25% 1.2 3.3 45.0 79 .4%
CEMEX - RMC
General Industry 39% .2 3.9 5.8 1150 .1%
Shell - Pennzoil Petroleum 42% .070 2.3 1.8 350 .9%
Amgen - Immunex
Life Sciences 44% .200 17.0 16.0 163.50 25.6%
Allergan-Inamed
Life Sciences 27% .350 7.4 3.3 186.2 7%
Cephalon - Cima
Life Sciences 25% 0 2.9 .514 187.4 27.5%
Genzyme-ILex
Life Sciences 22% 0 4.5 1.0 123 20%
Boston Sc. - Guidant
Life Sciences 40% .325 5.7 27 689 20.8%
Nestle – Ralston Purina
Food / Consumer 36% .260 23.5 10.3 39.61 8.0%
Pfizer - Pharmacia
Life Sciences 36% 2.2 4.8 60 27.7 17.74%
Sanofi-Aventis
Life Sciences 30% 2.0 4.7 58 109.29 18%
Teva-IVAX Life Sciences 20% .1 5.0 7.4 180 8.9%
Procter& Gamble-Gillette
Food / Consumer 18% 1.0 24.8 57 13 2.08%
Valero-Premcor Petroleum 20% .350 8.6 8.0 12 .9%
Cytyc-Digene
Life Sciences 13% 0 13.6 .5537 48 24.2%
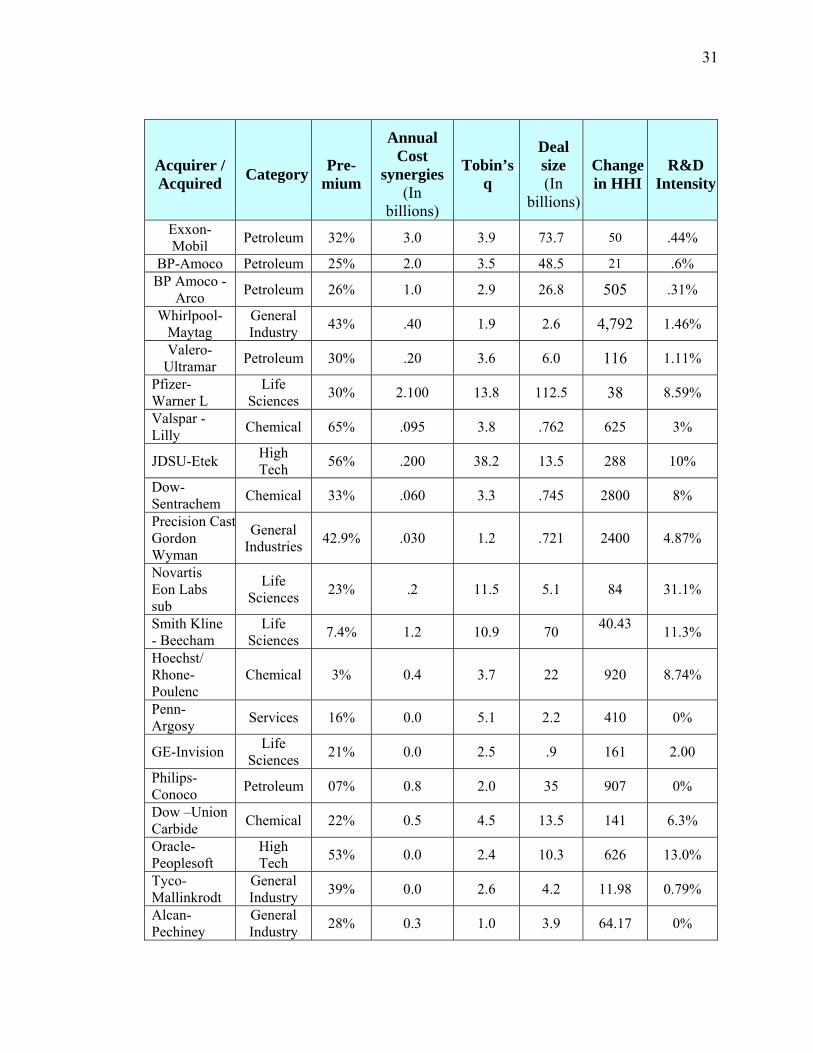
31
Acquirer / Acquired Category Pre-
mium
Annual Cost
synergies (In
billions)
Tobin’s q
Deal size (In
billions)
Change in HHI
R&D Intensity
Exxon-Mobil Petroleum 32% 3.0 3.9 73.7 50 .44%
BP-Amoco Petroleum 25% 2.0 3.5 48.5 21 .6% BP Amoco -
Arco Petroleum 26% 1.0 2.9 26.8 505 .31%
Whirlpool-Maytag
General Industry 43% .40 1.9 2.6 4,792 1.46%
Valero-Ultramar Petroleum 30% .20 3.6 6.0 116 1.11%
Pfizer-Warner L
Life Sciences 30% 2.100 13.8 112.5 38 8.59%
Valspar - Lilly Chemical 65% .095 3.8 .762 625 3%
JDSU-Etek High Tech 56% .200 38.2 13.5 288 10%
Dow-Sentrachem Chemical 33% .060 3.3 .745 2800 8%
Precision CastGordon Wyman
General Industries 42.9% .030 1.2 .721 2400 4.87%
Novartis Eon Labs sub
Life Sciences 23% .2 11.5 5.1 84 31.1%
Smith Kline - Beecham
Life Sciences 7.4% 1.2 10.9 70 40.43
11.3%
Hoechst/ Rhone-Poulenc
Chemical 3% 0.4 3.7 22 920 8.74%
Penn-Argosy Services 16% 0.0 5.1 2.2 410 0%
GE-Invision Life Sciences 21% 0.0 2.5 .9 161 2.00
Philips-Conoco Petroleum 07% 0.8 2.0 35 907 0%
Dow –Union Carbide Chemical 22% 0.5 4.5 13.5 141 6.3%
Oracle-Peoplesoft
High Tech 53% 0.0 2.4 10.3 626 13.0%
Tyco-Mallinkrodt
General Industry 39% 0.0 2.6 4.2 11.98 0.79%
Alcan-Pechiney
General Industry 28% 0.3 1.0 3.9 64.17 0%
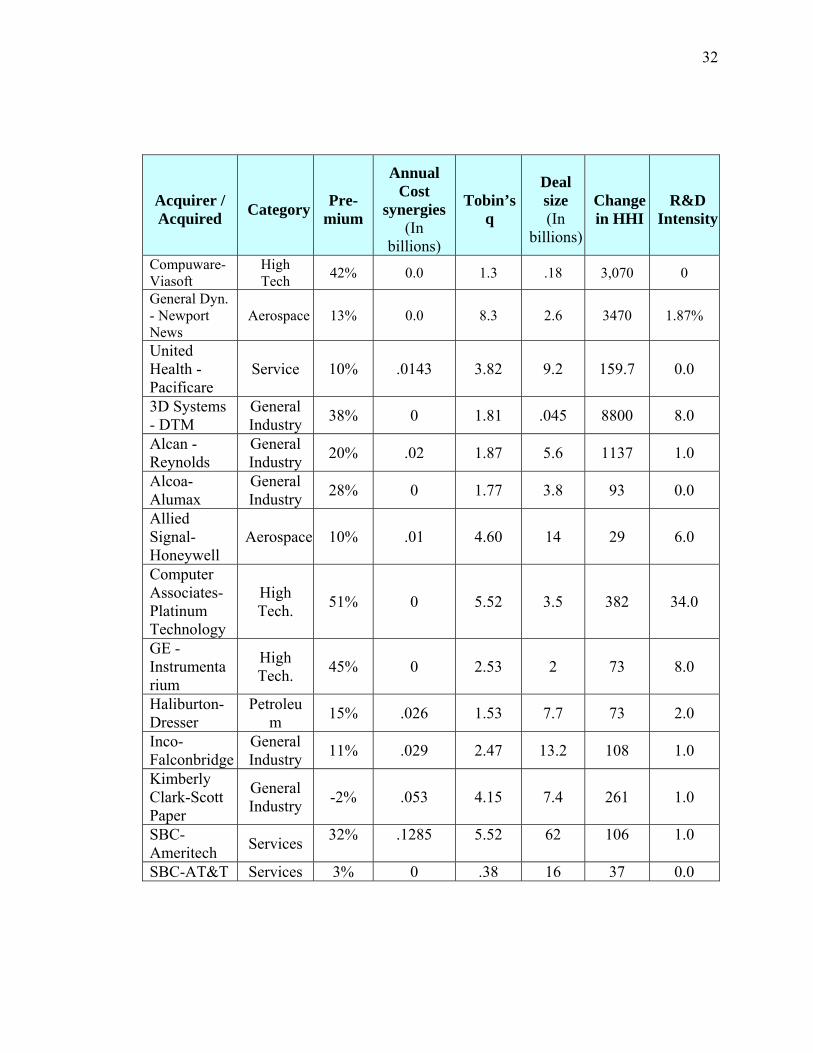
32
Acquirer / Acquired Category Pre-
mium
Annual Cost
synergies (In
billions)
Tobin’s q
Deal size (In
billions)
Change in HHI
R&D Intensity
Compuware-Viasoft
High Tech 42% 0.0 1.3 .18 3,070 0
General Dyn. - Newport News
Aerospace 13% 0.0 8.3 2.6 3470 1.87%
United Health - Pacificare
Service 10% .0143 3.82 9.2 159.7 0.0
3D Systems - DTM
General Industry 38% 0 1.81 .045 8800 8.0
Alcan - Reynolds
General Industry 20% .02 1.87 5.6 1137 1.0
Alcoa-Alumax
General Industry 28% 0 1.77 3.8 93 0.0
Allied Signal-Honeywell
Aerospace 10% .01 4.60 14 29 6.0
Computer Associates-Platinum Technology
High Tech. 51% 0 5.52 3.5 382 34.0
GE -Instrumentarium
High Tech. 45% 0 2.53 2 73 8.0
Haliburton-Dresser
Petroleum 15% .026 1.53 7.7 73 2.0
Inco-Falconbridge
General Industry 11% .029 2.47 13.2 108 1.0
Kimberly Clark-Scott Paper
General Industry -2% .053 4.15 7.4 261 1.0
SBC-Ameritech Services 32% .1285 5.52 62 106 1.0
SBC-AT&T Services 3% 0 .38 16 37 0.0

33
Acquirer / Acquired Category Pre-
mium
Annual Cost
synergies (In
billions)
Tobin’s q
Deal size (In
billions)
Change in HHI
R&D Intensity
Suiza-Broughton
Food and consumer 4% .113 3.4 .1 169 0.0
Case-New Holland
General Industry 39% 0 1.81 4.3 356 4.0
L’Orleal-Carson
General Industry 35% 0 .299 .1 3759 0.0
Monsanto-Dekalb Genetics
Chemical 22% 0 8.42 2.3 44 13.0
Food Lion-Hannaford Service 14% .025 5.15 3.6 300 0.0
Bell Atlantic-GTE
Service 4% .039 6.33 52.8 102 1.0
Georgia Pacific-fort James
General Industry 55% .070 6.43 11 836 1.0
Verizon-MCI Service 9% .18 1.74 8.5 48 0.2
Lafarge-Blue Circle
General Industry 21% .09 1.80 4.7 522 0.2
Worldcom-Intermedia Telecom 38% 0 9.53 6 68 1.1
Worldcom-Sprint Telecom 28% .0 7.34 129 48 0.0
Nestle-Dryers
Food and consumer 57% .11 7.3 2.4 914 0.0
Allied Waste-Browning Ferris
General Industry 23% .037 5.47 9.4 87 0.0
AT&T-TCI Telecom 22% .037 8.90 48 314 0.0 TRW-BDM
Aerospace/Automotive 31% .051 4.56 1 222 1.6

34
Acquirer / Acquired Category Pre-
mium
Annual Cost
synergies (In
billions)
Tobin’s q
Deal size (In
billions)
Change in HHI
R&D Intensity
Western Wireless-Alltel
Telecom 40% .18 16.77 6.2 222 0.0
Cingular Wireless-AT&T
Telecom 17% .056 1.22 41 239 0.0
ABB-Elsag Bailey
General Industry 58% .181 6.43 2.1 174 8.7
Ge-InVision
Life Sciences 21% .15 2.41
.9 162 7.4
Hospira-Mayne Pharma
Life Sciences 32% .025 7.57 2 153 7.1
Abbitti-Bowater
General Industry 24% .023 2.18 2.4 413 0.0
Barr-Pliva Life Sciences
50% .1 1.21 2.5 190 4.3
Monsanto – Pine Land chemical 20% 0 7.32 1.5 1930 2.8
Excelon-PJM Utility 16% .333 1.79 12.0 1086 0
Watson-Andrx
Life Sciences
32% .025 7.57 2.0 153 7.1
Marquee Holdings-LCE Holdings
Service
10%
.01 8.18 4.1 531 0.0
Linde-BOC Chemical 39% .04 2.55 14.4 157.75 1.6 Federal Mogul-T&N
General Industry
65% - -3.23 2.4 1508 2.4
McClatchy-Knight Ridder
General Industry 4% .007 5.52 6.5 306 0.0
Clear Channel-AMFM
Service 27% .004 3.31 23.8 447 0.0

35
Acquirer / Acquired Category Pre-
mium
Annual Cost
synergies (In
billions)
Tobin’s q
Deal size (In
billions)
Change in HHI
R&D Intensity
Quest - Unilab
Health care 26.7% 005 27.3 .87 107 0.0
CBS-American Radio
Service 19.9% 0 3.36 1.6 890 0.0
Cardinal - Bergen
Health care 46.8% 0 2.63 2.5 802 0.0
McKeeson-Amerisource
Health care 18.5% 0 135.7 2.25 629 0.0
Northwest-Continental Service 23.6% 0 6.65 7.4 96 0.0
GE-Innoserve
Health care 26.5% .02 2.36 .016 1912 0.0
Commscope - Andrew Service 17.6% 0 1.44 2.6 322 5.2
Capital-Triathlon Service 14.8% .178 2.8 0.19 152 0.0
AT&T - Dobson Telecom 16% 0 7.18 2.8 30.6 0.0
American Radio –EZ Systems
Telecom 66.4% .0068 5.36 0.66 158 0.0
Thermo Electron-Fisher Scientific
Life Sciences 11.9% .0138 2.5 12.8 5.25 0.9
Ricket & Coleman-Benkiser
General Industry 20.5% .038 15.45 2.7 30.6 0.7
Provident-Unum Service 22% 0 2.62 11.43 218 0.0
Medtronic - Avecor
Life Sciences 53.5% 0 1.53 .106 202 8.3
Medtronic – Physio Control
Life Sciences 21% .155 7.48 .53 130 12.0

36
Acquirer / Acquired Category Pre-
mium
Annual Cost
synergies (In
billions)
Tobin’s q
Deal size (In
billions)
Change in HHI
R&D Intensity
El Paso - Sonat Service 36% 0 28.7 6 65 0.0
CSC - Mynd
High Tech 54% .06 .816 .568 398 0.0
Agrium - UAP Chemical 27% .04 11.4 2.65 90 0.0

37
APPENDIX B
2nd REQUEST DEALS – NON CHALLENGED MERGERS – ANALYSIS OF
PREMIUMS
Acquirer / Acquired
Relevant Category
Pre-mium
Cost Synergies (Annual)
(In billions)
Tobin’s q
Deal size (In
billions)
R&D of Acquired
Company / Sales
Anthem Wellpoint Healthcare 35% .239 3.02 14.2 0%
Sprint Nextel Telecom 4.5% .07 5.82 36 .1%
Boeing – McDonnell Douglas
Aerospace/ Automotive 13% .075 3.57 13.3 2.7%
Daimler Benz - Chrysler
Aerospace/ Automotive 48% .05 3.6 40 3.8%
Phelps Dodge - Inco
General Industry 23% .02 2.96 41 2.0%
Tyco-Keystone
General Industry 52% 0 1.28 1.2 0.0%
Perkin Elmer – Bio-Perspective
Life Science 17% 0 3.82 0.4 16.0%
J&J Alza Life Science 39% 0 7.17 21 6.1
Valero - premcor Petroleum 23% .044 8.6 8 .9%
Whirlpool - maytag Industrial 43% .219 1.33 2.6 1.5%
Arch wireless- Metrocall Telecom 5% .165 1.53 .3 0%
Worldcom MCI Telecom 21% .032 3.4 44 0%
Monsanto-DeKlab Chemical 41.5% 0 4.88 2.3 13%

38
Acquirer / Acquired Category Pre-
mium
Cost Synergies (Annual)
(In billions)
Tobin’s q
Deal size (In
billions)
R&D of Acquired
Company / Sales
Intelsat - Panamsat Service 23% .04 20.0 3.2 0%
Ebay - Paypal Service -11% 0 1.21 1.5 0%
Yellow - Roadway
General Industry 60% .18 10.64 1.1 0%

39
REFERENCES
Acs, Zoltan and Audretsch, David, “Innovation, Market Structure, and Firm Size,” Review of Statistics and Economics, November 1987.
Ben Zion, Uri, “The R&D and Investment Decision and its relationship to the Firm’s Market Value: Some Preliminary Results”, Chapter 15 of R&D, Patents, and Productivity, by Zvi Griliches, University of Chicago Press, 1984.
Cohen, Wesley, Levin, Richard, Mowery, David, “Firm Size and R&D Intensity, A Re examination,” NBER Working Paper 2205, April 1987.
Chauvin, Keith, Hirschey, Mark, “Advertising, R&D expenditures and the market value of the firm - Mergers and Acquisitions,” Financial Management, winter of 1993
Cleary, George, “Efficiencies in Merger Analysis: From Both Sides Now Testimony from the Anti trust Modernization Committee,” November 17, 2005.
Connelly, Robert and Hirschey, Mark, “R&D, Market Structure, and Profits: A value-based Approach”, The Review of Economics and Statistics, Vol 66, No 4, Nov. 1984, pp. 682-686.
“Dynamic Efficiencies in Merger Analysis” http://www.oecd.org/dataoecd/53/22/40623561.pdf, 2007.
Hall, Bronwyn, “Stock Market’s Valuation of R&D Investment During the 1980s,” the American Economic Review, Vol. 83, May 1993.
Hall, Bronwyn, “Mergers & R&D Revisited,” Prepared for the Quasi Experimental Methods Symposium, Econometrics Laboratory, US Berkeley, July 30 1999.
Higgins, Mathew and Rodriguez, Daniel, “The Outsourcing of R&D through Acquisitions,” Journal of Financial Economics, Vol 80, Issue 2, May 2006, pp 351-383.
Ho, Yew Kee, Key, H.T., Ong, Jin Mei, “The effects of R&D and advertising on firm value; an examination of manufacturing and non-manufacturing firms”, Engineering Management, IEEE Transaction, Vol. 52, Issue 1, Feb. 2005.
Jaffe, A. “Technological Opportunity and Spillovers of R&D: Evidence from Firms’ Patents, Profits, and Market Value.” American Economic Review, Vol. 76 (1986), pp. 984-1001.
Johnson, Lewis and Pazderka, Bohumir, “Firm Value and Investment in R&D,” Managerial and Decision Economics, Vol.14, 1993 pp. 15-24.
Lev, Baruch and Sougiannis, Theodore, “The Capitalization, Amortization, and Value-relevance of R&D”, in Intangible Assets by Baruch Lev and John Hand, Oxford University Press, 2003.
Montgomery, Cynthia, “Product-Market Diversification and Market Power”, The Journal of Economic Perspectives, Vol. 8, No. 3 (Summer, 1994), pp. 163-178
Pautler, Paul, “Evidence on Mergers and Acquisitions,” FTC website Working Papers, September 25, 2001.
40
Slusky, Alexander & Caves, “Synergy, Agency, and Determinants of Premia Paid in Mergers”, Journal of Industrial Economics, Vol. 39, No.3, March 1991.
Stout, Lynn, “Are Takeover Premiums Really Premiums? Market Price, Fair Value, and Corporate Law”, The Yale Law Journal, Vol 99, Nov 6, pp 1235-1296, April 1990.
Syrneonidis, George, “Innovation, Firm Size and Market Structure: Schumpeterian Hypothesis and Some New Themes,” OECD Economic Studies, No.27 1996/II.
Wright, Joshua, “Antitrust, Multi-Dimensional Competition and Innovation: Do We Have an Antitrust-Relevant Theory of Competition Now?” Conference paper, The Regulation of Innovation and Economic Growth. May 4, 2007.

41
Tables and Figures
For
The Stock Market’s Valuation of R&D and Market Concentration in
Horizontal Mergers

42
Table 1: Breakdown of 2nd Requests and Merger Challenges
Type DOJ FTC Total
Merger Challenges 232 208 440
2nd Requests 400 342 742

43
Table 2: Variable Description
Variable (s) Symbol Description Purpose
Deal Premium DPi
DP = (Sm*(1-%∆S&P )–MV) MV
S = deal value at time of merger announcement MV = market value 30 days prior to the merger
Shows the additional amount the acquirer will pay for the acquisition
above market price
Deal size Sm Purchase price of target firm Variable to calculate
market value and create an interaction term with R&D
Average R&D intensity Ri
R&D as a percent of sales of the acquisition candidate for recent
year prior to merger
A measure of the knowledge potential of the
firm
Weighted Average Change in Herfindahl Index
∆HHIm
Change in HHI multiplied by the percentage of the challenged
product revenue by total company sales
Shows the increase in market concentration from
the merger.
Profit margin PMi Average of target firm’s profit margin for previous two years
Measure of ability to price above marginal costs and
earn abnormal profits
Tobin’s q qi Market value divided by the stockholder’s equity of the
acquisition candidate.
A measure of intrinsic value or the value of the
company to the market. It is often viewed as a
measure of managerial performance.
Cost Synergy divided by Market Value
COSTi
Claimed annual merger specific cost synergies. This variable is
normalized by dividing by market value
Shows the expected efficiencies from the
horizontal merger
Economic Growth GRt+1 Annual GDP growth one year after
the deal is announced
Measure of expected economic growth, which is
used to determine if premiums vary with
economic growth

44
Table 3: Breakout of Mergers by Industry
Industry Primary NAICS Code (s)
Frequency - Challenged Mergers
Frequency - Total Mergers
Petroleum 324110 7 8 General Manufacturing21
Various 10 15
Life sciences 325411, 22 24 Food and consumer 311111, 325611 6 6 High tech 334111, 334611 6 6 Mining, metals, and minerals
33111, 212111 4 5
Chemical processing 325110, 5 6 Aerospace / Defense 336411, 5 6 Telecommunications 517110 14 18 Health care 524111 10 10 Other services22
Various 5 8 Total 95 112
21 General manufacturing includes automotive, appliances, paints, and building products. 22 Other services include movie theaters, gaming, airlines, newspapers, financial processing,
supermarkets, and utilities.

45
Table 4: Average Merger Premiums by Industry
Industry
Average Merger
Premiums - All Mergers
Average Merger Premiums - Challenged
Mergers
Average Merger Premiums -
Non Challenged Mergers
Petroleum 27% 27% 23% General manufacturing 50% 50% 48% Life sciences 31% 30% 49% Food and consumer 40% 40% - High tech 89% 89% - Mining, metals, and minerals 28% 29% 25%
Chemical processing 31% 33% 22% Aerospace / Defense 35% 37% 22% Telecommunications 28% 32% 18% Health care 21% 21% - Other services 22% 27% 23% Average 34% 35% 32%
46
Table 5: Premiums, R&D Intensity and Market Concentration among Challenged Mergers23
Industry
Average Merger Premiums - Challenged
Mergers
Average Deal Size
in Billions
Average R&D intensity
Average Weighted
Change in HHI
Petroleum 27% $27.2 0.8% 170 General manufacturing 50% $7.0 1.8% 349
Life sciences 30% $14.9 12.1% 250 Food and consumer 40% $12.1 1.8% 188 High tech 89% $4.7 14.4% 778 Mining, metals, and minerals 29% $13.5 0.9% 200
Chemical processing 33% $4.3 5.9% 532 Aerospace / Defense 37% $7.2 2.7% 550 Telecommunications 32% $26.8 0.8% 265 Health care 21% $5.8 0.0% 239 Other services 27% $5.9 0.0% 312 Average 35% $13.4 4.4% 317
23 Only challenged mergers are included in this table, because data is not available for weighted
change in HHI for the non-challenged merger.

47
Table 6: Average Deal Premiums versus Change in HHI by R&D Class
-0.2
0
0.2
0.4
0.6
0.8
1
1.2
<50 50-100 100-200 200-300 300-500 500-700
Dea
l Pre
miu
m
Change in HHI
R&D intensity >10%R&D of 5% to 10%
R&D of 0% to 5%
Table 7: Change in HHI and R&D-Intensity Classes
Category Weighted Change in HHI
R&D-Intensity
Low 0 - 50 0% - 5%
Mid 51 - 250 5% - 10%
High >250 >10%
48
Table 8: Base and Interactive Model Results (t statistics in parenthesis)
Base Models Interactive Models
Log Deal Premium
(Challenged Mergers)
(Challenged
Mergers without
change in HHI)
(All Mergers) (Challenged
Mergers)
(Challenged Mergers without
change in HHI)
(All Mergers)
Log R&D .10** (2.01)
.08 (1.53)
.05 (.86)
.11 (.47)
.15** (2.26)
.10 (1.36)
Log ∆HHI .15*** (2.90) - - .15**
(2.43) - -
Log Cost Synergy
0.07* (1.70)
0.08** (2.08)
0.09** (2.17)
0.07 (1.62)
.08** (1.98)
0.08** (2.12)
Log Deal Size
-.01 (-.08)
-.04 (-.92)
-.04 (-.89)
.02 (.50)
-.01 (-.04)
-.02 (-.34)
Average Profit
Margin
-.001 (-.03)
-.001 (-.29)
-.004 (-.53)
-.01 (.46)
-.01 (-.59)
-.01 (-.56)
Growth (t+1)
-.07 (-1.51)
-.10** (-2.00)
-.10* (-1.80)
-.08* (-1.68)
-.11** (-2.19)
-.10* (-1.92)
Log Tobin’s q
-.02 (-.28)
.02 (.28)
.03 (.39)
-.01 (-.10)
.03 (.43)
.03 (.47)
Challenge .15 (.67)
.15 (.66)
Log Size * log R&D
- - - -.03
(-1.47) -.04*
(-1.88) -.03
(-.89)
Log R&D * log ∆HHI
- - - .01
(.29) - -
Constant -1.62*** (-4.28)
-.74*** (-3.84)
-.88*** (-2.89)
-1.72*** (-3.73)
-.80*** (-3.98)
-.79*** (-3.84)
R2 .21 .14 .12 .23 .16 .13
N 95 95 112 95 95 112
Legend: * P <.1; ** P <.05; *** P <.01
49
Table 9: Regression Results –Industry Effects (t statistics)
Log Deal Premium Industry Model Industry and Base Model All Mergers
Petroleum .9 (.84)
.38 (1.37)
.37 (1.39)
General Manufacturing
.76*** (3.05)
.65** (2.13)
.84*** (3.01)
Life sciences .31 (1.59)
.72 (.10)
.06 (.23)
Food and Consumer .61** (2.08)
.45 (1.45)
.48 (1.59)
High tech 1.36*** (4.92)
.72* (1.84)
.99** (2.79)
Mining .29 (1.31)
.31 (1.25)
.41* (1.65)
Chemical .64** (2.45)
.24 (.93)
.36 (1.58)
Aerospace .35* (1.78)
.27 (1.01)
.36* (1.68)
Telecommunications .18 (.73)
.31 (1.15)
.24 (.96)
Health Care .43* (1.65)
.21 (.88)
.33 (1.16)
Services -.06 (-.32)
-.09 (-.38)
-.01 (-.06)
Log R&D - .13* (1.70)
.07 (.82)
Log HHI - .11* (1.92) -
Growth (t+1) -.05 (-.94)
-.06 (-1.14)
Average Profit Margin - -.01
(-.33) -.01
(-.75)
Log Deal Size - .01 (-.28)
-.03 (-.54)
Challenge - - .21 (.99)
Constant -1.65*** (-9.87)
-1.84*** (-3.98)
-1.53*** (-3.92)
R2 .22 .33 .28

50
N 95 95 112
Table 10: Average Deal Premiums by Market Concentration and R&D Segments
Weighted Change in HHI
R&D <5% (Low)
R&D 5% - 10%(Mid)
R&D > 10% (High)
Total
0-50 (Low) 18% 15% 23% 19%
51-250 (Mid) 37% 35% 73% 39%
> 250 (High) 33% 43% 44% 37%
Total 33% 35% 44% 35%

51
Table 11: Regression Results – Fixed and Combination Segments (t statistics in parenthesis)
Log Deal Premium Fixed Segment Model
Combination Segment Model
Log R&D .26*** (2.93)
.08 (.83)
Log ∆HHI .29** (2.38)
.16*** (2.80)
Log Cost Synergy .04 (1.24)
.07* (1.66)
Log Deal Size -.01 (-.01)
.01 (.27)
Average Profit Margin -.01 (-.54)
-.01 (-.38)
Growth (t+1) -.09*** (-1.99)
-.26*** (-2.50)
Log Tobin’s q -.05 (-.86)
-.02 (-.31)
Low R&D (<5% ) .42 (1.50) -
Mid R&D (5% - 10%) -.09 (-.42) -
Low ∆HHI (<100) .34 (.74) -
Mid ∆HHI (100-250) .48** (2.09) -
Mid ∆HHI (100-250)* log R&D - .25***
(2.34)
High ∆HHI (>250)* log ∆ R&D - .18
(1.62)
Mid R&D (5% - 10%) * log ∆HHI - -.10***
(-2.48)
High R&D (>10%) * log ∆HHI - -.09*
(-1.85)
Constant -2.90*** (-3.61)
-1.60*** (-3.86)
R2 .32 .28
N 95 95