the stock screening process featuring the shareholder ... · the stock screening process featuring...
TRANSCRIPT

1/9/2016
The Stock Screening ProcessFeaturing the Shareholder Yield Screen
AAII-San Diego 1
Legal Disclaimer And Risk Disclosure
1/9/2016
These materials are for educational and entertainment purposes only and areneither a solicitation, nor an offer to buy or sell any financial instrument. Allinformation provided here is the personal opinion of the authors. Theauthors, AAII, AAII-Silicon Valley, AAII-SV-CI-MI Group leaders andmembers, make no claim that the information in any of these presentations iscorrect. Under no circumstances should any of the information in thesepresentations be taken as personal or individual trading advice. Pastperformance and/or hypothetical results of any trading method are notindicative of future results. Trading and investing in any financial instrumentcarries high levels of risk and may not be suitable for all investors. Youshould be aware of all the risks associated with trading, and seek advice froma financial professional, if you have any doubts. The authors, AAII, AAII-Silicon Valley, AAII-SV-CI-MI Group leaders and members, will not assumeany responsibility whatsoever for the actions of the reader nor financial lossesthat may result from the use or misuse of the information presented.
2AAII-San Diego

1/9/2016
Agenda
• Introductory Comments• The Shareholder Yield
Screen• Volatility & Drawdown
Control• “Implementation Details”• Session Takeaways• Q&A• Extra “Stuff” (i.e., screens…)• References
AAII-San Diego 3

1/9/2016 AAII-San Diego
Introductory Comments • Which stock screener is used??
– Stock Investor Pro (SIPro),Portfolio123 (P123) are ones I use
– Can build this screen in StockInvestor Pro (I have!)
– Many free screeners out there (beaware of data issues)
• Do you need to have a back-testing tool?– No, unless you want to do analysis
similar to what you’ll see here– If you want to do back-testing I use
P123. (There are some free back-testing tools out there – be aware ofdata issues)
4

1/9/2016 AAII-San Diego
Introductory Comments• What other tools do I need??
– An Excel-like spreadsheet is handy –especially if you want to implement thevolatility control items we’ll be talking about
– Feel free to write code if so inclined…• How much time does this take??
– Analysis can take considerable time (I like thispart so I’m OK with spending the time)
– Implementation should be a small amount oftime. You have some control over this -- we’lltalk more about this later…
• Should I do more with the screen results?– AAII recommends further analysis – If you plan to do more analysis you can double
the number of stocks in the screen (e.g., 50instead of 25) and focus on picking the top 25
– If you do take “raw” screen results do sanitychecking for acquisitions, sudden price divesor spikes, etc.
5

1/9/2016 AAII-San Diego
Introductory Comments• What’s the plan from here??
– Screen: Will cover the shareholderyield screen, back-test results /performance statistics, current stocks
– Volatility Control: Will describemethods and provide some tools toaddress this
– Implementation: Methods and toolsto implement the screen – and thebrokerages used for buyingbaskets/motifs/folios
• There are additional screens in theExtra “Stuff” area– OSV, Tiny Titans, Sector Dogs– Not part of formal presentation --
feel free to email me for Q&A
6

1/9/2016
The Shareholder Yield Screen
AAII-San Diego 7

• Based on AAII-SV event in May 2013 byMeb Faber on his book Shareholder Yield– Free e-book at Amazon for the next few days
• Key points– SY = DY + BBY + PDY
• Shareholder Yield = Dividend Yield +BuyBack Yield + PayDown Yield
– BuyBack Yield: Net share buybacks (measuredover the last year)
– PayDown Yield: Net pay down of debt (Totaldebt reduction over the last year)
– All 3 terms are the real return to shareholders– SY has done well over time – see next slide– Compare SYLD ETF to PKW, PFM ETFs
• For foreign stocks see the FYLD ETF
Shareholder Yield
1/9/2016 AAII-San Diego 8

Shareholder Yield
1/9/2016 AAII-San Diego
• Back-test takestop 25% ofS&P500 stocksyearly (by eachmeasure)
• Market cap-weights usedwithin eachstrategy
9

Shareholder Yield
1/9/2016 AAII-San Diego 10

• Terms: (some, not all)– Setvar = “set variable”; frank = “rank on ShrHldrYld descending order”– DbtTotPYQ = “Total Debt Previous Year Quarter”; – SharesFDPYQ = “Common Shares Fully Diluted Previous Year Quarter”
Shareholder Yield at Portfolio123
1/9/2016 AAII-San Diego 11

Shareholder Yield (V3.1): Current Stocks
1/9/2016 AAII-San Diego 12

Shareholder Yield (V3.1): Back-Test
1/9/2016 AAII-San Diego 13

• How does this screencompare to the SYLD ETF??– Can’t compare directly –
limited history for SYLD ETF– Can back test a 100 stock
version of this alg to get anidea of what the performance“might have been”
– Real SYLD ETF performancewill vary (of course)
– Walk-in expectation is forlower ETF performance due tolarger number of stocks held
– Let’s see…
Shareholder Yield V3.1 vs. “SYLD ETF”
1/9/2016 AAII-San Diego 14

Shareholder Yield V3.1 vs. “SYLD ETF”
1/9/2016 AAII-San Diego 15

1/9/2016 AAII-San Diego
Shareholder Yield V3.1 vs. “SYLD ETF”
16

• S&P500, equal weight, re-balanced annuallyis a pretty good “screen” (buy RSP instead?)
• SYLD V3.1 screen is very good compared toour benchmarks – Good CAGR and Sharpe, significantly higher
MDD and Std Dev– Beta and R-squared are low, alpha high
• SYLD – which buys 100 stocks – willprobably have somewhat worse performance– Time and effort for screening pays off
Shareholder Yield (V3.1) Take-Aways
1/9/2016 AAII-San Diego 17

1/9/2016
Volatility & Drawdown Control
AAII-San Diego
• Volatility and Drawdown• S&P500 History Lessons• Buy & Hold• Timing• Direct Volatility Control
18

Volatility and Drawdown
1/9/2016 AAII-San Diego
• We all like the gains from the stock screens –but we hate losing money even more!
• Behavioral finance has a lot to sayabout this part of investing
• While standard deviation is one measure ofvolatility, drawdown is what drives people tosell
• A quick review of DrawDown (DD)and Max DD (MDD) follows
• There are other measures of risk – but DD,MDD and SD are good general indicators
• Other risk measures include VaR,CVaR, Ulcer Index, etc.
19

1/9/2016 AAII-San Diego
Drawdown Illustration
Drawdown 1(MaxDD)
Drawdown 2
EquityCurve
Draw-DownCurve
with permission, Michael Begley, informal notes
20

S&P 500 History Lessons (Market Weighted)
1/9/2016 AAII-San Diego
• Let’s look at each year from ‘99 onand see the market statistics
• Gain: 4.7% (average) but rangedfrom -38% to +29%
• MDD has averaged -17% but was asbad as -48%
• Std Deviation (SD) averaged 14%but ranged from 5.1% to 23.5%
21

S&P 500 History Lessons (Equal Weighted)
1/9/2016 AAII-San Diego
• Let’s look at each year from ‘99 onand see the market statistics
• Gain: 8.6% (average) but rangedfrom -41% to +43%
• MDD has averaged -18% but was asbad as -53%
• Std Deviation (SD) averaged 15.6%but ranged from 6.8% to 28.6%
22

• Buy & Hold has historicallyworked well in the US overthe long term– Long term: 10+ years –longer if
inflation adjusted– Secular bear markets average
around 17 years
• The biggest problem withB&H is that people don’t doit! (i.e., Hold)– People sell at the bottom due to
drawdowns, fear, pain of lossestaken, etc.
Buy & Hold
1/9/2016 AAII-San Diego 23

• Diversification and assetallocation can help reducevolatility and DD– Should be part of your overall plan
• Know your (S&P500) history –let it help set your expectations
• Ignore CNBC, Cramer, TV,articles, blogs, etc. – they’re alljust noise
• Only make planned, periodicaccount changes – Re-balancing, rotating portfolio,
asset allocation changes due tochanged circumstances, etc.
Buy & Hold: Follow the Plan
1/9/2016 AAII-San Diego 24

Timing
1/9/2016 AAII-San Diego
• One way to control volatility and DD is to“Time the Market”
• Many believe this is a fool’s errand• Of course funds that do “Quantitative”
“Tactical” or “Dynamic AssetAllocation” aren’t timing the market
• Two simple timing systems are presented• 210d/10M SMA on the SPY or on the
SYLD screen. • Above the 10M SMA stay in the
market; below go to cash• The system is implemented at the end-
of-month to reduce “noise” trades• For those interested, the spreadsheet
with the data is available
25

Timing
1/9/2016 AAII-San Diego 26

Direct Volatility Control
1/9/2016 AAII-San Diego
• Much of this approach comes from articles byDarwin Investments
• To address volatility and DD, directly measurevolatility and – when the market becomes “toovolatile” – reduce volatility by adding cash
• Our chosen target volatility is a 1% daily SD on atrailing 63 day basis
• If the SD is above 1% --- add cash toreduce volatility down to 1% SD
• Implement the volatility check at the end of themonth
• Note you never completely exit the market withthis approach
27

Volatility Control: Continuous and Stepwise
1/9/2016 AAII-San Diego 28

1/9/2016 AAII-San Diego 29

• B&H can be effective – but you need discipline• Simple timing systems have been effective
BUT they can be frustrating in bull markets– They also require discipline to follow– You can almost read the SMA values, and make
timing decisions, from a chart of the SPY
• Simple volatility control also works well– Will need a spreadsheet to implement this system
Volatility and Drawdown Take-Aways
1/9/2016 AAII-San Diego 30

1/9/2016
Implementation Details
AAII-San Diego
• Running the Screen• Doing the Trades
31

Running the Screen
1/9/2016 AAII-San Diego
• SYLD screen shown is run annually • For a “Buy and Hold” Strategy…
• Run near the screen’s anniversary date –1 day’s work per year!!
• In taxable accounts, sell dates are offsetto minimize taxes (long vs. short termgains). Over time this may get messy…
• For timing and/or volatility control…• When re-entering the market, buy the
same stocks – no need to run the screen!• Edge case: If you’re 11 months into the
year, re-run the screen with intention tokeep stocks for 12 months (saves a trade)
• In taxable accounts watch for wash sales– may need to adjust buy date
32

Running the Screen
1/9/2016 AAII-San Diego
• For partial cash positions…• This may be needed for some timing and
volatility adjustment schemes• The back-test assumes an equal percentage
of $$$ taken from each stock – i.e., sellsome of each stock – which increases thetrade count
• All screens should be easily implemented in SIPro,P123 and many free screeners
• Again, some free screeners may have “dataquality” issues
• Hesitant?? Start off small.• Commissions insignificant as you scale up
33

Doing the Trades: Problems and Solutions
1/9/2016 AAII-San Diego
• A major objection to screening is theamount, and costs, of trading
• One 25-stock screen rotatedannually results in 50 trades/year
• Assume 1 timing-event per yearand you’re up to 100 trades/year
• Monthly volatility adjustments canadd another 100-200 trades/year
• High costs in terms of time and $$$• Ways to address this problem
• Find a lower-cost brokerage,negotiate fees with broker
• Wrap accounts• Brokerages aimed at this market
segment (next slide…)
34

Doing the Trades: Folio Investing
1/9/2016 AAII-San Diego 35

Doing the Trades: 9ge0990
1/9/2016 AAII-San Diego 36

• Once a screen is developed, the time to runand implement it is not large
• If you do timing or volatility control thespreadsheet to automate this is not complex(you have access to an example….)
• Depending on your strategy you may do alot of trading – so cost will be an issue
• There are brokerages that minimize thecosts – both time and money -- for this sortof trading
Implementation Take-Aways
1/9/2016 AAII-San Diego 37

1/9/2016
Session Take-Aways
AAII-San Diego 38

• Covered some questions about howstock screen folios might fit into yourinvestment plans
• Presented a screen that is worth yourtime and trouble to pursue– Can also use SYLD and FYLD if the
screening isn’t a good “fit” for you– More screens in the “Extra Stuff” section
• Showed the importance of comparingresults to various benchmarks anduniverses
Session Take-Aways
1/9/2016 AAII-San Diego 39

• Looked at Buy & Hold and simple timingand volatility control schemes – Pick the approach you are most comfortable
with – or you won’t stick with it
• Reviewed some of the items needed toimplement these screens
• Provided pointers to a few brokeragesthat work well with this style of investing
• Now it’s up to YOU to take the next step– And remember it can be a small one…
Thanks much!!
Session Take-Aways
1/9/2016 AAII-San Diego 40

1/9/2016 AAII-San Diego 41

1/9/2016 AAII-San Diego 42
A Few More Topics(If Time Permits…)

1/9/2016
The Shareholder Yield Screen
AAII-San Diego 43

• While the S&P500 is a usefulbenchmark comparison we will lookinto two others as well
• #1: S&P500 stocks, equal weighted,rebalanced annually. – This captures the small cap, low price and
value effects
• #2: Sets of 25 stocks randomly pickedfrom the S&P500 annually. – Create 2,000 of these random sets– Do some statistical tests to see how well
the screen is doing
Shareholder Yield V3: S&P500 Fair Comparison
1/9/2016 AAII-San Diego 44

Shareholder Yield (V3) vs. SP500 Equal Weight
1/9/2016 AAII-San Diego 45

Shareholder Yield (V3) vs. SP500 Equal Weight
1/9/2016 AAII-San Diego 46

Shareholder Yield (V3) vs. Random 25
1/9/2016 AAII-San Diego 47

Shareholder Yield (V3) vs. Random 25
1/9/2016 AAII-San Diego
Shareholder Yield V3: 13.2% CAGR +3 SD, 99.9%
Annualized Return
8.2%6.6%5.0% 9.9% 11.5% 13.1%
Note: Stats above generated on Fall ‘13 – slight differences with performance metrics updated through 4/29/14
48

1/9/2016
Volatility and Drawdown Control
AAII-San Diego
• S&P500 History Lessons
49

S&P 500 History Lessons: Four Bad Bears
1/9/2016 AAII-San Diego 50

S&P 500 History Lessons: Secular Bear Markets
1/9/2016 AAII-San Diego 51

1/9/2016
Shareholder Yield: More “Fun with Volatility”
AAII-San Diego 52

1/9/2016
The 40/60 SYLD/VUSTX Mix• So far we’ve looked at lowering
volatility by adding cash• What happens if we mix SYLD
with a negatively correlated asset– e.g., LT bonds – instead??
• The following slides show resultsfrom different approaches:– A constant mix of 40/60
SYLD/VUSTX– Using a 40/60 mix only when a
timing signal occurs
• Why VUSTX?? Has a longenough history for back-testing– Would use TLT in practice
AAII-San Diego 53

1/9/2016
The 40/60 SYLD/VUSTX Mix• So far we’ve looked at lowering
volatility by adding cash• What happens if we mix a
negatively correlated asset – e.g.,LT bonds – instead??
• The following slides show resultsfrom different approaches:– A constant mix of 40/60
SYLD/VUSTX– Using a 40/60 mix only when a
timing signal occurs
• Why VUSTX?? Has a longenough history for back-testing– Would use TLT in practice
AAII-San Diego 54

1/9/2016
The 40/60 SYLD/VUSTX Mix• So far we’ve looked at lowering
volatility by adding cash• What happens if we mix a
negatively correlated asset – e.g.,LT bonds – instead??
• The following slides show resultsfrom different approaches:– A constant mix of 40/60
SYLD/VUSTX– Using a 40/60 mix only when a
timing signal occurs
• Why VUSTX?? Has a longenough history for back-testing– Would use TLT in practice
AAII-San Diego 55

1/9/2016
The Max Sharpe & Min Var Mixes• Another approach is to
dynamically (monthly) optimizeSYLD/VUSTX weights
• Max Sharpe optimizes weights toget the best Sharpe ratio
• Min Var optimizes weights to getthe lowest volatility (variance)
• A trailing 60 trading day windowis used for all calculations
• Weights are adjusted in 10%increments for SYLD & VUSTX– For example: 0/100, 10/90, 20/80/,
…. 80/20, 90/10, 100/0
AAII-San Diego 56

1/9/2016
The 40/60 SYLD/VUSTX Mix• So far we’ve looked at lowering
volatility by adding cash• What happens if we mix a
negatively correlated asset – e.g.,LT bonds – instead??
• The following slides show resultsfrom different approaches:– A constant mix of 40/60
SYLD/VUSTX– Using a 40/60 mix only when a
timing signal occurs
• Why VUSTX?? Has a longenough history for back-testing– Would use TLT in practice
AAII-San Diego 57

• Mixing negatively correlated assets helpsreduce volatility with reasonable returns
• Pick the alg based on your risk/rewardtolerance and trading activity level
• Can mix algs – e.g., Max Sharpe & Min Var –to get the risk reward curve that fits your needs
More “Fun with Volatility” Take-Aways
1/9/2016 AAII-San Diego 58

1/9/2016
Extra “Stuff”: Even More Screens!
AAII-San Diego
• Sector Dogs• Tiny Titans• The Other Side of
Value
59

Sector Dog ETF
1/9/2016 AAII-San Diego 60

Sector Dog ETF
1/9/2016 AAII-San Diego 61

• SDOGX is a pure dividend yieldstrategy equally weighted acrossall S&P sectors
• Would a “Shareholder YieldSector Dog” approach workbetter?– Would find the top 5 stocks in each
S&P sector by SYLD and not DY
• The results of the back testing thisscheme are shown on thefollowing slides…
Sector SYLD Dog??
1/9/2016 AAII-San Diego 62

• Terms: (some, not all)– forder: orders all stocks in each SECTOR and takes the top 5
Sector SYLD Dog
1/9/2016 AAII-San Diego 63

Sector SYLD Dog: Current Stocks
1/9/2016 AAII-San Diego 64

Sector SYLD Dog: Current Stocks
1/9/2016 AAII-San Diego 65

Sector SYLD Dog: Back-Test
1/9/2016 AAII-San Diego 66

Sector SYLD Dog vs. Random 25
1/9/2016 AAII-San Diego
Annualized Return
8.2%6.6%5.0% 9.9% 11.5%
Sector SYLD Dog: 11.5% CAGR +2 SD, ~97%
13.1%
67

• The SYLD Dog screen does well comparedto our two benchmarks – Good CAGR and Sharpe, significantly higher
MDD and Std Dev– Note that SYLD Dog has lower SD than SYLD –
overall the same Sharpe ratio
• SYLD Dog beats SDOGX ETF by ~1.4%over the back-test period– Ran a dividend yield screen (not shown) – DY
screen at the 87th percentile (1+ SD)– Shareholder Yield beats Dividend Yield
Sector SYLD Dog Take-Aways
1/9/2016 AAII-San Diego 68

Dogs of the Dow AAII Screen
1/9/2016 AAII-San Diego
Why does this fail?? Probably has too small a universe to choose from…
69

1/9/2016
Extra “Stuff”: Even More Screens!
AAII-San Diego
• Sector Dogs• Tiny Titans• The Other Side of
Value
70

1/9/2016
Tiny Titans: Background• Tiny Titans ranks highly in the all-
time winners of AAII screens– Great performance– A very simple screen, easily
understandable– http://www.aaii.com/stock-
screens/screendata/OShauTinyTitans fordetails
• AAII back test methodology mayNOT be what you do in reality– Limited liquidity check – slippage,
spread costs increase– May have 0-100 stocks pass the screen –
not many people would invest this way
AAII-San Diego 71

1/9/2016
Tiny Titans Performance @ AAII
AAII-San Diego 72

1/9/2016
Tiny Titans: Some Issues• The problems with the AAII Tiny Titans scheme include:
– Number of stocks: Can buy 0 to 100+– No cash: You can be 100% invested in 1 or a handful of stocks– Liquidity: Other than “No OTC”, >$25M Market Capitalization, there is
no liquidity check– Trading costs: 12 round-trips/year (can’t do much here)
• Liquidity: When dealing with stocks this small must be aware ofunavoidable costs
AAII-San Diego
Vol = Volume
73

Tiny Titans: Screen
1/9/2016 AAII-San Diego 74

Tiny Titans: Current Stocks
1/9/2016 AAII-San Diego 75

Tiny Titans: Back-Test
1/9/2016 AAII-San Diego 76

• While the R2000 is a usefulbenchmark comparison we will lookat two others as well
– “All stocks” - with the TT universescreen elements - rebalanced every 4weeks. This captures the small cap, lowprice and value effects
– Comparison with picking 25 stocks from“All stocks” - with the TT universescreen elements - every 4 weeks. Thislets us do some statistical test to see howwell the screen is doing
Tiny Titans vs. All Stocks: Fair Comparison
1/9/2016 AAII-San Diego 77

Tiny Titans vs. All Stocks
1/9/2016 AAII-San Diego 78

Tiny Titans vs. All Stocks
1/9/2016 AAII-San Diego 79
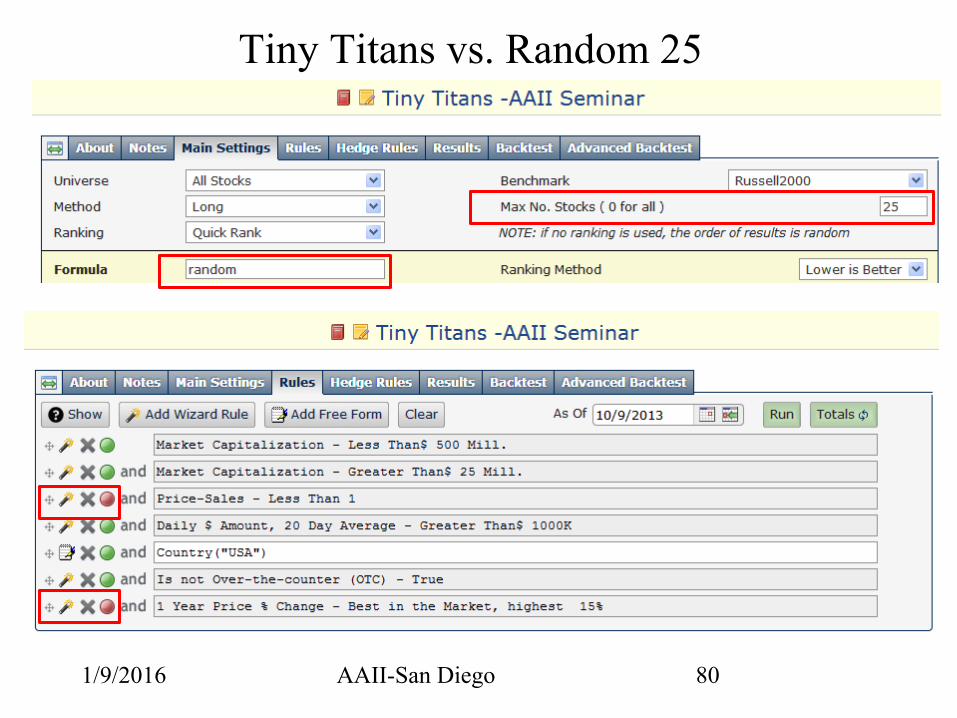
Tiny Titans vs. Random 25
1/9/2016 AAII-San Diego 80

Tiny Titans vs. Random 25
1/9/2016 AAII-San Diego 81

Tiny Titans: Back-Test vs. Random 25
1/9/2016 AAII-San Diego
Annualized Return
8.4%5.0%1.7% 11.7% 15%
Tiny Titans: 24.3% CAGR, +4.7 SD, ~100%
18.4% 21.7%
82

• The Tiny Titans screen obliterates our twobenchmarks – CAGR and Sharpe are excellent, lower MDD than
Equal Weight – but high StdDev overall
• More practical screen than AAII’s….– Liquidity check should make stocks “buyable” at
reasonable spread/slippage costs– If the screen results in less than 15 stocks cash is
added to the portfolio– Limited to 25 stocks (easier implementation)– MUST be run monthly - so has a high trading cost
Tiny Titans Take-Aways
1/9/2016 AAII-San Diego 83

1/9/2016
Extra “Stuff”: Even More Screens!
AAII-San Diego
• Sector Dogs• Tiny Titans• The Other Side of
Value
84

• The AAII Journal and the CIhave written articles on thisapproach
• Based on my testing I used asubset (“Quality”) of what’sbeen recommended
• The screen: Top 25 stocksranked by Gross Profit / TotalAssets
• Not only is there no momentumor TA in this screen – there’s nopricing info at all!!
The Other Side of Value (OSV)
1/9/2016 AAII-San Diego 85

• Terms: (some, not all)– Setvar: Computes Gross Profits to Total Assets (@GPtoTtlAsst) so it can
be seen in screen runs
The OSV Screen
1/9/2016 AAII-San Diego 86

The OSV: Current Stocks
1/9/2016 AAII-San Diego 87

The OSV: Back-Test
1/9/2016 AAII-San Diego 88

The OSV vs. Random 25
1/9/2016 AAII-San Diego
Annualized Return
8.2%6.6%5.0% 9.9% 11.5%
The OSV: 11.4% CAGR +2 SD, ~97%
13.1%
89

• By excluding Financials andADRs ~ 15% of the S&P500stocks are excluded from beingranked– Range shown in back-test was 401-
426 stocks available to be ranked
• So – should we compare to 25stocks picked out of the S&P500or this smaller universe?
• I took the coward’s way out andam presenting both statistics andletting you decide which is moreappropriate…
OSV: Comparing to the Right Universe??
1/9/2016 AAII-San Diego 90

The OSV vs. (Alternate Universe) Random 25
1/9/2016 AAII-San Diego
Annualized Return
9.1%7.0%5.0% 11.1% 13.2%
The OSV screen: 11.4% CAGR 1+ SD, ~87%
15.3%
91

• The OSV screen does well compared to our two standard benchmarks, less well WRT thesmaller (no Financials, ADRs) universe– Good CAGR and SD is lower than SYLD, not as
good as Sector SYLD Dog– Note that OSV has slightly lower SD than SYLD –
but larger than it’s equal weight universe!
• Typically the OSV screen will over-weightsome sectors -- e.g., Consumer, HealthCareand Tech are 60-80% of screen results
The OSV Take-Aways
1/9/2016 AAII-San Diego 92

1/9/2016 AAII-San Diego 93
Reference Material
1/9/2016 AAII-San Diego
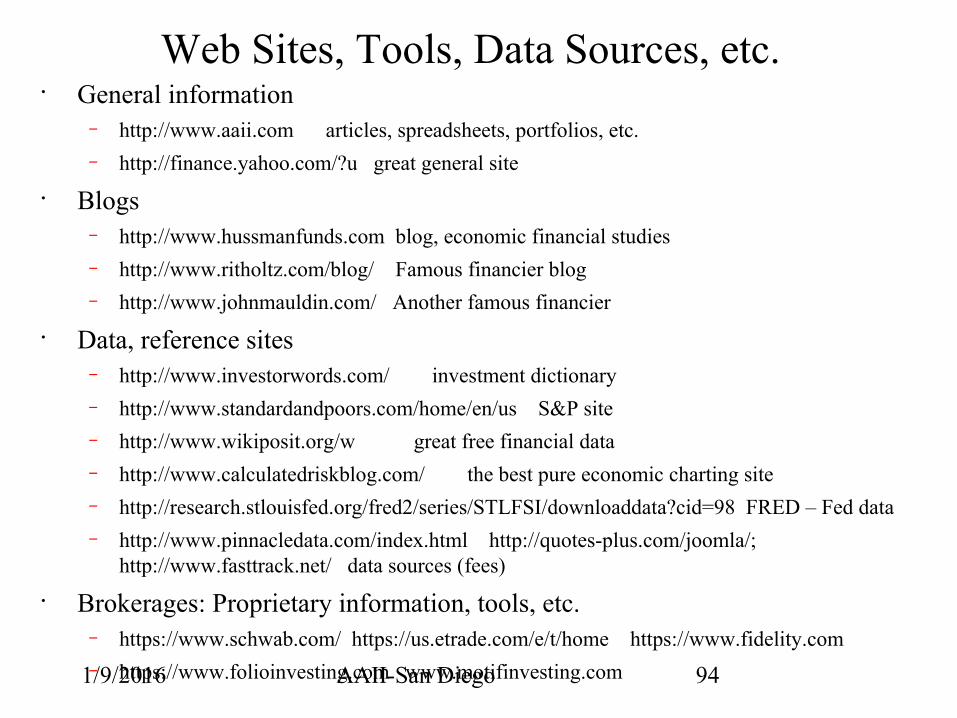
Web Sites, Tools, Data Sources, etc.• General information
– http://www.aaii.com articles, spreadsheets, portfolios, etc.– http://finance.yahoo.com/?u great general site
• Blogs– http://www.hussmanfunds.com blog, economic financial studies– http://www.ritholtz.com/blog/ Famous financier blog – http://www.johnmauldin.com/ Another famous financier
• Data, reference sites– http://www.investorwords.com/ investment dictionary– http://www.standardandpoors.com/home/en/us S&P site– http://www.wikiposit.org/w great free financial data– http://www.calculatedriskblog.com/ the best pure economic charting site– http://research.stlouisfed.org/fred2/series/STLFSI/downloaddata?cid=98 FRED – Fed data– http://www.pinnacledata.com/index.html http://quotes-plus.com/joomla/;
http://www.fasttrack.net/ data sources (fees)
• Brokerages: Proprietary information, tools, etc.– https://www.schwab.com/ https://us.etrade.com/e/t/home https://www.fidelity.com– https://www.folioinvesting.com www.motifinvesting.com 94

1/9/2016 AAII-San Diego
Web Sites, Tools, Data Sources, etc.• Tools
– http://www.assetcorrelation.com/ Generates correlations across instruments
– http://stockcharts.com/ Draw complex charts
– http://www.google.com/ Can find anything
– http://www.keelix.com/backtester/ ( free SIPro back tester)
– http://sumgrowth.com/ momentum & timing site (fees after trial period)
– https://www.vectorvest.com/vvlogin/login.aspx back testing tool (fees)
– http://www.portfolio123.com/ back testing toll (fees)
– http://www.qmatix.com/XLQ.htm (good Excel plug-in for Yahoo! Data, SIPro)
– Excel, Visual Basic: do a lot of hacking with this tool
– SIPro: best reasonably priced stock screener out there
• Economics, Finance sites– http://advisorperspectives.com/dshort/ mix of economic and market, very understandable, lots of fun charts
– http://www.businesscycle.com/ ECRI – famous economic forecaster, downloadable info
– http://www.angrybearblog.com/ economic policy (arguments)
– http://gfs.eiu.com/about/ monthly economic forecast (free – I think)
• Quant sites (mostly blogs)– http://cssanalytics.wordpress.com/ Lots of algs, models, ideas
– http://www.cxoadvisory.com/ Lots of algs, models, economic forecasts, etc
– http://www.mebanefaber.com/ Faber’ blog; some algs, lots of good reading references, ideas
– http://marketsci.wordpress.com/ Lots of algs, models, ideas
– http://boards.fool.com/mechanical-investing-100093.aspx board with lots of ideas, algs 95