the strategic processes of small businesses...
TRANSCRIPT

1
THE STRATEGIC PROCESSES
OF SMALL BUSINESSES
OPERATING
IN A
TURBULENT ENVIRONMENT:
A RETAIL COMMUNITY
PHARMACY
PERSPECTIVE
K.K. NAIDOO

2
THE STRATEGIC PROCESSES OF SMALL BUSINESSES OPERATING IN A TURBULENT ENVIRONMENT:
A RETAIL COMMUNITY PHARMACY PERSPECTIVE
by
KAMSALADEVI KUMUDINI NAIDOO
Submitted in accordance with the requirements for the degree of
DOCTOR OF BUSINESS LEADERSHIP
at the
UNIVERSITY OF SOUTH AFRICA
PROMOTER: PROFESSOR V MAKIN
MARCH 2006

3
(i) DEDICATION
FOR THE GENERATION BEFORE ME, MY MOTHER,
SARATHAMBAL NAIDOO AND
THE GENERATION AFTER ME, MY SON,
SHIVESH NAIDOO
“YOU ARE THE WIND BENEATH MY WINGS”

4
(ii) ACKNOWLEDGEMENTS AND THANKS
I THANK THE ALMIGHTY GOD, BY WHOSE GRACE,
THIS STUDY WAS MADE POSSIBLE.
I am immensely indebted to the following people:
1. My promoter, Professor V Makin. Thank you for your guidance, advice,
support and help. To have been your student, has been an honour, a
privilege and a pleasure.
2. The staff, at the School of Business Leadership, UNISA, especially Ms
Lynette Smith. Your efficient assistance has been invaluable to this
study.
3. The DBL Colloquia attendees and participants, whose constructive
criticism, comments and ideas, helped shape this study.
4. My mentor, colleague and friend, Professor V Rambiritch, for motivation,
encouragement, support and advice, par excellence.
5. My colleagues and friends, Professor SY Essack, Professor CM Dangor,
Professor JAO Ojewole, Professor T Govender, Dr F Oosthuizen, Mr D
Lutchman, Mrs P Naidoo, Mr L Murugan, Mr S Chonco, Ms A
Bagwandeen, Mr A Govender, Ms L Govender, Ms C Mocktar, Ms U
Govinden, Mr P Naidoo, Mrs A Heeralal and Ms N Hurbans, for all
their kind words of encouragement.
6. My colleagues and friends, Mr D Kisoon & Mrs N Kisoon and Dr Lochan
Naidoo & Mrs Julie Naidoo. You personify friendship.
7. Dr R Ramasar, Dr P Ramasar and Ms S Govender, for all their help and
assistance, without which, this study would not have been possible.
8. All the study participants. No amount of words can adequately express my
appreciation for your support.
9. All my friends, family and colleagues who have been helpful and
supportive and who have believed in me.

5
(iii) ABSTRACT AND EXECUTIVE SUMMARY A: ABSTRACT
Introduction:
In South Africa, the small business sector has been identified as a sector that is
not performing optimally. In a turbulent environment, this type of small business
profile is magnified. Therefore, it is important to examine mechanisms through
which the performance of this sector can be enhanced. Dynamic capabilities have
emerged as a strategic tool of the highest order in terms of firm management and
strengthening these capabilities is a key concern for firms that operate in a
turbulent environment. Dynamic capabilities are described as the processes
required to reconfigure existing resources into new functional competencies.
Therefore, this study investigated the strategic processes of small businesses and
developed a new strategic model and theory to illustrate and elucidate intervention
mechanisms and strategies to strengthen the dynamic capabilities of these small
businesses.
Methodology:
The retail community pharmacy sector was chosen as a model sector for this
study since it is a sector that comprises mainly of small businesses and it is
currently experiencing environmental turbulence. The methodology followed an
initial exploratory, qualitative approach followed by a formal, empirical, quantitative
approach. The research questionnaire was derived after ensuring that content
validity, criterion related validity, construct validity and reliability criteria were met.
This questionnaire was administered to a sample of 477 out of a population of
2549 small businesses in the retail community pharmacy sector, using an
unrestricted, simple, random, probability sampling approach. As a consequence of
having received 130 completed questionnaires, the results obtained in this study
were expressed at the 95% confidence level with a confidence interval of 0.08.
Results and Discussion:
From a gap analysis of the level of importance of dynamic capabilities and their
extent of implementation, seven dynamic capabilities whose implementation can
be enhanced by an alteration of the management importance perception of them,
were extracted. These capabilities revolve around staff reward, well-being,
empowerment and education and training, as well as the abilities of the small

6
business leadership to sense the environment and opportunities while being
sensitive to stakeholder needs. Through a consolidation of the results of the gap
analysis, a model for the initiation and the sustaining of innovative resource
reconfigurations was developed. Conclusion:
For the management practice setting, this study’s findings suggest that the
dynamic capabilities of small firms operating in a turbulent environment can be
enhanced and strengthened by the employment of the model developed by this
study. From a management education perspective, this study’s findings also
suggest that the employment of specific and focussed management education that
revolves around the seven identified processes will enable not only the initiating
phase of the proposed model but will also provide a multiplier effect in the model
since management capability is also part of the general resource base of the firm.
This study thus proposes the use of these management practice and educational
approaches to strengthen and enhance the dynamic capabilities of small
businesses operating in a turbulent environment.
Keywords: strategic processes, dynamic capabilities, small businesses,
turbulent environment, management capability.

7
B: EXECUTIVE SUMMARY
CHAPTER 1: OVERVIEW
The aims of this chapter were to introduce the study, state the research problem,
the research objectives and the research propositions, explain the study’s use of
the importance/implementation approach, demarcate and outline the scope of the
study, define the research limitations, explain the research design and provide the
chapter outline of the thesis.
This overview chapter commenced with an introduction to the study and an
explanation of why the resource-based view needed to be extended to the
dynamic capabilities view. The relevance of the dynamic capabilities view to
optimal business performance in a turbulent environment was also explained. This
chapter also highlighted the study’s differentiation of dynamic capabilities into
reconfiguration enabling processes and reconfiguration processes in order to
obtain clarity about the content, domain, conceptualisation and operationalisation
of dynamic capabilities.
In explaining the context of the study, viz. small businesses operating in a
turbulent environment, the lack of optimal performance of the small business
sector and its failure to meet expectations was emphasised.
From this business and management problem emerged the research problem viz.
“How to strengthen the dynamic capabilities of small businesses operating in a
turbulent environment”. From this research problem, emerged the purpose of the
study, and the research objectives of the study.
This chapter also explained the study’s use of its importance/implementation
approach and emphasised how the use of this approach would enable the
quantitative description of scarce resource allocation to strategic processes or
dynamic capabilities. The utility of this approach in the creation of a theoretical
model for the strengthening of the strategic processes in small businesses
operating in a turbulent environment was also emphasised.
The study also demarcated clearly, through the outlining of the scope of the study,
aspects related to the study that would not be dealt with by the study. These
aspects were linked to the recommendations for future research in Chapter 6. The
limitations of the study were also outlined, and linked to the recommendations in
Chapter 6.

8
This chapter also described the research design, in nine stages, and highlighted
the type of study being carried out viz. an initial qualitative, exploratory approach,
followed by a quantitative, descriptive approach and then a quantitative,
explanatory or inferential approach.
The chapter also provided the chapter outline of the thesis
CHAPTER 2: THE LITERATURE REVIEW
The aims of this chapter were to review the literature review to provide a
theoretical background to the study and motivate for and justify the propositions
developed.
This literature review chapter commenced with the definition and characterisation
of small businesses. Turbulent environment were defined and strategic
approaches to these turbulent environments were then explored. The literature
indicated the inadequacy of traditional strategic processes in turbulent
environments and pointed to the need for new strategic processes that would
enable the continuous adaptation, innovation and reconfiguration of resources to
create value-adding strategies and competitive advantage; a perspective
consistent with the dynamic capabilities view.
In general, the literature review revealed a paucity of literature and research on
the strategic processes of small businesses operating in a turbulent environment.
Nonetheless, since the literature on dynamic capabilities indicated that there are
“best practices“ in the execution of dynamic capabilities, “best practices” for
excellence in small business excellence were identified in the Malcolm Baldrige
Quality Award Criteria.
To obtain clarity about what dynamic capabilities really are, the literature was
searched to extract relevant and cohesive themes that would enable the
conceptual separation of dynamic capabilities into reconfiguration enabling
processes and reconfiguration processes. The literature identified the processes
of “patching” and “co-evolving” as reconfiguration processes. Four reconfiguration
drivers were also identified viz.: environment and opportunity sensing, knowledge
acquisition and learning, co-ordination and regulation and alignment and
integration. These reconfiguration drivers were found to be embodied in the “best
practices “ of the Malcolm Baldrige National Quality Award Criteria.

9
Using the identified reconfiguration enabling processes, reconfiguration processes
and themes that emerged from the personal interviews, this chapter synthesised a
set of strategic processes for small businesses operating in a turbulent
environment. This set of strategic processes was used as the basis for the
questionnaire to be distributed to the respondents of this study.
The literature was also reviewed to provide support for the propositions that were
generated, using the methodology described in Chapter 3.
A general synthesis of the literature also revealed the importance of the study in
the practice environment for the small business and for small business theory and
the general body of management theory.
The environmental turbulence created in the retail community pharmacy sector by
the new pricing structures, single exit prices, the opening of ownership of
pharmacies to persons other than pharmacists, the creation of designated service
providers by service payers and the issue of dispensing licences to healthcare
professionals who are not pharmacists, provided justification for the use of this
sector to model the strategic processes of small businesses operating in a
turbulent environment. The importance of the study to this sector was also
explained, in terms of increasing the knowledge of how resources are
reconfigured in this sector, in the light of this sector’s duality viz. its focus on
professionalism versus its focus on mercantilism.
CHAPTER 3: RESEARCH METHODOLOGY
This aims of this chapter were to describe the research stages and the elements
of the research process, focusing on the primary data collection methodology,
both qualitative and quantitative and the method that was used in the process of
theory building and proposition development, as well as explaining how the
instrument was designed, the nature of measurement, the soundness of
measurement, the pilot study, the population and sampling methods, the data
preparation and the data analysis methods.
This research methodology chapter commenced with a clear layout of the nine
research stages, from the research problem formulation stage to the data analysis
stage. The chapter then described the elements of the research process. The
degree of problem crystallisation was shown by the description of the research as

10
an initial qualitative, exploratory study, followed by a quantitative descriptive
analysis and finally by a quantitative, formal, empirical study method. The
researcher’s control of variables was illustrated by an explanation of how the
researcher had no control of the variables in the sense of being able to manipulate
them. The time-dimension of the study as was indicated by the cross-sectional
nature of the study, which showed that the study represented a moment in time.
The use of Dubin’s theory building and proposition development methodology was
clearly explained. Each proposition that was developed was motivated for
comprehensively in Chapter 2.
The questionnaire design process indicated how the themes that emerged from
the personal interviews with six small business owners, all retail community
pharmacists were incorporated into the draft questionnaire together with the
relevant strategic processes extracted from the literature.
This chapter also indicated that prior to the pilot study, this draft questionnaire,
was first evaluated by a panel of six experts, comprising, academics, small
business owners and pharmacists, and that the questionnaire was refined
according to the comments and suggestions, giving rise to the pilot questionnaire.
The pilot questionnaire was then subjected to a pilot study that comprised of ten
respondents, all small business owners who were retail community pharmacists.
This chapter described the nature of measurement used in the study as the Likert
scaling method and explained its appropriateness of use in this type of study. The
soundness of measurement in terms of validity and reliability parameters were
also described in this chapter. The content validity criterion was satisfied by the
evaluation of the draft questionnaire by the panel of experts. The criterion-related
validity parameter was satisfied by the genesis of the questionnaire in a validated
set of “best practices” from the Malcolm Baldrige National Quality Award Criteria.
The construct validity was satisfied by the use of the factor analysis which refined
the measuring instrument and confirmed that the factors actually measured the
strategic processes of small businesses operating in a turbulent environment. The
reliability criterion was satisfied by the high Cronbach Alpha values obtained
indicating the consistency and homogeneity among the items in the questionnaire.
The section dealing with the pilot study chapter commenced with an explanation of
the purpose of the pilot study and then a description of the pilot study participants,
who were ten small business owners who were retail community pharmacists. The

11
chapter then detailed the analytical procedures that were carried to ensure the
validity and reliability of the instrument, using the SPSS 11.5 statistical package.
The alpha coefficients that were obtained for the reliability analysis ranged from
moderate to high in general showing a moderate to high internal consistency in
the questionnaire. The factor analysis results that were obtained showed that a
five factor solution showed the best interpretable factor pattern, which loaded out
onto the factors staff, leadership, measurement, customers and networks and
support systems.
The chapter then explained that a second factor analysis was conducted on the
instrument after adjustment to the five factor solution, to ensure that the correct
factor solution was used. The second factor analysis results showed that the
factor, staff, loaded out onto a two factor solution, for knowledge, empowerment
and motivation as well as reward. This chapter thus showed that a five factor
solution showed the most interpretable factor patter, with the factor, staff being
sub-divided into staff knowledge, empowerment and motivation and staff reward.
The chapter explained the limitations to the pilot study and concluded that the
questionnaire had satisfactory reliability and validity for the study.
In dealing with the administration of the final questionnaire to the population under
test, the chapter highlighted the relevant population of this study [retail community
pharmacies that are small businesses], comprising of 2549 pharmacies. The
chapter also indicated that at a confidence level of 95% and a confidence interval
[expresses as a decimal] of 0.05, a sample size of 334 was required for this
population. The sample was selected using an unrestricted, simple, random,
probability sampling approach with the SPSS 11.5 statistical package. To account
for a 30% non response rate, 477 questionnaires were distributed. However, only
134 questionnaires were returned. Of these four questionnaires were incomplete
and were not included in the study. The study’s new confidence interval
[expressed as a decimal], with this reduced sample size was then calculated to be
0.08 at the 95% confidence level.
The chapter also indicated methods by which the data would be prepared for
analysis by describing the editing, coding and entering of data procedures.
The methods of data analysis were also described in this chapter with reasons
cited for the choice of descriptive and inferential statistics used in the study. The
chapter indicated that the type of descriptive statistics that this study used were

12
the means and the standard deviations. The means were used because they
measure the central tendency was used to determine the average response of
respondents towards a test, while the standard deviations were used because
they improve interpretability by removing the variance’s square and expressing
deviations in their original units.
Besides the Cronbach Alpha and factor analysis, the chapter indicated that t-tests
were also used. Since this study revolved around the determination of the
significance of the difference between two variables that were both provided by
the same set of respondents, the use of a paired t-test thus provided the best test
of statistical significance.
CHAPTER 4: QUANTITATIVE DATA ANALYSIS AND RESULTS
The aims of this chapter were to present and analyse the data.
This chapter commenced with reliability and validity testing on the data obtained
from the final questionnaire, using the Cronbach Alpha values and factor analysis
methods described in Chapter 3. This chapter then indicated that the factors
loaded out onto a six factor solution, viz. staff-knowledge empowerment and
motivation, staff-reward, leadership, measurement, customers and networks and
support systems. The leadership factor loaded out onto two separate sub-factors,
leadership - general and leadership – new. This chapter termed each factor, a
process cluster. The reliability estimates for each process cluster ranged from
moderate to high, indicating a moderate to high internal consistency in the final
questionnaire.
The data analysis in this chapter was approached in a stepwise manner, with an
initial general analysis of all process clusters and processes. This was followed by
an analysis of the importance /implementation gap in process clusters and finally
an analysis of the importance/implementation gap in all processes.
13
CHAPTER 5: DISCUSSION OF RESULTS
The aims of this chapter were to discuss the results obtained in Chapter 4
This chapter commenced with a quantitative description of the level of importance
and extent of implementation of each process cluster and each individual process
using a comparison of the means of the results obtained and through a trend
analysis of these means. For the strategic process clusters, this chapter found that
these small businesses considered measurement to be the most important
strategic process cluster; while staff-reward was found to be the least important
strategic process cluster. On the other hand networks and support systems was
found to be the most implemented strategic process cluster with leadership-
turbulence the least implemented process cluster.
For the individual processes, in terms of importance, this chapter found that
processes 12, 18, 21 and 22 were the most important processes, while processes
10 and 32 were the least important processes. For the individual processes, in
terms of implementation, this chapter found that processes 4, 5 and 6 were the
most implemented processes, while process 14 was the least implemented
process.
In the second step, this chapter analysed importance and implementation in
general and found that there was a significant gap between level of importance
and extent of implementation of the processes in general.
In the third step, this chapter analysed the importance and implementation of
process clusters and found that staff-reward was the only process cluster with no
significant gap between level of importance and extent of implementation,
indicating that the extent of implementation, and by extension the resource
allocation, to this process cluster could be influenced by a change in the
importance perception, and by extension the management capabilities of small
businesses operating in a turbulent environment.. This step also indicated that the
other process clusters were dependant on a change in the general resource base
of the small firm for any change in the extent of implementation of these process
clusters.
In the fourth step, this chapter analysed the importance and implementation of all
processes and found that processes 4, 6,7,8,10,29 and 30 showed no significant
gap between level of importance and extent of implementation, indicating that the
extent of implementation, and by extension the resource allocation to these

14
processes could be influenced by a change in the importance perception, and by
extension the management capabilities of small businesses operating in a
turbulent environment. This step also indicated that the other processes were
dependant on a change in the general resource base of the small firm for any
change in the extent of implementation of these processes.
CHAPTER 6: CONCLUSIONS AND RECOMMENDATIONS
The aims of this chapter were to present the major findings of this study, show
how the research problem, the research purpose, the research objectives and the
research propositions are satisfied and to make recommendations for future areas
of research.
This chapter commenced with a linking of each element of the research purpose,
research objectives to chapters and sections where they were addressed. Using
the empirical results of the study, the research propositions were examined to
indicate whether they were supported or not. This chapter also reported on a new
strategic model and theory on the strategic processes of small businesses
operating in a turbulent environment and presented a summary of the main
research findings.
The main conclusion of the study was highlighted viz. by the employment of
stepwise, rational, specific and targeted interventions and strategies that are
designed to initiate and sustain the dynamic capabilities of small businesses
operating in a turbulent environment, the dynamic capabilities of these small firms
can be strengthened and hence their performance in turbulent environments
optimised.
Several recommendations for future research in this area were also made.

15
(v) TABLE OF CONTENTS
CONTENTS PAGE (i) Title page 2
(ii) Dedication 3
(iii) Acknowledgements and Thanks 4
(iv) Abstract and Executive Summary 5
(v) Table of Contents 15
(vi) Definition of Key Terms 21
(vii) List of Annexures 22
(viii) List of Tables 24
(ix) List of Figures 27
(x) List of Graphs 29
Chapter 1: Overview 30 1.1 The Chapter Summary 31
1.2 Introduction 33
1.3 The Research Problem 34
1.4 The Importance/Implementation Approach 38
1.5 The Purpose of the Study 40
1.6 The Research Objectives 41
1.7 The Research Propositions 42
1.8 The Demarcation and Scope of the Study 42
1.9 The Research Design 44
1.9.1 The Type of Study 45
1.9.2 Primary data collection methodology 46
1.9.3 The Research Plan 47
1.10 The Limitations of the Study 50
1.11 The Outline of the Thesis Chapters 51
1.12 The Chapter Conclusions 53
16
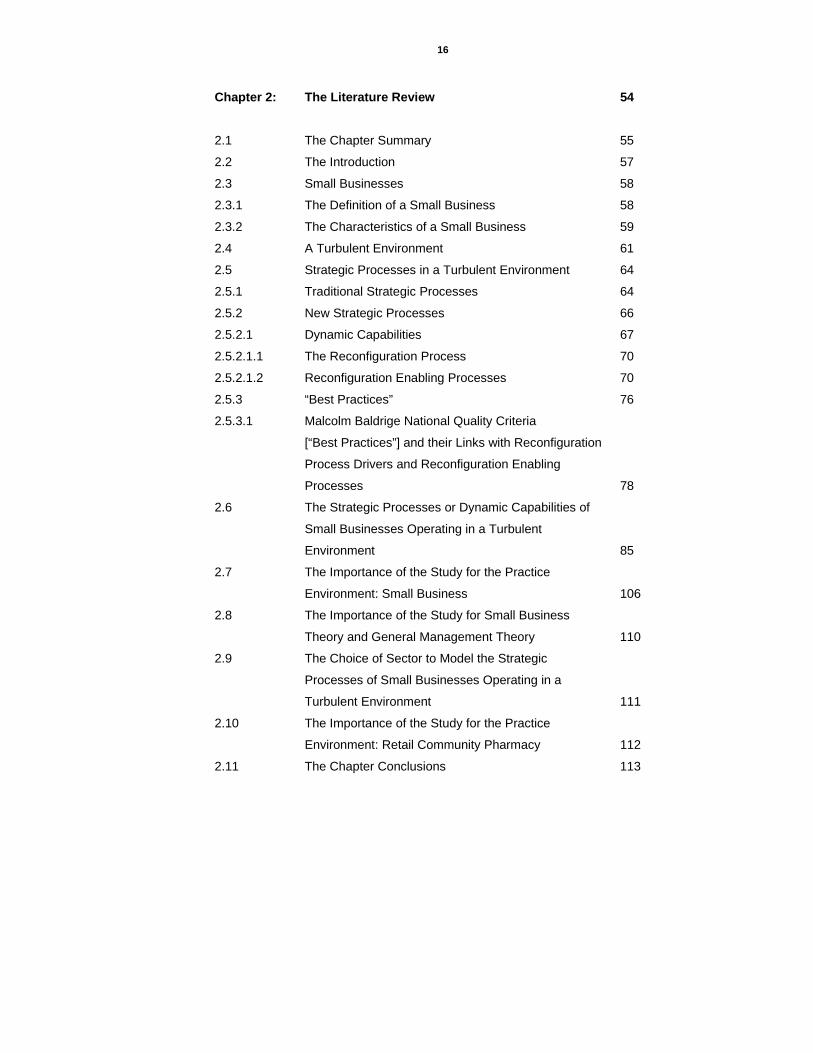
Chapter 2: The Literature Review 54
2.1 The Chapter Summary 55
2.2 The Introduction 57
2.3 Small Businesses 58
2.3.1 The Definition of a Small Business 58
2.3.2 The Characteristics of a Small Business 59
2.4 A Turbulent Environment 61
2.5 Strategic Processes in a Turbulent Environment 64
2.5.1 Traditional Strategic Processes 64
2.5.2 New Strategic Processes 66
2.5.2.1 Dynamic Capabilities 67
2.5.2.1.1 The Reconfiguration Process 70
2.5.2.1.2 Reconfiguration Enabling Processes 70
2.5.3 “Best Practices” 76
2.5.3.1 Malcolm Baldrige National Quality Criteria
[“Best Practices”] and their Links with Reconfiguration
Process Drivers and Reconfiguration Enabling
Processes 78
2.6 The Strategic Processes or Dynamic Capabilities of
Small Businesses Operating in a Turbulent
Environment 85
2.7 The Importance of the Study for the Practice
Environment: Small Business 106
2.8 The Importance of the Study for Small Business
Theory and General Management Theory 110
2.9 The Choice of Sector to Model the Strategic
Processes of Small Businesses Operating in a
Turbulent Environment 111
2.10 The Importance of the Study for the Practice
Environment: Retail Community Pharmacy 112
2.11 The Chapter Conclusions 113
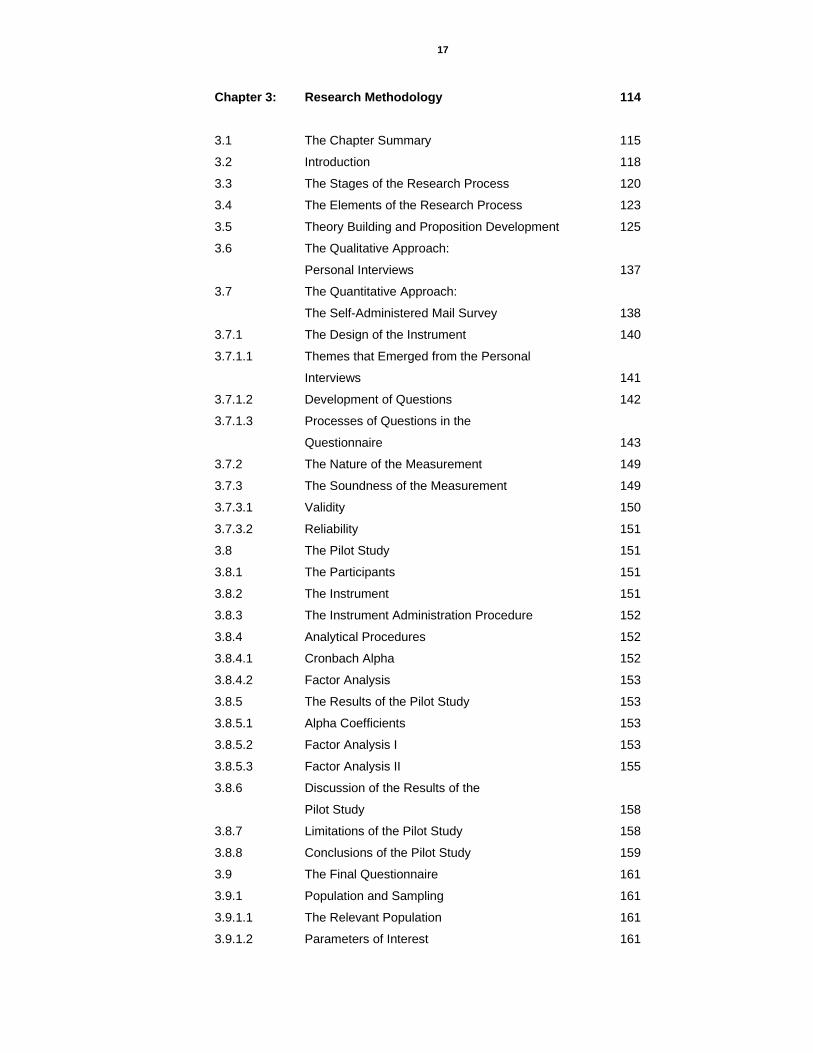
17
Chapter 3: Research Methodology 114
3.1 The Chapter Summary 115
3.2 Introduction 118
3.3 The Stages of the Research Process 120
3.4 The Elements of the Research Process 123
3.5 Theory Building and Proposition Development 125
3.6 The Qualitative Approach:
Personal Interviews 137
3.7 The Quantitative Approach:
The Self-Administered Mail Survey 138
3.7.1 The Design of the Instrument 140
3.7.1.1 Themes that Emerged from the Personal
Interviews 141
3.7.1.2 Development of Questions 142
3.7.1.3 Processes of Questions in the
Questionnaire 143
3.7.2 The Nature of the Measurement 149
3.7.3 The Soundness of the Measurement 149
3.7.3.1 Validity 150
3.7.3.2 Reliability 151
3.8 The Pilot Study 151
3.8.1 The Participants 151
3.8.2 The Instrument 151
3.8.3 The Instrument Administration Procedure 152
3.8.4 Analytical Procedures 152
3.8.4.1 Cronbach Alpha 152
3.8.4.2 Factor Analysis 153
3.8.5 The Results of the Pilot Study 153
3.8.5.1 Alpha Coefficients 153
3.8.5.2 Factor Analysis I 153
3.8.5.3 Factor Analysis II 155
3.8.6 Discussion of the Results of the
Pilot Study 158
3.8.7 Limitations of the Pilot Study 158
3.8.8 Conclusions of the Pilot Study 159
3.9 The Final Questionnaire 161
3.9.1 Population and Sampling 161
3.9.1.1 The Relevant Population 161
3.9.1.2 Parameters of Interest 161

18
3.9.1.3 The Type of Sample 162
3.9.1.4 The Size of the Sample 162
3.9.2 The Distribution of the Questionnaire 163
3.9.3 The Preparation of the Data 165
3.9.4 The Analysis of the Data 166
3.9.4.1 Descriptive Statistics 166
3.9.4.2 Inferential Statistics 166
3.9.5 The Strategic Processes for the Final Questionnaire 169
3.10 The Chapter Conclusions 173
Chapter 4: Quantitative Data Analysis and Results 174 4.1 The Chapter Summary 175
4.2 Introduction 176
4.3 The Reliability and Validity of the
Final Questionnaire 178
4.4 Importance and Implementation 180
4.4.1 The Importance of Strategic Process Clusters
and Strategic Processes 180
4.4.2 The Implementation of Strategic Process Clusters
and Strategic Processes 181
4.4.3 A Trend Analysis 183
4.4.3.1 The Importance of Process Clusters 183
4.4.3.2 The Implementation of Process Clusters 184
4.4.3.3 The Importance of Individual Processes 185
4.4.3.4 The Implementation of Individual Processes 186
4.5 The Importance / Implementation Gap 187
4.5.1 Gap Analysis of Importance and Implementation
in General 187
4.5.2 Gap Analysis of Process Clusters 188
4.5.3 Gap Analysis of Individual Processes 191
4.6 The Chapter Conclusions 195
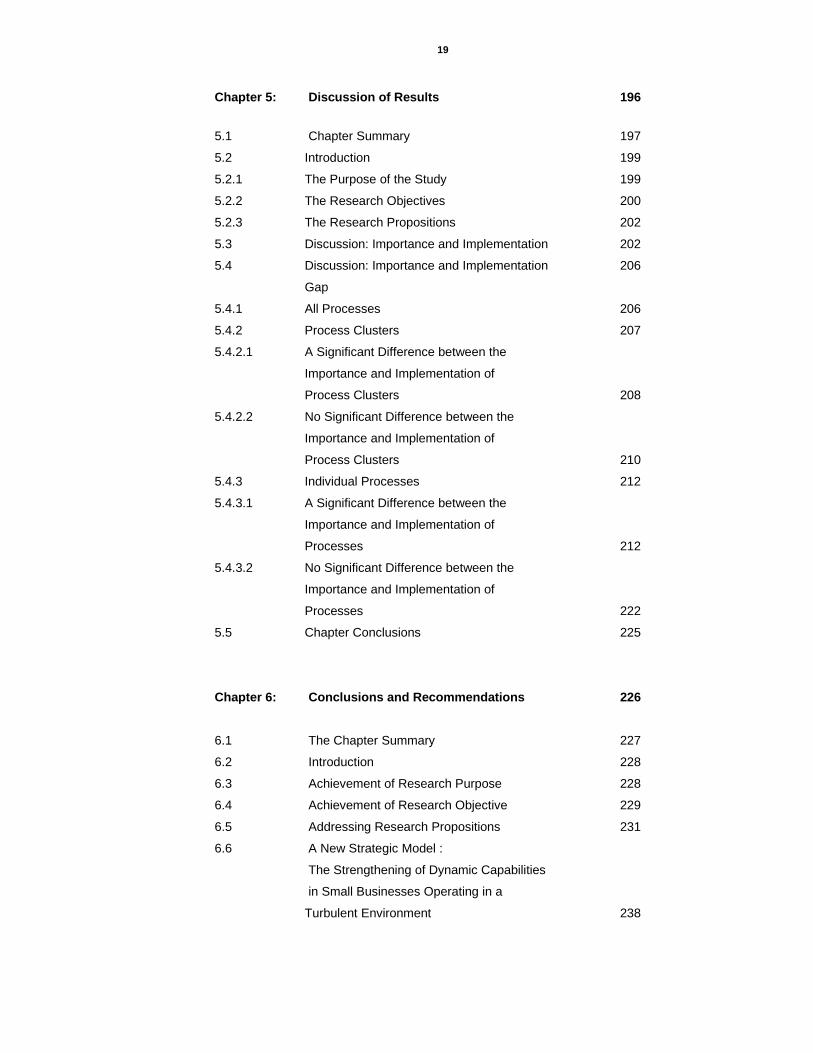
19
Chapter 5: Discussion of Results 196
5.1 Chapter Summary 197
5.2 Introduction 199
5.2.1 The Purpose of the Study 199
5.2.2 The Research Objectives 200
5.2.3 The Research Propositions 202
5.3 Discussion: Importance and Implementation 202
5.4 Discussion: Importance and Implementation 206
Gap
5.4.1 All Processes 206
5.4.2 Process Clusters 207
5.4.2.1 A Significant Difference between the
Importance and Implementation of
Process Clusters 208
5.4.2.2 No Significant Difference between the
Importance and Implementation of
Process Clusters 210
5.4.3 Individual Processes 212
5.4.3.1 A Significant Difference between the
Importance and Implementation of
Processes 212
5.4.3.2 No Significant Difference between the
Importance and Implementation of
Processes 222
5.5 Chapter Conclusions 225
Chapter 6: Conclusions and Recommendations 226
6.1 The Chapter Summary 227
6.2 Introduction 228
6.3 Achievement of Research Purpose 228
6.4 Achievement of Research Objective 229
6.5 Addressing Research Propositions 231
6.6 A New Strategic Model :
The Strengthening of Dynamic Capabilities
in Small Businesses Operating in a
Turbulent Environment 238

20
6.7 A New Strategic Theory :
The Strengthening of Dynamic Capabilities
in Small Businesses Operating in a
Turbulent Environment 243
6.8 Summary of the Main Findings of the Study 245
6.9 Conclusions 246
6.10 Recommendations 248
6.11 Chapter Conclusions 249
21
(vi) DEFINITION OF KEY TERMS SMALL BUSINESS
For the purposes of this research a businesses shall be defined as a business
employing less than 50 workers assumed to be formally registered, clearly
demarcated and paying taxes on a regular basis (Chapter 2)
DYNAMIC CAPABILITIES
This study defines dynamic capabilities as the strategic processes of a small
business operating in a turbulent environment and they comprise of
reconfiguration processes and reconfiguration enabling processes (Chapter 2).
RECONFIGURATION PROCESS
The reconfiguration process is the innovative redeployment of existing resources
into a new set of functional competencies (Chapter 2). RECONFIGURATION ENABLING PROCESS
These are enabling processes that underlie the ability to create new configurations
(Chapter 2)
“BEST PRACTICE”
This study defines “ best practice “ processes as those processes that enable an
organisation to be more effective and efficient in their strategic activities by
ensuring a fast, co-ordinated execution of complex details, and which are well
established constructs (Chapter 2).
RESOURCES
All the assets of the firm, technological, financial, managerial and organisational,
that enables firms to operate in markets. They comprise more than tangible
assets, and include the intangible assets such as the skills and knowledge of the
workforce (Chapter 2).

22
(vii) LIST OF ANNEXURES ANNEXURE PAGE
ANNEXURE 1A 251
ANNEXURE 1B 276
ANNEXURE 2 300
ANNEXURE 3 304
ANNEXURE 4 308
ANNEXURE 5 309
ANNEXURE 6 311
ANNEXURE 7 314
ANNEXURE 8 315
ANNEXURE 9 318
ANNEXURE 10 320
ANNEXURE 11 322
ANNEXURE 12 324
ANNEXURE 13 326
ANNEXURE 14 348
ANNEXURE 15 350
ANNEXURE 16 352
ANNEXURE 17 356

23
ANNEXURE 18 357
ANNEXURE 19 360
ANNEXURE 20: REFERENCES 361

24
(viii) LIST OF TABLES TABLE PAGE
TABLE 1: A summary of the literature on the key drivers
of reconfiguration 73
TABLE 2: Malcolm Baldrige National Quality Criteria and
Their links with reconfiguration process drivers
and reconfiguration enabling processes 78
TABLE 3: Themes emerging from the interviews 141
TABLE 4: Questions developed for the questionnaire 144
TABLE 5: The newly defined factors of section 2B 154
TABLE 6: The newly defined sub-factors of the factor staff 156
TABLE 7: Factors and items of the pilot questionnaire 159
TABLE 8: Reliability estimates and variability of the pilot
questionnaire 160
TABLE 9: The sample size 163
TABLE 10: The new sample size 164
TABLE 11: The strategic processes for the final
questionnaire 169
TABLE 12: Factors and Items of the final questionnaire 178
TABLE 13: Reliability estimates and variability of final
questionnaire 179
TABLE 14: All process clusters from the highest to the
lowest [importance] 180
TABLE 15: The highest and the lowest processes [importance] 180
25
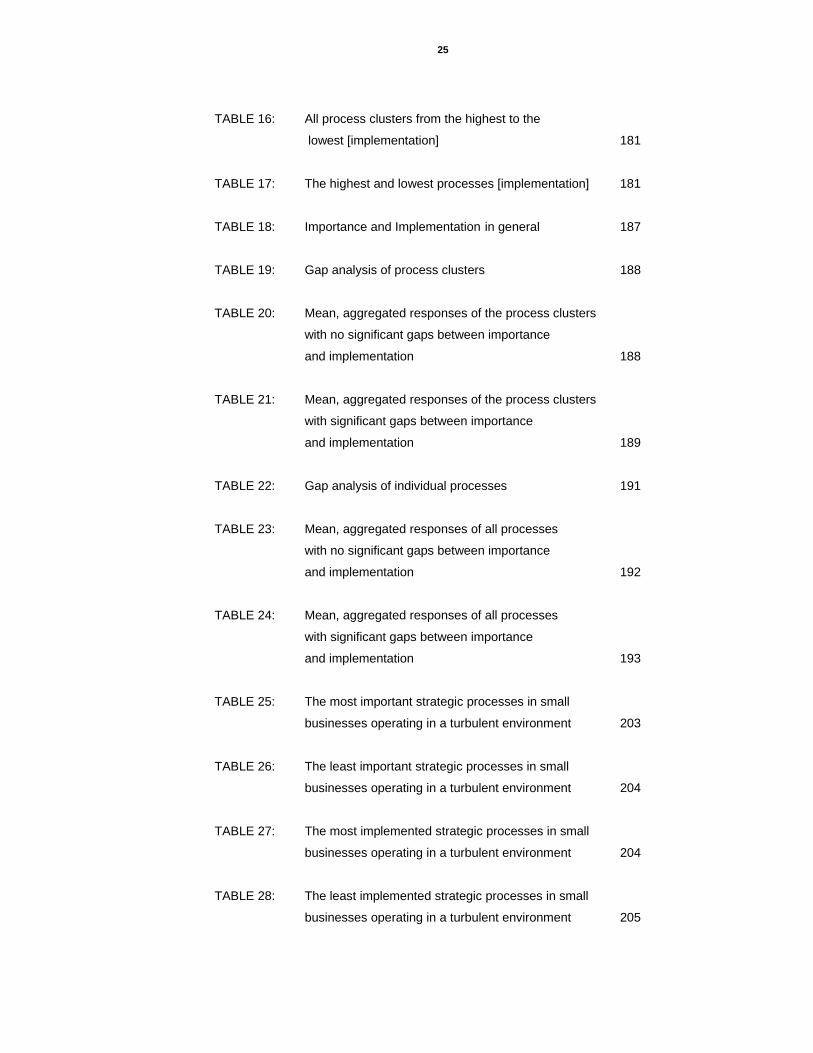
TABLE 16: All process clusters from the highest to the
lowest [implementation] 181
TABLE 17: The highest and lowest processes [implementation] 181
TABLE 18: Importance and Implementation in general 187
TABLE 19: Gap analysis of process clusters 188
TABLE 20: Mean, aggregated responses of the process clusters
with no significant gaps between importance
and implementation 188
TABLE 21: Mean, aggregated responses of the process clusters
with significant gaps between importance
and implementation 189
TABLE 22: Gap analysis of individual processes 191
TABLE 23: Mean, aggregated responses of all processes
with no significant gaps between importance
and implementation 192
TABLE 24: Mean, aggregated responses of all processes
with significant gaps between importance
and implementation 193
TABLE 25: The most important strategic processes in small
businesses operating in a turbulent environment 203
TABLE 26: The least important strategic processes in small
businesses operating in a turbulent environment 204
TABLE 27: The most implemented strategic processes in small
businesses operating in a turbulent environment 204
TABLE 28: The least implemented strategic processes in small
businesses operating in a turbulent environment 205

26
TABLE 29: Strategic processes which have a significant gap
between level of importance and extent of
implementation 213
TABLE 30: Strategic processes that receive the greatest
resource allocation 217
TABLE 31: Group-1 strategic processes about which small
businesses operating in a turbulent environment
face difficult choices in resource allocation 218
TABLE 32: Group-2 strategic processes about which small
businesses operating in a turbulent environment
face difficult choices in resource allocation 219
TABLE 33: Group-3 strategic processes about which small
businesses operating in a turbulent environment
face difficult choices in resource allocation 220
TABLE 34: Strategic processes that do not receive priority in
resource allocation in small businesses operating
in a turbulent environment 222
TABLE 35: Strategic processes which have no significant gap
between level of importance and extent of
implementation 223
27
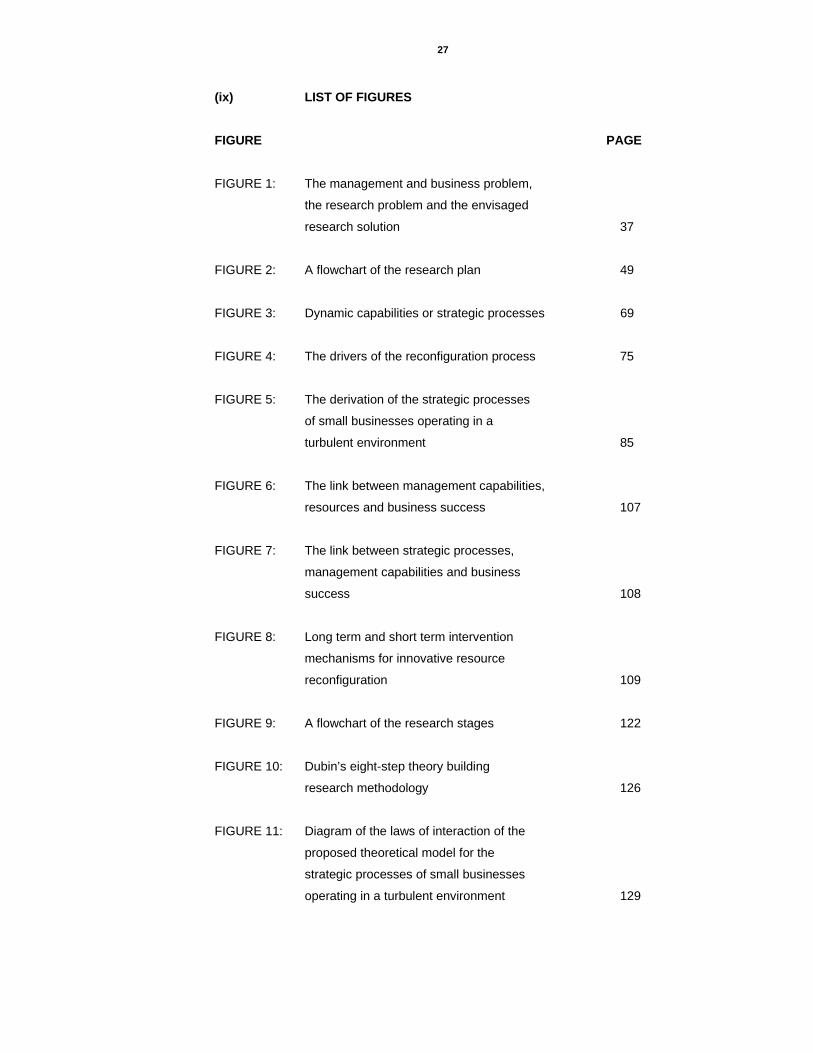
(ix) LIST OF FIGURES
FIGURE PAGE
FIGURE 1: The management and business problem,
the research problem and the envisaged
research solution 37
FIGURE 2: A flowchart of the research plan 49
FIGURE 3: Dynamic capabilities or strategic processes 69
FIGURE 4: The drivers of the reconfiguration process 75
FIGURE 5: The derivation of the strategic processes
of small businesses operating in a
turbulent environment 85
FIGURE 6: The link between management capabilities,
resources and business success 107
FIGURE 7: The link between strategic processes,
management capabilities and business
success 108
FIGURE 8: Long term and short term intervention
mechanisms for innovative resource
reconfiguration 109
FIGURE 9: A flowchart of the research stages 122
FIGURE 10: Dubin’s eight-step theory building
research methodology 126
FIGURE 11: Diagram of the laws of interaction of the
proposed theoretical model for the
strategic processes of small businesses
operating in a turbulent environment 129

28
FIGURE 12: The boundaries of a theory on the strategic
processes of small businesses
operating in a turbulent environment 131
FIGURE 13: A theoretical model of the strategic processes
of small businesses operating in a
turbulent environment 135
FIGURE 14: Questionnaire design 142
FIGURE 15: Questionnaire design and expected outcomes 143
FIGURE 16: Data analysis steps 177
FIGURE 17: Data analysis, research objectives, research
propositions , research purpose and
research problem 199
FIGURE 18: Importance and implementation in general 206
FIGURE 19: The importance and implementation of process
clusters and resources 209
FIGURE 20: The importance and implementation of process
clusters and management capability 211
FIGURE 21: The importance and implementation of processes
and resources 216
FIGURE 22: The importance and implementation of processes
and management capability 224
FIGURE 23: Study findings, research purpose, research
objectives, research propositions,
research problem 228
FIGURE 24: A new strategic model: the strengthening of
the dynamic capabilities of small business
operating in a turbulent environment 242

29
(x) LIST OF GRAPHS GRAPH PAGE
GRAPH 1: The importance of process clusters 183
GRAPH 2: The implementation of process clusters 184
GRAPH 3: The importance of individual processes 185
GRAPH 4: The implementation of individual processes 186
GRAPH 5: Graph of process clusters with significant gaps
between importance and implementation 190
GRAPH 6: Graph of processes with significant gaps
between importance and implementation 194

30
CHAPTER ONE OVERVIEW

31
CHAPTER 1: OVERVIEW 1.1 CHAPTER SUMMARY
The aims of this chapter were to introduce the study, state the research problem,
the research objectives and the research propositions, explain the study’s use of
the importance/implementation approach, demarcate and outline the scope of the
study, define the research limitations, explain the research design and provide the
chapter outline of the thesis.
This overview chapter commenced with an introduction to the study and an
explanation of why the resource-based view needed to be extended to the
dynamic capabilities view. The relevance of the dynamic capabilities view to
optimal business performance in a turbulent environment was also explained. This
chapter also highlighted the study’s differentiation of dynamic capabilities into
reconfiguration enabling processes and reconfiguration processes in order to
obtain clarity about the content, domain, conceptualisation and operationalisation
of dynamic capabilities.
In explaining the context of the study, viz. small businesses operating in a
turbulent environment, the lack of optimal performance of the small business
sector and its failure to meet expectations was emphasised.
From this business and management problem emerged the research problem viz.
“How to strengthen the dynamic capabilities of small businesses operating in a
turbulent environment”. From this research problem, emerged the purpose of the
study, and the research objectives of the study.
This chapter also explained the study’s use of its importance/implementation
approach and emphasised how the use of this approach would enable the
quantitative description of scarce resource allocation to strategic processes or
dynamic capabilities. The utility of this approach in the creation of a theoretical
model for the strengthening of the strategic processes in small businesses
operating in a turbulent environment was also emphasised.
The study also demarcated clearly, through the outlining of the scope of the study,
aspects related to the study that would not be dealt with by the study. These
aspects were linked to the recommendations for future research in Chapter 6. The
limitations of the study were also outlined, and linked to the recommendations in
Chapter 6.

32
This chapter also described the research design, in nine stages, and highlighted
the type of study being carried out viz. an initial qualitative, exploratory approach,
followed by a quantitative, descriptive approach and then a quantitative,
explanatory or inferential approach.
The chapter also provided the chapter outline of the thesis
33
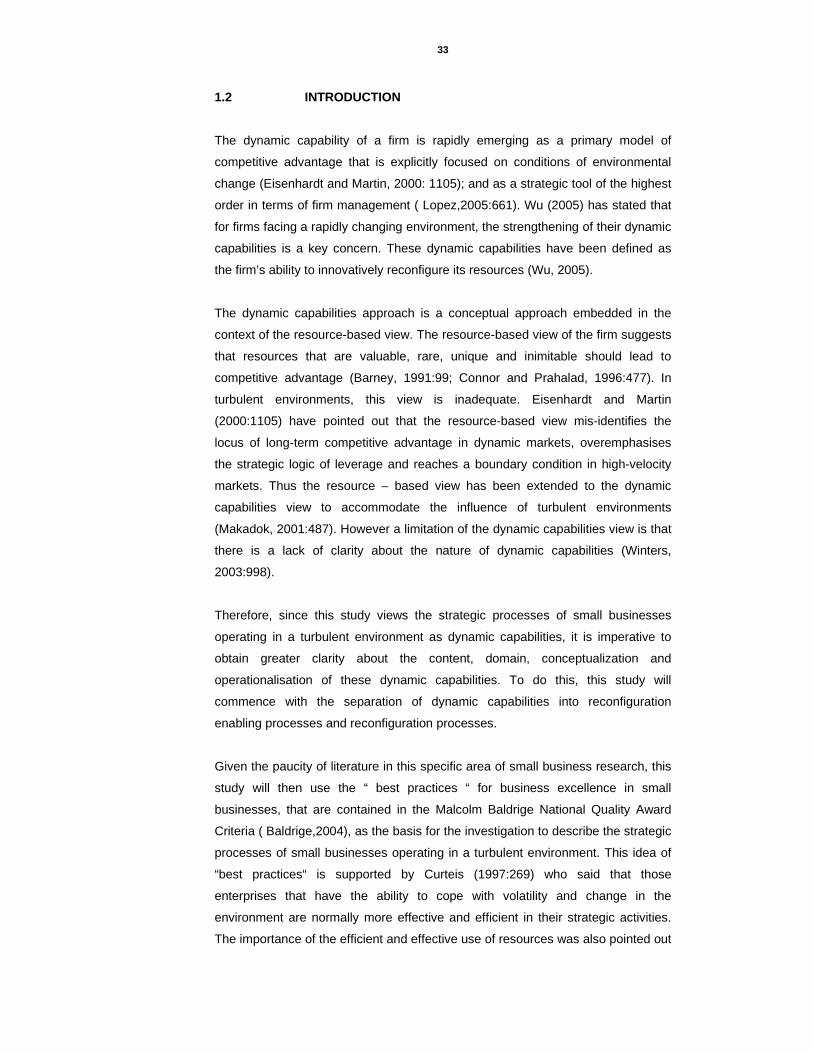
1.2 INTRODUCTION
The dynamic capability of a firm is rapidly emerging as a primary model of
competitive advantage that is explicitly focused on conditions of environmental
change (Eisenhardt and Martin, 2000: 1105); and as a strategic tool of the highest
order in terms of firm management ( Lopez,2005:661). Wu (2005) has stated that
for firms facing a rapidly changing environment, the strengthening of their dynamic
capabilities is a key concern. These dynamic capabilities have been defined as
the firm’s ability to innovatively reconfigure its resources (Wu, 2005).
The dynamic capabilities approach is a conceptual approach embedded in the
context of the resource-based view. The resource-based view of the firm suggests
that resources that are valuable, rare, unique and inimitable should lead to
competitive advantage (Barney, 1991:99; Connor and Prahalad, 1996:477). In
turbulent environments, this view is inadequate. Eisenhardt and Martin
(2000:1105) have pointed out that the resource-based view mis-identifies the
locus of long-term competitive advantage in dynamic markets, overemphasises
the strategic logic of leverage and reaches a boundary condition in high-velocity
markets. Thus the resource – based view has been extended to the dynamic
capabilities view to accommodate the influence of turbulent environments
(Makadok, 2001:487). However a limitation of the dynamic capabilities view is that
there is a lack of clarity about the nature of dynamic capabilities (Winters,
2003:998).
Therefore, since this study views the strategic processes of small businesses
operating in a turbulent environment as dynamic capabilities, it is imperative to
obtain greater clarity about the content, domain, conceptualization and
operationalisation of these dynamic capabilities. To do this, this study will
commence with the separation of dynamic capabilities into reconfiguration
enabling processes and reconfiguration processes.
Given the paucity of literature in this specific area of small business research, this
study will then use the “ best practices “ for business excellence in small
businesses, that are contained in the Malcolm Baldrige National Quality Award
Criteria ( Baldrige,2004), as the basis for the investigation to describe the strategic
processes of small businesses operating in a turbulent environment. This idea of
“best practices“ is supported by Curteis (1997:269) who said that those
enterprises that have the ability to cope with volatility and change in the
environment are normally more effective and efficient in their strategic activities.
The importance of the efficient and effective use of resources was also pointed out

34
by Penrose (1959:54) who said that small businesses may achieve superior
performance not because they have better resources, but because they make
better use of these resources.
Since strengthening dynamic capabilities is a key concern for firms operating in a
turbulent environment, this study will also describe mechanisms by which this can
be achieved. The study will identify and quantitatively describe the dynamic
capabilities of small businesses operating in a turbulent environment. The study
will also differentiate these identified dynamic capabilities into those that can be
influenced by short term intervention strategies and those that require long term
intervention strategies. This differentiation of dynamic capabilities on this basis will
create a model that will show how innovative resource configurations can be
initiated and sustained in small businesses operating in a turbulent environment.
This will lead to the strengthening of the dynamic capabilities of these small firms,
i.e. the ability of these small firms to innovatively reconfigure its resources.
In small businesses, this is of particular importance since this sector has been
identified as a sector that is not performing optimally, and whose contributions
towards economic growth and development, fall short of expectations
(Stephenson, 2006:167), despite the fact that theoretically its characteristics are
favourable to turbulent environments.
This study will use the retail community pharmacy sector as a model sector to for
this study since it is a sector that comprises mainly of small businesses and is
currently experiencing environmental turbulence.
1.3 RESEARCH PROBLEM
The review of the literature in Chapter 2 describes the dynamic capabilities or
strategic processes that are required by organisations operating in turbulent
environments to enable them to innovatively reconfigure their resources. It also
highlights the characteristics of these small firms that favour these capabilities i.e.
flat and flexible structures; structural simplicity; streamlined operations; a lack of
structural inertia; entrepreneurial and risk oriented leadership; informal, dynamic
strategies; high innovatory potential; personalised management; the ability to seek
out protected market niches that are too small or not important enough for larger
firms and better customer service(Beaver and Jennings,2005:9; Davis, Hills and
LaForge, 1985:31; Hudson, Smart and Bourne, 2001:1096; Porter,1980;Hitt,
Hoskinsson and Harrison, 1991:7 and Boone and Kurtz, 1996:125 ). From this, it

35
is expected that small businesses despite their turbulent environments comprise a
sector that is the driving force of economic growth and job creation (Sunter, 2000:
23).
However, according to the then South African Minister of Trade and Industry, Alec
Erwin (Hudson and Darrol, 2003), the South African, small-business sector is
more than a decade away from where it should be. Furthermore, the Global
Entrepreneurship Monitor Survey (S.A, 2004:10) has found that South Africa
ranked 24th out of 34 countries in terms new business formation. From this it can
be seen that there is a business and management problem viz. “How to optimise
the performance of small businesses operating in a turbulent environment “
Since the literature review in Chapter 2, points out that the strengthening of the
dynamic capabilities of small firms operating in a turbulent environment will
increase their ability to be successful in these environments, it is therefore
important to be able to determine strategies to strengthen these capabilities. Thus
from this emerges the research problem viz. “How to strengthen the dynamic
capabilities of small businesses operating in a turbulent environment”.
According to the literature review in Chapter 2, two reasons that are often cited for
small business failures are the paucity of management skills and the paucity of
resources. Thus, effective strategies to reduce these failures revolve around two
dimensions : firstly, the organisation’s management capability and secondly, the
resource base of the firm ( Rindova and Taylor ,2002:6 ; Wilkes and Dale
,1998:731; Shin et al ,1998:10; Ahire and Golhar ,1996:1 and Welsh and
White,1981:18 ).
The findings relating to the management capability dimension are supported by
other surveys of small business failure which have also found that while
entrepreneurs often have good ideas and are competent, they do not know how to
run a business and have no underlying appreciation of business fundamentals
(Barron, 2000:1; Brink, 1997:364). Ligthelm and Cant (2002:1) also found that
deficiencies in its internal environment are the major cause of small and medium
enterprise failures. These deficiencies revolve around poor management skills. In
addition, Stephenson (2006:167) specifically highlighted that these firms also
suffer from a lack of management education.
The findings relating to the resource base dimension are also supported by other
studies that attribute the failure of small businesses to resource limitations (Wilkes
and Dale, 1998:731, Shin, Kalinowski and El-Enein, 1998:10 and Ahire and

36
Golhar, 1996:1). In addition, Welsh and White (1981:18) have also stated that
because small businesses are resource impoverished, they face significant
disadvantages when competing head-to-head against larger businesses.
Dodgson and Bessant (1997: 13) have defined resources as: “All the assets of the
firm - technological, financial, managerial and organisational -which enable firms
to operate in markets. They comprise more than tangible assets, and include the
intangible assets such as the skills and knowledge of the workforce”. From this
definition, it can be seen that whilst management capability has specifically been
cited as a reason for small business failure, it is also a small business resource.
Since small businesses are resource impoverished, strategies to strengthen the
dynamic capabilities of small businesses operating in a turbulent environment that
are directed at the level of management capabilities will achieve a quicker result
than strategies directed at the level of the general resource base of the firm. Since
management capabilities are also part of the resource base of the firm, increasing
management capabilities will also increase the resource base of the firm. In
addition, Kozan, Oksoy and Ozsoy (2006:114) have stated that by improving
management know-how, the resource aggregation capability of the small firm is
improved.
From this emerges the study’s proposed solution to the research problem and
hence the business and management problem viz. “A rational, specific and
targeted approach to strengthening the dynamic capabilities of small businesses
operating in a turbulent environment. This approach will be elucidated in a model
proposed by the study. The model will differentiate dynamic capabilities into those
that can be influenced by the shorter-term intervention strategy of specifically
increasing management capabilities and those that require the longer-term
strategy of altering the general resource base of these small firms. By using this
rational, specific and targeted approach to initiate and sustain the dynamic
capabilities of these small firms, their dynamic capabilities will be strengthened
and hence the performance of these small firms in turbulent environments,
optimised.”

37
FIGURE 1: THE MANAGEMENT AND BUSINESS PROBLEM, RESEARCH PROBLEM AND THE PROPOSED RESEARCH SOLUTION
BUSINESS &
MANAGEMENT PROBLEM
“How to optimise the performance of small businesses operating in a turbulent
RESEARCH PROBLEM
“How to strengthen the dynamic capabilities of small
businesses operating in a turbulent environment”
PROPOSED RESEARCH SOLUTION
“Develop a model that elucidates
strategies to initiate and sustain the dynamic capabilities of small businesses
operating in a turbulent environment.”

38
1.4 THE IMPORTANCE/IMPLEMENTATION APPROACH In order to investigate the research problem identified Section 1.3, this study’s
focus is on the level of importance and extent of implementation of strategic
processes of small businesses operating in a turbulent environment.
The examination of the allocation of resources by small businesses operating in a
turbulent environment to specific processes through their extent of implementation
will enable the determination of which processes receive the most resources,
which the least and which compete with each other for the scarce resources that
are available in these resource impoverished small firms
The examination of the management capability of small businesses operating in a
turbulent environment with respect to the innovative reconfiguration of resources
through the level of importance of each process will enable the determination of
which process the leadership of these small firms have the greatest capability in,
which the least and which, if there are differing levels of importance for the
processes, compete with each other for the scarce resources that are available in
these resource impoverished small firms.
Since dynamic capabilities deal with the innovative reconfiguration of resources,
management decisions to allocate scarce resources to specific processes will
determine the type and extent of innovative reconfigurations that take place. Thus
understanding how resources are allocated in small businesses operating in a
turbulent environment will enable the identification of those dynamic capabilities
that have a low level of resource allocation and which consequently need to be
strengthened.
This is supported by Adner and Helfat (2003: 1011), who have stated that
managerial decisions are acknowledged as some of the most critical antecedents
of capability transformation. Branzei and Vertinsky (2006:75) have also
emphasised that suitable strategic choices can help firms overcome the
constraints of their existing resource endowments by guiding the development of
extant skills and by facilitating the emergence of new capabilities. These strategic
manoeuvres can modify a firm’s current capability- development trajectory by
influencing the range and depth of external cues noticed the framing of these
stimuli as threats or opportunities for action, a firm’s speed of reaction, and/or the
specific actions taken in response (Branzei and Vertinsky, 2006:75).

39
The importance/implementation approach also lends itself to the determination of
whether the level of importance placed on a process affects its implementation. By
the use of appropriate statistical testing, as reported on in Chapter 3, the testing
for significance of difference between the level of importance and the extent of
implementation provides an indication of which processes may be influenced by
an alteration of the importance perception, and by extension the management
capabilities of small businesses operating in a turbulent environment. According to
Kozan, Oksoy and Ozsoy (2006:114) small business growth was positively
influenced by owner intensity, a construct of which importance placed on activity is
a component; and according to Korman (1970:31), the theory of work motivation
states that people will be motivated to behave and perform in a manner that is
consistent with their self-concept. Thus, the importance that a person places on a
skill affects that person’s behaviour.
Where there is no significant difference between the level of importance and
extent of implementation of these processes, the extent of implementation and by
extension their resource allocation, will be influenced by an alteration of the
importance perception, and by extension the management capabilities, of small
businesses operating in a turbulent environment.
The converse of this is that where there is a significant difference between the
level of importance and extent of implementation of these processes, the extent of
implementation and by extension their resource allocation, is uncoupled from the
importance perception, and by extension from their management capability. In
these instances, extent of implementation will be influenced by an alteration of the
general resource base.
Since the study’s envisaged solution to the research problem revolves around a
model that elucidates a rational, specific and targeted approach to initiate and
sustain the dynamic capabilities of small businesses operating in a turbulent
environment, the importance/implementation approach is a particularly suitable
and appropriate approach to this study as it enables the differentiation of dynamic
capabilities into those that can be influenced by the shorter-term intervention
strategy of specifically increasing management capabilities and those that require
the longer-term strategy of altering the general resource base of these small firms.

40
1.5 THE PURPOSE OF THE STUDY In order to achieve the envisaged solution to the research problem of this study,
the main purpose of the research is to investigate the strategic processes of small
businesses operating in a turbulent environment. The core elements of this
purpose comprises of:
1. The conceptual identification and the separation of dynamic capabilities
into those processes that are reconfiguration enabling processes and
those processes that are reconfiguration processes.
2. The conceptualisation of strategic processes or dynamic capabilities with
a specific set of measurable “best practice” processes that capture and
incorporate the idea of strategic processes or dynamic capabilities while
being grounded in empirical research.
3. The quantitative identification and description of the strategic processes or
dynamic capabilities of small businesses operating in a turbulent
environment and their resource allocation.
4. The development of a model that elucidates a rational, specific and
targeted approach to initiate and sustain the dynamic capabilities of small
businesses operating in a turbulent environment. The model will
differentiate dynamic capabilities into those that can be influenced by the
shorter-term intervention strategy of specifically increasing management
capabilities and those that require the longer-term strategy of altering the
general resource base of these small firms. By using this rational, specific
and targeted approach to initiate and sustain the dynamic
capabilities of these small firms, their dynamic capabilities will be
strengthened and hence the performance of these small firms in turbulent
environments will be optimised.

41
1.6 THE RESEARCH OBJECTIVES The research purpose of this study will be achieved through the attainment of the
following research objectives:
1. To quantitatively identify and describe the strategic processes of small
businesses operating in a turbulent environment.
2. To establish and quantify the level of importance of strategic processes in
these small businesses.
3. To establish and quantify the extent of implementation of strategic
processes in these small businesses.
4. To determine from the identified strategic processes, which processes
have statistically significant gaps between their level of importance and
extent of implementation and which have no significant gaps.
5. To quantitatively identify and describe how small businesses operating in
turbulent environments allocate their scarce resources to strategic
processes.
6. To differentiate between those strategic processes that can be influenced
by short term intervention mechanisms and those that require long term
intervention mechanisms.
7. To use the differentiated processes to form the basis of a model that
elucidates a rational, specific and targeted approach to initiate and
sustain the dynamic capabilities of small businesses operating in a
turbulent environment. By using this rational, specific and targeted
approach to initiate and sustain the dynamic capabilities of these small
firms, their dynamic capabilities will be strengthened and hence the
performance of these small firms in turbulent environments will be
optimised.
42
1.7 THE RESEARCH PROPOSITIONS The following research propositions will be comprehensively motivated for in
Chapter 2. The methodology describing the process of proposition formulation is
reported on in Chapter 3.
Proposition 1: If there is a positive correlation between the level of importance and extent of
implementation of strategic processes in small businesses operating in a turbulent
environment, then the extent of implementation of these processes will increase
with an increase in the level of importance of these processes in these small firms.
Proposition 2: If there is a positive correlation between the level of importance and extent of
implementation of reconfiguration enabling processes in small businesses
operating in a turbulent environment, then the extent of implementation of these
processes will increase with an increase in the level of importance of these
processes in these small firms.
Proposition 3: If there is a positive correlation between the level of importance and extent of
implementation of reconfiguration processes in small businesses operating in a
turbulent environment, then the extent of implementation of these processes will
increase with an increase in the level of importance of these processes in these
small firms.
1.8 THE DEMARCATION AND SCOPE OF THE STUDY
Since the literature review reveals a paucity of research on strategic processes of
small businesses operating in a turbulent environment, this study commences with
a qualitative, exploratory and descriptive approach. It then progresses to
quantitative analyses to enable the achievement of the research purpose and the
research objectives and to satisfy the research propositions. The following aspects
should be noted:
1. The study covers the theory on small businesses, strategic processes and
the dynamic capabilities of firms operating in turbulent environments as
revealed in the literature review.

43
2. Due to the paucity of research on the strategic processes of small firms
that operate in a turbulent environment, the study extends the theory on
dynamic capabilities of firms operating in turbulent environments to small
businesses. The following assumptions thus are made:
• The theory on dynamic capabilities of firms operating in turbulent
environments is applicable to small businesses.
• The strategic processes of small firms that operate in a turbulent
environment are the firm’s dynamic capabilities. Hence the terms
are used interchangeably in this study.
3. From the literature review, this study finds that dynamic capabilities
consist of reconfiguration processes and reconfiguration enabling
processes and that reconfiguration enabling processes lead to
reconfiguration processes that give rise to value –added strategies and
hence competitive advantage. This is a conceptually designed linkage.
This study will not test this linkage. The empirical testing of this linkage is
a recommendation made in this study in Chapter 6 for future studies.
4. There will be no empirical testing of the conceptually identified links
between management education and the importance perception of
managers, the importance perception of managers and the management
capability of the small firm, management capability of the small firm and
dynamic capabilities or the link between the resource base of the small
firm and dynamic capabilities. The empirical testing of these linkages are
recommendations made in this study in Chapter 6 for future studies.
5. The study will make no distinction between owner-led and manager-led
small businesses. A specific segmentation of small businesses into these
two categories and further testing is a recommendation made in this study
in Chapter 6.
6. The dimension of management capability that is investigated in this study
will be looked at solely from the view point of management skills and
knowledge of management practices and processes. An analysis of the
components of management capability and further testing on the impact
of each component on the reconfiguration of resources is a
recommendation made in Chapter 6.

44
7. The study will use the retail community pharmacy sector as a model
sector to describe the strategic processes of small businesses operating
in a turbulent environment as it is a sector that is currently experiencing
environmental turbulence and is comprised of mainly small businesses.
1.9 THE RESEARCH DESIGN Business research can be defined as a systematic investigation of phenomena of
interest to business decision makers. The use of scientific business research,
which is a specialized type of investigation characterized by the rigor of the
analytical tools and techniques applied, can result in research-based decision
making becoming an important tool for those organizations seeking competitive
advantage. Some of the defining characteristics of scientific business research
are:
• The purpose of the research must be clearly defined
• The research process must be detailed in a research proposal;
• The research design must be thoroughly planned
• The limitations must be frankly revealed
• The analysis of the data must be sufficiently adequate to reveal its
significance and the methods of analysis should be appropriate
• The findings must be presented unambiguously
• The conclusions must be justified
(Cooper and Schindler, 1998: 14-18)
The research purpose and the research objectives and the research propositions
are stated in this chapter as well as the scope and demarcation of the study and
the study limitations. The research design is also described in this chapter. In
chapter 2, research propositions are derived from scientific literature, as well as
from existing research. The research methodology is described in Chapter 3. The
qualitative and quantitative findings are presented in Chapter 4. The results are
discussed in Chapter 5 and these form the basis of and justify the conclusions
presented in Chapter 6.Research design is defined as a plan that shows, through
discussion, how the evidence will be used to make inferences (King, Keohane and
Verba, 1994:118).

45
1.9.1 THE TYPE OF STUDY
This research study will be a cross-sectional, formal, qualitative and quantitative
study. The qualitative aspect will be carried out via a series of personal interviews
while the quantitative aspect will use an ex post facto statistical design to
investigate the strategic processes carried out by small businesses operating in
turbulent environments.
Research serves many purposes. Some of the purposes of research are: to
explore, to describe; and to explain phenomena (Cooper and Schindler, 1998: 10;
Babbie, 1995:84).
Exploratory research gives insights into the research methods that could provide
the answers to research problems or hint at answers but seldom provides answers
to research questions. Exploration is usually the purpose when the subject is
relatively new, either in general or to the researcher (Babbie, 1995:8). Descriptive
research tries to discover answers to the questions who, what, when, where and
sometimes how. However, a descriptive study does not explain why an event
occurred or why the variables interact the way they do (Cooper and Schindler,
1998: 11). An explanatory study goes beyond description and attempts to explain
reasons for the phenomena that the descriptive study only observed (Cooper and
Schindler, 1998: 11-12).
This study will commence with an initial qualitative, exploratory approach since the
review of the literature reveals that the subject is relatively new. This research
study will also incorporate a quantitative, descriptive approach in that it seeks to
quantitatively identify and describe what specific strategic processes are important
to small business owners, and how they are implemented. Furthermore, this study
will also be explanatory and inferential, in that it will go beyond description to
achieve its envisaged solution to the research problem.
The study will also follow a theory –generating strategy, viz., the grounded theory
approach. In this approach, a study commences with loose definitions of the key
concepts and some speculative initial propositions. Observations are then made
and these are used to refine and redefine the initial concepts and propositions.
The process is repeated until what is held to be a robust interpretation is
generated (Curran and Blackburn, 2001:41).
46
1.9.2 THE PRIMARY DATA COLLECTION METHODOLOGY
Research designs can also be classified by the approach used to collect primary
data, viz. the observational approach or the communication approach. The
communication approach is questioning or surveying people and recording their
responses for analysis. Questioning is more efficient than observation and its
greatest strength as a primary data collecting technique is its versatility. Abstract
information of all types as well as opinions, attitudes, intentions, expectations and
information about events is often only available through questioning. However, the
major weakness of this approach is that the quantity and quality of information
secured depends heavily on the ability and willingness of the respondents to co-
operate (Cooper and Schindler, 1998:287).
This study used the communication approach – through questioning of the small
business owner – to obtain the required data with respect to the level of
importance and extent of implementation of strategic processes in small
businesses.
The communication approach of this study was dealt with both qualitatively and
quantitatively. The qualitative communication approach used the personal
interview technique (semi-structured), while the quantitative communication
approach used the self-administered mail survey technique.
The initial exploratory nature of this research required the depth of information and
detail that could be secured from personal interviews, which Cooper and Schindler
(1998:291), describe as the greatest strength of this technique, while the formal,
descriptive and explanatory nature of this research benefited from the self-
administered mail survey technique, which according to Cooper and Schindler,
(1998:304), enables anonymity and a greater geographical coverage.
Due to the paucity of information on the strategic processes of small businesses
operating in a turbulent environment, this study commences with a qualitative,
exploratory approach. This approach which uses the personal interview
methodology, provides several key themes which are then explored in the
literature and used as the basis for the questions in the instrument.
Furthermore, small businesses are organic and loosely structured, rather than
mechanistic and highly formalised. Thus, the processes in a small firm are seldom
readily visible (Beaver and Jennings, 2005:9). Therefore the qualitative approach
is an especially appropriate method with which to commence this study’s

47
investigative process. However, Beaver and Jennings (2005:9), also note that
despite this loose and less formal approach to management processes in small
businesses, certain essential management activities that have been defined and
refined throughout a long history of management research must be carried out.
Hence, this study has combined the qualitative approach with a quantitative
approach that uses identified “best practices” for small business excellence as its
basis. This approach is also supported by Cooper and Schindler (1998:309) who
state that using a mixed-mode of communication with respondents enables the
tailoring of the research method to suit the unique needs of a study.
1.9.3 THE RESEARCH PLAN
This study will follow a research plan in the nine stages outlined below:
Stage 1: The formulation of the research problem
The research problem to be investigated will be formulated from literature that
examined the background to the problem. This research stage is reported in
Chapter 1.
Stage 2 : The identification of the research purpose and the research objectives
Using the identified research problem, the research purpose and the research
objectives will be identified. This research stage is reported in Chapter 1.
Stage 3: The literature review
A detailed literature review will be performed on strategic processes, dynamic
capabilities, small business, quality, turbulent environment and changing
environment. This research stage is reported in Chapter 2.
Stage 4: The qualitative approach
An exploratory, qualitative investigation will be performed through the conduction
of personal interviews with six small business owners, all retail community
pharmacists. Key themes emerging from these interviews will inform the
questionnaire development process. This research stage is reported in Chapter 3.

48
Stage 5: The design of the instrument
Using the literature review and the key themes from the qualitative investigation, a
draft questionnaire will be developed to ensure that the research purpose and
objectives are achieved and the research propositions are satisfied and in so
doing, lead to a solution to the research problem. This questionnaire will be
evaluated by a panel of six experts, prior to being administered in the pilot study.
This research stage is reported in Chapter 3.
Stage 6: The pilot study
The pilot questionnaire will be distributed to ten respondents that are similar in
profile to the target population. The results of the pilot study will be analysed using
the SPSS 11.5 statistical package to ensure that the required validity and reliability
parameters are met. This research stage is reported in Chapter 3.
Stage 7: The development of the research propositions
Based on the literature review, the results of the expert panel evaluation, the
results obtained from the pilot study and the results of the qualitative analysis,
research propositions will be developed. This methodology of research stage is
reported in Chapter 3 and the research propositions and motivated for and
reported in Chapter 2.
Stage 8: The refinement of the final questionnaire and its administration
Based on the results of the pilot study, the final questionnaire will be refined and
then administered to the chosen sample of respondents. This research stage is
reported in Chapter 3.
Stage 9: Data Analyses
Quantitative statistical analyses will be performed on the returned questionnaires
using the SPSS 11.5 statistical package. These are reported in Chapter 4.

49
FIGURE 2: A FLOWCHART OF THE RESEARCH PLAN
STAGE 4 QUALITATIVE
ANALYSIS- PERSONAL INTERVIEWS
STAGE 3 LITERATURE REVIEW
STAGE 5 INSTRUMENT DESIGN
STAGE 8 DISTRIBUTION OF FINAL
QUESTIONNAIRE
STAGE 9 DATA ANALYSIS
STAGE 6 PILOT STUDY
STAGE 2 RESEARCH PURPOSE
RESEARCH OBJECTIVES
STAGE 1 RESEARCH PROBLEM
STAGE 7 RESEARCH
PROPOSITIONS
Theoretical Model

50
1.10 THE LIMITATIONS OF THE STUDY
The following are the main limitations of this study:
1. Only small firms, according to this study’s definition of small firms are
included in the study. This study recommends, in Chapter 6, that this
investigation be extended to small firms of different sizes.
2. The age of a firm or stage in its life cycle is not considered. This study
recommends in Chapter 6, that this investigation be extended to small
firms of different ages or stages in the life cycle.
3. The retail community pharmacy sector is used as a model sector to
examine the strategic processes of small firms that operate in a turbulent
environment. This is a highly regulated sector and these findings may
not be applicable to sectors of small firms that belong to unregulated
sectors. Chapter 6 recommends that this investigation be carried
in other small business sectors.
4. The study does not empirically test the conceptually identified links. The
empirical testing of these linkages are recommendations made in this
study in Chapter 6 for future studies.

51
1.11 THE OUTLINE OF THE THESIS CHAPTERS The chapters in this thesis are outlined as follows:
Chapter One:
This chapter introduces the study. It states the research problem, the research
purpose, the research objectives and the research propositions and explains its
use of the importance/implementation approach. This chapter also demarcates the
study, outlines the scope of the study, defines the research limitations and
explains the research design. The chapter outline is also given.
Chapter Two:
The literature is reviewed and propositions are motivated for in this chapter. Small
businesses are defined and characterised, strategic approaches in turbulent
environments are explored and the concept of dynamic capabilities is discussed.
A conceptual distinction is made between reconfiguration enabling processes and
reconfiguration enabling processes and the literature is searched for “best
practice" processes of performance excellence in small businesses. This leads the
discussion to the Malcolm Baldrige Quality Award criteria, which together with the
reconfiguration and reconfiguration enabling processes is used as a
comprehensive lens through which to view the strategic processes of small
businesses. A set of strategic processes for small businesses operating in a
turbulent environment are generated. This chapter also explains why the retail
community pharmacy sector is used as a model sector for this study. In his
chapter the importance of the study and the choice of the model sector are also
explored. The importance of the study is looked at from three perspectives: the
importance in the practice environment- small businesses, the importance to
management theory and the importance to the practice environment-retail
community pharmacy.
Chapter Three: This chapter indicates the research stages and the research elements. The
methodology used for theory building and proposition development is also
explained. It also describes the qualitative and quantitative approaches to this
study. The design of the questionnaire, nature of measurement, the soundness of
the measurement and sampling and population elements are detailed. The pilot

52
study methodology and results are reported here. The approaches that the study
uses to prepare and analyse the data are also described in this chapter.
Chapter Four:
The data is analysed and the results are presented in this chapter.
Chapter Five:
The chapter commences with a broad description of the strategic processes of
small businesses that operate in a turbulent environment and proceeds with an
initial examination of the importance – implementation gap at the general level,
then an examination at the process cluster level and then finally an examination at
the individual process level. The results obtained from these analyses show a
clear picture of the resource allocation and the resource allocation drivers in small
businesses operating in a turbulent environment.
Chapter Six:
In this chapter the major findings of the study are presented and the
recommendations for future research are highlighted.
Annexures:
The annexures that are attached to this thesis after chapter 6, contain the pilot
questionnaire, the final questionnaire, all the relevant data obtained from the
analysis of these questionnaires and the list of references used.

53
1.12 THE CHAPTER CONCLUSIONS This chapter introduced the study, stated the research problem, the research
objectives and the research propositions, explained the study’s use of the
importance/implementation approach, demarcated and outlined the scope of the
study, defined the research limitations, explained the research design and
provided the thesis chapter outlines.
The next chapter will review the literature to provide a theoretical background to
the study and motivate for and justify the propositions developed.

54
CHAPTER TWO LITERATURE
REVIEW

55
CHAPTER 2: THE LITERATURE REVIEW
2.1 THE CHAPTER SUMMARY
The aims of this chapter were to review the literature review to provide a
theoretical background to the study and motivate for and justify the propositions
developed.
This literature review chapter commenced with the definition and characterisation
of small businesses. Turbulent environment were defined and strategic
approaches to these turbulent environments were then explored. The literature
indicated the inadequacy of traditional strategic processes in turbulent
environments and pointed to the need for new strategic processes that would
enable the continuous adaptation, innovation and reconfiguration of resources to
create value-adding strategies and competitive advantage; a perspective
consistent with the dynamic capabilities view.
In general, the literature review revealed a paucity of literature and research on
the strategic processes of small businesses operating in a turbulent environment.
Nonetheless, since the literature on dynamic capabilities indicated that there are
“best practices“ in the execution of dynamic capabilities, “best practices” for
excellence in small business excellence were identified in the Malcolm Baldrige
Quality Award Criteria.
To obtain clarity about what dynamic capabilities really are, the literature was
searched to extract relevant and cohesive themes that would enable the
conceptual separation of dynamic capabilities into reconfiguration enabling
processes and reconfiguration processes. The literature identified the processes
of “patching” and “co-evolving” as reconfiguration processes. Four reconfiguration
drivers were also identified viz.: environment and opportunity sensing, knowledge
acquisition and learning, co-ordination and regulation and alignment and
integration. These reconfiguration drivers were found to be embodied in the “best
practices “ of the Malcolm Baldrige National Quality Award Criteria.
Using the identified reconfiguration enabling processes, reconfiguration processes
and themes that emerged from the personal interviews, this chapter synthesised a
set of strategic processes for small businesses operating in a turbulent
environment. This set of strategic processes was used as the basis for the
questionnaire to be distributed to the respondents of this study.

56
The literature was also reviewed to provide support for the propositions that were
generated, using the methodology described in Chapter 3.
A general synthesis of the literature also revealed the importance of the study in
the practice environment for the small business and for small business theory and
the general body of management theory.
The environmental turbulence created in the retail community pharmacy sector by
the new pricing structures, single exit prices, the opening of ownership of
pharmacies to persons other than pharmacists, the creation of designated service
providers by service payers and the issue of dispensing licences to healthcare
professionals who are not pharmacists, provided justification for the use of this
sector to model the strategic processes of small businesses operating in a
turbulent environment. The importance of the study to this sector was also
explained, in terms of increasing the knowledge of how resources are
reconfigured in this sector, in the light of this sector’s duality viz. its focus on
professionalism versus its focus on mercantilism.

57
2.2 INTRODUCTION According to Mouton (2001:87) and De Vos (2002:128), literature reviews are an
integral part of empirical research. A review of literature and research on similar
topics enables exposure to the most recent and authoritative theorizing and
empirical findings applicable to the subject being researched as well as the
prevention of duplication of previous studies. It is only after the establishment of
what others have done and after the engagement of subsequent research that a
researcher may contribute to new academic knowledge (Mouton & Marais,
1996:161 and Babbie, 1998:147).
In this study, new refers to:
The conceptual identification and the separation of dynamic capabilities
into those processes that are reconfiguration processes and those
processes that are reconfiguration enabling processes ;
The conceptualisation of strategic processes or dynamic capabilities with
a specific set of measurable “ best practice” processes that capture and
incorporate the idea of strategic processes or dynamic capabilities and
that are grounded in empirical research;
The quantitative identification and description of the strategic processes or
dynamic capabilities of small businesses operating in a turbulent
environment and their resource allocation;
The development of a model that elucidates a rational, specific and
targeted approach to initiate and sustain the dynamic capabilities of small
businesses operating in a turbulent environment. By using this rational,
specific and targeted approach to initiate and sustain the dynamic
capabilities of these small firms, their dynamic capabilities will be
strengthened and hence the performance of these small firms in turbulent
environments will be optimised.
The literature review did not reveal any prior study of this nature both nationally, in
South Africa as well as internationally.
The theoretical information required for this study was obtained through a
literature search using both hard copy and electronic media. The choice of
literature databases that was searched was based on the level of appropriateness

58
of the databases to the topics being reviewed. Validation by peer review, purpose,
scope, authority and format formed the basis of evaluation of the content of each
source prior to the inclusion of these secondary and tertiary data sources in the
literature review.
The following electronic journal databases were used extensively:
ABI/Inform Global (Proquest )
Academic Search Premier ( Ebsco Host)
Business Source Premier ( Ebsco Host )
Academic Research Library ( Proquest)
General Business File International ( Gale Group)
Emerald
Swetswise
Elsevier
Using keyword search queries, Boolean logic was used for the research keywords
and key phrases - strategic processes, dynamic capabilities, small business,
quality, turbulent environment and changing environment.
2.3 SMALL BUSINESSES 2.3.1 THE DEFINITION OF A SMALL BUSINESS
Researchers and policymakers describe small firms in different ways. Robinson
and Pearce (1984:80) found that firms could typically be defined on the basis of
either annual sales or number of employees and that even between these two
measures there is wide variability, in that the definition a small business can range
anywhere from one to 200 employees; while Keats and Bracker (1988:41) found
that on the measure of annual sales, researchers define small businesses as
those businesses with a turnover falling in the range from under $150 000 to less
than $150 million.
A small business is broadly defined by the U.S. Small Business Administration
(SBA, 2004) as “one that is independently owned and operated, and which is not
dominant in its field of operation” and on a more detailed level, as one that is
organised for profit, has a place of business in the United States, makes a
significant contribution to the U.S.economy by paying taxes or using its products,
material or labour and does not exceed the numerical size standard for its

59
industry. It further defines a small business in the retail trade as one that has a
turnover of less than $6 million.
In South Africa, the White Paper on small business, published by the Department
of Trade and Industry, was tabled in Parliament in 1995. Its main objective is to
regulate, stimulate and promote small business activities in South Africa. The
White Paper (RSA,1995) defines a small business as an established business
employing between 4 and 49 workers assumed to be formally registered, clearly
demarcated and paying taxes on a regular basis; and a micro-enterprise as one
which employs between 1 and 4 workers and has a turnover less than the value
added tax registration limit. The South African National Small Business
Amendment Bill, defines a small business in the retail sector as having a total full-
time equivalent of paid employees of 50 or less, a very small business as having
20 or less and a micro business as having 5 or less (RSA, 2003).
Thus it can be seen that a common, definitive description, used internationally and
by both research and practice, does not seem to exist. For the purposes of this
research, a small business shall be defined as a business employing less than 50
workers, assumed to be formally registered, clearly demarcated and paying taxes
on a regular basis.
2.3.2 THE CHARACTERISTICS OF A SMALL BUSINESS
While small businesses do have features in common with large organisations,
they also have unique characteristics and attributes that are reflected in the
manner in which they are lead, organised and managed. According to Curran and
Blackburn (2001:5), smaller businesses are not just smaller versions of bigger
businesses. They have pointed out that small businesses deal with unique size-
related issues, behave differently in their analysis of and interaction with, their
environment and have distinct and key characteristics that differentiate them from
the majority of their larger counterparts. Briefly summarized, these characteristics
indicate that small businesses have:
♦ flat and flexible structures;
♦ structural simplicity;
♦ streamlined operations;
♦ a lack of structural inertia;
♦ entrepreneurial and risk oriented leadership;

60
♦ informal, dynamic strategies;
♦ high innovatory potential;
♦ personalised management;
♦ the ability to seek out protected market niches that are too small or not
important enough for larger firms and better customer service; as well as
♦ poor management; and
♦ severe resource limitations
(Beaver and Jennings,2005:9; Davis, et al, 1995:31; Hudson et al, 2001:1096;
Porter,1980;Hitt, Hoskinsson and Harrison, 1991:7 and Boone and Kurtz,
1996:125 ).
According to Ivanova and Gibcus (2003:12), the small firm’s economic success,
once founded, is determined by the available resources and the specific
managerial capabilities. Thus, effective strategies to reduce these failures revolve
around two dimensions : firstly, the organisation’s management capability and
secondly, the resource base of the firm ( Rindova and Taylor ,2002:6 ; Wilkes and
Dale ,1998:731; Shin et al ,1998:10; Ahire and Golhar ,1996:1 and Welsh and
White,1981:18 ).
The findings relating to the management capability dimension are supported by
other surveys of small business failure which have also found that while
entrepreneurs often have good ideas and are competent, they do not know how to
run a business and have no underlying appreciation of business fundamentals
(Barron, 2000:1; Brink, 1997:364). While, a number of authors have also argued
that key components in the success/growth of small firms are the competencies,
skills and knowledge of their managers (Hendry et al., 1991; Marshall et al., 1995),
there is also evidence to suggest that levels of skills in small firm managers are
often lacking (Sisson and Storey, 1988; Stanworth and Gray, 1991; Vickerstaff,
1992; Goss and Jones, 1992). Ligthelm and Cant (2002:1) have found that
deficiencies in its internal environment are the major cause of small and medium
enterprise failures. These deficiencies revolve around poor management skills. In
addition, Stephenson (2006:167) specifically highlighted that small firms also
suffer from a lack of management education.
The findings relating to the resource base dimension are also supported by other
studies that attribute the failure of small businesses to resource limitations (Wilkes
and Dale, 1998:731, Shin, Kalinowski and El-Enein, 1998:10 and Ahire and
Golhar, 1996:1). In addition, Welsh and White (1981:18) have also stated that

61
because small businesses are resource impoverished, they face significant
disadvantages when competing head-to-head against larger businesses.
Dodgson and Bessant (1997: 13) have defined resources as: “All the assets of the
firm - technological, financial, managerial and organisational -which enable firms
to operate in markets. They comprise more than tangible assets, and include the
intangible assets such as the skills and knowledge of the workforce”. From this
definition, it can be seen that whilst management capability has specifically been
cited as a reason for small business failure, it is also a small business resource.
2.4 A TURBULENT ENVIRONMENT
According to Andrews (Andrews in Mintzberg & Quinn, 1992: 47), the environment
of an organization in business is said to be “the pattern of all the external
conditions and influences that affect its life and development”.
Turbulence can be caused by the state of, and interaction between, environmental
factors. For example, Samli (1993) has said that turbulence is caused by a
combination of environmental factors such as business cycles, sudden economic
disturbances (for instance, oil crises), mergers leading to oligopolies, growth in
importance of information over production, the concentration of economic and
political power in the hands of a few, changing consumer lifestyles and behaviour
and the downsizing trend in business. This is supported by Nilson (1995) who has
also maintained that turbulence is sometimes caused by an industry’s strategic
assets being undermined, for example a legal monopoly or dominance due to high
entry costs or protection by legislation being removed. An example of this is the
Government breaking up a legal monopoly as has happened in the retail
community pharmacy sector. This is reported on later in this chapter.
In defining turbulence, some researchers (Cronje et al., 1997; Conner, 1998;
Vorhies, 1998), concentrate only on the dynamism in the environment. This
involves rapid and unexpected changes in the organization’s environmental sub-
dimensions such as technology, customers, competitors, government regulations
and new product launches. Dynamism also implies that an organization can not
plan only relying on historical data, as they used to. Instead, the organization acts
in an environment, where it instead has to foresee what will happen in the future
and act accordingly. Brooks and Weatherston (1997) also found that dynamism is
an inherent condition of an environment, that is, it is continually changing, but the
extent of this change varies for different organizations or environments.

62
Cronje et al. (1997) have stressed that a stable environment does not change
much, and when it does change, the change is predictable; but in a turbulent
environment, on the other hand, there are many unexpected changes. Sadler has
also emphasized change and dynamism in a turbulent environment by saying that
a turbulent environment is “an environment characterized both by several changes
occurring rapidly and simultaneously and by a situation where only the most
optimistic see the possibility of a return to a more stable environment in the
foreseeable future” (Sadler, 1996 p. 21). In the retail community pharmacy sector,
there are several changes occurring rapidly and simultaneously viz. a new pricing
structure at the retail level, single exit price at the manufacturer level, a
discontinuance of discounts in the supply chain, the allowing of ownership of retail
community pharmacies by persons other than pharmacists, the creation of
designated service providers by service payers and the issuing of dispensing
licenses to healthcare professionals who are not pharmacists. This causes
turbulence in the environment of the retail community pharmacy sector.
Other approaches to defining turbulence incorporate a second parameter together
with dynamism i.e. the parameter of complexity (Johnson & Scholes, 1999). This
second parameter, complexity, indicates that the environment is difficult to
comprehend for an organization and that it consists of sophisticated technology
and a high rate of diversity (Johnson & Scholes, 1999). Complexity has also been
defined as the measure of heterogeneity or diversity in the environment, that is,
the degree to which environmental factors are many and different. These factors
include customers, suppliers, competitors and socio-political and technological
environments (Chae and Hill, 1997:3; Chakravarthy, 1997:69; Lane and Maxfield,
1996:215).This is again illustrated in the retail community pharmacy sector by a
new pricing structure at the retail level, single exit price at the manufacturer level,
a discontinuance of discounts in the supply chain, the allowing of ownership of
retail community pharmacies by persons other than pharmacists, the creation of
designated service providers by service payers and the issuing of dispensing
licenses to healthcare professionals who are not pharmacists.
Other researchers, such as Brooks and Weatherston (1997), Chakravarthy
(1997:69), Malhotra (1996) and Smith et al. (1999:637) have also defined
environmental turbulence as a function of the complexity in the environment it
faces and the dynamism and uncertainty in that environment.
These definitions of turbulence that incorporate both dynamism and complexity,
are based on Emery and Trist’s (1965) causal texture of organizational
environments and they incorporate the two key factors – dynamics and complexity

63
– that are related to environmental change. Emery and Trist, (Emery & Trist in
Dessler, 1992), in their classification of environment categories, have described
the category, turbulent field, as one of high complexity and rapid changes.
A synthesis of the foregoing elements, leads to a definition of turbulence as, “a
dynamic, complex, and unpredictable condition that is subject to both rapid and
multi-dimensional change”
Volberda (1997:169) has emphasised two challenges for firms to solve when
performing in a turbulent environment. The first is organizational design and the
second is the management challenge. In terms of the organizational design,
Brown and Eisenhardt (1998) have stated that mechanistic organizations are too
structured to allow essential change to happen, while Pascale (1999:83) and
Volberda (1997:169) have said that organizations must become less hierarchical.
This is emphasised by Chakravarthy (1997:69), Pascale (1999:83), and
Tetenbaum (1998:21), who have suggested that organizations should be
decentralized or flattened to enable them to become more innovative and open to
learning. In addition Tetenbaum(1998:21) has also emphasized the idea of
flexibility in organizations operating in a turbulent environment.
These organizational features have been pointed out in the characteristics of small
firms in the previous section 2.3.2 which indicated that small businesses have flat
and flexible structures; structural simplicity; streamlined operations; a lack of
structural inertia and high innovatory potential. However even though small
businesses have feature which have been identified as conducive to operating in
a turbulent environment; the small business sector has been identified as a sector
that is not performing optimally, and whose contributions towards economic
growth and development, fall short of expectations (Stephenson, 2006:167).
Thus, following Volberda’s (1997:169) suggestion, an appropriate organizational
structure is not enough when coping with a turbulent and rapidly changing
environment. The small firm must also solve the management challenge.
According to Crossan, White, Lane and Klus (1996:20) and Hamel (1995:22),
traditional strategic processes are inadequate in a turbulent environment; and this
type of behaviour causes organisations to be less effective. Turbulence in the
environment thus increases the importance of three key strategic processes. First,
according to Chakravarthy (1997: 69), conduct among competitors becomes less
orderly and more difficult and thus normal strategic processes are inadequate.
Second, according to Haleblian and Finkelstein (1993:844), the need for

64
information increases as the environment grows more turbulent and decision-
making becomes more difficult. Third, the need for innovation throughout the
organization grows as turbulence increases, since it becomes less possible to
predict customer, product and service requirements (Pine, Victor and Boynton,
1993:108; Achrol, 1991:77). Thus, in a turbulent environment, the windows for
decision-making are shorter, the risk of obsolescence is greater and long-term
control is impossible. As a result managers have to learn new ways of operating
in a turbulent environment (Davis, Morris and Allen, 1991:43).
According to Miller (1996:485), the “learning manager” acquires new knowledge
and is able and willing to apply that knowledge in making decisions or influencing
others in the organisation. Beaver and Jennings (2005: 11) describe the small
business the owner as an individual who establishes and manages a business for
the primary purpose of furthering personal goals and to whom the business is a
primary source of income and which consumes the majority of his/her time and
resources. Thus, such a profile would fit the willing part of Miller’s definition. In
order to meet the “able “ part of the definition of a “learning manager “,
management capabilities are then critical.
Furthermore, a number of authors have argued that key components in the
success/growth of small firms are the competencies, skills and knowledge of their
managers (Hendry et al., 1991; Marshall et al., 1995:73) and there is also
evidence to suggest that levels of skills in small firm managers are often lacking
(Sisson and Storey, 1988:3; Stanworth and Gray, 1991; Vickerstaff, 1992:1; Goss
and Jones, 1992:13).
The next section will examine the strategic processes of businesses operating in a
turbulent environment.
2.5 STRATEGIC PROCESSES IN A TURBULENT ENVIRONMENT
2.5.1 TRADITIONAL STRATEGIC PROCESSES
Conventional and traditional approaches to strategy focus on the question “Where
do you want to go?" first, and then “How do you want to get there?” These
approaches to strategy entail the selection of attractive markets, choosing a
defensible strategic position and building core competencies (Eisenhardt,
1999:65). However, in turbulent markets particular strategic positions are quickly
eroded and strategic planning can become irrelevant, so the traditional concept of

65
strategic processes has become inadequate for better performance. In these
markets it is impossible to predict which competencies or strategies will be
successful and for how long.
Traditional approaches to strategy also emphasise strategic positioning by
acquiring or building valuable resources as the basis of creating sustained
competitive advantage and superior, long – term performance. The importance of
resources, which includes physical, human and organisational assets that have
been used to implement value - creating strategies, is the core of the resource-
based view (Kylaheiko, Sandstrom and Virkkunen, 2002:65; Barney, 1986: 656
and Wernerfelt, 1984:171, 1995:171). In this view, resources form the basis of
unique value-creating strategies and their related activity systems that address
specific markets and customers in distinctive ways, and in so doing, lead to
competitive advantage – for example core competencies (Prahalad and Hamel,
1990:79) and configurations (Collis and Montgomery, 1995:118,1998:70 ;
Porter,1996:61).
However, Lopez (2005:661) and Eisenhardt and Martin (2000:1105) have pointed
out that the resource-based view of the firm does not adequately explain how and
why some firms achieve competitive advantage in turbulent markets. Eisenhardt
and Martin (2000:1105) have also stated that the resource-based view
misidentifies the locus of long-term competitive advantage in turbulent markets
markets, overemphasises the strategic logic of leverage and reaches a boundary
condition in these markets.
Thus, in a turbulent environment, traditional strategic approaches are inadequate
and this type of behaviour causes organisations to be less effective (Crossan,
White, Lane and Klus, 1996:20 and Hamel, 1995:22). Therefore the strategic
processes used by businesses operating in a turbulent environment must enable
the organisation to re-allocate available resources as priorities and demands
change (Fowler et al, 2000:357) as well as be able to continuously adapt,
innovate, and even change themselves in order to survive and thrive in evolving
market conditions (Eisenhardt and Tabrizi, 1995:84; Galunic and Eisenhardt,
2001:1229).
66
2.5.2 NEW STRATEGIC PROCESSES
Today’s business environment is probably the most dynamic that any business
has faced (O’Regan and Ghobadian, 2005:81). Eisenhardt and Brown (1999:72),
have pointed out that in volatile markets, corporate strategy should focus on
strategic processes more than on strategic positioning. In these markets, it is
impossible to predict which competencies or strategies will be successful and for
how long. The implication is that it is more important to build corporate-level
strategic processes that enable dynamic strategic repositioning than it is to build
any particular defensible position. These new strategic processes turn on change
and add economic value by enabling managers to mobilise and reconfigure
corporate success to capture market opportunities faster than the competition.
In turbulent markets competitive advantage can be gained by creating a series of
temporary advantages. The strategic logic here is that of opportunity sensing
(Lengnick-Hall and Wolff, 1999:1109). Sexton and Smilor (1997) describe this
process as the creation and recognition of opportunities as well as the pursuit of
those opportunities by turning them into wealth creating businesses during a
limited window of time.
From Section 2.5.1, it can be seen that in turbulent environments there is a need
for the changing of traditional rules, business models and ways of thinking. This
re-invention of industries and business models is about the creation of new
bundles of products and services and the re-structuring of value chains. According
to Linder, Jarvenpaa and Davenport (2003:43) innovation is the implementation of
new ideas that create value and according to Hamel (1997:70), strategic-
innovation is the ability to reinvent the basis of competition within existing
industries and to reinvent entirely new industries. Strategic innovativeness is thus
a major success factor for businesses operating in a turbulent environment
(Recklies, 2001: 3).
Jansen, Van den Bosch and Volberda (2005:351) have echoed these trends of
thought in their concept of organisational ambidexterity, which describes the ability
of a firm to pursue exploratory and exploitative innovations simultaneously. This
they say is crucial to firm survival. Successful innovations are thus the results of a
deliberate search for and a high alertness to new opportunities (Wiklund and
Shepherd, 2005:71; Hausman, A, 2005:775). The values created by innovations
are often manifested in new ways of doing things and processes that contribute to
wealth. By implication, then, the failure to innovate is likely to result in reduced
competitiveness (O’Regan and Ghobadian, 2005:81).

67
Since innovation enhances the competitiveness of firms (Neely and Hii, 1998) in
dynamic environments, firms should have the capabilities to innovate (Nelson and
Winter, 1982; Zollo and Winter, 1999:339; Teece et al, 1997:509). Therefore the
strategic processes used by businesses operating in a turbulent environment must
enable the organisation to continuously adapt, innovate, and even change
themselves in order to survive and thrive in evolving market conditions (Eisenhardt
and Tabrizi, 1995:84, Galunic and Eisenhardt, 2001:1229) as well as be able to
re-allocate available resources as priorities and demands change (Fowler et al,
2000:357). This perspective is consistent with what is termed by the literature as
dynamic capabilities. According to Branzei and Vertinsky (2006:75), sustained
innovativeness depends on each firms set of dynamic capabilities. From a
Schumpeterian perspective, dynamic capabilities enable a firm to innovate and
make that innovation profitable over and over again (Schumpeter, 1934).
2.5.2.1 DYNAMIC CAPABILITIES
While the exact nature of dynamic capabilities is still not yet well understood, their
visible outcome is the transformation of existing resources into new functional
competencies that better match the environment (Arthurs and Busenitz,2006:195;
Eisenhardt and Martin, 2000:1105). This view of dynamic capabilities has its
genesis in Schumpeterian competition (Schumpeter, 1934), where competitive
advantage is based on the creative destruction of existing resources and the novel
reconfiguration of new, and potentially rent-generating functional competencies.
The emerging literature on dynamic capabilities draws on the resource-based view
of the firm (Lopez, 2005:661; Wu, 2005; Dutta, Narasimhan and Rajiv, 2005: 277;
Kylakeiko, Sandstrom and Virkunnen,2002: 65; Branzei and Vertinsky, 2006:75;
Knudsen and Madsen, 2002:475; Hayes et al, 1998; Itami, 1987; Iansiti, 1994:557;
Teece and Pisano, 1994:537; Kogut and Zander, 1992:383; Nelson and Winter,
1982; Teece et al, 1997:509) which states that the firm’s resources are an
essential structure for innovation. The dynamic capabilities view is an extension
of this resource-based view (Makadok, 2001:487). The resource-based view
emphasises the selection and accumulation of synergistic combinations of
resources (Barney, 1991:771) and the dynamic capabilities view stresses the
reconfiguration of existing resources into new functional competencies (Arthurs
and Busenitz, 2006:195; Eisenhardt and Martin, 2000:1105; Teece et al,
1997:509).

68
According to Eisenhardt and Martin (2000:1107) some dynamic capabilities
integrate resources; some are related to the gain and release of resources while
some focus on the reconfiguration of resources. Zollo and Winter (1999: 10) have
offered the definition of dynamic capabilities as “a learned pattern of collective
activity through which the organization systematically generates and modifies its
operational routines” while Galunic and Eisenhardt (2001:1229) have argued that
the existence of dynamic capabilities is assumed without specifying the particular
processes that form these capabilities.
Dynamic capabilities have also been described as the drivers behind the
creation, evolution and reconfiguration of other resources into new sources of
competitive advantage (Henderson and Cockburn, 1994: 63; Teece et al, 1997:
509); while Eisenhardt and Martin (2001: 1107) have specifically defined dynamic
capabilities as the “firm’s processes that use resources – specifically the
processes to integrate, reconfigure, gain and release resources – to match
and even create market change. Dynamic capabilities thus are the organisational
and strategic routines by which firms achieve new resource configurations as
markets emerge, collide, split, evolve and die “. The literature also refers to
dynamic capabilities as complex and tacit (Dierickx and Cool, 1989:1504),
causally ambiguous, difficult to observe (Simonin 1999:595) and difficult to
conceptualize, operationalise and measure (D'Adderio 2001: 1409).
However, while these descriptions stress the importance of reconfiguring existing
resources into new configurations of functional competencies and view
reconfiguration as the ultimate outcome of dynamic capabilities, the conceptual
ambiguity surrounding the idea of dynamic capabilities leads to a blurring between
the reconfiguration enabling processes and the actual reconfiguration processes
that lead to innovative resource reconfigurations and value-added strategies.
There is a lack of clarity about the nature of dynamic capabilities, and even
disagreement about whether such capabilities even exist (Winter, 2003: 991). This
makes it imperative to introduce a greater clarity about their content, domain,
conceptualization, and operationalisation.
Therefore the following section will first conceptually distinguish between the
reconfiguration enabling processes and the actual reconfiguration processes that
lead to innovative resource reconfigurations and value creating strategies. The
next section will show how dynamic capabilities are linked to competitive
advantage in turbulent environments and thereafter, following the logic of
Eisenhardt and Martin(2000:1107) who have specifically stated that “ dynamic
capabilities actually consist of identifiable and specific routines that often have
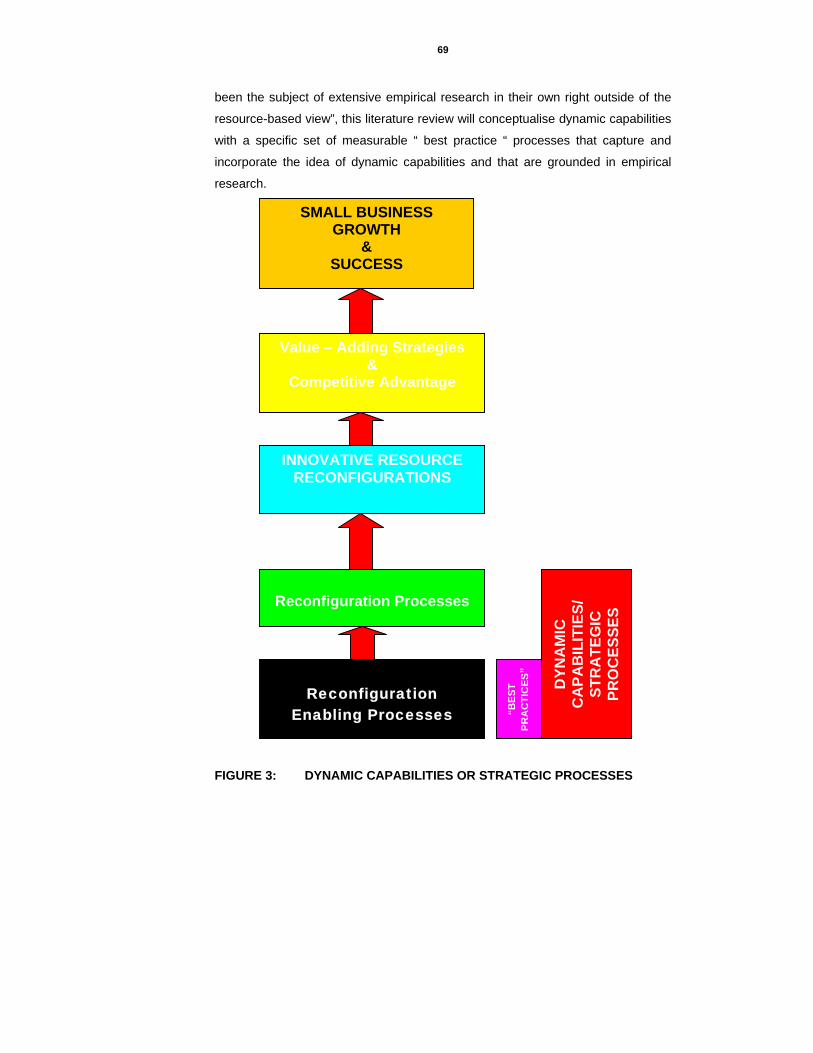
69
been the subject of extensive empirical research in their own right outside of the
resource-based view”, this literature review will conceptualise dynamic capabilities
with a specific set of measurable “ best practice “ processes that capture and
incorporate the idea of dynamic capabilities and that are grounded in empirical
research.
FIGURE 3: DYNAMIC CAPABILITIES OR STRATEGIC PROCESSES
Reconfiguration Processes
Reconfiguration
Enabling Processes
DYN
AM
IC
CA
PAB
ILIT
IES/
ST
RA
TEG
IC
PRO
CES
SES
“BES
T PR
AC
TIC
ES”
INNOVATIVE RESOURCE RECONFIGURATIONS
Value – Adding Strategies &
Competitive Advantage
SMALL BUSINESS GROWTH
& SUCCESS

70
2.5.2.1.1 THE RECONFIGURATION PROCESS
The reconfiguration process is the innovative redeployment of existing resources
into a new set of functional competencies (Abernathy and Clark, 1985:3;
Henderson and Clark, 1990:9).
For example, Eisenhardt and Martin (2000:1107), have introduced the processes
of patching and co-evolving:
Patching the business portfolio, means the frequent re-mapping or re-
structuring the enterprise in order to fit changing market opportunities. By
dynamically adjusting the business in order to match changing market
opportunities, managers are directed toward high-potential businesses,
activities or products, uncovering the profit levers that drive effective strategy
of those businesses, and creating economic value for the enterprise.
Restructuring can take the form of combining, adding, splitting, exiting or
transferring.
Coevolving is a subtle strategic process, involving the creation of a flexible
business portfolio with both collaborative and competitive units and a superior
strategy based on cross-business synergies in performing business activities.
The reconfiguration process deploys superior new configurations of functional
competencies that better match the environment.
2.5.2.1.2 RECONFIGURATION ENABLING PROCESSES
The idea of enabling processes to facilitate reconfiguration is consistent with the
view of dynamic capabilities as tools that underlie the ability to create new
configurations (Galunic and Eisenhardt, 2001:1229). Four key drivers of
reconfiguration (Table 1) have been identified from the dynamic capabilities and
related literatures. They are environment and opportunity sensing, knowledge
acquisition and learning, co-ordination and regulation and alignment and
integration.

71
ENVIRONMENT AND OPPORTUNITY SENSING
This helps to identify market needs and spot new opportunities (Zahra and
George, 2002:185). It is the process of generating, disseminating and
responding to market intelligence about customer needs (Jaworski and Kohli,
1993:53; Kohli and Jaworski, 1990:1). By generating market intelligence,
(Sinkula, 1994: 35; Slater and Narver, 1995: 63) market trends are sensed
and new market opportunities are discovered (Galunic and Rodan,
1995:1193). By disseminating market intelligence, it is propagated, analysed
and interpreted (Kogut and Zander, 1996:502). By responding to market
intelligence, plans to capitalise on market intelligence are initiated, developed
and capitalised on (D’Aveni, 1994).
KNOWLEDGE ACQUISITION AND LEARNING
This builds new thinking, generates new knowledge and enhances existing
resources (Zollo and Winter, 2002:339). It reflects the ability to learn by
assimilating, transforming and exploiting existing knowledge resources to
generate new knowledge (Cohen and Levinthal, 1990:128; Zahra and George,
2002:185). By assimilating knowledge, knowledge articulation and codification
occurs (Zander and Kogut, 1995:76). By transforming knowledge new thinking
is generated (Henderson and Cockburn, 1994:63), and brainstorming and
experimentation (Pisano, 1994:85), innovative problem-solving (Iansiti and
Clark, 1994:557; Kim, 1998:506) and variation (Zott, 2003:97) can take place.
By exploiting knowledge new initiatives can be pursued (Van den Bosch et
al.1999:551) and new solutions identified (Zott, 2003:97).
CO-ORDINATION AND REGULATION
This helps to allocate resources, assign tasks and synchronise activities
(Teece et al, 1997:509). By allocating resources the distribution and
assigning of knowledge and resources can occur (Burgelman, 1994:24;
Okhuysen and Eisenhardt, 2002:370). By assigning tasks the appointing of
the right person to the right unit can take place (Eisenhardt and Brown,
1999:72). By synchronising activities the management of dependencies
among resources and tasks to create new ways of performing a desired set of
activities (Crowston, 1997:157; Malone and Crowstone, 1994:87) and the
implementation of a set of complex activities by specifying the organisational
principles by which individual knowledge is integrated (Grant, 1996:109) can
occur.
72
For example, Eisenhardt and Sull (2001:107) have proposed the formulation
of simple rules which regulate the flows of strategic processes and define
desirable courses of action. Simple rules establish a strategic frame to help
managers efficiently seize fleeting opportunities. These simple rules fall into
five broad categories:
1. How-to rules – spell out key features of how a process is
executed.
2. Boundary rules – delineate boundary conditions that help
managers sort through many opportunities quickly and efficiently
and focus managers on which opportunities can be pursued and
which are outside the pale.
3. Priority Rules – help managers rank the accepted opportunities
4. Timing Rules – set the rhythm of key strategic processes and help
synchronise the enterprise with the pace of emerging
opportunities and other parts of the company; and co-ordinate the
enterprises various parts in order to enable the seizing of
opportunities in an efficient way.
5. Exit Rules – help managers decide when to pull out of previous
opportunities.
ALIGNMENT AND INTEGRATION
This helps to implement innovations by developing patterns of interaction. This
is the ability to integrate disparate inputs through heedful contribution,
representation, and subordination into a group system (Wieck and Roberts,
1993:357). By contribution the supply of individual input to the group outcome
reflects the sharing individual knowledge (Okhuysen and Esenhardt,
2002:370) and the keeping of managers well informed (Brown and Eisenhardt:
1997, 1). By representation, the visualisation of how individuals fit in, how
others act, and how their activities affect others ( Crowston and
Kammerer,1998:227) can take place. By subordination the reliance on the
group system reflects the interrelationship of diverse inputs to execute a
collective activity (Grant, 1996:109).

73
TABLE 1: A SUMMARY OF THE LITERATURE ON THE KEY DRIVERS OF RECONFIGURATION SOURCE
ENVIRONMENT & OPPORTUNITY
SENSING
KNOWLEDGE ACQUISITION &
LEARNING
CO-ORDINATION &
REGULATION
ALIGNMENT & INTEGRATION
Arthurs and
Busenitz,2006
X X X X
Branzei and
Vertinsky, 2006
X X X X
Brown and
Eisenhardt, 1997
X X X
Burgelman, 1994 X X
Collis, 1994 X X X X
Crowston and
Kammerer, 1998
X X
Danneels, 2002 X X
D’Aveni, 1994 X
De Boer et al, 1999 X X
Eisenhardt and
Brown,1999
X X
Eisenhardt and
Galunic,2000
X X X
Eisenhardt and
Sull,2001
X
Galunic and
Eisenhardt,2001
X X
Galunic and Rodan,
1998
X X
Garud and
Nayyar,1994
X X X
Grant, 1996 X X
Helfat and
Raubitschek,2000
X
Henderson and
Clark,1990
X X
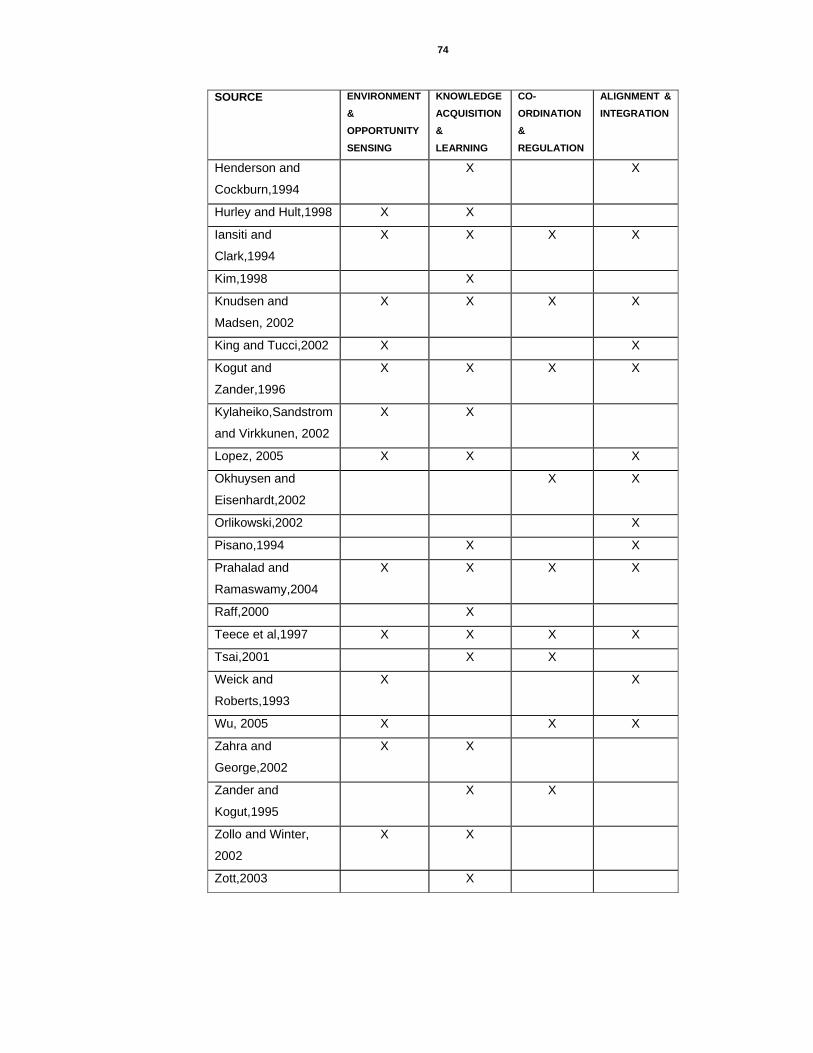
74
SOURCE ENVIRONMENT
& OPPORTUNITY
SENSING
KNOWLEDGE
ACQUISITION &
LEARNING
CO-
ORDINATION &
REGULATION
ALIGNMENT &
INTEGRATION
Henderson and
Cockburn,1994
X X
Hurley and Hult,1998 X X
Iansiti and
Clark,1994
X X X X
Kim,1998 X
Knudsen and
Madsen, 2002
X X X X
King and Tucci,2002 X X
Kogut and
Zander,1996
X X X X
Kylaheiko,Sandstrom
and Virkkunen, 2002
X X
Lopez, 2005 X X X
Okhuysen and
Eisenhardt,2002
X X
Orlikowski,2002 X
Pisano,1994 X X
Prahalad and
Ramaswamy,2004
X X X X
Raff,2000 X
Teece et al,1997 X X X X
Tsai,2001 X X
Weick and
Roberts,1993
X X
Wu, 2005 X X X
Zahra and
George,2002
X X
Zander and
Kogut,1995
X X
Zollo and Winter,
2002
X X
Zott,2003 X

75
FIGURE 4: THE DRIVERS OF THE RECONFIGURATION PROCESS
Thus it can be seen that environment and opportunity sensing, knowledge
acquisition and learning, co-ordination and regulation and alignment and
integration are drivers of reconfiguration processes that lead to innovative
resource reconfigurations and value-added strategies.
INNOVATIVE RESOURCE RECONGIGURATIONS
Reconfiguration Processes E.g.
Patching Co-evolving
Reconfiguration Enabling Processes
E.g. Simple RulesD
YNA
MIC
CA
PAB
ILIT
IES/
ST
RA
TEG
IC P
RO
CES
SES
Environment and
Opportunity Sensing
Knowledge Acquisition
& Learning
Co-ordination & Regulation
Alignment and
Integration
“BES
T PR
AC
TIC
ES”
Value - Adding Strategies &
Competitive Advantage
SMALL BUSINESS GROWTH & SUCCESS

76
2.5.3 “BEST PRACTICES” According to Arthurs and Busenowitz (2006:195), dynamic capabilities are
primarily recursive in that they combine knowledge concerning the organisation’s
performance against its aspired level of performance in the market, along with the
search for new strategic inputs and innovative reconfigurations that would permit
the organisation to meet its performance expectations. The focal point of dynamic
capabilities, they say, thus, fluctuates among an examination of external
influencers of performance in the market, the target customer base, an
examination of the organisations capabilities with regards to any potential
competitors for the customer base and an examination of strategic factors for
potential undervalued strategic inputs.
Variance in dynamic capabilities stems in part from a firm’s accumulated
experience, as prior choices support the development of distinct sets of resources
and skills and/or may result in differential effectiveness at generating new value
from extant endowments (Schultz, 2003: 440). Thus idiosyncrasies in dynamic
capabilities trigger and sustain inter-firm performance differences (Eisenhardt and
Martin, 2000: 1105).
While the dynamic capabilities of specific firms may be their unique and
idiosyncratic processes, dynamic capabilities can also be common to and
associated with effective and efficient processes across firms. These
commonalities arise because there are better or less effective and efficient ways
of dealing with the specific organisational challenges that needs to be addressed
by a given capability i.e. there are “best practices” in the execution of dynamic
capabilities (Eisenhardt and Martin, 2000: 1108).
Curteis (1997:269) has supported this by saying that those enterprises that have
the ability to cope with volatility and change in the environment are normally more
effective and efficient in their strategic activities. Eisenhardt and Martin (2000:
1113) have also stated that in high velocity markets dynamic capabilities may
have detailed routines which help to ensure a fast, co-ordinated execution of
complex details. Therefore this study defines “ best practice “ processes as those
processes that enable an organisation to be more effective and efficient in their
strategic activities by ensuring a fast, co-ordinated execution of complex details,
and which are well established constructs
Following this logic, rather than attempting to build new constructs to
conceptualise these processes, the literature was reviewed in order to obtain a

77
conceptual and theoretical starting point. This review of the literature shows no
specific research on the dynamic capabilities or strategic processes of small
businesses operating in turbulent environments. Nonetheless, documented
systems of “best practices” for small business performance excellence were found
in the Malcolm Baldrige National Quality Award criteria (Baldrige, 2004). These
are existing, well-established and measurable constructs that capture the idea of
dynamic capabilities and that are grounded in empirical research.
Through its core values and concepts: visionary leadership, customer-driven
excellence, organizational and personal learning, valuing staff and partners,
agility, focus on the future, managing for innovation, management by fact, social
responsibility, focus on results and creating value, the Malcolm Baldrige National
Quality Award criteria emphasises the earlier identified four key drivers of the
reconfiguration process viz. environment and opportunity sensing, the acquisition
of knowledge and learning, co-ordination and regulation as well as alignment and
integration.
These key drivers are embodied in the seven categories of the Malcolm Baldrige
National Quality Award criteria: 1) Leadership (125 pts.); 2) Strategic Planning (85
pts.); 3) Customer and Market Focus (80 pts.); 4) Information and Analysis (85
pts.); 5) Human Resource Focus (85 pts.); 6) Process Management (85 pts.) and
7) Business /Organizational Results (450 pts.) In addition the Baldrige Award has
a small business category (Baldrige, 2004).
Therefore, since the Malcolm Baldrige National Quality Award criteria contains
measurable constructs that capture the idea of the four key drivers of
reconfiguration and that are grounded in empirical research, the Malcolm Baldrige
National Quality Award criteria will be used as the basis for the questionnaire
design in chapter 5. As is reported on in Chapter 5, the questionnaire will also
incorporate the two specifically identified reconfiguration processes of “ patching “
and “ co-evolving”, the specifically identified reconfiguration enabling process of “
simple rules” as well as perspectives gained from the personal interviews
conducted.
Since the literature review has indicated a dearth of material on the dynamic
capabilities or strategic processes of small businesses operating in a turbulent
environment, the use of a documented system of “best practices “for small
business excellence will provide a comprehensive lens through which to view the
dynamic capabilities or strategic processes of small businesses operating in a
turbulent environment.

78
2.5.3.1 MALCOLM BALDRIGE NATIONAL QUALITY AWARD CRITERIA [“BEST PRACTICES”] AND THEIR LINKS WITH RECONFIGURATION PROCESS DRIVERS AND RECONFIGURATION ENABLING PROCESSES
The following is a summary of the ‘best practices” derived from the Malcolm
Baldrige National Quality Award criteria. Each “best practice” is reflected on the
operational level as a strategic process in the small business operating in a
turbulent environment. Each process is linked to the identified reconfiguration
enabling processes of environment and opportunity sensing, the acquisition of
knowledge and learning, co-ordination and regulation as well as alignment and
integration.
TABLE 2: MALCOLM BALDRIGE NATIONAL QUALITY AWARD (MBNQA) CRITERIA AND THEIR LINKS WITH RECONFIGURATION PROCESS DRIVERS AND RECONFIGURATION ENABLING PROCESSES
MBNQA CATEGORY: LEADERSHIP AND STRATEGIC PLANNING
This examines how the organization’s senior leaders address values, directions,
performance expectations, develops strategic objectives and action plans, deploys
the chosen strategic objectives and action plans, focuses on customers and other
stakeholders, deals with empowerment, innovation, and learning issues and
measures progress. Also examined are the organization’s governance and how
the organization addresses its public, community, legal and ethical responsibilities.
RECONFIGURATION ENABLING PROCESS
RECONFIGURATION PROCESS DRIVER
The leadership of small business takes
into account the needs and
expectations of all stakeholders, the
changing, turbulent and competitive
environment, regulatory, financial,
market, technological, societal and
other risks as well as factors unique to
the organisation, when establishing
organisational values, goals and
performance expectations as well as
when looking for business opportunities
Environment and Opportunity Sensing

79
The leadership of small businesses,
through both formal and informal
approaches fosters staff empowerment
and innovation.
Alignment and Integration
The leadership of small businesses
serve as role models for the
organisation and all stakeholders. Their
values and expectations of
performance are communicated and
reinforced among managers and
throughout the entire workforce.
Alignment and Integration
The leadership of small businesses
participates, encourages, supports, and
recognizes involvement with their
communities and professional
associations to both support and
strengthen them as well as the small
business.
Environment and Opportunity Sensing
In its decision-making processes, the
leadership of small businesses takes
into account it’s legal, ethical and risk
requirements. By systematically
addressing current and potential
impacts in the decision-making
processes, these become an integral
part of performance management and
improvement.
Environment and Opportunity Sensing
The leadership of small businesses is
able to lead with an impelling strategic
focus while allowing organizational
members to be active players in the
strategic process.
Alignment and Integration
The strategies that are developed are
clearly translated into action plans that
support the achievement of
organizational objectives.
Co-ordination and Regulation

80
MBNQA CATEGORY: CUSTOMERS AND MARKETS This examines how the organization determines requirements, expectations, and
preferences of customers and markets. Also examined is how the organization
builds relationships with customers and determines the key factors that lead to
customer acquisition, satisfaction, loyalty and retention, and to business
expansion.
RECONFIGURATION ENABLING PROCESS PROCESS
RECONFIGURATION PROCESS DRIVER
There is ease of access for small
businesses customers when they are
seeking information or assistance
and/or when they wish to comment or
complain.
Alignment and Integration
A complaint management process
exists that ensures complaints are not
only resolved effectively and promptly
but are also analysed as a source of
improvement activities.
Acquisition of Knowledge and Learning
MBNQA CATEGORY: MEASUREMENT, ANALYSIS AND KNOWLEDGE MANAGEMENT This examines how the organization selects, gathers, analyzes, manages, and
improves its data, information, and knowledge assets.
RECONFIGURATION ENABLING PROCESS PROCESS
RECONFIGURATION PROCESS DRIVER
The organization regularly measures
and analyses organizational
performance and provides the
information and data to support the
organisation’s strategic planning
process, as well as its operational and
functional processes to enable
continuous improvement.
Acquisition of Knowledge and Learning

81
A variety of employee support services
( well being and motivation ) are
available, and are periodically
evaluated and improved to meet
employee’s needs. Both formal and
informal methods- such as surveys, exit
interviews and tracking absenteeism
and turnover – are used to determine
employee well-being, satisfaction, and
motivation.
Acquisition of Knowledge and Learning
The company gathers information about
customer satisfaction for all key
customer segments and captures
information that reflects transaction
quality, customer repurchase, new
business, and positive referral.
Customer satisfaction measures are
used to drive improvement and better
understand the factors that drive
markets.
Acquisition of Knowledge and Learning
Key information and data - financial and
non-financial- is clearly linked to the
organisation’s processes and goals,
and are systematically gathered and
used to track and improve the
company’s performance at all levels.
Acquisition of Knowledge and Learning
Key performance measures embedded
in the action plans and are used to
systematically track progress towards
meeting organizational strategies
Acquisition of Knowledge and Learning
Employees and other stakeholders who
need information to effectively perform
their work have convenient access to all
necessary information.
Acquisition of Knowledge and Learning
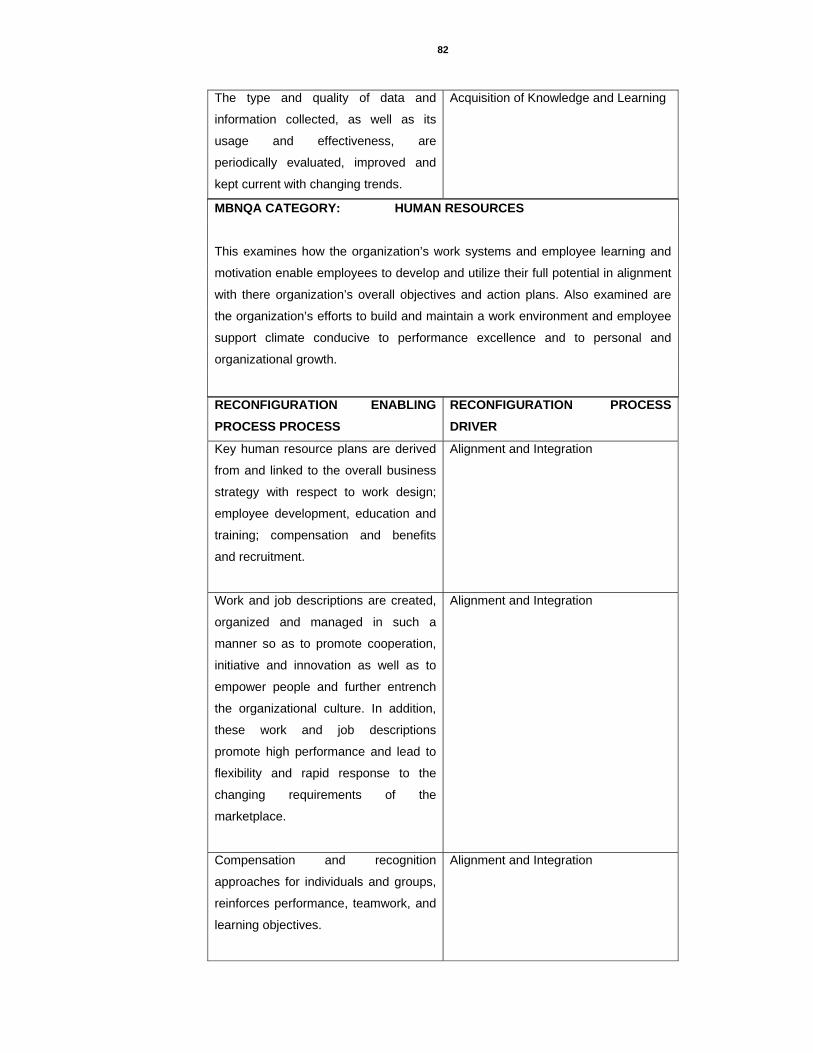
82
The type and quality of data and
information collected, as well as its
usage and effectiveness, are
periodically evaluated, improved and
kept current with changing trends.
Acquisition of Knowledge and Learning
MBNQA CATEGORY: HUMAN RESOURCES
This examines how the organization’s work systems and employee learning and
motivation enable employees to develop and utilize their full potential in alignment
with there organization’s overall objectives and action plans. Also examined are
the organization’s efforts to build and maintain a work environment and employee
support climate conducive to performance excellence and to personal and
organizational growth.
RECONFIGURATION ENABLING PROCESS PROCESS
RECONFIGURATION PROCESS DRIVER
Key human resource plans are derived
from and linked to the overall business
strategy with respect to work design;
employee development, education and
training; compensation and benefits
and recruitment.
Alignment and Integration
Work and job descriptions are created,
organized and managed in such a
manner so as to promote cooperation,
initiative and innovation as well as to
empower people and further entrench
the organizational culture. In addition,
these work and job descriptions
promote high performance and lead to
flexibility and rapid response to the
changing requirements of the
marketplace.
Alignment and Integration
Compensation and recognition
approaches for individuals and groups,
reinforces performance, teamwork, and
learning objectives.
Alignment and Integration

83
Staff education, development and
training activities are structured to
balance organizational objectives with
employee’s individual knowledge and
skills needs. The envisaged activities
are jointly designed by the employees
concerned and their managers detailing
the specific needs, objectives and
performance measures, clearly.
Alignment and Integration
MBNQA CATEGORY: PROCESS MANAGEMENT
This examines the key aspects of the organization’s process management,
including key product, service, and business processes for creating customer and
organizational value and key support processes. This category encompasses all
key processes and all work units.
RECONFIGURATION ENABLING PROCESS PROCESS
RECONFIGURATION PROCESS DRIVER
The design of key services and the
service delivery process is addressed
systematically, incorporating all
stakeholders and accounting for
changing customer requirements, the
environment and technology.
Co-ordination and Regulation
The design of key services and the
service delivery process incorporates
quality and operational performance
requirements such as cost control,
health, safety, and environmental
impacts, process capability,
maintainability, supplier capability and
cycle time.
Co-ordination and Regulation

84
MBNQA CATEGORY: BUSINESS RESULTS
This examines the organization’s performance and improvement in key business
areas—customer satisfaction, product and service performance, financial and
marketplace performance, human resource results, operational performance, and
governance and social responsibility. Also examined are performance levels
relative to those of competitors.
RECONFIGURATION ENABLING PROCESS PROCESS
RECONFIGURATION PROCESS DRIVER
The small business captures trends and
analyses key measures of:
• operational and service
performance such as productivity,
cycle time, supplier and partner
performance and other appropriate
measures of effectiveness and
efficiency. These results are
compared against industry or best-
in-class benchmarks.
• regulatory compliance and
environmental improvements.
These results are compared
against industry or best-in-class
benchmarks.
• financial performance, including
aggregate measures of financial
return and economic value added,
return on investment, operating
profit, pre-tax profit margin and/or
market share and business growth
as appropriate . These results are
compared against industry or best-
in-class benchmarks.
• employee well-being, satisfaction,
development, work-system
improvement and effectiveness.
These results are compared
against industry or best-in-class
benchmarks.
Acquisition of Knowledge and Learning

85
2.6 THE STRATEGIC PROCESSES OR DYNAMIC CAPABILITIES OF SMALL BUSINESSES OPERATING IN A TURBULENT ENVIRONMENT The MBNQA criteria, the specifically identified reconfiguration enabling process of
“simple rules”, the specifically identified reconfiguration processes of “ patching”
and co-evolving”, together with the perspectives gained from the qualitative
analysis [ personal interviews] were incorporated into a questionnaire. This
methodology is reported in Chapter 3. Following a rigorous expert panel
evaluation and the validation and reliability testing procedures of a pilot study, the
processes were refined and are reported in this section as the strategic processes
of small businesses operating in a turbulent environment.
FIGURE 5: THE DERIVATION OF THE STRATEGIC PROCESSES OF SMALL BUSINESS OPERATING IN A TURBULENT ENVIRONMENT
MBNQA+ SIMPLE RULES
Reconfiguration Enabling
Processes
ReconfigurationProcesses
Perspectives: Qualitative Analysis Personal
Interviews
Strategic Processes of Small Businesses operating
in a Turbulent Environment
Draft Questionnaire
Expert Panel Evaluation Pilot Study
FIN
AL
QU
ESTI
ON
NA
IRE

86
This literature in this section will provide a justification from a literature viewpoint,
for their inclusion in the proposed theoretical model which will be developed in
Section 3. The literature under each process will also provide a motivation for the
propositions developed following the proposition development methodology
outlined in Chapter 3. Where possible, the common literature references that are
used in support of different processes are cited under groups of processes, for the
sake of efficient literature presentation. In other instances, the literature references
are repeated.
Process 1
The leadership of a small business, through both formal [e.g. defined and
structured] and informal [e.g. observation] methods, fosters staff empowerment
and innovation.
As described in the literature earlier in this chapter, a key characteristic of small
firms is its flat structure. While a flattened hierarchy should be enabling to
employee empowerment (Holbeche, 1994), Powell (2002:59) has cautioned that
flatter structures may well promote the image of empowerment at the expense of
the actual practice of empowerment. Wilkinson (1999:208) has also described a
“bleak house“scenario of small firms that are dictatorially run with employees who
have very little involvement in the running of the business.
Beaver and Jennings (2005: 12), have also stated that in small firms appointment
and promotion are often made on the basis of birth or personal friendship and
where the relationships between the leadership and the operating personnel are
often informal with no precise definition of rights and obligations and duties and
responsibilities.
Thus, it can be seen that in these small businesses, process 1 has a low level of
importance and a low extent of implementation.
Process 2
The leadership of a small business allows the business to co-evolve by fostering,
driving and executing multi-business/multi-unit collaborative linkages and
managing group dynamics while at the same time empowering staff.
A reconfiguration process identified in Chapter 2, is the process of co-evolving.
Eisenhardt and Galunic (2000:91) have stated that with coevolving, multi-business
teams (the heads of individual businesses working together) drive synergies by

87
reconnecting the collaborative links among businesses as markets and
businesses evolve. Their key skill is managing their own group dynamics. The
important aspects of coevolving described are:
♦ Form of collaboration – the shifting webs among evolving businesses.
♦ Objectives – growth, agility and economies of scope.
♦ Internal dynamics – collaboration and competition.
♦ Focus – the content and the number of collaborative links
♦ Corporate role – to set collaborative context.
♦ Business role – to drive and execute collaboration.
♦ Incentive – self-interest, based on individual business-unit performance,
not collaboration.
♦ Business metrics – performance against competitors in growth, share and
profits.
Sekulie (2002: 73) has also described co-evolving as a subtle strategic process
which includes the creation of a flexible business portfolio with both collaborative
and competitive units and a superior corporate strategy based on cross-business
synergies in performing business activities. As the ability of two or more business
units to generate greater value working together that could apart, synergy has its
sources in shared resources, knowledge and skills, co-ordinated strategies,
vertical integration and establishing internal alliances in the enterprise.
However, in the small enterprise, the managerial process is characterised by the
highly personalised preferences, prejudices and attitudes of the firm’s
owner/manager, to whom a key challenge is to learn how to delegate while
simultaneously creating a team-like environment within the company ( Mazzarol,
2003 : 30).
Research has also shown that the leadership of small businesses need to be in
control of the organisation (Malone, 2004:17; Miller and Simmons, 1992:31). In
addition, these leaders have been shown to have authoritarian (Birley, 1986:36)
and paternalistic (Dyer, 1988:37) characteristics. Hence, they adopt leadership
styles and management systems that allow them to centralise power and control
as well as decision-making (Dyer, 1988:37; Longnecker and Schoen, 1997:1;
Mintzberg, 1984:207 and Seymour, 1993:263).
Furthermore, in these small businesses, where power centralization is prevalent
Beaver and Jennings, 2005:14), there may be a low level of importance and a low
extent of implementation for process 2.

88
Process 3
Work and job descriptions are created, organized and managed in such a manner
so as to promote cooperation, initiative and innovation as well as to empower staff
and further entrench the organizational culture.
The earlier discussions have shown that leadership of small businesses have
autocratic and paternalistic tendencies and the tendency to micro-manage is
prevalent in these firms. Malone (2004:17) has also emphasised that a strong ego
is a common trait in the leadership of small businesses. This trait may also reduce
co-operation, initiative and innovation. In addition, it may also disempower staff.
Mazzarol (2003 :28) has highlighted the importance of small business leadership “
learning to let go” and cited some of the risks of micro-management
disempowerment and failure to get the best out of staff. Furthermore, Beaver and
Jennings (2005:12), have also pointed out that in small businesses relationships
are often informal with no precise definition of rights and responsibilities and
duties and obligations.
Thus, it can be seen that in these small firms there may be a low level of
importance and a low level of implementation for process 3.
Process 4
Staff education, development and training activities are structured to balance
organizational objectives with employees’ individual knowledge and skills needs
and are jointly designed by the employees concerned and the small business
leadership detailing specific needs, objectives and performance measures, clearly.
Process 9
Key human resource plans are derived from and linked to the overall business
strategy with respect to compensation, benefits and recruitment.
According to Kerr and McDougall (1999:65), small businesses do not derive their
development, education and training provided for employees from their overall
business strategy. In addition, few small businesses actually assess and evaluate
the effectiveness of any of the training, education and development provided.
Their human resource plans are often piece meal, ad hoc, and lack cohesion.
Webster, Waller and Brown (2005:552) have supported this by saying that in small

89
businesses informal transfer of skills and knowledge between individuals occurs.
Furthermore, Beaver and Jennings (2005:12), have also pointed out that in small
businesses relationships are often informal with no precise definition of rights and
responsibilities and duties and obligations.
Hendry et al (1991) have suggested that training and learning in small businesses
is often ad hoc, occurring in the course of normal routines. Other researchers
have reported that managers of small firms they do not consider the use of
generally accepted HRM practices as essential for improving productivity as they
lack training in formal personnel management practices (Amba-Rao and Pendse,
1985: 19; Mc Evoy, 1984: 1).
Thus, it can be seen that in these small firms there may be a low level of
importance and a low level of implementation for processes 4 and 9.
Process 5
The skills, knowledge, values and attitudes of the staff and leadership are
important, relevant, valuable and available to customers.
Andriechuk (1992:28) has said that since small businesses have fewer
employees, these employees handle a broad set of responsibilities. Moreover,
small firms have a natural tendency to cross-functional training because they have
fewer layers of management and staff (Axland, 1992:29. Thus, the employee is
asked to do more and job specialization and specialist knowledge acquisition is
not facilitated. This may result in important, relevant and available skills and
knowledge not being available to customers.
Thus, it can be seen that in these small firms there may be a low level of
importance and a low level of implementation for process 5.

90
Process 6
A variety of employee support services ( well being and motivation ) are available,
and are periodically evaluated and improved to meet employee’s needs.
Recruiting, motivating and retaining employees are some of the biggest problems
for small firms (Hornsby and Kuratko, 1990:9; Mathis and Jackson, 1991;
Ghobadian and Gallear, 1996: 83). Job meaningfulness is closely linked with
motivation through challenge and self expression (Powell, 2002:57). However, in
the small firm, the owner perceives the business as an extension of his or her own
personality. Consequently, there is little room of the employee’s self expression.
Research has also shown that the leadership of small businesses need to be in
control of the organisation (Malone, 2004:17; Miller and Simmons, 1992:31). In
addition, these leaders have been shown to have authoritarian (Birley, 1986:36)
and paternalistic (Dyer, 1988:37) characteristics. Hence, they adopt leadership
styles and management systems that allow them to centralise power and control
as well as decision-making (Dyer, 1988:37; Longnecker and Schoen, 1997:1;
Mintzberg, 1984:207 and Seymour, 1993:263).
Thus, it can be seen that in these small firms there may be a low level of
importance and a low level of implementation for process 6.
Process 7
Employees and other stakeholders who need information to effectively perform
their work have convenient access to all necessary information
Small firms tend to focus their selection and use of data on internal operational
process issues (Neely et al, 1994: 140), thus the usefulness of the information
collected is only of limited scope to employees and stakeholders.
Thus, it can be seen that in these small firms there may be a low level of
importance and a low level of implementation for process 7.

91
Process 8
The leadership of a small business leads with an impelling strategic focus while
allowing and rewarding organizational members for being active players in the
strategic process. While staff are encouraged and rewarded for experimenting,
taking risks and being creative, the small business leadership at the same time
retains control of the overall goals of the firm.
Hart (1992:327) pointed out that, top managers must lead with an impelling
strategic focus while allowing organisational members to be active players in the
strategic process. When managers and organisational members acquire this
complex pattern of co-ordination, they have achieved a resource that is difficult to
comprehend and imitate by their competitors, turbulent environments.
These findings are supported by Lumpkin and Dess (1995:1386) who investigated
the relationship between simplistic strategic decision processes and organisational
performance as moderated by the environment and stage of organisational
development and found that firms facing dynamic environments need complex
decision processes. A complex strategic decision process involves all mangers
and utilizes all organisation members’ skills and abilities providing a firm with a
strategic resource that is difficult to imitate (Grant, 1991:114).
This view is also emphasised by Snyman and Drew (2003:293) who investigated
the relationship between complexity as a strategic decision process and firm
performance. They found that in hyper-competitive environments, where change is
rapid and ambiguous, firms need more than just rational or incremental strategic
decision processes. Complex processes were found to be significantly related to
higher firm performance than were simpler, unitary or impoverished strategic
decision processes. A complex strategic decision process involves all mangers
and utilizes all organisation members’ skills and abilities providing a firm with a
strategic resource that is difficult to imitate (Grant, 1991:114).
However, in the small enterprise, the managerial process is characterised by the
highly personalised preferences, prejudices and attitudes of the firm’s
owner/manager, to whom a key challenge is to learn how to delegate while
simultaneously creating a team-like environment within the company ( Mazzarol, :
30).
Research has also shown that the leadership of small businesses need to be in
control of the organisation (Malone, 2004:17; Miller and Simmons, 1992:31). In
addition, these leaders have been shown to have authoritarian (Birley, 1986:36)

92
and paternalistic (Dyer, 1988:37) characteristics. Hence, they adopt leadership
styles and management systems that allow them to centralise power and control
as well as decision-making (Dyer, 1988:37; Longnecker and Schoen, 1997:1;
Mintzberg, 1984:207 and Seymour, 1993:263).
Furthermore, in these small businesses, where power centralization is prevalent
(Beaver and Jennings, 2005:14), there may be a low level of importance and a low
extent of implementation for process 8.
Process 10
Compensation and recognition approaches for individuals and groups, reinforces
performance, teamwork, and learning and business objectives.
Andriechuk (1992:28) found that since small businesses have fewer employees,
these employees handle a broad set of responsibilities. Thus it can be seen that
the job descriptions are generally much broader at small firms. In the small firm,
the employee is asked to do more and therefore more opportunities exist for the
employee to gain greater experience in a broad variety of jobs and tasks. The
problem that is encountered here is that this broad tasking comes with a price. But
the fewer resources of small businesses allow less compensation which in turn
leads to higher staff turnover. Recruiting, motivating and retaining employees are
some of the biggest problems for small firms (Hornsby and Kuratko, 1990:9;
Mathis and Jackson, 1991; Ghobadian and Gallear, 1996: 83). Higher staff
turnover rates compromise learning and experience and this hinders both
communication and skill sharing.
In smaller firms compensation in terms of salary and benefits do not usually
compare with those in larger firms (Lichtenstein, 1998:55). In addition, small
business managers do not see incentives as essential to the improvement of
productivity (Amba-Rao and Pendse, 1985:19). Thus small firms do not rely on
compensation packages to reinforce performance and teamwork and therefore
these firms may have to use other recognition programs to do so.
Thus, it can be seen that in these small firms there may be a low level of
importance and a low level of implementation for process 10.

93
Process 11
The leadership of a small business serves as a role model for the organisation
and all stakeholders.
O’Gorman, Bourke and Murray (2005:1) have stated that small size is generally
associated with greater interpersonal contact among groups and greater
informality in communication patterns; and according to Lee and Oakes
(1995:413), the simple structure and systems present in small businesses enables
the leadership of small businesses to inspire and motivate others in the
organisation.
However, in the small enterprise, the managerial process is characterised by the
highly personalised preferences, prejudices and attitudes of the firm’s
owner/manager, to whom a key challenge is to learn how to delegate while
simultaneously creating a team-like environment within the company ( Mazzarol,
2003: 30).
Research has also shown that the leadership of small businesses need to be in
control of the organisation (Malone, 2004:17; Miller and Simmons, 1992:31). In
addition, these leaders have been shown to have authoritarian (Birley, 1986:36)
and paternalistic (Dyer, 1988:37) characteristics. Hence, they adopt leadership
styles and management systems that allow them to centralise power and control
as well as decision-making (Dyer, 1988:37; Longnecker and Schoen, 1997:1;
Mintzberg, 1984:207 and Seymour, 1993:263).
Thus, it can be seen that in these small firms there may be a low level of
importance and a low level of implementation for process 11.

94
Process 12
The leadership of a small business has a few simple rules to guide its strategic
processes instead of elaborate strategies [a simple standard operating procedure
is devised to guide decision making]. These rules focus on : – how to carry out key
processes; knowing which opportunities to pursue and which should not be
considered; being able to rank the accepted opportunities; to synchronize the
pace of emerging opportunities and other parts of the company and when to pull
out of yesterday’s opportunities.
According to Eisenhardt and Sull (2001:107), a key aspect of strategy in turbulent
environments is that while each company should follow a disciplined and
consistent strategy - otherwise it would be paralysed by chaos - it is more
important to focus on a unique set of strategically significant processes and a
handful of rules to guide them. A consistent strategy helps managers rapidly sort
through all kinds of opportunities and gain short-term advantage by exploiting the
attractive ones. Rather than picking a position or leveraging a competence,
managers should select a few key strategic processes and develop simple rules to
shape the process. Rather than responding to a complicated world with elaborate
strategies, they should craft a handful of simple rules.
These simple rules fall into five broad categories:
1. How-to rules – these spell out key features of how a process is executed-
“what makes our process unique?”
2. Boundary rules – they focus managers on which opportunities can be
pursued and which are outside the pale.
3. Priority Rules –they help managers rank the accepted opportunities
4. Timing Rules – they synchronise managers with the pace of emerging
opportunities and other parts of the company.
5. Exit Rules – they help managers decide when to pull out of yesterday’s
opportunities. These simple rules are not broad, mindless, vague or stale.
In turbulent environments, small firms are less likely to increase their strategic
initiatives (Lindsay and Rue, 1980: 385) as they are constrained by their lack of
resources and their range of strategic options (Dandrige, 1979: 53; Robinson and
Pearce, 1984: 80). Thus, they are particularly vulnerable when coping with the
speed of economic, industry, and competitive change (Drozdow and Carroll,
1997:75). Another reason why small firms are generally considered more
vulnerable to competitive challenges is that they spend more time adjusting and
reacting rather than predicting and controlling the business environment
(D’Amboise and Muldowney, 1988:226). They are also generally characterized as

95
having a myopic view of management that focuses mainly on meeting day-to day
survival challenges which can be attributed partly to the lack of understanding of
the leadership to the strategic aspect of business and partly to the lack of
resources (Ahire, 1996:44). It is also suggested that small firms lack the
necessary staff and time to engage in strategic planning, and generally do not
plan (Robinson and Pearce, 1984:80). Scully and Fawcett (1994: 39) have
supported this view, and state that any change that occurs in the small firm is
likely to be incremental without any stakeholder-focused assessment and hence
the small firms generally fail to develop any true strategic initiatives.
Thus, it can be seen that in these small firms there may be a low level of
importance and a low level of implementation for process 12.
Process 13
The leadership of a small business ensures that the design of key services and
the service delivery process incorporates quality and operational performance
requirements such as cost control, health, safety, and environmental impacts,
process capability, maintainability, supplier capability and cycle time.
While the notion of stakeholder importance is supported to some extent by small
firm leaders, decision-making may be based on incomplete or biased input.
Important viewpoints may be overlooked as some important stakeholders may be
ignored and dependence developed on stakeholders who may have been
developed and maintained by these small business leaders. Furthermore, White
and Wilson (1988) have found that at the smaller firm process activities were
strongly systematized. Such systems strengthen the command and control
environment that is typically found in small firms.
Thus it can be seen that small businesses are focused on day to day operations
and their leadership does not favour an all-inclusive stakeholder approach. This
may lead to incomplete or biased decision- making when designing key services.
Thus, it can be seen that in these small firms there may be a low level of
importance and a low level of implementation for process 13.

96
Process 14
The leadership of a small business patches and restructures the business portfolio
by creating an enterprise structure that consists of patches [units/modules], in
order to fit changing market opportunities. In this type of structure, the business
units are modular, focused and discrete so that they can be combine seamlessly;
there is access to trends and knowledge that can help to predict when to
restructure the business; there is an ability to recognize patterns and trends that
develop in the market place; market segmentation which reveals how to optimally
configure patches [ units/modules] to exploit market opportunities, is clearly
understood; road maps which suggest how future patches [ units/modules] are
likely to evolve, are available.
One of these newly defined strategic processes is patching (Eisenhardt and
Brown, 1999:72). When markets are turbulent, patching becomes crucial.
Patching is the strategic process by which corporate executives routinely remap
business to changing markets. While managers in traditional companies see
structure as mostly stable, managers in companies that patch believe structure is
inherently temporary. Patchers also develop corporate strategy differently.
Traditional managers set corporate strategy first, whereas managers who patch
keep the organisation focused on the right overall set of business opportunities
and then let strategy emerge from individual businesses. Patching changes are
usually small in scale and made frequently and quickly – think evolution not
revolution.
For patching to work, the company’s infrastructure must support the process. This
requires modularity, detailed and complete business-level metrics. Modularity
enables a patching company’s business units to be focused and discrete so that
they can be combined seamlessly. Complete and detailed business-level metrics
that are comparable across boundaries are also essential for effective patching.
Such metrics and their trends give corporate managers in-depth knowledge of
their businesses and can help them predict how and when to re-patch.
Great patching executives all possess one critical skill: pattern recognition. They
can see trends developing in the marketplace before most other people can. More
significant, they have a deep understanding of two concrete aspects of managing:
market segmentation, which reveals how to optimally configure patches to exploit
market opportunities, and road maps for new products, services or technologies
which suggest how future patches are likely to evolve. This understanding of
patching was made after more than a decade of research into reasons behind
corporate success in high-velocity, intensely competitive industries.

97
The aspects of patching are:
♦ modularity
♦ detailed and complete business-level metrics.
♦ pattern recognition
♦ market segmentation
♦ road maps.
In turbulent environments, small firms are less likely to increase their strategic
initiatives (Lindsay and Rue, 1980: 385) as they are constrained by their lack of
resources and their range of strategic options (Dandrige, 1979: 53; Robinson and
Pearce, 1984: 80). Thus, they are particularly vulnerable when coping with the
speed of economic, industry, and competitive change (Drozdow and Carroll,
1997:75). Another reason why small firms are generally considered more
vulnerable to competitive challenges is that they spend more time adjusting and
reacting rather than predicting and controlling the business environment
(D’Amboise and Muldowney, 1988:226). They are also generally characterized as
having a myopic view of management that focuses mainly on meeting day-to day
survival challenges which can be attributed partly to the lack of understanding of
the leadership to the strategic aspect of business and partly to the lack of
resources (Ahire, 1996:44). It is also suggested that small firms lack the
necessary staff and time to engage in strategic planning, and generally do not
plan (Robinson and Pearce, 1984:80). Scully and Fawcett (1994: 39) have
supported this view, and state that any change that occurs in the small firm is
likely to be incremental without any stakeholder-focused assessment and hence
the small firms generally fail to develop any true strategic initiatives.
Thus, it can be seen that in these small firms there may be a low level of
importance and a low level of implementation for process 14.

98
Process 15
The leadership of a small business develops strategies that are clearly translated
into action plans that support the achievement of organizational objectives.
Process 19
The organization regularly measures and analyses organizational performance to
provide the information and data to support the organization’s strategic planning
process, as well as its operational and functional processes to enable continuous
improvement.
Process 20
Key information and data - financial and non-financial- is clearly linked to the
organisation’s processes and goals, and are systematically gathered and used to
track and improve the company’s performance at all levels.
Process 21
Key performance measures embedded in the action plans and are used to
systematically track progress towards meeting organizational strategies.
Process 28
The company gathers information about customer satisfaction for all key customer
segments and captures information that reflects transaction quality, customer
repurchase, new business and positive referral.
Since in small businesses there is no margin of error, no-one to blame mistakes
on and no-one to ask for resources(Brady 1995: 44) key performance measures
are seen as time and resource consuming and considered unnecessary.
Consequently, the tracking of progress towards meeting action plans is seen as
unnecessary in the small firm.
In turbulent environments, small firms are less likely to increase their strategic
initiatives (Lindsay and Rue, 1980: 385) as they are constrained by their lack of
resources and their range of strategic options (Dandrige, 1979: 53; Robinson and
Pearce, 1984: 80). Thus, they are particularly vulnerable when coping with the
speed of economic, industry, and competitive change (Drozdow and Carroll,
1997:75).
Another reason why small firms are generally considered more vulnerable to
competitive challenges is that they spend more time adjusting and reacting rather
than predicting and controlling the business environment (D’Amboise and
Muldowney, 1988:226). They are also generally characterized as having a myopic
view of management that focuses mainly on meeting day-to day survival

99
challenges which can be attributed partly to the lack of understanding of the
leadership to the strategic aspect of business and partly to the lack of resources
(Ahire, 1996:44).
It is also suggested that small firms lack the necessary staff and time to engage in
strategic planning, and generally do not plan (Robinson and Pearce, 1984:80).
Scully and Fawcett (1994: 39) have supported this view, and state that any
change that occurs in the small firm is likely to be incremental without any
stakeholder-focused assessment and hence the small firms generally fail to
develop any true strategic initiatives.
Thus, it can be seen that in these small firms there may be a low level of
importance and a low level of implementation for processes 15, 19,20,21 and 28.
Process 16
The leadership of a small business knows what resources [e.g. human, financial,
physical, support] are available to the business; their constraints, their capacities
and their advantages.
Process 17
The leadership of a small business devises appropriate strategies that can
maximize any resource advantage and overcome any resource limitation.
Surveys of small business failure have showed that while entrepreneurs often
have good ideas and are competent they “do not have a clue on how to run a
business and have no underlying appreciation of business fundamentals” (Barron,
2000:1; Brink, 1997:364). Ligthelm and Cant (2002:1) have found that deficiencies
in its internal environment are the major cause of small and medium enterprise
failures, and revolve around poor management skills. The failure of small
businesses has also been attributed to resource limitations (Wilkes and Dale,
1998:731; Shin et al, 1998:10; Ahire and Gohar, 1996:1 and Welsh and While:
18).
Thus, it can be seen that in these small firms there may be a low level of
importance and a low level of implementation for processes 16 and 17.

100
Process 18
The leadership of small businesses ensures that personalized service is offered to
customers
Process 24
There is ease of access for small businesses customers when they are seeking
information or assistance and/or when they wish to comment or complain.
Process 25
A complaint management process exists that ensures complaints are not only
resolved effectively and promptly but are also analyzed as a source of
improvement activities.
Process 26
Good relationships with customers are actively pursued and maintained by both
staff and the leadership of small businesses.
Process 27
The design of key services and the service delivery process is addressed
systematically accounting for changing customer requirements.
Andriechuk (1992:28) found that since small businesses have fewer employees,
these employees handle a broad set of responsibilities. Thus it can be seen that
the job descriptions are generally much broader at small firms. Thus, employees
may have very little time to offer customers a personalised service.
Furthermore, according to Kerr and McDougall (1999:65), small businesses do not
derive their development, education and training provided for employees from
their overall business strategy. In addition, few small businesses actually assess
and evaluate the effectiveness of any of the training, education and development
provided. Thus, the education and training of employees may be inadequate to
offer customers a personalised service.
Thus, it can be seen that in these small firms there may be a low level of
importance and a low level of implementation for process 18, 24, 25, 26 and 27.

101
Process 22
The type and quality of data and information collected, as well as its usage and
effectiveness, are periodically evaluated, improved and kept current with changing
trends.
Assessing company performance relative to plans and goals may be a moot point
for many small firms since these firms tend to not develop formal strategy and
plans (as per previous discussion). In general, small firms may have certain
financial goals in mind but rarely does the small firm have the time or resources to
collect the data in order to analyse the overall performance of the company. Small
firms will review the performance of key process measures but formal goals are
not set for these processes.
Furthermore, research suggests that although firms may appreciate the potential
strategic value of competitor information, they generally make little systematic
attempt to collect or maintain such data (Fann and Smeltzer, 1989: 35). Often, the
direct competitor of a small firm is another small firm and research has shown that
it is difficult to collect competitive information held internal to such an organization
because these firms being privately held make information difficult to obtain
(Hewitt-Dundas et al, 1997: 76).
Goh and Ridgeway (1994: 54) have pointed out that the majority of the small firms
either conduct only limited comparisons with their competitors or just monitor
trends within their own firm. The firms tend to be very inward-looking and are
satisfied so long as they are performing better than their neighbouring
competitors. They have not realized the importance of benchmarking and the
advantages it holds for their company. Ebrahimpour and Withers (1992: 142) have
found that quality tracking techniques such as benchmarking may also be used
less frequently and less effectively in small firms.
However, Beal (2000: 27) has found that collecting information on how
competitors interact with the external environment can be an important source of
information about competitors for the small firm. Wiarda and Luria (1998: 91) have
also pointed out that the collection and analysis of performance data is of low
priority to small firms who have few resources to do in-depth work in this area.
Thus small firms tend to be very inward-looking and are content so long as they
are performing better than their neighbouring competitors. In many cases, the
direct rival of a small firm is another small firm and research has shown that it is
difficult to collect competitive information held internal to the company because the

102
majority of these firms are privately held and information is not easily obtained.
These firms do not realise the advantages of benchmarking and the advantages it
holds for their firm. In addition small firms make little effort to collect or maintain
data about their competitors.
Thus, it can be seen that in these small firms there may be a low level of
importance and a low level of implementation for process 22.
Process 23
All measures of organizational performance captured by the small business are
compared against industry or best-in-class benchmarks.
Goh and Ridgeway (1994: 54) have found that small firms were unaware of the
need to maintain detailed and accurate records. Ebrahimpour and Withers (1992:
142) have also reported that quality tracking techniques such as benchmarking
may also be used less frequently and less effectively in small firms.
Thus, it can be seen that in these small firms there may be a low level of
importance and a low level of implementation for process 23.
Process 29
The leadership of a small business takes into account the needs and expectations
of all stakeholders, the changing, turbulent and competitive environment,
regulatory, financial, market, technological, societal and other risks as well as
factors unique to the organization, when establishing organisational values,
organisational directions and performance expectations as well as when looking
for business opportunities,
Research has shown that the leadership of small businesses need to be in control
of the organisation (Malone, 2004:17; Miller and Simmons, 1992:31). In addition,
these leaders have been shown to have authoritarian (Birley, 1986:36) and
paternalistic (Dyer, 1988:37) characteristics. Hence, they adopt leadership styles
and management systems that allow them to centralise power and control as well
as decision-making (Dyer, 1988:37; Longnecker and Schoen, 1997:1; Mintzberg,
1984:207 and Seymour, 1993:263).
Because the leadership of small firms faces fewer organisational constraints than
those in larger firms, their decisions can have proportionately larger and more
immediate impacts on the business (Haveman, 1993:864; Norburn and Birley,
1988:225). Thus, these leaders know that just one poor decision can seriously

103
threaten the existence of their organisation. As a result of this pressure the
leadership of small firms tends to be more conservative or risk averse in their
decisions and rely heavily upon themselves for final decisions involving all aspects
of the business.
Thus, it can be seen that in these small firms there may be a low level of
importance and a low level of implementation for process 29.
Process 30
The leadership of a small business uses its involvement with its communities and
professional associations to both support and strengthen those communities and
associations as well as the business.
Process 31
The leadership of a small business has strong friend, family and professional
networks.
According to Williamson (1985) economic functions can be performed either within
the boundaries of hierarchical firms (within the organisation) or by market
processes that cross these hierarchical boundaries. For small firms, the economic
functions and transactions within the boundaries of hierarchical firms are either
impossible or extremely difficult because small firms, being small and alone, are
inherently lacking in resources, causing higher costs. Hence it is clear that small
firms find it difficult to perform their economic activities either at the level of the
hierarchical firm or the market.
Given this, small firms need support in order to compete and survive. Networking
is one of the best solutions given in the literature for the development of small
firms in developing countries, because networking lies between the hierarchy and
the market (Jarillo, 1988:31; Thorelli, 1986:37). Hierarchies and markets are
regarded as being the polar ends of a variety of governance options (Butler, 1991;
Williamson, 1985).
In the network, the logic of exchange differs from the economic logic of the market
and the hierarchy. The logic of exchange is considered as “social embeddedness”
because on going social ties shape actor expectations and opportunities in ways
that differ from the economic logic of market behaviour (Granovetter, 1985:481;
Uzzi, 1996:674). Butler and Hansen (1991:1) and Birley (1985: 107) have also
pointed out that both broad and inter-firm strategic networks provide successful
start-up and competitive advantage for small enterprises. Donckels and

104
Lambrecht (1995:273) have also highlighted a positive relationship between
network formalities and small business growth.
Thus it is seen that networking is the best solution for small firm development
(Donckels and Lamprecht, 1995:273; Gibb, 1993:1; Johannisson, 1990:32,
Szarka, 1990:10).
Ostgaard and Birley (1996:37) have described networking as an entrepreneurial
process that involves the gathering of scarce resources from the environment.
These resources include not only finance and other material resources, but also
information, ideas, advice, customers, etc. and are usually obtained through the
entrepreneur’s personal network. A network provides the entrepreneur with
information, support, contact and credibility.
Studies done by Donckels and Lambrecht (1995: 273) identified external
consultants, seminars, trade fairs, contact with other entrepreneurs and
discussions with relatives as sources of network formation. Dodd (1997: 80) also
points out that one of the most efficient ways for a manager or a business owner
to establish an external network of personal ties is through membership of various
clubs, societies and associations.
Discussions with relatives and friends are also a major element of the formation of
networks and also have a strong impact on business performance, particularly in
small businesses (Aldrich, Rosen and Woodward, 1986: 154; Dodd, 1997:80).
Since owners/managers of small firms do not have adequate managerial and
technical skills to run their business efficiently and effectively (Holmlund and Kock,
1998:46 and Joyce et al, 1995:1) small firms regularly use external researchers or
consultants to enhance the skills of their internal staff (Brysen et al, 1993:265).
Thus it can be seen that by participating in networks, small firms are able to
overcome some of their resource limitations and growth is fostered; and
furthermore this network participation is of mutual benefit to both the small firm
and the professional and community associations.
Thus, it can be seen that in these small firms there may be a high level of
importance and a high level of implementation for processes 30 and 31.

105
Process 32
The leadership of a small business takes into account its legal, ethical and risk
requirements, in its decision-making processes
The legal requirements imposed on small businesses can create barriers or drive
existing firms from the industry. According to Reilland (1999:18), the cost of
complying with regulations consumes a much higher share of sales revenues for
small and medium sized companies, than for larger enterprises”. The small
business has to take these issues under serious consideration when making
decisions because the impact could seriously threaten the existence of the
business.
Vyakarnam et al (1997:1625) have discussed small business ethics and point out
the inherent conflict within owner managed businesses in terms of separating out
the rights of the owner from those of the business, when they may be perceived
as the same entity. The personal characteristics of the owner manager and
particularly the extent to which they can detach themselves from the business and
its various stakeholders have an impact on the firm’s outward social responsibility.
It therefore seems clear that in smaller firms the personal ethics of the
owner/manager will be the significant driving force that leads toward socially
responsible or irresponsible actions.
Small businesses consider issues of legal, ethical and risk requirement seriously
when making decisions because their impact could seriously threaten the
existence of the business. Small firms that ignore such issues usually do not
survive. However, it can be seen that small firm management can be conflicted by
their legal and ethical commitments if the distinction between self interest and
business interest becomes blurred. In addition, the perceived overburden of
policies, laws and regulations alienates these managers and while they will usually
meet the minimum requirements, they usually do not find competitive advantage
through treating these issues as areas for potential improvement.
Thus, it can be seen that in these small firms there may be a low level of
importance and a low level of implementation for process 32.

106
2.7 THE IMPORTANCE OF THE STUDY FOR THE PRACTICE ENVIRONMENT: SMALL BUSINESSES
This study aims to develop a model that elucidates a rational, specific and
targeted approach to initiate and sustain the dynamic capabilities of small
businesses operating in a turbulent environment. This model will differentiate
dynamic capabilities into those that can be influenced by the shorter-term
intervention strategy of specifically increasing management capabilities and those
that require the longer-term strategy of altering the general resource base of these
small firms. By using this rational, specific and targeted approach to initiate and
sustain the dynamic capabilities of these small firms, their dynamic capabilities will
be strengthened and hence the performance of these small firms in turbulent
environments, optimized.
Since it is the owner/managers’ decision-making perceptions that govern their
behaviour through various stages of the decision-making process (Tait, 1990:38),
the level of importance assigned by the owner/manager to a particular process will
determine the resources to be allocated to it and hence the extent of
implementation of a particular process and the extent of innovative resource
reconfigurations that revolve around it. This is supported by Adner and Helfat
(2003: 1011) who state that managerial decisions are acknowledged as some of
the most critical antecedents of capability transformation. Helfat and Peteraf (
2003:1004) also state that “ unless the external selection environment is so
constraining that it limits managers to only one possible option, different managers
in different firms may make different choices “.
Suitable strategic choices can help firms overcome the constraints of their existing
resource endowments by guiding the development of extant skills and by
facilitating the emergence of new capabilities. These strategic manoeuvres can
modify a firm’s current capability- development trajectory by influencing the range
and depth of external cues noticed the framing of these stimuli as threats or
opportunities for action, a firm’s speed of reaction, and/or the specific actions
taken in response (Branzei and Vertinsky, 2006:75).
Furthermore, Kozan, Oksoy and Ozsoy (2006:114) have also found that small
business growth was positively influenced by owner intensity, a construct of which,
importance placed on activity is a component. Korman (1970: 31) also describes
the theory of work motivation which states that people will be motivated to behave

107
and perform in a manner that is consistent with their self-concept. In other words,
the importance that a person places on a skill affects that person’s behaviour.
Thus the choices and decisions made by small businesses on how they allocate
their resources to strategic processes, determines the type and extent of
innovative resource reconfigurations that can occur in these small firms.
Attempting to increase the importance about specific dynamic capabilities, through
increasing management capabilities is a shorter term and more focused task than
attempting to alleviate the general resource impoverishment of these small firms.
Furthermore, the short-term intervention of improving management capability in
small firms that operate in a turbulent environment will enhance the ability of small
firms to grow their firm’s resource base. Kozan, Oksoy and Ozsoy (2006:114)
state that by improving management know-how, the resource aggregation
capability of the small firm is improved. Thus, the alleviation of the impoverishment
of management capability in a small business operating in a turbulent environment
has dual benefits. An increase in management capability benefits business
success and the resource base of the firm. An increase in the resource base in
turn benefits business success and since management capability is also a
resource of the firm, it also benefits management capability.
FIGURE 6: THE LINK BETWEEN MANAGEMENT CAPABILITY, RESOURCES AND BUSINESS SUCCESS
Because of the resource impoverishment of small businesses operating in a
turbulent environment, it is important that their resources be used efficiently and
effectively. Thus in seeking to enhance and increase management capabilities, it
is important to be able to identify the specific areas in which management
RESOURCE BASE
MANAGEMENT CAPABILITY
BUSINESS SUCCESS
Long –term Multi-factorial
task
Short-term Focused task

108
capability should be enhanced. From the literature review in this chapter, it is clear
that the areas that should be focused on are the strategic processes or dynamic
capabilities of small businesses operating in a turbulent environment. Dynamic
capabilities are a business asset of the highest order (Lopez, 2005:661) and also
according to Wu (2005), for firms facing a changing environment, strengthening
dynamic capabilities is a key concern. Thus this study’s general findings focus on
the strategic processes or dynamic capabilities of small businesses operating in a
turbulent environment. On a more specific level, the study’s findings specifically
focus on those strategic processes whose implementation can be altered by
changing their level of importance and by extension by changing management
capability, in these small businesses.
From this study’s findings the small business management practitioner, will be
able to identify the dynamic capabilities about which more knowledge is required.
By increasing management capabilities in this regard, the general resource base
of these small firms will also be increased and thus following from the logic of the
earlier discussion, the dynamic capabilities of these small firms will be
strengthened, leading to innovative resource reconfigurations.
FIGURE 7: THE LINK BETWEEN STRATEGIC PROCESSES, MANAGEMENT CAPABILITY, RESOURCES AND BUSINESS SUCCESS
RESOURCE BASE
MANAGEMENT CAPABILITY
BUSINESS SUCCESS
Long –term Multi-factorial
task
Short-termFocused task
Education and Training about
Specific Strategic
Processes/ Dynamic
Capabilities

109
FIGURE 8: LONG TERM AND SHORT TERM INTERVENTION MECHANISMS FOR INNOVATIVE RESOURCE RECONFIGURATIONS.
VALUE-ADDING STRATEGIES &
COMPETITIVE ADVANTAGE
* INNOVATIVE RESOURCE
RECONFIGURATIONS
WHICH DYNAMIC
CAPABILITIES ???
* INNOVATIVE RESOURCE
RECONFIGURATIONS
WHICH DYNAMIC
CAPABILITIES ???
MANAGEMENTCAPABILITY
MANAGEMENT LEVEL OF
IMPORTANCE
SHORT TERM INTERVENTION
*TARGETED
& SPECIFIC
MANAGEMENT EDUCATION
GENERAL RESOURCE BASE
* MANAGERAL
**MANAGEMENT CAPABILITY
**MANAGEMENT LEVEL OF IMPORTANCE
* TECHNOLOGICAL * FINANCIAL * ORGANISATIONAL
SMALL BUSINESS GROWTH/SUCCESS
RESOURCE ALLOCATION
- to which dynamic capabilities????? RES
EAR
CH
PR
OB
LEM
RES
EAR
CH
PR
OB
LEM
Change level of importance

110
2.8 THE IMPORTANCE OF THE STUDY FOR SMALL BUSINESS THEORY AND GENERAL MANAGEMENT THEORY
The literature review in this chapter reveals a paucity of research on the strategic
processes in small businesses operating in a turbulent environment. Current
literature and research in dynamic capabilities occurs in large organisations.
Furthermore, although much of the literature on dynamic capabilities argues that
they are rooted in organisational processes, the nature of these foundational
processes have not received much attention, generally in dynamic capabilities
literature and specifically none at all in the literature on small businesses. Thus
this study’s differentiation of dynamic capabilities into the two constructs of
reconfiguration enabling processes and reconfiguration processes provides clarity
about the domain and the conceptualization of dynamic capabilities.
In addition, this study’s conceptualisation and measurement of dynamic
capabilities as a specific set of measurable strategic processes that capture the
idea of dynamic capabilities, provides a theoretical basis for the link between the
reconfiguration enabling processes and the reconfiguration processes that lead to
innovative resource reconfigurations. This provides clarity about the content and
operationalisation of dynamic capabilities.
In areas where there is a paucity of research and literature, theory building is
important as it provides the creation of frameworks that can explain practical
phenomena. Theories advance our knowledge by proposing particular concepts
that classify and describe a phenomenon. They also offer a set of interrelated
statements using these concepts. Theories are not absolute laws; they are always
tentative and are based on probabilities of events occurring.
Using Dubin’s theory building method ( Dubin, 1978), this study will build and
develop the theory of strategic processes of small businesses operating in a
turbulent environment by first proposing a theoretical model and then by
developing this model through an empirical testing of its key indicators. This
theory building process and theoretical model is reported on in Chapter 3.

111
2.9 THE CHOICE OF SECTOR TO MODEL THE STRATEGIC PROCESSES OF SMALL BUSINESSES OPERATING IN TURBULENT ENVIRONMENTS
A sector that is experiencing environmental turbulence is the retail community
pharmacy sector.
While government intervention, through the means of policies, regulations etc., is
an important mechanism to address the failure of pharmaceutical markets (WHO,
1997); its intervention in the supply and distribution of medicines in South Africa,
has created unprecedented turbulence in the environment of the pharmaceutical
industry.
With the advent of democracy in South Africa, the government introduced the
South African National Drug Policy. The cornerstone of the South African National
Drug Policy (RSA, 1995) is affordable access to drugs. Access to drugs is an
integral part of the realization of a fundamental human right – the right to health
(Velasquez and Boulet, 1999). With the cost of pharmaceuticals comprising a
large slice of the healthcare bill; and with the accessibility, safety, efficacy and
quality of drugs being part of the health objectives of the South African National
Drug Policy (RSA, 1995) and cost-effective rational drug use being part of its
economic objectives; the industry is experiencing a range of legislative changes
designed to maximise the value provided by drug therapy.
The proposals for and implementation of this wide range of legislation, in the form
of acts and regulations such as the Pharmacy Act, the Medical Schemes Act, The
Medicines and Related Substances Control Act and the National Health Bill, all of
which have or will bring about some radical changes to both the environment and
the way in which private retail community functions in the future.
Some of the changes that are impacting on the pharmaceutical industry and
causing turbulence are: a new pricing structure at the retail level, single exit price
at the manufacturer level, a discontinuance of discounts in the supply chain, the
allowing of ownership of retail community pharmacies by persons other than
pharmacists, the creation of designated service providers by service payers and
the issuing of dispensing licenses to healthcare professionals who are not
pharmacists. Thus, it can be seen that the retail community pharmacy sector is a
sector that is experiencing environmental turbulence, and hence it will provide a
rich environment to investigate the strategic processes of small businesses
operating in a turbulent environment.

112
2.10 THE IMPORTANCE OF THE STUDY FOR THE PRACTICE ENVIRONMENT: RETAIL COMMUNITY PHARMACY
Researchers and healthcare professionals continually strive to find ways to
optimise the value of services – to lower costs while at the same time improving
the quality of care. While the concept of quality is embedded in all aspects of drug
supply, its importance in business and strategic management is often overlooked
and its perspectives may even be seen to be mutually exclusive.
Retail community pharmacists have always practised in an environment where
their professional obligations co-exist with their numerous business
responsibilities. This duality between professionalism and mercantilism has
become more pronounced nowadays, in the light of the emphasis placed on cost-
containment in the healthcare sector; and practising in such an environment
places these healthcare professionals under pressure to meet business objectives
whilst at the same time maintaining a highly professional image. In this
environment, very little is known about the manner in which the retailers configure
their resources to be successful in the increasingly competitive marketplace
(Szeinbach and Barnes, 1995).

113
2.11 CHAPTER CONCLUSIONS This chapter reviewed the literature to provide a theoretical background to the
study and motivate for and justify the propositions developed. Using the identified
reconfiguration enabling processes, reconfiguration processes and themes that
emerged from the personal interviews, this chapter synthesised a set of strategic
processes for small businesses operating in a turbulent environment.
This literature review chapter leads to the next chapter, which is the research
methodology chapter which explains the research methodology employed in this
study.

114
CHAPTER THREE
RESEARCH METHODOLOGY

115
CHAPTER 3: RESEARCH METHODOLOGY
3.1 THE CHAPTER SUMMARY
This aims of this chapter were to describe the research stages and the elements
of the research process, focusing on the primary data collection methodology,
both qualitative and quantitative and the method that was used in the process of
theory building and proposition development, as well as explaining how the
instrument was designed, the nature of measurement, the soundness of
measurement, the pilot study, the population and sampling methods, the data
preparation and the data analysis methods.
This research methodology chapter commenced with a clear layout of the nine
research stages, from the research problem formulation stage to the data analysis
stage. The chapter then described the elements of the research process. The
degree of problem crystallisation was shown by the description of the research as
an initial qualitative, exploratory study, followed by a quantitative descriptive
analysis and finally by a quantitative, formal, empirical study method. The
researcher’s control of variables was illustrated by an explanation of how the
researcher had no control of the variables in the sense of being able to manipulate
them. The time-dimension of the study as was indicated by the cross-sectional
nature of the study, which showed that the study represented a moment in time.
The use of Dubin’s theory building and proposition development methodology was
clearly explained. Each proposition that was developed was motivated for
comprehensively in Chapter 2.
The questionnaire design process indicated how the themes that emerged from
the personal interviews with six small business owners, all retail community
pharmacists were incorporated into the draft questionnaire together with the
relevant strategic processes extracted from the literature.
This chapter also indicated that prior to the pilot study, this draft questionnaire,
was first evaluated by a panel of six experts, comprising, academics, small
business owners and pharmacists, and that the questionnaire was refined
according to the comments and suggestions, giving rise to the pilot questionnaire.
The pilot questionnaire was then subjected to a pilot study that comprised of ten
respondents, all small business owners who were retail community pharmacists.

116
This chapter described the nature of measurement used in the study as the Likert
scaling method and explained its appropriateness of use in this type of study. The
soundness of measurement in terms of validity and reliability parameters were
also described in this chapter. The content validity criterion was satisfied by the
evaluation of the draft questionnaire by the panel of experts. The criterion-related
validity parameter was satisfied by the genesis of the questionnaire in a validated
set of “best practices” from the Malcolm Baldrige National Quality Award Criteria.
The construct validity was satisfied by the use of the factor analysis which refined
the measuring instrument and confirmed that the factors actually measured the
strategic processes of small businesses operating in a turbulent environment. The
reliability criterion was satisfied by the high Cronbach Alpha values obtained
indicating the consistency and homogeneity among the items in the questionnaire.
The section dealing with the pilot study chapter commenced with an explanation of
the purpose of the pilot study and then a description of the pilot study participants,
who were ten small business owners who were retail community pharmacists. The
chapter then detailed the analytical procedures that were carried to ensure the
validity and reliability of the instrument, using the SPSS 11.5 statistical package.
The alpha coefficients that were obtained for the reliability analysis ranged from
moderate to high in general showing a moderate to high internal consistency in
the questionnaire. The factor analysis results that were obtained showed that a
five factor solution showed the best interpretable factor pattern, which loaded out
onto the factors staff, leadership, measurement, customers and networks and
support systems.
The chapter then explained that a second factor analysis was conducted on the
instrument after adjustment to the five factor solution, to ensure that the correct
factor solution was used. The second factor analysis results showed that the
factor, staff, loaded out onto a two factor solution, for knowledge, empowerment
and motivation as well as reward. This chapter thus showed that a five factor
solution showed the most interpretable factor patter, with the factor, staff being
sub-divided into staff knowledge, empowerment and motivation and staff reward.
The chapter explained the limitations to the pilot study and concluded that the
questionnaire had satisfactory reliability and validity for the study.
In dealing with the administration of the final questionnaire to the population under
test, the chapter highlighted the relevant population of this study [retail community
pharmacies that are small businesses], comprising of 2549 pharmacies. The

117
chapter also indicated that at a confidence level of 95% and a confidence interval
[expresses as a decimal] of 0.05, a sample size of 334 was required for this
population. The sample was selected using an unrestricted, simple, random,
probability sampling approach with the SPSS 11.5 statistical package. To account
for a 30% non response rate, 477 questionnaires were distributed. However, only
134 questionnaires were returned. Of these four questionnaires were incomplete
and were not included in the study. The study’s new confidence interval
[expressed as a decimal], with this reduced sample size was then calculated to be
0.08 at the 95% confidence level.
The chapter also indicated methods by which the data would be prepared for
analysis by describing the editing, coding and entering of data procedures.
The methods of data analysis were also described in this chapter with reasons
cited for the choice of descriptive and inferential statistics used in the study. The
chapter indicated that the type of descriptive statistics that this study used were
the means and the standard deviations. The means were used because they
measure the central tendency was used to determine the average response of
respondents towards a test, while the standard deviations were used because
they improve interpretability by removing the variance’s square and expressing
deviations in their original units.
Besides the Cronbach Alpha and factor analysis, the chapter indicated that t-tests
were also used. Since this study revolved around the determination of the
significance of the difference between two variables that were both provided by
the same set of respondents, the use of a paired t-test thus provided the best test
of statistical significance.

118
3.2 INTRODUCTION
Business research can be defined as a systematic investigation of phenomena of
interest to business decision makers. The use of scientific business research,
which is a specialized type of investigation characterized by the rigor of the
analytical tools and techniques applied, can result in research-based decision
making becoming an important tool for those organizations seeking competitive
advantage. Some of the defining characteristics of scientific business research
are:
• The purpose of the research must be clearly defined
• The research process must be detailed in a research proposal;
• The research design must be thoroughly planned
• The limitations must be frankly revealed
• The analysis of the data must be sufficiently adequate to reveal its
significance and the methods of analysis should be appropriate
• The findings must be presented unambiguously
• The conclusions must be justified
(Cooper and Schindler, 1998: 14-18)
The research purpose and the research objectives and the research propositions
are stated in chapter 1, as well as the scope and demarcation of the study and the
study limitations. The research design is also described in this chapter. In chapter
2, research propositions are derived from scientific literature, as well as from
existing research. The research methodology is described in this chapter and the
qualitative and quantitative findings are presented in Chapters 3. The results are
discussed in Chapter 5 and they form the basis of and justify the conclusions
presented in Chapter 6.
Babbie and Mouton (1998:74), Mouton (2001:56) and De Vos (2002:137) point out
that research methodology can be defined as the process, instruments and
procedures to be used in such research. Therefore this chapter will present the
details of the methodology applied to this study. This research study is a cross-
sectional, formal, qualitative and quantitative study. The qualitative aspect is
carried out via a series of personal interviews while the quantitative aspect uses
an ex post facto statistical design to achieve its research purpose viz. to
investigate the strategic processes carried out by small businesses operating in
turbulent environments through the achievement of the following core elements of
its research purpose:

119
1. The conceptual identification and the separation of dynamic capabilities
into those processes that are reconfiguration enabling processes and
those processes that are reconfiguration processes.
2. The conceptualisation of strategic processes or dynamic capabilities with
a specific set of measurable “best practice” processes that capture and
incorporate the idea of strategic processes or dynamic capabilities while
being grounded in empirical research.
3. The quantitative identification and description of the strategic processes or
dynamic capabilities of small businesses operating in a turbulent
environment and their resource allocation.
4. The development of a model that elucidates a rational, specific and
targeted approach to initiate and sustain the dynamic capabilities of small
businesses operating in a turbulent environment. The model will
differentiate dynamic capabilities into those that can be influenced by the
shorter-term intervention strategy of specifically increasing management
capabilities and those that require the longer-term strategy of altering the
general resource base of these small firms. By using this rational, specific
and targeted approach to initiate and sustain the dynamic
capabilities of these small firms, their dynamic capabilities will be
strengthened and hence the performance of these small firms in turbulent
environments will be optimised.

120
3.3 THE STAGES OF THE RESEARCH PROCESS
This study will follow a research plan in the nine stages outlined below:
Stage 1: The formulation of the research problem
The research problem to be investigated will be formulated from literature that
examined the background to the problem. This research stage is reported in
Chapter 1.
Stage 2 : The identification of the research purpose and the research objectives
Using the identified research problem, the research purpose and the research
objectives will be identified. This research stage is reported in Chapter 1.
Stage 3: The literature review
A detailed literature review will be performed on strategic processes, dynamic
capabilities, small business, quality, turbulent environment and changing
environment. This research stage is reported in Chapter 2.
Stage 4: The qualitative approach
An exploratory, qualitative investigation will be performed through the conduction
of personal interviews with six small business owners, all retail community
pharmacists. Key themes emerging from these interviews will inform the
questionnaire development process. This research stage is reported in Chapter 3.
Stage 5: The design of the instrument
Using the literature review and the key themes from the qualitative investigation, a
draft questionnaire will be developed to ensure that the research purpose and
objectives are achieved and the research propositions are satisfied and in so
doing, lead to a solution to the research problem. This questionnaire will be
evaluated by a panel of six experts, prior to being administered in the pilot study.
This research stage is reported in Chapter 3.

121
Stage 6: The pilot study
The pilot questionnaire will be distributed to ten respondents that are similar in
profile to the target population. The results of the pilot study will be analysed using
the SPSS 11.5 statistical package to ensure that the required validity and reliability
parameters are met. This research stage is reported in Chapter 3.
Stage 7: The development of the research propositions
Based on the literature review, the results of the expert panel evaluation, the
results obtained from the pilot study and the results of the qualitative analysis,
research propositions will be developed. This methodology of research stage is
reported in Chapter 3 and the research propositions and motivated for and
reported in Chapter 2.
Stage 8: The refinement of the final questionnaire and its administration
Based on the results of the pilot study, the final questionnaire will be refined and
then administered to the chosen sample of respondents. This research stage is
reported in Chapter 3.
Stage 9: Data analyses
Quantitative statistical analyses will be performed on the returned questionnaires
using the SPSS 11.5 statistical package. These are reported in Chapter 4.

122
FIGURE 9: A FLOWCHART OF THE RESEARCH STAGES
STAGE 4 QUALITATIVE
ANALYSIS- PERSONAL INTERVIEWS
STAGE 3 LITERATURE REVIEW
STAGE 5 INSTRUMENT DESIGN
STAGE 8 DISTRIBUTION OF FINAL
QUESTIONNAIRE
STAGE 9 DATA ANALYSIS
STAGE 6 PILOT STUDY
STAGE 2 RESEARCH PURPOSE
RESEARCH OBJECTIVES
STAGE 1 RESEARCH PROBLEM
STAGE 7 RESEARCH
PROPOSITIONS
Theoretical Model
Level of Importance
Extent of Implementation
GAP
RESULTS
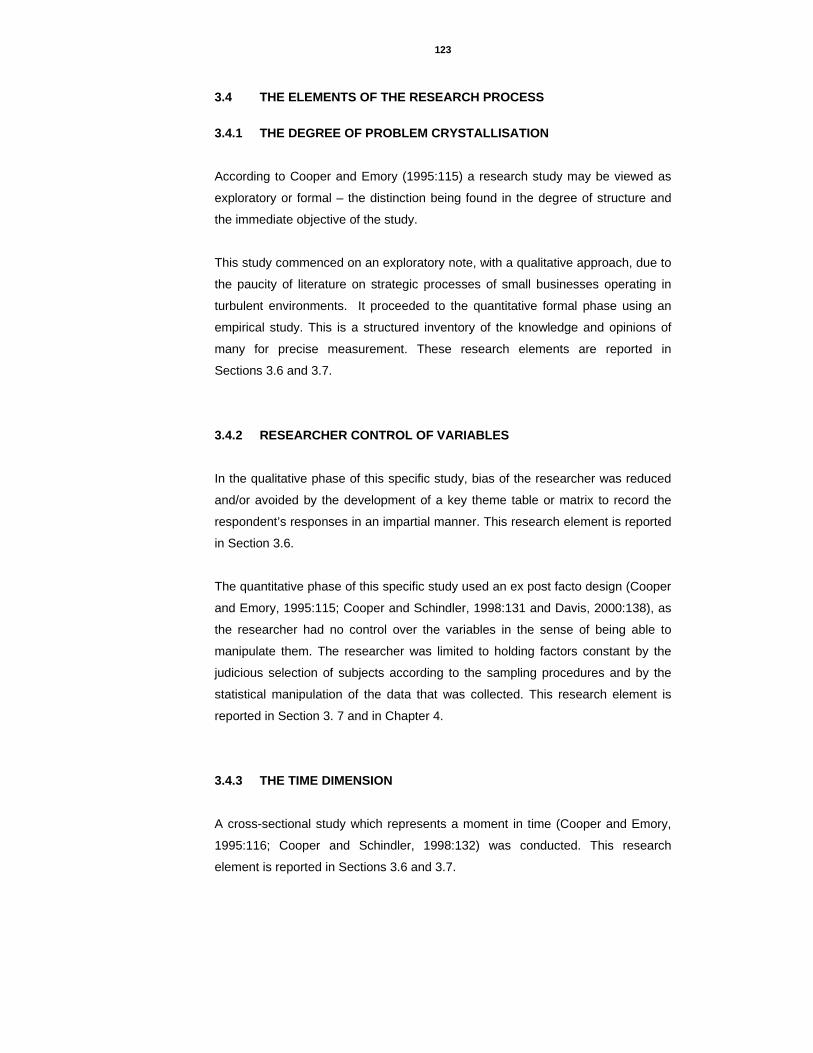
123
3.4 THE ELEMENTS OF THE RESEARCH PROCESS 3.4.1 THE DEGREE OF PROBLEM CRYSTALLISATION According to Cooper and Emory (1995:115) a research study may be viewed as
exploratory or formal – the distinction being found in the degree of structure and
the immediate objective of the study.
This study commenced on an exploratory note, with a qualitative approach, due to
the paucity of literature on strategic processes of small businesses operating in
turbulent environments. It proceeded to the quantitative formal phase using an
empirical study. This is a structured inventory of the knowledge and opinions of
many for precise measurement. These research elements are reported in
Sections 3.6 and 3.7.
3.4.2 RESEARCHER CONTROL OF VARIABLES
In the qualitative phase of this specific study, bias of the researcher was reduced
and/or avoided by the development of a key theme table or matrix to record the
respondent’s responses in an impartial manner. This research element is reported
in Section 3.6.
The quantitative phase of this specific study used an ex post facto design (Cooper
and Emory, 1995:115; Cooper and Schindler, 1998:131 and Davis, 2000:138), as
the researcher had no control over the variables in the sense of being able to
manipulate them. The researcher was limited to holding factors constant by the
judicious selection of subjects according to the sampling procedures and by the
statistical manipulation of the data that was collected. This research element is
reported in Section 3. 7 and in Chapter 4.
3.4.3 THE TIME DIMENSION
A cross-sectional study which represents a moment in time (Cooper and Emory,
1995:116; Cooper and Schindler, 1998:132) was conducted. This research
element is reported in Sections 3.6 and 3.7.
124
3.4.4 THEORY BUILDING AND PROPOSITION DEVELOPMENT
A proposition is a statement about concepts that may be judged true or false, if it
refers to observable phenomena, while a hypothesis is a proposition that is
formulated for empirical testing (Cooper and Schindler, 1998: 43). By the
development of a set of propositions that establish the relationship between things
in a systematic way theories can be created (Henning, 2004:14). Thus proposition
research is especially useful in researching areas that that are new and that can
be observed and described, in order to generate new theories and contribute to
the development of the area’s body of knowledge. A theory is a system of ideas
and abstracts that organizes knowledge about the social world (Neuman, 2000).
This research element is reported in Section 3.5.

125
3.5. THEORY BUILDING AND PROPOSITION DEVELOPMENT The literature review reported on in Chapter 2, shows a paucity of literature and
research on the strategic processes of small businesses operating in a turbulent
environment. Thus, this study’s approach to building theory will be a valuable
contribution to this field of study. This study uses propositions rather than
hypotheses for the following reasons:
♦ Subject area –the subject area, the strategic processes of small
businesses operating in a turbulent environment, is relatively new and
there is a paucity of literature and research in this area. Since, this study
is not based on any previously derived research model specific to the
subject area, the use of propositions enables the study to be approached
from a much more pragmatic and meaningful viewpoint.
♦ Observable phenomena – the strategic processes of small businesses
operating in a turbulent environment are observable and describable
phenomena.
Dubin (1978) describes an eight –step theory building methodology. Dubin’s
theory building method has been described by Chermack (2005:61), as the most
appropriate and comprehensive method of theory building available.
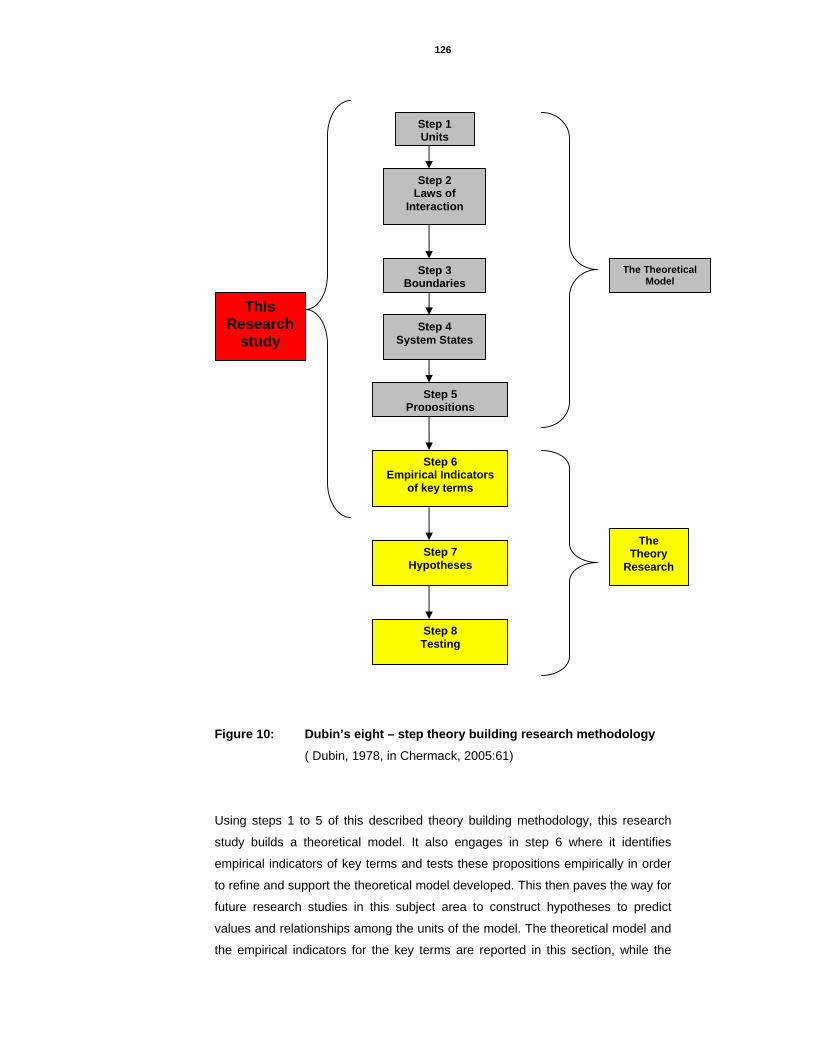
126
Figure 10: Dubin’s eight – step theory building research methodology ( Dubin, 1978, in Chermack, 2005:61)
Using steps 1 to 5 of this described theory building methodology, this research
study builds a theoretical model. It also engages in step 6 where it identifies
empirical indicators of key terms and tests these propositions empirically in order
to refine and support the theoretical model developed. This then paves the way for
future research studies in this subject area to construct hypotheses to predict
values and relationships among the units of the model. The theoretical model and
the empirical indicators for the key terms are reported in this section, while the
Step 1 Units
Step 2 Laws of
Interaction
Step 3 Boundaries
Step 4System States
Step 5 Propositions
Step 6 Empirical Indicators
of key terms
Step 7 Hypotheses
Step 8 Testing
The Theoretical Model
The Theory
Research
This Research
study

127
propositions are comprehensively motivated for in Chapter 2. The empirical tests
are reported in Chapters 4 and 5, while Chapter 5 draws conclusions regarding
any empirical support for the theoretical model based on the results obtained.
Step 1: Developing units of the theory.
The units of the theory are the building blocks of the theory and are selected
based on the literature (Chermack, 2005:61) and experience (Lynham, 2002:221).
The theorist thus has unlimited opportunities to employ units of his/her choice
(Dubin, 1978:78). The units of a theory of strategic processes of small businesses
operating in a turbulent environment are:
1. The level of importance of strategic processes, in general and specifically,
the level of importance of reconfiguration enabling processes and the
level of importance of reconfiguration processes by small businesses
operating in a turbulent environment
2. The extent of implementation of strategic processes, in general, and
specifically, the extent of implementation of reconfiguration enabling
processes and the extent of implementation of reconfiguration processes
by small businesses operating in a turbulent environment.
Dubin (1978:73) has proposed four guidelines to assess the appropriateness of
the units chosen. They are:
Guideline 1—Relational units cannot be combined in the same theory with
enumerative or associative units that are themselves properties of that relational
unit.
Guideline 2—Where a statistical unit is employed, it is by definition a property of a
collective. In the same theory, do not combine such a statistical unit with any kind
of unit (enumerative, associative, or relational) describing a property of members
of the same collective.
Guideline 3—Summative units have utility in education of and communication
with those who are naïve in a field. Summative units are not employed in scientific
models.
Guideline 4—A unit type must be chosen, and a unit can be of only one type.
Further specification is at the discretion of the theorist. The initial distinctions are

128
intended to help the theorist in considering the variables to include in the theory
and to assess the maturity or development stage of the domains to be included.
The proposed theoretical model of strategic processes of small businesses
operating in a turbulent environment combines only enumerative units. Therefore,
there is no risk of violating any of the four guidelines proposed by Dubin (1978).
The elements of each unit have been reported on in the literature review in
Chapter 2.
Step 2: Specifying the laws of interaction describing the relationships among the units.
The laws of interaction describe how the units relate to each other. The proposed
theoretical model of strategic processes of small businesses operating in a
turbulent environment includes five categorical laws and two sequential laws. “A
categoric law of interaction is one that states that values of a unit are associated
with values of another unit” (Dubin, 1978: 98). Sequential laws of interaction are
defined as laws that are “always employing a time dimension. The time dimension
is used to order the relationship among two or more units” (Dubin, 1978: 101), i.e.
that one precedes the other.
Categorical laws:
1. All units are required for the theory to function.
2. There is a greater-than-chance probability that the level of importance of
strategic processes in small businesses operating in a turbulent
environment is associated with the extent of implementation of strategic
processes in these small businesses.
3. There is a greater-than-chance probability that the level of importance of
reconfiguration enabling processes in small businesses operating in a
turbulent environment is associated with the extent of implementation of
reconfiguration enabling processes in these small businesses.
4. There is a greater-than-chance probability that the level of importance of
reconfiguration processes in small businesses operating in a turbulent
environment is associated with the extent of implementation of
reconfiguration processes in these small businesses.
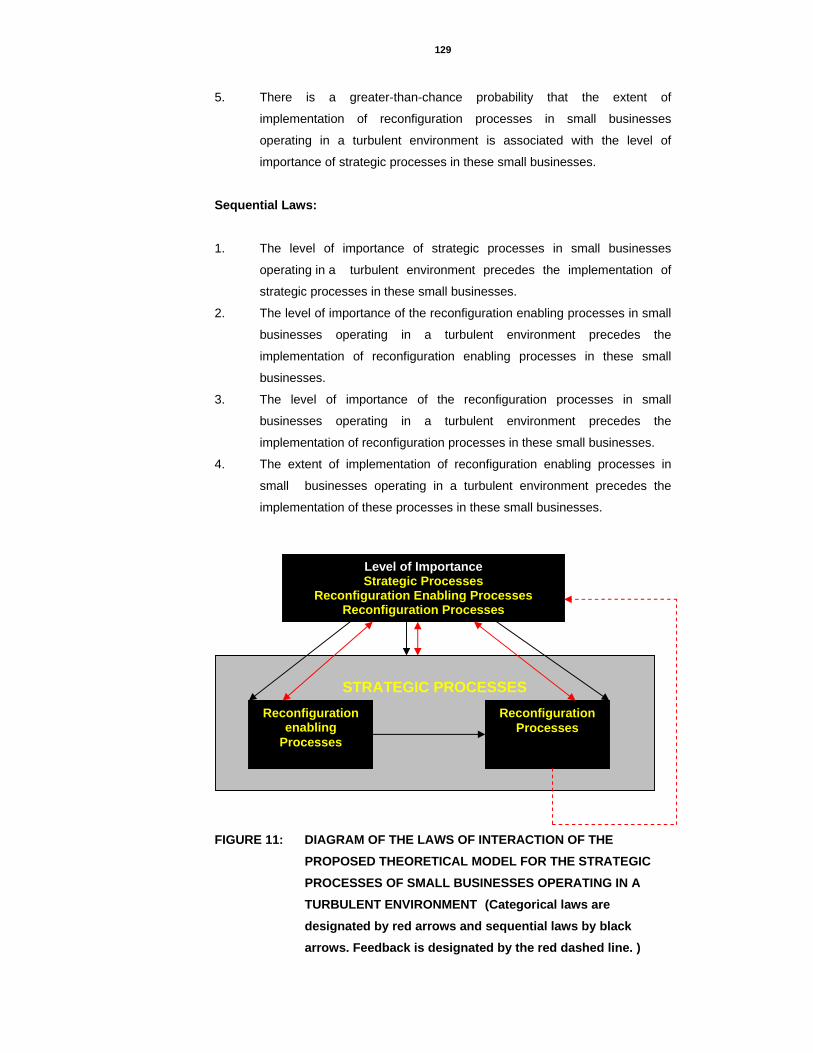
129
5. There is a greater-than-chance probability that the extent of
implementation of reconfiguration processes in small businesses
operating in a turbulent environment is associated with the level of
importance of strategic processes in these small businesses.
Sequential Laws:
1. The level of importance of strategic processes in small businesses
operating in a turbulent environment precedes the implementation of
strategic processes in these small businesses.
2. The level of importance of the reconfiguration enabling processes in small
businesses operating in a turbulent environment precedes the
implementation of reconfiguration enabling processes in these small
businesses.
3. The level of importance of the reconfiguration processes in small
businesses operating in a turbulent environment precedes the
implementation of reconfiguration processes in these small businesses.
4. The extent of implementation of reconfiguration enabling processes in
small businesses operating in a turbulent environment precedes the
implementation of these processes in these small businesses.
FIGURE 11: DIAGRAM OF THE LAWS OF INTERACTION OF THE PROPOSED THEORETICAL MODEL FOR THE STRATEGIC PROCESSES OF SMALL BUSINESSES OPERATING IN A TURBULENT ENVIRONMENT (Categorical laws are designated by red arrows and sequential laws by black arrows. Feedback is designated by the red dashed line. )
Level of ImportanceStrategic Processes
Reconfiguration Enabling Processes Reconfiguration Processes
STRATEGIC PROCESSES
Reconfiguration enabling
Processes
Reconfiguration Processes

130
Dubin (1978) designated parsimony as the single criteria for evaluating the laws of
interaction in a theoretical model. Parsimony is established by utilizing the
minimum complexity and number of laws necessary to relate all of the units in the
model and has solely to do with the number of laws that link the units. In this
proposed theory, the minimum number of laws is used to connect each unit,
categorically, and sequentially, including a law stating the requirement for all
stated units, and one law covering the influence of feedback from reconfiguration
processes. This gives five categorical laws and four sequential laws.
Step 3: Determining the boundaries within which the theory is expected to function.
The boundaries locate the theory in its environment. The determination of the
boundaries of a theoretical model requires that the theorist identify the domain or
multiple domains in which the theory is expected to operate (Dubin, 1978).
There are two boundaries for this proposed theoretical model viz. small
businesses and turbulent environments. The elements of each boundary have
been reported on in the literature review in Chapter 2. They will be described
again below to provide justification for the use of these particular boundaries in the
theory.

131
FIGURE 12: THE BOUNDARIES OF A THEORY ON THE STRATEGIC PROCESSES OF SMALL BUSINESSES OPERATING IN A TURBULENT ENVIRONMENT.
TURBULENT ENVIRONMENT
SMALL BUSINESSES
STRATEGIC PROCESSES
IMPORTANCE/IMPLEMENTATION
Reconfiguration
enabling processes
Reconfiguration Processes
input output
Burdens of Legislation Competition
Resources Management Capabilities

132
Step 4: Identifying the system states in which the theory is expected to function.
According to Dubin (1978:144), a state of a system may be defined by three
features:
1. All units of the system have characteristic values
2. The characteristic values of all units are determinant
3. This constellation of unit values persists through time
Thus, it is necessary for the values of all units to be known in order to determine
the system state.
The level of strategic process implementation will vary and transit among several
states. Borrowing from Chermack (2005:65) and to illustrate the differing states of
transition, the theory proposed will adopt a (0, 1) coding. By this, it is intended that
0 indicates absence of the characteristic under examination (for example, if the
unit level of importance of strategic processes was coded 0, this would be taken to
indicate an absence of importance).
Any value other than 0 assigned to a state, reflects the level of development of
that state. In addition, the laws of interaction suggest that the theory being
developed occurs along a time sequence i.e. actions with regard to specific units
precede the actions with regards to others. Thus, as the system transitions from
state to state, the unit values shift from 0 to 1.
There are five system states in this proposed theory:
1. System state 1- Non-operation (unit value =0)
2. System state 2- Level of importance of strategic processes,
reconfiguration enabling processes and
reconfiguration processes (unit value 0 to 1,
depending on level of importance)
3. System state 3- Extent of implementation of strategic processes
(unit value 0 to 1, depending on extent of
implementation)
3. System state 4- Extent of implementation of reconfiguration
enabling processes (unit value 0 to 1, depending
on extent of implementation)
133
4. System state 5- Extent of implementation of reconfiguration
processes (unit value 0 to 1, depending on
level of importance)
Step 5: Specifying the propositions about how the theory is expected to operate.
According to Dubin (1978: 160), a proposition may be defined as a truth statement
about a model when the model is fully specified in its units, laws on interaction,
boundary and system states. Thus, propositions are predictive statements that
follow logically from the previous steps of the theory building method. Therefore,
the logical steps for a theory on strategic processes for small businesses
operating in a turbulent environment are as follows:
Proposition 1: If there is a positive correlation between the level of importance and extent of
implementation of strategic processes in small businesses operating in a turbulent
environment, then the extent of implementation of these processes will increase
with an increase in the level of importance of these processes in these small firms.
Proposition 2: If there is a positive correlation between the level of importance and extent of
implementation of reconfiguration enabling processes in small businesses
operating in a turbulent environment, then the extent of implementation of these
processes will increase with an increase in the level of importance of these
processes in these small firms.
Proposition 3: If there is a positive correlation between the level of importance and extent of
implementation of reconfiguration processes in small businesses operating in a
turbulent environment, then the extent of implementation of these processes will
increase with an increase in the level of importance of these processes in these
small firms.

134
Step 6: Empirical Indicators of a theory of the strategic processes of small businesses operating in a turbulent environment
Informed by the above propositions and the literature three empirical indicators
are identified for the proposed theory on the strategic processes of small
businesses operating in a turbulent environment. These empirical indicators are
necessary to be able to identify values and measures for the interacting units of
the proposed theory, which must be verified through empirical research (Lynham
and Chermack, 2006: 82). This theory empirically tests these developed indicators
in order to refine and support the theoretical model developed. The general
empirical indicators of the proposed theory are as follows:
1. Empirical Indicator 1 for the Unit: Extent of implementation of strategic processes
The value of the unit will increase as a result of an increase in the level of
importance of strategic processes as measured by any instrument that
measures the allocation of resources to these strategic processes.
2. Empirical Indicator 2 for the Unit: Extent of implementation of reconfiguration enabling processes
The value of the unit will increase as a result of an increase in the level of
importance of reconfiguration enabling processes as measured by any
instrument that measures the allocation of resources to individual
reconfiguration enabling processes.
3. Empirical Indicator 3 for the Unit: Extent of implementation of reconfiguration processes
The value of the unit will increase as a result of an increase in the level of
importance of reconfiguration processes as measured by any instrument
that measures the allocation of resources to individual reconfiguration
processes.

135
FIGURE 13: A THEORETICAL MODEL OF THE STRATEGIC PROCESSES OF SMALL BUSINESSES OPERATING IN A TURBULENT ENVIRONMENT
The completion of Dubin’s steps 1-5 (Dubin, 1978), results in a theoretical model
for the strategic processes of small businesses operating in a turbulent
environment. Furthermore, this section also engaged in step 6 of Dubin’s theory
building methodology by developing empirical indicators of key terms. Chapter 4
will show the empirical testing of these key terms in order to refine and support the
theoretical model. This will pave the way for future research studies to formulate
and test hypotheses that can predict values and relationships in this model.
TURBULENT ENVIRONMENT
SMALL BUSINESSES
STRATEGIC PROCESSES
input output
Burdens of Legislation Competition
Resources
Importance of strategic processes, reconfiguration
enabling processes and reconfiguration processes
Implementation of
reconfiguration enabling
processes
Implementation of
reconfiguration processes Management
Capabilities

136
The essence of the theoretical model specifies the core concepts in the theory,
how they interrelate, the context in which they relate, the conditions under which
the theoretical model is expected to operate, and the propositions about the
model. In addition, this section also lays down the groundwork for part two of
Dubin’s eight-step theory building research methodology ( Dubin,1978), by
formulating empirical indicators for the proposed theory. Thus, this section has
provided a logical model with empirical indicators.
The literature review in Chapter 2 has indicated that this is the first of its kind
pertaining to phenomena known as the strategic processes of small businesses
operating in a turbulent environment.

137
3.6 THE QUALITATIVE APPROACH: PERSONAL INTERVIEWS
Qualitative research is an unstructured, exploratory research method based on
small samples intended to provide insight and understanding of the problem
setting (Malhotra, 1996:164). In this study, the qualitative research was executed
by means of personal interviews with the leadership of small businesses [retail
community pharmacies]. The main aim of this procedure was to identify important
aspects to be included in the questionnaire [measuring instrument] that may have
been absent from the literature due to a paucity of information and literature
available on the strategic processes of small businesses operating in a turbulent
environment.
Face–to-face semi-structured interviews were conducted with a group of six small
business owners; all retail community pharmacists. Due to the initial exploratory
nature of this study, this method was particularly appropriate. The choice of the
members of the group was based on the match of the business to the research
questions, the accessibility and the availability of the small business leadership as
well as the willingness of the small business leadership to be interviewed. In order
to manage and extract meaningful trends from the qualitative data generated by
the interviews the size of the group was limited to six.
The interviews were conducted in a semi-structured conversational manner, with
the interviewer (the researcher) guiding the discussion in order to maintain it within
the boundaries of the research topic. The interviewer made notes to record the
discussion as it progresses.
According to Cooper and Schindler (1998:291), a personal interview is a two-way
conversation initiated by an interviewer to obtain information from a respondent.
The interviewer generally controls the topics and patterns of discussion. While this
is a costly method, both in terms of time and money, the advantages of personal
interviews include:
The depth of information and detail that can be secured.
The greater control that interviewers possess in this type of interrogation.
The ability to adjust the language of the interview.
The initial exploratory nature of this study required a method of data collection that
would allow the generation of ideas, themes and topics that may not have been
found in the literature due to the paucity of research and literature on the strategic

138
processes of small businesses that operate in a turbulent environment, hence the
use of the personal interview research methodology.
A successful personal interview must meet three broad conditions viz.:
Availability of the needed information from the respondent
An understanding by the respondent of his or her role
Adequate motivation by the respondent to cooperate
(Cooper and Schindler; 1998:292).
In this study, the respondents were all small business owners who are retail
community pharmacists. From the interview introduction, each respondent was
made aware of his role in the interview. Furthermore, being a small business
owner operating in a turbulent environment, each respondent was acutely aware
of the impact of the environment on his business and in addition each respondent
was informed that a summary of the results of this study would be made available
to each respondent.
According to Cooper and Schindler (1998: 297) that non-response and response
errors as well as sampling errors can occur during this type of surveying. This
study ensured that specific appointments were made with each respondent at
times that the respondent was available and furthermore, by specifically recording
all answers in a key theme table or matrix, there was impartiality in the recording
and interpreting of answers.
This research element is reported in Section 3.7.1.
3.7 THE QUANTITATIVE APPROACH: THE SELF-ADMINISTERED MAIL SURVEY The quantitative phase of this research study is a formal, structured, empirical
self-administered questionnaire. According to Cooper and Schindler (1998: 303)
the self-administered questionnaire has become ubiquitous in modern living.
A draft questionnaire was designed to establish and quantify the level of
importance and extent of implementation of strategic processes in small
businesses. This instrument was constructed from the concepts and themes
extracted from the literature as well from the semi-structured personal interviews.
The draft instrument was refined following an evaluation by a panel of six experts.

139
The panel of experts used comprised academics, pharmacists and small business
owners and the participants in the pilot study comprised small business owners
from the retail community pharmacy sector. The draft instrument was then
administered to participants of the pilot study and the returned questionnaires
analysed. The results obtained from this analysis formed the basis for the further
refinement of the questionnaire in order to create the final questionnaire. The final
measuring instrument was then administered to the sample of the population that
was calculated to provide statistically significant results.
According to Cooper and Schindler (1998:304), although this method has some
disadvantages e.g. accurate mailing lists required, no interviewer intervention
available for probing or explanation and skewed responses are often obtained; the
advantages are particularly suitable to this study, in that it allowed contact with
otherwise inaccessible respondents, it allowed for an increased geographical
coverage without an increase in costs, its anonymity allowed for more complete
and honest answers and it allowed the respondents more time to think about the
answers.
The study also attempted to overcome the disadvantages of this survey method
by ensuring that the covering letter and the questionnaire instructions were as
complete and as concise as possible. This process was aided by the pre-
evaluation by the panel of experts as well as the pilot study. The pilot study
together with the reliability and validity tests and the factor analysis performed
reduced the impact of any skewed responses. Furthermore, the target population
was the retail community pharmacy population, whose contact details were
obtained from the South African Pharmacy Council.
These research elements are reported in Sections 3.8 and 3.9.

140
3.7.1 THE DESIGN OF THE INSTRUMENT
An instrument is the primary device by which measurement is accomplished and
in the development of a measurement scale the variables and concepts that need
to be measured for the study must be determined ( Davis,2000:193:194).
In this study this determination started with the identification of the research
problem the research purpose and the research objectives and subsequently
flowed to the literature review and the set of personal interviews conducted.
Strategic concerns in the design of the instrument include:
What type of data is needed to find a solution to the research problem?
What communication approach will be used?
Should the questions be structured, unstructured or some combination?
(Cooper and Schindler, 1998:324)
Small businesses are organic and loosely structured, rather than mechanistic and
highly formalised. Thus, the processes in a small firm are seldom readily visible
(Beaver and Jennings, 2005:9). Moreover, there is paucity of information on
strategic processes of small businesses operating in a turbulent environment.
Therefore the qualitative approach was an especially appropriate method with
which to commence this study’s investigative process.
However, Beaver and Jennings (2005:9), also note that despite this loose and less
formal approach to management processes in small businesses, certain essential
management activities that have been defined and refined throughout a long
history of management research must be carried out. Hence, this study combined
the qualitative approach with a quantitative approach that uses identified “best
practices” for small business excellence as its basis. This approach is also
supported by Cooper and Schindler (1998:309) who have state that using a
mixed-mode of communication with respondents enables the tailoring of the
research method to suit the unique needs of a study.

141
3.7.1.1 THEMES THAT EMERGED FROM THE PERSONAL INTERVIEWS
The following table describes the results of the personal interviews.
TABLE 3: THEMES EMERGING FROM THE PERSONAL INTERVIEWS
THEME KEYWORDS USED
STRATEGIES Cost minimization, value added services, focus on
key lines, focus on core business, broad goals which
guide decisions, customer service, staff focus, support systems, and leadership.
CUSTOMERS & CUSTOMER SERVICE
Excellent, personalized, loyalty, good communication
and feedback, trust, knowledge, skills, attitude and
good relationships
STAFF Backbone of business, loyalty, good communication,
support and understaffing
SUPPORT SYSTEMS Family, friends, community and professional [limited]
LEADERSHIP Plan and make decisions with limited input from staff,
informal methods of scanning the environment, finger-
on-the-pulse, active, busy, hectic work environment,
pressure, low morale, decreased motivation,
decreased risk taking, and hesitancy.
The information obtained from the interviews informed the design of the
measuring instrument in order to improve on the richness and quality of the
research outcome.

142
3.7.1.2 DEVELOPMENT OF QUESTIONS
From the literature review in Chapter 2, emerged the reconfiguration enabling
processes and the specific reconfiguration processes that lead to innovative
resource reconfigurations. From the personal interviews in the section 4.2,
emerged the key themes and core concepts of customers and customer service,
staff, support systems and leadership. The questionnaire will be based on a
synthesis of these streams. The synthesis of these separate streams formed the
basis of the questionnaire design.
Figure 14 : QUESTIONNAIRE DESIGN
QU
ESTI
ON
NA
IRE
LITERATURE: STRATEGIC PROCESSES
Reconfiguration enabling processes
Reconfiguration processes
PERSONAL INTERVIEW RESULTS

143
FIGURE 15 : QUESTIONNAIRE DESIGN AND EXPECTED OUTCOMES 3.7.1.3 PROCESSES AS QUESTIONS IN THE QUESTIONNAIRE The following processes were incorporated as questions into the questionnaire.
Some processes contain multiple ideas, which have been described by Alreck
and Settle (1995) as “double-barrelled” questions. They have also said that
respondents may be confused as to how to respond to these type of questions.
However, this study’s rationale in using these types of questions was to prevent
the survey from containing more questions and becoming longer. Moreover, it was
also anticipated that the review of the questionnaire by the expert panel group and
the pilot testing of the questionnaire would refine the questions that would be
incorporated into the final questionnaire. The following table summarises the
questions developed for the questionnaire to be evaluated by the panel of experts
and subsequently to undergo pilot testing.
QU
ESTI
ON
NA
IRE
LITERATURE: STRATEGIC PROCESSES
Reconfiguration enabling processes
Reconfiguration processes
PERSONAL INTERVIEW RESULTS
IMPORTANCE
IMPLEMENTATION
GAP
♦
Res
ourc
e al
loca
tion
to re
conf
igur
atio
n en
ablin
g pr
oces
ses
an
d re
conf
igur
atio
n pr
oces
ses
♦
Iden
tify
thos
e pr
oces
ses
who
se le
vel o
f im
plem
enta
tion
can
be in
crea
sed
by in
crea
sing
leve
l of i
mpo
rtan
ce.

144
TABLE 4 : QUESTIONS DEVELOPED FOR THE QUESTIONNAIRE
Process 1: The leadership of small business takes into account the needs and expectations of all stakeholders, the changing, turbulent and competitive environment, regulatory, financial, market, technological, societal and other risks as well as factors unique to the organisation, when establishing organisational values, goals and performance expectations as well as when looking for business opportunities
Process 2: The leadership of small businesses, through both formal and
informal approaches fosters staff empowerment and innovation.
Process 3: The leadership of small businesses serve as role models for
the organisation and all stakeholders. Their values and expectations of performance are communicated and reinforced among managers and throughout the entire workforce.
Process 4: The leadership of small businesses participates, encourages,
supports, and recognizes involvement with their communities and professional associations to both support and strengthen them as well as the small business.
Process 5: The leadership of small businesses have strong friend, family and professional support networks,
Process 6: In its decision-making processes, the leadership of small
businesses takes into account it’s legal, ethical and risk requirements. By systematically addressing current and potential impacts in the decision-making processes, these become an integral part of performance management and improvement.

145
Process 7: The leadership of small businesses is able to formulate a few simple rules to guide its strategic processes – how to execute a strategic process; know which opportunities can be pursued and which are outside the pale; able to rank the accepted opportunities, synchronize the pace of emerging opportunities and other parts of the company and know when to pull out of yesterday’s opportunities.
Process 8: The leadership of small businesses is able to restructure the
business portfolio by creating a patching structure of enteprise in order to fit changing market opportunities – the business units are modular, focused and discrete so that they can be combine seamlessly; there is access to trends and knowledge that can help to predict when to restructure the business; there is an ability to recognize patterns and trends that develop in the market place; market segmentation which reveals how to optimally configure patches to exploit market opportunities, is clearly understood; road maps which suggest how future patches are likely to evolve, are available.
Process 9: The leadership of small businesses can enable the business
to co-evolve by fostering, driving and executing collaborative linkages and managing group dynamics while at the same time rewarding individual performance.
Process 10: The leadership of small businesses is able to lead with an
impelling strategic focus while allowing organizational members to be active players in the strategic process.
Process 11: The strategies that are developed are clearly translated into
action plans that support the achievement of organizational objectives.
Process 12: The leadership of small businesses have a thorough
understanding of available resources, both internal and external, that can enable the achievement of strategic goals.
Process 13: The leadership of small businesses are able to devise
appropriate strategies that can maximise any resource advantage and overcome any resource limitation

146
Process 14: Key human resource plans are derived from and linked to the overall business strategy with respect to work design; employee development, education and training; compensation and benefits and recruitment.
Process 15: Work and job descriptions are created, organized and
managed in such a manner so as to promote cooperation, initiative and innovation as well as to empower people and further entrench the organizational culture. In addition, these work and job descriptions promote high performance and lead to flexibility and rapid response to the changing requirements of the marketplace.
Process 16: Compensation and recognition approaches for individuals
and groups, reinforces performance, teamwork, and learning objectives.
Process 17: Staff education, development and training activities are
structured to balance organizational objectives with employee’s individual knowledge and skills needs. The envisaged activities are jointly designed by the employees concerned and their managers detailing the specific needs, objectives and performance measures, clearly.
Process 18: There is ease of access for small businesses customers
when they are seeking information or assistance and/or when they wish to comment or complain.
Process 19: A complaint management process exists that ensures
complaints are not only resolved effectively and promptly but are also analysed as a source of improvement activities.
Process 20: Good relationships with customers are actively pursued and
maintained by both staff and the leadership of small businesses.
Process 21: The staff and leadership of small businesses ensure that
personalized service is offered to customers

147
Process 22: The skills, knowledge, values and attitudes of the staff and leadership of small businesses are important, relevant, valuable and available to customers.
Process 23: The design of key services and the service delivery process
is addressed systematically, incorporating all stakeholders and accounting for changing customer requirements, the environment and technology.
Process 24: The design of key services and the service delivery process
incorporates quality and operational performance requirements such as cost control, health, safety, and environmental impacts, process capability, maintainability, supplier capability and cycle time.
Process 25: The organization regularly measures and analyses organizational performance and provides the information and data to support the organisation’s strategic planning process, as well as its operational and functional processes to enable continuous improvement.
Process 26: A variety of employee support services ( well being and
motivation ) are available, and are periodically evaluated and improved to meet employee’s needs. Both formal and informal methods- such as surveys, exit interviews and tracking absenteeism and turnover – are used to determine employee well-being, satisfaction, and motivation.
Process 27: The company gathers information about customer
satisfaction for all key customer segments and captures information that reflects transaction quality, customer purchase, new business, and positive referral. Customer satisfaction measures are used to drive improvement and better understand the factors that drive markets.

148
Process 28: Key information and data - financial and non-financial- is clearly linked to the organisation’s processes and goals, and are systematically gathered and used to track and improve the company’s performance at all levels.
Process 29: Key performance measures embedded in the action plans
and are used to systematically track progress towards meeting organizational strategies
Process 30: Employees and other stakeholders who need information to
effectively perform their work have convenient access to all necessary information.
Process 31: The type and quality of data and information collected, as
well as its usage and effectiveness, are periodically evaluated, improved and kept current with changing trends.
Process 32: The small business captures trends and analyses key
measures of: * Operational and service performance such as productivity, cycle time, supplier and partner performance and other appropriate measures of effectiveness and efficiency. These results are compared against industry or best-in-class benchmarks. * Regulatory compliance and environmental improvements. These results are compared against industry or best-in-class benchmarks. * Customer and markets satisfaction and dissatisfaction – such as retention, gains and losses of customers, perceived value of products and services and satisfaction relative to competitors. These results are compared against industry or best-in-class benchmarks. * Financial performance, including aggregate measures of financial return and economic value added, return on investment, operating profit, pre-tax profit margin and/or market share and business growth as appropriate. These results are compared against industry or best-in-class benchmarks. * Employee well-being, satisfaction, development, work-system improvement and effectiveness. These results are compared against industry or best-in-class benchmarks.

149
3.7.2 THE NATURE OF THE MEASUREMENT
Measurement in research consists of assigning numbers to empirical events in
compliance with a set of rules (Cooper & Emory, 1995:141; Cooper & Schindler,
1998:159). This implies that measurement is a three-part process:
1. Selecting observable empirical events
2. Using numbers or symbols to represent aspects of the event; and
3. Applying a mapping rule to connect the observation of the symbol
(Cooper & Emory, 1995:142)
The characteristics and properties of empirical events can therefore be translated
into a form that can be analysed by the researcher (Davis, 2000:166). The
procedure for the assignment of numbers (or other symbols) to a property of
objects in order to impart some of the characteristics of numbers to the properties
in question is called scaling (Cooper and Schindler, 1998:184).
This study used the Likert scaling method. In this method, the statements in the
questionnaire express either a favourable or unfavourable attitude towards an
object of interest. The respondent is asked to agree or disagree with each
statement. Each response is given a numerical score to reflect the degree of
attitude favourableness, and the scores may be totalled to measure the
respondent’s attitude (Cooper and Schindler, 1998:189). In this study, the
respondent was asked to indicate the level of importance ascribed to strategic
processes and the extent of implementation of these processes in the small
business.
This research element is reported in the pilot and final questionnaires in
Annexures 1A and 1B.
3.7.3 THE SOUNDNESS OF MEASUREMENT Essential to any research endeavour, is its credibility; which depends on the
soundness of its measurements. According to Cooper and Schindler (1998: 166),
the two important characteristics of sound measurement are: validity and
reliability. This study carried out processes to ensure the reliability and the validity
of the instrument of measurement. The methodology used to ensure these
parameters is reported below.

150
3.7.3.1 VALIDITY This study was carried out processes to ensure content, criterion-related and
construct validity.
CONTENT VALIDITY This is the extent to which the content of the items provides adequate coverage of
the topic under study (Cooper & Schindler, 1998: 167). The literature was
consulted and personal interviews were conducted in order to identify elements
relevant to strategic processes, small businesses and turbulent environments as
well as quality frameworks. According to Cooper & Schindler (1998: 167), other
methods that are used to achieve content validity include a judgmental or panel
evaluation. This study used an expert panel consisting of academics, pharmacists
and small business owners. The proposed questions were submitted the panel
and the comments that were received from the panel were used to refine the
questionnaire. The most common comments received from the panel were with
respect to the re-phrasing of certain questions that could have introduced
ambiguity into the measuring instrument. The wording of the questions was
adjusted accordingly and the final wording is reflected in the pilot questionnaire in
Annexure 1A.
CRITERION-RELATED VALIDITY
According to Durham and Terrblanche (2002:83), criterion-related validity is the
degree to which a measure is related to some other standard or criterion that is
known to indicate the construct accurately. The measuring instrument used in this
study has its genesis in the framework followed the Malcolm Baldrige National
Quality Award, described in the literature review in chapter 2.
CONSTRUCT VALIDITY Construct validity refers to how well the results obtained from the use of the
measures fit the theories around which the test is designed (Sekaran, 1992:173).
According to Cooper and Schindler (1998:167), the use of factor analysis can
determine the construct validity of a measuring instrument. An initial factor
analysis (described in the pilot study in Section 3.8) performed on the measuring
instrument refined the measuring instrument structure. A further factor analysis
(described in the pilot study in Section 3.8) on the refined instrument confirmed

151
that the factors actually measured the strategic processes of small businesses
operating in a turbulent environment.
3.7.3.2 RELIABILITY Reliability refers to the degree to which measures are free from error and
therefore yield consistent results (Zikmund, 2003:300). The Cronbach Alpha test is
regarded as useful in indicating reliability (Cooper and Schindler, 1998:171).This
study uses the Cronbach Alpha values to test for internal consistency. The high
Cronbach Alpha values (described in the pilot study in (Section 3.8) obtained
indicates that there will be consistency and homogeneity among the items in the
final, refined, measuring instrument.
These research elements are reported in Section 3.8.
3.8 THE PILOT STUDY The purpose of this pilot study was three fold. The first objective was to evaluate
the mechanical aspects (grammar, form content, readability etc.) of the draft
questionnaire. The second objective was to determine construct validity of the
questionnaire and the third objective was to determine the reliability of the
instrument in terms of its internal consistency.
3.8.1 THE PARTICIPANTS
Participants were small business owners who were retail community pharmacists.
A total of 10 individuals participated in the pilot study.
3.8.2 THE INSTRUMENT
The draft instrument that was designed in Section 3.7.1 was refined following an
evaluation by a panel of six experts, prior to its administration to the respondents
of the pilot study. The panel of experts used comprised academics, pharmacists
and small business owners.
The pilot questionnaire, attached as Annexure 1A, consisted of four sections.
Section 1 solicited demographic information. Items in this section were not part of

152
the item count, nor were they included in the validation and reliability analyses.
Section 2 consisted of 32 questions that were distributed across the following
factors: Leadership, Staff Focus, Patients, Other Customers and Markets, Process
Management, Measurement and Analysis of Organisational Performance and
Organisational Performance Results. Participants used the following 3-point
Likert-type scale to indicate their level of importance and extent of implementation
of each process: 1 indicated a low level of importance or “not at all” in terms of
extent of implementation, 2 indicated a medium level of importance or
“sometimes” extent of implementation and 3 indicated a high level of importance
or “extensive” extent of implementation.
3.8.3 INSTRUMENT ADMINISTRATION PROCEDURE
Participants were given the pilot questionnaire and they were requested to
complete the questionnaire and to write any comments and suggestions to
improve the study on the last page. As participants returned the questionnaires,
each received a face-to face interview regarding the content, appearance and
readability of the items in the questionnaire.
3.8.4 ANALYTICAL PROCEDURES In this pilot study the dual purpose of the analytical procedures was to determine
the construct validity and reliability of the measuring instrument. According to
Cooper and Schindler (1998:167), the use of factor analysis can determine the
construct validity of a measuring instrument and the Cronbach Alpha test is
regarded as useful in indicating reliability (Cooper and Schindler, 1998:171).
3.8.4.1 CRONBACH ALPHA
In this pilot study, the Cronbach Alpha measure was used to test the internal
consistency of the questionnaire. According to Davis (2000:183), this technique
computes the mean reliability coefficient estimates for all possible ways of splitting
a set of items in half. The closer the alpha value is to 1, greater is the internal
consistency. The SPSS 11.5 statistical package was used to compute the
Cronbach alpha values in this study.

153
3.8.4.2 FACTOR ANALYSIS
Factor analysis looks for patterns among the variables to discover if an underlying
combination of the original variables (a factor) can summarise the original set
(Cooper and Schindler, 1998:560).
In factor analysis a correlation matrix is generated from the original set of data
(Davis, 2000:482). This can be done in a number of ways, but the most frequently
used approach is the principal component analysis approach (Cooper and
Schindler, 1998:557). This method transforms a set of variables into a new set of
composite variables (or principal components) that are not correlated with each
other. These linear combinations of variables, called factors, account for the
variance in the data as a whole. The best combination makes up the first factor.
The process continues until all the variance is accounted for correlation
coefficients between the factor and the variables are called loadings.
The SPSS 11.5 statistical package was used to carry out the factor analyses in
this study.
3.8.5 THE RESULTS OF THE PILOT STUDY 3.8.5.1 ALPHA COEFFICIENTS
Results from the reliability analysis for Sections 2A and B showed alpha
coefficients ranging from moderate to high in general; with a negative value for
one scale [ Q2A:Customers and Other Markets, -0.2222] and a low value for one
scale[Q2A:Staff Focus, 0.3895]. Summary descriptive statistics and alpha
coefficient values for the scales of Sections 2A and 2B are reported in Annexure
2.
3.8.5.2 FACTOR ANALYSIS I
A factor analysis was performed on each section of the questionnaire (Sections
2A and 2B) to ascertain the degree to which the data conformed to the literature
and interview – based factors.
The decision of how many factors to extract was based on the Eigen values
greater than 1 rule, the scree plot and a visual inspection of the trial solution. The
initial analysis was run without specifying how many factors to retain.

154
For Section 2A, more than one of the variables had a zero variance. Thus, a factor
analysis could not be obtained.
For Section 2B, this procedure resulted in 5 factors with Eigen values greater than
1. This was confirmed by a visual inspection of the scree plot which indicated a
sudden drop in the scree beginning with factor 5. The 5-factor solution was
inspected visually and was found to contain interpretable factor patterns.
The data was subjected to a principal components analysis and principal axis
factoring using both varimax and oblique rotations. Principal factor analysis with
varimax rotation provided the most interpretable factor patterns. The 5-factor
solution accounted for 91.121% of the total variance. The eigen values and the
results from the rotated matrix are reported in Annexure 3.
The newly defined 5-factors are reported below.
TABLE 5: THE NEWLY DEFINED FACTORS OF SECTION 2B
ITEM (QUESTION)
FACTOR
2,9,10,14,15,16,17,22,26,30 STAFF
3,7,8,11,12,13,21,24 LEADERSHIP
25,28,29,31,32 MEASUREMENT
18,19,20,23,27 CUSTOMERS
1,4,5,6 NETWORKS AND SUPPORT
SYSTEMS

155
3.8.5.3 FACTOR ANALYSIS II
The factors and the items in the draft measuring instrument were redefined and
adjusted according to the interpretable factors that emerged from the first factor
analysis. A second factor analysis and determination of the alpha coefficients
were repeated on the refined instrument. The results are reported below.
♦ Section 2B
♦ Factor: Leadership
For Section 2B, Factor: Leadership, the factor analysis resulted in 1 factor with an
eigen value greater than 1. This was confirmed by a visual inspection of the scree
plot which indicated a sudden drop in the scree beginning with factor 1. The 1-
factor solution was inspected visually and was found to contain an interpretable
item (question) pattern.
The data was subjected to a principal components analysis and principal axis
factoring using both varimax and oblique rotations. Principal factor analysis with
varimax rotation provided the most interpretable patterns. The 1-factor solution
accounted for 77.884% of the total variance. The alpha values, the Eigen values
and the results from the rotated matrix are reported in Annexure 5.
♦ Section 2B
♦ Factor: Staff For Section 2B, Factor: Staff, the factor analysis resulted in 2 factors with an eigen
value greater than 1. This was confirmed by a visual inspection of the scree plot
which indicated a sudden drop in the scree beginning with factor 2. The 2-factor
solution was inspected visually and was found to contain an interpretable item
(question) pattern.
The data was subjected to a principal components analysis and principal axis
factoring using both varimax and oblique rotations. Principal factor analysis with
varimax rotation provided the most interpretable patterns. The 2-factor solution
accounted for 89.729% of the total variance. The alpha values, the Eigen values
and the results from the rotated matrix are reported in Annexure 6.
For the Factor: Staff, the items (questions) that loaded out onto each newly
defined sub-factor are reported below.

156
TABLE 6: THE NEWLY DEFINED SUB-FACTORS OF THE FACTOR STAFF
ITEM ( QUESTION)
FACTOR
2,9,15,17,22,26,30 KNOWLEDGE, EMPOWERMENT AND
MOTIVATION
10,14,16 REWARD
♦ Section 2B
♦ Factor :Staff
♦ Sub-Factor: Staff [Knowledge, Empowerment and Motivation]
For Section 2B, Factor: Staff, Sub-factor: Knowledge, the factor analysis resulted
in 1 factor with an Eigen value greater than 1. This was confirmed by a visual
inspection of the scree plot which indicated a sudden drop in the scree beginning
with factor 1. The 1-factor solution was inspected visually and was found to
contain an interpretable item (question) pattern.
The data was subjected to a principal components analysis and principal axis
factoring using both varimax and oblique rotations. Principal factor analysis with
varimax rotation provided the most interpretable patterns. The 1-factor solution
accounted for 88.716% of the total variance. The alpha values, the Eigen values
and the results from the rotated matrix are reported in Annexure 8.
♦ Section 2B
♦ Factor :Staff
♦ Sub-Factor: Staff [Reward]
For Section 2B, Factor: Staff, Sub-factor: Reward, the factor analysis resulted in 1
factor with an Eigen value greater than 1. This was confirmed by a visual
inspection of the scree plot which indicated a sudden drop in the scree beginning
with factor 1. The 1-factor solution was inspected visually and was found to
contain an interpretable item (question) pattern.
The data was subjected to a principal components analysis and principal axis
factoring using both varimax and oblique rotations. Principal factor analysis with
varimax rotation provided the most interpretable patterns. The 1-factor solution
accounted for 90.724% of the total variance. The alpha values, the Eigen values
and the results from the rotated matrix are reported in Annexure 9.

157
♦ Section 2B
♦ Factor: Customers
For Section 2B, Factor: Customers, the factor analysis resulted in 1 factor with an
Eigen value greater than 1. This was confirmed by a visual inspection of the scree
plot which indicated a sudden drop in the scree beginning with factor 1. The 1-
factor solution was inspected visually and was found to contain an interpretable
item (question) pattern.
The data was subjected to a principal components analysis and principal axis
factoring using both varimax and oblique rotations. Principal factor analysis with
varimax rotation provided the most interpretable patterns. The 1-factor solution
accounted for 80.891% of the total variance. The alpha values, the Eigen values
and the results from the rotated matrix are reported in Annexure 10.
♦ Section 2B
♦ Factor: Measurement
For Section 2B, Factor: Measurement, the factor analysis resulted in 1 factor with
an eigen value greater than 1. This was confirmed by a visual inspection of the
scree plot which indicated a sudden drop in the scree beginning with factor 1. The
1-factor solution was inspected visually and was found to contain an interpretable
item (question) pattern.
The data was subjected to a principal components analysis and principal axis
factoring using both varimax and oblique rotations. Principal factor analysis with
varimax rotation provided the most interpretable patterns. The 1-factor solution
accounted for 100% of the total variance. The alpha values, the Eigen values and
the results from the rotated matrix are reported in Annexure 11.
♦ Section 2B
♦ Factor: Networks and Support Systems
For Section 2B, Factor: Networks and Support Systems, the factor analysis
resulted in 1 factor with an Eigen value greater than 1. This was confirmed by a
visual inspection of the scree plot which indicated a sudden drop in the scree
beginning with factor 1. The 1-factor solution was inspected visually and was
found to contain an interpretable item (question) pattern.

158
The data was subjected to a principal components analysis and principal axis
factoring using both varimax and oblique rotations. Principal factor analysis with
varimax rotation provided the most interpretable patterns. The 1-factor solution
accounted for 77.105 of the total variance. The alpha values, the Eigen values and
the results from the rotated matrix are reported in Annexure 12.
3.8.6 DISCUSSION OF RESULTS OF THE PILOT STUDY
Although some of the hypothesized items (questions) that were derived from the
literature and the personal interviews merged to create new factors, the results
from the factor analyses support the fundamental researcher hypothesized
structure of the measuring instrument.
Because more than one variable in Section 2A had a zero variance, a factor
analysis of this section could not be obtained. Hence, the factor solution for
Section was based on the results for Section 2B. The researcher hypothesized a
6-factor solution for Section 2B, but the factor analyses revealed that a 5-factor
solution produced the most interpretable pattern of factor scores, accounting for
91.121% of the common variance in the data set. The scale scores revealed
reliability estimates of 0.8688 to 1. The factor staff was sub-divided into two sub-
factors, knowledge and reward, accounting for 89.729 % of the variability and with
reliability estimates of 0.9625.
3.8.7 LIMITATIONS OF THE PILOT STUDY
The target population, small businesses which are retail community pharmacies, is
represented in the profile of the participants of this pilot study. However, the
demographic data of the study indicates some limitations to the study’s external
validity e.g. since the data is derived from established small businesses which are
retail community pharmacies, it is possible that if the questionnaire were
administered to newer small businesses, or small businesses of different sizes,
the factor patterns may vary.
Furthermore, administration to different populations of small business owners may
also alter the factor patterns.

159
3.8.8 CONCLUSIONS OF THE PILOT STUDY
The findings indicate that the questionnaire has satisfactory reliability and validity
as the profile of the pilot participants meet the criteria of the research viz. small
businesses which are retail community pharmacies. The structure of the
measuring instrument determined as valid and reliable for this research study is
reflected in table 8 below and is attached in Annexure 1B.
TABLE 7: FACTORS AND ITEMS OF THE PILOT QUESTIONNAIRE
FACTOR
ITEM (QUESTION)
2B-STAFF-KNOWLEDGE,
EMPOWERMENT AND MOTIVATION
2,9,15,17,22,26,30
2B-STAFF-REWARD 10,14,16
2B-LEADERSHIP 3,7,8,11,12,13,21,24
2B-MEASUREMENT 25,28,29,31,32
2B-CUSTOMERS 18,19,20,23,17
2B-NETWORKS AND SUPPORT
SYSTEMS
1,4,5,6

160
The reliability estimates and common variance for each of the factors of the
measuring instrument determined as valid and reliable for this research study is
reflected in table 9 below. Each factor represents a process cluster.
TABLE 8: RELIABILITY ESTIMATES AND VARIABILITY OF THE PILOT
QUESTIONNAIRE
FACTOR/PROCESS CLUSTER RELIABILITY ESTIMATE ( ALPHA VALUE)
VARIANCE (%)
2B LEADERSHIP
0.9523 77.884
2B STAFF-KNOWLEDGE,EMPOWERMENT AND MOTIVATION
0.9625 88.716
2B STAFF-REWARD
0.9303 90.724
2B CUSTOMERS
0.9359 80.891
2B MEASUREMENT
1 100
2B NETWORKS AND SUPPORT SYSTEMS
0.8688 77.105

161
3.9 THE FINAL QUESTIONNAIRE 3.9.1 POPULATION AND SAMPLING
According to Cooper and Schindler (1998:219), there are several decisions to
consider in securing a sample, such as:
What is the relevant population?
What are the parameters of interest?
What is the type of sample?
What is the size of the sample needed?
3.9.1.1 THE RELEVANT POPULATION
The definition of a population is generally apparent from the management problem
or research question(s) (Cooper and Schindler, 1998:219). In this study the target
population comprised of small businesses that are operating in a turbulent
environment. Following from the logic of Chapter 2, the sector used as a model is
the retail community pharmacy sector. Hence, the target population of this study
was the retail community pharmacy sector, which comprised of 2549 retail
community pharmacies. . A list of all pharmacies registered with the South African
Pharmacy Council was obtained. To specifically target the small business owner,
it was clearly stated in the questionnaire that it should only be filled in by those
who fitted the definition of a small business viz. a business employing less than 50
workers, assumed to be formally registered, clearly demarcated and paying taxes
on a regular basis. Most retail community pharmacies fit this profile.
3.9.1.2 THE PARAMETERS OF INTEREST
Sample statistics are estimators of population parameters. They are the
descriptors of the relevant variables computed from sample data and they form
the basis of our inferences about the population because they are the best
estimates of the population (Cooper and Schindler, 1998:220).

162
3.9.1.3 THE TYPE OF SAMPLE
Probability sampling is based on the concept of random selection- a controlled
procedure that assures that each population element is given a nonzero chance of
selection. When each sample is drawn individually from the population at large, it
is an unrestricted sample. The unrestricted, simple random sample is the simplest
form of probability sampling. Its use enables each population element to have a
known and equal chance of selection (Cooper and Schindler, 1998:219). This
study used an unrestricted, simple, random, probability sampling approach. The
SPSS 11.5 statistical package was used to compute the selection from the
database of pharmacies obtained from the South African Pharmacy Council.
3.9.1.4 SIZE OF THE SAMPLE The size of the sample is a function of the variation in the population parameters
under study and the estimating precision needed by the researcher (Cooper and
Schindler, 1998:223). Using a confidence level of 95% and a confidence interval
of 5, the sample size was determined according to the following formula
(programmed into a sample size calculator available at
www.surveysystem.com/sscalc.htm,2005):
SAMPLE SIZE = Z2 *(p)*(1-p) c2
Where:
Z = Z value (e.g. 1.96 for 95% confidence level)
p = percentage picking a choice, expressed as a decimal (0.5 used as
worst case percentage for sample size needed)
c = confidence interval, expressed as a decimal (e.g. 0.05 =+-5)
Correction for a finite population:
New ss = ss
1+ ss-1
pop
Where:
ss = sample size
pop = population
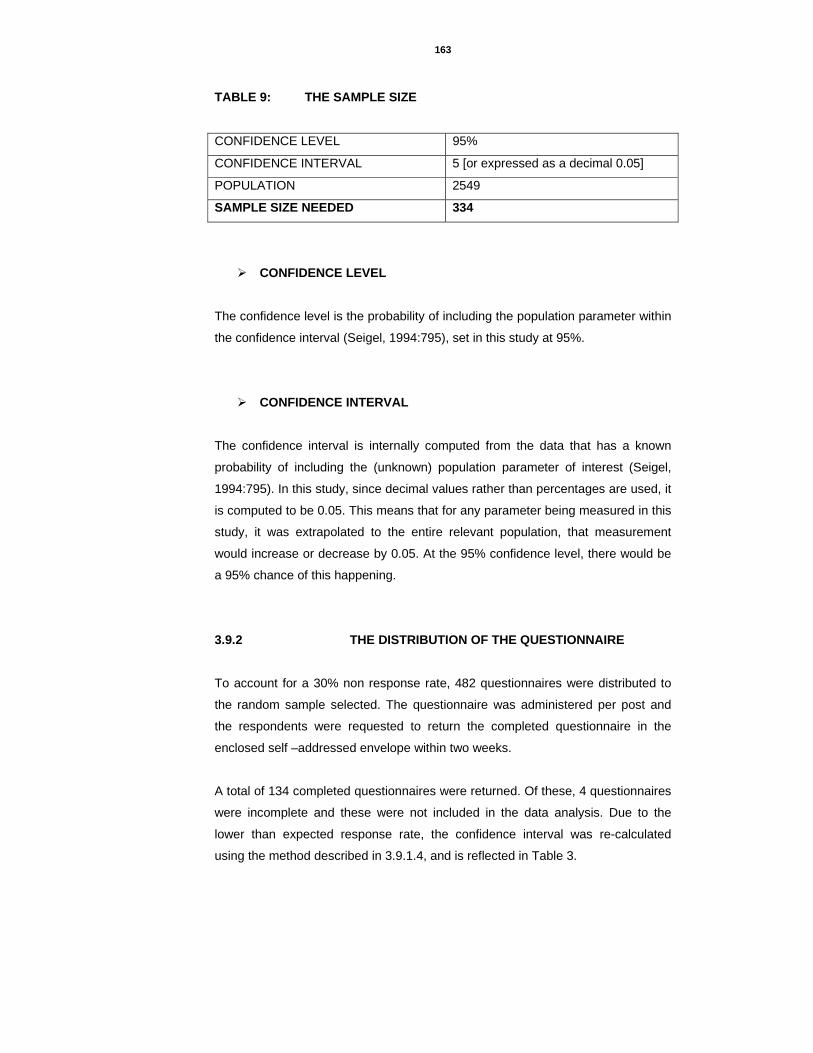
163
TABLE 9: THE SAMPLE SIZE
CONFIDENCE LEVEL 95%
CONFIDENCE INTERVAL 5 [or expressed as a decimal 0.05]
POPULATION 2549
SAMPLE SIZE NEEDED 334
CONFIDENCE LEVEL
The confidence level is the probability of including the population parameter within
the confidence interval (Seigel, 1994:795), set in this study at 95%.
CONFIDENCE INTERVAL
The confidence interval is internally computed from the data that has a known
probability of including the (unknown) population parameter of interest (Seigel,
1994:795). In this study, since decimal values rather than percentages are used, it
is computed to be 0.05. This means that for any parameter being measured in this
study, it was extrapolated to the entire relevant population, that measurement
would increase or decrease by 0.05. At the 95% confidence level, there would be
a 95% chance of this happening.
3.9.2 THE DISTRIBUTION OF THE QUESTIONNAIRE
To account for a 30% non response rate, 482 questionnaires were distributed to
the random sample selected. The questionnaire was administered per post and
the respondents were requested to return the completed questionnaire in the
enclosed self –addressed envelope within two weeks.
A total of 134 completed questionnaires were returned. Of these, 4 questionnaires
were incomplete and these were not included in the data analysis. Due to the
lower than expected response rate, the confidence interval was re-calculated
using the method described in 3.9.1.4, and is reflected in Table 3.

164
SAMPLE SIZE = Z2 *(p)*(1-p) c2
Where:
Z = Z value (e.g. 1.96 for 95% confidence level)
p = percentage picking a choice, expressed as a decimal (0.5 used as
worst case percentage for sample size needed)
c = confidence interval, expressed as a decimal (e.g. 0.05 =+-5)
Correction for a finite population:
New ss = ss
1+ ss-1
pop
Where:
ss = sample size
pop = population
TABLE 10: NEW SAMPLE SIZE
CONFIDENCE LEVEL 95%
SAMPLE SIZE 130
POPULATION 2549
NEW CONFIDENCE INTERVAL 8 [ or expressed as a decimal 0.08]
The new confidence interval, due to the lower than expected response rate of the
returned questionnaires, is 0.08. This indicates that for any parameter being
measured in this study, it was extrapolated to the entire relevant population, the
measurement obtained in the sample would increase or decrease by 0.08. At the
95% confidence level, there would be a 95% chance of this happening.

165
3.9.3 THE PREPARATION OF THE DATA
Once the questionnaires were returned, they were prepared for analysis. This
involved editing, coding and entering the data (Cooper and Schindler: 1998:411).
Editing the Data
Editing detects errors and omissions, corrects them when possible and certifies
that minimum data quality standards are achieved (Cooper and Schindler:
1998:411). In this study, the data was edited by the separation of the incomplete
questionnaires from the completed ones. Since this study comprised of
anonymous respondents, the respondents who sent in incomplete questionnaires
could not be contacted. Therefore, these questionnaires were discarded. In this
study 4 questionnaires were returned incomplete. These were discarded.
Coding the Data
Coding involves applying a set of rules to the data to transform information from
one form to another (Durrheim and Terreblanche, 2002:98). In this study this
involved converting each questions to a numeric symbol to allow for the
quantitative analysis using the SPSS 11.5 statistical programme. The responses
were already in the Likert scale format; therefore no coding of the responses was
necessary.
Entering the Data The data obtained from the questionnaires was captured and analysed statistically
using the SPSS 11.5 statistical software package.
These research elements are reported in Chapter 4.

166
3.9.4 THE ANALYSIS OF THE DATA
The purpose of any analytical method is to convert data into information needed to
make decisions (Davis, 2000:386). This study uses both descriptive and inferential
statistical tools.
3.9.4.1 DESCRIPTIVE STATISTICS
In this study, the descriptive statistics used were means and standard deviations.
The means, measuring the central tendency were used to determine the average
response of respondents towards a test. The mean (the arithmetic mean) is the
sum of the observed values in the distribution divided by the number of
observations. The standard deviation is the positive square root of the variance. It
improves interpretability by removing the variance’s square and expressing
deviations in their original units (Cooper and Schindler: 1998:427).
3.9.4.2 INFERENTIAL STATISTICS
Since the research study’s interest goes beyond the mere description of the
samples obtained, the use of inferential analysis allows the drawing of conclusions
about the population itself. Terreblanche and Durrheim ( 2002:117) and Collis and
Hussey ( 2003:196), state that inferential analysis allows the drawing of
conclusions about the population based on data obtained from samples. In this
study, the inferential statistics used included the Cronbach Alpha, the Factor
Analysis, and paired t-tests.
The Cronbach Alpha
The Cronbach Alpha measure was used to test the internal consistency of the
questionnaire. According to Davis (2000:183), this technique computes the mean
reliability coefficient estimates for all possible ways of splitting a set of items in
half. The closer the alpha value is to 1, greater is the internal consistency. The
SPSS 11.5 statistical package was used to compute the Cronbach alpha values in
this study.

167
The Factor Analysis
Factor analysis looks for patterns among the variables to discover if an underlying
combination of the original variables (a factor) can summarise the original set
(Cooper and Schindler, 1998:560).
In factor analysis a correlation matrix is generated from the original set of data
(Davis, 2000:482). This can be done in a number of ways, but the most frequently
used approach is the principal component analysis approach (Cooper and
Schindler, 1998:557). This method transforms a set of variables into a new set of
composite variables (or principal components) that are not correlated with each
other. These linear combinations of variables, called factors, account for the
variance in the data as a whole. The best combination makes up the first factor.
The process continues until all the variance is accounted for correlation
coefficients between the factor and the variables are called loadings. The SPSS
11.5 statistical package was used to carry out the factor analyses in this study.
Paired t-tests To achieve the research purpose, the research objectives and satisfy the research
propositions, this study performed a gap analysis between level of importance and
extent of implementation for all the identified strategic processes or dynamic
capabilities. Since this involved the determination of the significance of the
difference between two variables that were both provided by the same set of
respondents, the use of a paired t-test thus provided the best test of statistical
significance.
The t-test focuses on the difference between each pair of the scores, this controls
for variance in both measures from one respondent to the next. Paired t-tests are
used to compare the means of two variables for a single group. The procedure
computes the differences between values of the two variables for each case and
tests whether the average differs from zero. (Prism, 2005 and NCL, 2005).
A statistically significant difference in any gap between level of importance and
extent of implementation was recorded where the p-value was computed to be
less than 0.05. If the p-value is small, it means that the pairs are significantly
correlated, the Pearson correlation coefficient, r, is positive, the t-ratio [the mean
of the differences divided by the standard error of the differences] is large and it is
unlikely that the effect observed is a coincidence of random sampling and the

168
effect, which in this study is the gap between level of importance and extent of
implementation, is statistically significant (Prism, 2005).
The t-test assumes a normal distribution of the differences and the Kolmogorov-
Smirnov statistic was used to test for this assumption throughout. If the K-S value
is greater than 0.5, then normality is assumed (Norusis, 1995 and Coake and
Steed, 1996). The SPSS 11.5 statistical package was used to carry out the t-tests
in this study.
These research elements are reported in Chapter 4.

169
3.9.5 THE STRATEGIC PROCESSES FOR THE FINAL QUESTIONNAIRE The strategic processes to be incorporated as questions in the final questionnaire
are illustrated in Table 11 below:
TABLE 11: THE STRATEGIC PROCESSES FOR THE FINAL QUESTIONNAIRE
Process 1
The leadership of a small business, through both formal [e.g. defined and
structured] and informal [e.g. observation] methods, fosters staff empowerment
and innovation.
Process 2
The leadership of a small business allows the business to co-evolve by fostering,
driving and executing multi-business/multi-unit collaborative linkages and
managing group dynamics while at the same time empowering staff.
Process 3
Work and job descriptions are created, organized and managed in such a manner
so as to promote cooperation, initiative and innovation as well as to empower staff
and further entrench the organizational culture.
Process 4
Staff education, development and training activities are structured to balance
organizational objectives with employees’ individual knowledge and skills needs
and are jointly designed by the employees concerned and the small business
leadership detailing specific needs, objectives and performance measures, clearly.
Process 5
The skills, knowledge, values and attitudes of the staff and leadership are
important, relevant, valuable and available to customers.
Process 6
A variety of employee support services ( well being and motivation ) are available,
and are periodically evaluated and improved to meet employee’s needs.
Process 7
Employees and other stakeholders who need information to effectively perform
their work have convenient access to all necessary information.
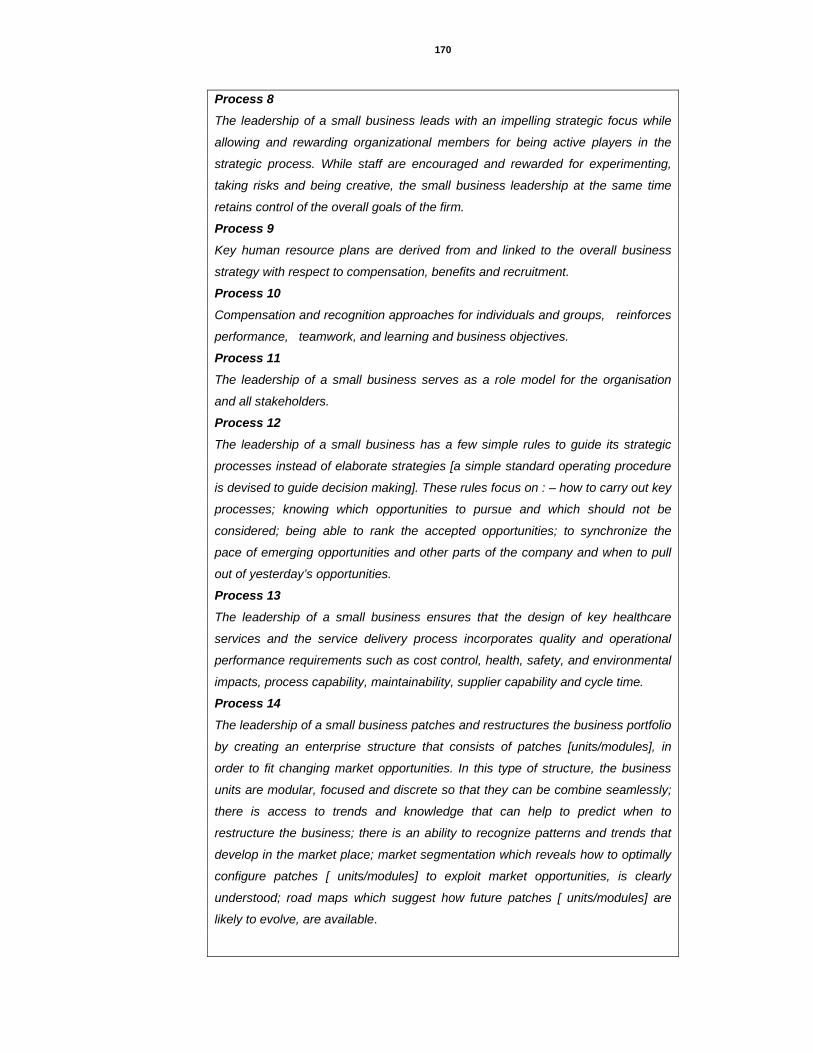
170
Process 8
The leadership of a small business leads with an impelling strategic focus while
allowing and rewarding organizational members for being active players in the
strategic process. While staff are encouraged and rewarded for experimenting,
taking risks and being creative, the small business leadership at the same time
retains control of the overall goals of the firm.
Process 9
Key human resource plans are derived from and linked to the overall business
strategy with respect to compensation, benefits and recruitment.
Process 10
Compensation and recognition approaches for individuals and groups, reinforces
performance, teamwork, and learning and business objectives.
Process 11
The leadership of a small business serves as a role model for the organisation
and all stakeholders. Process 12
The leadership of a small business has a few simple rules to guide its strategic
processes instead of elaborate strategies [a simple standard operating procedure
is devised to guide decision making]. These rules focus on : – how to carry out key
processes; knowing which opportunities to pursue and which should not be
considered; being able to rank the accepted opportunities; to synchronize the
pace of emerging opportunities and other parts of the company and when to pull
out of yesterday’s opportunities.
Process 13
The leadership of a small business ensures that the design of key healthcare
services and the service delivery process incorporates quality and operational
performance requirements such as cost control, health, safety, and environmental
impacts, process capability, maintainability, supplier capability and cycle time.
Process 14
The leadership of a small business patches and restructures the business portfolio
by creating an enterprise structure that consists of patches [units/modules], in
order to fit changing market opportunities. In this type of structure, the business
units are modular, focused and discrete so that they can be combine seamlessly;
there is access to trends and knowledge that can help to predict when to
restructure the business; there is an ability to recognize patterns and trends that
develop in the market place; market segmentation which reveals how to optimally
configure patches [ units/modules] to exploit market opportunities, is clearly
understood; road maps which suggest how future patches [ units/modules] are
likely to evolve, are available.
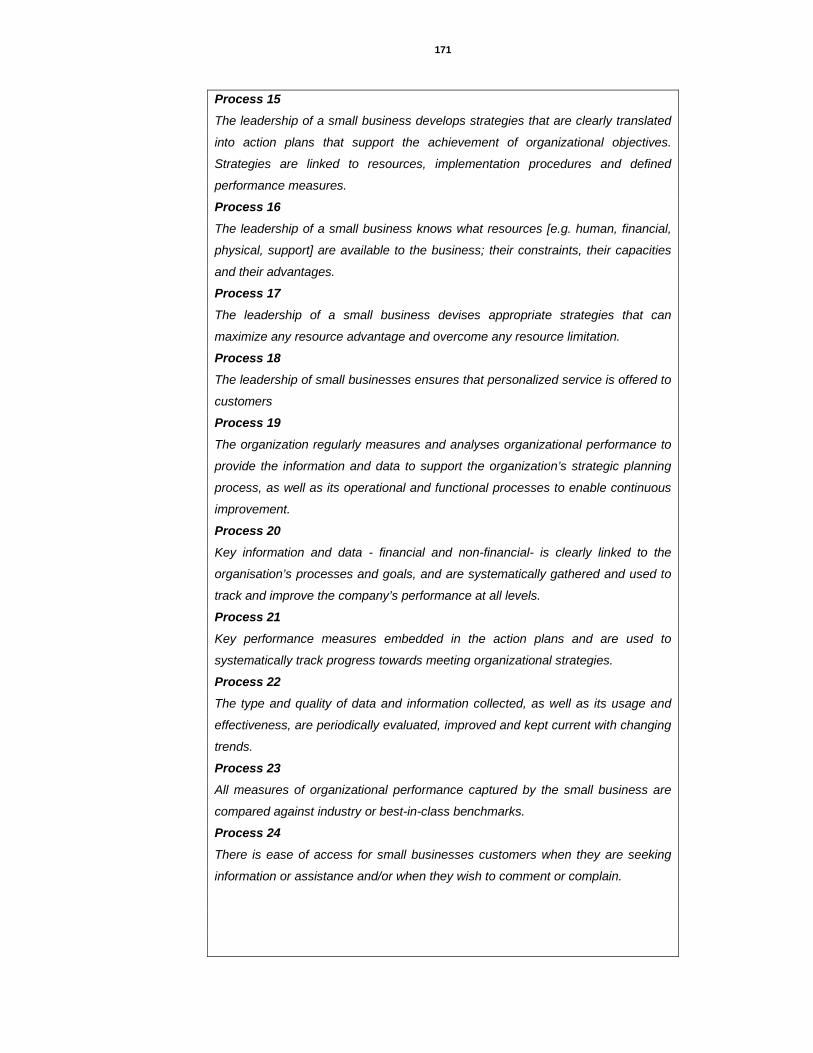
171
Process 15
The leadership of a small business develops strategies that are clearly translated
into action plans that support the achievement of organizational objectives.
Strategies are linked to resources, implementation procedures and defined
performance measures.
Process 16
The leadership of a small business knows what resources [e.g. human, financial,
physical, support] are available to the business; their constraints, their capacities
and their advantages.
Process 17
The leadership of a small business devises appropriate strategies that can
maximize any resource advantage and overcome any resource limitation.
Process 18
The leadership of small businesses ensures that personalized service is offered to
customers
Process 19
The organization regularly measures and analyses organizational performance to
provide the information and data to support the organization’s strategic planning
process, as well as its operational and functional processes to enable continuous
improvement.
Process 20
Key information and data - financial and non-financial- is clearly linked to the
organisation’s processes and goals, and are systematically gathered and used to
track and improve the company’s performance at all levels.
Process 21
Key performance measures embedded in the action plans and are used to
systematically track progress towards meeting organizational strategies.
Process 22
The type and quality of data and information collected, as well as its usage and
effectiveness, are periodically evaluated, improved and kept current with changing
trends.
Process 23
All measures of organizational performance captured by the small business are
compared against industry or best-in-class benchmarks.
Process 24
There is ease of access for small businesses customers when they are seeking
information or assistance and/or when they wish to comment or complain.

172
Process 25
A complaint management process exists that ensures complaints are not only
resolved effectively and promptly but are also analyzed as a source of
improvement activities.
Process 26
Good relationships with customers are actively pursued and maintained by both
staff and the leadership of small businesses.
Process 27
The design of key healthcare services and the service delivery process is
addressed systematically accounting for changing customer requirements.
Process 28
The company gathers information about customer satisfaction for all key customer
segments and captures information that reflects transaction quality, customer
repurchase, new business and positive referral.
Process 29
The leadership of a small business takes into account the needs and expectations
of all stakeholders, the changing, turbulent and competitive environment,
regulatory, financial, market, technological, societal and other risks as well as
factors unique to the organization, when establishing organisational values,
organisational directions and performance expectations as well as when looking
for business opportunities,
Process 30
The leadership of a small business uses its involvement with its communities and
professional associations to both support and strengthen those communities and
associations as well as the business.
Process 31
The leadership of a small business has strong friend, family and professional
networks.
Process 32
The leadership of a small business takes into account its legal, ethical and risk
requirements, in its decision-making processes

173
3.10 THE CHAPTER CONCLUSIONS This chapter described the research stages and the elements of the research
process, focusing on the primary data collection methodology, both qualitative and
quantitative and the method that was used in the process of theory building and
proposition development. It also explained how the instrument was designed, the
nature of measurement, the soundness of measurement, the pilot study, the
population and sampling methods, the data preparation and the data analysis
methods.
The next chapter is the quantitative data analysis and results chapter, where the
study results will be presented.

174
CHAPTER FOUR THE
QUANTITATIVE DATA ANALYSIS AND RESULTS
175
CHAPTER 4: THE QUANTITATIVE DATA ANALYSIS AND RESULTS
4.1 THE CHAPTER SUMMARY
The aims of this chapter were to present and analyse the data.
This chapter commenced with reliability and validity testing on the data obtained
from the final questionnaire, using the Cronbach Alpha values and factor analysis
methods described in Chapter 3. This chapter then indicated that the factors
loaded out onto a six factor solution, viz. staff-knowledge empowerment and
motivation, staff-reward, leadership, measurement, customers and networks and
support systems. The leadership factor loaded out onto two separate sub-factors,
leadership - general and leadership – new. This chapter termed each factor, a
process cluster. The reliability estimates for each process cluster ranged from
moderate to high, indicating a moderate to high internal consistency in the final
questionnaire.
The data analysis in this chapter was approached in a stepwise manner, with an
initial general analysis of all process clusters and processes. This was followed by
an analysis of the importance /implementation gap in process clusters and finally
an analysis of the importance/implementation gap in all processes.

176
4.2 INTRODUCTION
This chapter deals with the analysis and presentation of the empirical data.
However before analysing the data, reliability and validity tests were performed on
the data obtained from the final questionnaire, using the Cronbach Alpha values
and factor analysis methods described in Section 3.8.
To analyse the data obtained estimators of population means based on the simple
random sample were developed to enable the identification and description of the
strategic processes in small businesses operating in a turbulent environment as
well as the determination of both the level of importance of these strategic
processes to these small firms and their extent of their implementation therein.
The performance of a trend analysis further described the strategic processes of
small businesses operating in a turbulent environment. Paired t-tests on
combinations of the variables importance and implementation were also
performed to enable the identification any significant differences between them.
Finally, the means of the aggregated data, where a significant difference is found
between the variables, importance and implementation, were plotted on scalar
charts to describe how small businesses operating in a turbulent environment
allocate their resources. The decision to plot only the aggregated data in instances
where there is no significant difference between the variables arose from the
discussion in section 1.4, Chapter 1 where it was pointed out that where there is a
significant difference between importance and implementation of processes, this
indicates that resource allocation and hence process implementation is not
dependant on the importance perception, but rather on scarce resources. Since
small businesses operate in a resource impoverished and resource constrained
environment, it how these resources are allocated that will determine any
innovative resource reconfigurations that can lead to value –adding strategies and
competitive advantage.
The above approach to the analysis of the data in this study is arranged into four
steps, with a preliminary data validation stage.

177
FIGURE 16: DATA ANALYSIS STEPS
PRELIMINARY DATA VALIDATION STEP
STEP 1 GENERAL ANALYSIS OF ALL PROCESS CLUSTERS
AND PROCESSES
STEP 2 ANALYSIS OF IMPORTANCE AND IMPLEMENTATION IN
GENERAL
STEP 3 ANALYSIS OF IMPORTANCE AND IMPLEMENTATION OF
PROCERSS CLUSTERS
STEP 4 ANALYSIS OF IMPORTANCE AND IMPLEMENTATION OF
INDIVIDUAL PROCESSES
DATA CONSOLIDATION

178
4.3 THE RELIABILITY AND VALIDITY OF THE FINAL QUESTIONNAIRE Prior to the analysis of the data obtained from the returned questionnaires, a
determination of the Cronbach Alpha values and a factor analysis was carried
using the methods described in the pilot study. As in the pilot study, more than
one item in Section 2A had a zero variance and thus a factor analysis could not be
obtained for Section 2A. For Section 2B, the items (questions) that loaded onto
each factor are summarized below. The leadership factor loaded out onto two
separate sub-factors: Leadership-General and Leadership-Turbulence.
TABLE 12: FACTORS AND ITEMS OF THE FINAL QUESTIONNAIRE
FACTOR/PROCESS CLUSTER
ITEM/PROCESS/QUESTION
2B-STAFF-KNOWLEDGE,
EMPOWERMENT AND MOTIVATION
1,2,3,4,5,6,7
2B-STAFF-REWARD 8,9,10
2B-LEADERSHIP
Sub-Factors LEADERSHIP – GENERAL
LEADERSHIP - TURBULENCE
11,12,13,14,15,16,17,18
11,13,15,16,17,18
12,14
2B-MEASUREMENT 19,20,21,22,23
2B-CUSTOMERS 24,25,26,27,28
2B-NETWORKS AND SUPPORT
SYSTEMS
29,30,31,32

179
The reliability estimates and common variance for each of the factors of the final
measuring instrument (Annexure 1B), are reported in Annexure 13 and
summarized below.
TABLE 13: RELIABILITY ESTIMATES AND VARIABILITY OF THE FINAL
QUESTIONNAIRE
FACTOR/PROCESS CLUSTER RELIABILITY ESTIMATE ( ALPHA VALUE)
VARIANCE (%)
2B STAFF-KNOWLEDGE,EMPOWERMENT AND MOTIVATION
0.8642 60.503
2B STAFF-REWARD
0.8066 72.211
2B LEADERSHIP SUB-FACTORS LEADERSHIP-GENERAL LEADERSHIP-TURBULENCE
0.9115 0.9248 0.7711
63.612 74.532 81.373
2B MEASUREMENT
0.9343 80.415
2B CUSTOMERS
0.8323 61.385
2B NETWORKS AND SUPPORT SYSTEMS
0.9379 84.496

180
4.4 IMPORTANCE AND IMPLEMENTATION 4.4.1 THE IMPORTANCE OF STRATEGIC PROCESS CLUSTERS AND
STRATEGIC PROCESSES
Annexure 14 reports the mean for each process cluster and for each process
individually. These are summarized below.
TABLE 14: ALL PROCESS CLUSTERS FROM THE HIGHEST TO THE LOWEST [IMPORTANCE]
PROCESS CLUSTER MEAN
MEASUREMENT [M] 2.84
STAFF-KNOWLEDGE,MOTIVATION AND
EMPOWERMENT [SK] 2.81
LEADERSHIP-TURBULENCE [LT] 2.80
LEADERSHIP-GENERAL [LG] 2.78
CUSTOMERS [C] 2.64
NETWORKS [N] 2.45
STAFF – REWARD [SR] 2.30
TABLE 15: THE HIGHEST AND THE LOWEST PROCESSES
[IMPORTANCE]
PROCESS MEAN
Q22,Q21, Q18, Q12 3.00
Q10,Q32 2.20
The means are provided at the 95% confidence level with a 0.08 confidence level.
Thus, for the population of this study, it can be said with 95% certainty that each
mean would apply in the range of 0.08 more or 0.08 less than the sample mean.

181
4.4.2 THE IMPLEMENTATION OF STRATEGIC PROCESS CLUSTERS AND STRATEGIC PROCESSES
Annexure 15 reports the mean for each process cluster and for each process
individually. The highest and lowest scoring items, in general and for different age
and size bands, are summarized below.
TABLE 16: ALL PROCESS CLUSTERS FROM THE HIGHEST TO THE
LOWEST [IMPLEMENTATION]
PROCESS CLUSTER AND PROCESSES MEAN
NETWORKS 2.58
STAFF-KNOWLEDGE,MOTIVATION AND
EMPOWERMENT
2.53
STAFF - REWARD 2.29
CUSTOMERS 2.20
MEASUREMENT 1.97
LEADERSHIP-GENERAL 1.89
LEADERSHIP-TURBULENCE 1.83
TABLE 17: THE HIGHEST AND THE LOWEST PROCESSES
[IMPLEMENTATION]
PROCESSES MEAN
Q6,Q5,Q4 2.80
Q14 1.82
The means are provided at the 95% confidence level with a 0.08 confidence level.
Thus, for the population of this study, it can be said with 95% certainty that each
mean would apply in the range of 0.08 more or 0.08 less than the sample mean.

182
The means are provided at the 95% confidence level with a 0.08 confidence level.
Thus, for the population of this study, it can be said with 95% certainty that each
mean would apply in the range of 0.08 more or 0.08 less than the sample mean.

183
4.4.3 TREND ANALYSIS The means are provided at the 95% confidence level with a 0.08 confidence level.
Thus, for the population of this study, it can be said with 95% certainty that each
mean would apply in the range of 0.08 more or 0.08 less than the sample mean.
4.4.3.1 THE IMPORTANCE OF PROCESS CLUSTERS The results of the trend analysis are reported in Annexure 16 and the graph is
shown below.
GRAPH 1: THE IMPORTANCE OF PROCESS CLUSTERS
2
2.5
3
SK SR LG LT M C N
PROCESS CLUSTER
MEA
N Process SR
Cluster
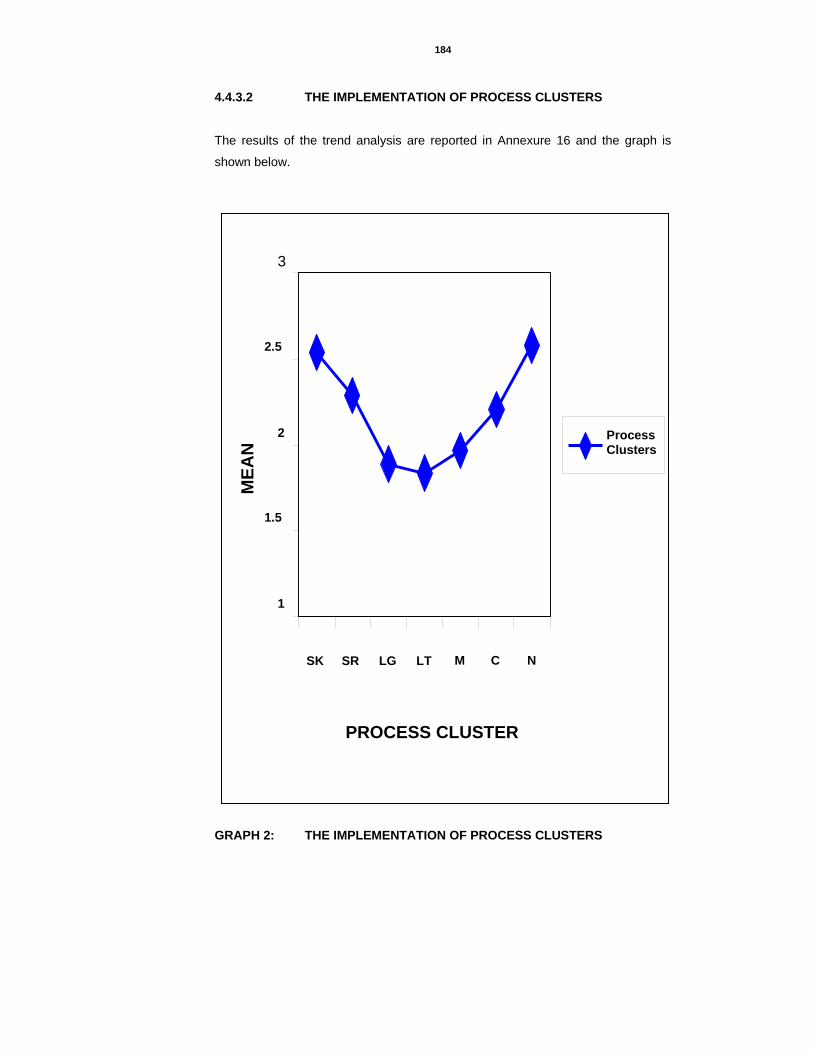
184
4.4.3.2 THE IMPLEMENTATION OF PROCESS CLUSTERS
The results of the trend analysis are reported in Annexure 16 and the graph is
shown below.
GRAPH 2: THE IMPLEMENTATION OF PROCESS CLUSTERS
1
1.5
2
2.5
3
SK SR LG LT M C N
PROCESS CLUSTER
MEA
N Process
Clusters
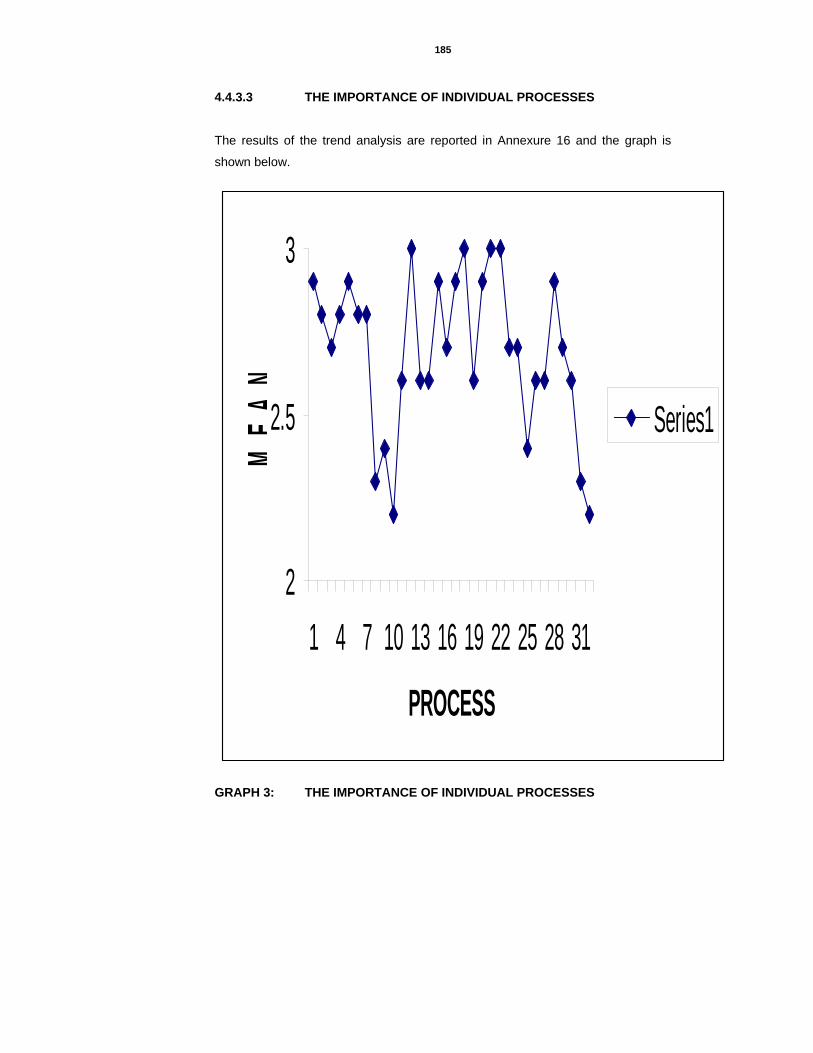
185
4.4.3.3 THE IMPORTANCE OF INDIVIDUAL PROCESSES
The results of the trend analysis are reported in Annexure 16 and the graph is
shown below.
2
2.5
3
1 4 7 10 13 16 19 22 25 28 31
PROCESS
MEA
N
Series1
GRAPH 3: THE IMPORTANCE OF INDIVIDUAL PROCESSES

186
4.4.3.4 THE IMPLEMENTATION OF INDIVIDUAL PROCESSES
The results of the trend analysis are reported in Annexure 16 and the graph is
shown below.
00.5
11.5
22.5
3
1 4 7 10 13 16 19 22 25 28 31
PROCESSES
MEA
N
Series1
GRAPH 4: THE IMPLEMENTATION OF INDIVIDUAL PROCESSES

187
4.5 THE IMPORTANCE/ IMPLEMENTATION GAP
A gap analysis was performed between the perceived level of importance and
extent of implementation of the process clusters and the individual processes.
This involved determining the significance of the difference between the two
variables that are being examined. Therefore a paired t-test was used to provide
the best test of statistical significance. Since a requirement for the use of the t-test
is a normal distribution, the Kolmogorov-Smirnov (K-S) statistic was calculated to
determine the normality of distribution of the data being analysed. A K-S statistic
that is greater than 0.5 indicates a normal distribution. For a significant difference
between the variables a p value of < 0.05 is required.
The means are provided at the 95% confidence level with a 0.08 confidence level.
Thus, for the population of this study, it can be said with 95% certainty that each
mean would apply in the range of 0.08 more or 0.08 less than the sample mean.
4.5.1 GAP ANALYSIS OF IMPORTANCE AND IMPLEMENTATION IN GENERAL
The results of the paired samples test and the Kolmogorov-Smirnov test are
reported in Annexure 17 and summarised below.
TABLE 18: IMPORTANCE AND IMPLEMENTATION IN GENERAL
VARIABLE MEAN K-S Statistic
Importance 2.66 0.762
Implementation 2.18 0.502
The K-S statistics are greater then 0.5 for each variable. This indicates that the
data is distributed normally.
The significance of the gap between the variables, importance and
implementation, is reflected in the p value of 0.030, which is less than 0.05.

188
4.5.2 GAP ANALYSIS OF PROCESS CLUSTERS
The results of the paired samples test and the Kolmogorov-Smirnov test are
reported in Annexure 18 and summarised below.
TABLE 19: GAP ANALYSIS OF PROCESS CLUSTERS
PROCESS CLUSTER SIGNIFICANCE
STAFF-KNOWLEDGE, MOTIVATION AND
EMPOWERMENT
0.000
STAFF-REWARD 0.867
LEADERSHIP-GENERAL 0.000
LEADERSHIP-TURBULENCE 0.000
MEASUREMENT 0.000
CUSTOMERS 0.000
NETWORKS 0.029
The K-S statistic is greater then 0.5 for each factor. This indicates that the data is
distributed normally for each factor.
The significance of the gap in the variables of all process clusters except staff-
reward is reflected in p values that are less than 0.05. The lack of significance of
the gap in the variables of the process cluster staff-reward is reflected in a p value
that is greater than 0.05.
The data of the process cluster that showed no significant gap between the
variables are reported in Annexure 18 and summarised below.
TABLE 20: MEAN, AGGREGATED RESPONSES OF THE PROCESS CLUSTERS WITH NO SIGNIFICANT GAPS BETWEEN IMPORTANCE AND IMPLEMENTATION
PROCESS CLUSTER IMPORTANCE IMPLEMENTATION
STAFF-REWARD [SR] 2.30 2.29

189
The data of the process clusters that showed a significant gap between the
variables was normalised and the mean of the aggregates were plotted on a
scalar chart. The results are reported in Annexure 18 and summarised below
together with the scalar chart.
TABLE 21: MEAN, AGGREGATED RESPONSES OF THE PROCESS
CLUSTERS WITH SIGNIFICANT GAPS BETWEEN IMPORTANCE AND IMPLEMENTATION
PROCESS CLUSTER IMPORTANCE IMPLEMENTATION
STAFF-KNOWLEDGE,
MOTIVATION AND
EMPOWERMENT [SK]
2.81 2.53
LEADERSHIP-GENERAL
[LG] 2.78 1.89
LEADERSHIP-
TURBULENCE [LT] 2.80 1.83
MEASUREMENT [M] 2.84 1.97
CUSTOMERS [C] 2.64 2.20
NETWORKS AND
SUPPORT SYSTEMS
[N]
2.45 2.58

190
2.65 2.60 2.55 310 2.45 2.40 2.35 2.30 2.25 2.20 2.15 2.10 2.05 2.00 1.95 1.90 1.85 180
SK
LG
M
C
LT
2.40 2.45 2.50 2.55 2.60 2.65 2.70 2.75 2.80 2.85
IMPLEMENTATION LOW IMPORTANCE HIGH IMPLEMENTATION
HIGH IMPORTANCE HIGH IMPLEMENTATION
LOW IMPORTANCE LOW IMPLEMENTATION
HIGH IMPORTANCE LOW IMPLEMENTATION
N
GRAPH 5: GRAPH OF PROCESS CLUSTERS WITH SIGNIFICANT GAPS BETWEEN IMPORTANCE AND IMPLEMENTATION
IMPORTANCE

191
4.5.3 GAP ANALYSIS OF INDIVIDUAL PROCESS The results of the paired samples test and the Kolmogorov-Smirnov test are
reported in Annexure 19 and summarised below.
TABLE 22: GAP ANALYSIS OF INDIVIDUAL PROCESS
PROCESS SIGNIFICANCE
1 0.000
2 0.000 3 0.000 4 1.000
5 0.027 6 1.000
7 0.107
8 1.000
9 0.002 10 0.090
11 0.000 12 0.000 13 0.000 14 0.000 15 0.000 16 0.000 17 0.000 18 0.000 19 0.000 20 0.000 21 0.000 22 0.000 23 0.000 24 0.000 25 0.000 26 0.000 27 0.000 28 0.000 29 0.059
30 0.730
31 0.00 32 0.00

192
The K-S statistic is greater then 0.5 for each process with variance. This indicates
that the data is distributed normally.
The significance of the gap in the variables of all processes except processes
4,6,7,8,10,29,30 is reflected in p values that are less than 0.05. The lack of
significance of the gap in variables of the processes 4,6,7,8,10,29,30 is reflected
in a p value that is greater than 0.05.
The data of the process cluster that showed no significant gap between the
variables are reported in Annexure 19 and summarised below.
TABLE 23: MEAN AGREGATED RESPONSES OF ALL PROCESSES
WITH NO SIGNIFICANT GAPS BETWEEN IMPORTANCE AND IMPLEMENTATION
PROCESS IMPORTANCE IMPLEMENTATION
4 2.80 2.80
6 2.80 2.80
7 2.80 2.70
8 2.30 2.30
10 2.20 2.31
29 2.70 2.58
30 2.60 2.58
The data was normalised and the mean of the aggregates of those processes that
showed a significant gap between the variables were plotted on a scalar chart.
The results are reported in Annexure 19 and summarised below together with a
scalar chart.

193
TABLE 24: MEAN AGREGATED RESPONSES OF ALL PROCESSES WITH SIGNIFICANT GAPS BETWEEN IMPORTANCE AND IMPLEMENTATION
PROCESS IMPORTANCE IMPLEMENTATION
1 2.90 2.22
2 2.80 2.30
3 2.70 2.12
5 2.90 2.80
9 2.40 2.26
11 2.60 1.83
12 3.00 1.84
13 2.60 1.88
14 2.60 1.82
15 2.90 1.86
16 2.70 2.11
17 2.90 1.86
18 3.00 1.83
19 2.60 1.91
20 2.90 1.83
21 3.00 2.41
22 3.00 1.91
23 2.70 1.83
24 2.70 2.21
25 2.40 2.20
26 2.60 2.20
27 2.60 2.20
28 2.90 2.20
31 2.30 2.58
32 2.20 2.58

194
2.80 2.70 2.60 2.40 2.30 2.40 2.30 2.20 2.10 2.00 1.90 1.80
2.20 2.30 2.40 2.50 2.60 2.70 2.80 2.90 3.00
IMPLEMENTATIONLOW IMPORTANCE HIGH IMPLEMENTATION
HIGH IMPORTANCE HIGH IMPLEMENTATION
LOW IMPORTANCE LOW IMPLEMENTATION
HIGH IMPORTANCELOW IMPLEMENTATION
GRAPH 6: GRAPH OF PROCESSES WITH SIGNIFICANT GAPS BETWEEN IMPORTANCE AND IMPLEMENTATION
1 28
2
5
9 25
16 3
19 13 11 14
18 12
17/15 20
21
22
23
24 26/27
31 32 IMPORTANCE

195
4.6 CHAPTER CONCLUSIONS This chapter presented and analysed the data, which will be discussed in the
following chapter.

196
CHAPTER FIVE DISCUSSION
OF RESULTS

197
CHAPTER 5: DISCUSSION OF RESULTS
5.1 CHAPTER SUMMARY
The aims of this chapter were to discuss the results obtained in Chapter 4
This chapter commenced with a quantitative description of the level of importance
and extent of implementation of each process cluster and each individual process
using a comparison of the means of the results obtained and through a trend
analysis of these means. For the strategic process clusters, this chapter found that
these small businesses considered measurement to be the most important
strategic process cluster; while staff-reward was found to be the least important
strategic process cluster. On the other hand networks and support systems was
found to be the most implemented strategic process cluster with leadership-
turbulence the least implemented process cluster.
For the individual processes, in terms of importance, this chapter found that
processes 12, 18, 21 and 22 were the most important processes, while processes
10 and 32 were the least important processes. For the individual processes, in
terms of implementation, this chapter found that processes 4, 5 and 6 were the
most implemented processes, while process 14 was the least implemented
process.
In the second step, this chapter analysed importance and implementation in
general and found that there was a significant gap between level of importance
and extent of implementation of the processes in general.
In the third step, this chapter analysed the importance and implementation of
process clusters and found that staff-reward was the only process cluster with no
significant gap between level of importance and extent of implementation,
indicating that the extent of implementation, and by extension the resource
allocation, to this process cluster could be influenced by a change in the
importance perception, and by extension the management capabilities of small
businesses operating in a turbulent environment.. This step also indicated that the
other process clusters were dependant on a change in the general resource base
of the small firm for any change in the extent of implementation of these process
clusters.
In the fourth step, this chapter analysed the importance and implementation of all
processes and found that processes 4, 6,7,8,10,29 and 30 showed no significant

198
gap between level of importance and extent of implementation, indicating that the
extent of implementation, and by extension the resource allocation to these
processes could be influenced by a change in the importance perception, and by
extension the management capabilities of small businesses operating in a
turbulent environment. This step also indicated that the other processes were
dependant on a change in the general resource base of the small firm for any
change in the extent of implementation of these processes.

199
5.2 INTRODUCTION
In this chapter the data will be analysed and discussed in order to achieve the
research purpose, the research objectives and to investigate the research
propositions. The achievement of this will satisfy the research
purpose.
FIGURE 17: DATA ANALYSIS, RESEARCH OBJECTIVES, RESEARCH PROPOSITIONS, RESEARCH PURPOSE AND RESEARCH
PROBLEM
In summary, the research purpose, the research objectives and the research
propositions of this study are:
5.2.1 THE PURPOSE OF THE STUDY In order to achieve the envisaged solution to the research problem of this study,
the main purpose of the research is to investigate the strategic processes of small
businesses operating in a turbulent environment. The core elements of this
purpose comprises of:
RESEARCH PURPOSE
Research objectives
Research propositions
DATA ANALYSIS, RESULTS
& DISCUSSION
RESEARCH PROBLEM

200
1. The conceptual identification and the separation of dynamic capabilities
into those processes that are reconfiguration enabling processes and
those processes that are reconfiguration processes.
2. The conceptualisation of strategic processes or dynamic capabilities with
a specific set of measurable “best practice” processes that capture and
incorporate the idea of strategic processes or dynamic capabilities while
being grounded in empirical research.
3. The quantitative identification and description of the strategic processes or
dynamic capabilities of small businesses operating in a turbulent
environment and their resource allocation.
4. The development of a model that elucidates a rational, specific and
targeted approach to initiate and sustain the dynamic capabilities of small
businesses operating in a turbulent environment. The model will
differentiate dynamic capabilities into those that can be influenced by the
shorter-term intervention strategy of specifically increasing management
capabilities and those that require the longer-term strategy of altering
the general resource base of these small firms. By using this rational,
specific and targeted approach to initiate and sustain the dynamic
capabilities of these small firms, their dynamic capabilities will be
strengthened and hence the performance of these small firms in turbulent
environments, will be optimised.
5.2.2 THE RESEARCH OBJECTIVES The research purpose of this study will be achieved through the attainment of the
following research objectives:
1. To quantitatively identify and describe the strategic processes of small
businesses operating in a turbulent environment.
2. To establish and quantify the level of importance of strategic processes in
these small businesses.
3. To establish and quantify the extent of implementation of strategic
processes in these small businesses.
4. To determine from the identified strategic processes, which processes
have statistically significant gaps between their level of importance and
extent of implementation and which have no significant gaps.

201
5. To quantitatively identify and describe how small businesses operating in
turbulent environments allocate their scarce resources to strategic
processes.
6. To differentiate between those strategic processes that can be influenced
by short term intervention mechanisms and those that require long term
intervention mechanisms.
7. To use the differentiated processes to form the basis of a model that
elucidates a rational, specific and targeted approach to initiate and sustain
the dynamic capabilities of small businesses operating in a turbulent
environment. By using this rational, specific and targeted approach to
initiate and sustain the dynamic capabilities of these small firms, their
dynamic capabilities will be strengthened and hence the performance of
these small firms in turbulent environments will be optimised.

202
5.2.3 THE RESEARCH PROPOSITIONS Proposition 1: If there is a positive correlation between the level of importance and extent of
implementation of strategic processes in small businesses operating in a turbulent
environment, then the extent of implementation of these processes will increase
with an increase in the level of importance of these processes in these small firms.
Proposition 2: If there is a positive correlation between the level of importance and extent of
implementation of reconfiguration enabling processes in small businesses
operating in a turbulent environment, then the extent of implementation of these
processes will increase with an increase in the level of importance of these
processes in these small firms.
Proposition 3: If there is a positive correlation between the level of importance and extent of
implementation of reconfiguration processes in small businesses operating in a
turbulent environment, then the extent of implementation of these processes will
increase with an increase in the level of importance of these processes in these
small firms.
5.3 DISCUSSION: IMPORTANCE AND IMPLEMENTATION
The data analysis in section 4.4 provides the information required for the
achievement of research objectives 1, 2 and 3. This analysis enables the
quantitative identification and description of the strategic processes of small
businesses operating in a turbulent environment, the establishment and
quantification of the level of importance of strategic processes in these small
businesses and the establishment and quantification of the extent of
implementation of strategic processes in these small businesses.
For the strategic process clusters, it was found that these small businesses
considered measurement to be the most important strategic process cluster;
while staff-reward was found to be the least important strategic process cluster.
On the other hand networks and support systems was found to be the most implemented strategic process cluster with leadership-turbulence being the
least implemented process cluster.

203
For the individual processes, in terms of importance, it was found that processes
12, 18, 21 and 22 were the most important processes, while processes 10 and 32
were the least important processes
TABLE 25: THE MOST IMPORTANT STRATEGIC PROCESSES IN SMALL
BUSINESSES OPERATING IN A TURBULENT ENVIRONMENT
Process 12
The leadership of a small business has a few simple rules to guide its strategic
processes instead of elaborate strategies [a simple standard operating procedure
is devised to guide decision making]. These rules focus on : – how to carry out key
processes; knowing which opportunities to pursue and which should not be
considered; being able to rank the accepted opportunities; to synchronize the
pace of emerging opportunities and other parts of the company and when to pull
out of yesterday’s opportunities.
Process 18
The leadership of small businesses ensures that personalized service is offered to
customers
Process 21
Key performance measures embedded in the action plans and are used to
systematically track progress towards meeting organizational strategies.
Process 22
The type and quality of data and information collected, as well as its usage and
effectiveness, are periodically evaluated, improved and kept current with changing
trends.

204
TABLE 26: THE LEAST IMPORTANT STRATEGIC PROCESSES IN SMALL BUSINESSES OPERATING IN A TURBULENT ENVIRONMENT
Process 10
Compensation and recognition approaches for individuals and groups, reinforces
performance, teamwork, and learning and business objectives.
Process 32
The leadership of a small business takes into account its legal, ethical and risk
requirements, in its decision-making processes
For the individual processes, in terms of implementation, it was found that
processes 4, 5 and 6 were the most implemented processes, while process 14
was the least implemented process.
TABLE 27: THE MOST IMPLEMENTED STRATEGIC PROCESSES IN SMALL BUSINESSES OPERATING IN A TURBULENT ENVIRONMENT
Process 4
Staff education, development and training activities are structured to balance
organizational objectives with employees’ individual knowledge and skills needs
and are jointly designed by the employees concerned and the small business
leadership detailing specific needs, objectives and performance measures, clearly.
Process 5
The skills, knowledge, values and attitudes of the staff and leadership are
important, relevant, valuable and available to customers.
Process 6
A variety of employee support services ( well being and motivation ) are available,
and are periodically evaluated and improved to meet employee’s needs.
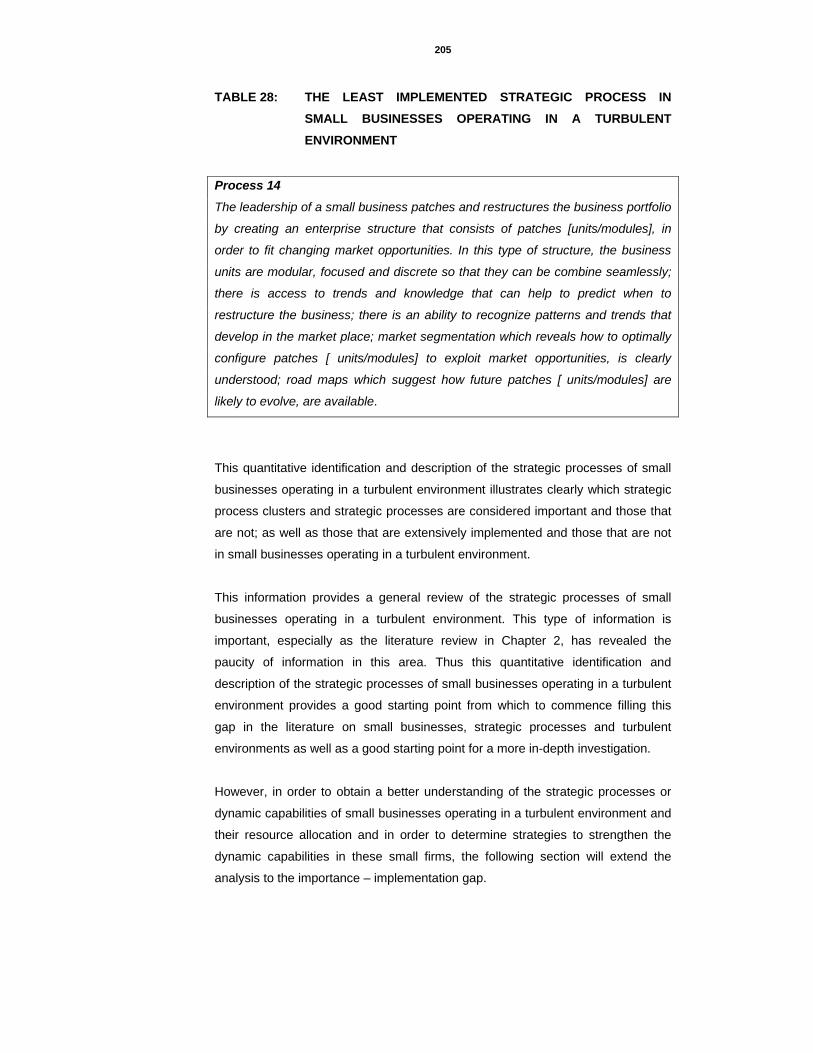
205
TABLE 28: THE LEAST IMPLEMENTED STRATEGIC PROCESS IN SMALL BUSINESSES OPERATING IN A TURBULENT ENVIRONMENT
Process 14
The leadership of a small business patches and restructures the business portfolio
by creating an enterprise structure that consists of patches [units/modules], in
order to fit changing market opportunities. In this type of structure, the business
units are modular, focused and discrete so that they can be combine seamlessly;
there is access to trends and knowledge that can help to predict when to
restructure the business; there is an ability to recognize patterns and trends that
develop in the market place; market segmentation which reveals how to optimally
configure patches [ units/modules] to exploit market opportunities, is clearly
understood; road maps which suggest how future patches [ units/modules] are
likely to evolve, are available.
This quantitative identification and description of the strategic processes of small
businesses operating in a turbulent environment illustrates clearly which strategic
process clusters and strategic processes are considered important and those that
are not; as well as those that are extensively implemented and those that are not
in small businesses operating in a turbulent environment.
This information provides a general review of the strategic processes of small
businesses operating in a turbulent environment. This type of information is
important, especially as the literature review in Chapter 2, has revealed the
paucity of information in this area. Thus this quantitative identification and
description of the strategic processes of small businesses operating in a turbulent
environment provides a good starting point from which to commence filling this
gap in the literature on small businesses, strategic processes and turbulent
environments as well as a good starting point for a more in-depth investigation.
However, in order to obtain a better understanding of the strategic processes or
dynamic capabilities of small businesses operating in a turbulent environment and
their resource allocation and in order to determine strategies to strengthen the
dynamic capabilities in these small firms, the following section will extend the
analysis to the importance – implementation gap.
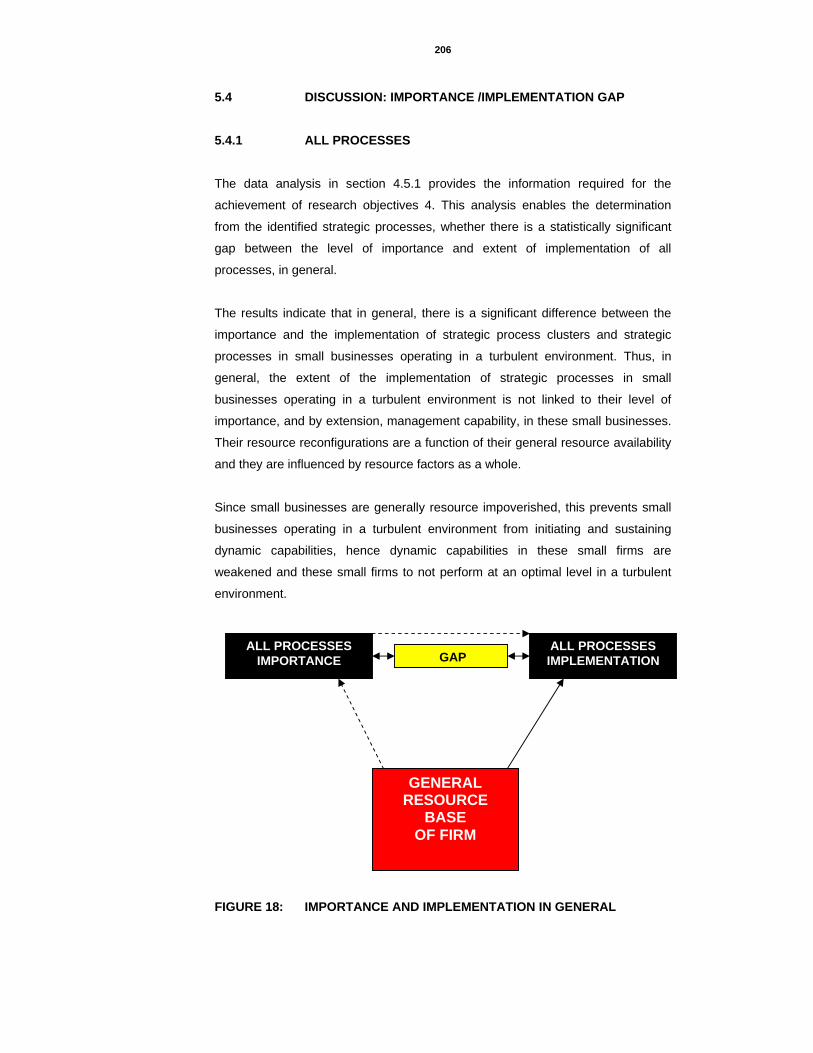
206
5.4 DISCUSSION: IMPORTANCE /IMPLEMENTATION GAP 5.4.1 ALL PROCESSES
The data analysis in section 4.5.1 provides the information required for the
achievement of research objectives 4. This analysis enables the determination
from the identified strategic processes, whether there is a statistically significant
gap between the level of importance and extent of implementation of all
processes, in general.
The results indicate that in general, there is a significant difference between the
importance and the implementation of strategic process clusters and strategic
processes in small businesses operating in a turbulent environment. Thus, in
general, the extent of the implementation of strategic processes in small
businesses operating in a turbulent environment is not linked to their level of
importance, and by extension, management capability, in these small businesses.
Their resource reconfigurations are a function of their general resource availability
and they are influenced by resource factors as a whole.
Since small businesses are generally resource impoverished, this prevents small
businesses operating in a turbulent environment from initiating and sustaining
dynamic capabilities, hence dynamic capabilities in these small firms are
weakened and these small firms to not perform at an optimal level in a turbulent
environment.
FIGURE 18: IMPORTANCE AND IMPLEMENTATION IN GENERAL
ALL PROCESSESIMPORTANCE
ALL PROCESSESIMPLEMENTATION GAP
GENERAL RESOURCE
BASE OF FIRM
207
This general finding provides important information and adds to the knowledge
base on small business theory. However, it is important to investigate further in
order to determine whether there are any specific process clusters or processes
that show no significant differences between the level of importance and extent of
implementation. From the logic described in Section 1.4, changing the level of
importance and by extension the management capability in these process clusters
and processes will increase their extent of implementation, and by extension
thereof, their resource allocation to these process clusters and processes. This
will strengthen the dynamic capabilities in these small firms and optimise small
business performance in a turbulent environment.
Therefore, the following sections will examine whether there are any significant
differences or not between the level of importance and extent of implementation of
process clusters and individual processes.
5.4.2 PROCESS CLUSTERS
The data analysis in section 4.5.2 provides the information required for the
achievement of research objectives 4, 5 and 6. This analysis enables the
determination from the identified strategic processes clusters of which process
clusters have statistically significant gaps between their level of importance and
extent of implementation and which have no significant gaps; the quantitative
identification and description how small businesses operating in turbulent
environments allocate their scarce resources to strategic process clusters and the
differentiation between those strategic process clusters that can be influenced by
short term intervention mechanisms and those that require long term intervention
mechanisms.

208
5.4.2.1 A SIGNIFICANT DIFFERENCE BETWEEN THE IMPORTANCE AND IMPLEMENTATION OF PROCESS CLUSTERS
The results indicate that in small businesses operating in a turbulent environment,
there is a significant difference between the level of importance and extent of
implementation of the strategic process clusters staff knowledge, empowerment
and motivation, leadership-general, leadership–turbulence, measurement,
customers and networks. Thus, for these process clusters specifically, the extent
of the implementation of strategic processes in small businesses operating in a
turbulent environment is not linked to their level of importance, and by extension,
management capability, in these small businesses. Their resource allocation, and
by extension their extent of implementation, with respect to these identified
process clusters are a function of their general resource availability and they are
influenced by resource factors as a whole.
Since small businesses are generally resource impoverished, this prevents small
businesses operating in a turbulent environment from initiating and sustaining
dynamic capabilities that revolve around these process clusters, hence dynamic
capabilities in these small firms are weakened and these small firms to not
perform at an optimal level in a turbulent environment.
While the implementation of these process clusters suffers from a lack of
resources, the results indicate that when small businesses operating in a turbulent
environment do implement strategic processes, they allocate most of their scarce
resources to the strategic process clusters of networks and support systems and
to staff knowledge, empowerment and motivation. Since the former is perceived to
be of lower importance than the latter [networks and support systems falls in the
low importance quadrant compared to staff knowledge, empowerment and
motivation, which is in the high importance quadrant in Graph 5], this finding also
reinforces the view that for these process clusters their extent of implementation
and by extension, their resource allocation is not linked to their level of
importance.
From the above it can be seen that in small businesses operating in a turbulent
environment, innovative resource reconfigurations revolve around networks and
support systems and staff knowledge, empowerment and motivation and these
small firms allocate most of their scarce resources to these process clusters.
The allocation of its scarce resources these two process clusters occurs at the
expense of the process clusters, leadership-general, leadership-turbulence,

209
measurement and customers. This results in limited or no innovative resource
reconfigurations revolving around these process clusters.
In Graph 5, in the quadrant high importance/low implementation, the process
clusters – customers, measurement, leadership-general and leadership-
turbulence – compete for whatever scarce resources that are left after these small
businesses have implemented the staff-knowledge, empowerment and motivation
and networks and support systems process clusters. Although these small
businesses consider these process clusters to be important, their extent of
implementation is low and scarce resources are spread out over these process
clusters. In particular, these businesses face difficult choices about whether to
allocate their resources to leadership-general or leadership turbulence [these
process clusters are concentrated together in Graph 5].
These research findings provide clarity about how small businesses operating in a
turbulent environment allocate their scarce resources to strategic processes.
FIGURE 19: THE IMPORTANCE AND IMPLEMENTATION OF PROCESS
CLUSTERS AND RESOURCES
PROCESSCLUSTERS
IMPORTANCE SKEM LG LT M C N
PROCESS CLUSTERS
IMPLEMENTATION SKEM LG LT M C
N
GAP
GENERAL RESOURCE
BASE OF THE FIRM

210
5.4.2.2 NO SIGNIFICANT DIFFERENCE BETWEEN THE IMPORTANCE AND IMPLEMENTATION OF PROCESS CLUSTERS
The results presented in Section 4.5.2, also indicate that in small businesses
operating in a turbulent environment, there is no significant difference between the
level of importance and extent of implementation of the process cluster staff
reward. Thus, for these process clusters specifically, the extent of the
implementation of strategic processes in small businesses operating in a turbulent
environment is linked to their level of importance, and by extension, management
capability, in these small businesses. Their resource allocation, and by extension
their extent of implementation, with respect to these identified process clusters are
a function of their level of importance, and by extension management capability in
small businesses operating in a turbulent environment.
This process cluster – Staff reward - can benefit from the shorter term intervention
strategy of the enhancing and upgrading of management capabilities. Thus
management education and training about staff reward and reward systems will
benefit resource allocation to this process cluster and facilitate innovative resource
reconfigurations that revolve around this process cluster. This will lead to a
strengthening of the dynamic capabilities of these small firms and hence the
performance of these small firms in turbulent environments will be optimised.
Other studies also reinforce this finding. In smaller firms compensation in terms of
salary and benefits do not usually compare with those in larger firms (Lichtenstein,
1998:55). In addition, small business managers do not see incentives as essential
to the improvement of productivity (Amba-Rao and Pendse, 1985:19). In addition
Beaver and Jennings (2005:9), have also stated that in small firms, promotions
are often made on the basis of birth or personal friendship, rather than on the
basis of educational and technical qualifications.

211
FIGURE 20: THE IMPORTANCE AND IMPLEMENTATION OF PROCESS
CLUSTERS AND MANAGEMENT CAPABILITY
The above finding provides important information and adds to the knowledge base
on small business theory, and further provides the basis for a rational, targeted,
specific, comparably short term and less complex intervention strategy to enable
the strengthening of the dynamic capabilities of small businesses operating in a
turbulent environment.
However, it is also imperative to investigate further in order to determine whether
there are any specific processes that show no significant differences between
importance and implementation and which can then benefit from rational, targeted,
specific, comparatively less complex and shorter term intervention strategies in
order to enable the strengthening of the dynamic capabilities of small businesses
operating in a turbulent environment.
Therefore, the following sections will examine whether there are any significant
differences or not between the level of importance and extent of implementation of
individual processes.
PROCESSCLUSTER
IMPORTANCE SR
PROCESS CLUSTER
IMPLEMENTATION SR
NO GAP
MANAGEMENT CAPABILITY

212
5.4.3 INDIVIDUAL PROCESSES
The data analysis in section 4.5.3 provides the information required for the
achievement of research objectives 4, 5 and 6. This analysis enables the
determination from the identified strategic processes clusters of which process
clusters have statistically significant gaps between their level of importance and
extent of implementation and which have no significant gaps; the quantitative
identification and description how small businesses operating in turbulent
environments allocate their scarce resources to strategic process clusters and the
differentiation between those strategic process clusters that can be influenced by
short term intervention mechanisms and those that require long term intervention
mechanisms
5.4.3.1 A SIGNIFICANT DIFFERENCE BETWEEN THE IMPORTANCE AND IMPLEMENTATION OF PROCESSES
The results indicate that in small businesses operating in a turbulent environment,
there is a significant difference between the level of importance and extent of
implementation of the processes illustrated in Table 29. Thus, for these processes
specifically, the extent of the implementation of strategic processes in small
businesses operating in a turbulent environment is not linked to their level of
importance, and by extension, management capability, in these small businesses.
Their resource allocation, and by extension their extent of implementation, with
respect to these identified processes are a function of their general resource
availability and they are influenced by resource factors as a whole.
Since small businesses are generally resource impoverished, this prevents small
businesses operating in a turbulent environment from initiating and sustaining
dynamic capabilities that revolve around these process clusters, hence dynamic
capabilities in these small firms are weakened and these small firms to not
perform at an optimal level in a turbulent environment.

213
TABLE 29: STRATEGIC PROCESSES WHICH HAVE A SIGNIFICANT GAP BETWEEN LEVEL OF IMPORTANCE AND EXTENT OF IMPLEMENTATION
Process 1
The leadership of a small business, through both formal [e.g. defined and
structured] and informal [e.g. observation] methods, fosters staff empowerment
and innovation.
Process 2
The leadership of a small business allows the business to co-evolve by fostering,
driving and executing multi-business/multi-unit collaborative linkages and
managing group dynamics while at the same time empowering staff.
Process 3
Work and job descriptions are created, organized and managed in such a manner
so as to promote cooperation, initiative and innovation as well as to empower staff
and further entrench the organizational culture.
Process 5
The skills, knowledge, values and attitudes of the staff and leadership are
important, relevant, valuable and available to customers.
Process 9
Key human resource plans are derived from and linked to the overall business
strategy with respect to compensation, benefits and recruitment.
Process 11
The leadership of a small business serves as a role model for the organisation
and all stakeholders.
Process 12
The leadership of a small business has a few simple rules to guide its strategic
processes instead of elaborate strategies [a simple standard operating procedure
is devised to guide decision making]. These rules focus on : – how to carry out key
processes; knowing which opportunities to pursue and which should not be
considered; being able to rank the accepted opportunities; to synchronize the
pace of emerging opportunities and other parts of the company and when to pull
out of yesterday’s opportunities.
Process 13
The leadership of a small business ensures that the design of key healthcare
services and the service delivery process incorporates quality and operational
performance requirements such as cost control, health, safety, and environmental
impacts, process capability, maintainability, supplier capability and cycle time.

214
Process 14
The leadership of a small business patches and restructures the business portfolio
by creating an enterprise structure that consists of patches [units/modules], in
order to fit changing market opportunities. In this type of structure, the business
units are modular, focused and discrete so that they can be combine seamlessly;
there is access to trends and knowledge that can help to predict when to
restructure the business; there is an ability to recognize patterns and trends that
develop in the market place; market segmentation which reveals how to optimally
configure patches [ units/modules] to exploit market opportunities, is clearly
understood; road maps which suggest how future patches [ units/modules] are
likely to evolve, are available.
Process 15
The leadership of a small business develops strategies that are clearly translated
into action plans that support the achievement of organizational objectives.
Strategies are linked to resources, implementation procedures and defined
performance measures.
Process 16
The leadership of a small business knows what resources [e.g. human, financial,
physical, support] are available to the business; their constraints, their capacities
and their advantages.
Process 17
The leadership of a small business devises appropriate strategies that can
maximize any resource advantage and overcome any resource limitation.
Process 18
The leadership of small businesses ensures that personalized service is offered to
customers Process 19
The organization regularly measures and analyses organizational performance to
provide the information and data to support the organization’s strategic planning
process, as well as its operational and functional processes to enable continuous
improvement.
Process 20
Key information and data - financial and non-financial- is clearly linked to the
organisation’s processes and goals, and are systematically gathered and used to
track and improve the company’s performance at all levels.
Process 21
Key performance measures are embedded in the action plans and are used to
systematically track progress towards meeting organisational strategies.

215
Process 22
The type and quality of data and information collected, as well as its usage and
effectiveness, are periodically evaluated, improved and kept current with changing
trends.
Process 23
All measures of organizational performance captured by the small business are
compared against industry or best-in-class benchmarks
Process 24
There is ease of access for small businesses customers when they are seeking
information or assistance and/or when they wish to comment or complain.
Process 25
A complaint management process exists that ensures complaints are not only
resolved effectively and promptly but are also analyzed as a source of
improvement activities.
Process 26
Good relationships with customers are actively pursued and maintained by both
staff and the leadership of small businesses.
Process 27
The design of key healthcare services and the service delivery process is
addressed systematically accounting for changing customer requirements.
Process 28
The company gathers information about customer satisfaction for all key customer
segments and captures information that reflects transaction quality, customer
repurchase, new business and positive referral.
Process 31
The leadership of a small business has strong friend, family and professional
networks.
Process 32
The leadership of a small business takes into account its legal, ethical and risk
requirements, in its decision-making processes

216
FIGURE 21: THE IMPORTANCE AND IMPLEMENTATION OF PROCESSES AND RESOURCES
While the implementation of these process clusters suffers from a lack of
resources, the results indicate that when small businesses operating in a turbulent
environment do implement strategic processes, they allocate most of their scarce
resources to the strategic processes 5, 31 and 32, illustrated in Table 32, although
the latter two are perceived to be of lower importance than the former [in Graph 6,
processes 31 and 32 fall in the low importance quadrant, compared to process 5,
which is in the high importance quadrant]. This finding also reinforces the view
that for these process clusters their extent of implementation and hence resource
allocation and new resource reconfiguration is not linked to their level of
importance.
From the above it can be seen that in small businesses operating in a turbulent
environment, innovative resource reconfigurations revolve around strategic
processes – 5, 31 and 32 - and these small firms allocate most of their scarce
resources to these processes.
The allocation of its scarce resources these three processes clusters occurs at the
expense of the other processes stated in Table 31. This results in limited or no
innovative resource reconfigurations revolving around these processes.
PROCESSESIMPORTANCE
1,2,3,5,9,11,12,13,14,15,16,17,18,19,20,21,22,23,24,25,26,27,28,
31,32
PROCESSES IMPLEMENTATION
1,2,3,5,9,11,12,13,14,15,16,17,18,19,20,21,22,23,24,25,26,27,28,
31,32
GAP
GENERAL RESOURCE
BASE

217
TABLE 30: STRATEGIC PROCESSES THAT RECEIVE THE GREATEST RESOURCE ALLOCATION
Process 5
The skills, knowledge, values and attitudes of the staff and leadership are
important, relevant, valuable and available to customers.
Process 31
The company gathers information about customer satisfaction for all key customer
segments and captures information that reflects transaction quality, customer
repurchase, new business, and positive referral.
Process 32
The leadership of a small business takes into account its legal, ethical and risk
requirements, in its decision-making processes
In Graph 6, in the quadrants, high importance/low implementation, and low
importance and low implementation, the processes –
1,2,3,9,11,12,13,14,15,16,17,18,19,20,21,22,23,24,25,26,27,28 - compete for
whatever scarce resources that are left after these small businesses have
implemented the processes – 5, 31, 32. Although these small businesses consider
these processes to be important, their extent of implementation is low and scarce
resources are spread out over these process clusters. In particular, these
businesses face difficult choices about whether to allocate their resources to the
following groups of processes:
Group 1-1/2/3/16/24/26/27/28
Group 2-12/15/17/18/20/22
Group 3-11/13/14/19/23
These processes are concentrated together in three distinct areas in Graph 6.
Because their resource allocation, and by extension their extent of
implementation, with respect to these identified processes, 1,2,3,16,24,26,27,28,
illustrated in Table 31, are a function of their general resource availability and they
are influenced by resource factors as a whole, small businesses operating in a
turbulent environment may pursue one of these processes at the expense of
another. For example, good relationships with customers may be implemented at
the expense of the reconfiguration process of co-evolving or work and job
descriptions created at the expense of ease of customer access to assistance.
Attempting to change only the importance perception of the management towards
these processes will not change the manner in which resources are allocated to

218
these processes and subsequently innovative resource reconfigurations will not be
enabled. These processes require the comparatively more complex and longer
term intervention of an alteration of the general resource base of the small
business operating in a turbulent environment in order to facilitate innovative
resource reconfigurations that revolve around these processes.
TABLE 31: GROUP 1-STRATEGIC PROCESSES ABOUT WHICH SMALL
BUSINESS OPERATING IN A TURBULENT ENVIRONMENT FACE DIFFICULT CHOICES IN RESOURCE ALLOCATION
Process 1
The leadership of a small business, through both formal [e.g. defined and
structured] and informal [e.g. observation] methods, fosters staff empowerment
and innovation.
Process 2
The leadership of a small business allows the business to co-evolve by fostering,
driving and executing multi-business/multi-unit collaborative linkages and
managing group dynamics while at the same time empowering staff.
Process 3
Work and job descriptions are created, organized and managed in such a manner
so as to promote cooperation, initiative and innovation as well as to empower staff
and further entrench the organizational culture.
Process 16
The leadership of a small business knows what resources [e.g. human, financial,
physical, support] are available to the business; their constraints, their capacities
and their advantages.
Process 24
There is ease of access for small businesses customers when they are seeking
information or assistance and/or when they wish to comment or complain.
Process 26
Good relationships with customers are actively pursued and maintained by both
staff and the leadership of small businesses.
Process 27
The design of key healthcare services and the service delivery process is
addressed systematically accounting for changing customer requirements.
Process 28
The company gathers information about customer satisfaction for all key customer
segments and captures information that reflects transaction quality, customer
repurchase, new business and positive referral.

219
Because their resource allocation, and by extension their extent of
implementation, with respect to these identified processes, 12, 15, 17,18,20,22,,
illustrated in Table 32, are a function of their general resource availability and they
are influenced by resource factors as a whole, small businesses operating in a
turbulent environment may pursue one of these processes at the expense of
another. For example, personalised customer service may be implemented at the
expense of the reconfiguration enabling process of simple rules or the type and
quality of data that is collected may be at the expense of ease of using key data to
improve performance. Attempting to change only the importance perception of the
management towards these processes will not change the manner in which
resources are allocated to these processes and subsequently innovative resource
reconfigurations will not be enabled. These processes require the comparatively
more complex and longer term intervention of an alteration of the general resource
base of the small business operating in a turbulent environment in order to
facilitate innovative resource reconfigurations.
TABLE 32: GROUP 2-STRATEGIC PROCESSES ABOUT WHICH SMALL
BUSINESS OPERATING IN A TURBULENT ENVIRONMENT FACE DIFFICULT CHOICES IN RESOURCE ALLOCATION
Process 12
The leadership of a small business has a few simple rules to guide its strategic
processes instead of elaborate strategies [a simple standard operating procedure
is devised to guide decision making]. These rules focus on : – how to carry out key
processes; knowing which opportunities to pursue and which should not be
considered; being able to rank the accepted opportunities; to synchronize the
pace of emerging opportunities and other parts of the company and when to pull
out of yesterday’s opportunities.
Process 15
The leadership of a small business develops strategies that are clearly translated
into action plans that support the achievement of organizational objectives.
Strategies are linked to resources, implementation procedures and defined
performance measures.
Process 17
The leadership of a small business devises appropriate strategies that can
maximize any resource advantage and overcome any resource limitation.
Process 18
The leadership of small businesses ensures that personalized service is offered to
customers
Process 20

220
Key information and data - financial and non-financial- is clearly linked to the
organisation’s processes and goals, and are systematically gathered and used to
track and improve the company’s performance at all levels.
Process 22
The type and quality of data and information collected, as well as its usage and
effectiveness, are periodically evaluated, improved and kept current with changing
trends.
Because their resource allocation, and by extension their extent of
implementation, with respect to these identified processes, 11,13,14,9,3,
illustrated in Table 33, are a function of their general resource availability and they
are influenced by resource factors as a whole, small businesses operating in a
turbulent environment may pursue one of these processes at the expense of
another. For example, measurement and analysis of organisational performance
may be implemented at the expense of the reconfiguration process of patching or
the role model function of the leadership of the small business may be
implemented at the expense of best-in class benchmarks. Attempting to change
only the importance perception of the management towards these processes will
not change the manner in which resources are allocated to these processes and
subsequently innovative resource reconfigurations. These processes require the
comparatively more complex and longer term intervention of an alteration of the
general resource base of the small business operating in a turbulent environment
in order to facilitate innovative resource reconfigurations.
TABLE 33: GROUP 3-STRATEGIC PROCESSES ABOUT WHICH SMALL
BUSINESS OPERATING IN A TURBULENT ENVIRONMENT FACE DIFFICULT CHOICES IN RESOURCE ALLOCATION
Process 11
The leadership of a small business serves as a role model for the organisation
and all stakeholders. Process 13
The leadership of a small business ensures that the design of key healthcare
services and the service delivery process incorporates quality and operational
performance requirements such as cost control, health, safety, and environmental
impacts, process capability, maintainability, supplier capability and cycle time.

221
Process 14
The leadership of a small business patches and restructures the business portfolio
by creating an enterprise structure that consists of patches [units/modules], in
order to fit changing market opportunities. In this type of structure, the business
units are modular, focused and discrete so that they can be combine seamlessly;
there is access to trends and knowledge that can help to predict when to
restructure the business; there is an ability to recognize patterns and trends that
develop in the market place; market segmentation which reveals how to optimally
configure patches [ units/modules] to exploit market opportunities, is clearly
understood; road maps which suggest how future patches [ units/modules] are
likely to evolve, are available.
Process 19
The organization regularly measures and analyses organizational performance to
provide the information and data to support the organization’s strategic planning
process, as well as its operational and functional processes to enable continuous
improvement.
Process 23
All measures of organizational performance captured by the small business are
compared against industry or best-in-class benchmarks
The results also indicate that processes 9 and 25, illustrated in table 34, are of low
importance in small businesses operating in a turbulent environment. They are
also implemented to a low extent. These processes do not receive priority in
resource allocation. Attempting to change only the importance perception of the
management towards these processes will not change the manner in which
resources are allocated to these processes and subsequently innovative resource
reconfigurations will not be enabled. These processes require the comparatively
more complex and longer term intervention of an alteration of the general resource
base of the small business operating in a turbulent environment in order to
facilitate innovative resource reconfigurations.

222
TABLE 34: STRATEGIC PROCESSES THAT DO NOT RECEIVE PRIORITY IN RESOURCE ALLOCATION IN SMALL BUSINESSES OPERATING IN A TURBULENT ENVIRONMENT.
Process 9
Key human resource plans are derived from and linked to the overall business
strategy with respect to compensation, benefits and recruitment.
Process 25
A complaint management process exists that ensures complaints are not only
resolved effectively and promptly but are also analyzed as a source of
improvement activities.
5.4.3.2 NO SIGNIFICANT DIFFERENCE BETWEEN THE IMPORTANCE AND IMPLEMENTATION OF PROCESSES
The results also indicate that in small businesses operating in a turbulent
environment, there is no significant difference between the level of importance and
extent of implementation of the processes 4, 6,7,8,10,29 and 30, illustrated in
Table 35. Thus, for these processes specifically, the extent of the implementation
of strategic processes in small businesses operating in a turbulent environment is
linked to their level of importance, and by extension, management capability, in
these small businesses. Their resource allocation, and by extension their extent of
implementation, with respect to these identified processes are a function of their
level of importance, and by extension management capability in small businesses
operating in a turbulent environment.
These processes – 4, 6,7,8,10,29 and 30 - can benefit from the shorter term
intervention strategy of the enhancing and upgrading of management capabilities.
Thus management education and training about these processes will benefit
resource allocation to this process cluster and facilitate innovative resource
reconfigurations that revolve around this process cluster. This will lead to a
strengthening of the dynamic capabilities of these small firms and hence the
performance of these small firms in turbulent environments will be optimised.
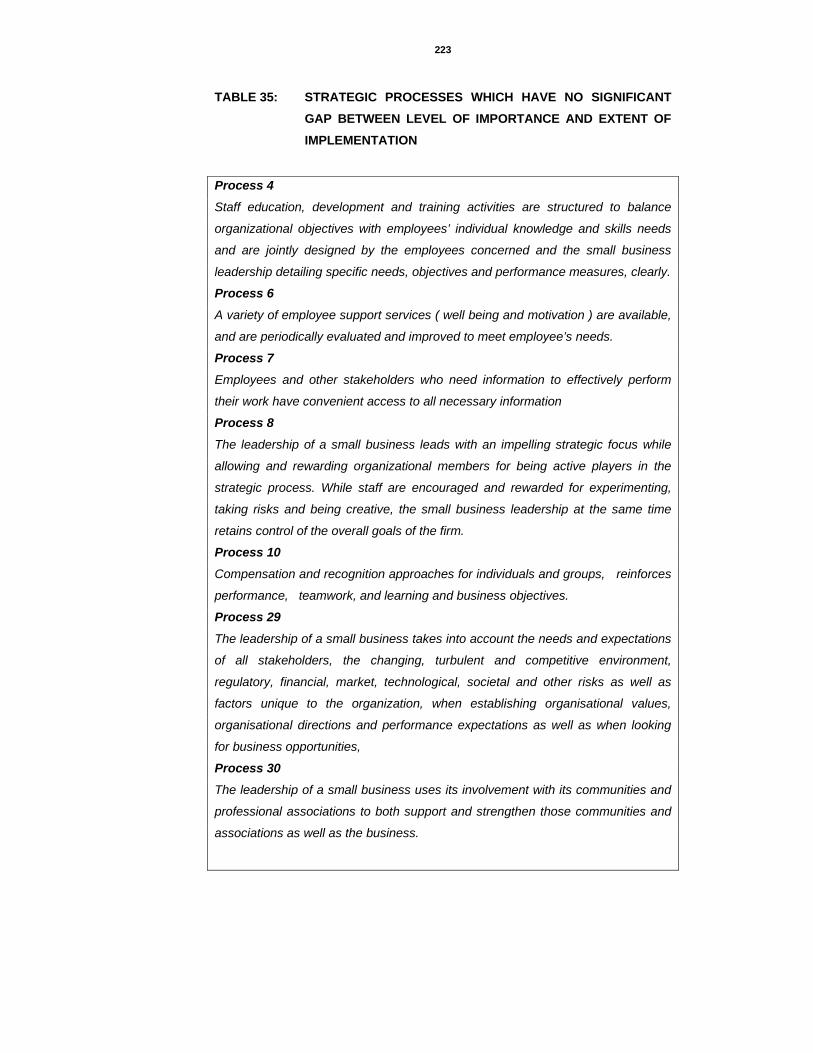
223
TABLE 35: STRATEGIC PROCESSES WHICH HAVE NO SIGNIFICANT GAP BETWEEN LEVEL OF IMPORTANCE AND EXTENT OF IMPLEMENTATION
Process 4
Staff education, development and training activities are structured to balance
organizational objectives with employees’ individual knowledge and skills needs
and are jointly designed by the employees concerned and the small business
leadership detailing specific needs, objectives and performance measures, clearly.
Process 6
A variety of employee support services ( well being and motivation ) are available,
and are periodically evaluated and improved to meet employee’s needs.
Process 7
Employees and other stakeholders who need information to effectively perform
their work have convenient access to all necessary information
Process 8
The leadership of a small business leads with an impelling strategic focus while
allowing and rewarding organizational members for being active players in the
strategic process. While staff are encouraged and rewarded for experimenting,
taking risks and being creative, the small business leadership at the same time
retains control of the overall goals of the firm.
Process 10
Compensation and recognition approaches for individuals and groups, reinforces
performance, teamwork, and learning and business objectives.
Process 29
The leadership of a small business takes into account the needs and expectations
of all stakeholders, the changing, turbulent and competitive environment,
regulatory, financial, market, technological, societal and other risks as well as
factors unique to the organization, when establishing organisational values,
organisational directions and performance expectations as well as when looking
for business opportunities,
Process 30
The leadership of a small business uses its involvement with its communities and
professional associations to both support and strengthen those communities and
associations as well as the business.

224
FIGURE 22: THE IMPORTANCE AND IMPLEMENTATION OF PROCESSES
AND MANAGEMENT CAPABILITY
The above findings provide important information and add to the knowledge base
and further provide the basis for rational, targeted, specific, comparably short term
and less complex intervention strategies to enable the strengthening of dynamic
capabilities in small businesses operating in a turbulent environment.
PROCESSESIMPORTANCE 4,6,7,8,10,29,30
PROCESSES IMPLEMENTATION
4,6,7,8,10,29,30
NO GAP
MANAGEMENT CAPABILITY

225
5.5 CHAPTER CONCLUSIONS The results that were presented in Chapter 4 were discussed here. The discussion
started with a description of the level of importance and extent of implementation
of processes clusters and processes. It then proceeded to discuss the results on
the level of process clusters, and then at the level of individual processes. This
discussion will feed into the next chapter on conclusions with a view to satisfying
the research problem, the research purpose, the research objectives and the
research propositions. The discussion will also be drawn into the new strategic
model and theory that will be developed.

226
CHAPTER SIX CONCLUSIONS
AND RECOMMENDATIONS

227
CHAPTER 6: CONCLUSIONS AND RECOMMENDATIONS
6.1 CHAPTER SUMMARY
The aims of this chapter were to present the major findings of this study, show
how the research problem, the research purpose, the research objectives and the
research propositions are satisfied and to make recommendations for future areas
of research.
This chapter commenced with a linking of each element of the research purpose,
research objectives to chapters and sections where they were addressed. Using
the empirical results of the study, the research propositions were examined to
indicate whether they were supported or not. This chapter also reported on a new
strategic model and theory on the strategic processes of small businesses
operating in a turbulent environment and presented a summary of the main
research findings.
The main conclusion of the study was highlighted viz. by the employment of
stepwise, rational, specific and targeted interventions and strategies that are
designed to initiate and sustain the dynamic capabilities of small businesses
operating in a turbulent environment, the dynamic capabilities of these small firms
can be strengthened and hence their performance in turbulent environments
optimised.
Several recommendations for future research in this area were also made.

228
6.2 INTRODUCTION The research problem and the research purpose are satisfied through the
achievement of the research objectives and the investigation of the research
propositions.
FIGURE 23: STUDY FINDINGS, RESEARCH OBJECTIVES, RESEARCH
PROPOSITIONS, RESEARCH PURPOSE AND RESEARCH PROBLEM
6.3 ACHIEVEMENT OF RESEARCH PURPOSE:
In order to achieve the anticipated solution to the research problem of this study,
the purpose of the research was to investigate the strategic processes of small
businesses operating in a turbulent environment. The core elements of this
purpose comprise of:
1. The conceptual identification and the separation of dynamic capabilities
into those processes that are reconfiguration processes and those
processes that are reconfiguration enabling processes.
This has been achieved in Chapter 2.
RESEARCH PURPOSE
Research objectives
Research propositions
MAIN FINDINGS OF STUDY
RESEARCH PROBLEM

229
2. The conceptualisation of strategic processes or dynamic capabilities with
a specific set of measurable “best practice” processes that capture and
incorporate the idea of strategic processes or dynamic capabilities while
being grounded in empirical research.
This has been achieved in Chapter 2.
3. The quantitative identification and description of the strategic processes or
dynamic capabilities of small businesses operating in a turbulent
environment and their resource allocation.
This has been achieved in Chapters 4 and 5.
4. The development of a model that elucidates a rational, specific and
targeted approach to initiate and sustain the dynamic capabilities of small
businesses operating in a turbulent environment. The model will
differentiate dynamic capabilities into those that can be influenced by the
shorter-term intervention strategy of specifically increasing management
capabilities and those that require the longer- term strategy of altering
the general resource base of these small firms. By using this rational,
specific and targeted approach to initiate and sustain the dynamic
capabilities of these small firms, their dynamic capabilities will be
strengthened and hence the performance of these small firms in turbulent
environments, will be optimised.
This has been achieved in Chapter 5 and reported in Chapter 6.
6.4 ACHIEVEMENT OF RESEARCH OBJECTIVES:
In order to achieve the research purpose of this study the research objectives of
this study are:
1. To quantitatively identify and describe the strategic processes of small
businesses operating in a turbulent environment.
This has been achieved in Sections 4.4 and 5.1
2. To establish and quantify the level of importance of strategic processes in
these small businesses. This has been achieved in Sections 4.4 and 5.1

230
3. To establish and quantify the extent of implementation of strategic
processes in these small businesses. This has been achieved in Sections 4.4 and 5.1
4. To determine from the identified strategic processes, which processes
have statistically significant gaps between their level of importance and
extent of implementation and which have no significant gaps.
This has been achieved in Sections 4.5 and 5.2
5. To quantitatively identify and describe how small businesses operating in
turbulent environments allocate their scarce resources to strategic
processes. This has been achieved in Sections 4.5 and 5.2
6. To differentiate between those strategic processes that can be influenced
by short term intervention mechanisms and those that require long term
intervention mechanisms. This has been achieved in Section 4.5 and reported in Chapter 6
7. To use the differentiated processes to form the basis of a model that
elucidates a rational, specific and targeted approach to initiate and sustain
the dynamic capabilities of small businesses operating in a turbulent
environment. By using this rational, specific and targeted approach to
initiate and sustain the dynamic capabilities of these small firms, their
dynamic capabilities will be strengthened and hence the performance
of these small firms in turbulent environments will be optimised.
This has been achieved in Section 4.5 and reported in Chapter 6

231
6.5 ADDRESSING RESEARCH PROPOSITIONS
The research propositions developed according to the methodology reported in
Chapter 3 and motivated for in Chapter 2 are evaluated in this section against the
research findings.
Proposition 1: If there is a positive correlation between the level of importance and extent of
implementation of strategic processes in small businesses operating in a turbulent
environment, then the extent of implementation of these processes will increase
with an increase in the level of importance of these processes in these small firms.
The study’s findings are reflected initially as process clusters and then individually
as processes. The process clusters that were identified through a factor analysis
are:
♦ Staff – knowledge, motivation and empowerment
♦ Staff-reward
♦ Leadership-general
♦ Leadership-turbulence
♦ Measurement
♦ Customers
♦ Networks and Support Systems
Of these, only the process cluster Staff-reward displayed no significant gap
between the level of importance and the extent of implementation in small
businesses operating in a turbulent environment. Section 1.4 describes the
importance/implementation approach used in this study.
Where there is no significant difference between the level of importance and
extent of implementation of these process clusters, the extent of implementation
and hence their resource allocation, will be influenced by an alteration of the
importance perception. Thus, for the process cluster Staff-reward, increasing the
levels of importance, and by extension management capability about Staff-reward,
will increase the extent of its implementation, and by extension, extent of resource
allocation to this process cluster in small businesses operating in a turbulent
environment. This will strengthen the dynamic capabilities of these small firms and
enable the optimal performance of small businesses operating in a turbulent
environment.

232
The research results partially support this proposition, since only the extent of
implementation, and by extension resource allocation to the process cluster Staff-
reward will be increased by an increase in its level of importance, and by
extension, management capability in this process cluster.
Resource impoverishment of the general resource base of the small business
operating in a turbulent environment constrains the implementation of the other
process clusters, Staff – knowledge, motivation and empowerment, Leadership-
general, Leadership-turbulence, Measurement, Customers, Networks and Support
Systems.
Proposition 2: If there is a positive correlation between the level of importance and extent of
implementation of reconfiguration enabling processes in small businesses
operating in a turbulent environment, then the extent of implementation of these
processes will increase with an increase in the level of importance of these
processes in these small firms.
Of the reconfiguration enabling processes, only processes 4-6-7-8-10-29-30
showed no significant gap between the level of importance and extent of
implementation in small businesses operating in a turbulent environment. These
processes are indicated below:
Process 4
Staff education, development and training activities are structured to balance
organizational objectives with employees’ individual knowledge and skills needs
and are jointly designed by the employees concerned and the small business
leadership detailing specific needs, objectives and performance measures, clearly.
Process 6
A variety of employee support services ( well being and motivation ) are available,
and are periodically evaluated and improved to meet employee’s needs.
Process 7
Employees and other stakeholders who need information to effectively perform
their work have convenient access to all necessary information
Process 8 The leadership of a small business leads with an impelling strategic focus while
allowing and rewarding organizational members for being active players in the
strategic process. While staff are encouraged and rewarded for experimenting,

233
taking risks and being creative, the small business leadership at the same time
retains control of the overall goals of the firm.
Process 10
Compensation and recognition approaches for individuals and groups, reinforces
performance, teamwork, and learning and business objectives.
Process 29
The leadership of a small business takes into account the needs and expectations
of all stakeholders, the changing, turbulent and competitive environment,
regulatory, financial, market, technological, societal and other risks as well as
factors unique to the organization, when establishing organisational values,
organisational directions and performance expectations as well as when looking
for business opportunities,
Process 30 The leadership of a small business uses its involvement with its communities and
professional associations to both support and strengthen those communities and
associations as well as the business.
Where there is no significant difference between the level of importance and
extent of implementation of these processes, the extent of implementation and
hence their resource allocation, will be influenced by an alteration of the
importance perception. Thus, for the process - 4-6-7-8-10-29-30- increasing the
levels of importance, and by extension management capability about these
processes, will increase the extent of their implementation, and by extension,
extent of resource allocation to them in small businesses operating in a turbulent
environment. This will strengthen the dynamic capabilities of these small firms and
enable the optimal performance of small businesses operating in a turbulent
environment.
The research results partially support this proposition, since only the extent of
implementation, and by extension resource allocation to the processes - 4-6-7-8-
10-29-30- will be increased by an increase in its level of importance, and by
extension, management capability in these processes.

234
Resource impoverishment of the general resource base of the small business
operating in a turbulent environment constrains the implementation of the other
processes indicated below:
Process 1
The leadership of a small business, through both formal [e.g. defined and
structured] and informal [e.g. observation] methods, fosters staff empowerment
and innovation.
Process 3
Work and job descriptions are created, organized and managed in such a manner
so as to promote cooperation, initiative and innovation as well as to empower staff
and further entrench the organizational culture.
Process 5
The skills, knowledge, values and attitudes of the staff and leadership are
important, relevant, valuable and available to customers.
Process 9
Key human resource plans are derived from and linked to the overall business
strategy with respect to compensation, benefits and recruitment.
Process 11
The leadership of a small business serves as a role model for the organisation
and all stakeholders.
Process 12
The leadership of a small business has a few simple rules to guide its strategic
processes instead of elaborate strategies [a simple standard operating procedure
is devised to guide decision making]. These rules focus on : – how to carry out key
processes; knowing which opportunities to pursue and which should not be
considered; being able to rank the accepted opportunities; to synchronize the
pace of emerging opportunities and other parts of the company and when to pull
out of yesterday’s opportunities.
Process 13
The leadership of a small business ensures that the design of key healthcare
services and the service delivery process incorporates quality and operational
performance requirements such as cost control, health, safety, and environmental
impacts, process capability, maintainability, supplier capability and cycle time.
Process 15
The leadership of a small business develops strategies that are clearly translated
into action plans that support the achievement of organizational objectives.
Strategies are linked to resources, implementation procedures and defined
performance measures.
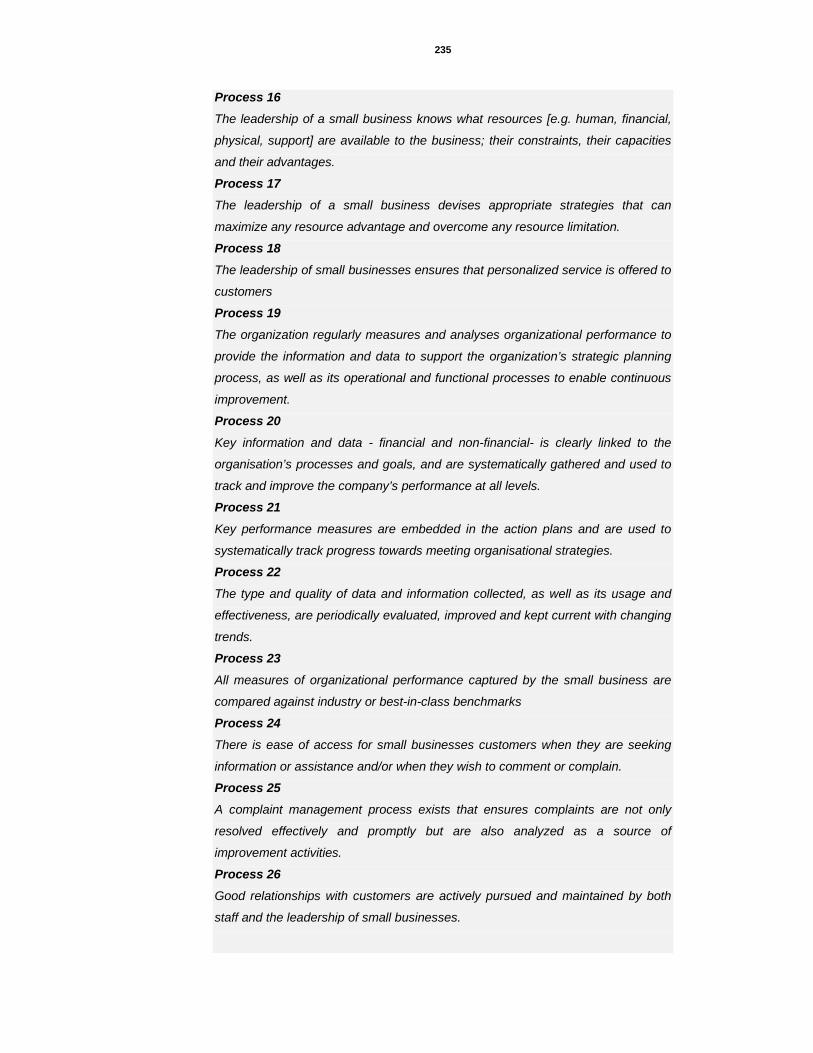
235
Process 16
The leadership of a small business knows what resources [e.g. human, financial,
physical, support] are available to the business; their constraints, their capacities
and their advantages.
Process 17
The leadership of a small business devises appropriate strategies that can
maximize any resource advantage and overcome any resource limitation.
Process 18
The leadership of small businesses ensures that personalized service is offered to
customers Process 19
The organization regularly measures and analyses organizational performance to
provide the information and data to support the organization’s strategic planning
process, as well as its operational and functional processes to enable continuous
improvement.
Process 20
Key information and data - financial and non-financial- is clearly linked to the
organisation’s processes and goals, and are systematically gathered and used to
track and improve the company’s performance at all levels.
Process 21
Key performance measures are embedded in the action plans and are used to
systematically track progress towards meeting organisational strategies.
Process 22
The type and quality of data and information collected, as well as its usage and
effectiveness, are periodically evaluated, improved and kept current with changing
trends.
Process 23
All measures of organizational performance captured by the small business are
compared against industry or best-in-class benchmarks
Process 24
There is ease of access for small businesses customers when they are seeking
information or assistance and/or when they wish to comment or complain.
Process 25
A complaint management process exists that ensures complaints are not only
resolved effectively and promptly but are also analyzed as a source of
improvement activities.
Process 26
Good relationships with customers are actively pursued and maintained by both
staff and the leadership of small businesses.

236
Process 27
The design of key healthcare services and the service delivery process is
addressed systematically accounting for changing customer requirements.
Process 28
The company gathers information about customer satisfaction for all key customer
segments and captures information that reflects transaction quality, customer
repurchase, new business and positive referral.
Process 31
The leadership of a small business has strong friend, family and professional
networks.
Process 32
The leadership of a small business takes into account its legal, ethical and risk
requirements, in its decision-making processes
Proposition 3: If there is a positive correlation between the level of importance and extent of
implementation of reconfiguration processes in small businesses operating in a
turbulent environment, then the extent of implementation of these processes will
increase with an increase in the level of importance of these processes in these
small firms.
Of the reconfiguration processes, none of the processes showed a lack of any
significant gap between the level of importance and extent of implementation in
small businesses operating in a turbulent environment.
Thus, the research results do not support this proposition, since the extent of
implementation of none of these processes will be increased by an increase in its
level of importance.

237
Resource impoverishment of the general resource base of the small business
operating in a turbulent environment constrains the implementation of the
reconfiguration processes. These as indicated in the below:
Process 2
The leadership of a small business allows the business to co-evolve by fostering,
driving and executing multi-business/multi-unit collaborative linkages and
managing group dynamics while at the same time empowering staff.
Process 14
The leadership of a small business patches and restructures the business portfolio
by creating an enterprise structure that consists of patches [units/modules], in
order to fit changing market opportunities. In this type of structure, the business
units are modular, focused and discrete so that they can be combine seamlessly;
there is access to trends and knowledge that can help to predict when to
restructure the business; there is an ability to recognize patterns and trends that
develop in the market place; market segmentation which reveals how to optimally
configure patches [ units/modules] to exploit market opportunities, is clearly
understood; road maps which suggest how future patches [ units/modules] are
likely to evolve, are available.
Although the propositions of this research study are only partially supported by the
empirical data, the results, which clearly differentiate between those processes
whose extent of implementation can be increased by an increase in the level of
importance, and by extension management capabilities; and those processes
whose extent of implementation, and by extension their resource allocation, leads
the way towards new strategies to initiate and sustain dynamic capabilities in
small businesses operating in a turbulent environment. This provides the basis of
a new strategic model and theory on strengthening the dynamic capabilities of
small businesses that operate in a turbulent environment.

238
6.6 A NEW STRATEGIC MODEL: THE STRENGTHENING OF THE DYNAMIC CAPABILITIES OF SMALL BUSINESSES OPERATING IN A TURBULENT ENVIRONMENT
The differentiation of dynamic capabilities into those processes whose extent of
implementation can be increased by an increase in the level of importance, and by
extension management capabilities; and those processes whose extent of
implementation, and by extension their resource allocation, leads the way towards
new strategies to initiate and sustain dynamic capabilities in small businesses
operating in a turbulent environment. This provides the basis of a new strategic
model and theory on strengthening the dynamic capabilities of small businesses
that operate in a turbulent environment. Dynamic capabilities are a business asset
of the highest order (Lopez, 2005:661) and also according to Wu (2005), for firms
facing a changing environment, strengthening dynamic capabilities is a key
concern.
This new strategic theory and model proposes two stages viz. an initiating stage
and a sustaining stage. The initiating stage comprises the initiation of those
processes whose level of implementation, and by extension, whose resources
allocation is dependant of the level of importance, and by extension, the
management capability in those processes. The sustaining stage comprises those
processes whose level of implementation, and by extension, whose resources
allocation is not dependant of the level of importance, and by extension, the
management capability in those processes. Instead, it is dependant on the general
resource base of the firm.
Thus, applying the logic of Section 1.3,1.4 and 2.6, to the results discussed in
Chapter 5, the comparatively short term intervention mechanism of upgrading and
enhancing management capability can change the importance perceptions of
managers about the process cluster staff-reward and the processes, 4,
6,7,8,10,29 and 30, illustrated below. This is the initiating phase of the framework.
Process 4
Staff education, development and training activities are structured to balance
organizational objectives with employees’ individual knowledge and skills needs
and are jointly designed by the employees concerned and the small business
leadership detailing specific needs, objectives and performance measures, clearly.
Process 6 A variety of employee support services ( well being and motivation ) are available,
and are periodically evaluated and improved to meet employee’s needs.

239
Process 7
Employees and other stakeholders who need information to effectively perform
their work have convenient access to all necessary information
Process 8
The leadership of a small business leads with an impelling strategic focus while
allowing and rewarding organizational members for being active players in the
strategic process. While staff are encouraged and rewarded for experimenting,
taking risks and being creative, the small business leadership at the same time
retains control of the overall goals of the firm.
Process 10
Compensation and recognition approaches for individuals and groups, reinforces
performance, teamwork, and learning and business objectives.
Process 29
The leadership of a small business takes into account the needs and expectations
of all stakeholders, the changing, turbulent and competitive environment,
regulatory, financial, market, technological, societal and other risks as well as
factors unique to the organization, when establishing organisational values,
organisational directions and performance expectations as well as when looking
for business opportunities,
Process 30
The leadership of a small business uses its involvement with its communities and
professional associations to both support and strengthen those communities and
associations as well as the business.
From the content of these processes and the process cluster staff-reward, it can
be seen that the focus is on the creation of a well educated, developed and
trained staff component, who receive a variety of employee support services, are
empowered, well compensated and rewarded by a leadership that has its fingers
on the pulse of the firm, its environment and its stakeholders. Thus the initiating
phase in the framework is the changing of the importance perception towards
these specific processes and the process cluster staff-reward. This will enable the
allocation of resources to achieve innovative resource reconfigurations that
revolve around these processes, in the short term.
Changing the importance perception towards processes, 4,6,7,8,10,29 and 30
and the process cluster of staff-reward has a two-fold effect on the general
resource base of the small firm: firstly, management capability is also a small
business resource and therefore upgrading and enhancing management capability
also contributes towards to the general upgrading and enhancement of the
general resource base of the small firm; and secondly, the upgrading and

240
enhancement of the management capability has a multiplier effect on the
organisation – the greater the management capability, the greater the amount of
resources a firm can aggregate. According to Kozan, Oksoy and Ozsoy
(2006:114), small business resource aggregation is positively influenced by an
increase in management know-how.
The comparatively longer term and more complex intervention mechanism of
enhancing and upgrading the general resource base of the firm involves, in
addition to managerial resources, financial, technical and organisational
resources. Thus this construct is driven by more that the importance perception of
managers about what it takes to succeed in turbulent markets and what
management and market competencies are required to respond to such changes.
In addition, the small business also operates in a resource impoverished and
resource constrained environment. However, this construct also has some effect
on management capability, since managerial resources also form part of the
general resource base of the firm, hence having some influence on the importance
perception. Addressing the general resource base of the small firm operating in a
turbulent environment is the sustaining stage of the framework. This will enable
the allocation of resources to achieve innovative resource reconfigurations that
revolve around these processes, in the long term.
By following the stepwise, rational, specific and targeted approach of first
addressing the importance perception of the process cluster staff-reward and
processes 4,6,7,8,10,29 and 30, the leadership of small businesses operating in a
turbulent environment will foster the creation of a well educated, developed and
trained staff component, who receive a variety of employee support services, are
empowered, well compensated and rewarded by a leadership that has its fingers
on the pulse of the firm, its environment and its stakeholders. This will serve as a
platform to enable the resource aggregation that will trigger the promotion of
innovative resource reconfigurations. Furthermore, since management capability
is also a small business resource as stated earlier, management capability will
also be further upgraded and enhanced.
Some studies have also identified similar constructs, for example, Swamy and
Balaji ( 2006:41) have found that small firms that are ISO 9000 [ a framework for
quality assurance] certified, place a greater emphasis on human resource
management practices, in order to remain competitive than non-ISO certified firms
However, Mazzarol ( 2003: 27), highlighted the management deficiencies of small
businesses by finding that owners and managers of small businesses need to
develop skills and competencies in leadership, coaching and management.

241
Thus this study’s development of a new strategic model and theory on the
strategic processes of small businesses operating in a turbulent environment
starts to fill the knowledge gap on strengthening dynamic capabilities in these
small firms and hence enables these small firms to optimise their performance in a
turbulent environment.

242
IMPORTANCE PROCESS CLUSTERS
SKEM LG LT M C
PROCESSES
1,3,5,9,11,12,13, 15,16,17,18,19,20, 21,22,23,24,25,26,
27,28,31,32
IMPLEMENTATION PROCESS CLUSTERS
SKEM LG LT M C
PROCESSES
1,3,5,9,11,12,13, 15,16,17,18,19,20, 21,22,23,24,25,26,
27,28,31,32
GAP
GENERAL RESOURCE
BASE OF FIRM
IMPORTANCE PROCESS CLUSTERS
SR
PROCESSES 4,6,7,8,10,29,30
IMPLEMENTATION PROCESS CLUSTERS
SR
PROCESSES 4,6,7,8,10,29,30
NO GAP
MANAGEMENT CAPABILITY
FIGURE 24: A NEW STRATEGIC MODEL: THE STRENGTHENING OF THE DYNAMIC CAPABILITIES OF SMALL BUSINESSES OPERATING IN A TURBULENT ENVIRONMENT
INIT
IAT
ING
PH
AS
E
Reconfiguration Processes 2,14
Innovative Resource Reconfigurations
BUSINESS SUCCESS
SU
ST
AIN
ING
PH
AS
E

243
6.7 A NEW STRATEGIC THEORY: THE STRENGTHENING OF DYNAMIC CAPABILITIES IN SMALL BUSINESSES OPERATING IN A TURBULENT ENVIRONMENT Drawing on the new strategic model on strengthening the dynamic capabilities of
small businesses operating in a turbulent environment, this section describes the
new strategic theory for these small firms. The theory developed provides the
solution to the research problem defined in Chapter 1 -“to determine how to
strengthen the dynamic capabilities of small businesses operating in a turbulent
environment”
If small businesses operating in a turbulent environment increase the level
of importance, and by extension, the management capability in the process cluster Staff-reward and the processes - 4-6-7-8-10-29-30 – then their extent
of implementation, and by extension the extent of resource allocation to these specific process clusters and processes, in these small firms will increase.
According to Miller (1996:485), the “learning manager” acquires new knowledge
and is able and willing to apply that knowledge in making decisions or influencing
others in the organisation. Beaver and Jennings (2005: 11) describe the small
business the owner as an individual who establishes and manages a business for
the primary purpose of furthering personal goals and to whom the business is a
primary source of income and which consumes the majority of his/her time and
resources. Thus, such a profile would fit the willing part of Miller’s definition. In
order to meet the “able“ part of the definition of a “learning manager“ ,
management capabilities are then critical. Furthermore, a number of authors have
argued that key components in the success/growth of small firms are the
competencies, skills and knowledge of their managers (Hendry et al., 1991;
Marshall et al., 1995) and there is evidence to suggest that levels of skills in small
firm managers are often lacking (Sisson and Storey, 1988; Stanworth and Gray,
1991; Vickerstaff, 1992; Goss and Jones, 1992).
This will also lead to a sustaining of innovative resource reconfigurations through an increase in the resource base of the firm
This multiplier effect is due to management capability being part of the general
resource base of the firm as well as the increase in resources that arise from
greater management capability. Kozan, Oksoy and Ozsoy (2006:114) state that by

244
improving management know-how, the resource aggregation capability of the
small firm is improved.
NEW STRATEGIC THEORY:
If small businesses operating in a turbulent environment increase the level of importance, and by extension, the management capability, in the process
cluster Staff-reward and the processes - 4-6-7-8-10-29-30 – then their extent of implementation, and by extension the extent of resource allocation to
these specific process clusters and processes, in these small firms will increase. This will also lead to a sustaining of innovative resource
reconfigurations through an increase in the resource base of the firm.
Process 4
Staff education, development and training activities are structured to balance
organizational objectives with employees’ individual knowledge and skills needs
and are jointly designed by the employees concerned and the small business
leadership detailing specific needs, objectives and performance measures, clearly.
Process 6
A variety of employee support services ( well being and motivation ) are available,
and are periodically evaluated and improved to meet employee’s needs.
Process 7
Employees and other stakeholders who need information to effectively perform
their work have convenient access to all necessary information
Process 8
The leadership of a small business leads with an impelling strategic focus while
allowing and rewarding organizational members for being active players in the
strategic process. While staff are encouraged and rewarded for experimenting,
taking risks and being creative, the small business leadership at the same time
retains control of the overall goals of the firm.
Process 10
Compensation and recognition approaches for individuals and groups, reinforces
performance, teamwork, and learning and business objectives.
Process 29
The leadership of a small business takes into account the needs and expectations
of all stakeholders, the changing, turbulent and competitive environment,
regulatory, financial, market, technological, societal and other risks as well as
factors unique to the organization, when establishing organisational values,
organisational directions and performance expectations as well as when looking
for business opportunities.

245
Process 30
The leadership of a small business uses its involvement with its communities and
professional associations to both support and strengthen those communities and
associations as well as the business.
The overall effect of the initiation and sustaining of dynamic capabilities according
to this new strategic theory will be the strengthening of dynamic capabilities, and
hence the optimal performance of small businesses operating in a turbulent
environment.
6.8 A SUMMARY OF THE MAIN FINDINGS OF THE STUDY
In small businesses that operate in a turbulent environment, it was found that:
For the strategic process clusters, it was found that measurement was
considered to be the most important strategic process cluster; while staff-
reward was found to be the least important strategic process cluster. On
the other hand networks and support systems was found to be the most
implemented strategic process cluster with leadership-turbulence the
least implemented process cluster.
For the individual processes, in terms of importance, it was found that
processes 12, 18, 21 and 22 were the most important processes, while
processes 10 and 32 were the least important processes. For the
individual processes, in terms of implementation, it was found that
processes 4, 5 and 6 were the most implemented processes, while
process 14 was the least implemented process.
For all processes in general, there was no significant gap between the
level of importance and the extent of implementation. This indicated that ,
in general, the resource impoverishment of small businesses operating in
a turbulent environment inhibited their dynamic capabilities.
At the process cluster level, there was a significant gap between the level
of importance and extent of implementation, only for the process cluster –
Staff reward. This indicated that an increased extent of implementation
and by extension, an increased resource allocation, to this process cluster

246
was dependant on the level of importance and by extension, the
management capability.
At the process level, there was a significant gap between the level of
importance and extent of implementation, only for the processes - 4-6-7-8-
10-29-30. This indicated that an increased extent of implementation and
by extension, an increased resource allocation, to these processes was
dependant on the level of importance and by extension, the management
capability.
These research findings have been incorporated in a new strategic model and
theory aimed at strengthening the dynamic capabilities of small businesses
operating in a turbulent environment and hence to optimise the performance of
these small firms in a turbulent environment.
6.9 CONCLUSIONS
For businesses in a turbulent environment, strengthening their dynamic
capabilities is a key concern (Wu, 2005). For small businesses operating in a
turbulent environment, this is especially relevant, since the small business sector
is a sector that is not performing optimally and furthermore, falls short of
expectations. Arising from this business and management problem was this
study’s research problem – viz. “How to strengthen the dynamic capabilities of
small businesses operating in a turbulent environment”.
Therefore this study proposes a model that elucidates a rational, specific and
targeted approach to initiate and sustain the dynamic capabilities of small
businesses operating in a turbulent environment. The model differentiates
dynamic capabilities into those that can be influenced by the shorter-term
intervention strategy of specifically increasing management capabilities and those
that require the longer- term strategy of altering the general resource base of
these small firms. By using this rational, specific and targeted approach to initiate
and sustain the dynamic capabilities of these small firms, their dynamic
capabilities will be strengthened and hence the performance of these small firms
in turbulent environments will be optimised.
By following the stepwise, rational, specific and targeted approach of first
addressing the importance perception, and by extension, the management

247
capability in the process cluster staff-reward and processes 4,6,7,8,10,29 and 30,
the leadership of small businesses operating in a turbulent environment will foster
the creation of a well educated, developed and trained staff component, who
receive a variety of employee support services, are empowered, well
compensated and rewarded by a leadership that has its fingers on the pulse of the
firm, its environment and its stakeholders. This will serve as a platform to enable
the resource aggregation that will trigger the sustaining of innovative resource
reconfigurations. Furthermore, since management capability is also a small
business resource as stated earlier, management capability will also be further
upgraded and enhanced.
This study thus concludes that by the employment of stepwise, rational, specific
and targeted interventions and strategies that are designed to initiate and sustain
the dynamic capabilities of small businesses operating in a turbulent environment,
the dynamic capabilities of these small firms can be strengthened and hence their
performance in turbulent environments optimised.
Dynamic capabilities are a business asset of the highest order and are key factors in optimising the strategic course of the company’s future
(Lopez, 2005:661).

248
6.10 STUDY RECOMMENDATIONS FOR FUTURE RESEARCH In order to further extend and build upon the body of knowledge of management
literature on strategy, dynamic capabilities and the strategic processes of small
businesses operating in a turbulent environment; as well as to enhance
managerial practice, the following recommendations are made:
Following through from Dubin’s eight step theory building methodology,
(Dubin,1978), hypotheses should be developed and tested.
The study should be repeated in other sectors of small businesses, both those
in regulated as well as unregulated environments. This is important since the
strategic processes of small businesses in unregulated industries may differ
from those in regulated ones.
The study should be repeated in small businesses segmented by the criterion
of owner-led or manager-led.
An analysis of the components of the dimension management capability be
done and further testing on the impact of each component on the
reconfiguration of resources should be carried out.
The study should be repeated in small businesses falling within different
stages of the life cycle as well as those falling in different size categories. The
former is important in that determining whether the age of a business, whether
new or well established has any effect on its strategic processes. The latter
will enable a determination of whether size of small business [whether small,
medium or micro] has any effect on its strategic processes. This is important
since Chapter 2 indicated that there are varying definitions of small
businesses emanating from research, government and management spheres.
The study should be extended broadly across small businesses in different
sectors to empirically establish the linkages that have been developed
theoretically between management education and the importance perception
of managers, the importance perception of managers and the management
capability of the small firm, management capability of the small firm and
dynamic capabilities or the link between the resource base of the small firm
and dynamic capabilities. Following this route, an empirical link between
reconfiguration processes and the creation of value-adding strategies and
competitive advantage should also be developed.

249
6.11 CHAPTER CONCLUSIONS
This chapter presented the major findings of this study, showed how the research
problem, the research purpose, the research objectives and the research
propositions were satisfied and to made recommendations for future areas of
research. This chapter also reported on a new strategic model and theory on the
strategic processes of small businesses operating in a turbulent environment and
presented a summary of the main research findings.
The chapter ended by highlighting the study’s main conclusion viz. by the
employment of stepwise, rational, specific and targeted interventions and
strategies that are designed to initiate and sustain the dynamic capabilities of
small businesses operating in a turbulent environment, the dynamic capabilities of
these small firms can be strengthened and hence their performance in turbulent
environments optimised.
Several recommendations for future research in this area were also made.

250
ANNEXURES

251
ANNEXURE 1A – THE PILOT QUESTIONNAIRE 12.07.05
Dear Owner/Managing Pharmacist
Your kind assistance is humbly requested. I am a doctoral student [School of
Business Leadership, UNISA] and I require your participation in a PILOT STUDY
that is necessary for the completion of my research. I am investigating the
strategic processes of small businesses operating in a turbulent environment (see
attached research summary). Please complete the attached questionnaire, to
assist with this study. Your kind assistance will be greatly appreciated.
Note : Since this study deals with small businesses, your participation is required only if you meet the criteria as per the research definition of a small business - a business employing less than 50 workers assumed to be formally registered, clearly demarcated and paying taxes on a regular basis.
Your answers should reflect the unique business factors or resource constraints
experienced by your firm. Rating a process as “low” in importance or “not
implemented” does not in any way imply poor management. In fact, there is no
firm, large or small, that comprehensively and extensively implements all of these
processes.
All responses received will be held in strict confidence. All participants are
guaranteed that their individual responses shall remain confidential and no
individual firm data will be made available to any person or organisation at any
time. However by participating in this research, respondents are giving consent for
the use of the data for scientific research purposes.
The survey questionnaire consists of five main sections. It should take
approximately one hour to complete. The owner/ managing pharmacist should fill
in this survey. Any questions concerning the project can be directed to: Ms KK Naidoo [email protected] Cell: 0824948227
Should you be interested in the results of the project, please send me your email
address and I will gladly forward the results to you on completion of the project.

252
The Strategic Processes of Small Businesses:
A Retail Community Pharmacy Perspective
The characteristics of small firms are different from large firms and they
demonstrate certain features that can give them advantage over larger firms;
however they may be resource impoverished. This constrains their ability to gain
and sustain competitive advantage. In addition, turbulent environments make it all
the more difficult for these firms to attain this advantage. Research has found that
it is often a firm’s strategy and the strategic processes it implements that can give
a firm advantage over its competitors. Therefore, the purpose this research is to
understand the role of strategic processes in small firms operating in a resource
constrained and turbulent environment. This research envisages achieving this
through an examination of how important the leadership of small businesses
perceives firm strategic processes to be and the extent of implementation of these
processes in small businesses.
The retail community pharmacy sector will be used as a model to investigate the
research propositions generated. It is a sector that is comprised mainly of small
businesses and it is currently experiencing turbulence as a result of legislative
changes and competition.

253
SURVEY The Strategic Processes of Small Businesses:
A Retail Community Pharmacy Perspective
PLEASE INDICATE YOUR ANSWER WITH A CROSS -(X) - IN THE APPROPRIATE BOX.
SECTION I (DEMOGRAPHIC ANALYSIS) 1. Is your pharmacy independently owned or part of a larger group?
Independently Owned
Part of a Larger Group
2. Please indicate the number of people employed in your firm.
1-3
4-49
50 or more
3. Please indicate the geographical area in which your pharmacy is situated.
KwaZulu-Natal
Eastern Cape
Western Cape
Northern Cape
Gauteng
Limpopo
North-West Province
Free State
Mpumalanga
4. Please indicate whether your pharmacy is situated in an urban area,
a suburban area or a rural area.
URBAN
SUBURBAN
RURAL

254
5. Please indicate the number of years that your firm is in existence
Less than 5 years
Between 5-10 years
More than 10 years
SECTION II (PROCESS ANALYSIS) Each process is being analysed from two aspects – level of importance and extent
of implementation.
A. How important do you believe this process to be with respect to achieving
performance
excellence?
Low importance Medium importance High importance 1 2 3 B. To what extent does your firm carry out this process in order to achieve
performance excellence?
Not at all Sometimes Extensively 1 2 3
PLEASE INDICATE YOUR ANSWER WITH A CROSS- (X) - IN THE APPROPRIATE BOX.

255
LEADERSHIP
A: How important do you believe this process to be with respect to achieving performance excellence?
PROCESS
B: To what extent does your firm carry out this process in order to achieve performance excellence?
Low 1
Med 2
High 3
1. The leadership of a small business takes into account the needs and
expectations of all stakeholders, the changing, turbulent and competitive
environment, regulatory, financial, market, technological, societal and other
risks as well as factors unique to the organization, when establishing
organisational values, organisational directions and performance
expectations as well as when looking for business opportunities,
Not at all 1
Sometimes 2
Extensively 3
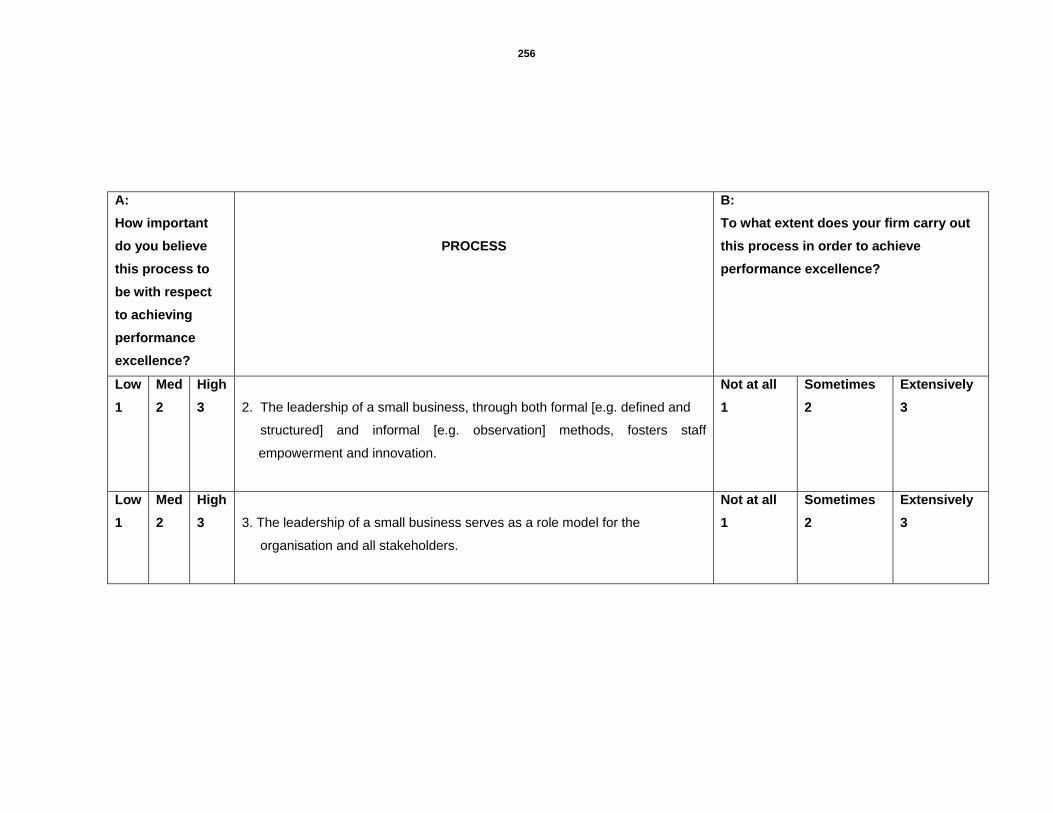
256
A: How important do you believe this process to be with respect to achieving performance excellence?
PROCESS
B: To what extent does your firm carry out this process in order to achieve performance excellence?
Low 1
Med 2
High 3
2. The leadership of a small business, through both formal [e.g. defined and
structured] and informal [e.g. observation] methods, fosters staff
empowerment and innovation.
Not at all 1
Sometimes 2
Extensively 3
Low 1
Med 2
High 3
3. The leadership of a small business serves as a role model for the
organisation and all stakeholders.
Not at all 1
Sometimes 2
Extensively 3

257
A: How important do you believe this process to be with respect to achieving performance excellence?
PROCESS
B: To what extent does your firm carry out this process in order to achieve performance excellence?
Low 1
Med 2
High 3
4. The leadership of a small business uses its involvement with its
communities and professional associations to both support and strengthen
those communities and associations as well as the business.
Not at all 1
Sometimes 2
Extensively 3
Low 1
Med 2
High 3
5. The leadership of a small business has strong friend, family and
professional support networks.
Not at all 1
Sometimes 2
Extensively 3

258
A: How important do you believe this process to be with respect to achieving performance excellence?
PROCESS
B: To what extent does your firm carry out this process in order to achieve performance excellence?
Low 1
Med 2
High 3
6. The leadership of a small business takes into account its legal, ethical and
risk requirements, in its decision-making processes
Not at all 1
Sometimes 2
Extensively 3

259
A: How important do you believe this process to be with respect to achieving performance excellence?
PROCESS
B: To what extent does your firm carry out this process in order to achieve performance excellence?
Low 1
Med 2
High 3
7. The leadership of a small business has a few simple rules to guide its
strategic processes instead of elaborate strategies [a simple standard
operating procedure is devised to guide decision making]. These rules focus
on : – how to carry out key processes; knowing which opportunities to pursue
and which should not be considered; being able to rank the accepted
opportunities; to synchronize the pace of emerging opportunities and other
parts of the company and when to pull out of yesterday’s opportunities.
Not at all 1
Sometimes 2
Extensively 3

260
A: How important do you believe this process to be with respect to achieving performance excellence?
PROCESS
B: To what extent does your firm carry out this process in order to achieve performance excellence?
Low 1
Med 2
High 3
8. The leadership of a small business patches and restructures the business
portfolio by creating an enterprise structure that consists of patches
[units/modules], in order to fit changing market opportunities. In this type of
structure, the business units are modular, focused and discrete so that they
can be combine seamlessly; there is access to trends and knowledge that
can help to predict when to restructure the business; there is an ability to
recognize patterns and trends that develop in the market place; market
segmentation which reveals how to optimally configure patches [
units/modules] to exploit market opportunities, is clearly understood; road
maps which suggest how future patches [ units/modules] are likely to evolve,
are available.
Not at all 1
Sometimes 2
Extensively 3

261
A: How important do you believe this process to be with respect to achieving performance excellence?
PROCESS
B: To what extent does your firm carry out this process in order to achieve performance excellence?
Low 1
Med 2
High 3
9. The leadership of a small business allows the business to co-evolve by
fostering, driving and executing multi-business/multi-unit collaborative
linkages and managing group dynamics while at the same time empowering
staff.
Not at all 1
Sometimes 2
Extensively 3

262
A: How important do you believe this process to be with respect to achieving performance excellence?
PROCESS
B: To what extent does your firm carry out this process in order to achieve performance excellence?
Low 1
Med 2
High 3
10. The leadership of a small business leads with an impelling strategic focus
while allowing organizational members to be active players in the strategic
process. While staff are encouraged and rewarded for experimenting,
taking risks and being creative, the small business leadership retains
control of the overall goals of the firm is retained by the leadership.
Not at all 1
Sometimes 2
Extensively 3
Low 1
Med 2
High 3
11. The leadership of a small business develops strategies that are clearly
translated into action plans that support the achievement of organizational
objectives. Strategies are linked to resources, implementation
procedures and defined performance measures.
Not at all 1
Sometimes 2
Extensively 3

263
A: How important do you believe this process to be with respect to achieving performance excellence?
PROCESS
B: To what extent does your firm carry out this process in order to achieve performance excellence?
Low 1
Med 2
High 3
12. The leadership of a small business knows what resources [e.g. human,
financial, physical, support] are available to the business; their constraints,
their capacities and their advantages.
Not at all 1
Sometimes 2
Extensively 3
Low 1
Med 2
High 3
13. The leadership of a small business devises appropriate strategies that can
maximize any resource advantage and overcome any resource limitation.
Not at all 1
Sometimes 2
Extensively 3

264
STAFF FOCUS
A: How important do you believe this process to be with respect to achieving performance excellence?
PROCESS
B: To what extent does your firm carry out this process in order to achieve performance excellence?
Low 1
Med 2
High 3
14. Key human resource plans are derived from and linked to the overall
business strategy with respect to work design; employee development,
education and training; compensation and benefits and recruitment.
Not at all 1
Sometimes 2
Extensively 3

265
A: How important do you believe this process to be with respect to achieving performance excellence?
PROCESS
B: To what extent does your firm carry out this process in order to achieve performance excellence?
Low 1
Med 2
High 3
15. Work and job descriptions are created, organized and managed in such a
manner so as to promote cooperation, initiative and innovation as well as
to empower people and further entrench the organizational culture.
Not at all 1
Sometimes 2
Extensively 3
Low 1
Med 2
High 3
16. Compensation and recognition approaches for individuals and groups,
reinforces performance, teamwork, and learning and business objectives.
Not at all 1
Sometimes 2
Extensively 3

266
A: How important do you believe this process to be with respect to achieving performance excellence?
PROCESS
B: To what extent does your firm carry out this process in order to achieve performance excellence?
Low 1
Med 2
High 3
17. Staff education, development and training activities are structured to
balance organizational objectives with employees’ individual knowledge
and skills needs and are jointly designed by the employees concerned and
the small business leadership detailing specific needs, objectives and
performance measures, clearly.
Not at all 1
Sometimes 2
Extensively 3
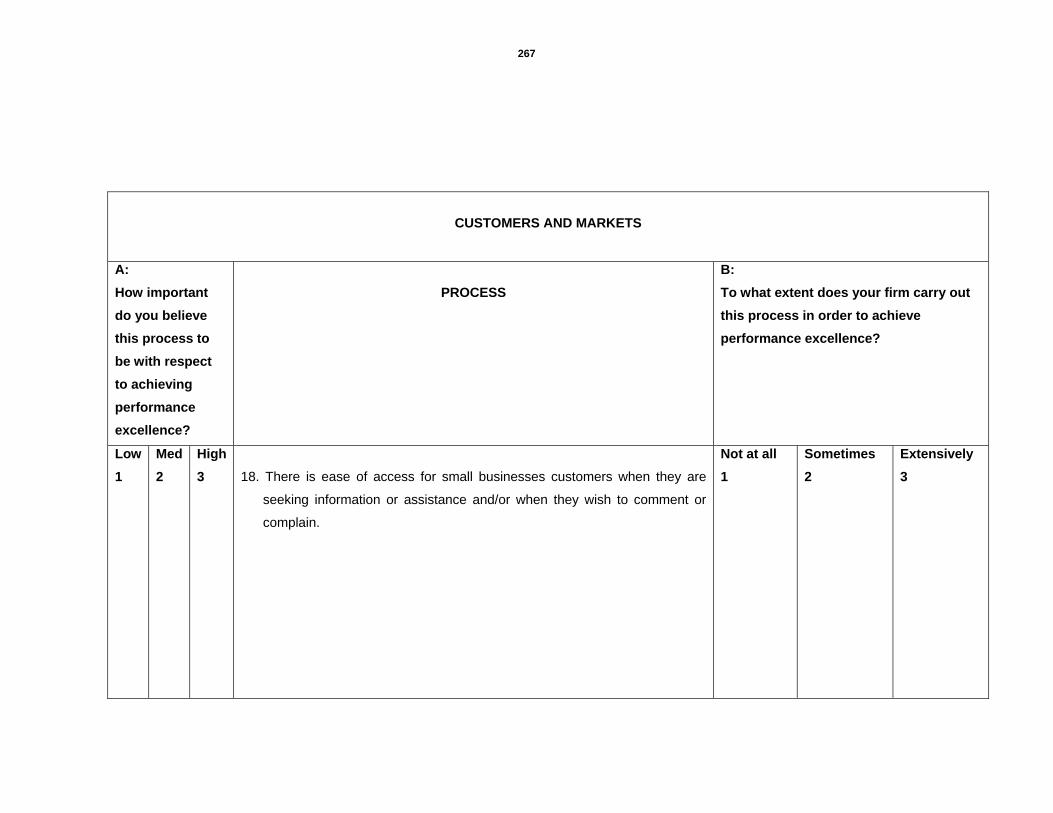
267
CUSTOMERS AND MARKETS
A: How important do you believe this process to be with respect to achieving performance excellence?
PROCESS
B: To what extent does your firm carry out this process in order to achieve performance excellence?
Low 1
Med 2
High 3
18. There is ease of access for small businesses customers when they are
seeking information or assistance and/or when they wish to comment or
complain.
Not at all 1
Sometimes 2
Extensively 3

268
A: How important do you believe this process to be with respect to achieving performance excellence?
PROCESS
B: To what extent does your firm carry out this process in order to achieve performance excellence?
Low 1
Med 2
High 3
19. A complaint management process exists that ensures complaints are not
only resolved effectively and promptly but are also analyzed as a source of
improvement activities.
Not at all 1
Sometimes 2
Extensively 3
Low 1
Med 2
High 3
20. Good relationships with customers are actively pursued and maintained by
both staff and the leadership of small businesses.
Not at all 1
Sometimes 2
Extensively 3

269
A: How important do you believe this process to be with respect to achieving performance excellence?
PROCESS
B: To what extent does your firm carry out this process in order to achieve performance excellence?
Low 1
Med 2
High 3
21. The leadership of small businesses ensures that personalized service is
offered to customers.
Not at all 1
Sometimes 2
Extensively 3
Low 1
Med 2
High 3
22. The skills, knowledge, values and attitudes of the staff and leadership of
small businesses are important, relevant, valuable and available to
customers.
Not at all 1
Sometimes 2
Extensively 3

270
PROCESS MANAGEMENT
A: How important do you believe this process to be with respect to achieving performance excellence?
PROCESS
B: To what extent does your firm carry out this process in order to achieve performance excellence?
Low 1
Med 2
High 3
23. The design of key healthcare services and the service delivery process is
addressed systematically, incorporating all stakeholders and accounting
for changing customer requirements, the environment and technology.
Not at all 1
Sometimes 2
Extensively 3
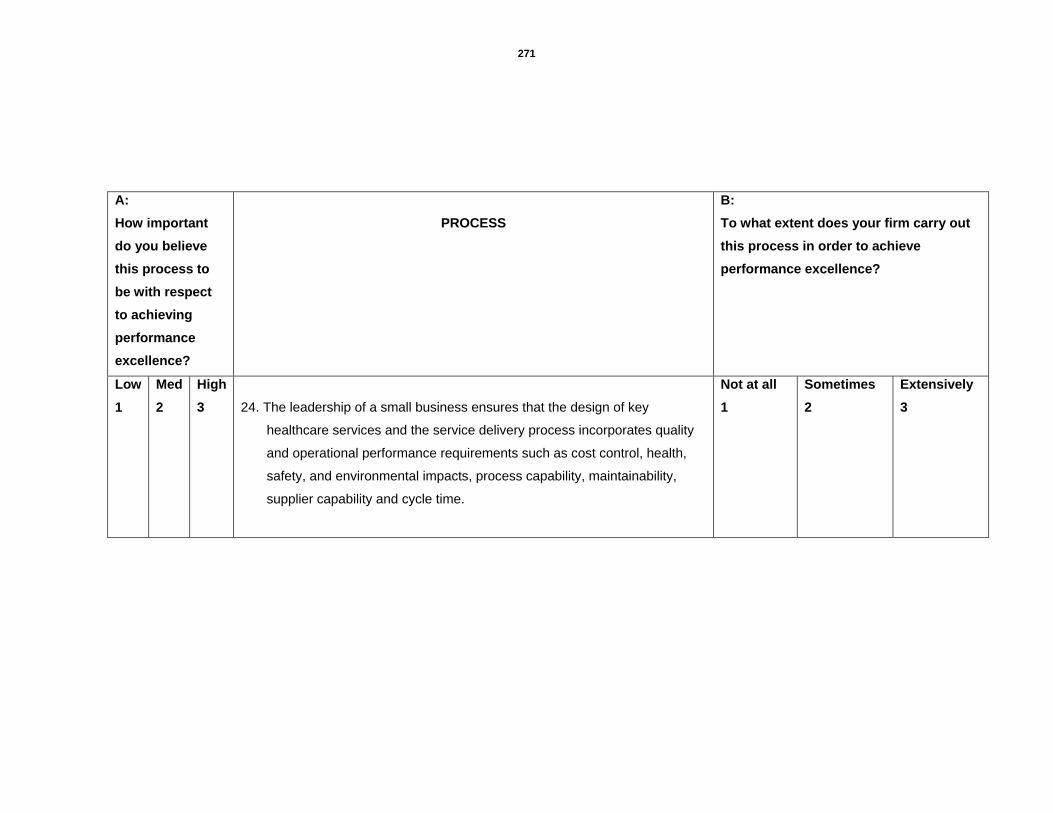
271
A: How important do you believe this process to be with respect to achieving performance excellence?
PROCESS
B: To what extent does your firm carry out this process in order to achieve performance excellence?
Low 1
Med 2
High 3
24. The leadership of a small business ensures that the design of key
healthcare services and the service delivery process incorporates quality
and operational performance requirements such as cost control, health,
safety, and environmental impacts, process capability, maintainability,
supplier capability and cycle time.
Not at all 1
Sometimes 2
Extensively 3

272
MEASUREMENT AND ANALYSIS OF ORGANISATIONAL PERFORMANCE
A: How important do you believe this process to be with respect to achieving performance excellence?
PROCESS
B: To what extent does your firm carry out this process in order to achieve performance excellence?
Low 1
Med 2
High 3
25. The organization regularly measures and analyses organizational
performance to provide the information and data to support the
organization’s strategic planning process, as well as its operational and
functional processes to enable continuous improvement.
Not at all 1
Sometimes 2
Extensively 3
Low 1
Med 2
High 3
26. A variety of employee support services ( well being and motivation ) are
available, and are periodically evaluated and improved to meet
employee’s needs.
Not at all 1
Sometimes 2
Extensively 3

273
A: How important do you believe this process to be with respect to achieving performance excellence?
PROCESS
B: To what extent does your firm carry out this process in order to achieve performance excellence?
Low 1
Med 2
High 3
27. The company gathers information about customer satisfaction for all key
customer segments and captures information that reflects transaction
quality, customer repurchase, new business, and positive referral.
Not at all 1
Sometimes 2
Extensively 3
Low 1
Med 2
High 3
28. Key information and data - financial and non-financial- is clearly linked to
the organisation’s processes and goals, and are systematically gathered
and used to track and improve the company’s performance at all levels.
Not at all 1
Sometimes 2
Extensively 3

274
A: How important do you believe this process to be with respect to achieving performance excellence?
PROCESS
B: To what extent does your firm carry out this process in order to achieve performance excellence?
Low 1
Med 2
High 3
29. Key performance measures embedded in the action plans and are used to
systematically track progress towards meeting organizational strategies
Not at all 1
Sometimes 2
Extensively 3
Low 1
Med 2
High 3
30. Employees and other stakeholders who need information to effectively
perform their work have convenient access to all necessary information.
Not at all 1
Sometimes 2
Extensively 3
Low 1
Med 2
High 3
31. The type and quality of data and information collected, as well as its usage
and effectiveness, are periodically evaluated, improved and kept current
with changing trends.
Not at all 1
Sometimes 2
Extensively 3
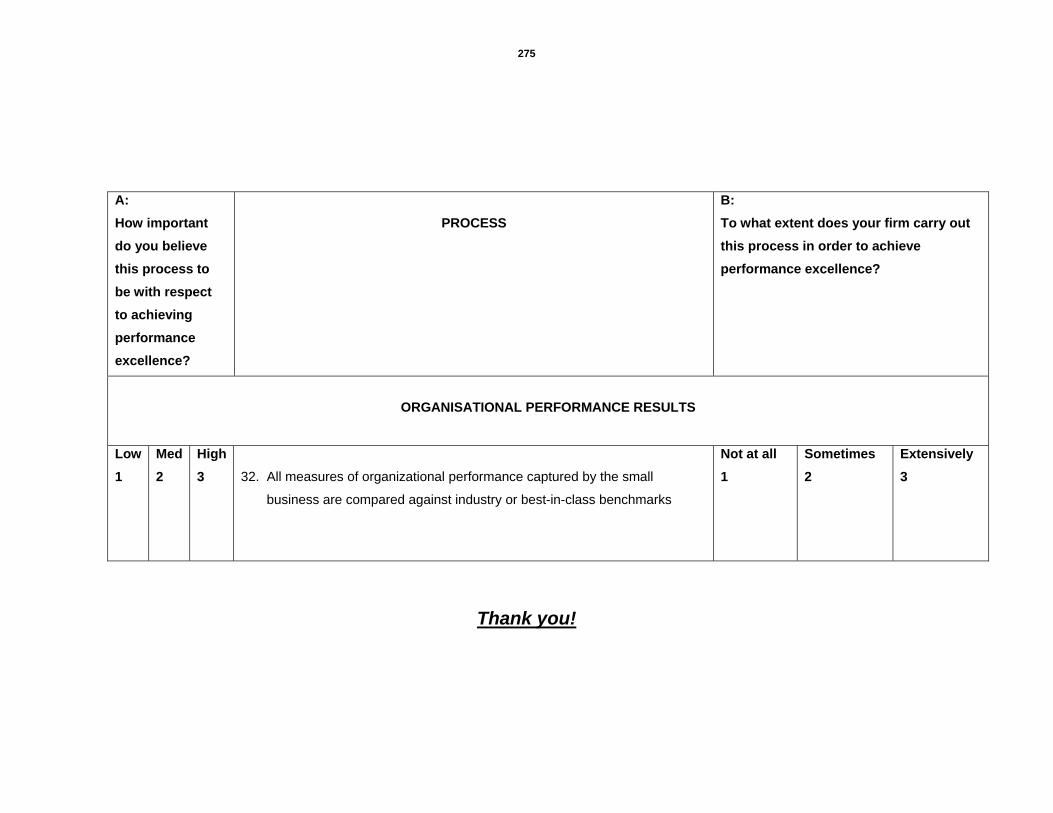
275
A: How important do you believe this process to be with respect to achieving performance excellence?
PROCESS
B: To what extent does your firm carry out this process in order to achieve performance excellence?
ORGANISATIONAL PERFORMANCE RESULTS
Low 1
Med 2
High 3
32. All measures of organizational performance captured by the small
business are compared against industry or best-in-class benchmarks
Not at all 1
Sometimes 2
Extensively 3
Thank you!

276
ANNEXURE 1B – THE FINAL QUESTIONNAIRE Dear Owner/Managing Pharmacist
Your kind assistance is humbly requested. I am a doctoral student [School of Business Leadership, UNISA] and I require your participation
in RESEARCH STUDY that is necessary for the completion of my research. I am investigating the strategic processes of small businesses
operating in a turbulent environment (see attached research summary). Please complete the attached questionnaire, to assist with this
study. Your kind assistance will be greatly appreciated.
Note : Since this study deals with small businesses, your participation is required only if you meet the criteria as per the research definition of a small business - a business employing less than 50 workers assumed to be formally registered, clearly demarcated and paying taxes on a regular basis.
Your answers should reflect the unique business factors or resource constraints experienced by your firm. Rating a process as “low” in
importance or “not implemented” does not in any way imply poor management. In fact, there is no firm, large or small, that comprehensively
and extensively implements all of these processes.
All responses received will be held in strict confidence. All participants are guaranteed that their individual responses shall remain
confidential and no individual firm data will be made available to any person or organisation at any time. However by participating in this
research, respondents are giving consent for the use of the data for scientific research purposes.
The survey questionnaire consists of two main sections. It should take approximately one hour to complete. The owner/ managing
pharmacist should fill in this survey.

277
PLEASE COMPLETE THE ATTACHED QUESTIONNAIRE AND RETURN IN THE SELF-ADDRESSED ENVELOPE WITHIN 2 WEEKS OF RECEIPT, TO P.O.BOX 19539, DORMERTON, 4015.
Any questions concerning the project can be directed to: Ms KK Naidoo [email protected] Cell: 0824948227
Should you be interested in the results of the project, please send me your email address and I will gladly forward the results to you on
completion of the project.
THANK YOU
Ms.K.K. NAIDOO

278
The Strategic Processes of Small Businesses:
A Retail Community Pharmacy Perspective
The characteristics of small firms are different from large firms and they demonstrate certain features that can give them advantage over
larger firms; however they may be resource impoverished. This constrains their ability to gain and sustain competitive advantage. In
addition, turbulent environments make it all the more difficult for these firms to attain this advantage. Research has found that it is often a
firm’s strategy and the strategic processes it implements that can give a firm advantage over its competitors. Therefore, the purpose this
research is to understand the role of strategic processes in small firms operating in a resource constrained and turbulent environment. This
research envisages achieving this through an examination of how important the leadership of small businesses perceives firm strategic
processes to be and the extent of implementation of these processes in small businesses.
The retail community pharmacy sector will be used as a model to investigate the research propositions generated. It is a sector that is
comprised mainly of small businesses and it is currently experiencing turbulence as a result of legislative changes and competition.
SURVEY
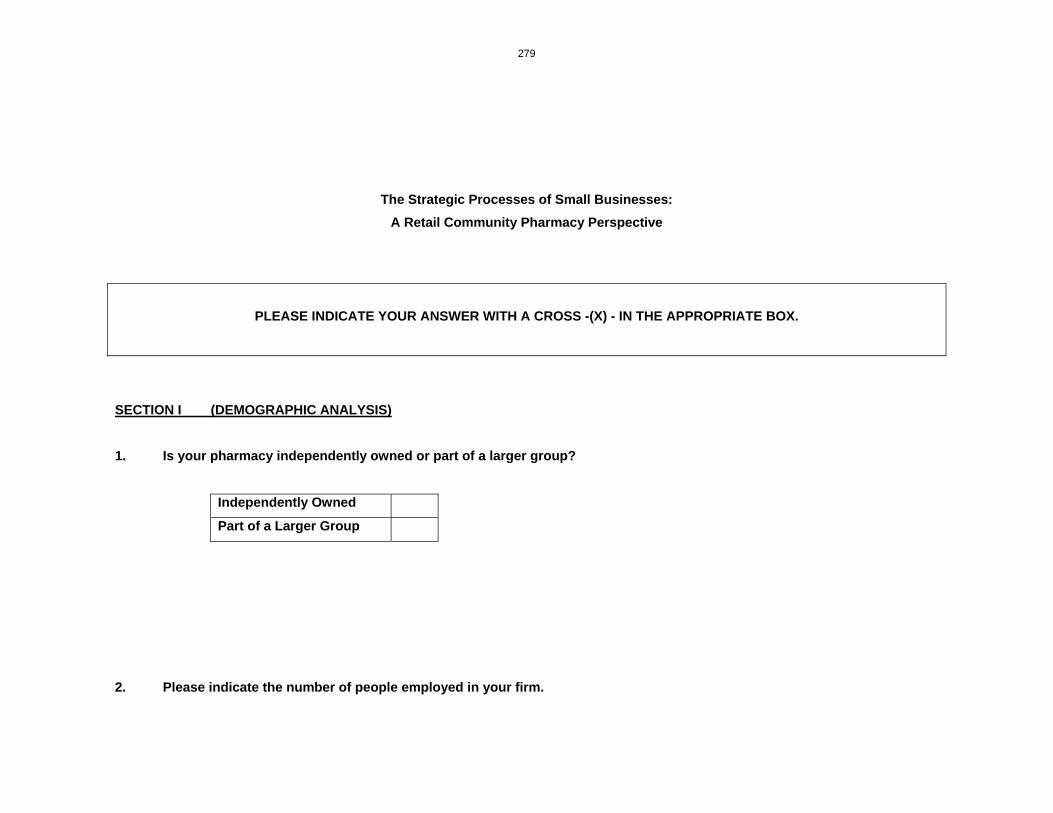
279
The Strategic Processes of Small Businesses: A Retail Community Pharmacy Perspective
PLEASE INDICATE YOUR ANSWER WITH A CROSS -(X) - IN THE APPROPRIATE BOX.
SECTION I (DEMOGRAPHIC ANALYSIS) 1. Is your pharmacy independently owned or part of a larger group?
Independently Owned
Part of a Larger Group
2. Please indicate the number of people employed in your firm.

280
1-3
4-49
50 or more
3. Please indicate the geographical area in which your pharmacy is situated.
KwaZulu-Natal
Eastern Cape
Western Cape
Northern Cape
Gauteng
Limpopo
North-West Province
Free State
Mpumalanga
4. Please indicate whether your pharmacy is situated in an urban area, a suburban area or a rural area.

281
URBAN
SUBURBAN
RURAL
5. Please indicate the number of years that your firm is in existence
Less than 5 years
Between 5-10 years
More than 10 years

282
SECTION II (PROCESS ANALYSIS) In the following pages, each process under the headings, LEADERSHIP, STAFF, CUSTOMERS, MEASUREMENT and NETWORKS AND SUPPORT SYSTEMS is being analysed from two aspects – level of importance and extent of implementation.
PLEASE INDICATE YOUR ANSWER WITH A CROSS- (X) - IN THE APPROPRIATE BOX NEXT TO EACH QUESTION.
A. How important do you believe this process to be with respect to achieving performance
excellence?
Low importance Medium importance High importance 1 2 3 B. To what extent does your firm carry out this process in order to achieve performance excellence?
Not at all Sometimes Extensively 1 2 3
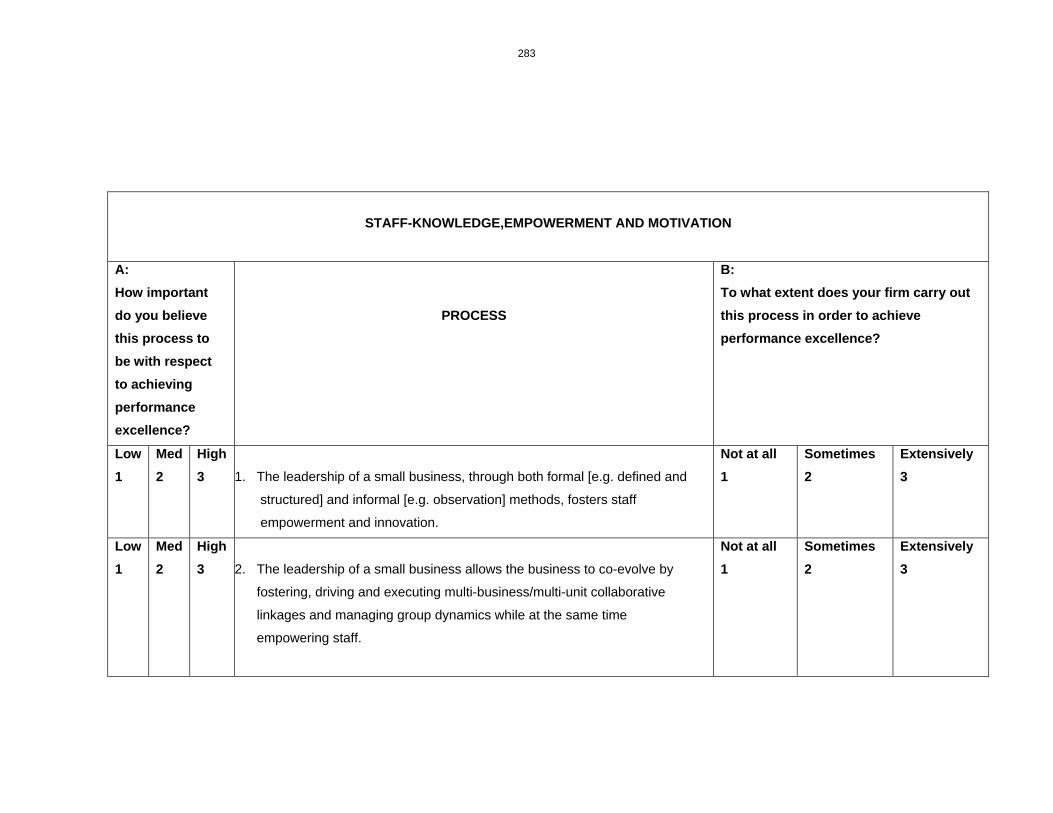
283
STAFF-KNOWLEDGE,EMPOWERMENT AND MOTIVATION
A: How important do you believe this process to be with respect to achieving performance excellence?
PROCESS
B: To what extent does your firm carry out this process in order to achieve performance excellence?
Low 1
Med 2
High 3
1. The leadership of a small business, through both formal [e.g. defined and
structured] and informal [e.g. observation] methods, fosters staff
empowerment and innovation.
Not at all 1
Sometimes 2
Extensively 3
Low 1
Med 2
High 3
2. The leadership of a small business allows the business to co-evolve by
fostering, driving and executing multi-business/multi-unit collaborative
linkages and managing group dynamics while at the same time
empowering staff.
Not at all 1
Sometimes 2
Extensively 3

284
A: How important do you believe this process to be with respect to achieving performance excellence?
PROCESS
B: To what extent does your firm carry out this process in order to achieve performance excellence?
Low 1
Med 2
High 3
3. Work and job descriptions are created, organized and managed in such a
manner so as to promote cooperation, initiative and innovation as well as to
empower staff and further entrench the organizational culture.
Not at all 1
Sometimes 2
Extensively 3
Low 1
Med 2
High 3
4. Staff education, development and training activities are structured to
balance organizational objectives with employees’ individual knowledge
and skills needs and are jointly designed by the employees concerned
and the small business leadership detailing specific needs, objectives and
performance measures, clearly.
Not at all 1
Sometimes 2
Extensively 3
Low 1
Med 2
High 3
5. The skills, knowledge, values and attitudes of the staff and leadership are
important, relevant, valuable and available to customers.
Not at all 1
Sometimes 2
Extensively 3

285
A: How important do you believe this process to be with respect to achieving performance excellence?
PROCESS
B: To what extent does your firm carry out this process in order to achieve performance excellence?
Low 1
Med 2
High 3
6. A variety of employee support services ( well being and motivation ) are
available, and are periodically evaluated and improved to meet
employee’s needs.
Not at all 1
Sometimes 2
Extensively 3
Low 1
Med 2
High 3
7. Employees and other stakeholders who need information to effectively
perform their work have convenient access to all necessary information.
Not at all 1
Sometimes 2
Extensively 3

286
STAFF - REWARD
A: How important do you believe this process to be with respect to achieving performance excellence?
PROCESS
B: To what extent does your firm carry out this process in order to achieve performance excellence?
Low 1
Med 2
High 3
8. The leadership of a small business leads with an impelling strategic focus
while allowing and rewarding organizational members for being active
players in the strategic process. While staff are encouraged and rewarded
for experimenting, taking risks and being creative, the small business
leadership at the same time retains control of the overall goals of the firm.
Not at all 1
Sometimes 2
Extensively 3
Low 1
Med 2
High 3
9. Key human resource plans are derived from and linked to the overall
business strategy with respect to compensation, benefits and recruitment.
Not at all 1
Sometimes 2
Extensively 3

287
A: How important do you believe this process to be with respect to achieving performance excellence?
PROCESS
B: To what extent does your firm carry out this process in order to achieve performance excellence?
Low 1
Med 2
High 3
10. Compensation and recognition approaches for individuals and groups,
reinforces performance, teamwork, and learning and business objectives
Not at all 1
Sometimes 2
Extensively 3

288
LEADERSHIP
A: How important do you believe this process to be with respect to achieving performance excellence?
PROCESS
B: To what extent does your firm carry out this process in order to achieve performance excellence?
Low 1
Med 2
High 3
11. The leadership of a small business serves as a role model for the
organisation and all stakeholders.
Not at all 1
Sometimes 2
Extensively 3

289
A: How important do you believe this process to be with respect to achieving performance excellence?
PROCESS
B: To what extent does your firm carry out this process in order to achieve performance excellence?
Low 1
Med 2
High 3
12. The leadership of a small business has a few simple rules to guide its
strategic processes instead of elaborate strategies [a simple standard
operating procedure is devised to guide decision making]. These rules
focus on : – how to carry out key processes; knowing which opportunities
to pursue and which should not be considered; being able to rank the
accepted opportunities; to synchronize the pace of emerging
opportunities and other parts of the company and when to pull out of
yesterday’s opportunities.
Not at all 1
Sometimes 2
Extensively 3
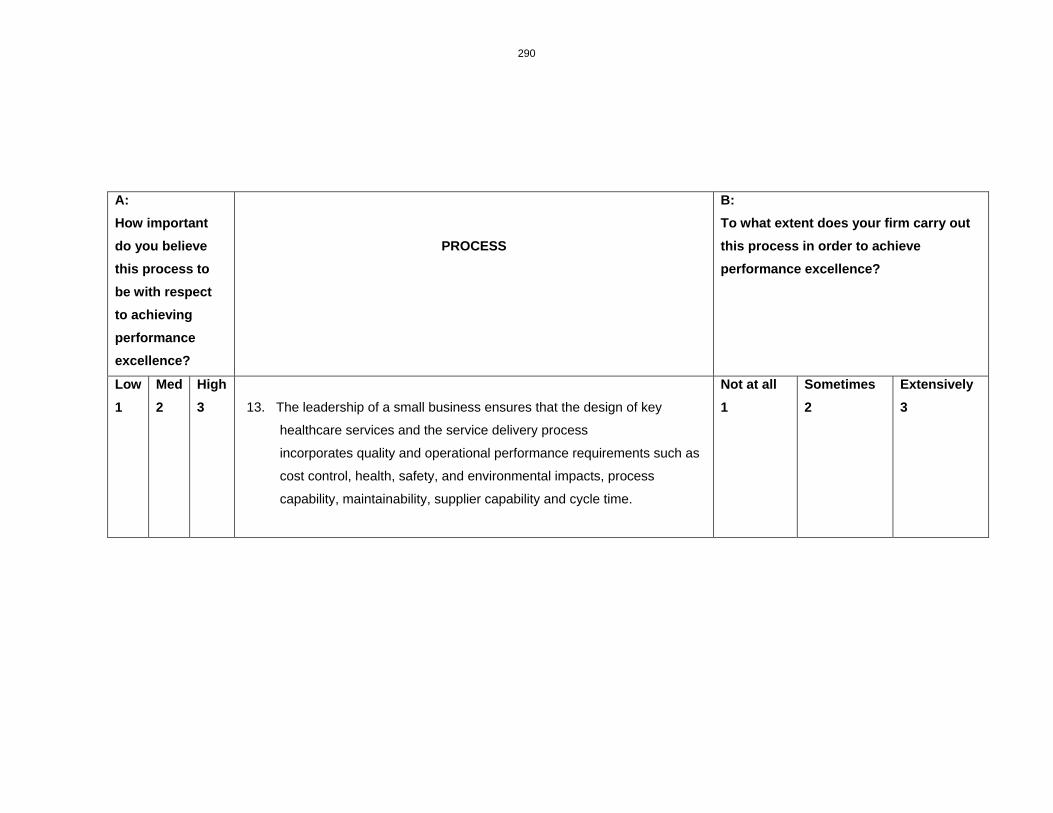
290
A: How important do you believe this process to be with respect to achieving performance excellence?
PROCESS
B: To what extent does your firm carry out this process in order to achieve performance excellence?
Low 1
Med 2
High 3
13. The leadership of a small business ensures that the design of key
healthcare services and the service delivery process
incorporates quality and operational performance requirements such as
cost control, health, safety, and environmental impacts, process
capability, maintainability, supplier capability and cycle time.
Not at all 1
Sometimes 2
Extensively 3

291
A: How important do you believe this process to be with respect to achieving performance excellence?
PROCESS
B: To what extent does your firm carry out this process in order to achieve performance excellence?
Low 1
Med 2
High 3
14. The leadership of a small business patches and restructures the business
portfolio by creating an enterprise structure that consists of patches
[units/modules], in order to fit changing market opportunities. In this type
of structure, the business units are modular, focused and discrete so that
they can be combine seamlessly; there is access to trends and
knowledge that can help to predict when to restructure the business;
there is an ability to recognize patterns and trends that develop in the
market place; market segmentation which reveals how to optimally
configure patches [ units/modules] to exploit market opportunities, is
clearly understood; road maps which suggest how future patches [
units/modules] are likely to evolve, are available.
Not at all 1
Sometimes 2
Extensively 3

292
A: How important do you believe this process to be with respect to achieving performance excellence?
PROCESS
B: To what extent does your firm carry out this process in order to achieve performance excellence?
Low 1
Med 2
High 3
15. The leadership of a small business develops strategies that are clearly
translated into action plans that support the achievement of
organizational objectives. Strategies are linked to resources ,
implementation procedures and defined performance measures.
Not at all 1
Sometimes 2
Extensively 3
Low 1
Med 2
High 3
16. The leadership of a small business knows what resources [e.g. human,
financial, physical, support] are available to the business; their
constraints, their capacities and their advantages.
Not at all 1
Sometimes 2
Extensively 3

293
A: How important do you believe this process to be with respect to achieving performance excellence?
PROCESS
B: To what extent does your firm carry out this process in order to achieve performance excellence?
Low 1
Med 2
High 3
17. The leadership of a small business devises appropriate strategies that
can maximize any resource advantage and overcome any resource
limitation.
Not at all 1
Sometimes 2
Extensively 3
Low 1
Med 2
High 3
18. The leadership of small businesses ensures that personalized service is
offered to customers
Not at all 1
Sometimes 2
Extensively 3

294
MEASUREMENT
A: How important do you believe this process to be with respect to achieving performance excellence?
PROCESS
B: To what extent does your firm carry out this process in order to achieve performance excellence?
Low 1
Med 2
High 3
19. The organization regularly measures and analyses organizational
performance to provide the information and data to support the
organization’s strategic planning process, as well as its operational and
functional processes to enable continuous improvement.
Not at all 1
Sometimes 2
Extensively 3
Low 1
Med 2
High 3
20. Key information and data - financial and non-financial- is clearly linked to
the organisation’s processes and goals, and are systematically gathered
and used to track and improve the company’s performance at all levels.
Not at all 1
Sometimes 2
Extensively 3

295
A: How important do you believe this process to be with respect to achieving performance excellence?
PROCESS
B: To what extent does your firm carry out this process in order to achieve performance excellence?
Low 1
Med 2
High 3
21. Key performance measures embedded in the action plans and are used to
systematically track progress towards meeting organizational strategies
Not at all 1
Sometimes 2
Extensively 3
Low 1
Med 2
High 3
22. The type and quality of data and information collected, as well as its usage
and effectiveness, are periodically evaluated, improved and kept current
with changing trends.
Not at all 1
Sometimes 2
Extensively 3
Low 1
Med 2
High 3
23. All measures of organizational performance captured by the small business
are compared against industry or best-in-class benchmarks
Not at all 1
Sometimes 2
Extensively 3

296
CUSTOMERS
A: How important do you believe this process to be with respect to achieving performance excellence?
PROCESS
B: To what extent does your firm carry out this process in order to achieve performance excellence?
Low 1
Med 2
High 3
24. There is ease of access for small businesses customers when they are
seeking information or assistance and/or when they wish to comment or
complain.
Not at all 1
Sometimes 2
Extensively 3
Low 1
Med 2
High 3
25. A complaint management process exists that ensures complaints are not
only resolved effectively and promptly but are also analyzed as a source of
improvement activities.
Not at all 1
Sometimes 2
Extensively 3

297
A: How important do you believe this process to be with respect to achieving performance excellence?
PROCESS
B: To what extent does your firm carry out this process in order to achieve performance excellence?
Low 1
Med 2
High 3
26. Good relationships with customers are actively pursued and maintained by
both staff and the leadership of small businesses.
Not at all 1
Sometimes 2
Extensively 3
Low 1
Med 2
High 3
27. The design of key healthcare services and the service delivery process is
addressed systematically accounting for changing customer requirements.
Not at all 1
Sometimes 2
Extensively 3
Low 1
Med 2
High 3
28. The company gathers information about customer satisfaction for all key
customer segments and captures information that reflects transaction
quality, customer repurchase, new business, and positive referral.
Not at all 1
Sometimes 2
Extensively 3

298
NETWORKS AND SUPPORT SYSTEMS
A: How important do you believe this process to be with respect to achieving performance excellence?
PROCESS
B: To what extent does your firm carry out this process in order to achieve performance excellence?
Low 1
Med 2
High 3
29. The leadership of a small business takes into account the needs and
expectations of all stakeholders, the changing, turbulent and competitive
environment, regulatory, financial, market, technological, societal and
other risks as well as factors unique to the organization, when establishing
organisational values, organisational directions and performance
expectations as well as when looking for business opportunities.
Not at all 1
Sometimes 2
Extensively 3

299
A: How important do you believe this process to be with respect to achieving performance excellence?
PROCESS
B: To what extent does your firm carry out this process in order to achieve performance excellence?
Low 1
Med 2
High 3
30. The leadership of a small business uses its involvement with its
communities and professional associations to both support and strengthen
those communities and associations as well as the business.
Not at all 1
Sometimes 2
Extensively 3
Low 1
Med 2
High 3
31. The leadership of a small business has strong friend, family and
professional support networks.
Not at all 1
Sometimes 2
Extensively 3
Low 1
Med 2
High 3
32. The leadership of a small business takes into account its legal, ethical and
risk requirements, in its decision-making processes
Not at all 1
Sometimes 2
Extensively 3

300
ANNEXURE 2 TABLE 1: DESCRIPTIVE STATISTICS [SECTION 2A]
Mean
Std.
Deviation Analysis N
Q2.1A 2.90 .316 10
Q2.2A 2.80 .422 10
Q2.3A 2.70 .675 10
Q2.4A 2.80 .422 10
Q2.5A 2.90 .316 10
Q2.6A 2.80 .422 10
Q2.7A 2.80 .422 10
Q2.8A 2.30 .483 10
Q2.9A 2.40 .516 10
Q2.10A 2.20 .789 10
Q2.11A 2.60 .516 10
Q2.12A 3.00 .000 10
Q2.13A 2.60 .516 10
Q2.14A 2.60 .516 10
Q2.15A 2.90 .316 10
Q2.16A 2.70 .483 10
Q2.17A 2.90 .316 10
Q2.18A 3.00 .000 10
Q2.19A 2.60 .699 10
Q2.20A 2.90 .316 10
Q2.21A 3.00 .000 10
Q2.22A 3.00 .000 10
Q2.23A 2.70 .483 10
Q2.24A 2.70 .483 10
Q2.25A 2.40 .699 10
Q2.26A 2.60 .516 10
Q2.27A 2.60 .699 10
Q2.28A 2.90 .316 10
Q2.29A 2.70 .675 10
Q2.30A 2.60 .516 10
Q2.31A 2.30 .823 10
Q2.32A 2.20 .789 10

301
TABLE 2: ALPHA COEFFICIENTS [SECTION 2A]
SCALE
No. of cases
No. of items
ALPHA
LEADERSHIP Q1A-13A
10 13 0.5718
STAFF FOCUS Q14A-17A
10 4 0.3895
PATIENTS, CUSTOMERS AND OTHER MARKETS Q18A-22A
10 5 -0.2222
PROCESS MANAGEMENT Q23A-24A
10 2 1
MEASUREMENT AND ANALYSIS OF ORGANISATIONAL PERFORMANCE Q25A-31A
10 7 0.9068
ORGANISATIONAL PERFORMANCE RESULTS Q32A
10 1 No alpha value

302
TABLE 3: DESCRIPTIVE STATISTICS [SECTION 2B]
Mean
Std.
Deviation Analysis N
Q2.1B 2.20 .422 10
Q2.2B 2.30 .823 10
Q2.3B 2.20 .919 10
Q2.4B 2.10 .316 10
Q2.5B 2.20 .632 10
Q2.6B 2.20 .422 10
Q2.7B 2.10 .876 10
Q2.8B 1.80 .632 10
Q2.9B 2.30 .823 10
Q2.10B 2.20 .919 10
Q2.11B 2.10 .738 10
Q2.12B 2.30 .483 10
Q2.13B 1.80 .632 10
Q2.14B 2.30 .675 10
Q2.15B 2.30 .823 10
Q2.16B 2.30 .675 10
Q2.17B 2.80 .422 10
Q2.18B 2.40 .699 10
Q2.19B 1.90 .568 10
Q2.20B 1.80 .789 10
Q2.21B 1.90 .738 10
Q2.22B 2.80 .422 10
Q2.23B 1.90 .568 10
Q2.24B 1.90 .568 10
Q2.25B 2.60 .516 10
Q2.26B 2.80 .422 10
Q2.27B 2.40 .699 10
Q2.28B 2.60 .516 10
Q2.29B 2.60 .516 10
Q2.30B 2.70 .483 10
Q2.31B 2.60 .516 10
Q2.32B 2.60 .516 10

303
TABLE 4: ALPHA COEFFICIENTS [SECTION 2B]
SCALE
No. of cases
No. of items
ALPHA
LEADERSHIP Q1B-13B
10 13 0.8904
STAFF FOCUS Q14B-17B
10 4 0.89265
PATIENTS, CUSTOMERS AND OTHER MARKETS Q18B-22B
10 5 0.8138
PROCESS MANAGEMENT Q23B-24B
10 2 0.7917
MEASUREMENT AND ANALYSIS OF ORGANISATIONAL PERFORMANCE Q25B-31B
10 7 0.9089
ORGANISATIONAL PERFORMANCE RESULTS Q32B
10 1 No alpha value

304
ANNEXURE 3 TABLE 5: TOTAL VARIANCE EXPLAINED [SECTION 2B]
Initial Eigen values Extraction Sums of Squared Loadings Rotation Sums of Squared Loadings
Component Total
% of
Variance Cumulative % Total
% of
Variance Cumulative % Total
% of
Variance Cumulative %
1 14.805 46.265 46.265 14.805 46.265 46.265 7.706 24.083 24.083
2 5.446 17.017 63.283 5.446 17.017 63.283 6.555 20.484 44.567
3 4.586 14.332 77.615 4.586 14.332 77.615 6.298 19.680 64.246
4 2.212 6.913 84.528 2.212 6.913 84.528 4.810 15.033 79.279
5 2.110 6.593 91.121 2.110 6.593 91.121 3.789 11.842 91.121
6 .992 3.100 94.221
7 .869 2.716 96.937
8 .581 1.814 98.751
9 .400 1.249 100.000
10 2.406E-15 7.519E-15 100.000
11 5.327E-16 1.665E-15 100.000
12 2.951E-16 9.221E-16 100.000
13 2.287E-16 7.146E-16 100.000
14 2.154E-16 6.730E-16 100.000
15 1.445E-16 4.515E-16 100.000
16 9.531E-17 2.978E-16 100.000
17 6.145E-17 1.920E-16 100.000
18 2.495E-17 7.796E-17 100.000
19 1.164E-17 3.639E-17 100.000

305
20 3.526E-18 1.102E-17 100.000
21 -5.536E-32 -1.730E-31 100.000
22 -2.361E-17 -7.378E-17 100.000
Component
Initial Eigen
values
Extraction
Sums of
Squared
Loadings
Rotation Sums
of Squared
Loadings
Total
% of
Variance Cumulative % Total
% of
Variance Cumulative % Total
% of
Variance Cumulative %
23 -8.440E-17 -2.637E-16 100.000
24 -1.051E-16 -3.285E-16 100.000
25 -1.991E-16 -6.222E-16 100.000
26 -2.691E-16 -8.410E-16 100.000
27 -2.851E-16 -8.908E-16 100.000
28 -2.942E-16 -9.195E-16 100.000
29 -4.166E-16 -1.302E-15 100.000
30 -5.993E-16 -1.873E-15 100.000
31 -1.223E-15 -3.820E-15 100.000
32 -1.507E-15 -4.708E-15 100.000
Extraction Method: Principal Component Analysis.
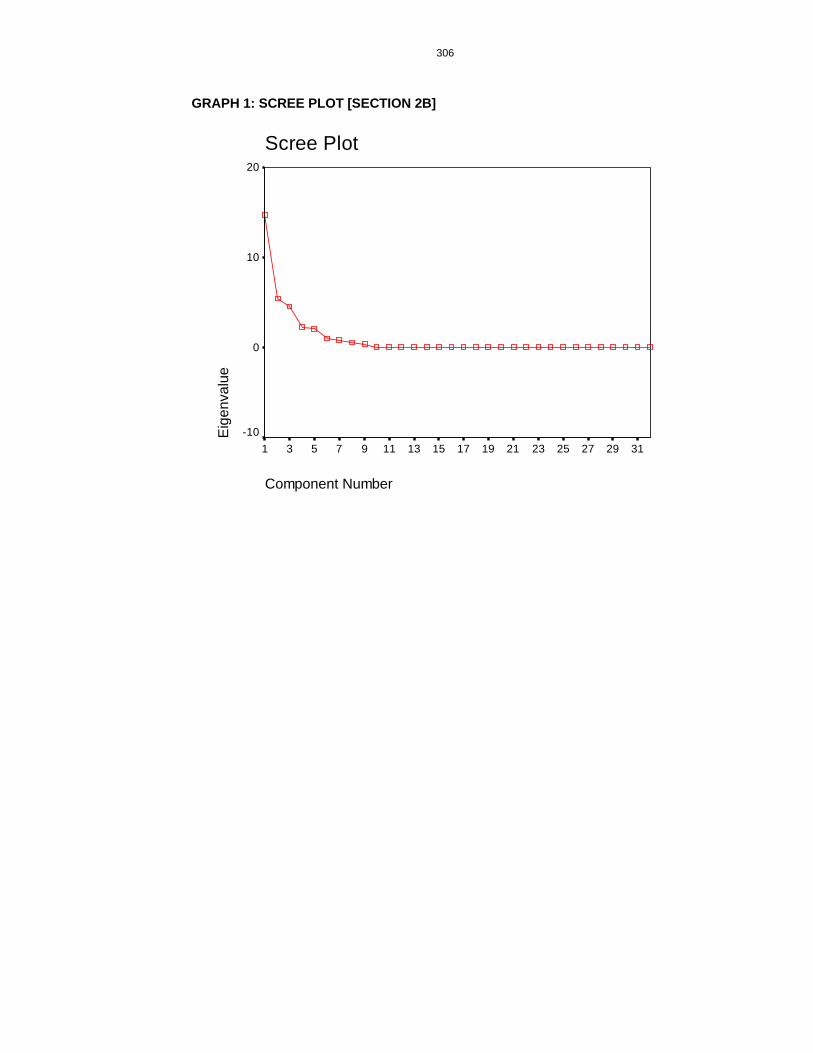
306
GRAPH 1: SCREE PLOT [SECTION 2B]
Scree Plot
Component Number
312927252321191715131197531
Eig
enva
lue
20
10
0
-10

307
TABLE 6: ROTATED COMPONENT MATRIX [SECTION 2B]
Component
1 2 3 4 5
Q2.1B .228 .953
Q2.2B .801 .402 .361
Q2.3B .620 .174 .540
Q2.4B .415 .184 .410 .702
Q2.5B .168 .218 -.138 .750
Q2.6B .228 .953
Q2.7B .929 .146
Q2.8B .203 .872 .157 .254 .190
Q2.9B .801 .402 .361
Q2.10B .744 .414 .375
Q2.11B .387 .710 .137 .367 -.162
Q2.12B .217 .592 .368 .222 .235
Q2.13B .203 .872 .157 .254 .190
Q2.14B .812 .196 -.191 .183 .360
Q2.15B .801 .402 .361
Q2.16B .812 .196 -.191 .183 .360
Q2.17B .862 .472
Q2.18B .213 .163 .269 .846 -.280
Q2.19B -.194 .426 .831 .197
Q2.20B .436 .324 .348 .697 .123
Q2.21B .186 .923 .246 .101
Q2.22B .862 .472
Q2.23B -.194 .426 .831 .197
Q2.24B .197 .653 .369 .497
Q2.25B .209 .210 .934 .171
Q2.26B .862 .472
Q2.27B .213 .163 .269 .846 -.280
Q2.28B .209 .210 .934 .171
Q2.29B .209 .210 .934 .171
Q2.30B .786 .350 .183 -.221 .231
Q2.31B .209 .210 .934 .171
Q2.32B .209 .210 .934 .171
Extraction Method: Principal Component Analysis. Rotation Method: Varimax with
Kaiser Normalization.

308
ANNEXURE 4
TABLE 6: THE NEWLY DEFINED FACTORS OF SECTION 2B
ITEM (QUESTION)
FACTOR
2,9,10,14,15,16,17,22,26,30 STAFF
3,7,8,11,12,13,21,24 LEADERSHIP
25,28,29,31,32 MEASUREMENT
18,19,20,23,27 CUSTOMERS
1,4,5,6 NETWORKS AND SUPPORT
SYSTEMS

309
ANEXURE 5 TABLE 7: ALPHA VALUES [SECTION 2B-LEADERSHIP]
Alpha = 0.9523 N (cases) =10 N (items =8
TABLE 8: DESCRIPTIVE STATISTICS [SECTION 2B-LEADERSHIP]
Mean
Std.
Deviation Analysis N
Q2.3B 2.20 .919 10
Q2.7B 2.10 .876 10
Q2.8B 1.80 .632 10
Q2.11B 2.10 .738 10
Q2.12B 2.30 .483 10
Q2.13B 1.80 .632 10
Q2.21B 1.90 .738 10
Q2.24B 1.90 .568 10
TABLE 9: TOTAL VARIANCE EXPLAINED [SECTION 2B-LEADERSHIP]
Initial Eigen values Extraction Sums of Squared Loadings
Component Total
% of
Variance
Cumulative
% Total
% of
Variance
Cumulative
%
1 6.231 77.884 77.884 6.231 77.884 77.884
2 .671 8.383 86.267
3 .417 5.209 91.477
4 .358 4.471 95.948
5 .222 2.775 98.722
6 .069 .857 99.580
7 .034 .420 100.000
8 -2.358E-
18
-2.948E-
17100.000
Extraction Method: Principal Component Analysis.

310
GRAPH 2: SCREE PLOT [SECTION 2B-LEADERSHIP]
Scree Plot
Component Number
87654321
Eig
enva
lue
7
6
5
4
3
2
1
0
-1
TABLE 10: COMPONENT MATRIX [SECTION 2B-LEADERSHIP]
Component
1
Q2.3B .802
Q2.7B .914
Q2.8B .946
Q2.11B .854
Q2.12B .733
Q2.13B .946
Q2.21B .954
Q2.24B .887
Extraction Method: Principal Component Analysis.
NOTES: Rotated Component Matrix (a) A Only one component was extracted. The solution cannot be rotated.

311
ANNEXURE 6 TABLE 11: ALPHA VALUES [SECTION 2B-STAFF]
Alpha = 0.9538 N (cases) =10 N (items =10
TABLE 12: DESCRIPTIVE STATISTICS [SECTION 2B-STAFF]
Mean
Std.
Deviation Analysis N
Q2.2B 2.30 .823 10
Q2.9B 2.30 .823 10
Q2.10B 2.20 .919 10
Q2.14B 2.30 .675 10
Q2.15B 2.30 .823 10
Q2.16B 2.30 .675 10
Q2.17B 2.80 .422 10
Q2.22B 2.80 .422 10
Q2.26B 2.80 .422 10
Q2.30B 2.70 .483 10

312
TABLE 13: TOTAL VARIANCE EXPLAINED [STAFF]
Initial Eigen values Extraction Sums of Squared Loadings Rotation Sums of Squared Loadings
Component Total
% of
Variance
Cumulative
% Total
% of
Variance
Cumulative
% Total
% of
Variance
Cumulative
%
1 7.790 77.899 77.899 7.790 77.899 77.899 5.627 56.269 56.269
2 1.183 11.831 89.729 1.183 11.831 89.729 3.346 33.460 89.729
3 .603 6.033 95.762
4 .292 2.918 98.679
5 .132 1.321 100.000
6 2.726E-
16 2.726E-15 100.000
7 2.443E-
17 2.443E-16 100.000
8 .000 .000 100.000
9 -1.892E-
16
-1.892E-
15100.000
10 -2.246E-
16
-2.246E-
15100.000
Extraction Method: Principal Component Analysis.
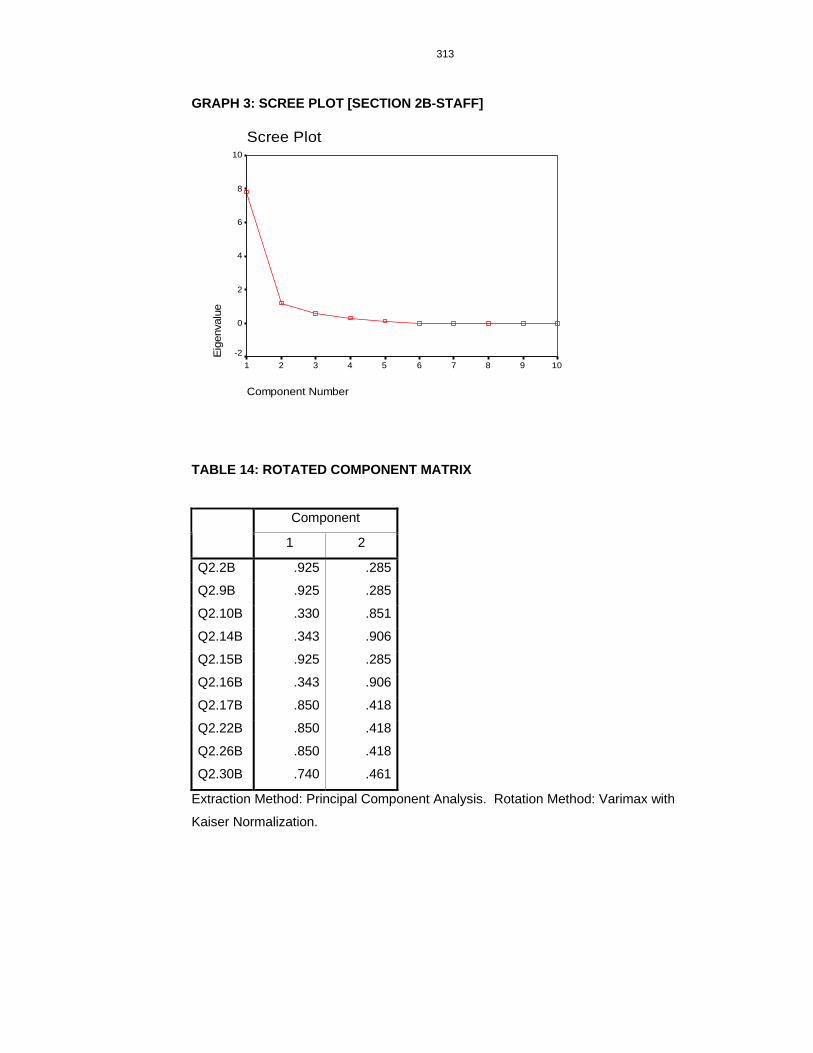
313
GRAPH 3: SCREE PLOT [SECTION 2B-STAFF]
Scree Plot
Component Number
10987654321
Eig
enva
lue
10
8
6
4
2
0
-2
TABLE 14: ROTATED COMPONENT MATRIX
Component
1 2
Q2.2B .925 .285
Q2.9B .925 .285
Q2.10B .330 .851
Q2.14B .343 .906
Q2.15B .925 .285
Q2.16B .343 .906
Q2.17B .850 .418
Q2.22B .850 .418
Q2.26B .850 .418
Q2.30B .740 .461
Extraction Method: Principal Component Analysis. Rotation Method: Varimax with
Kaiser Normalization.

314
ANNEXURE 7
TABLE 15: THE NEWLY DEFINED SUB-FACTORS OF THE FACTOR STAFF
ITEM ( QUESTION)
FACTOR
2,9,15,17,22,26,30 KNOWLEDGE, EMPOWERMENT AND
MOTIVATION
10,14,16 REWARD

315
ANNEXURE 8 TABLE 16: ALPHA VALUES [SECTION 2B-STAFF-KNOWLEDGE, EMPOWERMENT AND MOTIVATION]
Alpha = 0.9625 N (cases) =10 N (items =7
TABLE 17: DESCRIPTIVE STATISTICS [SECTION 2B-STAFF-KNOWLEDGE, EMPOWERMENT AND MOTIVATION]
Mean
Std.
Deviation Analysis N
Q2.2B 2.30 .823 10
Q2.9B 2.30 .823 10
Q2.15B 2.30 .823 10
Q2.17B 2.80 .422 10
Q2.22B 2.80 .422 10
Q2.26B 2.80 .422 10
Q2.30B 2.70 .483 10

316
TABLE 18: TOTAL VARIANCE EXPLAINED [SECTION 2B-STAFF –KNOWLEDGE, EMPOWERMENT AND MOTIVATION]
Initial Eigen values Extraction Sums of Squared Loadings
Component Total
% of
Variance
Cumulative
% Total
% of
Variance
Cumulative
%
1 6.210 88.716 88.716 6.210 88.716 88.716
2 .516 7.367 96.082
3 .274 3.918 100.000
4 3.853E-
175.505E-16 100.000
5 2.031E-
342.902E-33 100.000
6 .000 .000 100.000
7 -1.681E-
16
-2.401E-
15100.000
Extraction Method: Principal Component Analysis.
GRAPH 4: SCREE PLOT [SECTION 2B-STAFF-KNOWLEDGE, EMPOWERMENT AND MOTIVATION]
Scree Plot
Component Number
7654321
Eig
enva
lue
7
6
5
4
3
2
1
0
-1
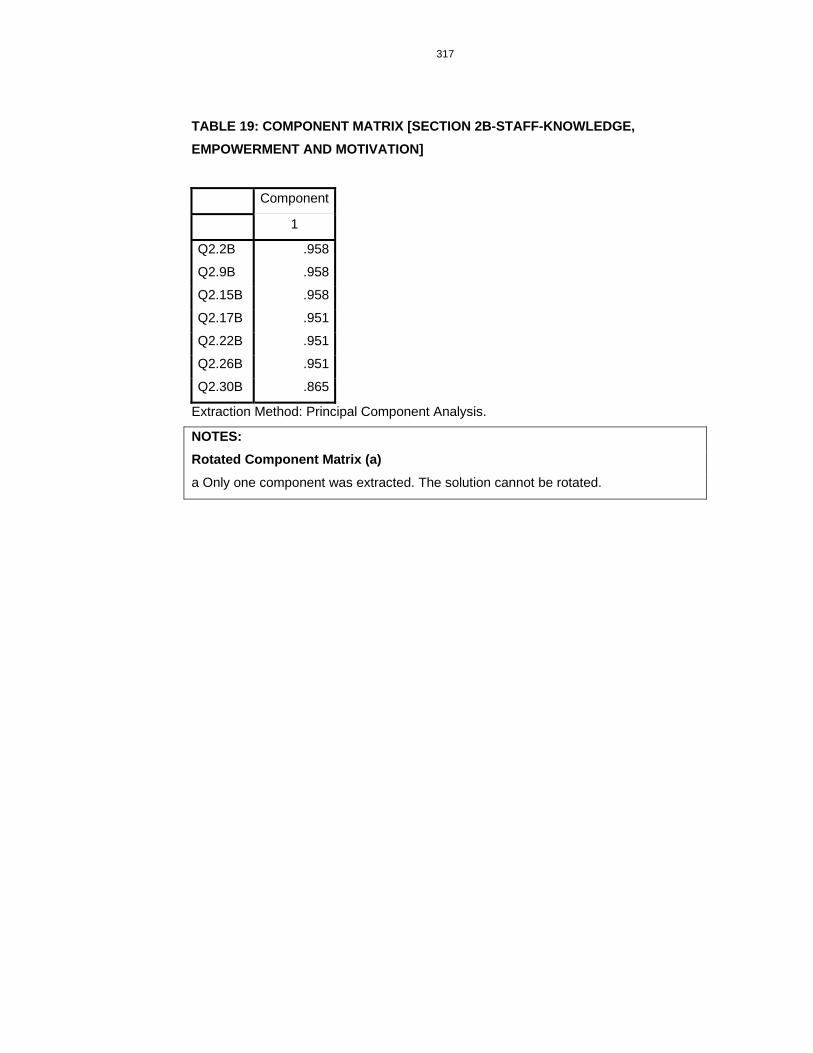
317
TABLE 19: COMPONENT MATRIX [SECTION 2B-STAFF-KNOWLEDGE, EMPOWERMENT AND MOTIVATION]
Component
1
Q2.2B .958
Q2.9B .958
Q2.15B .958
Q2.17B .951
Q2.22B .951
Q2.26B .951
Q2.30B .865
Extraction Method: Principal Component Analysis.
NOTES: Rotated Component Matrix (a)
a Only one component was extracted. The solution cannot be rotated.

318
ANNEXURE 9 TABLE 20: ALPHA VALUES [SECTION 2B-STAFF-REWARD]
Alpha = 0.9303 N (cases) =10 N (items =3
TABLE 21: DESCRIPTIVE STATISTICS [SECTION 2B-STAFF-REWARD]
Mean
Std.
Deviation Analysis N
Q2.10B
2.20 .919 10
Q2.14B
2.30 .675 10
Q2.16B
2.30 .675 10
TABLE 22: TOTAL VARIANCE EXPLAINED [SECTION 2B-STAFF-REWARD]
Initial Eigen values Extraction Sums of Squared Loadings
Component Total
% of
Variance
Cumulative
% Total
% of
Variance
Cumulative
%
1
2.722 90.724 90.724 2.722 90.724 90.724
2
.278 9.276 100.000
3 2.856E-
179.519E-16 100.000
Extraction Method: Principal Component Analysis.

319
GRAPH 5: SCREE PLOT [SECTION 2B-STAFF-REWARD]
Scree Plot
Component Number
321
Eig
enva
lue
3.0
2.5
2.0
1.5
1.0
.5
0.0
Table 23: Component Matrix [SECTION 2B-STAFF-REWARD]
Component
1
Q2.10B .897
Q2.14B .979
Q2.16B .979
Extraction Method: Principal Component Analysis.
NOTES: Rotated Component Matrix (a) a Only one component was extracted. The solution cannot be rotated.
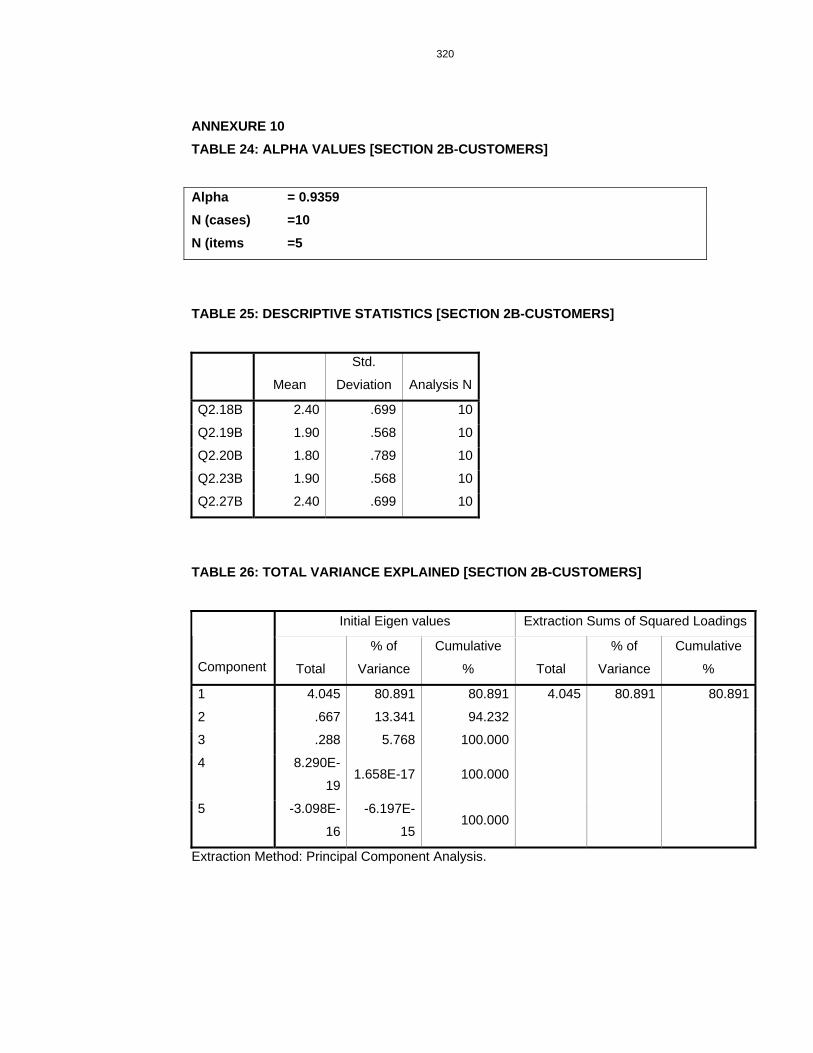
320
ANNEXURE 10 TABLE 24: ALPHA VALUES [SECTION 2B-CUSTOMERS]
Alpha = 0.9359 N (cases) =10 N (items =5
TABLE 25: DESCRIPTIVE STATISTICS [SECTION 2B-CUSTOMERS]
Mean
Std.
Deviation Analysis N
Q2.18B 2.40 .699 10
Q2.19B 1.90 .568 10
Q2.20B 1.80 .789 10
Q2.23B 1.90 .568 10
Q2.27B 2.40 .699 10
TABLE 26: TOTAL VARIANCE EXPLAINED [SECTION 2B-CUSTOMERS]
Initial Eigen values Extraction Sums of Squared Loadings
Component Total
% of
Variance
Cumulative
% Total
% of
Variance
Cumulative
%
1 4.045 80.891 80.891 4.045 80.891 80.891
2 .667 13.341 94.232
3 .288 5.768 100.000
4 8.290E-
191.658E-17 100.000
5 -3.098E-
16
-6.197E-
15100.000
Extraction Method: Principal Component Analysis.
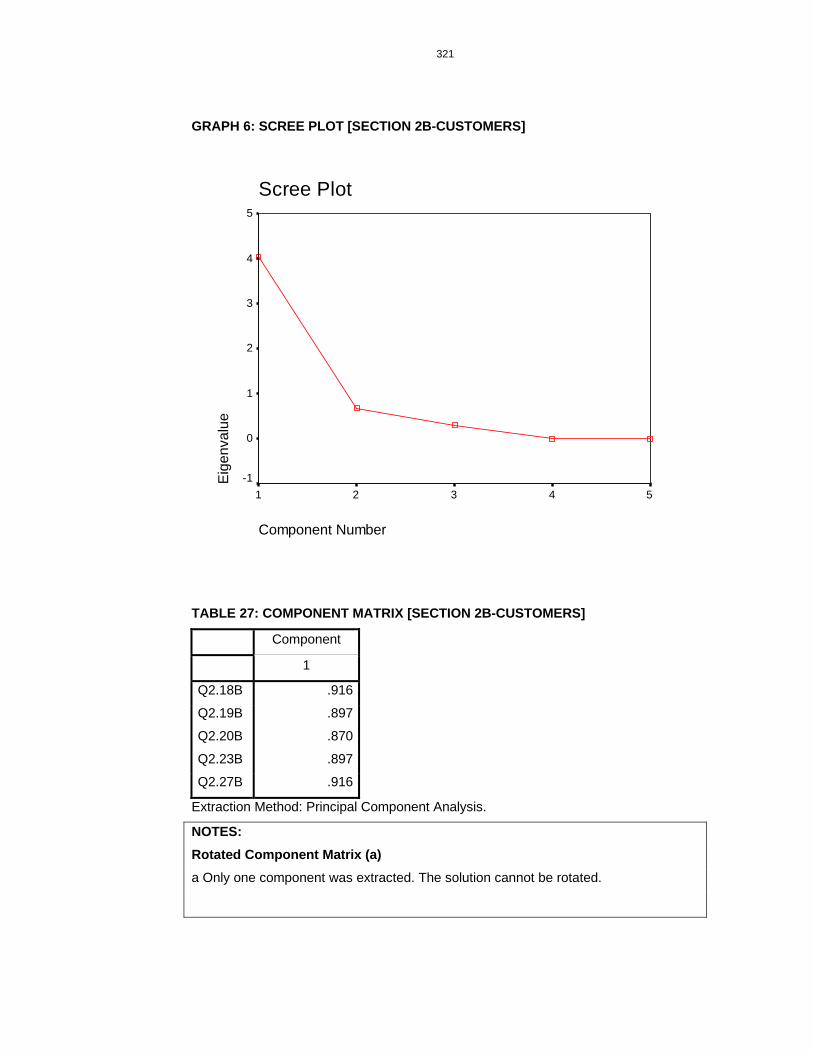
321
GRAPH 6: SCREE PLOT [SECTION 2B-CUSTOMERS]
Scree Plot
Component Number
54321
Eig
enva
lue
5
4
3
2
1
0
-1
TABLE 27: COMPONENT MATRIX [SECTION 2B-CUSTOMERS]
Component
1
Q2.18B .916
Q2.19B .897
Q2.20B .870
Q2.23B .897
Q2.27B .916
Extraction Method: Principal Component Analysis.
NOTES: Rotated Component Matrix (a) a Only one component was extracted. The solution cannot be rotated.
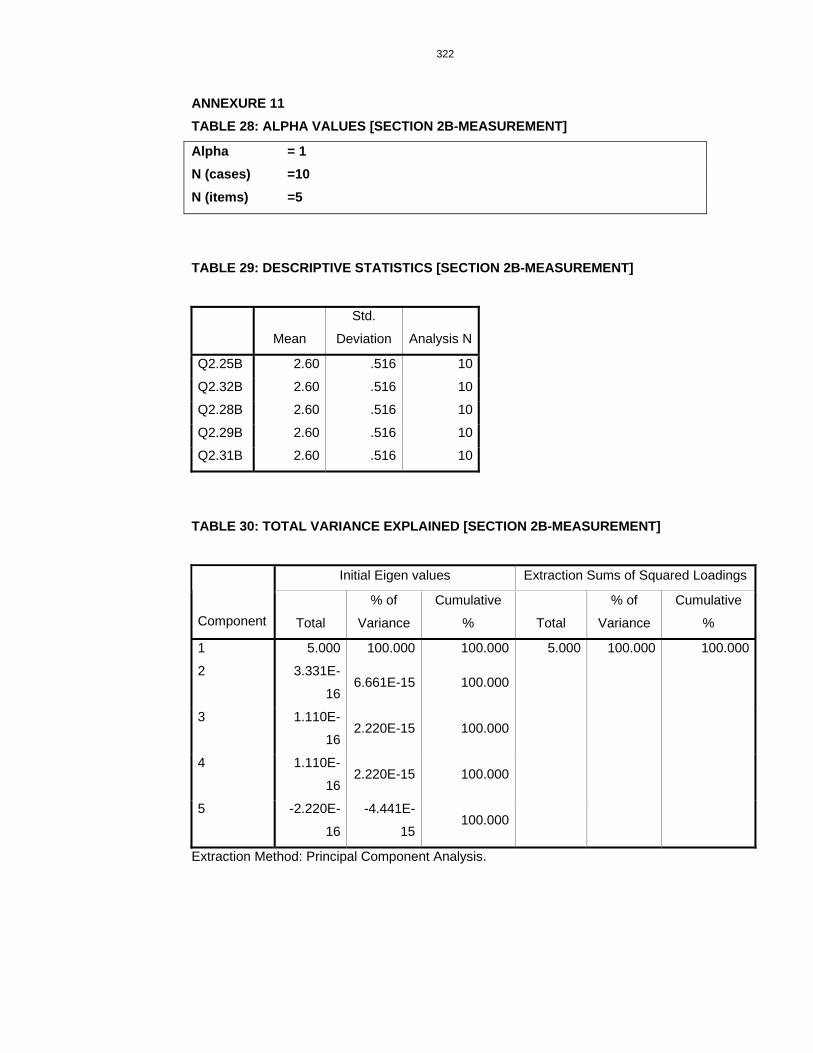
322
ANNEXURE 11 TABLE 28: ALPHA VALUES [SECTION 2B-MEASUREMENT]
Alpha = 1 N (cases) =10 N (items) =5
TABLE 29: DESCRIPTIVE STATISTICS [SECTION 2B-MEASUREMENT]
Mean
Std.
Deviation Analysis N
Q2.25B 2.60 .516 10
Q2.32B 2.60 .516 10
Q2.28B 2.60 .516 10
Q2.29B 2.60 .516 10
Q2.31B 2.60 .516 10
TABLE 30: TOTAL VARIANCE EXPLAINED [SECTION 2B-MEASUREMENT]
Initial Eigen values Extraction Sums of Squared Loadings
Component Total
% of
Variance
Cumulative
% Total
% of
Variance
Cumulative
%
1 5.000 100.000 100.000 5.000 100.000 100.000
2 3.331E-
166.661E-15 100.000
3 1.110E-
162.220E-15 100.000
4 1.110E-
162.220E-15 100.000
5 -2.220E-
16
-4.441E-
15100.000
Extraction Method: Principal Component Analysis.

323
GRAPH 7: SCREE PLOT [SECTION 2B-MEASUREMENT]
Scree Plot
Component Number
54321
Eig
enva
lue
6
5
4
3
2
1
0
-1
TABLE 31: COMPONENT MATRIX [SECTION 2B-MEASUREMENT]
Component
1
Q2.25B 1.000
Q2.32B 1.000
Q2.28B 1.000
Q2.29B 1.000
Q2.31B 1.000
Extraction Method: Principal Component Analysis.
NOTES; Rotated Component Matrix (a)
a Only one component was extracted. The solution cannot be rotated.
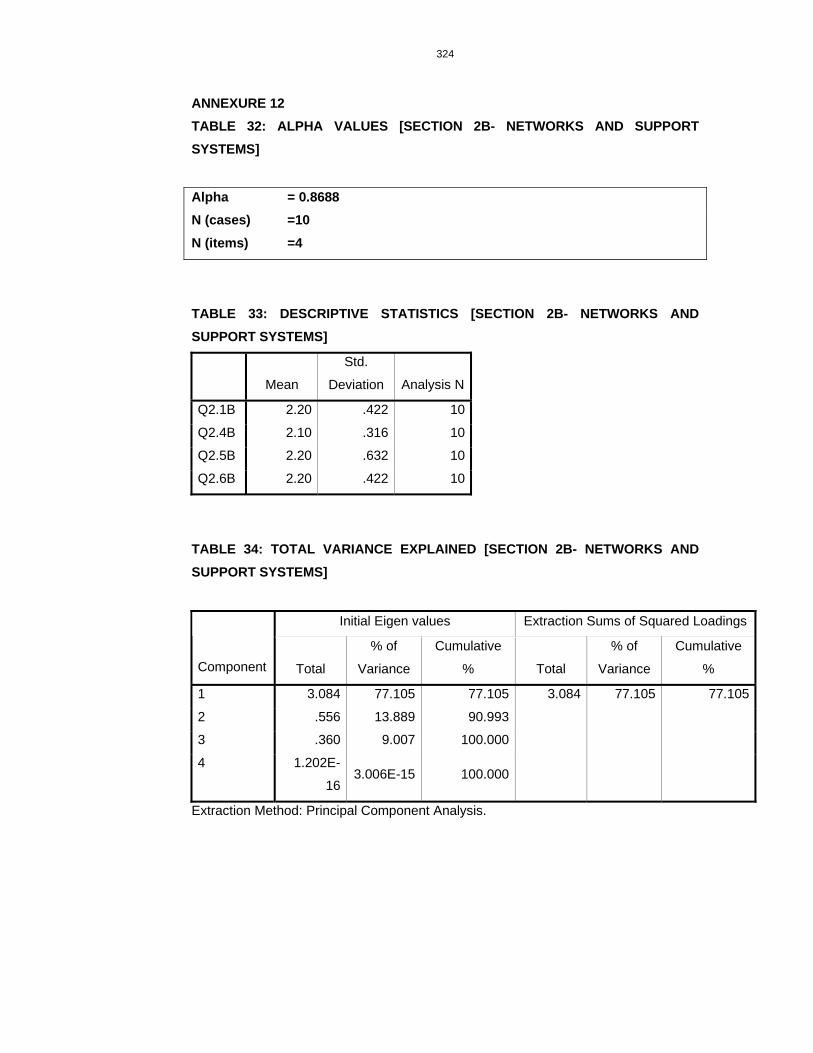
324
ANNEXURE 12 TABLE 32: ALPHA VALUES [SECTION 2B- NETWORKS AND SUPPORT SYSTEMS]
Alpha = 0.8688 N (cases) =10 N (items) =4
TABLE 33: DESCRIPTIVE STATISTICS [SECTION 2B- NETWORKS AND SUPPORT SYSTEMS]
Mean
Std.
Deviation Analysis N
Q2.1B 2.20 .422 10
Q2.4B 2.10 .316 10
Q2.5B 2.20 .632 10
Q2.6B 2.20 .422 10
TABLE 34: TOTAL VARIANCE EXPLAINED [SECTION 2B- NETWORKS AND SUPPORT SYSTEMS]
Initial Eigen values Extraction Sums of Squared Loadings
Component Total
% of
Variance
Cumulative
% Total
% of
Variance
Cumulative
%
1 3.084 77.105 77.105 3.084 77.105 77.105
2 .556 13.889 90.993
3 .360 9.007 100.000
4 1.202E-
163.006E-15 100.000
Extraction Method: Principal Component Analysis.

325
GRAPH 8: SCREE PLOT [SECTION 2B- NETWORKS AND SUPPORT SYSTEMS]
Scree Plot
Component Number
4321
Eig
enva
lue
3.5
3.0
2.5
2.0
1.5
1.0
.5
0.0
TABLE 35: COMPONENT MATRIX [SECTION 2B- NETWORKS AND SUPPORT SYSTEMS]
Component
1
Q2.1B .963
Q2.4B .783
Q2.5B .783
Q2.6B .963
Extraction Method: Principal Component Analysis.
NOTES: Rotated Component Matrix (a)
a Only one component was extracted. The solution cannot be rotated.

326
ANNEXURE 13 TABLE 36:DESCRIPTIVE STATISTICS [SECTION 2A]
Mean Std.
Deviation Analysis NQ2.1A 2.90 .301 130Q2.2A 2.80 .402 130Q2.3A 2.70 .643 130Q2.4A 2.80 .402 130Q2.5A 2.90 .301 130Q2.6A 2.80 .402 130Q2.7A 2.80 .402 130Q2.8A 2.30 .460 130Q2.9A 2.40 .492 130Q2.10A 2.20 .751 130Q2.11A 2.60 .492 130Q2.12A 3.00 .000 130Q2.13A 2.60 .492 130Q2.14A 2.60 .492 130Q2.15A 2.90 .301 130Q2.16A 2.70 .460 130Q2.17A 2.90 .301 130Q2.18A 3.00 .000 130Q2.19A 2.60 .666 130Q2.20A 2.90 .301 130Q2.21A 3.00 .000 130Q2.22A 3.00 .000 130Q2.23A 2.70 .460 130Q2.24A 2.70 .460 130Q2.25A 2.40 .666 130Q2.26A 2.60 .492 130Q2.27A 2.60 .666 130Q2.28A 2.90 .301 130Q2.29A 2.70 .643 130Q2.30A 2.60 .492 130Q2.31A 2.30 .784 130Q2.32A 2.20 .751 130

327
TABLE 37: ALPHA COEFFICIENTS [SECTION 2A] SCALE
No. of cases
No.of items
ALPHA
STAFF KNOWLEDGE EMPOWERMENT AND MOTIVATION
130 7 0.4527
STAFF REWARD
130 3 0.6036
LEADERSHIP GENERAL
130 6 0.5745
LEADERSHIP TURBULENCE
130 2 No alpha value
MEASUREMENT
130 5 0.3437
CUSTOMERS
130 5 0.8429
NETWORKS
130 4 0.8630

328
TABLE 38: DESCRIPTIVE STATISTICS [ SECTION 2B] Descriptive Statistics
Mean Std.
Deviation Analysis NQ1SK 2.22 .760 130Q2SK 2.30 .784 130Q3SK 2.12 .711 130Q4SK 2.80 .402 130Q5SK 2.80 .402 130Q6SK 2.80 .402 130Q7SK 2.70 .460 130Q8SR 2.30 .460 130Q9SR 2.28 .449 130Q10SR 2.31 .463 130Q11L 1.83 .612 130Q12L 1.84 .607 130Q13L 1.88 .659 130Q14L 1.82 .616 130Q15L 1.86 .644 130Q16L 2.11 .696 130Q17L 1.86 .644 130Q18L 1.83 .612 130Q19M 1.91 .549 130Q20M 1.83 .759 130Q21M 2.41 .679 130Q22M 1.91 .549 130Q23M 1.83 .759 130Q24C 2.21 .407 130Q25C 2.20 .402 130Q26C 2.20 .402 130Q27C 2.20 .402 130Q28C 2.20 .402 130Q29N 2.58 .526 130Q30N 2.58 .511 130Q31N 2.58 .511 130Q32N 2.58 .511 130

329
TABLE 39: ALPHA COEFFICIENTS [SECTION 2B] SCALE
No. of cases
No.of items
ALPHA
STAFF KNOWLEDGE EMPOWERMENT AND MOTIVATION
130 7 0.8642
STAFF REWARD
130 3 0.8066
LEADERSHIP SUB-FACTORS LEADERSHIP GENERAL LEADERSHIP TURBULENCE
130 130 130
8 6 2
0.9115 0.9248 0.7711
MEASUREMENT
130 5 0.9343
CUSTOMERS
130 5 0.8323
NETWORKS
130 4 0.9379
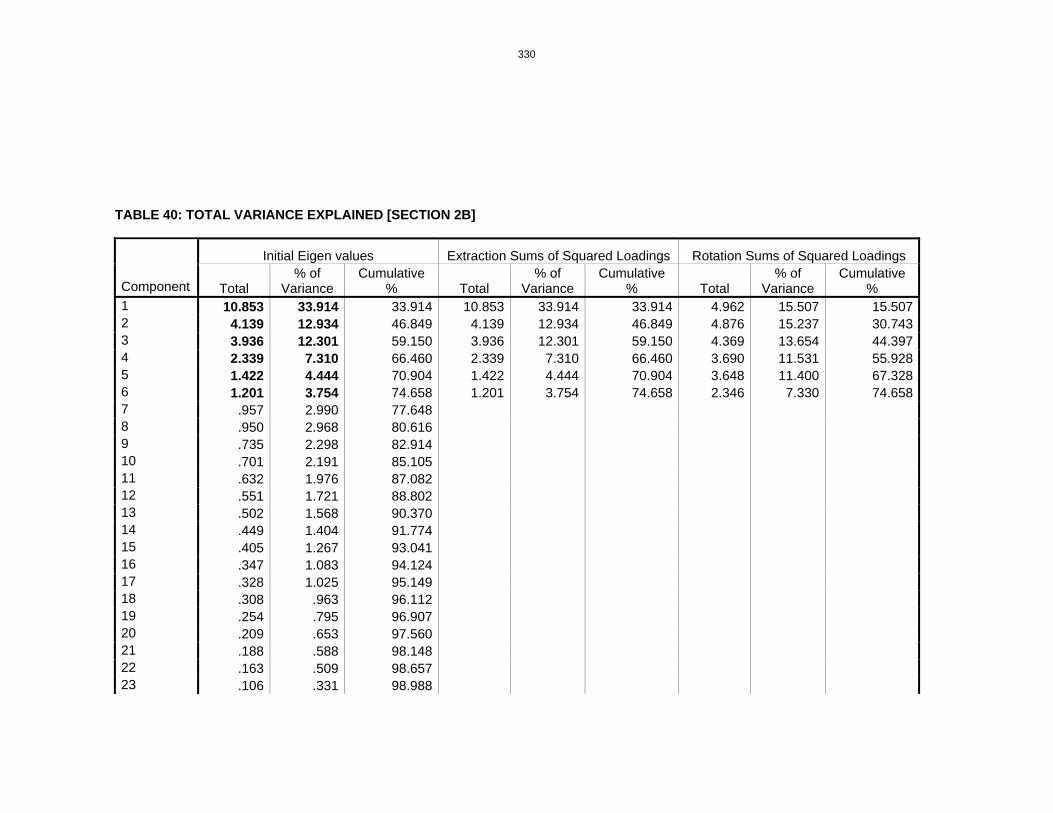
330
TABLE 40: TOTAL VARIANCE EXPLAINED [SECTION 2B]
Initial Eigen values Extraction Sums of Squared Loadings Rotation Sums of Squared Loadings
Component Total % of
Variance Cumulative
% Total % of
Variance Cumulative
% Total % of
Variance Cumulative
% 1 10.853 33.914 33.914 10.853 33.914 33.914 4.962 15.507 15.5072 4.139 12.934 46.849 4.139 12.934 46.849 4.876 15.237 30.7433 3.936 12.301 59.150 3.936 12.301 59.150 4.369 13.654 44.3974 2.339 7.310 66.460 2.339 7.310 66.460 3.690 11.531 55.9285 1.422 4.444 70.904 1.422 4.444 70.904 3.648 11.400 67.3286 1.201 3.754 74.658 1.201 3.754 74.658 2.346 7.330 74.6587 .957 2.990 77.648 8 .950 2.968 80.616 9 .735 2.298 82.914 10 .701 2.191 85.105 11 .632 1.976 87.082 12 .551 1.721 88.802 13 .502 1.568 90.370 14 .449 1.404 91.774 15 .405 1.267 93.041 16 .347 1.083 94.124 17 .328 1.025 95.149 18 .308 .963 96.112 19 .254 .795 96.907 20 .209 .653 97.560 21 .188 .588 98.148 22 .163 .509 98.657 23 .106 .331 98.988

331
24 .094 .295 99.283 25 .083 .260 99.542 26 .053 .166 99.708 27 .041 .128 99.836 28 .025 .080 99.916 29 .018 .055 99.971 30 .009 .029 100.000 31 1.138E-
16 3.558E-16 100.000
32 7.438E-17 2.324E-16 100.000
Extraction Method: Principal Component Analysi

332
GRAPH 9 : SCREE PLOT [SECTION 2B]
Scree Plot
Component Number
312927252321191715131197531
Eig
enva
lue
12
10
8
6
4
2
0

333
TABLE 41: ROTATED COMPONENT MATRIC [SECTION 2B]
Component 1 2 3 4 5 6 Q1SK .097 .736 .094 -.085 .022 .104Q2SK .283 .843 .119 .039 .228 .231Q3SK .097 .599 .071 -.110 .028 .333Q4SK -.005 .864 .066 .187 .333 -.003Q5SK .015 .496 -.009 .211 .207 -.219Q6SK -.088 .724 -.052 .149 .314 -.026Q7SK .278 .794 -.120 .225 .117 .185Q8SR .183 .157 .303 .143 .144 .675Q9SR .208 .127 .136 .157 .162 .682Q10SR .288 .203 .394 .145 .273 .644Q11L .837 .189 .355 .071 .068 .219Q12L .476 -.061 .381 .459 .010 -.013Q13L .875 .171 .096 -.129 .051 .129Q14L .508 -.107 .296 .402 .032 .271Q15L .632 -.113 .111 .122 .258 .018Q16L .557 .413 .515 -.166 .064 .128Q17L .917 .184 .149 -.010 .071 .143Q18L .817 .231 .276 -.060 .083 .192Q19M .299 -.222 .859 .064 .144 .168Q20M .207 .355 .735 .064 .306 .333Q21M .219 .180 .770 -.307 .248 -.086Q22M .299 -.222 .859 .064 .144 .168Q23M .207 .355 .735 .064 .306 .333Q24C .200 .022 -.149 .415 .005 .332Q25C -.002 .099 .017 .927 -.051 .120Q26C .090 .132 .006 .763 .015 -.111Q27C -.092 .115 .021 .819 -.183 .033Q28C -.088 .015 -.048 .761 -.041 .247Q29N .109 .274 .205 -.123 .859 .123Q30N .137 .275 .187 -.103 .890 .121Q31N .040 .129 .185 -.015 .846 .124Q32N .203 .304 .159 -.109 .736 .104
Extraction Method: Principal Component Analysis. Rotation Method: Varimax with Kaiser Normalization. a Rotation converged in 8 iterations.

334
TABLE 42: SECTION 2B [ STAFF KNOWLEDGE EMPOWERMENT AND MOTIVATION] Alpha = 0.8642 N (cases) = 130 N(Items) = 7 TABLE 43: DESCRIPTIVE STATISTICS - SECTION 2B [STAFF KNOWLEDGE EMPOWERMENT AND MOTIVATION]
Mean Std.
Deviation Analysis NQ1SK 2.22 .760 130Q2SK 2.30 .784 130Q3SK 2.12 .711 130Q4SK 2.80 .402 130Q5SK 2.80 .402 130Q6SK 2.80 .402 130Q7SK 2.70 .460 130
TABLE 44: TOTAL VARIANCE EXPLAINED - SECTION 2B [STAFF KNOWLEDGE EMPOWERMENT AND MOTIVATION]
Initial Eigen values Extraction Sums of Squared Loadings
Component Total % of
Variance Cumulative
% Total % of
Variance Cumulative
% 1 4.235 60.503 60.503 4.235 60.503 60.5032 .846 12.084 72.588 3 .660 9.424 82.012 4 .543 7.750 89.763 5 .395 5.647 95.410 6 .207 2.956 98.365 7 .114 1.635 100.000
Extraction Method: Principal Component Analysis.
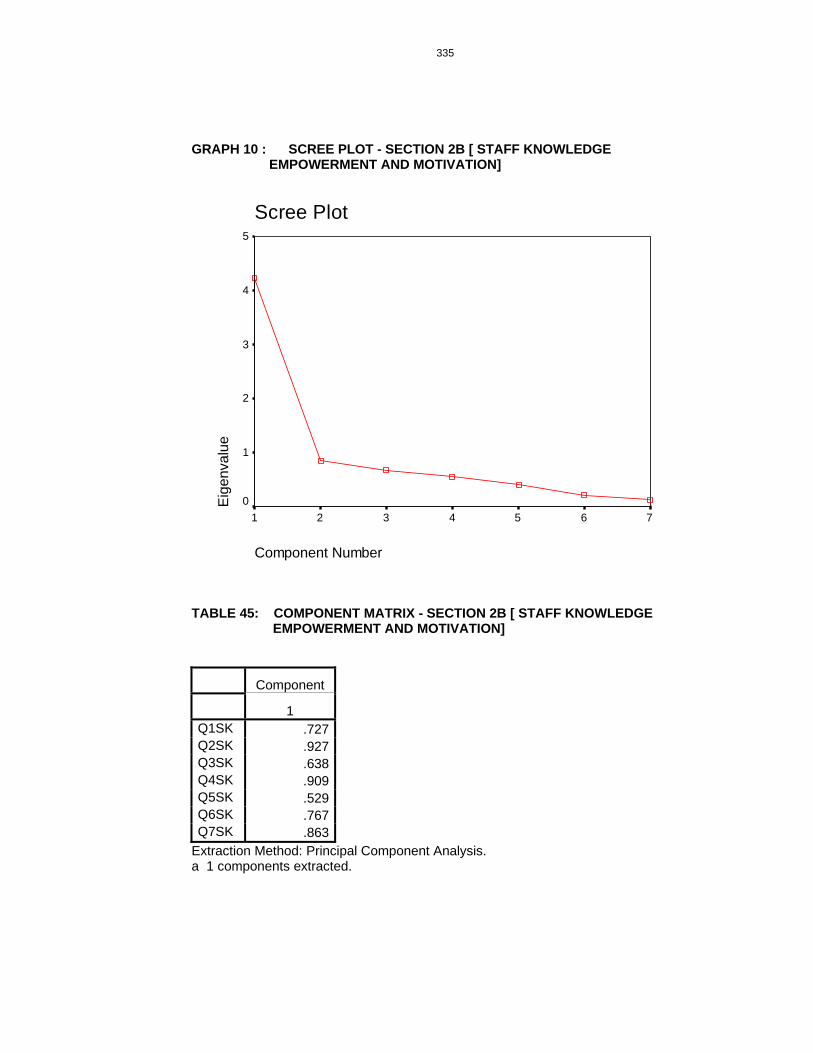
335
GRAPH 10 : SCREE PLOT - SECTION 2B [ STAFF KNOWLEDGE EMPOWERMENT AND MOTIVATION]
Scree Plot
Component Number
7654321
Eig
enva
lue
5
4
3
2
1
0
TABLE 45: COMPONENT MATRIX - SECTION 2B [ STAFF KNOWLEDGE EMPOWERMENT AND MOTIVATION]
Component
1 Q1SK .727Q2SK .927Q3SK .638Q4SK .909Q5SK .529Q6SK .767Q7SK .863
Extraction Method: Principal Component Analysis. a 1 components extracted.

336
TABLE 46: SECTION 2B [STAFF REWARD] Alpha = 0.8066 N (cases) = 130 N(Items) = 3 TABLE 47: DESCRIPTIVE STATISTICS –SECTION 2B [STAFF REWARD]
Mean Std.
Deviation Analysis N Q8SR 2.30 .460 130Q9SR 2.28 .449 130Q10SR 2.31 .463 130
TABLE 48: TOTAL VARIANCE EXPLAINED–SECTION 2B [STAFF REWARD]
Initial Eigenvalues Extraction Sums of Squared Loadings
Component Total % of
Variance Cumulative % Total % of
Variance Cumulative % 1 2.166 72.211 72.211 2.166 72.211 72.2112 .553 18.423 90.634 3 .281 9.366 100.000
Extraction Method: Principal Component Analysis.

337
GRAPH 11: SCREE PLOT - SECTION 2B [STAFF REWARD]
Scree Plot
Component Number
321
Eig
enva
lue
2.5
2.0
1.5
1.0
.5
0.0
TABLE 49: COMPONENT MATRIX- SECTION 2B [STAFF REWARD]
Component
1 Q8SR .847Q9SR .793Q10SR .905
Extraction Method: Principal Component Analysis. a 1 components extracted.

338
TABLE 50: SECTION 2B [ LEADERSHIP-GENERAL] Alpha = 0.9248 N (cases) = 130 N(Items) = 6 TABLE 51: DESCRIPTIVE STATISTICS- SECTION 2B [ LEADERSHIP-GENERAL]
Mean Std.
Deviation Analysis N Q11L 1.83 .612 130Q13L 1.88 .659 130Q15L 1.86 .644 130Q16L 2.11 .696 130Q17L 1.86 .644 130Q18L 1.83 .612 130
TABLE 52: TOTAL VARIANCE EXPLAINED
Initial Eigen values Extraction Sums of Squared Loadings
Component Total % of
Variance Cumulative % Total % of
Variance Cumulative % 1 4.472 74.532 74.532 4.472 74.532 74.5322 .788 13.136 87.668 3 .382 6.366 94.034 4 .174 2.892 96.926 5 .107 1.784 98.710 6 .077 1.290 100.000
Extraction Method: Principal Component Analysis.
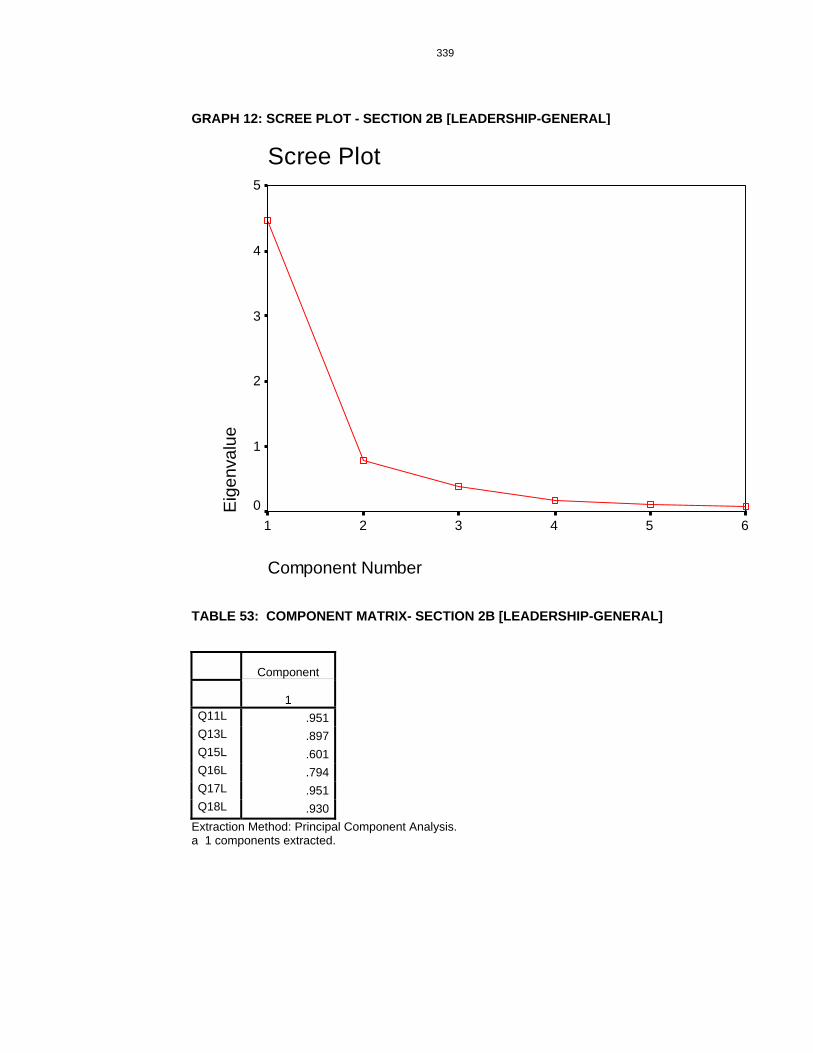
339
GRAPH 12: SCREE PLOT - SECTION 2B [LEADERSHIP-GENERAL]
Scree Plot
Component Number
654321
Eig
enva
lue
5
4
3
2
1
0
TABLE 53: COMPONENT MATRIX- SECTION 2B [LEADERSHIP-GENERAL]
Component
1 Q11L .951Q13L .897Q15L .601Q16L .794Q17L .951Q18L .930
Extraction Method: Principal Component Analysis. a 1 components extracted.

340
TABLE 54: SECTION 2B [ LEADERSHIP-TURBULENCE] Alpha = 0.7711 N (cases) = 130 N(Items) = 2 TABLE 55: DESCRIPTIVE STATISTICS- SECTION 2B [LEADERSHIP-TURBULENCE]
Mean Std.
Deviation Analysis N Q12L 1.84 .607 130Q14L 1.82 .616 130
TABLE 56: TOTAL VARIANCE EXPLAINED- SECTION 2B [LEADERSHIP-TURBULENCE]
Initial Eigenvalues Extraction Sums of Squared Loadings
Component Total % of
Variance Cumulative % Total % of
Variance Cumulative % 1 1.627 81.373 81.373 1.627 81.373 81.3732 .373 18.627 100.000
Extraction Method: Principal Component Analysis.

341
GRAPH 13: SCREE PLOT - SECTION 2B [LEADERSHIP-TURBULENCE]
Scree Plot
Component Number
21
Eig
enva
lue
1.8
1.6
1.4
1.2
1.0
.8
.6
.4
.2
TABLE 57: COMPONENT MATRIX - SECTION 2B [LEADERSHIP-TURBULENCE]
Component
1 Q12L .902 Q14L .902
Extraction Method: Principal Component Analysis. a 1 components extracted.

342
TABLE 58: SECTION 2B [ MEASUREMENT] Alpha = 0.9343 N (cases) = 130 N(Items) = 5 TABLE 59: DESCRIPTIVE STATISTICS- SECTION 2B [ MEASUREMENT]
Mean Std.
Deviation Analysis N Q19M 1.91 .549 130Q20M 1.83 .759 130Q21M 2.41 .679 130Q22M 1.91 .549 130Q23M 1.83 .759 130
TABLE 60: TOTAL VARIANCE EXPLAINED- SECTION 2B [ MEASUREMENT]
Initial Eigenvalues Extraction Sums of Squared Loadings
Component Total % of
Variance Cumulative % Total % of
Variance Cumulative % 1 4.021 80.415 80.415 4.021 80.415 80.4152 .657 13.132 93.546 3 .323 6.454 100.000 4 -1.089E-16 -2.178E-15 100.000 5 -5.223E-16 -1.045E-14 100.000
Extraction Method: Principal Component Analysis.

343
GRAPH 14 : SCREE PLOT- SECTION 2B [ MEASUREMENT]
Scree Plot
Component Number
54321
Eig
enva
lue
5
4
3
2
1
0
-1
TABLE 61: COMPONENT MATRIX- SECTION 2B [MEASUREMENT]
Component
1 Q19M .896Q20M .924Q21M .841Q22M .896Q23M .924
Extraction Method: Principal Component Analysis. a 1 components extracted.

344
TABLE 62 : SECTION 2B [ CUSTOMERS] Alpha = 0.8323 N (cases) = 130 N (Items) = 5 TABLE 63: DESCRIPTIVE STATISTICS- SECTION 2B [CUSTOMERS]
Mean Std.
Deviation Analysis N Q24C 2.21 .407 130Q25C 2.20 .402 130Q26C 2.20 .402 130Q27C 2.20 .402 130Q28C 2.20 .402 130
TABLE 64: TOTAL VARIANCE EXPLAINED- SECTION 2B [CUSTOMERS]
Initial Eigenvalues Extraction Sums of Squared Loadings
Component Total % of
Variance Cumulative % Total % of
Variance Cumulative % 1 3.069 61.385 61.385 3.069 61.385 61.3852 .837 16.744 78.129 3 .565 11.294 89.423 4 .392 7.837 97.260 5 .137 2.740 100.000
Extraction Method: Principal Component Analysis.

345
GRAPH 15: SCREE PLOT - SECTION 2B [ CUSTOMERS]
Scree Plot
Component Number
54321
Eig
enva
lue
3.5
3.0
2.5
2.0
1.5
1.0
.5
0.0
TABLE 65: COMPONENT MATRIX - SECTION 2B [CUSTOMERS]
Component
1 Q24C .526 Q25C .937 Q26C .744 Q27C .841 Q28C .809
Extraction Method: Principal Component Analysis. a 1 components extracted.

346
TABLE 66 : SECTION 2B [ NETWORKS AND SUPPORT SYSTEMS] Alpha = 0.9379 N (cases) = 130 N (Items) = 4 TABLE 67: DESCRIPTIVE STATISTICS- SECTION 2B [NETWORKS AND SUPPORT SYSTEMS]
Mean Std.
Deviation Analysis N Q29N 2.58 .526 130Q30N 2.58 .511 130Q31N 2.58 .511 130Q32N 2.58 .511 130
TABLE 68: TOTAL VARIANCE EXPLAINED- SECTION 2B [NETWORKS AND SUPPORT SYSTEMS]
Initial Eigenvalues Extraction Sums of Squared Loadings
Component Total % of
Variance Cumulative % Total % of
Variance Cumulative % 1 3.380 84.496 84.496 3.380 84.496 84.4962 .359 8.971 93.468 3 .240 6.004 99.472 4 .021 .528 100.000
Extraction Method: Principal Component Analysis.

347
GRAPH 16: SCREE PLOT - SECTION 2B [NETWORKS AND SUPPORT SYSTEMS]
Scree Plot
Component Number
4321
Eig
enva
lue
4
3
2
1
0
TABLE 69: COMPONENT MATRIX- SECTION 2B [NETWORKS AND SUPPORT SYSTEMS]
Component
1 Q29N .952Q30N .979Q31N .879Q32N .861
Extraction Method: Principal Component Analysis. a 1 components extracted.

348
ANNEXURE 14 TABLE 70: ALL PROCESS CLUSTERS [IMPORTANCE] PROCESS CLUSTER MEAN M 2.84 SK 2.81 LT 2.80 LG 2.78 C 2.64 N 2.45 SR 2.30

349
TABLE 71: MEAN AND STANDARD DEVIATION OF RESPONSES FOR EACH PROCESS [IMPORTANCE] Descriptive Statistics
N Mean Std. Deviation Q2.22A 130 3.00 .000 Q2.21A 130 3.00 .000 Q2.18A 130 3.00 .000 Q2.12A 130 3.00 .000 Q2.17A 130 2.90 .301 Q2.20A 130 2.90 .301 Q2.15A 130 2.90 .301 Q2.5A 130 2.90 .301 Q2.1A 130 2.90 .301 Q2.28A 130 2.90 .301 Q2.4A 130 2.80 .402 Q2.7A 130 2.80 .402 Q2.6A 130 2.80 .402 Q2.2A 130 2.80 .402 Q2.16A 130 2.70 .460 Q2.24A 130 2.70 .460 Q2.23A 130 2.70 .460 Q2.3A 130 2.70 .643 Q2.29A 130 2.70 .643 Q2.26A 130 2.60 .492 Q2.13A 130 2.60 .492 Q2.27A 130 2.60 .666 Q2.19A 130 2.60 .666 Q2.11A 130 2.60 .492 Q2.14A 130 2.60 .492 Q2.30A 130 2.60 .492 Q2.9A 130 2.40 .492 Q2.25A 130 2.40 .666 Q2.8A 130 2.30 .460 Q2.31A 130 2.30 .784 Q2.32A 130 2.20 .751 Q2.10A 130 2.20 .751 Valid N (listwise) 130

350
ANNEXURE 15 TABLE 72: ALL PROCESS CLUSTERS [IMPLEMENTATION] PROCESS CLUSTER MEAN N 2.58 SK 2.53 SR 2.29 C 2.20 M 1.97 LG 1.89 LT 1.83

351
TABLE 73: MEAN AND STANDARD DEVIATION OF RESPONSES FOR EACH PROCESS [IMPLEMENTATION] Descriptive Statistics
N Mean Std. Deviation Q6SK 130 2.80 .402 Q5SK 130 2.80 .402 Q4SK 130 2.80 .402 Q7SK 130 2.70 .460 Q30N 130 2.58 .511 Q29N 130 2.58 .526 Q32N 130 2.58 .511 Q31N 130 2.58 .511 Q21M 130 2.41 .679 Q10SR 130 2.31 .463 Q8SR 130 2.30 .460 Q2SK 130 2.30 .784 Q9SR 130 2.28 .449 Q1SK 130 2.22 .760 Q24C 130 2.21 .407 Q28C 130 2.20 .402 Q27C 130 2.20 .402 Q25C 130 2.20 .402 Q26C 130 2.20 .402 Q3SK 130 2.12 .711 Q16L 130 2.11 .696 Q22M 130 1.91 .549 Q19M 130 1.91 .549 Q13L 130 1.88 .659 Q17L 130 1.86 .644 Q15L 130 1.86 .644 Q12L 130 1.84 .607 Q11L 130 1.83 .612 Q23M 130 1.83 .759 Q20M 130 1.83 .759 Q18L 130 1.83 .612 Q14L 130 1.82 .616 Valid N (listwise) 130

352
ANNEXURE 16 TABLE 74: THE IMPORTANCE OF PROCESS CLUSTERS SK 2.81 SR 2.3 LG 2.78 LT 2.8 M 2.84 C 2.64 N 2.45 GRAPH 17: THE IMPORTANCE OF PROCESS CLUSTERS

353
TABLE 75: THE IMPLEMENTATION OF PROCESS CLUSTERS SK 2.53 SR 2.29 LG 1.89 LT 1.83 M 1.97 C 2.2 N 2.58 GRAPH 18: THE IMPLEMENTATION OF PROCESS CLUSTERS
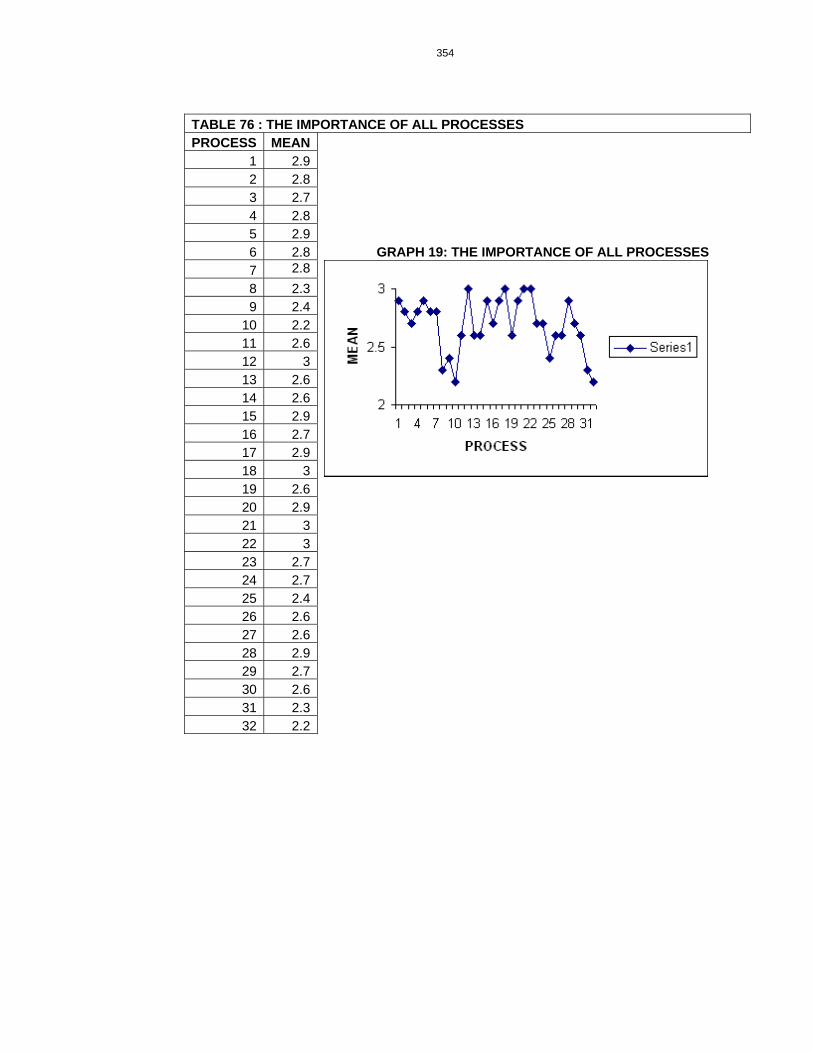
354
TABLE 76 : THE IMPORTANCE OF ALL PROCESSES PROCESS MEAN
1 2.9 2 2.8 3 2.7 4 2.8 5 2.9 6 2.8 GRAPH 19: THE IMPORTANCE OF ALL PROCESSES 7 2.8 8 2.3 9 2.4
10 2.2 11 2.6 12 3 13 2.6 14 2.6 15 2.9 16 2.7 17 2.9 18 3 19 2.6 20 2.9 21 3 22 3 23 2.7 24 2.7 25 2.4 26 2.6 27 2.6 28 2.9 29 2.7 30 2.6 31 2.3 32 2.2

355
TABLE 77: THE IMPLEMENTATION OF ALL PROCESSES PROCESS MEAN
1 2.22 2 2.3 3 2.12 4 2.8 5 2.8
6 2.8 GRAPH 20: THE IMPLEMENTATION OF ALL PROCESSES
7 2.7 8 2.3 9 2.28
10 2.31 11 1.83 12 1.84 13 1.8 14 1.82 15 1.86 16 2.11 17 1.86 18 1.83 19 1.91
20 1.83 21 2.41 22 1.91 23 1.83 24 2.21 25 2.2 26 2.2 27 2.2 28 2.2 29 2.58 30 2.58 31 2.58 32 2.58

356
ANNEXURE 17 TABLE 78: PAIRED SAMPLES TEST [IMPORTANCE VS IMPLEMENTATION]
Paired Differences
95% Confidence Interval of the Difference
Mean Std. Deviation Std. Error
Mean Lower Upper t df Sig. (2-tailed) Pair 1 IMPORTAN -
IMPLEMEN .4757 .44624 .16866 .0630 .8884 2.821 6 .030
TABLE 79 : One-Sample Kolmogorov-Smirnov Test [ IMPORTANCE VS IMPLEMENTATION]
IMPORTAN IMPLEMEN N [process clusters] 7 7
Mean 2.6600 2.1843 Normal Parameters(a,b) Std. Deviation .20936 .30154
Absolute .288 .190 Positive .195 .190
Most Extreme Differences
Negative -.288 -.160 Kolmogorov-Smirnov Z .762 .502 Asymp. Sig. (2-tailed) .606 .962
a Test distribution is Normal. b Calculated from data.

357
ANNEXURE 18 TABLE 80: PAIRED SAMPLES TEST [PROCESS CLUSTERS]
Paired Samples Test
1.9615 3.68825 .32348 1.3215 2.6016 6.064 129 .000.0154 1.04906 .09201 -.1667 .1974 .167 129 .867
5.3308 3.83858 .33667 4.6647 5.9969 15.834 129 .0001.9385 1.09795 .09630 1.7479 2.1290 20.130 129 .0004.3154 2.84492 .24952 3.8217 4.8091 17.295 129 .0002.1923 2.08388 .18277 1.8307 2.5539 11.995 129 .000-.5077 2.61850 .22966 -.9621 -.0533 -2.211 129 .029
SKA - SKBPair 1SRA - SRBPair 2LGA - LGBPair 3LTA - LTBPair 4MA - MBPair 5CA - CBPair 6NA - NBPair 7
MeanStd.
DeviationStd. Error
Mean Lower Upper
95% ConfidenceInterval of the
Difference
Paired Differences
t df Sig. (2-tailed)

358
TABLE 81: KOLMOGOROV-SMIRNOV TEST
One-Sample Kolmogorov-Smirnov Test
130 130 130 130 130 130 130 130 130 130 130 130 130 13019.7000 6.9000 16.7000 5.6000 14.2000 13.2000 9.8000 17.7385 6.8846 11.3692 3.6615 9.8846 11.0077 10.30771.42323 1.30503 1.27377 .49179 .98359 2.09614 2.28035 3.03865 1.16562 3.29937 1.10358 2.96134 1.55766 1.89183
.283 .255 .246 .392 .392 .305 .233 .204 .353 .237 .264 .154 .326 .299
.184 .255 .209 .289 .289 .195 .167 .142 .353 .131 .264 .138 .326 .204-.283 -.146 -.246 -.392 -.392 -.305 -.233 -.204 -.224 -.237 -.197 -.154 -.259 -.2993.232 2.905 2.808 4.469 4.469 3.475 2.653 2.321 4.025 2.706 3.012 1.761 3.714 3.410
.000 .000 .000 .000 .000 .000 .000 .000 .000 .000 .000 .004 .000 .000
NMeanStd. Deviation
Normal Parametersa,b
AbsolutePositiveNegative
Most ExtremeDifferences
Kolmogorov-Smirnov ZAsymp. Sig. (2-tailed)
SKA SRA LGA LTA MA CA NA SKB SRB LGB LTB MB CB NB
Test distribution is Normal.a.
Calculated from data.b.

359
TABLE 82: MEAN, AGGREGATED RESPONSES OF PROCESS CLUSTERS
PROCESS CLUSTER IMPORTANCE IMPLEMENTATION
STAFF-KNOWLEDGE,
MOTIVATION AND
REWARD [SK]
2.81 2.53
STAFF-REWARD [SR] 2.30 2.29
LEADERSHIP-GENERAL
[LG] 2.78 1.89
LEADERSHIP-
TURBULENCE [LT] 2.80 1.83
MEASUREMENT [M] 2.84 1.97
CUSTOMERS [C] 2.64 2.20
NETWORKS AND
SUPPORT SYSTEMS [N] 2.45 2.58
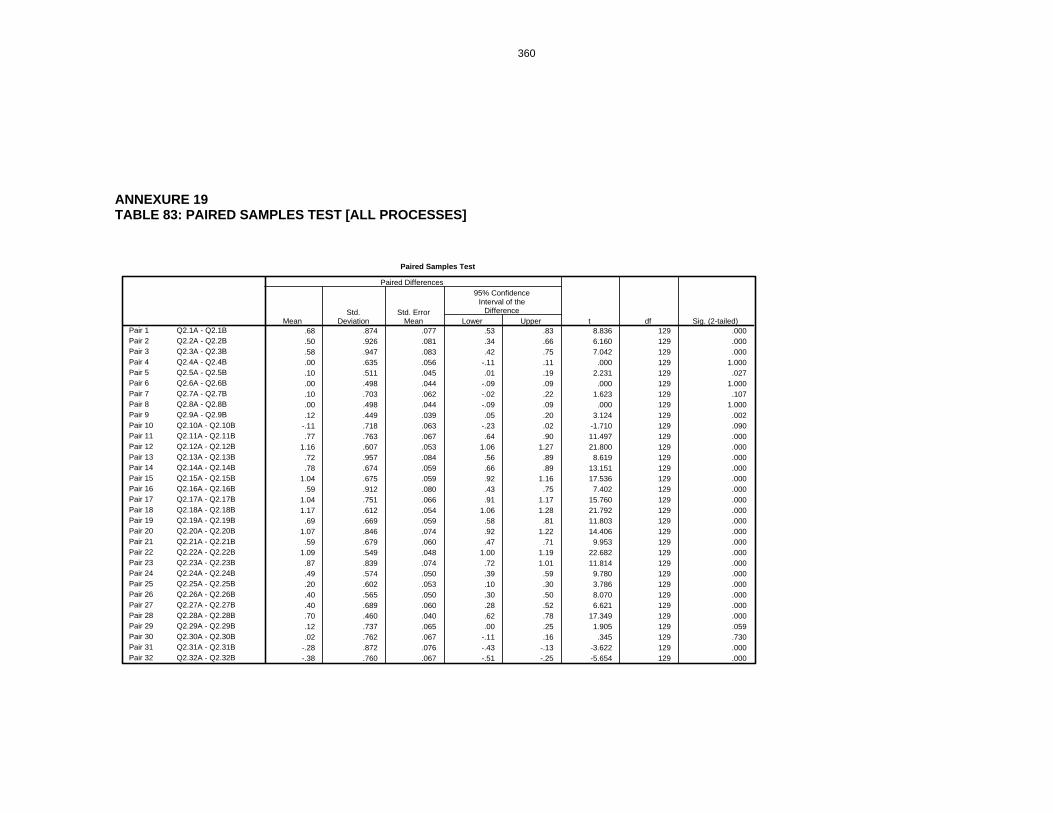
360
ANNEXURE 19 TABLE 83: PAIRED SAMPLES TEST [ALL PROCESSES]
Paired Samples Test
.68 .874 .077 .53 .83 8.836 129 .000
.50 .926 .081 .34 .66 6.160 129 .000
.58 .947 .083 .42 .75 7.042 129 .000
.00 .635 .056 -.11 .11 .000 129 1.000
.10 .511 .045 .01 .19 2.231 129 .027
.00 .498 .044 -.09 .09 .000 129 1.000
.10 .703 .062 -.02 .22 1.623 129 .107
.00 .498 .044 -.09 .09 .000 129 1.000
.12 .449 .039 .05 .20 3.124 129 .002-.11 .718 .063 -.23 .02 -1.710 129 .090.77 .763 .067 .64 .90 11.497 129 .000
1.16 .607 .053 1.06 1.27 21.800 129 .000.72 .957 .084 .56 .89 8.619 129 .000.78 .674 .059 .66 .89 13.151 129 .000
1.04 .675 .059 .92 1.16 17.536 129 .000.59 .912 .080 .43 .75 7.402 129 .000
1.04 .751 .066 .91 1.17 15.760 129 .0001.17 .612 .054 1.06 1.28 21.792 129 .000.69 .669 .059 .58 .81 11.803 129 .000
1.07 .846 .074 .92 1.22 14.406 129 .000.59 .679 .060 .47 .71 9.953 129 .000
1.09 .549 .048 1.00 1.19 22.682 129 .000.87 .839 .074 .72 1.01 11.814 129 .000.49 .574 .050 .39 .59 9.780 129 .000.20 .602 .053 .10 .30 3.786 129 .000.40 .565 .050 .30 .50 8.070 129 .000.40 .689 .060 .28 .52 6.621 129 .000.70 .460 .040 .62 .78 17.349 129 .000.12 .737 .065 .00 .25 1.905 129 .059.02 .762 .067 -.11 .16 .345 129 .730
-.28 .872 .076 -.43 -.13 -3.622 129 .000-.38 .760 .067 -.51 -.25 -5.654 129 .000
Q2.1A - Q2.1BPair 1Q2.2A - Q2.2BPair 2Q2.3A - Q2.3BPair 3Q2.4A - Q2.4BPair 4Q2.5A - Q2.5BPair 5Q2.6A - Q2.6BPair 6Q2.7A - Q2.7BPair 7Q2.8A - Q2.8BPair 8Q2.9A - Q2.9BPair 9Q2.10A - Q2.10BPair 10Q2.11A - Q2.11BPair 11Q2.12A - Q2.12BPair 12Q2.13A - Q2.13BPair 13Q2.14A - Q2.14BPair 14Q2.15A - Q2.15BPair 15Q2.16A - Q2.16BPair 16Q2.17A - Q2.17BPair 17Q2.18A - Q2.18BPair 18Q2.19A - Q2.19BPair 19Q2.20A - Q2.20BPair 20Q2.21A - Q2.21BPair 21Q2.22A - Q2.22BPair 22Q2.23A - Q2.23BPair 23Q2.24A - Q2.24BPair 24Q2.25A - Q2.25BPair 25Q2.26A - Q2.26BPair 26Q2.27A - Q2.27BPair 27Q2.28A - Q2.28BPair 28Q2.29A - Q2.29BPair 29Q2.30A - Q2.30BPair 30Q2.31A - Q2.31BPair 31Q2.32A - Q2.32BPair 32
MeanStd.
DeviationStd. Error
Mean Lower Upper
95% ConfidenceInterval of the
Difference
Paired Differences
t df Sig. (2-tailed)

361

362
ANNEXURE 20: REFERENCES
Abernathy, W.J. and Clark.K.B. 1985. Innovation: mapping the winds of creative
destruction. Research Policy. 14(1):3-22.
Adriechuk,B. 1992. Getting objective about quality. Small Business Reports. 17:28-32.
Adner,R. and Helfat, C. 2003. Corporate effects and dynamic managerial capabilities.
Strategic Management Journal. 24 (10): 1011-1025
Achrol, R.S. 1991. Evolution of the marketing organization: New forms for turbulent
environments. Journal of Marketing. 55 (October): 77 - 93.
Ahire, S.L. and Golhar, D.Y.1996. Quality management in large vs. small firms.
Journal of Small Business Management, 34 (2):1-13.
Aldrich, H., Rosen, B. and Woodward, B.L. 1986. Social behaviour and
entrepreneurial networks. Frontiers of Entrepreneurship Research. 239-240.
Alreck, P.L. and Settle,R.B.1995. The survey research handbook: guidelines and
strategies for conducting a survey. Irwin. Chicago.
Arthurs,J.D. and Busenitz. L.W.2006. Dynamic capabilities and venture
performance:the effects of venture capitalists. Journal of Business Venturing. 21: 195-
215.
Amba-Rao, S.C. and Pendse, D. 1985. Human resources compensation and
maintenance practices. American Journal of Small Business. Fall: 19-29.
Axland, S.1992. Small wonders. Quality Progress. 25(11):29-34.
Babbie, E. 1995. The practice of social research. Boston: Wadsworth.
Babbie, E. 1998. The practice of social research. Belmont: Wadsworth.

363
Babbie, E. and Mouton, J. 1998. The practice of social research. Oxford: University
Press
Baldrige, M.2004 Malcolm Baldrige Quality Criteria. Available from: http://www.quality.nist.gov/ [Accessed 30 April 2004].
Barney, J.B. 1986. Organisational culture: can it be a source of sustained competitive
advantage? Academy of Management Review. 11(3): 656-665
Barney, J.B.1991. Firm resources and sustained competitive advantage. Journal of
Management, 17(1):99-120.
Barron, C. 2000.Brilliant ideas but spectacular flops. Sunday Times Business Times.
April, 9(1).
Beal, R.M. 2000. Competing effectively: environmental scanning, competitive strategy
and organizational performance in small manufacturing firms. Journal of Small
Business Management. 38(1):27-47.
Beaver, G. and Carr, P. 2002. The enterprise culture: understanding a misunderstood
concept. Journal of Strategic Change. 11 (2): 105-113
Beaver,G. and Jennings.P.2005. Competitive advantage and entrepreneurial power.
Journal of Small Business and Enterprise Development. 12 (1) :9-23
Birley, S. 1985. The role of networks in the entrepreneurial process. Journal of
Business Venturing. 1(1): 107-117.
Birley, S. 1986. Succession in the family firm: the inheritor’s view. Journal of Small
Business Management. 24:36-43.
Boone, L. E. and Kurtz, D. L. 1996. Contemporary Business. Florida: The Dryden
Press
Brady, A. 1995. Small is as small does. Journal of Business Strategy. 16(2):44-46.
364
Branzei,O. and Vertinsky,I.2006. Strategic pathways to product innovation capabilities
in SME’s. Journal of Business Venturing. 21: 75-105.
Brink, A. 1997. The marketing perception of grocery store retailers belonging to black
business associations in Gauteng. Pretoria: University of South Africa.
Brooks, I. and Weatherston, J. 1997. The business environment: challenges and
changes. London: Prentice Hall.
Brown.S.L. and Eisenhardt, K.M. 1997.The art of continuous change; linking
complexity theory and time-paced evolution in relentlessly shifting organizations.
Administrative Science Quarterly. 42(1):1-34.
Brown, S.L. and Eisenhardt, K.M. 1998. Competing on the Edge: Strategy as
Structured Chaos. Boston: Harvard Business School Press.
Bryson, J., Wood, P. and Keeble, D. 1993. Business networks, small firm flexibility
and regional development in the U.K. business services. Entrepreneurship and
Regional Development. 5:265-277.
Burgelman, R.A. 1994. Fading memories: a process theory of strategic business exit
in dynamic environments. Administrative Science Quarterly. 39(1): 24-56.
Butler, J. and Hansen,G.S.1991. Network evolution, entrepreneurial success, and
regional development. Entrepreneurship and Regional Development.3:1-16.
Butler, R.1991. Designing organisations: a decision-making perspective. London:
Routledge.
Chae, M. and Hill, J.S. 1997. High versus low formality marketing planning in global
industries:determinants and consequences. Journal of Strategic Marketing.5: 3 - 22.
Chakravarthy, B. 1997. A new strategy framework for coping with turbulence. Sloan
Management Review, Winter: 69 – 82.
365
Chapman, P.1999. Managerial control strategies in small firms. International Small
Business Journal. 17(2):75-82.
Chermack.I. 2005. Studying scenario planning; theory, research suggestions and
hypotheses. Technological Forecasting and Social Change. 72: 59-73
Chittenden, F., Poutziouris, P. and Mukhtar, S. 1998. Small firms and the ISO 9000
approach to quality management. International Small Business Journal. 17(1):73-88.
Cohen, M.A. and Levinthal, D. 1990. Absorptive capacity: a new perspective on
learning and innovation. Administrative Science Quarterly. 35:128-152.
Coake,S.J. and Steed,L.G. 1996. SPSS for windows: analysis without anguish. John
Wiley & Son.
Collis, D.J. 1994 How valuable are organizational capabilities. Strategic Management
Journal. 15:143-152.
Collis, D.J. and Montgomery, C.A.1995 Competing on resources. Harvard Business
Review. 73(4):118-128.
Collis, D.J. and Montgomery, C.A.1998. Creating corporate resources. Harvard
Business Review. 76(3):70-83.
Collis,J. and Hussey,R. 2003. Business research . A practical guide for undergraduate
and postgraduate students. Second edition. Palgrave New York: Macmillan.
Conner, D.R. 1998. Leading at the edge of chaos: How to create the nimble
organization.New York: John Wiley.
Connor, K.R.and Prahalad, C.K.1996. A resource-based theory of the firm: knowledge
versus opportunism.Organisation Science, 7 (5):477-501.
Cooper, D.R. and Emory, C.W.1995. Business research methods. Chicago: Irwin
Cooper, D.R. and Schindler, P.S.1998, Business research methods. Boston: McGraw-
Hill

366
Cronje, G.J., du Toit, G.S., Mol, A.J., van Reenen, M.J. and Motlatla, M.D.C. (eds.).
1997.Introduction to business management. 4th edition. Johannesburg: International
Thomson
Crossan, M.M., White, R.E., Lane, H.W.and Klus, L. 1996. The improvising
organisation; where planning meets opportunity. Organisational Dynamics. 24(2):20-
35.
Crowston, K. 1997. A coordination theory approach to organizational process design.
Organisation Science. 8(2):157-175.
Crowston, K. and Kammerer.E.E.1998. Coordination and collective mind in software
requirements development. IBM Systems Journal. 37(2): 227-245.
Curran, R. and Blackburn, R.A.2001. Researching the small enterprise. London: Sage
Publications
Curteis, H.1997. Entrepreneurship in a growth culture. Long Range Planning.30
(2):267-276
D’Adderio, L. 2001. Crafting the virtual prototype: how firms integrate knowledge and
capabilities across organizational boundaries. Research Policy. 30 (9):1409-1424.
D’Amboise, G. and Muldowney, M. 1995. Management theory for small business:
attempts and requirements. Academy of Management Review. 13(2): 226-240.
D’Aveni, R. 1994. Hypercompetition:managing the dynamics of strategic
maneuvering. New York: Free Press.
Davis, D., Morris, M. and Allen, J. 1991. Perceived environmental turbulence and its
effect on selected entrepreneurship, marketing and organizational characteristics in
industrial firms. Journal of the Academy of Marketing Science. 19(1), Winter: 43 – 51.
D’Souza, D.E and McDougall, P.P.1989. Third world joint venturing; a strategic option
for the smaller firm. Entrepreneurship Theory and Practice. 13: 19-33.

367
Dandridge, T. 1979. Children are not little grown-ups; small business needs its own
organizational theory. Journal of Small Business Management. 17:53-57.
Daneels, E. 2002. The dynamic of product innovation and firm competencies.
Strategic Management Journal. 23(9):1095-1121.
Das, T.K. and Bing-Sheng, T. 1999. Cognitive biases and strategic decision process:
an integrative perspective. Journal of Management Studies. 36:757-779.
Davis,C., Hills,G.and LaForge,R.1995. The marketing/small enterprise paradox :a
research agenda. International Small Business Journal. 3: 31-42.
Davis,D. 2000. Business research for decision making. California: Duxbury.
De Boer, M.F. Van De Bosch,F. and Volberda, H.W. 1999. Managing organizational
knowledge integration in the emerging multimedia complex. Journal of Management
Studies. 36(3):379-418.
De Vos,A.S.2002. Research at grass roots: for the social sciences and human
services professions. Pretoria: Van Schaik
Dessler, G. 1992. Organization theory; Integrating structure and behaviour. Second
edition, Prentice-Hall International Limited, London, UK
Dierickx,I. and Cool,K. 1989. Asset stock accumulation and sustainability of
competitive advantage. Management Science. 35: 1504-1511.
Dodd,S.D.1997. Research note: social network membership and activity rates:some
comparative data. International Small Business Journal.15(4):80-87.
Dodgson,M and Bessant,J.1997.Effectve innovation policy-a new approach. London:
International Thompson Business Press.
368
Dollinger,M. 1984. Environmental boundary spanning and information processing
effects on organizational performance. Academy of Management Journal. 27(2):351-
368.
Dollinger,M. 1984. Environmental boundary spanning and information processing
effects on organizational performance. Academy of Management Journal. 27(2):351-
368.
Donckels,R. and Lambrecht,J. 1995. Networks and small business growth:an
explanatory model. Small Business Economics. 7:273-289.
Drozdow,N. and Carrol,V.P. 1997. Tools for strategy development in family firms.
Sloan Management Review. 39(1):75-88.
Dubin, R. Theory Building. Revised ed. Free Press/MacMillan,New York,1978.
Durrheim, K. and Terrblanche, M. 2002. Research in practice:applied methods for the
social sciences. Cape Town: University of Cape Town.
Dutta, S., Narasimhan,O. and Rajiv,S. 2005. Conceptualizing and measuring
capabilities:methodology and empirical application. Strategic Management Journal.
26: 277-285.
Dyer,W,G.1988. Culture and continuity in family firms. Family Business Review. 1:37-
50.
Ebrahimpour, M. and Withers,B.E.1992. Employee involvement in quality
improvement: a comparison of American and Japanese manufacturing firms operating
in the U.S. IEEE Transactions on Engineering Management. 39(2): 142-148.
Eisenhardt,K.M.1999. Strategy as strategic decision making. Sloan Management
Review. Spring: 65-72.
Eisenhardt,K.M. and Brown,S. 1999. Patching:restitching business portfolios in
dynamic markets. Harvard Business Review. 77:72-82.

369
Eisenhardt, K.M. and Martin, J.A.2000. Dynamic capabilities: What are they? Strategic
Management Journal, 21:1105-1121
Eisenhardt,K.M. and Galunic,C. 2000. Coevolving. At last a way to make synergies
work. Harvard Business Review. January-February. 91- 101.
Eisenhardt ,K.M. and Sull,D. 2001. Strategy as simple rules. Harvard Business
Review. January. 107-116
Eisenhardt,K.M. and Tabrizi,B.1995. Accelerating adaptive processes:product
innovation in the global computer industry. Administrative Science Quarterly. 40(1):84-
110.
Eisenhardt,K.M. and Zbaracki,M.J. 1992. Strategic decision making. Strategic
Management Journal. 13:17-37.
Emery, F.E. and Trist, E.L. 1965. The causal texture of organizational rnvironments,
Human Relations. 12(3): 21 – 32.
Fann, G.L. and Smeltzer,L.R.1989. The use of information from and about
competitors in small business management. Entrepreneurship Theory and Practice.
Summer:35-46.
Fowler,S., King,A.,Marsh,S.J. and Victor,B. 2000. Beyond products: new strategic
imperatives for developing competencies in dynamic environments. Journal of
Engineering and Technology Management. 17 :357-377.
Fuller,P.B.1994. Assessing marketing in small and medium-sized enterprises.
European Journal of Marketing. 28(12):34-49.
Galunic,D.C.and Eisenhardt,K.M. 2001. Architectural innovation and modular
corporate forms. Academy of Management Journal. 44(6):1229-1249.
Galunic,D.C. and Rodan,S. 1998. Resource recombinations in the form:knowledge
structures and the potential for Schumpeterian innovation. Strategic Management
Journal. 19: 1193-1201.
370
Garud, R. and Nayyar, P.R. 1994. Transformative capacity:continual structuring by
inter-temporal technology transfer. Strategic Management Journal. 15(6):365-386.
Ghobadian,A. and Gallear,D.N. 1996. Total quality management in SMEs. Omega.
24(1): 83-106.
Gibb,A.A.1993. Key factors in the design of policy support for the small and medium
enterprise development process ; an overview. Entrepreneurship and Regional
Development. 7:1-24.
Goh,P.L. and Ridgeway,K. 1994. The implementation of total quality management in
small and medium-sized manufacturing companies. TQM Magazine. 6(2):54-60.
Goss, D. and Jones, R. 199. `Organisation structure and small firm training provision',
InternationalSmall Business Journal. 10(4): 13-25.
Granovetter,M. 1985. Economic action and social structure:the problem of
embeddedness. American Journal of Sociology. 91(3):481-510.
Grant, R. 1991. The resource-based theory of competitive advantage: implications for
strategy formulation. California Management Review. Spring. 114-135.
Grant,R. 1996. Toward a knowledge based theory of the firm. Strategic Management
Journal. 17:109-122.
Guilhon,A., Martin,J. and Weill,M. 1998. Quality approaches in small or medium sized
enterprises:methodology and survey results. Total Quality Management. 9(8):689-
701.
Haleblian, J. and Finkelstein, S. 1993. Top management team size, CEO dominance,
and firm performance: The moderating roles of environmental turbulence and
discretion. Academy of Management Journal. 36(4): 844 – 863.
Hamel,G. 1997. Killer strategies. Fortune. 135(12);70-79.
Hamel,G.1995. Thinking differently. Business Quarterly. 59(4):22-30
371
Hart, S.L. 1992. An integrative framework for strategy-making processes. Academy of
Management Review. 17:327-351.
Hart,S.L. and Banbury, C. 1994. How strategy-making processes can make a
difference. Strategic Management Journal. 15:251-269.
Hausman, A. 2005. Innovativeness among small businesses: theory and propositions
for future research. Industrial Marketing Management. 34:773-782.
Haveman,H.A.1993.Ghosts of managers past: managerial succession and
organizational mortality. Academy of Management Journal.36:864-881.
Hayes, R.H., Wheelwright,S.C. and Clark,K.B. 1988. Dynamic manufacturing-creating
the learning organization. New York: The Free Press.
Helfat, C. and Peteraf. M. 2003. The dynamic resource-based view: capability life-
cycles. Strategic Management Journal.24: 997-1010.
Helfat,C. and Raubitschek. 2000. Product sequencing:co-evolution of
knowledge,capabilities and products. Strategic Management Journal. 21:961-979.
Henderson, R. and Cockburn, I.1994. Measuring competence? Exploring firm effects
in pharmaceutical research. Strategic Management Journal. Winter Special Issue.
15:63-84.
Henderson,J.C.and Clark,H. 1990. Architectural innovation. Administrative Science
Quarterly. 35:9-30.
Hendry, C., Jones, A. and Arthur, M. 1991. “Skill, supply, training and development in
the small-medium enterprise'. International Small Business Journal. 10(1): 68-72.
Hendry,C.,Jones,A.,Arthur,M and Pettigrew,C. 1991. Human resource development in
small to medium-sized enterprises. Warwick Business School, Resource Paper no.
88.

372
Henning,E. 2004. Finding you way in qualitative research. Hatfield.Van Schalks.
Hewitt-Dundas,N.,McFerran,B. and Roper,S. 1997. Competitor knowledge among
small firms:a pilot examination of fast growing Northern Ireland companies.
International Small Business
Hills,G.E and Narayana,C.L. 1989. Profile characteristics, success factors and
marketing in highly successful firms. Frontiers of Entrepreneurship Research. 354-362
Hills,G.E.,LaForge,R.W. and Parker,B.J. Chicago: The University of Illinois at Chicago
Press. 411-424.
Hitt,M.A.,Hoskisson,R.E and Harrison,J.S.1991. Strategic competitiveness in the
1990’s:challenges and opportunities for U.S executives. Academy of Management
Executive. 5 (2):7-22.
Holbeche,L. 1997. Career development in flatter structures. Rodney Park
Management Institute. Horsham
Holmlund,M. and Kock.S.1998. Relationships and the internationalization of Finnish
small and medium sized companies. International Small Business Journal. 16:46-63.
Hornsby,J.S. and Kuratko,D.K.1990. Human resource management in small business:
critical issues for the 1990’s. Journal of Small Business Management. July : 9-18.
Hudson,J. and Darrol,C.2003. Rather than support SMEs, remove their barriers.
Business Day.Available from :
http://www.businessday.co.za/articles/TarkArticle.aspx?ID=816288 [Accessed 10 May
2004].
Hudson,M., Smart,A. and Bourne,M. 2001. Theory and practice in SME performance
management systems. International Journal of Operations and Production
Management. 21 (8) :1096-1115.
Hurley, R.F. and Hult,T.M. 1998. Innovation, market orientation and organizational
learning: an integration and empirical examination. Journal of Marketing. 63(3):42-54.

373
Iansiti,M. and Clark,K.B.1994.Integration and dynamic change capability:evidence
from roduct development in automobiles and mainframe computers. Industrial and
Corporate Change. 3 (3): 557-605.
Itami, H. and Roehl,T.W. 1987. Mobilising invisible assets. Cambridge: Harvard
University Press.
Ivanova, E and Gibcus, P.2003 The decisionmaking entrepreneur. A literature review. SCALES Paper.N200219.
Jansen,J.P.,Van den Bosch,F.A.J. and Volberda,H.W. 2005. Exploratory innovation,
exploitative innovation, and ambidexterity: the impact of environmental and
organisational antecedents. Schmalenbach Business Review. 57 (4) :351-363.
Jarillo,J.C.1988. On strategic networks. Strategic Management Journal. 9:31-41.
Jaworski,B.J. and Kohli,A. 1993. Market orientation: antecedents and consequences.
Journal of Marketing. 57:53-70
Johannisson,B. 1990. Economics of overview-guiding the external growth of small
firms. International Small Business Journal. 9(1):32-44.
Johnson, G. & Scholes, K. 1999. Exploring corporate strategy. Fifth Edition, Prentice
Hall Europe, Hemel Hempstead, UK
Joyce,P., Wooles,A. and Blacks,S.1995. Networks and partnerships;managing
change and competition. Small Business and Enterprise Development. 2(1): 11-18.
Keane,R. Niemeyer,S. and Miller,M. 1996. Competitive Strategies in the craft product
retailing industry. Journal of Small Business Management. 34(1). 13-23.
Keats, B.W.and Bracker,J.S.1988. Toward a theory of small firm performance:a
conceptual model. American Journal of Small Business. Spring: 41-58

374
Kerr,A. and McDougall,M. 1999. The small business of developing people.
International Small Business Journal. 17(2):65-74.
Kim,L. Crisis construction and organizational learning;capability building in catching-
up at Hyundai Motors. Organisation Science. 9(4): 506-521.
King, G., Keohane, F.O. and Verba,S. 1994. Designing social enquiry: scientific
inference in qualitative research. New Jersey: Princeton University Press
King,A. and Tucci,C. 2002. Incumbent entry into new market niches:the role of
experience and managerial choice in the creation of dynamic capabilities.
Management Science. 48(2): 171-186.
Kinra, N. 1995. Strategic dimensions in marketing planning: large versus
small/medium companies in the Indian television market. Marketing Intelligence &
Planning. 13(4):34-44.
Kinsey,J. 1987. The marketing/entrepreneurship interface in manufacturing firms in
Scotand in Kogut,B. and Zander,U. 1992. Knowledge of the firm, combinative
capabilities and the replication of technology. Organisational Science. 3(3):383-397.
Knudsen,T.and Madsen,T.K. 2002. Export strategy: a dynamic capabilities
perspective. Scandinavian Journal of Management. 18:175-502.
Kogut,B. and Zander,U. 1996. What firms do? Coordination, identity and learning.
Organisation Science. 7(5):502-518.
Kohli, A.K. and Jaworski,B.J. 1990. Market orientation:the construct,research
propositions and managerial implications. Journal of Marketing. 54:1-18
Korman,A.K. 1970. Toward a hypothesis of work behaviour. Journal of Applied
Psychology. 54(1):31-44.
Kozan,M.K., Oksoy,D.and Ozsoy,O. 2006. Growth plans of small businesses in
turkey:individual and environmental influences. Journal of Small Business
Management. 44 (1):114-130.

375
Kylaheiko,K., Sandstrom,J. and Virkkunen,V. 2002. Dynamic capability view in terms
of real options. International Journal of Production Economics. 80:65-83.
Lane, D. and Maxfield, R. 1996. Strategy under complexity: Fostering generative
relationships. Long Range Planning. 29(2): 215 - 231.
Lansberg,I.S.1988. The succession conspiracy. Family Business Review. 1:119-143.
Lee,G.L. and Oakes,I. 1995. The “pros” and “cons” of TQM for small firms in
manufacturing:some experiences down the supply chain. Total Quality Management
.6(4):413-426.
Lengnick-Hall,C.A and Wolff,J.A. 1999 Similarities and contradictions in the core logic
of three strategy research streams. Strategic Management Journal. 20(12):1109-
1132.
Lichtenstein,J.H. 1998. Factors affecting pension and health benefits availability in
small and large business. Benefits Quarterly.14(1):55-61.
Ligthelm,A.A.and Cant,M.C.2002. Business success factors of SMEs in Gauteng.
Pretoria: University of South Africa
Longenecker,J. and Moore, C. 1987. Small Business Management. Cincinnati: South-
Western Publishing Company.
Longenecker,J.G and Schoen,J.E.1978. Management succession in the family
business. Journal of Small Business Management. 16:1-16.
Lopez,V.L. 2005. Competitive advantage and strategy formulation. Management
Decision.43 (5):661-669.
Lumpkin,G.T. and Dess,G.G. 1995. Simplicity as a strategy-making process: the
effects of stage of organizational development and environment on performance.
Academy of Management Journal. 38:1386-1407.

376
Lynham, S. A. (2002). The general method of theory-building research in applied
disciplines. Advances in Developing Human Resources. 4(3) : 221-241.
Lynham,S.and Chermack, T. 2006. Responsible leadership for performance: A
theoretical model and hypotheses. Journal of Leadership and Organisational Studies.
12.(4) : 73-87.
Makadok, R.2001. Toward a syntheses of the resource-based and dynamic capability
views of rent creation. Strategic Management Journal, 22, 5:487-505.
Malhotra,N.K.1996. Marketing Research: an applied orientation. New Jersey: Prentis
Hall International, Inc.
Malhotra, Y. 1993. Role of information technology in managing organizational change
and organizational interdependence.
Available from: www.brint.com/papers/change
[Accessed 12 March 1998].
Malone,M. 2004. The small business ego trap. Business Horizons. 47 (4):17-22
Malone,T. and Crowston, K. 1994. The interdisciplinary study of coordination. ACM
Computing Surveys. 26(1):87-119.
Marshall, J. N., Alderman, N., Wong, C. and Thwaites, A. 1995 `The impact of
management training and development in small and medium-sized enterprises'.
International Small Business Journal. 13(4): 73-90.
Mathis,R.L. and Jackson,J.H. 1991. Personnel/human resource management. St.
Paul: West Publishing Company.
Mazzarol, T. 2003. A model of small business HR Growth management. International
Journal of Entrepreneurial Behaviour and Research. 9 (1): 27-49.
McAdam,R. and McKeown,M.1999. Life after ISO 9000: an analysis of the impact of
ISO 9000 and total quality management on small businesses in Northern Ireland.
Total Quality Management. 10(2):229-241.

377
McDaniel,S.W and Parasuraman,A. 1985. Small business experience with and
attitudes towards formal marketing research. American Journal of Small Business.
9(4):1-5.
McEvoy,G.M. 1984. Small business personnel practices. Journal of Small Business
Management. October:1-8.
Miller,D.1996. Configurations revisisted. Strategic Management Journal. 17 (7) July:
505-512.
Miller,L.E.and Simmons,K.A.1992 Differences in management practices of founding
and nonfounding chief executives of human service organizations. Entrepreneurship
Theory and Practice. 16:31-39.
Mintzberg,H.1984. Power and organisation life cycles. Academy of Management
Review. 9: 207-224.
Mintzberg, H. & Quinn, J.B. (1992): The strategy process; concepts and contexts,
Prentice-Hall International Editions, Englewood Cliffs, NJ, USA
Mohan-Neil,S.I.1995. The influence of firm’s age and size on its environmental
scanning activities. Journal of Small Business Management. 33(4):10-21.
Mouton, J. and Marais, H.J.1996. Basic concepts in the methodology of social
sciences. Pretoria: Van Schaik
Mouton, J.2001. How to succeed in your master’s and doctoral studies : a South
African guide and resource book. Pretoria: Van Schaik
Neely, A. and Hii, J. (1998) Innovation and Business Performance: A Literature
Review. Cambridge, The Judge Institute of Management Studies.
Neely,A., Mills,J. Platts,K., Gregory,M. and Richards,H.1994. Realising strategy
through measurement. International Journal of Operations & Production
Management.14(3):140-152.

378
Nelson,R.R AND Winter,S.G. 1982. An evolutionary theory of economic change.
Cambridge: Bellknap Press
Neumann, W. 2000. Social research methods. Qualitative and quantitative
approaches. Needham Heights. Allyn and Bacon.
Nilson, T.H. 1995. Chaos marketing: How to win in a turbulent world. London:
McGraw-Hill.
Norburn,D. and Birley,S.1988. The top management team and corporate
performance. Strategic Management Journal. 9: 225-238.
Norusis,M.J. 1995. SPSS 6.1.Guide to data analysis. Engelwood Cliffs, New Jersey:
Prentiss-Hall.
O’Gorman,C.,Bourke,S. and Murray,J.A.2005. The nature of managerial work in
small growth – oriented businesses. Small Business Economics. 25: 1-16.
Okhuysen,G.A and Eisenhardt,K.M. 2002. Integrating knowledge in groups;how
formal interventions enable flexibility. Organisation Science. 13(4): 370-386.
O’Regan,N. and Ghobadian,A. 2005. Innovation in SMEs: the impact of strategic
orientation and environmental perceptions. International Journal of Productivity and
Performance Management. 54 ( 1/2 ): 81-98.
Orlikowski,W. 2002. Knowing in practice;enacting a collective capability in distributed
organizing. Organisation Science. 13(3): 249-273.
Ostgaard,T.A and Birley,S. 1996. New venture growth and personal networks. Journal
of Business Research. 36(1):37-50.
Parker,B.J. Chicago: The University of Illinois at Chicago Press. 232-246.
Pascale, R.T. 1999. Surfing the edge of chaos. Sloan Management Review. Spring:
83 - 94.

379
Pelham,A.M. and Clayson,D.E.1988. Receptivity to strategic planning tools in small
manufacturing firms. Journal of Small Business Management. 26(1):43-50.
Penrose, E.T.1959. The theory of the growth of the firm. New York: Wiley:
Penzer,E. 1991. Big ideas come in small packages. Incentive. 165(6):34-39
Pine II, B.J., Victor, B. and Boynton, A.L. 1993. Making mass customization work.
Harvard Business Review. September – October: 108 - 119.
Pineda,R.C.,Lerner,L.D.,Miller,M.C. and Phillips,S.J.1998. An investigation of factors
affecting the information-search activities of small business managers. Journal of
Small Business Management.36(1):60-71.
Pisano,G. 1994. Knowledge,integration and the locus of learning;an empirical analysis
of process development. Strategic Management Journal.15:85-100.
Porter, M.1996. What is strategy? Harvard Business Review. 74(6):61-78.
Porter,M. 1980. Competitive strategy. New York: Free Press
Powell,L.2002. Shedding a tier: flattening organizational structures and employee
empowerment. The International Journal of Management Education. 16(1):54-59
Prahalad,C. and Ramaswamy,V.2004. The future of competition. Cambridge: Harvard
Business School Press.
Prahalad,C.K.and Hamel,G.1990. The core competence of the corporation. Harvard
Business Review. 68(3):79-91.
Prism guide to interpreting statistical results. Available from :
http://graphpad.com/articles/interopret/analyzing_two_groups/paired_t.htm
[ Accessed on 15 October 2005].
Raff,D.M.2000 Superstores and the evolution of firm capabilities in American
bookselling.Strategic Management Journal. 21 : 1043-1060

380
Raymond,L.,Bergeron,F. and Rivard,S. 1998. Determinants of business process
reengineering success in small and large enterprises: an empirical study in the
Canadian context. Journal of Small Business Managament. 36(1):72-85.
Recklies,D. 2001. Strategy in turbulent times. Available from
:http://www.themanager.org/Strategy/strategy.htm [Accessed 10 November 2005]
Reeves, C. and Hoy,F. 1993. Employee perceptions of management commitment and
customer evaluations of quality service in independent firms. Journal of Small
Business Management. 31(14): 52-59.
Reiland,R.1999. Hey , government, lettuce alone. Restaurant Hospitality. 83(1): 18.
RSA,1995. Republic of South Africa. National Drug Policy. Available from :
http://www.doh.gov.za/docs/policy/drugsjan1996.pdf [ Accessed on 3 March 2004]
RSA,1995. Republic of South Africa. Parliament. White Paper on National Strategy
for the Development and Promotion of Small Businesses in South Africa. Cape Town:
Government Printer
RSA, 2003. Republic of South Africa. National Small Business Amendment Bill.
Available from:http://www.info.gov.za/gazette/bills/2003/b20-03.pdf [ Accessed on 5
November 2004].
Rindova, V. and Taylor, S. 2002. Dynamic capabilities as macro and micro
organizational evolution. Smith Papers Online.
Available
from:http://bmgt3notes.umd.edu/faculty/km/papers.nsf/0/012076bd4a9b08a385256d0
c00651a8 [Accessed 14 November 2005]
Robinson,R.B. and Pearce,J. 1984. Research thrusts in small firm strategic planning.
Academy of Management Review. 25:80-93
Roper,S.,Hewitt-Dundass,N. and McFerran,B. 1997. Disparities in quality perceptions
between small firms and their customers. Small Business Journal. 15(4): 64-79.

381
SA,2004. S.A. Global Entrepreneurship Monitor, 2004. Available
from:http://www.gsb.uct.ac.za/gsbwebb/default.asp?intpagenr=228 [ Accessed 30
October,2005].
Sadler, P. 1996. Managing change, Kogan Page Limited, London, UK
Samli, A.C. 1993. Counterturbulence marketing: A proactive strategy for volatile
economic times. Westport: Quorum Books.
SBA (Small Business Administration). 2004. What is a small business ? Available
from :http://sba.gov/businessop/standards/smallbus.htm [Accessed on 5 November
2004].
Schumpeter, J.A.1394. The theory of economic development. Cambridge: Harvard
University Press.
Schultz,M. 2003. Pathways of relevance:emploring inflows of knowledge into subunits of multinational corporations. Organisational Science. 14(4):440-459.
Schwartz,C. 1994. Mentoring:developing leadership for the future. Fund Raising
Management. 25(8):56-58.
Scott, P.,Jones,B.,Bramley,A. and Bolton,B. 1996. Enhancing technology and skills in
small and medium sized manufacturing firms:problems and prospects. International
Small Business Journal. 14(3):85-99.
Scully, J.I. and Fawcett,S.E.1994. International procurement strategies:challenges
and opportunities for the small firm. Production & Inventory Management Journal.
35(2): 39-46.
Seigel,A.F.1994. Practical business statistics. Burr Ridge, Illinois: Irwin
Sekulie,V. 2002. The importance of corporate strategic processes in managing
efficiency of enterprise. Economics and Organisation. 1. (10 ) :67-74

382
Sekaran,U. 1992. Research methods in business:a skill building approach. New
York:Wiley.
Sexton,D.L. and Smilor,R.W. 1997. Entrepreneurship: 2000. Chicago: Upstart
Publishing Company.
Seymour,K.C.1993. Intergenerational relationships in the family firm: the effect on
leadership succession. Family Business Review. 6:263-281.
Shan,W. 1990. An empirical analysis of organizational strategies by entrepreneurial
high-technology firms. Strategic Management Journal. 11:129-139.
Shin,D., Kalinowski,J.G. and El-Enein,G.A.1998.Critical implementation issues in total
quality management. SAM Advanced Management Journal, 63(1):10-14
Simonim,B.L.1999. Ambiguity and the process of knowledge transfer in strategic
alliances. Strategic Management Journal,20 (7):595-623.
Sinkula, J.M. 1994. Market information processing and organizational learning.
Journal of marketing. 58:35-45
Sisson, K. and Storey, J. 1988. `Developing effective managers: A review of the
issues and an agenda for research'. Personnel Review. 17(4): 3-8.
Skinner,W.1971. The anachronistic factory. Harvard Business Review. January-
February:61-70.
Slater,S. and Narver,J. 1995. Market orientation and the learning organization.
Journal of Marketing. 59:63-74.
Smeltzer,L.R., Fann,G.L.and Nikoliasen,V.N.1988. Environmentalscanning practices
in small business. Journal of Small Busness Management. 26:55-62.
Smith, M.F., Sinha, I., Lancioni, R. and Forman, H. 1999. Role of market turbulence in
shaping pricing strategy. Industrial Marketing Management. 28: 637 - 649.

383
Snyman, J.H. and Drew, D.V. 2003. Complex strategic decision processes and firm
performance in a hypercompetitive industry. Journal of American Academy of
Business. 2(2)293-298
Specht,P.H.1987. Information sources used for strategic planning decisions in small
firms. American Journal of Small Business. Spring. 11(4):21-34.
Spitzer,D.M., Hills,G.E. and Alpar,P. 1989. Marketing planning and research among
high technology entrepreneurs in Research at the marketing/entrepreneurship
interface, ed.
Stacey,R.D.1992. Managing the unknowable:strategic boundaries between order and
chaos in organizations. San Francisco:Jossey-Bass Inc.,Publishers.
Stanworth, J. and Gray, C.1991 Bolton 20 years on: The small firm in the 1990s. Paul
Chapman, London.
Stephenson, K.A. 2006. Factors constraining the growth and survival of small scale
businesses. A developing countries analysis. Journal of American Academy of
Business. 8 (2):167-179.
Sunter,C.2000.The entrepreneur’s fieldbook. Upper Saddle River,NJ: Prentice Hall
Swamy, D.R.and Balaji, A.V.2006. A comparative study of human resource practices
and advanced technology adoption of SME’s with and without ISO certification.
Singapore Management Review. 28 (1):41-61.
Szarka,J. 1990. Networking and small firms. International Small Business
Journal.8(2):10-22.
Szeinbach,S.L.L. and Barnes,J.H. 1995. The changing retail environment:its
influence on professionalism in chain and independently owned pharmacies. Journal
of Applied Business Research. 11(1).
Teece,D.J. and Pisano,G. 1994. The dynamic capabilities of firms: an introduction.
Industry and Corporate Change. 3(3):537-556

384
Teece, D.J., Pisano,G. and Shuen,A. 1997. Dynamic capabilities and strategic
management. Strategic Management Journal. 18(7):509-533.
Tetenbaum, T.J. 1998. Shifting paradigms: From Newton to chaos. Organizational
Dynamics, Spring: 21 - 32.
Thorelli,H.B. 1986. Networks:between markets and hierarchies. Strategic
Management Journal.7:37-51.
Tsai, W. 2001. Knowledge transfer in intra-organisational networks:effects of network
position and absorptive capacity on business unit innovation and performance.
Academy of Management Journal. 44:996-1004.
University of Newcastle upon Tyne. How to perform and interpret t tests. Available
from: http://www.ncl.ac.uk/iss/statistics/docs/ttests.html
[Accessed on : 15 October 2005]
University of Strathclyde.2006. Small and Medium Enterprises; Definitions. Available from : http//www. Small and Medium Sized Enterprises Definitions - University of Strathclyde Library.htm
Uzzi, B. 1996. The sources and consequences of embeddedness for the economic
performance of organization:the network effect. American Sociological Review.
61:674-98.
Van den Bosch,F., Volberda,H. and De Boer,M. 1999. Co-evolution of firm absorptive
capacity and knowledge environment:organizational forms and combinative
capabilities. Organisation Science. 10;551-568.
Van Horn,M.1990. Market –entry approaches for the Pacific Rim. Journal of Business
Strategy. 11:14-19.
Velasquez G, and Boulet P. 1999. Globalization and Access to Drugs: Perspectives
on the WTO/TRIPS Agreement (Revised). Geneva, World Health Organization.
WHO/DAP/98.9.
385
Vickerstaff, S. 1992 `The training needs of small firms'. Human Resource
Management Journal. 2(3): 1-15.
Volberda, H.W. 1997. Building flexible organizations for fast-moving markets. Long
Range Planning, 30(2): 169 - 183.
Vorhies, D.W. 1998. An investigation of the factors leading to the development of
marketing
capabilities and organizational effectiveness. Journal of Strategic Marketing, 6: 3 – 23.
Vyakarnam,S., Bailey,A.,Myers,A. and Burnett,D. 1997. Towards an understanding of
ethical behaviour in small firms. Journal of Business Ethics. 16(15):1625-1636.
Webster,B., Walker,E. and Brown,A. Australian small business participation in training
activities. Education and Training. 47 ( 8/9):552-561.
Weick,K.E. and Roberts,K.H. 1993.Collective mind in organisations :heedful
interrelating on flight decks. Administrative Science Quarterly. 38(3):357-381.
Welsch,J.W.and While,J.E.1981. A small business is not a little big business. Harvard
Business Review. 59 (4): 18-32
Wernerfelt, B.1995.The resource-based view of the firm: ten years after. Strategic
Management Journal. 16 (3):171-174
Wernerfelt,B. 1984. A resource-based view of the firm. Strategic Management
Journal. 5 (2):171-180.
White,D.A and Wilson,T.D.1988. Information needs in industry:a case study approach.
CRUS Occasional Paper No. 16, University of Sheffield.
White,D.A.1986. Information use and needs in manufacturing
organizations:organizational factors in information behaviour. International Journal of
Information Management. 6:157-170.

386
WHO,1997. World Health Organization, Action Pro-gramme on Essential Drugs.
Health re-form and drug financing: an overview of ex-periences, options, and priorities
for action.Geneva.WHO/DAP/MAC(9)/97.7.
Wiarda,E.A and Luria,D.D. 1998. The best-practice company and other benchmarking
myths. Quality Progress. 31(2): 91-94.
Wiklund,J. and Shepherd,D. 2005. Entrepreneurial orientation and small business
performance: a configurational approach. Journal of Business Venturing. 20;71-91.
Wilkes,N. and Dale,B.G. 1998. Attitudes to self-assessment and quality awards: a
study in small and medium sized companies. Total Quality Management, 9(8):731-739
Wilkinson,W. 1999. Employment relations in SME’s . Employee Relations.l 21. (3):
206-217.
Williamson, O.E.1985. The economic institutions of capitalism. New York: Free Press.
Winter, S. 2003. Understanding dynamic capabilities. Strategic Management Journal.
24 (10):991-995.
Wu, L. 2005. Resources, dynamic capabilities and performance in a dynamic
environment: perceptions in Taiwanese IT enterprises. Information & Management [In
press. Available online at Elsevier , www.sciencedirect.com. Accessed in March 2006]
Zahra,S.A. and George,G. 2002. Absorptive capacity:a review, reconceptualisation
and extension. Academy of Management Review. 27(2):185-203
Zander,U. and Kogut, B. 1995. Knowledge and the speed of transfer and imitation of
organizational capabilities. Organisation Science. 6(1): 76-92.
Zikmund, W.G. 2003. Business research methods. Ohio: South-West Publishers
Zollo, M. and Winter, S.G. 1999. From organizational routines to dynamic capabilities.
INSEAD R&D Working Papers: 99/48/SM.

387
Zollo,M. and Winter,S.G.2002. Deliberate learning and the evolution of dynamic
capabilities. Organisation Science. 13:339-351.
Zott,C. 2003. Dynamic capabilities and the emergence of intra-industry differential firm
performance;insights from a simulation study. Strategic Management Journal. 24 :97-
125.