the strategic role of human capital management
TRANSCRIPT

© 2018 DISTRICT MANAGEMENT GROUP
The Strategic Role of Human Capital Management
2019 Leadership Development MeetingApril 25, 2019


4
Many efforts for reform and strengthening educators have been initiated over the years.
Source: RAND study: Teacher Evaluation: A Study of Effective Practices (Wise, Darling-Hammond, McLaughlin, & Bernstein, 1984)
“Mastery Teaching”• Emphasis on clinical
supervision
• Focus on teaching quality
• Lesson quality
• Developmental / Reflective
Pre-1980s 1980s – 90s
“Teacher Quality”• Strengthen principals’ resolve and
competence to evaluate teachers
• “Top-level commitment to and resource for evaluation outweigh checklists and procedures”
• Overcome teacher resistance to feedback
• Create uniform evaluation practices
• Train evaluators
• Danielson Model (1996): a dynamic process and model with four levels of performance (unsatisfactory, basic, proficient, and distinguished). Classroom domains
2000s 2010s 2015 and beyond
“Teacher Effectiveness”• Linking teacher evaluation and
student learning
• Teaching overly focused on credentials rather than instructional effectiveness and student achievement
• Backlash to teacher evaluation
• NCLB teacher quality requirements largely ignored by states – just 14 states required annual teacher evaluations
• “Widget Effect”
“Performance Management”• Race to the Top: “Great Teachers
and Leaders” system
• Evaluate all teachers and principals 1X/year+
• Multiple levels of effectiveness in multiple categories
• Use teacher evaluation results to inform key personnel decisions
• Performance pay
• Reward top teachers and weed out poor teachers à doesn’t work
• Gates Foundation invested heavily, but RAND study found no correlation to higher teacher quality or student learning (2018)
• Report recommends shift focus toward improving curriculum
“Strategic Human Capital”• ESSA: 43 states require student
growth / achievement included in evaluations
• ESSA rolls back requirements for states to implement teacher and principal evaluation
• Erosion of teacher evaluation movement
• Anti-testing backlash
• Vast majority of teachers end up with a rating equivalent to effective or higher
Human Capital Strategy Initiatives Over Time
3

5
Changing environment and context necessitate (re)evaluating human capital strategy.
Source: Adapted from Becker Huselid 1998; Wright et al., 2005.
Environment / Context
• Student population• Regulation• Accountability • Competition• Technology• “Political” environment• Funding and
compensation• ….Others?
Human Capital & Performance: A Causal Link
Overarchingstrategies
drive development of the
HR system
Resulting employee behavior
translates intoorganizational performance
HR systemdirectly impacts
employeeskills, motivation, and the structure
and design of work
4

6
Student demographics and need continue to change significantly.
Source: National Center for Education Statistics.
10%
52%13%
Free and Reduced Priced Lunch 38%
Select Student Populations as a Percent of All Students2014-2015
English Language Learners
5
2000 2015
52%
8% 10%
25.8 million students
4.8 million students
With ~13% of students continuing to receive Special Education services (6.7 million)

7
The student population is becoming more diverse, potentially already reaching “minority majority” status nationwide.
Source: National Center for Education Statistics.
Changes in Mix of Student Race / Ethnicity, ELL as a Percent of All Students
• The percentage of white students decreased from 59% to 50%, and the percentage of black students has gone down from 17% to 16%, from 2003-2013
• The percentage of Hispanic students rose from 19% to 25%, and Asian/Pacific Islander students went up from 4% to 5%
• The percentage of ELL public school students was 10% (4.8 million students) in 2015, up from 8% in 2000
• In 2015, the percentage of ELL students ranged from 1% in West Virginia to 21% in California
59
17 19
41
n/a
50
16
25
5 1 3
46
15
29
6 1 40
10
20
30
40
50
60
70
White Black Hispanic Asian/PacificIslander
AmericanIndian/Alaska
Native
Two or moreraces
Percentage distribution of public school students enrolled in pre-kindergarten through 12th grade, by race/ethnicity:
Fall 2003, fall 2013, and fall 2025
2003 2013 2025 (projected)
6

8
There is a growing need (and demand) for a more expansive definition of success.
New Dimensions of Performance
• Test Scores
• CollegeAcceptance
• Income
Traditional Measures
21st
Century Student
Learning&
Innovation
Media&
Technology
Life&
Career
KeyAcademics
• Whole Child
• CollegeCompletion
• Competency Based
• Career Readiness
New Measures
7

98
What are some of the biggest environmental changes affecting your district?
What strategic priorities and initiatives do you have in place to respond? What else may you need to consider?

10
1
2
3
4
5
More (and Better) Teachers
……Hope
Increase Specialization
Measure and Evaluate
Develop and Train
9
U.S. K-12 School District Human Capital Strategy to Date

11
More Teachers
10

12
The number of teachers in the U.S. has grown significantly…
Source: National Center for Education Statistics; Viadero, “Teacher Recruitment and Retention: It’s Complicated,” Education Week, January 23, 2018.
• From SY 1988 to SY 2016• Public-school teacher population
increased by 65%• K-12 student enrollment in public
schools increased by 24%
• Since SY 1988, the teacher force has gotten older, yet less experienced at teaching
0
10
20
30
40
50
60
70
80
0
0.5
1
1.5
2
2.5
3
3.5
4
4.5
1987-881990-91
1999-002003-04
2007-082011-12
2015-16
Num
ber of Students (millions)N
umbe
r of T
each
ers
(milli
ons)
Trends in the Numbers of Public Elementary and Secondary School Teachers and Students,
1987-2016
Teachers Students
Teachers
Students
11

13
National Center for Education Statistics; “Time and Learning in Schools: A National Profile,“ National Center on Time and Learning and Neag School of Education
…driven by a desire for lower student:teacher ratio…
0
500
1,000
1,500
2,000
2,500
3,000
3,500
12
14
16
18
20
22
24
26
1955 1960 1965 1970 1975 1980 1985 1990 1995 2000 2005 2010 2015
Num
ber of Teachers (millions)
Pup
ils p
er te
ache
r
Pupil/teacher ratio Teachers
Teachers per Student in Public Schools
Student:Teacher Ratio
# of Teachers
12

14
…resulting in ~80% of U.S. K-12 public school system operating expenses committed to employee salaries and benefits.
Source: National Center for Education Statistics.
U.S. K-12 Public School System Operating Expenses
328.3
130.9
61.1
43.85.65.7
0
100
200
300
400
500
600
SY 2014-15
Total SY 2014-15 Expenditures ($B)
Salaries Employee Benefits
Purchased Services Supplies
Tuition Other
57.1
22.7
10.6
7.61.0 1.0
0%
10%
20%
30%
40%
50%
60%
70%
80%
90%
100%
SY 2014-15
% of Total SY 2014-15 Expenditures
Salaries Employee Benefits
Purchased Services Supplies
Tuition Other
$575.4B
79.8%
13

15
Despite this growth, significant shortages remain, and hiring needs will continue to increase.
Source: U.S. Department of Education Office of Postsecondary Education cited in Viadero, “Teacher Recruitment and Retention: It’s Complicated,” Education Week, January 23, 2018; TalentEd, “The teacher shortage is real,” Talent Index report; Sutcher, Darling-Hammond, and Carver-Thomas, (2016), A Coming Crisis in Teaching? Teacher Supply, Demand, and Shortages in the U.S. (Palo Alto, CA: Learning Policy Institute).
Annual hiring needs
Percent of States and Territories Reporting Specialty-
Specific Statewide Teacher Shortages, 2016-2018
Teacher Shortages likely to get worse:
• Rising student enrollment: +3 MM by 2030
• Pressure to lower student:teacherratios: additional 145,000 teachers needed from the current 16-to-1 to pre-recession ratios of 15.3 to 1.
• High levels of teacher attrition: nearly 8% of the workforce annually, responsible for the largest share of annual demand—majority of them before retirement age
~300,000 Teachers
12%16%18%
30%32%32%35%39%42%
51%56%60%63%
79%84%88%89%95%
0% 20% 40% 60% 80% 100%
Industr ial ArtsGifted and Talented
NursesCounselors
Lib rariansHome Economics
Health/PEPre-K
Social StudiesArts
Career Technical…ESL-Bilingual Ed
ELAForeign Languages
ScienceComputer Scien ce
MathSpecial Ed
14
Increase from ~260,000 in recent years

16
Increase Specialization
15

17
Teachers now comprise ~50% of U.S. K-12 public school system staff, as additional instructional staff has continued to increase.
Source: National Center for Education Statistics
U.S. K-12 Public School System Staff
70.3 64.8 60.052.4 53.4 51.1 50.0 49.4
23.8 28.630.9
32.6 30.4 30.4 30.8 31.0
3.3 4.6 7.1 13.1 14.5 16.4 17.0 17.2
2.6 2.0 1.9 1.9 1.7 1.7 2.2 2.4
0%
10%
20%
30%
40%
50%
60%
70%
80%
90%
100%
1950 1960 1970 1980 1990 2000 2010 2015
% of Total US K-12 Public School System Staff
Teachers Support Staff Non-Teacher Instructional Staff District Administrators
16

18
Increases in the teacher population are being driven by growing specialization in the teaching workforce.
0% 50% 100% 150% 200% 250%
ESL/BillingualElem Enrichment
Foreign LanguagesMath
English/ELAScience
Special EdSocial StudiesGeneral Elem
OtherAll
Percent Increase in Public School Teachers by Field, from 1987-88 to 2015-16
Source: Ingersoll, Merrill, Stuckey, and Collins, “Seven Trends: The Transformation of the Teaching Force, updated October 2018,” Consortium for Policy Research in Education, University of Pennsylvania; Viadero, “Teacher Recruitment and Retention: It’s Complicated,” Education Week, January 23, 2018.
17

19
The traditional classroom is also requiring different instructional practices and skills.
Transformed ClassroomsTraditional Classroom Settings
Classroom Transformation
18

20
Personalization is accelerating the move to unbundle the teacher’s role.
Analyze
Curate
Tutor
Mentor
Facilitate
Coach
Content
Sage on the Stage
Guide on the Side
Tutor
Facilitate
Mentor
Curate
Analyze
Content
Coach
19
21
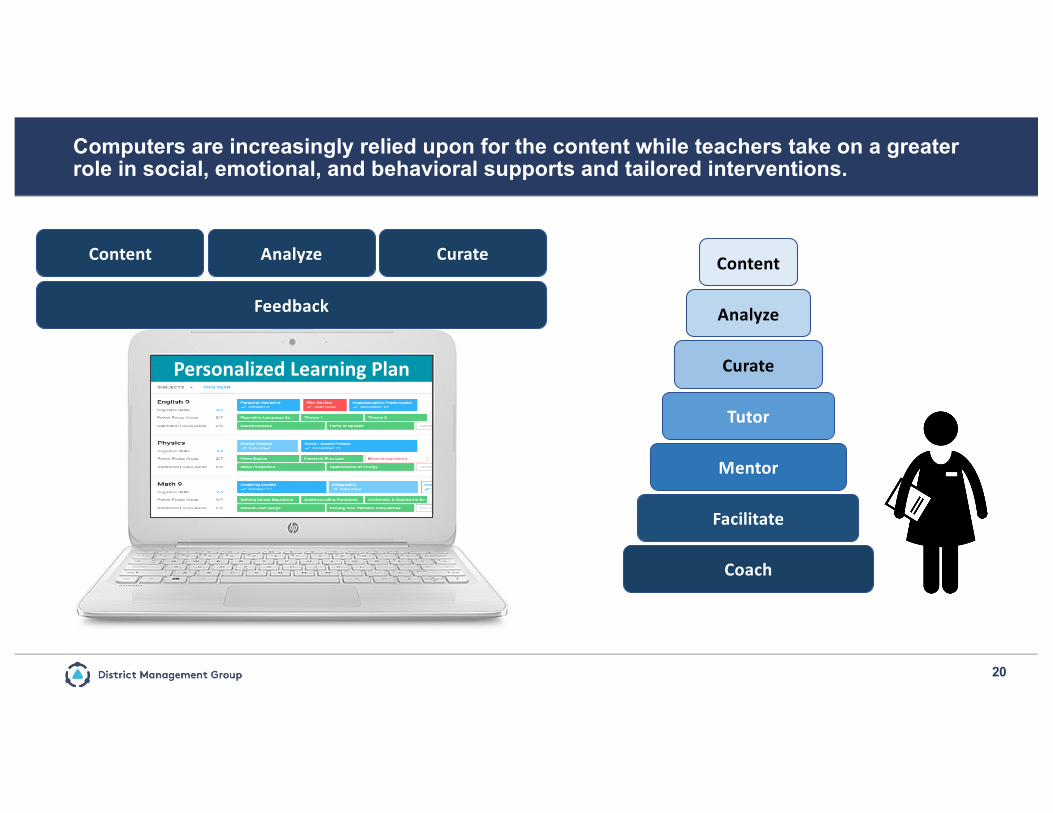
Computers are increasingly relied upon for the content while teachers take on a greater role in social, emotional, and behavioral supports and tailored interventions.
Personalized Learning Plan
CurateAnalyzeContent
20
Feedback
Tutor
Facilitate
Mentor
Curate
Analyze
Content
Coach

22
Develop and Train
21

23
The U.S. makes a substantial investment in developing teachers.
Source: TNTP, The Mirage, (2015).
~ $18 billion per year nationally spent on teacher PD
• 6-9% of district operating budget total: more than food (3-5%) or transportation (1%)
• On average, teachers spend 19 school days per year in development activities (10% of the school year)
• This is ~150 hours per year, ranging from 30 to 74 hours of mandated time
• 10th year teacher has spent a full school year in development activities
22
Beginning1st Year
2nd Year
3rd Year
4th Year
5th Year
6th Year
7+ Years
Valu
e-Ad
ded
Retu
rns
(std
. dev
. fro
m
Begi
nnin
g Te
ache
rs)
Teacher Effectiveness Improves Over First Three Years, Then Plateaus
Math Reading
24
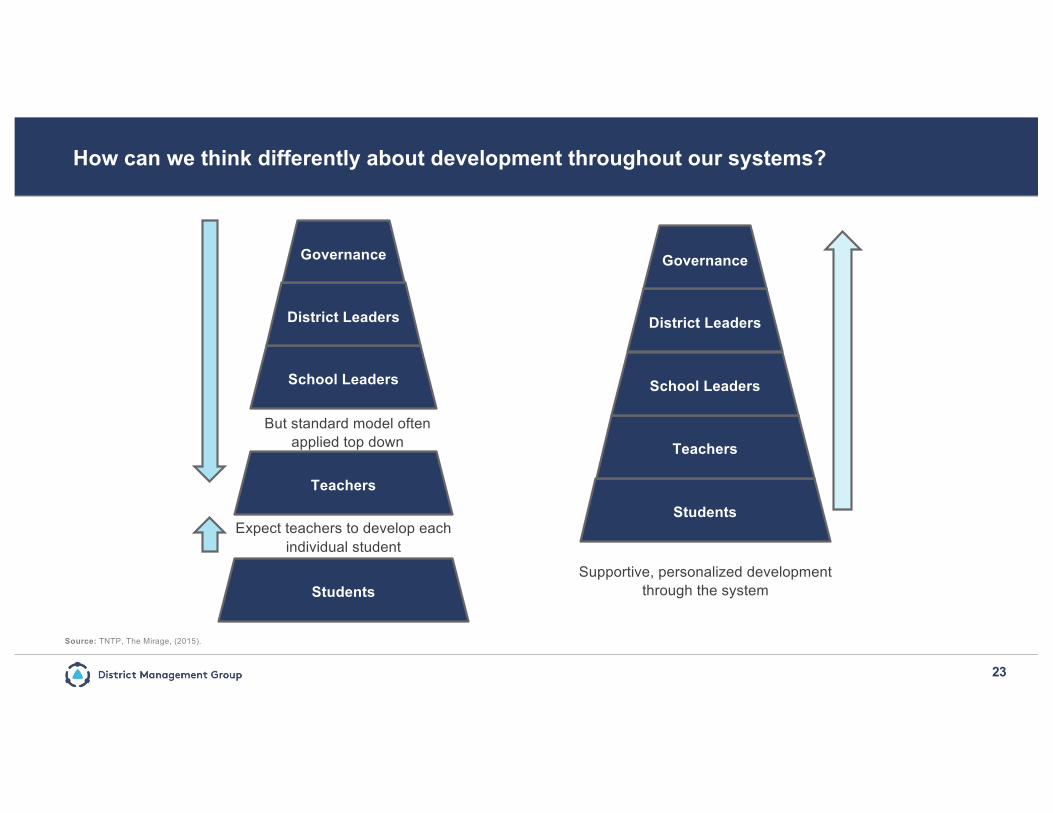
How can we think differently about development throughout our systems?
Source: TNTP, The Mirage, (2015).
23
Students
Teachers
Expect teachers to develop each individual student
School Leaders
District Leaders
Governance
But standard model often applied top down
Students
Teachers
School Leaders
District Leaders
Governance
Supportive, personalized development through the system

25
Measure and Evaluate
24
26
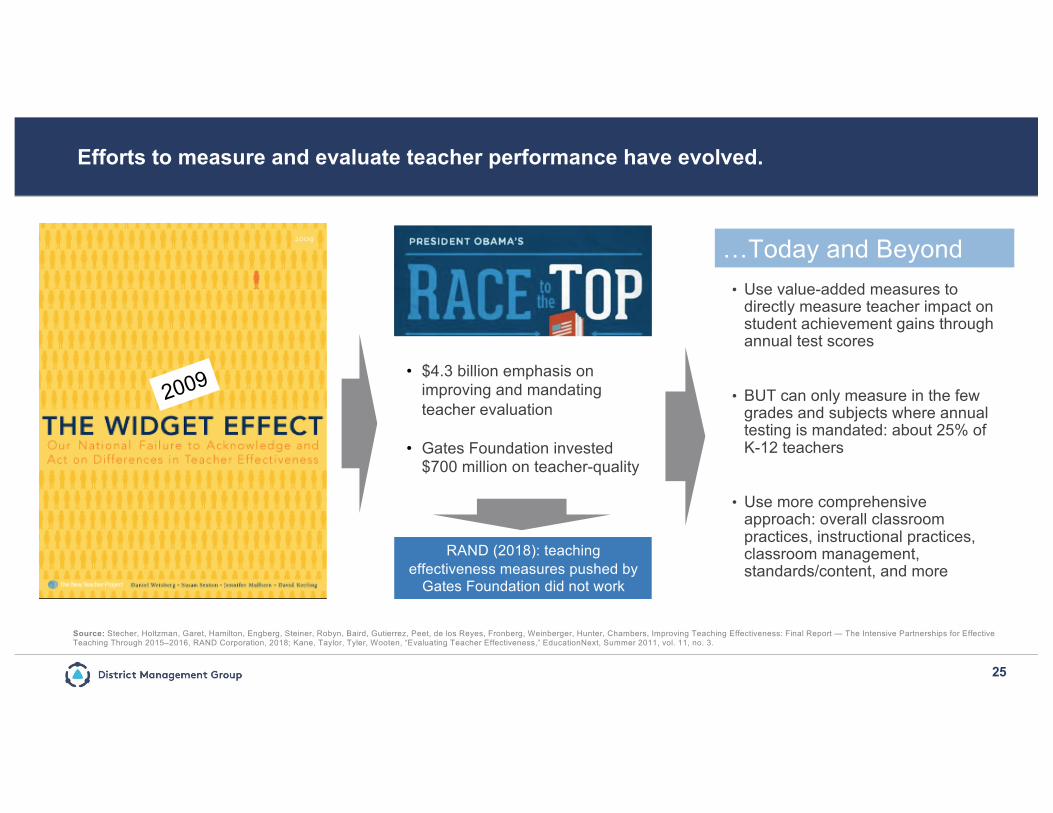
Efforts to measure and evaluate teacher performance have evolved.
Source: Stecher, Holtzman, Garet, Hamilton, Engberg, Steiner, Robyn, Baird, Gutierrez, Peet, de los Reyes, Fronberg, Weinberger, Hunter, Chambers, Improving Teaching Effectiveness: Final Report — The Intensive Partnerships for Effective Teaching Through 2015–2016, RAND Corporation, 2018; Kane, Taylor, Tyler, Wooten, “Evaluating Teacher Effectiveness,” EducationNext, Summer 2011, vol. 11, no. 3.
• Use value-added measures to directly measure teacher impact on student achievement gains through annual test scores
• BUT can only measure in the few grades and subjects where annual testing is mandated: about 25% of K-12 teachers
• Use more comprehensive approach: overall classroom practices, instructional practices, classroom management, standards/content, and more
2009 • $4.3 billion emphasis on improving and mandating teacher evaluation
• Gates Foundation invested $700 million on teacher-quality
RAND (2018): teaching effectiveness measures pushed by
Gates Foundation did not work
…Today and Beyond
25

27
An effective organizational strategy includes human capital management and aligns with district strategy.
Source: Adapted from Becker, Huselid, Ulrich The HR Scorecard 2001; Boris Groysberg and Amanda Cowen, Developing Leaders, HBS Publishing
• Clearly define the district strategy and build a business case for HR as a strategic asset
• Theory of Action: fundamental belief about how change will occur and strategic goals will be met
• Positioning relative to competitors
• Design measurement system of leading and lagging indicators of performance and key factors for success
• Implement “management by measurement”
• Widely distribute measures to all levels of the organization
• Regularly test measures against strategy map
• Identify organizational capabilities and attributes needed to successfully fulfill district strategy
• Create a strategy alignment “map” including key objectives, success factors, and indicators of performance
• Define organizational design and leadership competencies to develop and sustain organizational capabilities
26

2827
Think back on the strategic priorities and initiatives you discussed earlier…
What are the implications on your human capital approach, priorities, and performance measures?

29
Strengthen your district by aligning HR activities around human capital strategy.
DMGroup’s Human Capital Framework
Select, Hire, and StaffRecruit Develop, Evaluate, and Retain
Example areas where data should be used to answer crucial HR questions:
● Cultivating a strong candidate pool: What are our largest current sources of candidates and what is the hire rate from each source?
● Screening and selecting: What qualities does our interview process look for, and how well do those qualities predict future success?
● Hiring and staffing: What percent of offers made are accepted?
● Development and retention: What are the most common reasons for undesired departures? When in a teacher’s career do they depart?
28
30
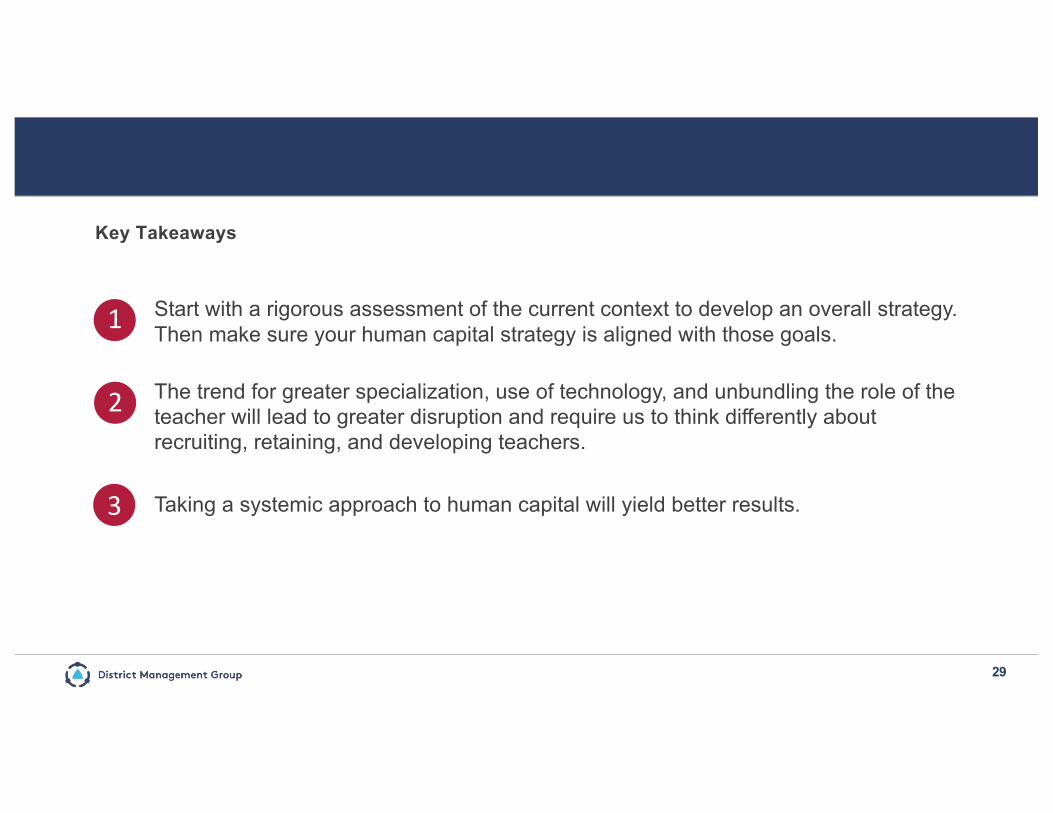
Key Takeaways
1
2
3
Start with a rigorous assessment of the current context to develop an overall strategy. Then make sure your human capital strategy is aligned with those goals.
The trend for greater specialization, use of technology, and unbundling the role of the teacher will lead to greater disruption and require us to think differently about recruiting, retaining, and developing teachers.
Taking a systemic approach to human capital will yield better results.
29

31
If you have any comments or questions about the contents of this document, please contact District Management Group:
Tel: (877) 362-3500Email: [email protected]: (617) 491-5266Web: www.dmgroupK12.com Mail: 133 Federal Street, Boston, MA 02110
30