the structural relationship between early nutrition, cognitive and non-cognitive skills in four...
TRANSCRIPT
The structural relationship between early nutrition,cognitive and non-cognitive skills in four developing
countries
Alan Sánchez
Grupo de Análisis para el Desarrollo (GRADE) y Niños del Milenio (NdM)
August 7, 2015
(GRADE y NdM) The structural relationship between early nutrition, cognitive and non-cognitive skills in four developing countriesAugust 7, 2015 1 / 33

MotivationWhat do we know about the impact of early stunting on skills formation?
Stunting in young children is associated to undernutrition
The impact of early stunting on educational achievement and cognitive skills iswell known (Grantham-McGregor et al., 2007; Alderman et al., 2006; Maluccio etal., 2009)
Catch-up growth and catch-up cognition is possible (Crookston et al., 2010,2013).
Evidence from the Jamaican study (Chang et al, 2002; Walker et al, 2007)suggests the existence of a linkage between early nutrition and the developmentof non-cognitive skills
This relationship has not been tested in other settings other than the Jamaicanstudy (except for extreme, clinical malnutrition)
Similarly, the interplay between early stunting, cognitive skills and non-cognitiveskills has not been studied
The objective of this study is to test the role of early undernutrition on the formation ofcognitive and non-cognitive skills and to analyze the pathways through which suchrelationship emerges
(GRADE y NdM) The structural relationship between early nutrition, cognitive and non-cognitive skills in four developing countriesAugust 7, 2015 2 / 33

Content
1 Literature review
2 The data
3 Conceptual framework
4 Empirical strategy
5 Results
6 Conclusions
(GRADE y NdM) The structural relationship between early nutrition, cognitive and non-cognitive skills in four developing countriesAugust 7, 2015 3 / 33

Literature review
Outline
1 Literature review
2 The data
3 Conceptual framework
4 Empirical strategy
5 Results
6 Conclusions
(GRADE y NdM) The structural relationship between early nutrition, cognitive and non-cognitive skills in four developing countriesAugust 7, 2015 4 / 33

Literature review
Literature review
Cunha and Heckman, 2007
Cunha and Heckman, 2008; Coneus et al., 2012; Helmers and Patnam, 2011
Chang et al., 2002; Walker et al., 2007
Dercon and Sanchez, 2013
(GRADE y NdM) The structural relationship between early nutrition, cognitive and non-cognitive skills in four developing countriesAugust 7, 2015 5 / 33

The data
Outline
1 Literature review
2 The data
3 Conceptual framework
4 Empirical strategy
5 Results
6 Conclusions
(GRADE y NdM) The structural relationship between early nutrition, cognitive and non-cognitive skills in four developing countriesAugust 7, 2015 6 / 33

The data
The data
Data comes from the Young Lives study
The Young Lives study is collecting data for 12,000 children in four countries(Peru, India, Vietnam and Ethiopia), including 8,000 children born between 2001and 2002
I In each country, approximately 2,000 children were sampled following asimilar multi-stage sampling procedure
I The first round took place in 2002I Follow-up surveys took place in 2006 and 2009 when children aged 4 and
7 years, respectivelyI Attrition levels in the first three surveys is below 5% in all cases (4.4% in
Peru, 2.2% in India, 2.0% in Vietnam and 2.2% in Ethiopia)
(GRADE y NdM) The structural relationship between early nutrition, cognitive and non-cognitive skills in four developing countriesAugust 7, 2015 7 / 33

The data
The data
Table : Key summary statistics by country sample (mean)
Peru India Vietnam EthiopiaMaternal years of education 7.8 3.6 7.1 2.6Female children (in %) 50 47 48 46Rural households (in %) 31 76 83 65Child stunted at age 1 (in %) 17 19 10 30Number of observations 1631 1638 1444 1448
Note: sample size corresponds to the balanced sample of children observed during the firstsurvey waves with non-missing values in the variable used for the estimations.
(GRADE y NdM) The structural relationship between early nutrition, cognitive and non-cognitive skills in four developing countriesAugust 7, 2015 8 / 33

Conceptual framework
Outline
1 Literature review
2 The data
3 Conceptual framework
4 Empirical strategy
5 Results
6 Conclusions
(GRADE y NdM) The structural relationship between early nutrition, cognitive and non-cognitive skills in four developing countriesAugust 7, 2015 9 / 33

Conceptual framework
Conceptual framework
The skills formation model (Cunha and Heckman 2007)
Cognitive and non-cognitive skills are formed since childhood
Parental investments play a fundamental role. They maximize likely altruisticutility subject to preferences and monetary constraints
Skills are self-reinforcing
There are complementarities across cognitive and non-cognitive skills
This framework is adjusted to take into account the role of nutritional status
(GRADE y NdM) The structural relationship between early nutrition, cognitive and non-cognitive skills in four developing countriesAugust 7, 2015 10 / 33

Conceptual framework
The model
Linearized, extended version of the skills formation model
θC7y = β11 + β12I7y + β13H4y + β14θ
C4y + ε1 (1)
θN7y = β21 + β22I7y + β23H4y + β24θ
C4y + ε2 (2)
H7y = β31 + β32IH7y + β33H4y + β34θ
C4y + ε3 (3)
In turn
θC4y = β41 + β42I4y + β43H1y + ε4 (4)
H4y = β51 + β52IH4y + β53H1y + ε6 (5)
This structure can be used to trace the impact of nutritional status on skills. Inparticular, nutritional status at age 1 (H1y ) can affect skills in subsequent periodsthrough direct and indirect channels.
(GRADE y NdM) The structural relationship between early nutrition, cognitive and non-cognitive skills in four developing countriesAugust 7, 2015 11 / 33

Conceptual framework
The model
The total effect of nutrition at age 1 on cognitive skills at age 7 is given byβ13β53 + β14β43
The corresponding total effect on non-cognitive skills is given by β23β53 + β24β43
One caveat of the proposed model specification is that non-cognitive skills at age4 are not allowed to play a role
I This reflects a data limitation, in the sense that the instruments used tomeasure non-cognitive skills in the Young Lives study (which are of aself-reported nature) cannot be applied to very young children
I Considering that our interest lies in calculating the impact of nutrition atage 1 on skills, this potentially generates a bias in our predictions
I In particular, the total effects that we are able to compute are likely torepresent a lower bound of the true total effects
(GRADE y NdM) The structural relationship between early nutrition, cognitive and non-cognitive skills in four developing countriesAugust 7, 2015 12 / 33

Empirical strategy
Outline
1 Literature review
2 The data
3 Conceptual framework
4 Empirical strategy
5 Results
6 Conclusions
(GRADE y NdM) The structural relationship between early nutrition, cognitive and non-cognitive skills in four developing countriesAugust 7, 2015 13 / 33

Empirical strategy
Empirical strategy
Nutritional status (H1y , H4y and H7y ) is proxied by a child’s height-for-age Z-score
Cognitive skills (θC7y , θC
4y ), non-cognitive skills (θN7y ) and parental investments (IH
4y ,I4y ,IH
7y , I7y ) are treated as unobserved latent factors
The fact that multiple cognitive and non-cognitive indicators as well as resourcesdevoted to the child are observed in each wave of the Young Lives study isexploited to obtain estimates for each type of latent factor through one-factorlinear measurement models
(GRADE y NdM) The structural relationship between early nutrition, cognitive and non-cognitive skills in four developing countriesAugust 7, 2015 14 / 33

Empirical strategy
Empirical strategy
Table : Observable variables used for estimation of latent factorsLatent factor Observable variableCognitive skills (age 7) θC
7y Peabody Picture Vocabulary TestEarly Grade Reading AssessmentMathematics test
Non-cognitive skills (age 7) θN7y Self-esteem score
Self-efficacy scoreCognitive skills (age 4) θC
4y Peabody Picture Vocabulary TestCognitive Development Assessment (Quantity)
Parental investments in skills (age 7) I7y Log non-food consumptionN◦ of hours child studies outside school
Parental investments in skills (age 4) I4y Log non-food consumptionAverage n◦ of hours children study outside school
Parental investments in nutrition IH7y ,IH
4y Log consumption of carbohydrates(age 4 and 7) Log consumption of proteins
Log consumption of minerals and vitaminsLog consumption of lipids and others
(GRADE y NdM) The structural relationship between early nutrition, cognitive and non-cognitive skills in four developing countriesAugust 7, 2015 15 / 33

Empirical strategy
Empirical strategy
It is assumed that skills are correctly measured by the above procedure
Nutritional status and parental investments could still be correlated with child andhousehold unobservable characteristics
To deal with this, a set of household economic shocks and pre-natal inputs areused as instrumental variables
I Shocks between pregnancy and age 1 instrument H1yI Shocks between age 1 and 4 instrument H4y , I4y and IH
4yI Shocks between age 4 and 7 instrument H7y , I7y and IH
7yI Pre-natal inputs and child’s birth size instrument H1y
(GRADE y NdM) The structural relationship between early nutrition, cognitive and non-cognitive skills in four developing countriesAugust 7, 2015 16 / 33

Instrumental variables
For height-for-age, age 1
Pre-natal inputsChild’s size at birth (very large, large, average, smalland very small); number of antenatal visits during pregnancy;mother’s health during pregnancy (good/averagecompared to bad/poor); child was born premature
Household shocks occurred between pregnancy and age 1
Common to all countries Affected by job loss/source of income/family enterprises;sever illness or injury; birth of new household member
Specific for India Affected by crop failure; natural disaster; decrease/change in foodavailability; livestock died
Specific for Vietnam Affected by crop failure; natural disasterSpecific for Ethiopia Affected by crop failure; natural disaster; decrease/change in food
availability; livestock died; death/reduction in household members;paying for children’s education
Instrumental variables
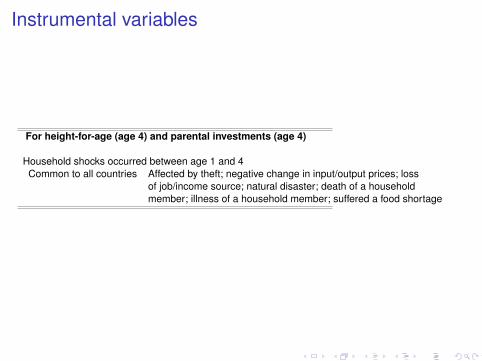
For height-for-age (age 4) and parental investments (age 4)
Household shocks occurred between age 1 and 4Common to all countries Affected by theft; negative change in input/output prices; loss
of job/income source; natural disaster; death of a householdmember; illness of a household member; suffered a food shortage

Instrumental variables, continuedFor height-for-age (age 7) and parental investments (age 7)
Household shocks occurred between age 4 and 7
Common to all countries Large increases in input prices; affected by drought; child’s motherbeen ill; other household member has been ill
Specific for Peru Affected by theft/destruction of house or consumer goods;frosts or hailstorms; large decreases in output prices
Specific for India Affected by death of livestock; too much rain or flood;pests or diseases affected crops; crop failure;child’s father been ill; other household member died
Specific for Vietnam Affected by theft/destruction of house or consumer goods;large decreases in output prices; death of livestock; toomuch rain or flood; pests or diseases affected crops;crop failure; pests or diseases; affecting livestock;child’s father been ill;
Specific for Ethiopia Affected by frosts or hailstorms; large decreases in output prices;death of livestock; too much rain or flood; pestsor diseases affected crops; crop failure; child’s father beenill; other household member died; erosion; cracks or landslides

Results
Outline
1 Literature review
2 The data
3 Conceptual framework
4 Empirical strategy
5 Results
6 Conclusions
(GRADE y NdM) The structural relationship between early nutrition, cognitive and non-cognitive skills in four developing countriesAugust 7, 2015 20 / 33

Distribution of skills
PeruAge 4 Age 7 Age 7
0.1
.2.3
.4D
ensi
ty
−2 0 2 4latent cognitive ability at age 4
0.2
.4.6
.8D
ensi
ty−2 −1 0 1 2
latent cognitive ability at age 7
0.5
11.
52
2.5
Den
sity
−1.5 −1 −.5 0 .5 1latent noncognitive ability at age 7
IndiaAge 4 Age 7 Age 7
0.2
.4.6
.81
Den
sity
−2 0 2 4latent cognitive ability at age 4
0.2
.4.6
.8D
ensi
ty
−1 −.5 0 .5 1 1.5latent cognitive ability at age 7
0.5
11.
5D
ensi
ty
−2 −1 0 1latent noncognitive ability at age 7

Distribution of skills
VietnamAge 4 Age 7 Age 7
0.2
.4.6
Den
sity
−2 0 2 4 6latent cognitive ability at age 4
0.2
.4.6
.8D
ensi
ty−2 −1 0 1
latent cognitive ability at age 7
0.5
11.
52
Den
sity
−1.5 −1 −.5 0 .5 1latent noncognitive ability at age 7
EthiopiaAge 4 Age 7 Age 7
0.2
.4.6
Den
sity
−2 0 2 4latent cognitive ability at age 4
0.2
.4.6
.81
Den
sity
−1 0 1 2latent cognitive ability at age 7
0.5
11.
52
2.5
Den
sity
−1.5 −1 −.5 0 .5 1latent noncognitive ability at age 7

Distribution of parental investments in skills
PeruAge 4 Age 7
0.5
11.
5D
ensi
ty
−1 0 1 2 3latent investment in nonfood at age 4
0.2
.4.6
.8D
ensi
ty
−2 −1 0 1 2latent investment in nonfood at age 7
IndiaAge 4 Age 7
0.2
.4.6
.8D
ensi
ty
−2 −1 0 1 2latent investment in nonfood at age 4
0.2
.4.6
.8D
ensi
ty
−2 −1 0 1 2 3latent investment in nonfood at age 7

Distribution of parental investments in skills
VietnamAge 4 Age 7
0.5
11.
5D
ensi
ty
−1 −.5 0 .5 1 1.5latent investment in nonfood at age 4
0.2
.4.6
Den
sity
−4 −2 0 2latent investment in nonfood at age 7
EthiopiaAge 4 Age 7
0.5
11.
52
Den
sity
−1 0 1 2latent investment in nonfood at age 4
0.2
.4.6
.81
Den
sity
−1 0 1 2latent investment in nonfood at age 7

Distribution of parental investments in nutrition
PeruAge 4 Age 7
0.2
.4.6
.8D
ensi
ty
−2 −1 0 1 2latent investment in food at age 4
0.2
.4.6
.81
Den
sity
−3 −2 −1 0 1 2latent investment in food at age 7
IndiaAge 4 Age 7
0.5
11.
5D
ensi
ty
−1.5 −1 −.5 0 .5 1latent investment in food at age 4
0.2
.4.6
.81
Den
sity
−2 −1 0 1 2latent investment in food at age 7

Distribution of parental investments in nutrition
VietnamAge 4 Age 7
0.2
.4.6
.8D
ensi
ty
−2 −1 0 1 2latent investment in food at age 4
0.2
.4.6
.81
Den
sity
−3 −2 −1 0 1latent investment in food at age 7
EthiopiaAge 4 Age 7
0.2
.4.6
.8D
ensi
ty
−3 −2 −1 0 1 2latent investment in food at age 4
0.2
.4.6
.8D
ensi
ty
−3 −2 −1 0 1 2latent investment in food at age 7

Main modelPeru India Vietnam Ethiopia(1) (2) (3) (4)
Dependent variable: cognitive skills, age 7Cognitive skills, age 4 β14 0.302*** 0.155*** 0.16*** 0.155***
(0.04) (0.036) (0.035) (0.021)Height-for-age, age 4 β13 0.085*** 0.15*** 0.107*** 0.111***
(0.022) (0.036) (0.029) (0.024)Parental investments, age 7 β12 0.139*** 0.149** 0.164*** 0.291***
(0.022) (0.066) (0.047) (0.043)Dependent variable: non-cognitive skills, age 7
Cognitive skills, age 4 β24 0.118*** 0.13*** 0.128*** 0.045(0.03) (0.042) (0.031) (0.036)
Height-for-age, age 4 β23 0.021 0.023 0.051 0.036(0.026) (0.025) (0.032) (0.029)
Parental investments, age 7 β22 0.121*** 0.085** 0.045 0.197***(0.017) (0.039) (0.049) (0.038)
Dependent variable: cognitive skills, age 4Height-for-age, age 1 β43 0.1*** 0.108*** 0.095*** 0.09***
(0.027) (0.031) (0.029) (0.032)Parental investments, age 4 β42 0.212*** 0.081*** 0.024 0.118***
(0.03) (0.027) (0.044) (0.034)Notes: Clustered standard errors reported in parenthesis. Standardized coefficients reported. All instrumental variables reportedin Table 3 are used. Estimations also control for mother’s years of education, year of birth fixed effects and whether the child wasborn in a rural area. When height-for-age at age 1 is the dependent variable, age in months at the time height was measured isincluded as a control.
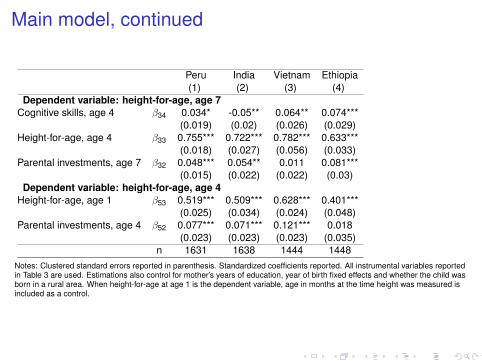
Main model, continued
Peru India Vietnam Ethiopia(1) (2) (3) (4)
Dependent variable: height-for-age, age 7Cognitive skills, age 4 β34 0.034* -0.05** 0.064** 0.074***
(0.019) (0.02) (0.026) (0.029)Height-for-age, age 4 β33 0.755*** 0.722*** 0.782*** 0.633***
(0.018) (0.027) (0.056) (0.033)Parental investments, age 7 β32 0.048*** 0.054** 0.011 0.081***
(0.015) (0.022) (0.022) (0.03)Dependent variable: height-for-age, age 4
Height-for-age, age 1 β53 0.519*** 0.509*** 0.628*** 0.401***(0.025) (0.034) (0.024) (0.048)
Parental investments, age 4 β52 0.077*** 0.071*** 0.121*** 0.018(0.023) (0.023) (0.023) (0.035)
n 1631 1638 1444 1448Notes: Clustered standard errors reported in parenthesis. Standardized coefficients reported. All instrumental variables reportedin Table 3 are used. Estimations also control for mother’s years of education, year of birth fixed effects and whether the child wasborn in a rural area. When height-for-age at age 1 is the dependent variable, age in months at the time height was measured isincluded as a control.

Total effectsPeru India Vietnam Ethiopia(1) (2) (3) (4)
Panel I: height-for-age as an indicator of nutritional statusOn cognitive skills, age 7 0.074*** 0.093*** 0.082*** 0.059***
(0.011) (0.009) (0.006) (0.010)On non-cognitive skills, age 7 0.023*** 0.026*** 0.044*** 0.018***
(0.004) (0.004) (0.004) (0.003)
Panel II: stunting as an indicator of nutritional statusOn cognitive skills, age 7 -0.082*** -0.057*** -0.068*** -0.045***
(0.018) (0.007) (0.005) (0.009)On non-cognitive skills, age 7 -0.012*** -0.012*** -0.025*** -0.006
(0.003) (0.003) (0.003) (0.001)
Panel III: severe stunting as an indicator of nutritional statusOn cognitive skills, age 7 -0.065*** -0.089*** -0.074** -0.033***
(0.022) (0.016) (0.034) (0.011)On non-cognitive skills, age 7 -0.002 -0.019*** -0.014* -0.008***
(0.005) (0.004) (0.008) (0.003)n 1631 1638 1444 1448
Notes: Clustered standard errors reported in parenthesis. Standardized coefficients reported. All instrumental variables reportedin Table 3 are used. In addition, PPVT score at age 4 is instrumented using Math score at age 4, and log non-food consumption isinstrumented using study hours outside school. Estimations also control for mother’s years of education, year of birth fixed effectsand whether the child was born in a rural area.

Alternative model (using observable indicators)Peru India Vietnam Ethiopia(1) (2) (3) (4)
Dependent variable: PPVT test, age 7PPVT test, age 4 0.334*** 0.166*** 0.259*** 0.188***
(0.041) (0.025) (0.031) (0.015)Height-for-age, age 4 0.058*** 0.105*** 0.034* 0.132***
(0.016) (0.024) (0.021) (0.031)Log non-food consumption, age 7 0.174*** 0.067*** 0.059** 0.099**
(0.034) (0.024) (0.029) (0.043)Dependent variable: self-esteem score, age 7
PPVT test, age 4 0.092*** 0.131*** 0.051 -0.009(0.030) (0.025) (0.040) (0.036)
Height-for-age, age 4 0.004 0.037 0.054 0.041(0.019) (0.024) (0.034) (0.032)
Log non-food consumption, age 7 0.083*** 0.112** 0.122*** 0.132***(0.030) (0.024) (0.044) (0.042)
Dependent variable: PPVT test, age 4Height-for-age, age 1 0.062** 0.068*** 0.057** 0.015
(0.027) (0.022) (0.027) (0.031)Log non-food consumption, age 4 0.219*** -0.034 0.117*** 0.139***
(0.023) (0.023) (0.041) (0.035)Notes: Clustered standard errors reported in parenthesis. Standardized coefficients reported. All instrumental variables reportedin Table 3 are used. Furthermore, PPVT score at age 4 is instrumented using Math score at age 4, and log non-food consumptionis instrumented using study hours outside school. Estimations also control for mother’s years of education, year of birth fixedeffects and whether the child was born in a rural area. When height-for-age at age 1 is the dependent variable, age in months atthe time height was measured is included as a control.

Alternative model (using observable indicators),continued
Peru India Vietnam Ethiopia(1) (2) (3) (4)
Dependent variable: height-for-age, age 7PPVT test, age 4 0.035* -0.05** 0.064** 0.065*
(0.019) (0.017) (0.025) (0.034)Height-for-age, age 4 0.755*** 0.721** 0.783*** 0.636***
(0.018) (0.012) (0.056) (0.032)Log food consumption, age 7 0.037** 0.05** 0.013 0.071***
(0.015) (0.016) (0.017) (0.024)Dependent variable: height-for-age, age 4
Height-for-age, age 1 0.521*** 0.509*** 0.629*** 0.401***(0.025) (0.018) (0.024) (0.048)
Log food consumption, age 4 0.077*** 0.052** 0.112*** 0.015(0.022) (0.021) (0.018) (0.034)
n 1631 1638 1444 1448Notes: Clustered standard errors reported in parenthesis. Standardized coefficients reported. All instrumental variables reportedin Table 3 are used. Furthermore, PPVT score at age 4 is instrumented using Math score at age 4, and log non-food consumptionis instrumented using study hours outside school. Estimations also control for mother’s years of education, year of birth fixedeffects and whether the child was born in a rural area. When height-for-age at age 1 is the dependent variable, age in months atthe time height was measured is included as a control.

Conclusions
Outline
1 Literature review
2 The data
3 Conceptual framework
4 Empirical strategy
5 Results
6 Conclusions
(GRADE y NdM) The structural relationship between early nutrition, cognitive and non-cognitive skills in four developing countriesAugust 7, 2015 32 / 33

Conclusions
Conclusions
We contribute to the literature by testing a model in which early nutrition canhave an impact on both cognitive and non-cognitive skills
Our methodology addresses some of the main concerns in terms of theendogenous nature of nutritional status, using economic shocks and pre-natalinputs as instrumental variables
We find that improvements in height during the first year of life have an effect oncognitive and non-cognitive skills. The effect is larger for cognitive skills
The effect on non-cognitive skills is of an indirect nature, mediated by cognitiveskills
Policy interventions that lead to improvements in height at age 1 will lead toimproved skills, but the same is true for interventions that lead to improvementsin height at age 4
(GRADE y NdM) The structural relationship between early nutrition, cognitive and non-cognitive skills in four developing countriesAugust 7, 2015 33 / 33