the structure and dynamical evolution of the stellar disk ... · the structure and dynamical...
TRANSCRIPT

Mon. Not. R. Astron. Soc. 000, 1–14 (0000) Printed 16 August 2016 (MN LATEX style file v2.2)
The Structure and Dynamical Evolution of the Stellar Disk of aSimulated Milky Way-Mass Galaxy
Xiangcheng Ma,1∗ Philip F. Hopkins,1 Andrew R. Wetzel,1,2,3 Evan N. Kirby,4
Daniel Anglés-Alcázar,5 Claude-André Faucher-Giguère,5 Dušan Kereš6
and Eliot Quataert71TAPIR, MC 350-17, California Institute of Technology, Pasadena, CA 91125, USA2Carnegie Observatories, 813 Santa Barbara Street, Pasadena CA 91101, USA3Department of Physics, University of California, Davis, CA 95616, USA4Department of Astrophysics, MC 249-17, California Institute of Technology, Pasadena, CA 91125, USA5Department of Physics and Astronomy and CIERA, Northwestern University, 2145 Sheridan Road, Evanston, IL 60208, USA6Department of Physics, Center for Astrophysics and Space Sciences, University of California at San Diego, 9500 Gilman Drive, La Jolla, CA 92093, USA7Department of Astronomy and Theoretical Astrophysics Center, University of California Berkeley, Berkeley, CA 94720, USA
Draft version 16 August 2016
ABSTRACTWe study the structure, age and metallicity gradients, and dynamical evolution using a cosmo-logical zoom-in simulation of a Milky Way-mass galaxy from the Feedback in Realistic En-vironments project. In the simulation, stars older than 6 Gyr were formed in a chaotic, burstymode and have the largest vertical scale heights (1.5–2.5 kpc) by z = 0, while stars youngerthan 6 Gyr were formed in a relatively calm, stable disk. The vertical scale height increaseswith stellar age at all radii, because (1) stars that formed earlier were thicker ‘at birth’, and(2) stars were kinematically heated to an even thicker distribution after formation. Stars of thesame age are thicker in the outer disk than in the inner disk (flaring). These lead to positivevertical age gradients and negative radial age gradients. The radial metallicity gradient is neg-ative at the mid-plane, flattens at larger disk height |Z|, and turns positive above |Z| ∼ 1.5kpc.The vertical metallicity gradient is negative at all radii, but is steeper at smaller radii. Thesetrends broadly agree with observations in the Milky Way and can be naturally understoodfrom the age gradients. The vertical stellar density profile can be well-described by two com-ponents, with scale heights 200–500 pc and 1–1.5 kpc, respectively. The thick component isa mix of stars older than 4 Gyr which formed through a combination of several mechanisms.Our results also demonstrate that it is possible to form a thin disk in cosmological simulationseven with strong stellar feedback.
Key words: galaxies: abundances – galaxies: evolution – galaxies: formation – cosmology:theory
1 INTRODUCTION
Gilmore & Reid (1983) first discovered that the vertical stellar den-sity profile in the solar neighborhood in the Milky Way (MW) canbe described by two exponential components with scale heights∼ 300pc and ∼ 1450pc, respectively, and identified them as thethin disk and the thick disk. Such a two-component profile is alsoseen in external edge-on disk galaxies (e.g. Yoachim & Dalcan-ton 2006; Comerón et al. 2011, 2012). However, it remains unclearwhether the thin and thick disks are two distinct components or onesingle structure that varies continuously above the disk plane.
Several mechanisms have been proposed to explain the for-
∗ E-mail: [email protected]
mation of the thick disk, despite the ambiguity of whether it is adiscrete component or not. Some popular scenarios, all motivatedby theory or observations, include: (1) kinematic heating from apre-existing thin disk during minor mergers (e.g. Quinn et al. 1993;Kazantzidis et al. 2008; Hopkins et al. 2008; Villalobos & Helmi2008; Purcell et al. 2009; Qu et al. 2011), (2) star formation at highredshift from chaotic gas accretion during hierarchical assembly(Brook et al. 2004) or in a turbulent, gas-rich disk (Bournaud et al.2009; Haywood et al. 2013), (3) radial migration of stars from theinner disk to the outer disk (Schönrich & Binney 2009b; Loebmanet al. 2011), and (4) accretion of stars from SMC-like satellites(Abadi et al. 2003). Nonetheless, it is still unclear which mecha-nism (or combination of mechanisms) is responsible for the forma-tion of thick disks in the MW and other galaxies.
c© 0000 RAS
arX
iv:1
608.
0413
3v1
[as
tro-
ph.G
A]
14
Aug
201
6

2 X. Ma et al.
Thanks to spectroscopic surveys of stars in the MW, suchas RAVE (Steinmetz et al. 2006), SEGUE (Yanny et al. 2009),APOGEE (Allende Prieto et al. 2008), and Gaia-ESO (Gilmoreet al. 2012), one can now combine three-dimensional position, ve-locity, and chemical abundance information for large samples (fora recent review, see Rix & Bovy 2013). Many groups have claimedthat there are two distinct sub-populations, named α-rich and α-poor stars, as revealed by the gap in the [α/Fe]–[M/H] plane([M/H] represent total stellar metallicity relative to solar abun-dance) or the bimodality of the [α/Fe] distribution at fixed [M/H].These two populations are attributed to the thick and thin disks(e.g. Adibekyan et al. 2013; Bensby et al. 2014; Anders et al. 2014;Nidever et al. 2014; Mikolaitis et al. 2014; Kordopatis et al. 2015).However, some samples show a much less significant gap in the[α/Fe]–[M/H] plane than others (e.g. Mikolaitis et al. 2014; Kor-dopatis et al. 2015), or no gap at all (e.g. Boeche et al. 2014). Also,in some cases, the bimodality appears in certain α elements but dis-appears in others (e.g. Bensby et al. 2014; Mikolaitis et al. 2014).The bimodality, if real, implies that the MW may have a specialformation history (e.g. Nidever et al. 2014). Also, it is not clearwhether such feature is common in other galaxies.
Many groups have confirmed a negative radial metallicity gra-dient with a slope d[M/H]/dR ∼ −0.06dexkpc−1 in MW starsnear the disk plane (height |Z| < 0.5kpc), with d[M/H]/dR grad-ually flattening above the mid-plane and turning positive at andabove |Z| > 1.5kpc (e.g. Cheng et al. 2012; Boeche et al. 2013,2014; Anders et al. 2014; Hayden et al. 2014; Mikolaitis et al.2014). A negative vertical metallicity gradient is also found in theMW disk from the mid-plane to |Z| ∼ 3kpc, but the slope variesdramatically in the literature (e.g. Carrell et al. 2012; Boeche et al.2014; Hayden et al. 2014). Hayden et al. (2014) found that the verti-cal metallicity gradient is steeper at inner Galactocentric radii thanat outer radii.
Nevertheless, using the data at a single epoch alone is not suf-ficient to identify the mechanism for MW thick disk formation.Cosmological simulations are useful for this problem as they al-low one to trace the evolution of the galaxy as well as understandthe underlying implications in the observational data. For example,Stinson et al. (2013) presented a cosmological simulation that pro-duces a disk galaxy with similar mass and structure to the MW; theyfound that older stars tend to have larger scale heights but shorterscale lengths than younger stars and supported the observationallymotivated conjecture in Bovy et al. (2012) that mono-abundancepopulations (stars with certain [Fe/H] and [α/Fe]) are good prox-ies for single age populations. They found that the thick disk wasformed kinematically hot in their simulated galaxy. However, Mi-randa et al. (2016) pointed out that the metallicity gradients in thedisk strongly rely on the treatment of (simplified) feedback in thesesimulations and only certain recipes produced similar behavior tothe MW in their simulations. Therefore, it is important to includerealistic models of the interstellar medium (ISM) and stellar feed-back to understand the formation of galactic disks.
In this paper, we study a simulation from the Feedback in Re-alistic Environments project (FIRE; Hopkins et al. 2014)1, whichproduces a disk galaxy with stellar mass similar to the MW at z = 0,to study the structure and abundance pattern of stars in the galacticdisk. We present the structure and dynamical evolution of the stel-lar disk, compare the metallicity gradients and their variation withrecent observations, and show how the metallicity gradients can
1 http://fire.northwestern.edu
Table 1. A list of symbols used in this paper.
Symbol Descriptionz Redshift
tlookback Lookback timeage Stellar age at z = 0
X , Y, Z Cartesian coordinatesR Galactocentric radius|Z| Height from the mid-plane
[M/H] Total metallicity (relative to solar)[Fe/H] Fe abundance (relative to solar)
[Mg/Fe] Mg to Fe abundance ratio (relative to solar)
be understood from the disk structure. The FIRE project is a suiteof cosmological zoom-in simulations with detailed models of themulti-phase ISM, star formation, and stellar feedback taken directlyfrom stellar evolution models and it produces reasonable galaxyproperties broadly consistent with observations from z = 0–6, suchas the stellar mass–halo mass relation (Hopkins et al. 2014; Feld-mann et al. 2016), the Kennicutt–Schmidt law (M. Orr, in prepara-tion), neutral hydrogen covering fractions around galaxies at bothlow and high redshift (Faucher-Giguère et al. 2015, 2016; Hafenet al. 2016), the stellar mass–metallicity relation (Ma et al. 2016),mass-loading factors of galactic winds (Muratov et al. 2015), metalbudgets and CGM metal content (Muratov et al. 2016), galaxysizes (El-Badry et al. 2016), and the population of satellite galaxiesaround MW-mass galaxies (Wetzel et al. 2016). We briefly summa-rize the simulation in Section 2, present our main results in Section3, discuss our findings in Section 4, and conclude in Section 5.
We adopt a standard flat ΛCDM cosmology with cosmologicalparameters H0 = 70.2kms−1 Mpc−1, ΩΛ = 0.728, Ωm = 1−ΩΛ =0.272, Ωb = 0.0455, σ8 = 0.807 and n = 0.961, broadly consistentwith observations (e.g. Hinshaw et al. 2013; Planck Collaborationet al. 2014).
2 SIMULATION AND METHODS
In this work, we perform a case study using galaxy m12i, a diskgalaxy with mass comparable to the Milky Way at z = 0, fromthe FIRE project. We pick this simulation because it has beenwell-studied in previous work (e.g. Hopkins et al. 2014; Mura-tov et al. 2015, 2016; El-Badry et al. 2016) and has a morphol-ogy that is closest to the MW in our suite. A detailed descrip-tion of the simulations, numerical recipes, and physics includedis presented in Hopkins et al. (2014, and references therein). Webriefly summarize their main features here. The simulation is runusing GIZMO (Hopkins 2015), in P-SPH mode, which adopts a La-grangian pressure-entropy formulation of the smoothed particle hy-drodynamics (SPH) equations that improves the treatment of fluid-mixing instabilities (Hopkins 2013).
The cosmological ‘zoom-in’ initial conditions for m12i areadopted from the AGORA project (Kim et al. 2014). The zoom-in region is about one Mpc in radius at z = 0. The initial particlemasses for baryons and dark matter are mb = 5.7× 10⁴ M andmdm = 2.8× 10⁵ M, respectively. The minimum force softeninglengths for gas and star particles are εgas = 14pc and εstar = 50pc(Plummer-equivalent). The force softening lengths for the gas par-ticles are fully adaptive (Price & Monaghan 2007). The most mas-sive halo in the zoom-in region has a halo mass of Mhalo = 1.4×10¹² M and a stellar mass around M∗ = 6×10¹⁰ M at z = 0.
In our simulation, gas follows a molecular-atomic-ionized
c© 0000 RAS, MNRAS 000, 1–14

The Stellar Disk of a Simulated MW-Mass Galaxy 3
Table 2. Lookback time vs redshift.
Lookback Time [tlookback, in Gyr] 0 1 2 3 4 5 6 7 8 10Redshift [z] 0 0.076 0.162 0.258 0.369 0.497 0.649 0.834 1.068 1.812
cooling curve from 10–1010 K, including metallicity-dependentfine-structure and molecular cooling at low temperatures and high-temperature metal-line cooling followed species-by-species for 11separately tracked species (H, He, C, N, O, Ne, Mg, Si, S, Ca,and Fe; see Wiersma et al. 2009a). At each timestep, the ioniza-tion states and cooling rates are determined from a compilation ofCLOUDY runs, including a uniform but redshift-dependent photo-ionizing background tabulated in Faucher-Giguère et al. (2009),and approximate models of photo-ionizing and photo-electric heat-ing from local sources. Gas self-shielding is accounted for with alocal Jeans-length approximation, which is consistent with the ra-diative transfer calculations in Faucher-Giguère et al. (2010).
We follow the star formation criteria in Hopkins et al. (2013)and allow star formation to take place only in locally self-gravitating, self-shielding/molecular gas which also exceeds a hy-drogen number density threshold nth = 5cm−3. Stars form on thelocal free-fall time when the gas meets these criteria and there is nostar formation elsewhere. Once a star forms, it inherits the metallic-ity of each tracked species from its parent gas particle. Every starparticle is treated as a single stellar population with known mass,age, and metallicity, assuming a Kroupa (2002) initial mass func-tion (IMF) from 0.1–100M. All the feedback quantities, includ-ing ionizing photon budgets, luminosities, supernovae (SNe) rates,mechanical luminosities of stellar winds, etc., are then directly tab-ulated from the stellar population models in STARBURST99 (Lei-therer et al. 1999). We account for several different stellar feedbackmechanisms, including (1) local and long-range momentum fluxfrom radiative pressure, (2) energy, momentum, mass and metal in-jection from SNe and stellar winds, and (3) photo-ionization andphoto-electric heating. We follow Wiersma et al. (2009b) and ac-count for metal production from Type-II SNe, Type-Ia SNe, andstellar winds using the metal yields in Woosley & Weaver (1995),Iwamoto et al. (1999), and Izzard et al. (2004), respectively. Therates of Type-II and Type-Ia SN are separtately computed fromSTARBURST99 and following Mannucci et al. (2006), respectively.
We note that the Mg yield from Type II SN in Woosley &Weaver (1995) is ∼ 0.4 dex lower than typical values in more re-cent models (e.g. Nomoto et al. 2006). Therefore, we manually add0.4 dex to all Mg abundances in our simulation to compare withobservations more accurately. This will have little effect on globalgalaxy properties, since Mg is not an important coolant (it is simplya “tracer species”). Also, the total number of Type Ia SNe calcu-lated from Mannucci et al. (2006) is lower than that derived fromMaoz et al. (2010) by a factor of a few for a stellar population olderthan 1 Gyr; this may lead to predictions of lower Fe, but we cannotsimply renormalize the Fe abundances in the simulation. We do notinclude a sub-resolution metal diffusion model in the simulation;all mixing above the resolution scale is explicitly resolved.
We use the Amiga Halo Finder (AHF; Knollmann & Knebe2009) to identify halos in the simulated box, where we adopt thetime-dependent virial overdensity from Bryan & Norman (1998).In this work, we only study the most massive (hence best-resolved)halo in the zoom-in region, which hosts a disk galaxy of very sim-ilar properties to the MW at z = 0. At each epoch, we define thegalactic center at the density peak of most stars and find the stellarhalf-mass radius as the radius within which the stellar mass equals
to a half of the stellar mass within 0.1 virial radius. Then the Z-axisis defined to be aligned with the total angular momentum of thegas within 5 stellar half-mass radii. In this paper, we will primarilyfocus on the stellar component. We do not perform a kinematic de-composition for the stellar content, but take all star particles in theanalysis to form an unbiased sample.
A list of symbols used in this paper and their descriptions arepresented in Table 1. In the rest of this paper, we always mean thez = 0 age when we quote stellar ages and will predominantly uselookback time (tlookback) when referring to an epoch in the simula-tion. In Table 2, we list the conversion between lookback time andredshift at selected epochs for reference.
3 RESULTS
3.1 General Picture
At high redshifts, the galaxy accretes gas rapidly and undergonesmultiple mergers, producing violent, bursty star formation, until afinal minor merger finished at z∼ 0.7 (corresponding to a look-backtime of tlookback ∼ 6Gyr). Since then, a calm, stable gas disk wasformed and maintained, with stars forming in the disk at a nearlyconstant rate (∼ 7M yr−1) regulated by stellar feedback.
The top panel in Fig. 1 illustrates the stellar morphologies atz = 0 for stars in the galaxy in six different z = 0 age intervals. Thetop and bottom panels show the stellar surface density viewed face-on and edge-on, respectively. The thickness increases with stellarage, from a thin disk-like structure to more spheroidal morphol-ogy, broadly consistent with the MW (Bovy et al. 2012) and othersimulations (e.g. Stinson et al. 2013). On the other hand, the radialmorphology first shrinks with increasing age, but then becomes lessconcentrated for ages greater than 8 Gyr, leaving intermediate-agestars (age ∼ 6Gyr) the most radially concentrated. This is in con-trast with the systems studied in Bovy et al. (2012) and Stinsonet al. (2013) where the oldest stars have the smallest scale lengths.This directly owes to a minor merger in the simulation around look-back time tlookback ∼ 6Gyr (z ∼ 0.7), which drove a concentratednuclear starburst.
The middle panel in Fig. 1 shows the stellar morphologies forthe same stars shown in the top panel (divided into the same z = 0age intervals), but viewed at the epoch when they just formed (la-beled by look-back time). In other words, we trace the galaxy backto these epochs, and show the young stars in the main progeni-tor galaxy at that time. Stars older than 8 Gyr were born to be achaotic, non-disk-like structure. For illustrative purposes, we alsoshow gas morphologies at the same epochs in the bottom panel inFig. 1. During the early stage of galaxy assembly when the stellarmass was sufficiently low, this galaxy experienced bursty, chaoticstar formation (Sparre et al. 2015). Starbursts drive bursts of gasoutflows with high efficiency (Muratov et al. 2015), and the burstyoutflows in turn modify the potential and cause radial migrationof stars, resulting in radial expansion and quasi-spherical morphol-ogy for stars older than 8 Gyr (El-Badry et al. 2016). A gas disk isformed by tlookback ∼ 6 Gyr (z ∼ 0.7). Below tlookback . 6 Gyr, starformation takes place in a relatively calm mode, with stars formingin a relatively stable disk at a rate self-regulated by feedback, and
c© 0000 RAS, MNRAS 000, 1–14

4 X. Ma et al.
Figure 1. Top: Morphology of stars in different age intervals at z = 0. The thickness increases with stellar age, but the scale length first decreases with stellarage in 0 < age < 6Gyr and then increases in age > 8Gyr, leaving stars of age ∼ 6Gyr the most radially concentrated (owing to a merger-driven nuclearstarburst about this time). Middle: Morphology of the same stars from each z = 0 age interval in the top panel, but viewed at the epoch when they just formed(labeled by lookback time) in the galaxy progenitor. Stars younger than 6 Gyr at z = 0 were formed in a relatively calm disk. Stars older than 8 Gyr at z = 0were formed in a violent, bursty mode and relax by z = 0. Bottom: Morphology of gas, viewed at the same epochs as in the middle panel. At early time, thegas is highly irregular and chaotic. By tlookback ∼ 6Gyr (z∼ 0.7), the gas eventually formed a disk.
there are no longer large scale outflows (Muratov et al. 2015). Hay-ward & Hopkins (2015) proposed an analytic model and arguedthat such bursty-to-calm transition is expected in massive galaxiesat late times, due to the change of ISM structure at low gas frac-tions.
We estimate the fraction of stars that comes from mergers or
tidally disrupted satellites, i.e. stars formed outside the main pro-genitor galaxy, using the particle tracking technique developed byand presented in D. Anglés-Alcázar et al. (in preparation). We findthat only . 10% of the stellar mass in the z = 0 galaxy was formedex situ and this contribution is only significant far above the galac-tic plane (|Z| & 5kpc). For example, during the last minor merger
c© 0000 RAS, MNRAS 000, 1–14
The Stellar Disk of a Simulated MW-Mass Galaxy 5
0.0 0.5 1.0 1.5 2.0 2.5 3.0|Z| [kpc]
105
106
107
ρ∗
[M¯ k
pc−
3]
R = 8 kpc
all stars
two-component fit
one-component fit
thin disk
thick disk
0 < age < 2 Gyr
2 < age < 4 Gyr
4 < age < 6 Gyr
6 < age < 8 Gyr
age > 8 Gyr
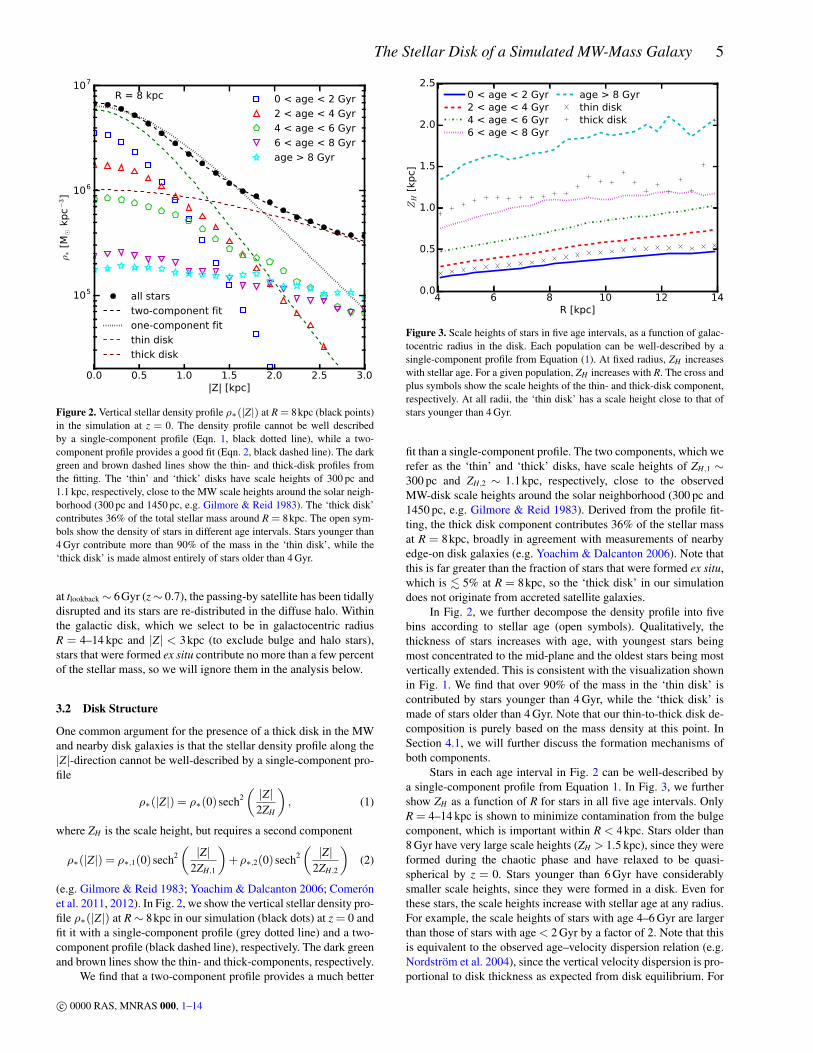
Figure 2. Vertical stellar density profile ρ∗(|Z|) at R = 8kpc (black points)in the simulation at z = 0. The density profile cannot be well describedby a single-component profile (Eqn. 1, black dotted line), while a two-component profile provides a good fit (Eqn. 2, black dashed line). The darkgreen and brown dashed lines show the thin- and thick-disk profiles fromthe fitting. The ‘thin’ and ‘thick’ disks have scale heights of 300 pc and1.1 kpc, respectively, close to the MW scale heights around the solar neigh-borhood (300 pc and 1450 pc, e.g. Gilmore & Reid 1983). The ‘thick disk’contributes 36% of the total stellar mass around R = 8kpc. The open sym-bols show the density of stars in different age intervals. Stars younger than4 Gyr contribute more than 90% of the mass in the ‘thin disk’, while the‘thick disk’ is made almost entirely of stars older than 4 Gyr.
at tlookback ∼ 6Gyr (z∼ 0.7), the passing-by satellite has been tidallydisrupted and its stars are re-distributed in the diffuse halo. Withinthe galactic disk, which we select to be in galactocentric radiusR = 4–14 kpc and |Z| < 3kpc (to exclude bulge and halo stars),stars that were formed ex situ contribute no more than a few percentof the stellar mass, so we will ignore them in the analysis below.
3.2 Disk Structure
One common argument for the presence of a thick disk in the MWand nearby disk galaxies is that the stellar density profile along the|Z|-direction cannot be well-described by a single-component pro-file
ρ∗(|Z|) = ρ∗(0)sech2(|Z|2ZH
), (1)
where ZH is the scale height, but requires a second component
ρ∗(|Z|) = ρ∗,1(0)sech2(|Z|
2ZH,1
)+ρ∗,2(0)sech2
(|Z|
2ZH,2
)(2)
(e.g. Gilmore & Reid 1983; Yoachim & Dalcanton 2006; Comerónet al. 2011, 2012). In Fig. 2, we show the vertical stellar density pro-file ρ∗(|Z|) at R∼ 8kpc in our simulation (black dots) at z = 0 andfit it with a single-component profile (grey dotted line) and a two-component profile (black dashed line), respectively. The dark greenand brown lines show the thin- and thick-components, respectively.
We find that a two-component profile provides a much better
4 6 8 10 12 14R [kpc]
0.0
0.5
1.0
1.5
2.0
2.5
ZH
[kp
c]
0 < age < 2 Gyr2 < age < 4 Gyr4 < age < 6 Gyr6 < age < 8 Gyr
age > 8 Gyrthin diskthick disk
Figure 3. Scale heights of stars in five age intervals, as a function of galac-tocentric radius in the disk. Each population can be well-described by asingle-component profile from Equation (1). At fixed radius, ZH increaseswith stellar age. For a given population, ZH increases with R. The cross andplus symbols show the scale heights of the thin- and thick-disk component,respectively. At all radii, the ‘thin disk’ has a scale height close to that ofstars younger than 4 Gyr.
fit than a single-component profile. The two components, which werefer as the ‘thin’ and ‘thick’ disks, have scale heights of ZH,1 ∼300 pc and ZH,2 ∼ 1.1kpc, respectively, close to the observedMW-disk scale heights around the solar neighborhood (300 pc and1450 pc, e.g. Gilmore & Reid 1983). Derived from the profile fit-ting, the thick disk component contributes 36% of the stellar massat R = 8kpc, broadly in agreement with measurements of nearbyedge-on disk galaxies (e.g. Yoachim & Dalcanton 2006). Note thatthis is far greater than the fraction of stars that were formed ex situ,which is . 5% at R = 8kpc, so the ‘thick disk’ in our simulationdoes not originate from accreted satellite galaxies.
In Fig. 2, we further decompose the density profile into fivebins according to stellar age (open symbols). Qualitatively, thethickness of stars increases with age, with youngest stars beingmost concentrated to the mid-plane and the oldest stars being mostvertically extended. This is consistent with the visualization shownin Fig. 1. We find that over 90% of the mass in the ‘thin disk’ iscontributed by stars younger than 4 Gyr, while the ‘thick disk’ ismade of stars older than 4 Gyr. Note that our thin-to-thick disk de-composition is purely based on the mass density at this point. InSection 4.1, we will further discuss the formation mechanisms ofboth components.
Stars in each age interval in Fig. 2 can be well-described bya single-component profile from Equation 1. In Fig. 3, we furthershow ZH as a function of R for stars in all five age intervals. OnlyR = 4–14 kpc is shown to minimize contamination from the bulgecomponent, which is important within R < 4kpc. Stars older than8 Gyr have very large scale heights (ZH > 1.5 kpc), since they wereformed during the chaotic phase and have relaxed to be quasi-spherical by z = 0. Stars younger than 6 Gyr have considerablysmaller scale heights, since they were formed in a disk. Even forthese stars, the scale heights increase with stellar age at any radius.For example, the scale heights of stars with age 4–6 Gyr are largerthan those of stars with age< 2 Gyr by a factor of 2. Note that thisis equivalent to the observed age–velocity dispersion relation (e.g.Nordström et al. 2004), since the vertical velocity dispersion is pro-portional to disk thickness as expected from disk equilibrium. For
c© 0000 RAS, MNRAS 000, 1–14
6 X. Ma et al.
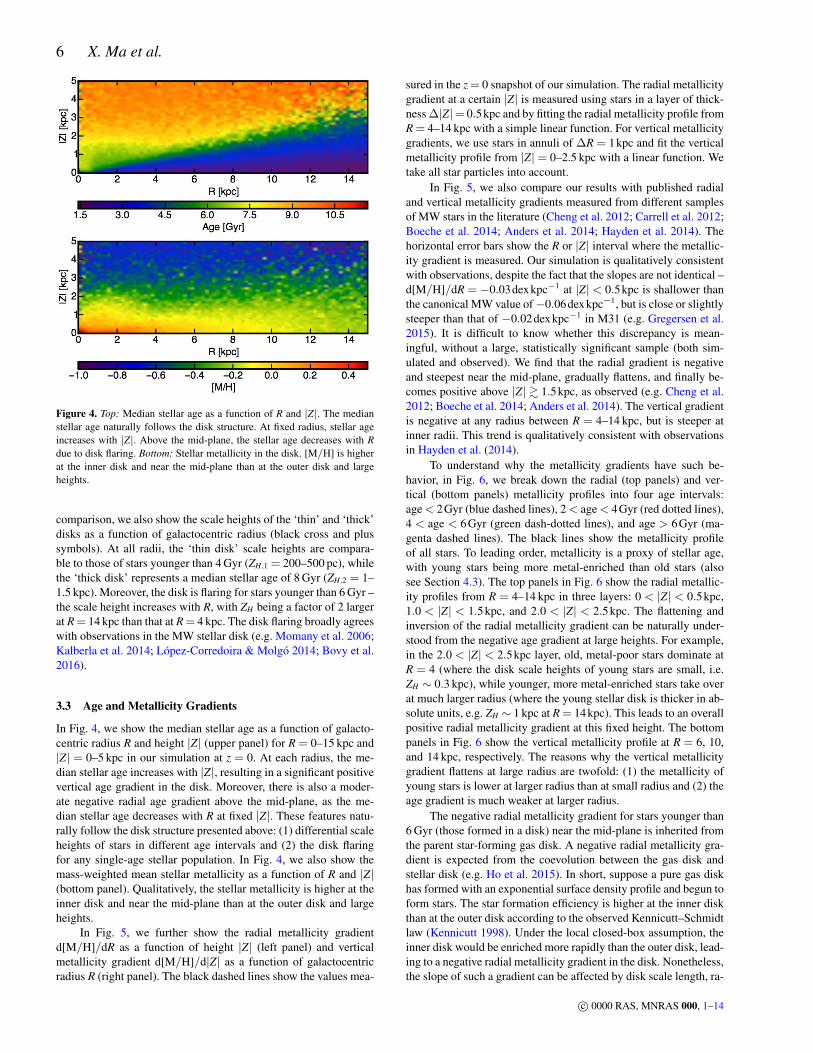
Figure 4. Top: Median stellar age as a function of R and |Z|. The medianstellar age naturally follows the disk structure. At fixed radius, stellar ageincreases with |Z|. Above the mid-plane, the stellar age decreases with Rdue to disk flaring. Bottom: Stellar metallicity in the disk. [M/H] is higherat the inner disk and near the mid-plane than at the outer disk and largeheights.
comparison, we also show the scale heights of the ‘thin’ and ‘thick’disks as a function of galactocentric radius (black cross and plussymbols). At all radii, the ‘thin disk’ scale heights are compara-ble to those of stars younger than 4 Gyr (ZH,1 = 200–500 pc), whilethe ‘thick disk’ represents a median stellar age of 8 Gyr (ZH,2 = 1–1.5 kpc). Moreover, the disk is flaring for stars younger than 6 Gyr –the scale height increases with R, with ZH being a factor of 2 largerat R = 14 kpc than that at R = 4 kpc. The disk flaring broadly agreeswith observations in the MW stellar disk (e.g. Momany et al. 2006;Kalberla et al. 2014; López-Corredoira & Molgó 2014; Bovy et al.2016).
3.3 Age and Metallicity Gradients
In Fig. 4, we show the median stellar age as a function of galacto-centric radius R and height |Z| (upper panel) for R = 0–15 kpc and|Z| = 0–5 kpc in our simulation at z = 0. At each radius, the me-dian stellar age increases with |Z|, resulting in a significant positivevertical age gradient in the disk. Moreover, there is also a moder-ate negative radial age gradient above the mid-plane, as the me-dian stellar age decreases with R at fixed |Z|. These features natu-rally follow the disk structure presented above: (1) differential scaleheights of stars in different age intervals and (2) the disk flaringfor any single-age stellar population. In Fig. 4, we also show themass-weighted mean stellar metallicity as a function of R and |Z|(bottom panel). Qualitatively, the stellar metallicity is higher at theinner disk and near the mid-plane than at the outer disk and largeheights.
In Fig. 5, we further show the radial metallicity gradientd[M/H]/dR as a function of height |Z| (left panel) and verticalmetallicity gradient d[M/H]/d|Z| as a function of galactocentricradius R (right panel). The black dashed lines show the values mea-
sured in the z = 0 snapshot of our simulation. The radial metallicitygradient at a certain |Z| is measured using stars in a layer of thick-ness ∆|Z|= 0.5kpc and by fitting the radial metallicity profile fromR = 4–14 kpc with a simple linear function. For vertical metallicitygradients, we use stars in annuli of ∆R = 1kpc and fit the verticalmetallicity profile from |Z|= 0–2.5 kpc with a linear function. Wetake all star particles into account.
In Fig. 5, we also compare our results with published radialand vertical metallicity gradients measured from different samplesof MW stars in the literature (Cheng et al. 2012; Carrell et al. 2012;Boeche et al. 2014; Anders et al. 2014; Hayden et al. 2014). Thehorizontal error bars show the R or |Z| interval where the metallic-ity gradient is measured. Our simulation is qualitatively consistentwith observations, despite the fact that the slopes are not identical –d[M/H]/dR = −0.03dexkpc−1 at |Z| < 0.5kpc is shallower thanthe canonical MW value of−0.06dexkpc−1, but is close or slightlysteeper than that of −0.02dexkpc−1 in M31 (e.g. Gregersen et al.2015). It is difficult to know whether this discrepancy is mean-ingful, without a large, statistically significant sample (both sim-ulated and observed). We find that the radial gradient is negativeand steepest near the mid-plane, gradually flattens, and finally be-comes positive above |Z| & 1.5kpc, as observed (e.g. Cheng et al.2012; Boeche et al. 2014; Anders et al. 2014). The vertical gradientis negative at any radius between R = 4–14 kpc, but is steeper atinner radii. This trend is qualitatively consistent with observationsin Hayden et al. (2014).
To understand why the metallicity gradients have such be-havior, in Fig. 6, we break down the radial (top panels) and ver-tical (bottom panels) metallicity profiles into four age intervals:age< 2Gyr (blue dashed lines), 2< age< 4Gyr (red dotted lines),4 < age < 6Gyr (green dash-dotted lines), and age > 6Gyr (ma-genta dashed lines). The black lines show the metallicity profileof all stars. To leading order, metallicity is a proxy of stellar age,with young stars being more metal-enriched than old stars (alsosee Section 4.3). The top panels in Fig. 6 show the radial metallic-ity profiles from R = 4–14 kpc in three layers: 0 < |Z| < 0.5kpc,1.0 < |Z| < 1.5kpc, and 2.0 < |Z| < 2.5kpc. The flattening andinversion of the radial metallicity gradient can be naturally under-stood from the negative age gradient at large heights. For example,in the 2.0 < |Z| < 2.5kpc layer, old, metal-poor stars dominate atR = 4 (where the disk scale heights of young stars are small, i.e.ZH ∼ 0.3 kpc), while younger, more metal-enriched stars take overat much larger radius (where the young stellar disk is thicker in ab-solute units, e.g. ZH ∼ 1 kpc at R = 14kpc). This leads to an overallpositive radial metallicity gradient at this fixed height. The bottompanels in Fig. 6 show the vertical metallicity profile at R = 6, 10,and 14 kpc, respectively. The reasons why the vertical metallicitygradient flattens at large radius are twofold: (1) the metallicity ofyoung stars is lower at larger radius than at small radius and (2) theage gradient is much weaker at larger radius.
The negative radial metallicity gradient for stars younger than6 Gyr (those formed in a disk) near the mid-plane is inherited fromthe parent star-forming gas disk. A negative radial metallicity gra-dient is expected from the coevolution between the gas disk andstellar disk (e.g. Ho et al. 2015). In short, suppose a pure gas diskhas formed with an exponential surface density profile and begun toform stars. The star formation efficiency is higher at the inner diskthan at the outer disk according to the observed Kennicutt–Schmidtlaw (Kennicutt 1998). Under the local closed-box assumption, theinner disk would be enriched more rapidly than the outer disk, lead-ing to a negative radial metallicity gradient in the disk. Nonetheless,the slope of such a gradient can be affected by disk scale length, ra-
c© 0000 RAS, MNRAS 000, 1–14

The Stellar Disk of a Simulated MW-Mass Galaxy 7
0.0 0.5 1.0 1.5 2.0 2.5 3.0|Z| [kpc]
0.06
0.04
0.02
0.00
0.02
0.04
d[M
/H]/
dR
[dex k
pc−
1]
SimulationCheng + 12Carrell + 12Boeche + 14Anders + 14Hayden + 14
4 6 8 10 12 14R [kpc]
0.5
0.4
0.3
0.2
0.1
0.0
d[M
/H]/
d|Z
| [d
ex k
pc−
1]
SimulationHayden + 14Carrell + 12Boeche + 14
Figure 5. Left: Radial metallicity gradient d[M/H]/dR as a function of height |Z|. Right: Vertical metallicity gradient d[M/H]/d|Z| as a function of galacto-centric radius R. d[M/H]/dR is negative at the mid-plane, gradually increases with |Z|, and eventually becomes positive above |Z| ∼ 1.5kpc. d[M/H]/d|Z| isnegative at all radii, but is stronger at smaller radii. These trends are qualitatively consistent with observations in the MW disk. A number of observations areshown, including Cheng et al. (2012), Carrell et al. (2012), Boeche et al. (2014), Anders et al. (2014), and Hayden et al. (2014).
4 6 8 10 12R [kpc]
0.8
0.6
0.4
0.2
0.0
0.2
[M/H
]
0.0 < |Z| < 0.5 kpc
4 6 8 10 12R [kpc]
1.0 < |Z| < 1.5 kpc
4 6 8 10 12R [kpc]
2.0 < |Z| < 2.5 kpc
0.0 0.5 1.0 1.5 2.0 2.5|Z| [kpc]
0.8
0.6
0.4
0.2
0.0
0.2
[M/H
]
5.5 < R < 6.5 kpc
All Stars0 < age < 2 Gyr2 < age < 4 Gyr4 < age < 6 Gyrage > 6 Gyr
0.0 0.5 1.0 1.5 2.0 2.5|Z| [kpc]
9.5 < R < 10.5 kpc
0.0 0.5 1.0 1.5 2.0 2.5|Z| [kpc]
13.5 < R < 14.5 kpc
Figure 6. Top: Radial metallicity profile in layers with |Z| = 0–0.5, 1.0–1.5, and 2.0–2.5 kpc. Bottom: Vertical metallicity profile at radii R = 6, 10, 14kpc.We show the metallicity profiles for all stars (black solid lines) as well as in bins of different stellar ages. The flattening and inversion of the radial metallicitygradient at high |Z| follows the negative age gradient at these heights. The steepening of the vertical metallicity gradient at smaller radii results from a strongerage gradient. The stellar age gradient is a natural consequence of disk structure.
c© 0000 RAS, MNRAS 000, 1–14

8 X. Ma et al.
4 6 8 10 12 14R [kpc]
0.0
0.2
0.4
0.6
0.8
1.0
1.2ZH
[kp
c]
z= 0 age 0−2 Gyr, at tlookback = 0 Gyrz= 0 age 2−4 Gyr, at tlookback = 2 Gyrz= 0 age 4−6 Gyr, at tlookback = 4 Gyr
4 6 8 10 12 14R [kpc]
0.0
0.2
0.4
0.6
0.8
1.0
1.2
ZH
[kp
c]
z= 0 age 4−6 Gyr
at tlookback = 0 Gyrat tlookback = 2 Gyrat tlookback = 4 Gyr
Figure 7. Left: Scale heights of stars in three z = 0 age intervals (0–2, 2–4, 4–6 Gyr), measured at the epoch when the stars formed (labeled by lookback time).Right: The evolution of scale heights for stars of age 4–6 Gyr at z = 0, as they would be observed at three different epochs (labeled by lookback time) aftertheir formation. Stars formed at an early epoch were born in a thicker disk than those formed at later times, because the star-forming disk was more gas-richand therefore turbulent. The scale heights of those populations then increase with time due to kinematic heating.
dial inflow and mixing, disk pre-enrichment, etc. A comprehensiveanalysis of the radial metallicity gradient and its dependence ongalaxy properties with a larger sample of simulations is the subjectof a future study.
3.4 Dynamical Evolution of the Stellar Disk
In Section 3.2, we show that even for stars that are initially formedin a disk (i.e. stars younger than age ∼ 6Gyr by z = 0), by z = 0,their scale height increases with stellar age at all radii (Fig. 3). Toexplain this, we first explore the scale heights of stars at the timewhen they just formed. In the left panel in Fig. 7, we show thescale heights for stars in three z = 0 age intervals: 0–2 Gyr, 2–4 Gyr,and 4–6 Gyr, but measured just after their formation time (labeledby lookback time). In other words, these stars are younger than2 Gyr at the time we measure their scale heights. The newly formedstars inherit the scale heights and velocity dispersion from the coldstar-forming gas in the disk where they were born. In general, starsformed earlier (which are older today) were born with larger scaleheights than stars formed at late times. For example, stars with z = 0age 4–6 Gyr (formation time at tlookback = 4Gyr) were born with ascale height of ZH ∼ 0.4 (0.8) kpc at R = 4 (14) kpc at this epoch,larger by a factor of ∼ 2 compared to the ‘at birth’ scale heightsof stars formed at z = 0. This naturally follows the evolution ofthe gas disk, because the thickness of a star-forming disk, whereself-regulation by feedback yields a Toomre parameter Q ∼ 1, isproportional to its gas fraction (e.g. Thompson et al. 2005; Faucher-Giguère et al. 2013), which is higher at early times.
We now examine how the scale height evolves over time. Inthe right panel in Fig. 7, we show the scale heights at three post-formation epochs (labeled by lookback time), for stars in the z = 0age interval 4–6 Gyr. At all radii, the scale height increases by∼ 30% (or ∼ 0.2kpc in absolute units) over the 4 Gyr from theirformation time to z = 0. During the same period, the vertical veloc-ity dispersion has also increased consistently. Several mechanismshave been proposed to cause such kinematic heating, including: (1)bars and spiral arms (e.g. Sellwood & Carlberg 1984; Minchev &Quillen 2006; Saha et al. 2010; Faure et al. 2014; Yurin & Springel
2015; Grand et al. 2016), (2) radial migration (e.g. Sellwood & Bin-ney 2002; Schönrich & Binney 2009b; Loebman et al. 2011; how-ever, see e.g. Minchev et al. 2012), (3) perturbation of satellites andsub-halos (e.g. Quinn et al. 1993; Kazantzidis et al. 2008; Purcellet al. 2009; Gómez et al. 2013), and (4) scattering by giant molec-ular clouds (GMCs) or star clusters (e.g. Spitzer & Schwarzschild1951, 1953; Aumer et al. 2016). In a cosmological context, thesemechanisms are usually combined and difficult to isolate in prac-tice. For example, gravitational perturbation of satellites can inducebars and spiral arms (e.g. Purcell et al. 2011), which further resultin kinematic heating and radial migration (Lynden-Bell & Kalnajs1972). Scattering by massive GMCs is also needed to redistributethe energy between planar and vertical motions (Carlberg 1987).In our simulation, the increase of disk thickness and velocity dis-persion is roughly a linear function of time, indicating that spiralarms may be the dominant heating mechanism, as suggested by ananalysis of a large sample of disk galaxy simulations (Grand et al.2016).
The flaring of the stellar disk is present ‘at birth’ and preservedduring kinematic heating. At their formation time, stars inheritedthe flaring of their parent gas disk, which is likely to be a naturalconsequence of hydrostatic equilibrium in a galactic potential (e.g.Olling 1995; O’Brien et al. 2010; Allaert et al. 2015), although diskflaring may also be induced and enhanced by mergers, spiral armsand bars, and radial migration (e.g. Bournaud et al. 2009; Purcellet al. 2011).
4 DISCUSSION
In this section, we discuss some observational and theoretical im-plications of our simulation. Although our analysis in Section 3 isbased on a single simulation, preliminary analysis of several otherMW-mass disk galaxy simulations indicates that the disk structureand dynamic evolution are similar in other systems, including oneusing 8 times higher mass resolution from Wetzel et al. (2016, seeAppendix A for more details), despite the fact that these simula-tions are run with a different hydrodynamic method and slightlymodified numerical implementations of the feedback model (the
c© 0000 RAS, MNRAS 000, 1–14

The Stellar Disk of a Simulated MW-Mass Galaxy 9
0 2 4 6 8 10 12Age [Gyr]
0.0
0.5
1.0
1.5
2.0
2.5
ZH
[kp
c]
thin disk thick disk
R=5 kpc
R=9 kpc
R=13 kpc
thin disk
thick disk
Figure 8. Scale heights as a function of stellar age at R = 5, 9, and 13 kpc.The cross and plus symbols show the scale heights of the ‘thin’ and ‘thick’components obtained from the profile fitting (e.g. see Fig. 2) at three radii,but we intentionally select their x-coordinates to match the curve. At allradii, the scale heights increase dramatically above stellar age 6 Gyr, sincethese stars were formed in a chaotic, bursty mode. In terms of mass density,the thin and thick disks can be separated by stars younger and older than4 Gyr, as illustrated by the vertical dotted line. The thick disk defined in thisway contains two distinct populations of stars: (1) stars older than 6 Gyrwhich were formed in the chaotic, bursty mode and (2) stars in 4–6 Gyrage interval that were formed in a gas-rich disk and kinematically heatedafter their formation. Note that the gas disk evolved smoothly during thepast 6 Gyr, so there is no sharp transition at 4 Gyr ago when the thin disk atz = 0 started to form.
FIRE-2 code, see Hopkins et al., in preparation). This suggeststhat the results presented in Section 3 are typical in similar sys-tems and insensitive to resolution and numerical method. This isexpected since our key results are derived from global processesand can be understood with simple analytic models, including (1)star formation is bursty at high redshift and becomes relatively sta-ble at late times, (2) the thickness of the star-forming gas disk de-creases at low gas fraction, and (3) the kinematic heating is contin-uously present from spiral structure, bars, GMCs, etc. Therefore,they should be independent of the subtle difference in the numer-ical details of small-scale physics. A comprehensive analysis ondisk morphology and its dependence on galaxy formation historyusing an enlarged sample of galaxies will be the subject of a futurestudy.
4.1 The thin and thick disks
In Section 3.2, we show that the vertical stellar density profile inthe simulation can be well described by a two-component function(Fig. 2), which we refer to as the traditional thin disk (ZH ∼ 200–500 pc) and thick disk (ZH ∼ 1–1.5 kpc) (e.g. Gilmore & Reid1983). In terms of mass density, the thin and thick disks in our sim-ulation can be roughly divided into stars younger and older than4 Gyr, respectively.
We first discuss the formation mechanisms of the thick disk. InFig. 8, we show the scale heights as a function of stellar age at threeradii R = 5, 9, and 13 kpc. The cross and plus symbols represent thescale heights of the thin and thick components, respectfully, as ob-tained from profile fitting. The vertical dotted line located at 4 Gyrillustrates the separation of the thin and thick disks. The thick disk
contains two distinct populations. First, about two thirds of the starsin the thick disk are older than 6 Gyr (formation redshift z & 0.7).These were formed during the chaotic, bursty phase in the galaxyprogenitor (Fig. 1). This agrees with the picture proposed in Brooket al. (2004). These stars have very large scale heights, as shown inFig 8. Second, the other 1/3 of the stars in the thick disk are in the4–6 Gyr age interval, which were formed in a relatively calm, sta-ble disk. The disk was more gas-rich and turbulent at early times,however, so the stars were formed thick ‘at birth’, as proposed inBournaud et al. (2009). Furthermore, these stars continued to bekinematically heated into a thicker spatial distribution after form-ing. Therefore, the thick disk in our simulation is a mix of starsolder than 4 Gyr, which formed through a combination of severalmechanisms.
Regarding the formation of the think disk, we note that thegas disk smoothly became thinner down to z = 0, thus forming thethin disk at late times. There is no sharp transition about 4 Gyr agowhen the thin disk at z = 0 started to form.
In the literature, some authors have claimed that there is atension between preserving thin disks and the necessity of strongstellar feedback to prevent galaxies from forming too many starsin cosmological simulations (e.g. Roškar et al. 2014; Agertz &Kravtsov 2016). However, our simulation simultaneously forms athin-disk component while producing a reasonable stellar mass andstar formation history in good agreement with observational con-straints (Hopkins et al. 2014). These results demonstrate that it ispossible to form thin disks in cosmological simulations, even in thepresence of strong stellar feedback. This is due to the fact that (1)our simulation has sufficient spatial resolution (smoothing lengthfar less than the vertical scale heights of the thin disk), (2) we al-low gas to cool to very low temperatures to explicitly resolve thecold, star-forming gas, and (3) the high resolution and the physi-cally motivated star formation and feedback models adopted in thesimulation allow one to explicitly resolve the launching and ventingof galactic winds without disrupting the entire galaxy.
4.2 Stellar Migration in the Disk
It has been proposed that radial migration of stars in the disk due toangular momentum exchange may be an important mechanism ofdisk heating that also flattens the stellar metallicity gradients (e.g.Sellwood & Binney 2002; Schönrich & Binney 2009a,b; Loeb-man et al. 2011). Recent numerical calculations suggest, however,that radial migration has little impact on the disk thickening (e.g.Minchev et al. 2012; Vera-Ciro et al. 2014). Nonetheless, radial mi-gration can still occur due to resonance effects in the presence ofspiral arms and bars (e.g. Lynden-Bell & Kalnajs 1972; Sellwood& Binney 2002), which is likely to be the dominant mechanism ofdisk heating (e.g. Grand et al. 2016).
In our simulation, stars older than 8 Gyr show strong radialmigration, because the bursty gas outflows driven by stellar feed-back generate large fluctuations in the galactic potential, causingstars to migrate toward large radius (El-Badry et al. 2016). How-ever, this is a very different mechanism from the standard radialmigration within a stable disk. To test the standard migration sce-nario, we study stars in the z = 0 age interval 4–6 Gyr. First, wego back to the snapshot at tlookback = 4 Gyr and select stars in threeannuli centered at R = 5, 9, and 13 kpc with 1 kpc width near thedisk plane (|Z| < 0.5 kpc) at that epoch. In the left panel in Fig. 9,we show the distribution of galactocentric radius R for these starsby z = 0. Stars in a given annulus 4 Gyr ago have a wide distribu-tion in R by z = 0. Only a small fraction (less than 10%) of stars
c© 0000 RAS, MNRAS 000, 1–14
10 X. Ma et al.
0 5 10 15 20R [kpc] (at z= 0)
0.00
0.02
0.04
0.06
0.08
0.10
0.12
0.14
0.16D
istr
ibuti
on (
arb
itra
ry u
nit
s)
z= 0 stellar age 4−6 GyrR=5 kpc at tlookback=4 GyrR=9 kpc at tlookback=4 GyrR=13 kpc at tlookback=4 Gyr
4 6 8 10 12 140.0
0.4
0.8
1.2
1.6
log Σ
∗ [M
¯ p
c−
2]
z= 0 age 4− 6 Gyr
4 6 8 10 12 14R [kpc]
0.4
0.3
0.2
0.1
0.0
[M/H
]
at tlookback = 0 Gyrat tlookback = 2 Gyrat tlookback = 4 Gyr
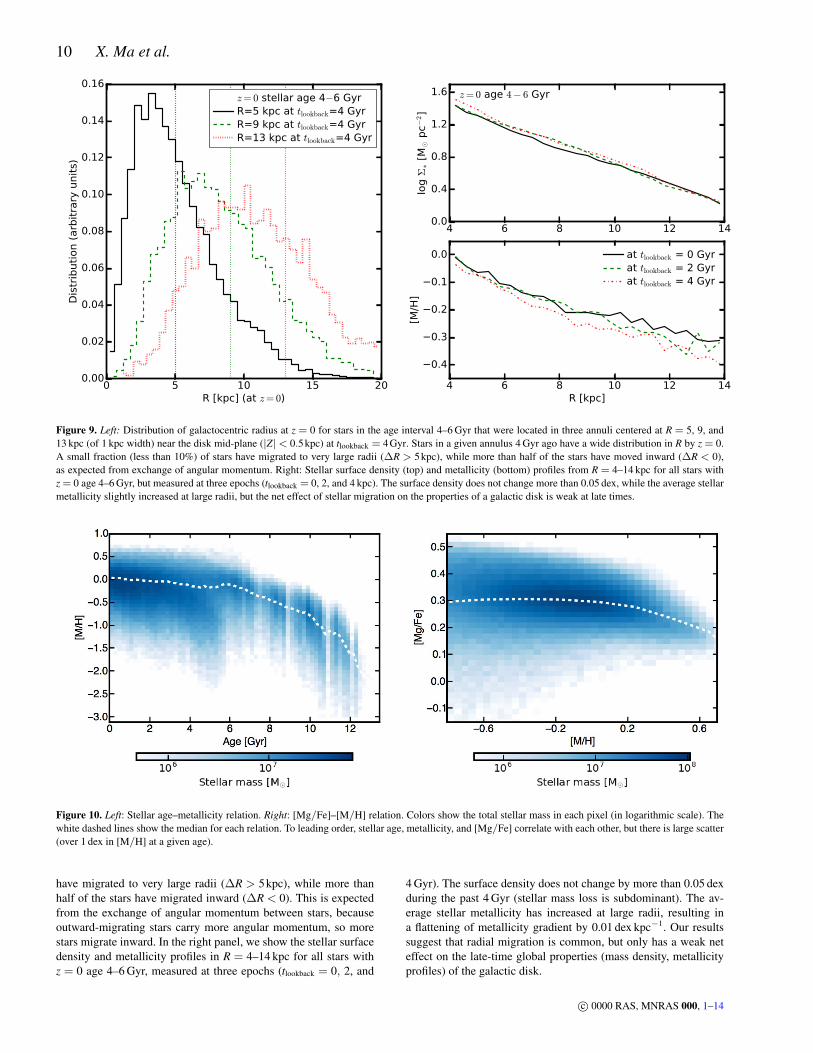
Figure 9. Left: Distribution of galactocentric radius at z = 0 for stars in the age interval 4–6 Gyr that were located in three annuli centered at R = 5, 9, and13 kpc (of 1 kpc width) near the disk mid-plane (|Z|< 0.5kpc) at tlookback = 4Gyr. Stars in a given annulus 4 Gyr ago have a wide distribution in R by z = 0.A small fraction (less than 10%) of stars have migrated to very large radii (∆R > 5kpc), while more than half of the stars have moved inward (∆R < 0),as expected from exchange of angular momentum. Right: Stellar surface density (top) and metallicity (bottom) profiles from R = 4–14 kpc for all stars withz = 0 age 4–6 Gyr, but measured at three epochs (tlookback = 0, 2, and 4 kpc). The surface density does not change more than 0.05 dex, while the average stellarmetallicity slightly increased at large radii, but the net effect of stellar migration on the properties of a galactic disk is weak at late times.
Figure 10. Left: Stellar age–metallicity relation. Right: [Mg/Fe]–[M/H] relation. Colors show the total stellar mass in each pixel (in logarithmic scale). Thewhite dashed lines show the median for each relation. To leading order, stellar age, metallicity, and [Mg/Fe] correlate with each other, but there is large scatter(over 1 dex in [M/H] at a given age).
have migrated to very large radii (∆R > 5kpc), while more thanhalf of the stars have migrated inward (∆R < 0). This is expectedfrom the exchange of angular momentum between stars, becauseoutward-migrating stars carry more angular momentum, so morestars migrate inward. In the right panel, we show the stellar surfacedensity and metallicity profiles in R = 4–14 kpc for all stars withz = 0 age 4–6 Gyr, measured at three epochs (tlookback = 0, 2, and
4 Gyr). The surface density does not change by more than 0.05 dexduring the past 4 Gyr (stellar mass loss is subdominant). The av-erage stellar metallicity has increased at large radii, resulting ina flattening of metallicity gradient by 0.01 dex kpc−1. Our resultssuggest that radial migration is common, but only has a weak neteffect on the late-time global properties (mass density, metallicityprofiles) of the galactic disk.
c© 0000 RAS, MNRAS 000, 1–14
The Stellar Disk of a Simulated MW-Mass Galaxy 11
0 2 4 6 8 10 12Age [Gyr]
0.00
0.05
0.10
0.15
0.20
0.25
0.30
0.35D
istr
ibuti
on (
Arb
itra
ry S
cale
)
[M/H] = -0.8, [Mg/Fe] = 0.45[M/H] = -0.4, [Mg/Fe] = 0.35[M/H] = 0.0, [Mg/Fe] = 0.25[M/H] = 0.4, [Mg/Fe] = 0.20
0 2 4 6 8 10 12Age [Gyr]
0.00
0.05
0.10
0.15
0.20
0.25
0.30
0.35
Dis
trib
uti
on (
Arb
itra
ry S
cale
)
[M/H] = 0.0, [Mg/Fe] = 0.45[M/H] = 0.0, [Mg/Fe] = 0.35[M/H] = 0.0, [Mg/Fe] = 0.25
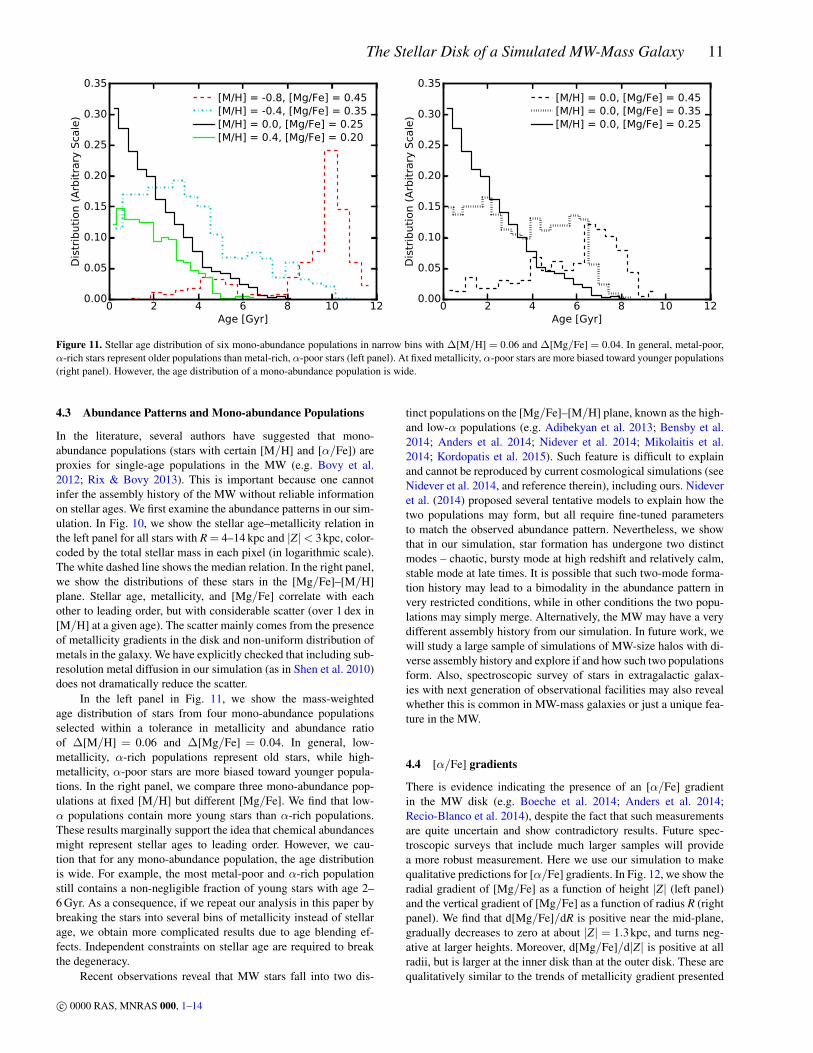
Figure 11. Stellar age distribution of six mono-abundance populations in narrow bins with ∆[M/H] = 0.06 and ∆[Mg/Fe] = 0.04. In general, metal-poor,α-rich stars represent older populations than metal-rich, α-poor stars (left panel). At fixed metallicity, α-poor stars are more biased toward younger populations(right panel). However, the age distribution of a mono-abundance population is wide.
4.3 Abundance Patterns and Mono-abundance Populations
In the literature, several authors have suggested that mono-abundance populations (stars with certain [M/H] and [α/Fe]) areproxies for single-age populations in the MW (e.g. Bovy et al.2012; Rix & Bovy 2013). This is important because one cannotinfer the assembly history of the MW without reliable informationon stellar ages. We first examine the abundance patterns in our sim-ulation. In Fig. 10, we show the stellar age–metallicity relation inthe left panel for all stars with R = 4–14 kpc and |Z|< 3kpc, color-coded by the total stellar mass in each pixel (in logarithmic scale).The white dashed line shows the median relation. In the right panel,we show the distributions of these stars in the [Mg/Fe]–[M/H]plane. Stellar age, metallicity, and [Mg/Fe] correlate with eachother to leading order, but with considerable scatter (over 1 dex in[M/H] at a given age). The scatter mainly comes from the presenceof metallicity gradients in the disk and non-uniform distribution ofmetals in the galaxy. We have explicitly checked that including sub-resolution metal diffusion in our simulation (as in Shen et al. 2010)does not dramatically reduce the scatter.
In the left panel in Fig. 11, we show the mass-weightedage distribution of stars from four mono-abundance populationsselected within a tolerance in metallicity and abundance ratioof ∆[M/H] = 0.06 and ∆[Mg/Fe] = 0.04. In general, low-metallicity, α-rich populations represent old stars, while high-metallicity, α-poor stars are more biased toward younger popula-tions. In the right panel, we compare three mono-abundance pop-ulations at fixed [M/H] but different [Mg/Fe]. We find that low-α populations contain more young stars than α-rich populations.These results marginally support the idea that chemical abundancesmight represent stellar ages to leading order. However, we cau-tion that for any mono-abundance population, the age distributionis wide. For example, the most metal-poor and α-rich populationstill contains a non-negligible fraction of young stars with age 2–6 Gyr. As a consequence, if we repeat our analysis in this paper bybreaking the stars into several bins of metallicity instead of stellarage, we obtain more complicated results due to age blending ef-fects. Independent constraints on stellar age are required to breakthe degeneracy.
Recent observations reveal that MW stars fall into two dis-
tinct populations on the [Mg/Fe]–[M/H] plane, known as the high-and low-α populations (e.g. Adibekyan et al. 2013; Bensby et al.2014; Anders et al. 2014; Nidever et al. 2014; Mikolaitis et al.2014; Kordopatis et al. 2015). Such feature is difficult to explainand cannot be reproduced by current cosmological simulations (seeNidever et al. 2014, and reference therein), including ours. Nideveret al. (2014) proposed several tentative models to explain how thetwo populations may form, but all require fine-tuned parametersto match the observed abundance pattern. Nevertheless, we showthat in our simulation, star formation has undergone two distinctmodes – chaotic, bursty mode at high redshift and relatively calm,stable mode at late times. It is possible that such two-mode forma-tion history may lead to a bimodality in the abundance pattern invery restricted conditions, while in other conditions the two popu-lations may simply merge. Alternatively, the MW may have a verydifferent assembly history from our simulation. In future work, wewill study a large sample of simulations of MW-size halos with di-verse assembly history and explore if and how such two populationsform. Also, spectroscopic survey of stars in extragalactic galax-ies with next generation of observational facilities may also revealwhether this is common in MW-mass galaxies or just a unique fea-ture in the MW.
4.4 [α/Fe] gradients
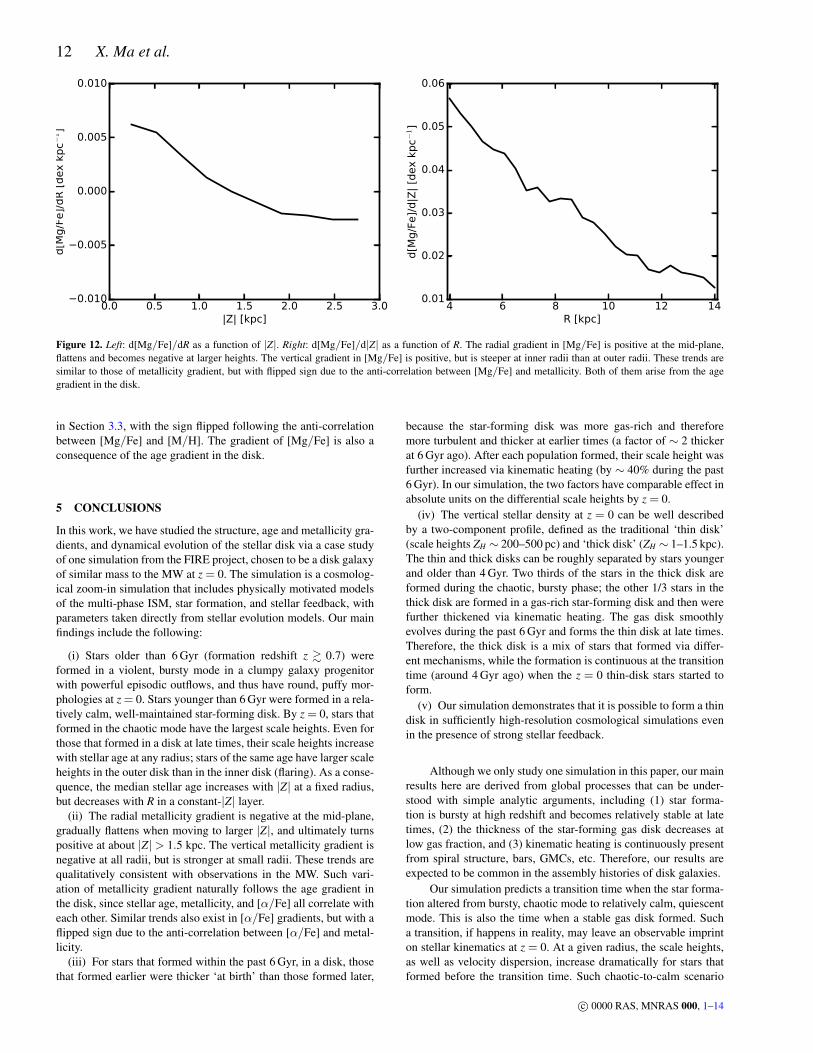
There is evidence indicating the presence of an [α/Fe] gradientin the MW disk (e.g. Boeche et al. 2014; Anders et al. 2014;Recio-Blanco et al. 2014), despite the fact that such measurementsare quite uncertain and show contradictory results. Future spec-troscopic surveys that include much larger samples will providea more robust measurement. Here we use our simulation to makequalitative predictions for [α/Fe] gradients. In Fig. 12, we show theradial gradient of [Mg/Fe] as a function of height |Z| (left panel)and the vertical gradient of [Mg/Fe] as a function of radius R (rightpanel). We find that d[Mg/Fe]/dR is positive near the mid-plane,gradually decreases to zero at about |Z| = 1.3kpc, and turns neg-ative at larger heights. Moreover, d[Mg/Fe]/d|Z| is positive at allradii, but is larger at the inner disk than at the outer disk. These arequalitatively similar to the trends of metallicity gradient presented
c© 0000 RAS, MNRAS 000, 1–14
12 X. Ma et al.
0.0 0.5 1.0 1.5 2.0 2.5 3.0|Z| [kpc]
0.010
0.005
0.000
0.005
0.010
d[M
g/F
e]/
dR
[dex k
pc−
1]
4 6 8 10 12 14R [kpc]
0.01
0.02
0.03
0.04
0.05
0.06
d[M
g/F
e]/
d|Z
| [d
ex k
pc−
1]
Figure 12. Left: d[Mg/Fe]/dR as a function of |Z|. Right: d[Mg/Fe]/d|Z| as a function of R. The radial gradient in [Mg/Fe] is positive at the mid-plane,flattens and becomes negative at larger heights. The vertical gradient in [Mg/Fe] is positive, but is steeper at inner radii than at outer radii. These trends aresimilar to those of metallicity gradient, but with flipped sign due to the anti-correlation between [Mg/Fe] and metallicity. Both of them arise from the agegradient in the disk.
in Section 3.3, with the sign flipped following the anti-correlationbetween [Mg/Fe] and [M/H]. The gradient of [Mg/Fe] is also aconsequence of the age gradient in the disk.
5 CONCLUSIONS
In this work, we have studied the structure, age and metallicity gra-dients, and dynamical evolution of the stellar disk via a case studyof one simulation from the FIRE project, chosen to be a disk galaxyof similar mass to the MW at z = 0. The simulation is a cosmolog-ical zoom-in simulation that includes physically motivated modelsof the multi-phase ISM, star formation, and stellar feedback, withparameters taken directly from stellar evolution models. Our mainfindings include the following:
(i) Stars older than 6 Gyr (formation redshift z & 0.7) wereformed in a violent, bursty mode in a clumpy galaxy progenitorwith powerful episodic outflows, and thus have round, puffy mor-phologies at z = 0. Stars younger than 6 Gyr were formed in a rela-tively calm, well-maintained star-forming disk. By z = 0, stars thatformed in the chaotic mode have the largest scale heights. Even forthose that formed in a disk at late times, their scale heights increasewith stellar age at any radius; stars of the same age have larger scaleheights in the outer disk than in the inner disk (flaring). As a conse-quence, the median stellar age increases with |Z| at a fixed radius,but decreases with R in a constant-|Z| layer.
(ii) The radial metallicity gradient is negative at the mid-plane,gradually flattens when moving to larger |Z|, and ultimately turnspositive at about |Z|> 1.5 kpc. The vertical metallicity gradient isnegative at all radii, but is stronger at small radii. These trends arequalitatively consistent with observations in the MW. Such vari-ation of metallicity gradient naturally follows the age gradient inthe disk, since stellar age, metallicity, and [α/Fe] all correlate witheach other. Similar trends also exist in [α/Fe] gradients, but with aflipped sign due to the anti-correlation between [α/Fe] and metal-licity.
(iii) For stars that formed within the past 6 Gyr, in a disk, thosethat formed earlier were thicker ‘at birth’ than those formed later,
because the star-forming disk was more gas-rich and thereforemore turbulent and thicker at earlier times (a factor of ∼ 2 thickerat 6 Gyr ago). After each population formed, their scale height wasfurther increased via kinematic heating (by ∼ 40% during the past6 Gyr). In our simulation, the two factors have comparable effect inabsolute units on the differential scale heights by z = 0.
(iv) The vertical stellar density at z = 0 can be well describedby a two-component profile, defined as the traditional ‘thin disk’(scale heights ZH ∼ 200–500 pc) and ‘thick disk’ (ZH ∼ 1–1.5 kpc).The thin and thick disks can be roughly separated by stars youngerand older than 4 Gyr. Two thirds of the stars in the thick disk areformed during the chaotic, bursty phase; the other 1/3 stars in thethick disk are formed in a gas-rich star-forming disk and then werefurther thickened via kinematic heating. The gas disk smoothlyevolves during the past 6 Gyr and forms the thin disk at late times.Therefore, the thick disk is a mix of stars that formed via differ-ent mechanisms, while the formation is continuous at the transitiontime (around 4 Gyr ago) when the z = 0 thin-disk stars started toform.
(v) Our simulation demonstrates that it is possible to form a thindisk in sufficiently high-resolution cosmological simulations evenin the presence of strong stellar feedback.
Although we only study one simulation in this paper, our mainresults here are derived from global processes that can be under-stood with simple analytic arguments, including (1) star forma-tion is bursty at high redshift and becomes relatively stable at latetimes, (2) the thickness of the star-forming gas disk decreases atlow gas fraction, and (3) kinematic heating is continuously presentfrom spiral structure, bars, GMCs, etc. Therefore, our results areexpected to be common in the assembly histories of disk galaxies.
Our simulation predicts a transition time when the star forma-tion altered from bursty, chaotic mode to relatively calm, quiescentmode. This is also the time when a stable gas disk formed. Sucha transition, if happens in reality, may leave an observable imprinton stellar kinematics at z = 0. At a given radius, the scale heights,as well as velocity dispersion, increase dramatically for stars thatformed before the transition time. Such chaotic-to-calm scenario
c© 0000 RAS, MNRAS 000, 1–14

The Stellar Disk of a Simulated MW-Mass Galaxy 13
can be tested by future observations of MW stars if an independentconstraint on stellar age can be obtained.
Nevertheless, our simulation is not designed or chosen in anyway to be identical to the MW and differs from it in several aspects.The radial metallicity gradient is −0.03dexkpc−1 in the disk mid-plane in our simulation, shallower than the −0.06dexkpc−1 slopein the MW disk (e.g. Cheng et al. 2012). This can be affected bydisk scale length, disk pre-enrichment at formation time, the extentof radial mixing, and specific merger or accretion events in the past.Also, our simulation does not show any bimodality in the [α/Fe]–[M/H] relation, in contrast to some observations of MW stars (e.g.Nidever et al. 2014). Such differences may originate from detailsin the assembly history. In future work, we will further explore thedisk formation, morphology, and metallicity profile and their de-pendence on galaxy formation history using an enlarged sample ofdisk galaxy simulations.
ACKNOWLEDGMENTS
We thank David Nidever, Hans-Walter Rix, Charlie Conroy, andPaul Torrey for helpful discussions. The simulations used in this pa-per were run on XSEDE computational resources (allocations TG-AST120025, TG-AST130039, and TG-AST140023). The anal-ysis was performed on the Caltech compute cluster “Zwicky”(NSF MRI award #PHY-0960291). Support for PFH was providedby an Alfred P. Sloan Research Fellowship, NASA ATP GrantNNX14AH35G, and NSF Collaborative Research Grant #1411920and CAREER grant #1455342. ARW was supported by a MoorePrize Fellowship through the Moore Center for Theoretical Cos-mology and Physics at Caltech and by a Carnegie Fellowshipin Theoretical Astrophysics at Carnegie Observatories. DAA ac-knowledges support by a CIERA Postdoctoral Fellowship. CAFGwas supported by NSF through grants AST-1412836 and AST-1517491, by NASA through grant NNX15AB22G, and by STScIthrough grants HST-AR-14293.001-A and HST-GO-14268.022-A.DK was supported by NSF grant AST-1412153 and funds from theUniversity of California, San Diego. EQ was supported by NASAATP grant 12-APT12-0183, a Simons Investigator award from theSimons Foundation, and the David and Lucile Packard Foundation.
REFERENCES
Abadi M. G., Navarro J. F., Steinmetz M., Eke V. R., 2003, ApJ,597, 21
Adibekyan V. Z. et al., 2013, A&A, 554, A44Agertz O., Kravtsov A. V., 2016, ApJ, 824, 79Allaert F. et al., 2015, A&A, 582, A18Allende Prieto C. et al., 2008, Astronomische Nachrichten, 329,
1018Anders F. et al., 2014, A&A, 564, A115Aumer M., Binney J., Schönrich R., 2016, MNRAS, 459, 3326Bensby T., Feltzing S., Oey M. S., 2014, A&A, 562, A71Boeche C. et al., 2013, A&A, 559, A59Boeche C. et al., 2014, A&A, 568, A71Bournaud F., Elmegreen B. G., Martig M., 2009, ApJ, 707, L1Bovy J., Rix H.-W., Liu C., Hogg D. W., Beers T. C., Lee Y. S.,
2012, ApJ, 753, 148Bovy J., Rix H.-W., Schlafly E. F., Nidever D. L., Holtzman J. A.,
Shetrone M., Beers T. C., 2016, ApJ, 823, 30
Brook C. B., Kawata D., Gibson B. K., Freeman K. C., 2004, ApJ,612, 894
Bryan G. L., Norman M. L., 1998, ApJ, 495, 80Carlberg R. G., 1987, ApJ, 322, 59Carrell K., Chen Y., Zhao G., 2012, AJ, 144, 185Cheng J. Y. et al., 2012, ApJ, 746, 149Comerón S. et al., 2011, ApJ, 729, 18Comerón S. et al., 2012, ApJ, 759, 98El-Badry K., Wetzel A., Geha M., Hopkins P. F., Kereš D., Chan
T. K., Faucher-Giguère C.-A., 2016, ApJ, 820, 131Faucher-Giguère C.-A., Lidz A., Zaldarriaga M., Hernquist L.,
2009, ApJ, 703, 1416Faucher-Giguère C.-A., Kereš D., Dijkstra M., Hernquist L., Zal-
darriaga M., 2010, ApJ, 725, 633Faucher-Giguère C.-A., Quataert E., Hopkins P. F., 2013, MN-
RAS, 433, 1970Faucher-Giguère C.-A., Hopkins P. F., Kereš D., Muratov A. L.,
Quataert E., Murray N., 2015, MNRAS, 449, 987Faucher-Giguère C.-A., Feldmann R., Quataert E., Keres D., Hop-
kins P. F., Murray N., 2016, preprint (arXiv:1601.07188)Faure C., Siebert A., Famaey B., 2014, MNRAS, 440, 2564Feldmann R., Hopkins P. F., Quataert E., Faucher-Giguère C.-A.,
Kereš D., 2016, MNRAS, 458, L14Gilmore G., Reid N., 1983, MNRAS, 202, 1025Gilmore G. et al., 2012, The Messenger, 147, 25Gómez F. A., Minchev I., O’Shea B. W., Beers T. C., Bullock J. S.,
Purcell C. W., 2013, MNRAS, 429, 159Grand R. J. J., Springel V., Gómez F. A., Marinacci F., Pakmor R.,
Campbell D. J. R., Jenkins A., 2016, MNRAS, 459, 199Gregersen D. et al., 2015, AJ, 150, 189Hayden M. R. et al., 2014, AJ, 147, 116Hayward C. C., Hopkins P. F., 2015, preprint
(arXiv:1510.05650)Haywood M., Di Matteo P., Lehnert M. D., Katz D., Gómez A.,
2013, A&A, 560, A109Hinshaw G. et al., 2013, ApJS, 208, 19Ho I.-T., Kudritzki R.-P., Kewley L. J., Zahid H. J., Dopita M. A.,
Bresolin F., Rupke D. S. N., 2015, MNRAS, 448, 2030Hopkins P. F., 2013, MNRAS, 428, 2840Hopkins P. F., 2015, MNRAS, 450, 53Hopkins P. F., Hernquist L., Cox T. J., Younger J. D., Besla G.,
2008, ApJ, 688, 757Hopkins P. F., Narayanan D., Murray N., 2013, MNRAS, 432,
2647Hopkins P. F., Kereš D., Oñorbe J., Faucher-Giguère C.-A.,
Quataert E., Murray N., Bullock J. S., 2014, MNRAS, 445, 581Iwamoto K., Brachwitz F., Nomoto K., Kishimoto N., Umeda H.,
Hix W. R., Thielemann F.-K., 1999, ApJS, 125, 439Izzard R. G., Tout C. A., Karakas A. I., Pols O. R., 2004, MNRAS,
350, 407Kalberla P. M. W., Kerp J., Dedes L., Haud U., 2014, ApJ, 794,
90Kazantzidis S., Bullock J. S., Zentner A. R., Kravtsov A. V.,
Moustakas L. A., 2008, ApJ, 688, 254Kennicutt Jr. R. C., 1998, ARA&A, 36, 189Kim J.-h. et al., 2014, ApJS, 210, 14Knollmann S. R., Knebe A., 2009, ApJS, 182, 608Kordopatis G. et al., 2015, A&A, 582, A122Kroupa P., 2002, Science, 295, 82Leitherer C. et al., 1999, ApJS, 123, 3Loebman S. R., Roškar R., Debattista V. P., Ivezic Ž., Quinn T. R.,
Wadsley J., 2011, ApJ, 737, 8
c© 0000 RAS, MNRAS 000, 1–14

14 X. Ma et al.
López-Corredoira M., Molgó J., 2014, A&A, 567, A106Lynden-Bell D., Kalnajs A. J., 1972, MNRAS, 157, 1Ma X., Hopkins P. F., Faucher-Giguère C.-A., Zolman N., Mura-
tov A. L., Kereš D., Quataert E., 2016, MNRAS, 456, 2140Mannucci F., Della Valle M., Panagia N., 2006, MNRAS, 370,
773Maoz D., Sharon K., Gal-Yam A., 2010, ApJ, 722, 1879Mikolaitis Š. et al., 2014, A&A, 572, A33Minchev I., Quillen A. C., 2006, MNRAS, 368, 623Minchev I., Famaey B., Quillen A. C., Dehnen W., Martig M.,
Siebert A., 2012, A&A, 548, A127Miranda M. S. et al., 2016, A&A, 587, A10Momany Y., Zaggia S., Gilmore G., Piotto G., Carraro G., Bedin
L. R., de Angeli F., 2006, A&A, 451, 515Muratov A. L., Kereš D., Faucher-Giguère C.-A., Hopkins P. F.,
Quataert E., Murray N., 2015, MNRAS, 454, 2691Muratov A. L. et al., 2016, preprint (arXiv:1606.09252)Nidever D. L. et al., 2014, ApJ, 796, 38Nomoto K., Tominaga N., Umeda H., Kobayashi C., Maeda K.,
2006, Nuclear Physics A, 777, 424Nordström B. et al., 2004, A&A, 418, 989O’Brien J. C., Freeman K. C., van der Kruit P. C., 2010, A&A,
515, A62Olling R. P., 1995, AJ, 110, 591Planck Collaboration et al., 2014, A&A, 571, A16Price D. J., Monaghan J. J., 2007, MNRAS, 374, 1347Purcell C. W., Kazantzidis S., Bullock J. S., 2009, ApJ, 694, L98Purcell C. W., Bullock J. S., Tollerud E. J., Rocha M., Chakrabarti
S., 2011, Nature, 477, 301Qu Y., Di Matteo P., Lehnert M. D., van Driel W., 2011, A&A,
530, A10Quinn P. J., Hernquist L., Fullagar D. P., 1993, ApJ, 403, 74Recio-Blanco A. et al., 2014, A&A, 567, A5Rix H.-W., Bovy J., 2013, A&ARv, 21, 61Roškar R., Teyssier R., Agertz O., Wetzstein M., Moore B., 2014,
MNRAS, 444, 2837Saha K., Tseng Y.-H., Taam R. E., 2010, ApJ, 721, 1878Schönrich R., Binney J., 2009a, MNRAS, 396, 203Schönrich R., Binney J., 2009b, MNRAS, 399, 1145Sellwood J. A., Binney J. J., 2002, MNRAS, 336, 785Sellwood J. A., Carlberg R. G., 1984, ApJ, 282, 61Shen S., Wadsley J., Stinson G., 2010, MNRAS, 407, 1581Sparre M., Hayward C. C., Feldmann R., Faucher-Giguère C.-
A., Muratov A. L., Kereš D., Hopkins P. F., 2015, preprint(arXiv:1510.03869)
Spitzer Jr. L., Schwarzschild M., 1951, ApJ, 114, 385Spitzer Jr. L., Schwarzschild M., 1953, ApJ, 118, 106Steinmetz M. et al., 2006, AJ, 132, 1645Stinson G. S. et al., 2013, MNRAS, 436, 625Thompson T. A., Quataert E., Murray N., 2005, ApJ, 630, 167Vera-Ciro C., D’Onghia E., Navarro J., Abadi M., 2014, ApJ, 794,
173Villalobos Á., Helmi A., 2008, MNRAS, 391, 1806Wetzel A. R., Hopkins P. F., Kim J.-h., Faucher-Giguere C.-A.,
Keres D., Quataert E., 2016, preprint (arXiv:1602.05957)Wiersma R. P. C., Schaye J., Smith B. D., 2009a, MNRAS, 393,
99Wiersma R. P. C., Schaye J., Theuns T., Dalla Vecchia C., Torna-
tore L., 2009b, MNRAS, 399, 574Woosley S. E., Weaver T. A., 1995, ApJS, 101, 181Yanny B. et al., 2009, AJ, 137, 4377Yoachim P., Dalcanton J. J., 2006, AJ, 131, 226
Yurin D., Springel V., 2015, MNRAS, 452, 2367van de Voort F., Quataert E., Hopkins P. F., Kereš D., Faucher-
Giguère C.-A., 2015, MNRAS, 447, 140
APPENDIX A: RESOLUTION TEST
In this paper, we performed a case study of a cosmological zoom-in simulation that produces a MW-mass disk galaxy at z = 0. Thissimulation is originally presented in Hopkins et al. (2014) and hasbeen thoroughly studied in other work (van de Voort et al. 2015;Faucher-Giguère et al. 2015; Muratov et al. 2015; Ma et al. 2016;El-Badry et al. 2016). Recently, Wetzel et al. (2016) have re-run thissimulation with eight times better mass resolution and higher spa-tial resolution (εgas = 1pc and εstar = 4pc), but using the mesh-lessfinite-mass (MFM) hydrodynamics method in GIZMO and FIRE-2, an improved numerical implementation of the FIRE model (seeHopkins et al., in preparation, for details). We repeat our analysison the new run and find all the results presented in the paper remainqualitatively unchanged. Particularly, the thin-to-thick disk decom-position, disk scale heights, and the amount of disk thickening atlate times are consistent within 10%. As one explicit example, inFig. A1, we show the median stellar age and average stellar metal-licity as a function of R and |Z| in the new run. The disk structureand metallicity profile are very similar to the simulation analyzedin the paper (Fig. 4). This suggests that our results are independentof resolution and numerical details, because most of the physics weconsider in the paper are global processes and can be understood bysimple analytic considerations. Nevertheless, there are some quan-titative differences between the two runs. In the new run, the star-forming disk formed and stabilized at a later time (tlookback ∼ 4Gyr),due to stochastic effects during the last minor merger. The gas diskis more metal-enriched at formation time, so the radial metallicitygradient on the mid-plane is weaker. Moreover, the disk is morestrongly flared, so the radial metallicity gradient turns positive ata lower height (|Z| ∼ 1 kpc). This suggests that a large statisticalsample is needed to make rigorous statements about quantitativedetails, as opposed to the robust qualitative trends we have focusedon here.
c© 0000 RAS, MNRAS 000, 1–14

The Stellar Disk of a Simulated MW-Mass Galaxy 15
Figure A1. The same as Fig. 4, but for the ultra-high-resolution simulationpresented in Wetzel et al. (2016). The disk structure does not significantlydiffer from the simulation studied in the paper, although this run has eighttimes better mass resolution and uses a more accurate hydrodynamic solver.
c© 0000 RAS, MNRAS 000, 1–14