the structure and evolution of young stellar clusters · allen et al.: structure and evolution of...
TRANSCRIPT

Allen et al.: Structure and Evolution of Young Stellar Clusters 361
361
The Structure and Evolution of Young Stellar Clusters
Lori Allen, S. Thomas Megeath, Robert Gutermuth,Philip C. Myers, and Scott Wolk
Harvard-Smithsonian Center for Astrophysics
Fred C. AdamsUniversity of Michigan
James Muzerolle and Erick YoungUniversity of Arizona
Judith L. PipherUniversity of Rochester
We examine the properties of embedded clusters within 1 kpc using new data from the SpitzerSpace Telescope, as well as recent results from 2MASS and other groundbased near-infraredsurveys. We use surveys of entire molecular clouds to understand the range and distribution ofcluster membership, size, and surface density. The Spitzer data demonstrate clearly that thereis a continuum of star-forming environments, from relative isolation to dense clusters. Thenumber of members of a cluster is correlated with the cluster radius, such that the average sur-face density of clusters having a few to a thousand members varies by a factor of only a few.The spatial distributions of Spitzer-identified young stellar objects frequently show elongation,low density halos, and subclustering. The spatial distributions of protostars resemble the dis-tribution of dense molecular gas, suggesting that their morphologies result directly from thefragmentation of the natal gas. We also examine the effects of the cluster environments on starand planet formation. Although far-UV (FUV) and extreme-UV (EUV) radiation from massivestars can truncate disks in a few million years, fewer than half the young stars in our sample(embedded clusters within 1 kpc) are found in regions of strong FUV and EUV fields. Typicalvolume densities and lifetimes of the observed clusters suggest that dynamical interactions arenot an important mechanism for truncating disks on solar system size scales.
1. INTRODUCTION
Since the publication of Protostars and Planets IV(PPIV), there have been significant advances in observationsof young stellar clusters from X-ray to millimeter wave-lengths. But while much of the recent work has concentratedon the stellar initial mass function (IMF) or protoplanetarydisk evolution (e.g., Lada and Lada, 2003), less attentionhas been directed to discerning the structure of young em-bedded clusters, and the evolution of that structure duringthe first few million years. Physical properties of young em-bedded clusters, such as their shapes, sizes, and densities,should inform theories of cluster formation. In this contri-bution, we describe recent results in which these proper-ties are obtained for a representative sample of young (1–3 m.y.), nearby (d ≤ 1 kpc), embedded clusters.
This contribution is motivated by three recent surveysmade with the Spitzer Space Telescope: the Spitzer YoungStellar Cluster Survey, which includes Spitzer, near-IR, andmillimeter-wave images of 30 clusters; the Spitzer OrionMolecular Cloud Survey, which covers 6.8 square degrees
in Orion; and the Cores to Disks (c2d) Legacy program,which surveyed several nearby molecular clouds (Evans etal., 2003). These surveys provide a comprehensive censusof nearly all the known embedded clusters in the nearestkiloparsec, ranging from small groups of several stars torich clusters with several hundred stars. A new archivalsurvey from Chandra (ANCHORS) is providing X-ray datafor many of the nearby clusters. Since PPIV, the Two Mi-cron All Sky Survey (2MASS) has become widely used asan effective tool for mapping large regions of star forma-tion, particularly in the nearby molecular clouds. This com-bination of X-ray, near-IR, and mid-IR data is a powerfulmeans for studying embedded populations of pre-main-se-quence stars and protostars.
Any study of embedded clusters requires some methodof identifying cluster members, and we begin by briefly re-viewing methods which have progressed rapidly since PPIV,including work from X-ray to submillimeter wavelengths,but with an emphasis on the mid-infrared spectrum coveredby Spitzer. Beyond section 2 we focus almost entirely onrecent results from Spitzer, rather than a review of the lit-
362 Protostars and Planets V
erature. In section 3, we discuss the cluster properties de-rived from large-scale surveys of young embedded clustersin nearby molecular clouds, including their sizes, spatialdistributions, surface densities, and morphologies. In sec-tion 4 we consider the evolution of young embedded clus-ters as the surrounding molecular gas begins to disperse. Insection 5 we discuss theories of embedded cluster evolu-tion, and in section 6 consider the impact of the cluster envi-ronment on star and planet formation. Our conclusions arepresented in section 7.
2. METHODS OF IDENTIFYING YOUNGSTARS IN CLUSTERS
2.1. Near- and Mid-Infrared
Young stellar objects (YSOs) can be identified and clas-sified on the basis of their mid-infrared properties (Adamset al., 1987; Wilking et al., 1989; Myers and Ladd, 1993).Here we review recent work on cluster identification andcharacterization based primarily on data from the SpitzerSpace Telescope.
Megeath et al. (2004) and Allen et al. (2004) developedYSO classification schemes based on color-color diagramsfrom observations taken with the Infrared Array Camera(IRAC) on Spitzer. Examining models of protostellar en-velopes and circumstellar disks with a wide range of plau-sible parameters, they found that the two types of objectsshould occupy relatively distinct regions of the diagram.Almost all the Class I (star + disk + envelope) models ex-hibited the reddest colors, not surprisingly, with the enve-lope density and central source luminosity having the mostsignificant effect on the range of colors. The Class II (star +disk) models included a treatment of the inner disk wall atthe dust sublimation radius, which is a significant contribu-tor to the flux in the IRAC bands. Models of the two classesgenerally occupy distinct regions in color space, indicatingthat they can be identified fairly accurately from IRAC dataeven in the absence of other information such as spectra.
Comparison of these loci with YSOs of known types inthe Taurus star-forming region shows reasonably goodagreement (Hartmann et al., 2005). Some degeneracy in theIRAC color space does exist; Class I sources with low en-velope column densities, low mass infall rates, or certainorientations may have the colors of Class II objects. Themost significant source of degeneracy is from extreme red-dening due to high extinction, which can cause Class II ob-jects to appear as low-luminosity Class I objects when con-sidering wavelengths λ < 10 µm.
The addition of data from the 24-µm channel of the Mul-tiband Imaging Photometer for Spitzer (MIPS) provides alonger wavelength baseline for classification, particularlyuseful for resolving reddening degeneracy between Class Iand II. It is also crucial for robust identification of evolveddisks, both “transition” and “debris,” which lack excessemission at shorter wavelengths due to the absence of dustclose to the star. Such 24-µm observations are limited, how-
ever, by lower sensitivity and spatial resolution comparedto IRAC, as well as the generally higher background emis-sion seen in most embedded regions. Muzerolle et al. (2004)delineated Class I and II loci in an IRAC/MIPS color-colordiagram of one young cluster based on the 3.6–24-µm spec-tral slope.
The choice of classification method depends partly onthe available data; not all sources are detected (or observed)in the 2MASS, IRAC, and MIPS bands. IRAC itself is sig-nificantly more sensitive at 3.5 and 4.5 µm than at 5.8 and8 µm, so many sources may have IRAC detections in onlythe two shorter wavelengths, and require a detection in oneor more near-IR band to classify young stars (Gutermuth etal., 2004; Megeath et al., 2005; Allen et al., 2005). Guter-muth et al. (in preparation) refined the IRAC + near-IR ap-proach by correcting for the effects of extinction, estimatedfrom the H-K color, and developed new classification cri-teria based on the extinction-corrected colors.
It is useful to compare some of the different classificationschemes. In Fig. 1 we plot first a comparison of the IRACmodel colors from Allen et al. (2004), Hartmann et al.(2005), and Whitney et al. (2003). In general, the modelspredict a similar range of IRAC colors for both Class I andClass II sources. Also in Fig. 1 we plot the same sample ofIRAC data (NGC 2068/71) from Muzerolle et al. (in prepa-ration) in three color-color planes that correspond to theclassification methods discussed above. In all diagrams,only those sources with detections in the three 2MASSbands, the four IRAC bands, and the MIPS 24-µm bandwere included. For the sake of comparison with pre-Spitzerwork, the points are coded according to their K–24-µm SEDslope. Prior to Spitzer, a commonly used four-class systemwas determined by the 2–10-µm (or 2–20-µm) slope (α),in which α > 0.3 = Class I, –0.3 ≤ α < 0.3 = “flat” spec-trum, –1.6 ≤ α < –0.3 = Class II, and α < –1.6 = Class III(photosphere) (Greene et al., 1994). A few of the sourcesin Fig. 1 have been observed spectroscopically and deter-mined to be T Tauri stars, background giants, or dwarfsunassociated with the cluster. These are indicated. The dia-grams also show the adopted regions of color space usedto roughly distinguish between Class I and Class II objects.
Classifications made with these methods are in generalagreement with each other, although some differences areapparent. For example, roughly 30% of Class I objects iden-tified with the Allen et al. (2004) method and detected at24 µm appear as Class II objects in the IRAC/MIPS-24 colorspace; however, many of these are borderline “flat spec-trum” sources where the separation between Class I and II issomewhat arbitrary and may not be physically meaningful.
These classification methods implicitly assume that allobjects that exhibit infrared excess are YSOs. However,there can be contamination from other sources, includingevolved stars, AGN, quasars, and high-redshift dusty gal-axies. Since most of these unrelated objects are faint high-redshift AGN (Stern et al., 2005), we have found that a mag-nitude cut of m3.6 < 14 will remove all but approximately10 non-YSOs per square degree within each of the IRAC-

Allen et al.: Structure and Evolution of Young Stellar Clusters 363
Fig. 1. Identifying and classifying young stars using near- and mid-infrared measurements. In the panel at top left, a comparison ofpredicted IRAC colors from Allen et al. (2004) (A04), Hartmann et al. (2005) (H05), and Whitney et al. (2003) (W03). Triangles rep-resent Class II models with Teff = 4000 K and a range of accretion rates, grain size distributions, and inclinations. Squares and circlesare Class I/0 models for a range of envelope density, centrifugal radius, and central source luminosity. In the remaining panels, weplot the data for the embedded cluster NGC 2068/71 (Muzerolle et al., in preparation). Point types are coded according to the mea-sured SED slope between 2 and 24 µm. Spectroscopically confirmed T Tauri, giant, and dwarf stars are indicated. In the top rightpanel, the large rectangle marks the adopted domain of Class II sources; the Class I domain is above and to the right (adapted fromAllen et al., 2004). In the bottom right panel (Gutermuth et al., in preparation), dereddened colors are separated into Class I and IIdomains by the dashed line. Diagonal lines outline the region where most of the classifiable sources are found. In the bottom leftpanel, the approximate domains of Class I and II sources are indicated by the solid lines. The dotted line represents the adopted thresholdfor excess emission at 3.6 and 4.5 µm; sources below this that exhibit large [8]–[24] excess are probably disks with large optically thinor evacuated holes (adapted from Muzerolle et al., 2004). Arrows show extinction vectors for AV = 30 (Flaherty et al., in preparation).These figures show that the various color planes considered here yield similar results when used to classify Spitzer sources.

364 Protostars and Planets V
only Class I and Class II loci, and all but a few non-YSOsper square degree from the IRAC/MIPS-24 loci, while re-taining most if not all of the cluster population.
2.2. Submillimeter and Millimeter
The youngest sources in star-forming regions are char-acterized by strong emission in the submillimeter and far-infrared, but ususally weak emission shortward of 24 µm.These “Class 0” objects were first discovered in submilli-meter surveys of molecular clouds (André et al., 1993).They are defined as protostars with half or more of theirmass still in their envelopes, and emitting at least 0.5% oftheir luminosity at submillimeter wavelengths. Motivatedin part by the discovery of Class 0 objects, observers haveimaged many embedded clusters in their dust continuumemission at millimeter and submillimeter wavelengths, re-vealing complex filamentary structure and many previouslyunknown sources (e.g., Motte et al., 1998, 2001; Sandelland Knee, 2001; Nutter et al., 2005).
These submillimeter and millimeter wavelength imagesgenerally have tens to hundreds of local maxima, but onlya small fraction of these are “protostars” having an internalheating source; the rest are “starless cores” having a maxi-mum of column density but no internal heating source. Thestandard way to determine whether a submillimeter sourceis a protostar or a starless core is to search for coincidencewith an infrared point source, such as a Spitzer source at 24or 70 µm, or a radio continuum point source, such as a VLAsource at 6 cm wavelength. For example, the protostarsNGC 1333-IRAS 4A, 4B, and 4C in Fig. 2 are each detectedat 850 µm (Sandell and Knee, 2001), and each has a coun-terpart in VLA observations (Rodriguez et al., 1999) andin 24-µm Spitzer observations, but not in the IRAC bands.In a few cases, Class 0 protostars such as VLA 1623 havebeen identified from their submillimeter emission and theirradio continuum, but not from their mid-infrared emission,because their mid-infrared emission is too heavily extin-guished (André et al., 2000).
2.3. X-Ray
Elevated X-ray emission is another signature of youth:Young stellar objects have typical X-ray luminosity 1000×that of the Sun. The e-folding decay time for this X-ray lu-minosity is a few hundred million years (see, e.g., Micelaet al., 1985; Walter and Barry, 1991; Dorren et al., 1995;Feigelson and Montmerle, 1999). Although the X-ray dataof young stellar clusters will be contaminated by AGN andother sources, this contamination can be reduced by iden-tifying optical/infrared counterparts to the X-ray sources.X-ray sources where the ratio of the X-ray luminosity tothe bolometric luminosity (LX/Lbol) ranges from 0.1% to0.01% are likely pre-main-sequence stars. In contrast to theinfrared techniques described in section 2.1, which can onlyidentify Class 0/I and II sources; X-ray observations canreadily detect Class II and Class III objects, with perhapssome bias toward Class III objects (Flacomio et al., 2003).
The main limitation of X-ray observations is the lack ofsensitivity toward lower mass stars. A complete sample ofstars requires a sensitivity toward sources with luminositiesas low as 1027 erg cm–2 s–1 (Feigelson et al., 2005); the sen-sitivity of most existing observations are an order of magni-tude higher. The observed X-ray luminosity is also affectedby extinction. Depending on the energy of the source, thesensitivity can be reduced by a factor of ten for sources atAV ~ 10 (Wolk et al., 2006).
2.4. Emission Lines and Variability
Among other techniques for identifying young clustermembers, spectroscopic surveys for emission lines andphotometric surveys for variability have been used success-fully at visible and near-IR wavelengths. The most com-mon means of identifying young stars spectroscopically isthrough detection of optical emission lines, in particular Hαat 6563 Å (Herbig and Bell, 1988). Large-scale objectiveprism (Wilking et al., 1987; Wiramihardja et al., 1989) andlater, wide-field multiobject spectroscopy (e.g., Hillenbrandet al., 1993) have been effective in identifying young starsin clusters and throughout molecular clouds; however, theymiss the deeply embedded members that are optically faintor invisible. This problem is partly alleviated by large-scalesurveys for photometric variability in the optical and near-IR. Recent near-IR surveys by Kaas (1999) and Carpenteret al. (2001, 2002) have been successful at identifying youngcluster members in Serpens, Orion, and Chamaeleon, re-spectively.
2.5. Star Counts
Much of the work on the density, size, and structure ofembedded clusters has relied on using star counts; indeed,the distribution of 2.2-µm sources were used to identifyclusters in the Orion B cloud in the seminal work of Ladaet al. (1991). Instead of identifying individual stars as mem-
Fig. 2. IRAC 4.5-µm and MIPS 24-µm images of IRAS-4 inNGC 1333. MIPS detects each of the three VLA sources, whileIRAC detects their outflows but not the driving sources.

Allen et al.: Structure and Evolution of Young Stellar Clusters 365
bers, methods based on star counts include all detectedsources and employ a statistical approach toward member-ship, in which an average density of background stars istypically estimated and subtracted out. In this analysis, thestar counts are typically smoothed to produce surface den-sity maps; a variety of smoothing algorithms are in the lit-erature (Gomez et al., 1993; Gladwin et al., 1999; Carpen-ter, 2000; Gutermuth et al., 2005; Cambresy et al., 2006).
The degree of contamination by foreground and back-ground stars is the most significant limitation for star-countmethods, and the efficacy of using star counts dependsstrongly on the surface density of contaminating stars. Inmany cases, the contamination can be minimized by set-ting a K-band brightness limit (Lada et al., 1991; Guter-muth, 2005). To estimate the position-dependent contamina-tion by field stars, models or measurements of the field stardensity can be combined with extinction maps of the mo-lecular cloud (Carpenter, 2000; Gutermuth et al., 2005;Cambresy, 2006). These maps are subtracted from the sur-face density of observed sources to produce maps of thedistribution of embedded stars; however, these maps are stilllimited by the remaining Poisson noise from the subtractedstars.
Star-count methods have the advantage that they do notdiscriminate against sources without infrared excess, brightX-ray emission, variability, or some other indication of
youth. On the other hand, they only work in regions wherethe surface density of member stars is higher than the sta-tistical noise from contaminating field stars. In Fig. 3 weshow maps of the IRAS 20050 cluster derived from the K-band star counts and from the distribution of infrared ex-cess sources. In the case of IRAS 20050, we find that thestar-count method provides a better map of the densest re-gions (due in part to confusion with bright nebulosity andsources in the Spitzer data), while the lower-density regionssurrounding these peaks are seen only in the distribution ofSpitzer-identified infrared excess sources (due to the highdensity of background stars).
3. THE STRUCTURE AND EVOLUTIONOF CLUSTERS: OBSERVATIONS
3.1. Identifying Clusters in Large-ScaleSurveys of Molecular Clouds
Unlike gravitationally bound open clusters or globularclusters, embedded clusters are not isolated objects. In mostcases, molecular cloud complexes contain multiple embed-ded clusters as well as distributed populations of relativelyisolated stars. Recent large-scale surveys and all-sky cata-logs are now providing new opportunities to study the prop-erties of embedded clusters through surveys of entire mo-
Fig. 3. IRAS 20050 surface densities derived from the statistical technique applied to all stars (left), and from identifying the infra-red-excess sources (right). In the left panel, all sources having K < 16 are plotted as a function of their position. Contours show thesurface density of K-band sources, starting at 1450 pc–2 (5σ above median field star density) and increasing at intervals of 750 pc–2.In the right panel, sources with infrared excess emission are plotted, and contours of their surface density are shown for 10, 60, 160,360, 760, and 1560 pc–2. The statistical technique (left) yields a higher peak surface density (~6000 pc–2 at the center) than the IR-excess technique (~3000 pc–2), but the latter is more sensitive to the spatially extended population of young stars.

366 Protostars and Planets V
lecular clouds. The advantage of studying clusters by sur-veying entire molecular clouds is twofold. First, the surveysprovide an unbiased sample of both the distributed and clus-tered populations within a molecular cloud. Second, thesurveys result in an unbiased measurement of the distribu-tion of cluster properties within a single cloud or ensembleof clouds. For the remainder of this discussion, we will usethe word “cluster” to denote embedded clusters of youngstars. Most of these clusters will not form bound open clus-ters (Lada and Lada, 1995).
We now concentrate on two recent surveys for youngstars in relatively nearby (<1 kpc) molecular clouds. Car-penter (2000) used the 2MASS 2nd incremental pointsource catalog to study the distribution of young stars inthe Orion A, Orion B, Perseus, and Monoceros R2 clouds.Since the 2nd incremental release did not cover the entiresky, only parts of the Orion B and Perseus clouds were stud-ied. More recently, Spitzer has surveyed a number of mo-lecular clouds. We discuss here new results from the SpitzerOrion Molecular Cloud Survey (Megeath et al., in prepa-ration) and the Cores to Disks (c2d) Legacy program sur-vey of the Ophiuchus Cloud (Allen et al., in preparation).We use these data to study the distribution of the numberof cluster members, the cluster radius, and the stellar den-sity in this small sample of clouds.
The advantage of using these two surveys is that theydraw from different techniques to identify populations ofyoung stellar objects. The analysis of the 2MASS data relieson star-counting methods (section 2.5), while the Spitzeranalysis relies on identifying young stars with infrared-ex-cesses from combined Spitzer and 2MASS photometry (sec-tion 2.1) (Megeath et al., in preparation). The 2MASS analy-sis is limited by the systematic and random noise from thebackground star subtraction, making the identification ofsmall groups and distributed stars subject to large uncer-tainties. The Spitzer analysis is limited to young stars withdisks or envelopes. A significant number of young stars inembedded clusters do not show excesses; this fraction mayrange from 20% to as much as 50% for 1–3-m.y. clusters(Haisch et al., 2001).
Carpenter (2000) identified stellar density peaks morethan six times the RMS background noise, and defined acluster as all stars in a closed 2σ contour surrounding thesepeaks. Megeath et al. (in preparation) defined clusters asgroups of 10 or more IR-excess sources in which eachmember is within a projected distance of 0.32 pc of anothermember (corresponding to a density of 10 stars pc–2). Onlygroups of ten or more neighbors are considered clusters.The clusters identified in the Spitzer survey are shown inFig. 4.
3.2. The Fraction of Stars in Large Clusters
It is now generally accepted that most stars form in clus-ters (Lada and Lada, 1995), but quantitative estimates ofthe fraction of stars that form in large clusters, small clus-ters, groups, and relative isolation are still uncertain. Porras
et al. (2003) compiled a list of all known groups and clus-ters with more than 5 members within 1 kpc of the Sun,while Lada and Lada (2003) compiled the properties of asample of 76 clusters with more than 36 members within2 kpc. Although these compilations are not complete, theyprobably give a representative sample of clusters in the near-est 1–2 kpc. In the sample of Porras et al. (2003), 80% ofthe stars are found in clusters with Nstar ≥ 100, and the morenumerous groups and small clusters contain only a smallfraction of the stars (see also Lada and Lada, 2003).
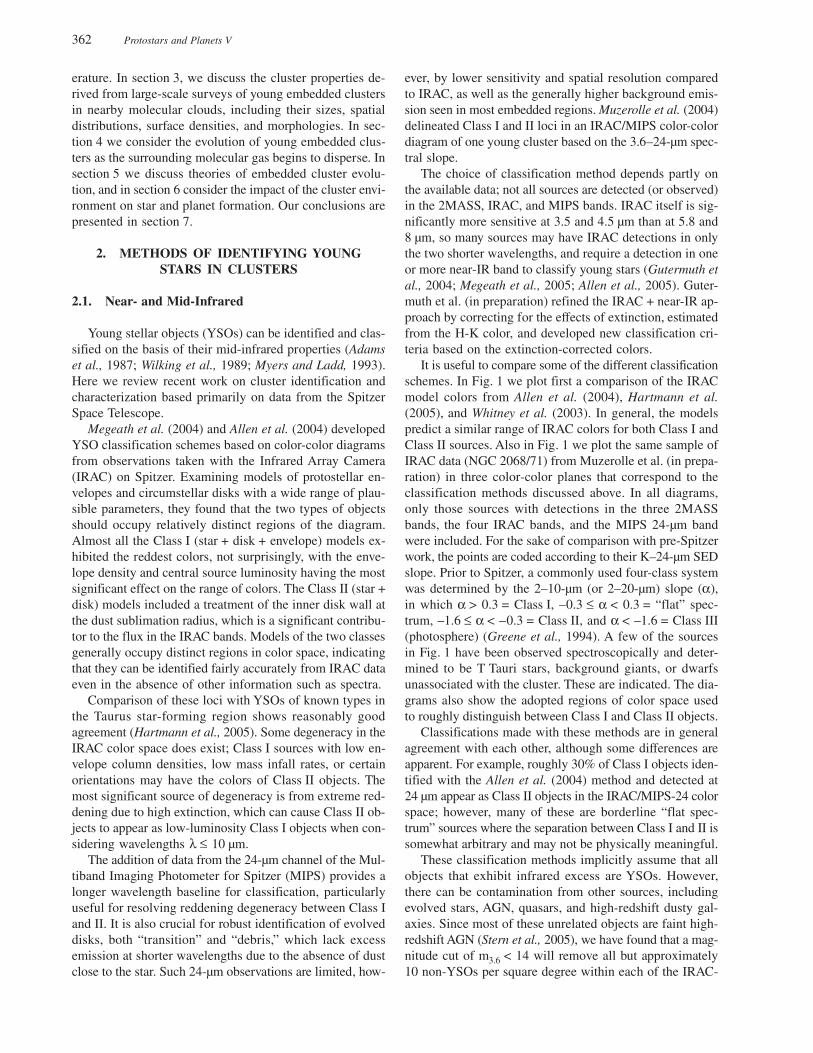
In Fig. 5, we plot the fraction of members from the2MASS and Spitzer surveys as a function of the numberof cluster size. Following the work of Porras et al. (2003),we divide the distribution into four sizes: Nstar ≥ 100, 100 >Nstar ≥ 30, 30 > Nstar ≥ 10, and Nstar < 10. The main differ-ence from the previous work is that we include a bin forNstar < 10; these we refer to as the distributed population.All the observed molecular clouds appear to contain a dis-tributed population. Carpenter (2000) estimated that thefraction of stars in the distributed population were 0%, 20%,27%, and 44% for the Orion B, Perseus, Orion A, andMon R2 cloud, respectively, although the estimated fractionranged from 0–66%, 13–41%, 0–61%, and 26–59%, de-pending on the assumptions made in the background starsubtraction. In the combined Spitzer survey sample, thefraction of distributed stars is 32–11%, 26–24%, and 25–21% for the Ophiuchus, Orion A, and Orion B clouds re-spectively. The uncertainty is due to contamination fromAGN: The higher fraction assumes no contamination, andthe lower number assumes that the distributed populationcontains 10 AGN for every square degree of map size. Theactual value will be in between those; extinction from thecloud will lower the density of AGN, and some of the con-taminating AGN will be found toward clusters. In total,these measurements suggest that typically 20–25% of thestars are in the distributed population.
There are several caveats with this analysis. The first isthe lack of completeness in the existing surveys. Carpen-ter (2000) considered the values of Nstar as lower limits dueto incompleteness and due to the masking of parts of theclusters to avoid artifacts from bright sources. Complete-ness is also an issue in the center of the Orion Nebula Cluster(ONC) for the Spitzer measurements. Also, we have not cor-rected the Spitzer data for the fraction of stars that do notshow infrared excesses; the actual number of stars may beas much as a factor of two higher (Gutermuth et al., 2004).
Another uncertainty is in the definition of the clusters.The clusters identified by these two methods are not en-tirely consistent. For example, in Orion A there is an un-certainty in the boundaries of the ONC. There is a large haloof stars surrounding this cluster, and the fraction of youngstars in large clusters is dependent on whether stars aregrouped in the ONC, in nearby smaller groups, or the dis-tributed population. Both the 2MASS and the Spitzer datalead to an expansive definition of this cluster, extendingbeyond the Orion nebula and incorporating the OMC 2/3and NGC 1977 regions, as well the L 1641 North group for

Allen et al.: Structure and Evolution of Young Stellar Clusters 367
the 2MASS analysis. The resulting cluster contains a signi-ficant number of stars in a relatively low stellar density en-vironment far from the O stars exciting in the nebula, whichdiffers significantly from the environment of the dense coreof the cluster embedded in the Orion nebula. The treatmentof the ONC is critical to this analysis: 50% (for the 2MASSsample) to 76% (for the Spitzer sample) of the stars in largeclusters (Nstar ≥ 100) are found in the ONC.
A final caveat is that these results apply to the currentepoch of star formation in the nearest kiloparsec. While thelargest cluster within 1 kpc is the ONC with 1000–2000members, a growing number of young super star clusters,which contain many thousands of stars, have been detectedin our galaxy. Super star clusters may bridge the gap be-tween embedded clusters in the nearest kiloparsec, and theprogenitors of the globular clusters that formed earlier in
Fig. 4. The spatial distribution of all Spitzer identified infrared excess sources from the combined IRAC and 2MASS photometry ofOrion A (left), Orion B (right), and Ophiuchus (bottom center). The contours outline the Bell Labs 13CO maps for the Orion A and Bclouds (Bally et al., 1987; Miesch and Bally, 1994), and an AV map of Ophiuchus (Huard, personal communication, 2006). The smallgray dots show all the detections in the Spitzer 3.6- and 4.5-µm bands with magnitudes brighter than 15th and uncertainties less than0.15. The large gray dots are the sources with infrared excesses. The black circles and triangles are sources found in clusters using themethod described in section 3.1; the two symbols are alternated so that neighboring clusters can be differentiated. Note that there aretwo clusters in the Orion A cloud that are below the lower boundary of the Bell Labs map. Each of the clouds has a significant dis-tributed population of IR-excess sources.
368 Protostars and Planets V
our galaxy’s history. Thus, the distribution of cluster sizeswe have derived may not be representative for other regionsof the galaxy, or early epochs in our galaxy’s evolution.
3.3. The Surface Density of Stars inEmbedded Clusters
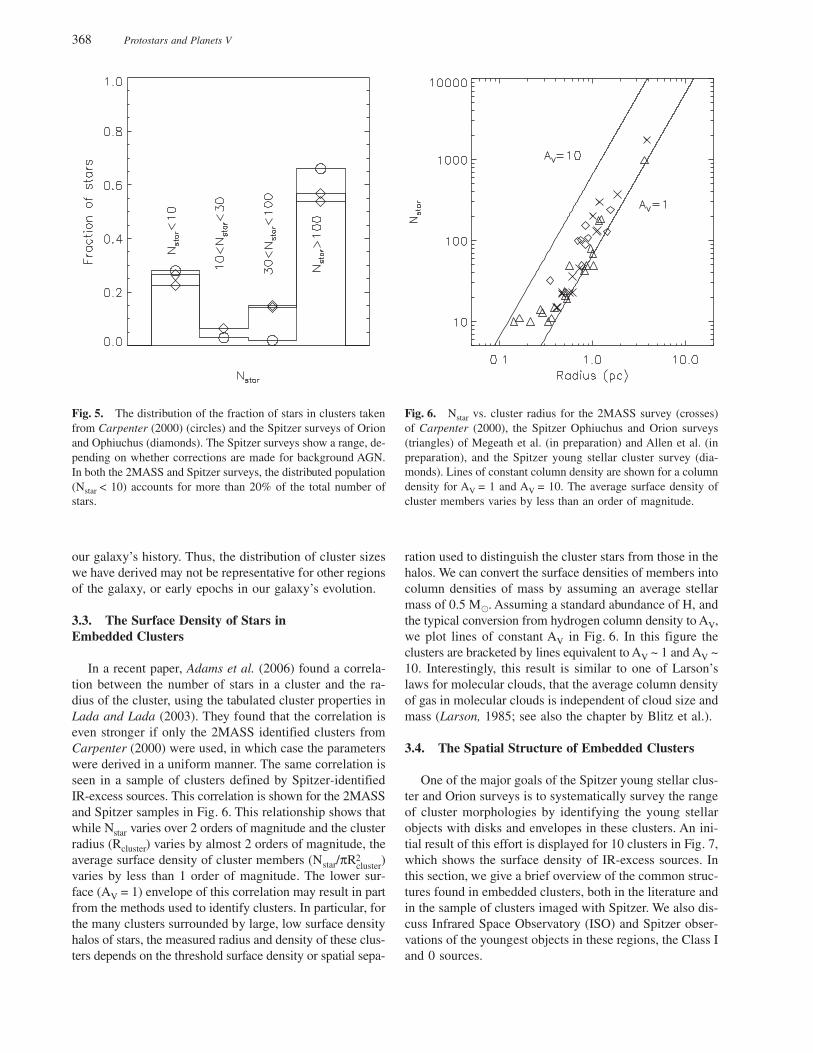
In a recent paper, Adams et al. (2006) found a correla-tion between the number of stars in a cluster and the ra-dius of the cluster, using the tabulated cluster properties inLada and Lada (2003). They found that the correlation iseven stronger if only the 2MASS identified clusters fromCarpenter (2000) were used, in which case the parameterswere derived in a uniform manner. The same correlation isseen in a sample of clusters defined by Spitzer-identifiedIR-excess sources. This correlation is shown for the 2MASSand Spitzer samples in Fig. 6. This relationship shows thatwhile Nstar varies over 2 orders of magnitude and the clusterradius (Rcluster) varies by almost 2 orders of magnitude, theaverage surface density of cluster members (Nstar/πR2
cluster)varies by less than 1 order of magnitude. The lower sur-face (AV = 1) envelope of this correlation may result in partfrom the methods used to identify clusters. In particular, forthe many clusters surrounded by large, low surface densityhalos of stars, the measured radius and density of these clus-ters depends on the threshold surface density or spatial sepa-
ration used to distinguish the cluster stars from those in thehalos. We can convert the surface densities of members intocolumn densities of mass by assuming an average stellarmass of 0.5 M . Assuming a standard abundance of H, andthe typical conversion from hydrogen column density to AV,we plot lines of constant AV in Fig. 6. In this figure theclusters are bracketed by lines equivalent to AV ~ 1 and AV ~10. Interestingly, this result is similar to one of Larson’slaws for molecular clouds, that the average column densityof gas in molecular clouds is independent of cloud size andmass (Larson, 1985; see also the chapter by Blitz et al.).
3.4. The Spatial Structure of Embedded Clusters
One of the major goals of the Spitzer young stellar clus-ter and Orion surveys is to systematically survey the rangeof cluster morphologies by identifying the young stellarobjects with disks and envelopes in these clusters. An ini-tial result of this effort is displayed for 10 clusters in Fig. 7,which shows the surface density of IR-excess sources. Inthis section, we give a brief overview of the common struc-tures found in embedded clusters, both in the literature andin the sample of clusters imaged with Spitzer. We also dis-cuss Infrared Space Observatory (ISO) and Spitzer obser-vations of the youngest objects in these regions, the Class Iand 0 sources.
Fig. 5. The distribution of the fraction of stars in clusters takenfrom Carpenter (2000) (circles) and the Spitzer surveys of Orionand Ophiuchus (diamonds). The Spitzer surveys show a range, de-pending on whether corrections are made for background AGN.In both the 2MASS and Spitzer surveys, the distributed population(Nstar < 10) accounts for more than 20% of the total number ofstars.
Fig. 6. Nstar vs. cluster radius for the 2MASS survey (crosses)of Carpenter (2000), the Spitzer Ophiuchus and Orion surveys(triangles) of Megeath et al. (in preparation) and Allen et al. (inpreparation), and the Spitzer young stellar cluster survey (dia-monds). Lines of constant column density are shown for a columndensity for AV = 1 and AV = 10. The average surface density ofcluster members varies by less than an order of magnitude.

Allen et al.: Structure and Evolution of Young Stellar Clusters 369
Many of the clusters shown in Fig. 7 appear elongated;this had also been evident in some of the earlier studies ofclusters (Carpenter et al., 1997; Hillenbrand and Hartmann,1998). To quantify this asymmetry, Gutermuth et al. (2005;Gutermuth et al., in preparation) compared the distributionof stars as a function of position angle to Monte Carlo simu-lations of circularly symmetric clusters, and demonstratedthat the elongation is statistically significant in three of thesix clusters in their sample. The elongation appears to be aresult of the primordial structure in the cloud; for the twoelongated clusters that have 850-µm dust continuum maps,the elongation of the cluster is aligned with filamentarystructure seen in the parental molecular cloud. This suggeststhat the elongation results from the formation of the clus-ters in highly elongated, or filamentary, molecular clouds.
Not all clusters are elongated. Gutermuth et al. (2005)found no significant elongation of the NGC 7129 cluster, aregion that also showed a significantly lower mean and peakstellar surface density than the more elongated clusters inhis sample. Since the cluster was also centered in a cavity
in the molecular cloud (see section 5), they proposed thatthe lack of elongation was due to the expansion of the clus-ter following the dissipation of the molecular gas. However,not all circularly symmetric clusters are easily explained byexpansion; Gutermuth et al. (in preparation) find two deeplyembedded clusters with no significant elongation or clumps,but no sign of the gas dispersal evident in NGC 7129. Thesetwo clusters, Cepheus A and AFGL 490, show azimuthalsymmetry, which may reflect the primordial structure of thecluster.
Examination of Fig. 7 reveals another common structure:low-density halos surrounding the dense centers, or cores, ofthe clusters. With the exception of AFGL 490 and perhapsCepheus A, all the clusters in Fig. 7 show cores and halos.The core-halo structure of clusters has been studied quan-titatively through azimuthally smoothed radial density pro-files (Muench et al., 2003). Although these density profilescan be fit by power laws, King models, or exponential func-tions (Lada and Lada, 1995; Horner et al., 1997; Hillen-brand and Hartmann, 1998; Gutermuth, 2005), the resulting
Fig. 7. The distribution of infrared excess sources in ten clusters surveyed with Spitzer. The contours are at 1, 10, and 100 IR-excesssources pc–2. These data clearly show that clusters are not circularly symmetric, but are often elongated. Some of the clusters, such asIRAS 20050, show distinct clumpy structure, although much of the small-scale structure seen in the highest contours is due to statis-tical fluctuations in the smoothing scale. The three most circularly symmetric clusters are Cepheus A, AFGL 490, and NGC 7129; theirregular structure in these clusters is due in part to statistical fluctuations in regions of lower surface density.

370 Protostars and Planets V
fits and their physical implications can be misleading. Aspointed out by Hartmann (2004), azimuthally averaged den-sity profiles can be significantly steepened by elongation[Hartmann (2004) argues this for molecular cores, but thesame argument applies to clusters]. A more sophisticatedtreatment is required to study the density profiles of elon-gated clusters.
It has long been noted that young stellar clusters aresometimes composed of multiple subclusters (Lada et al.,1996; Chen et al., 1997; Megeath and Wilson, 1997; Allenet al., 2002; Testi, 2002). Clusters with multiple densitypeaks or subclusters were classified as heirarchical clustersby Lada and Lada (2003). In some cases it is difficult todistinguish between two individual clusters and subclusterswithin a single cluster. Examples are the NGC 2068 andNGC 2071 clusters in the Orion B cloud (Fig. 4). Theseappear as two peaks in a more extended distribution of stars,although the cluster identification method described in sec-tion 3.1 separated the two peaks into two neighboring clus-ters. In the sample of Gutermuth et al. (2005; Gutermuth etal., in preparation), clumpy structure was most apparent inthe IRAS 20050 cluster (see also Chen et al., 1997). In thiscluster, the subclusters are asociated with distinct clumpsin the 850-µm map of the associated molecular cloud. Thissuggests that like elongation, subclusters result from struc-tures in the parental molecular cloud.
3.5. The Distribution of Protostars
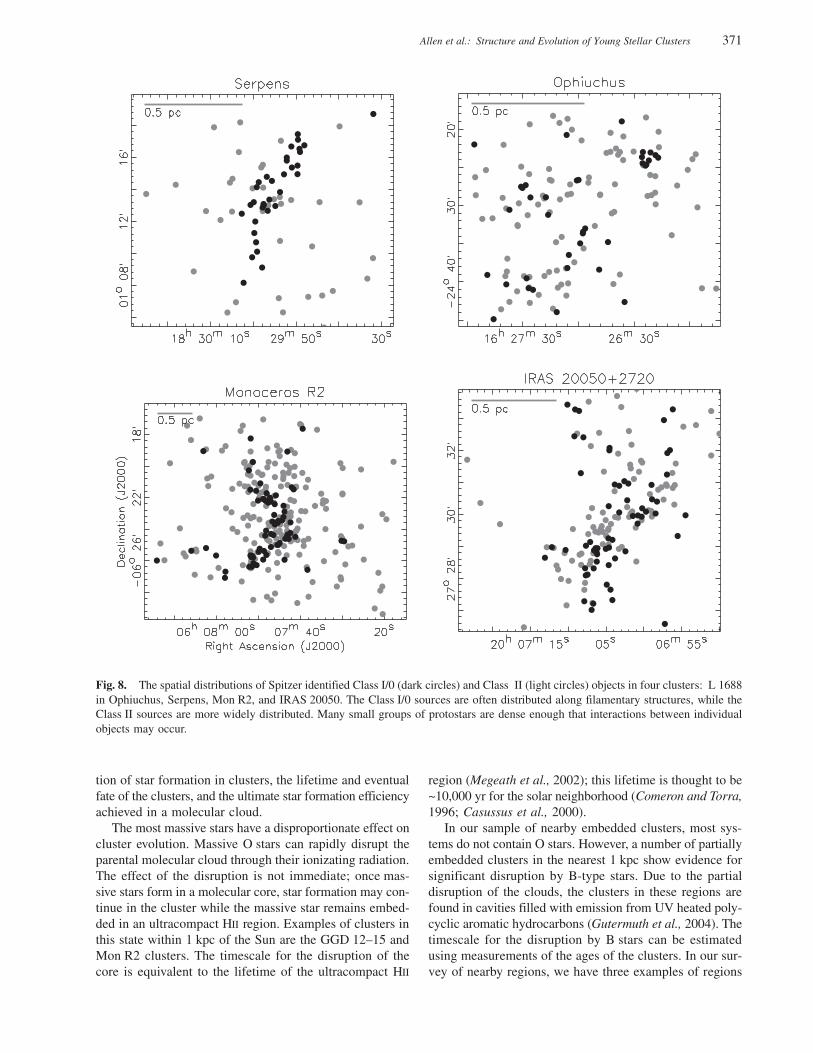
If the observed morphologies of embedded clusters re-sult from the filamentary and clumpy nature of the parentalmolecular clouds, then the younger Class 0/I objects, whichhave had the least time to move away from their star forma-tion sites, should show more pronounced structures than theolder, pre-main-sequence Class II and Class III stars. Ladaet al. (2000) found a deeply embedded population of youngstellar objects with large K-L colors toward the ONC; theseprotostar candidates showed a much more elongated andclumpy structure than the young pre-main-sequence starsin the Orion nebula. Using the methods described in sec-tion 2.1, we have identified Class 0/I and II objects in clus-ters using combined Spitzer and groundbased near-IR pho-tometry. In Fig. 8, we plot the distribution of Class 0/I andII sources for four clusters in our sample. In the L 1688 andIRAS 20050 clusters, the protostars fall preferentially insmall subclusters and are less widely distributed than theClass II objects. In the Serpens and GGD 12–15 clusters,the protostars are organized into highly elongated distri-butions. An interesting example containing multiple elon-gated distributions of protostars is the “spokes” cluster ofNGC 2264, which shows several linear chains of protostarsextending from a bright infrared source (Teixeira et al.,2006). These chains, which give the impression of spokeson a wheel, follow filamentary structures in the molecularcloud. These data support the view that the elongation andsubclustering are indeed the result of the primordial distri-bution of the parental dense gas. It is less clear whether the
observed halos result from dynamical evolution or originatein situ in less-active regions of star formation surroundingthe more active cluster cores. The current data suggest thatthe halos are at least in part primordial; Class 0/I objectsare observed in the halos of many clusters (Gutermuth et al.,2004; Megeath et al., 2004).
The spacing of protostars is an important constraint onthe physical mechanisms for fragmentation and possiblesubsequent interactions by protostars. Kaas et al. (2004)analyzed the spacing of Class I and II objects identified inISO imaging of the Serpens cluster. They calculated theseparations of pairs of Class I objects, and found that thedistribution of these separations peaked at 0.12 pc. In com-parison, the distribution of separations for Class II objectsshow only a broad peak at 0.2–0.6 pc; this reflects the morespatially confined distributions of protostars discussed in theprevious section. Teixeira et al. (2006) performed a similaranalysis for the sample of protostars identified in the spokescluster of NGC 2264. The distribution of nearest neighborseparations for this sample peaked at 0.085 pc; this spacingis similar to the Jeans length calculated from observationsof the surrounding molecular gas.
Although the observed typical spacing of protostars inSerpens and NGC 2264 apears to be ~0.1 pc, as shown inFig. 8, dense groups of protostars are observed in both theseregions (and others) in which several Class I/0 sources arefound within a region 0.1 pc in diameter. This is the dis-tance a protostar could move in 100,000 yr (the nominalprotostellar lifetime) at a velocity of 1 km s–1. This suggeststhat if the velocity dispersion of protostars is comparableto the turbulent velocity dispersion observed in molecularclouds, interactions between protostars may occur, particu-larly in dense groupings. On the other hand, observationsof some dense star-forming clumps show motions throughtheir envelopes much less than 1 km s–1 (Walsh et al., 2004).The densest grouping of protostars so far identified in theSpitzer survey is found in the spokes cluster. One of theprotostars in the spokes has been resolved into a small sys-tem of 10 protostars by groundbased near-IR imaging andby Spitzer IRAC imaging. These protostars are found in aregion 10,000 AU in diameter. It is not clear whether theseobjects are in a bound system, facilitating interactions asthe sources orbit within the system, or whether the stars aredrifting apart as the molecular gas binding the region isdispersed by the evident outflows (Young et al., 2006). Itshould be noted that this group of 10 protostars appears tobe the only such system in the spokes cluster. Thus, al-though dense groups of protostars are present in star-form-ing regions, they may not be common.
4. GAS DISRUPTION AND THE LIFETIMEOF EMBEDDED CLUSTERS
In the current picture of cluster evolution, star formationis terminated when the parental gas has dispersed. An un-derstanding of the mechanisms and timescales for the dis-ruption of the gas is necessary for understanding the dura-
Allen et al.: Structure and Evolution of Young Stellar Clusters 371
tion of star formation in clusters, the lifetime and eventualfate of the clusters, and the ultimate star formation efficiencyachieved in a molecular cloud.
The most massive stars have a disproportionate effect oncluster evolution. Massive O stars can rapidly disrupt theparental molecular cloud through their ionizating radiation.The effect of the disruption is not immediate; once mas-sive stars form in a molecular core, star formation may con-tinue in the cluster while the massive star remains embed-ded in an ultracompact HII region. Examples of clusters inthis state within 1 kpc of the Sun are the GGD 12–15 andMon R2 clusters. The timescale for the disruption of thecore is equivalent to the lifetime of the ultracompact HII
region (Megeath et al., 2002); this lifetime is thought to be~10,000 yr for the solar neighborhood (Comeron and Torra,1996; Casussus et al., 2000).
In our sample of nearby embedded clusters, most sys-tems do not contain O stars. However, a number of partiallyembedded clusters in the nearest 1 kpc show evidence forsignificant disruption by B-type stars. Due to the partialdisruption of the clouds, the clusters in these regions arefound in cavities filled with emission from UV heated poly-cyclic aromatic hydrocarbons (Gutermuth et al., 2004). Thetimescale for the disruption by B stars can be estimatedusing measurements of the ages of the clusters. In our sur-vey of nearby regions, we have three examples of regions
Fig. 8. The spatial distributions of Spitzer identified Class I/0 (dark circles) and Class II (light circles) objects in four clusters: L 1688in Ophiuchus, Serpens, Mon R2, and IRAS 20050. The Class I/0 sources are often distributed along filamentary structures, while theClass II sources are more widely distributed. Many small groups of protostars are dense enough that interactions between individualobjects may occur.

372 Protostars and Planets V
with such cavities: NGC 7129 (earliest member B2), IC 348(earliest member B5), and IC 5146 (earliest member B0-1),with ages of 2 m.y., 3 m.y. and 1 m.y., respectively (Hillen-brand et al., 1992; Hillenbrand, 1995; Herbig and Dahm,2002; Luhman et al., 2003). The presence of large, UV illu-minated cavities in these regions suggest that the nonion-izing FUV from B stars may be effective at heating andevaporating molecular cloud surfaces in cases where intenseFUV radiation from O stars is not present. For example, inthe case of NGC 7129, Morris et al. (2004) find that thetemperature at the molecular cloud surface has been heatedto 700 K by the FUV radiation. Future work is needed todetermine if the high temperatures created by the FUV radi-ation can lead to substantial evaporative flows.
In regions without OB stars, however, some other mecha-nism must operate. An example is IRAS 20050. Based onSCUBA maps, as well as the reddening of the members,Gutermuth et al. (2005) found that the cluster is partiallyoffset from the associated molecular gas, suggesting thatthe gas had been partially dispersed by the young starsAlthough this region contains no OB stars, it displays multi-ple outflows (Chen et al., 1997). Another example may bethe NGC 1333 cloud, where Quillen et al. (2005) found evi-dence of wind-blown cavities in the molecular gas. In theseregions, outflows may be primarily responsible for dissi-pating the dense molecular gas (e.g., Matzner and McKee,2000).
It is important to note that star formation continues dur-ing the gas dissipation process. Even when the gas aroundthe main cluster has been largely disrupted (such is the casein the ONC, IC 348, and NGC 7129), star formation con-tinues on the outskirts of the cluster in regions where thegas which has not been removed. Thus, the duration of starformation in these regions appears similar to the gas dis-persal time of ~1–3 m.y. Older clusters have not been foundpartially embedded in their molecular gas (Leisawitz et al.,1989).
5. EARLY CLUSTER EVOLUTION
Theories of cluster formation are reviewed elsewhere inthis volume (see chapters by Ballesteros-Paredes et al. andBonnell et al.). Here we will discuss the dynamical evolu-tion of young clusters during the first few million years.
Although most stars seem to form within clusters ofsome type (see section 4), only about 10% of stars are bornwithin star-forming units that are destined to become openclusters. As a result, for perhaps 90% of forming stars, thedestruction of their birth aggregates is an important issue.Star formation in these systems is not 100% efficient, so agreat deal of cluster gas remains in the system. This gas-eous component leaves the system in a relatively short time(a few million years; see above) and its departure acts tounbind the cluster. At the zeroth level of understanding, ifthe star-formation efficiency (SFE) is less than 50%, thena substantial amount of unbinding occurs when gas is re-moved. However, this description is overly simple. The stars
in the system will always have a distribution of velocities.When gas is removed, stars on the high-velocity tail of thedistribution will always leave the system (even for very highSFE) and those on the extreme low-velocity tail will tendto stay (even for low SFE). The fraction of stars that remainbound after gas removal is thus a smooth function of star-formation efficiency [several authors have tried to calculatethe function (see Lada et al., 1984; Adams, 2000; Boily andKroupa, 2003a,b)]. The exact form of the bound fraction,fb(ε), which is a function of SFE, depends on many othercluster properties: gas removal rates, concentration of thecluster, total depth of the cluster potential well, the distribu-tion functions for the stellar velocities (radial vs. isotropic),and the spatial profiles of the gaseous and stellar compo-nents (essentially, the SFE as a function of radial position).At the crudest level, the bound fraction function has theform fb ≈ ε , but the aforementioned complications allowfor a range of forms.
The manner in which a cluster spreads out and dissolvesafter its gas is removed is another important problem. Aftergas removal, clusters are expected to retain some stars asdescribed above, but such systems are relatively short-lived.For example, consider a cluster with N = 100 in its earlyembedded phase, before gas removal. After the gas leaves,typically one-half to two-thirds of the stars will become un-bound along with the gas. The part of the cluster that re-mains bound will thus contain only N = 30–50 stars. Smallgroups with N < 36 have relaxation times that are shorterthan their crossing times (Adams, 2000), and such smallunits will exhibit different dynamical behavior than theirlarger counterparts. In particular, such systems will relaxquickly and will not remain visible as clusters for very long.
As more data are taken, another mismatch between the-ory and observations seems to be emerging: The theoreticalcalculations described above start with an established clusterwith a well-defined velocity distribution function, and thenremove the gaseous component and follow the evolution.Given the constant column density relationship for clusters(section 3.4), that the velocity of the stars are virialized, andassuming that 30% of the cluster mass is in stars (see Ladaand Lada, 2003), then the crossing time for the typical clus-ter in our sample is ~1 m.y. (although it can be shorter in thedense centers of clusters). As a result, in rough terms, the gasremoval time, the duration of star formation, and the cross-ing time are comparable. This implies that partially em-bedded clusters may not have enough time to form relaxed,virial clusters; this in turn may explain in part the range ofmorphologies discussed in section 3.
6. EFFECTS OF CLUSTERS ON STARAND PLANET FORMATION
The radiation fields produced by the cluster environmentcan have an important impact on stars and planets formedwithin. Both the EUV and FUV radiation can drive diskevaporation (Shu et al., 1993; Johnstone et al., 1998; Störzerand Hollenbach, 1999; Armitage, 2000). In the modest-

Allen et al.: Structure and Evolution of Young Stellar Clusters 373
sized clusters of interest here (100–1000 stars), the massloss driven by FUV radiation generally dominates (e.g.,Adams et al., 2004), although EUV photoevaporation canalso be important (Shu et al., 1993; Johnstone et al., 1998;Störzer and Hollenbach, 1999; Armitage, 2000). For clus-ters with typical cluster membership, e.g., with Nstar = 300(section 3.1), the average solar system is exposed to a FUVflux of G ≈ 1000–3000 (Adams et al., 2006), where G = 1corresponds to a flux of 1.6 × 10⁻³ erg cm–2 s–1. FUV fluxesof this magnitude will evaporate a disk orbiting a solar-typestar down to a truncation radius of about 50 AU over a time-scale of 4 m.y. As a result, planet-forming disks are rela-tively immune in the regions thought to be relevant for mak-ing giant gaseous planets. Forming solar systems aroundsmaller stars are more easily evaporated for two reasons.First, the central potential well is less deep, so the stellargravity holds less tightly onto the disk gas, which is moreeasily evaporated. Second, we expect the disk mass to scalelinearly with stellar mass so that disks around smaller starshave a smaller supply and can be evaporated more quickly.With these disadvantages, M stars with 0.25 M can beevaporated down to 10 AU in 4 m.y. with an FUV radiationfield of G = 3000. In larger clusters with more massive stars,Adams et al. (2004) find that regions with strong FUV andEUV can affect disks around solar mass stars on solar sys-tem size scales, truncating an initially 100 AU disk to aradius of 30 AU in 4 m.y.
A full assessment of the importance of UV radiation ondisks needs to be informed by the observed properties ofclusters. What fraction of stars in the Spitzer and 2MASSsamples are found in clusters with significant EUV radia-tion fields? We use the presence of an HII region as an indi-cator of a EUV field. In the Spitzer sample (the Orion A,Orion B, and Ophiuchus clouds), the two clusters with HII
regions contain 45% of the IR-excess sources. In the 2MASSsample (Orion A, Orion B, Perseus, and Mon R2), 55% ofthe young stars are found in the four clusters with HII re-gions. Thus, a significant fraction of stars is found in clus-ters with HII regions. However, in both the 2MASS andSpitzer samples most of the stars found in clusters with HII
regions are found in the ONC. The ONC has a radius of4 pc and many of the low-mass stars in this cluster are morethan a parsec away from the massive stars, which are con-centrated in the center of the cluster. Thus, the fraction ofstars exposed to a significant EUV field appears to be lessthan 50%. However, a more systematic determination of thisfraction should be made as data become available.
In addition to driving photoevaporation, EUV radiation(and X-rays) can help ionize the disk gas. This effect ispotentially important. One of the most important mecha-nisms for producing disk viscosity is through magneto-rota-tional instability (MRI), and this instability depends on hav-ing a substantial ionization fraction in the disk. One problemwith this idea is that the disk can become too cold and theionization fraction can become too low to sustain the tur-bulence. If the background environment of the cluster pro-vides enough EUV radiation, then the cluster environment
can be important for helping drive disk accretion. Clusterscan also have an affect on the processes of star and planetformation through dynamical interactions. This raises a vari-ant of the classic question of nature vs. nurture: Are theproperties of the protostars and the emergent stars influ-enced by interactions, or are they primarily the result ofinitial conditions in a relatively isolated collapse? The nu-merical simulations of cloud collapse and cluster formation(Bate et al., 2003; Bonnell et al., 2003, 2004) predict thatinteractions are important, with the individual protostarscompetively accreting gas from a common reservoir as theymove through the cloud, and dynamical interactions be-tween protostars resulting in ejections from the cloud.
We assess the importance of interactions given our cur-rent understanding of cluster structure. The density of clus-ters, and of protostars in clusters, suggest that if stars movewith velocities similar to the turbulent gas velocity (~1 kms–1), interactions can occur in the lifetime of a protostar(100,000 yr). Gutermuth et al. (2005) found typical stellardensities of 104 stars pc–3 in the cores of two young clus-ters. If the velocity dispersion is 1 km s–1, most protostarswill pass within 1000 AU — the size of a protostellar en-velope — of another star or protostars within a protostellarlifetime. The observed spacing of Class I/0 sources discussedin section 3.2 also suggests that interactions can occur insome cases. At these distances protostars could compete forgas or interact through collisions of their envelopes. Inter-estingly, recent data suggest that, at least in some clusters,the observed prestellar clumps that make up the initial statesfor star formation are not moving dynamically, but ratherhave subvirial velocities (Walsh et al., 2004; Peretto et al.,2006). If these clusters are typical, then interactions betweenprotostars in clusters would be minimal.
Given the observed surface densities of clusters, is itpossible that a cluster could result from the collapse of in-dividual, noninteracting prestellar cores (i.e., nature overnurture?). If the starting density profile of an individual starformation event can be modeled as an isothermal sphere,then its radial size would be given by r = GM*/2a2 ≈ 0.03 pc(where we use a typical stellar mass of M* = 0.5 M andsound speed a = 0.2 km s–1). A spherical volume of radiusR = 1 pc can thus hold about 37,000 of these smaller spheres(in a close-packed configuration). Thus, we can concludethat there is no a priori geometrical requirement for the in-dividual star-forming units to interact.
Once a star sheds or accretes its protostellar envelope,direct collisions are relatively rare because their cross sec-tions are small. Other interactions are much more likely tooccur because they have larger cross sections. For example,the disks around newly formed stars can interact with eachother or with passing binaries and be truncated (Ostriker,1994; Kobayashi and Ida, 2001). In rough terms, these stud-ies indicate that a passing star can truncate a circumstellardisk down to a radius rd that is one-third of the impact pa-rameter. In addition, newly formed planetary systems caninteract with each other, and with passing binary star sys-tems, and change the planetary orbits (Adams and Laughlin,

374 Protostars and Planets V
2001). In a similar vein, binaries and single stars can inter-act with each other, exchange partners, form new binaries,and/or ionize existing binaries (Rasio et al., 1995; McMillanand Hut, 1996).
To affect a disk on a solar system (40 AU) scale requiresa close approach at a distance of 100 AU or less. Gutermuthet al. (2005) estimated the rate of such approaches for thedense cores of clusters. They estimate that for the typicaldensity of 104 stars per pc–3, the interaction time is 107 yr,longer than the lifetime of the cluster. For N-body models ofthe modest-sized clusters of interest here (100–1000 mem-bers), the typical star/disk system is expected to experienceabout one close encounter within 1000 AU over the next~5 m.y. while the cluster remains intact; close encounterswithin 100 AU are rare (e.g., Smith and Bonnell, 2001;Adams et al., 2006). Given that lifetime of the cluster is lessthan 5 m.y., these models again indicate a minimal effecton nascent solar systems.
7. CONCLUSIONS
1. The distribution of cluster properties: Systematicsurveys of giant molecular clouds from 2MASS and Spitzer,as well as targeted surveys of individual clusters, are pro-viding the first measurements of the range and distributionof cluster properties in the nearest kiloparsec. Although moststars appear in groups or clusters, in many star-formingregions there is a significant distributed component. Theseresults suggest that there is a continuum of star-forming en-vironments from relative isolation to dense clusters. Theo-ries of star formation must take into account (and eventuallyexplain) this observed distribution. The 2MASS and Spitzersurveys also show a correlation between number of mem-ber stars and the radii of clusters, such that the average sur-face density of stars varies by a factor of only ~5.
2. The structure of young stellar clusters: Commoncluster morphologies include elongation, low-density halos,and subclustering. The observed cluster and molecular gasmorphologies are similar, especially when only the young-est Class I/0 sources are considered. This similarity suggeststhat these morphologies (except possibly halos) result fromthe distribution of fragmentation sites in the parental cloud,and not the subsequent dynamical evolution of the cluster.Consequently, the surface densities and morphologies ofclusters are important constraints on models of the birth ofclusters.
3. The evolution of clusters: The evolution of clustersis driven initially by the formation of stars, and then lateron by the dissipation of gas. Gas dissipation appears to bedriven by different processes in different regions, includingphotoevaporation by EUV radiation from O stars, photo-evaporation by FUV radiation from B stars, and outflowsfrom lower-mass stars. Much of the gas appears to be dissi-pated in 3 m.y., which is a few times the crossing time andthe duration of star formation in these clusters. With theseshort timescales, clusters probably never reach dynamicalequilibrium in the embedded phase. The survival of clusters
as the gas is dispersed is primarily a function of the size ofthe cluster, the efficiency of star formation, and the rate atwhich the gas is dispersed.
4. The impact of clustering on star and planet forma-tion: FUV and EUV radiation from massive stars can ef-fectively truncate disks in a few million years. EUV radia-tion is needed to affect disks around solar type stars on solarsystem scales (<40 AU) in the lifetime of the cluster. Withinour sample of molecular clouds, fewer than 50% of the starsare found in regions with strong EUV fields. The observedspacing of protostars suggest that dynamical interactionsand competitive accretion may occur in the denser regionsof the observed clusters. However, evidence of subvirial ve-locities of prestellar condensations in at least one clusterhints that these interactions may not be important. Giventhe densities and lifetimes of the observed clusters, dynami-cal interactions do not appear to be an important mecha-nism for truncating disks on solar system size scales.
Acknowledgments. This work is based in part on observa-tions made with the Spitzer Space Telescope, which is operatedby the Jet Propulsion Laboratory, California Institute of Technol-ogy, under NASA Contract 1407. Support for this work was pro-vided by NASA through Contract Numbers 1256790 and 960785,issued by JPL/Caltech. P.C.M. acknowledges a grant from theSpitzer Legacy Science Program to the “Cores to Disks” team anda grant from the NASA Origins of Solar Systems Program. S.J.W.received support from Chandra X-ray Center Contract NAS8-39073. F.C.A. is supported by NASA through the Terrestrial PlanetFinder Mission (NNG04G190G) and the Astrophysics TheoryProgram (NNG04GK56G0).
REFERENCES
Adams F. C. (2000) Astrophys. J., 542, 964–973.Adams F. C. and Laughlin G. (2001) Icarus, 150, 151–162.Adams F. C., Lada C. J., and Shu F. H. (1987) Astrophys. J., 312, 788–
806.Adams F. C., Hollenbach D., Laughlin G., and Gorti U. (2004) Astrophys.
J., 611, 360–379.Adams F. C., Proszkow E. M., Fatuzzo M., and Myers P. C. (2006) Astro-
phys. J., 641, 504–525.Allen L. E., Myers P. C., Di Francesco J., Mathieu R., Chen H., and Young
E. (2002) Astrophys. J., 566, 993–1004.Allen L. E., Calvet N., D’Alessio P., Merin B., Hartmann L., Megeath
S. T., et al. (2004) Astrophys. J. Suppl., 154, 363–366.Allen L. E., Hora J. L., Megeath S. T., Deutsch L. K., Fazio G. G.,
Chavarria L., and Dell R. D. (2005) In Massive Star Birth: A Cross-roads of Astrophysics (R. Cesaroni et al., eds.), pp. 352–357. Cam-bridge Univ., Cambridge.
André P., Ward-Thompson D., and Barsony M. (1993) Astrophys. J., 406,122–141.
André P., Ward-Thompson D., and Barsony M. (2000) In Protostars andProtoplanets IV (V. Mannings et al., eds.), pp. 59–96. Univ. of Ari-zona, Tucson.
Armitage P. J. (2000) Astron. Astrophys., 362, 968–972.Bally J., Stark A. A., Wilson R. W., and Langer W. D. (1987) Astrophys. J.,
312, L45–L49.Bate M. R., Bonnell I. A., and Bromm V. (2003) Mon. Not. R. Astron.
Soc., 339, 577–599.Boily C. M. and Kroupa P. (2003a) Mon. Not. R. Astron. Soc., 338, 665–
672.

Allen et al.: Structure and Evolution of Young Stellar Clusters 375
Boily C. M. and Kroupa P. (2003b) Mon. Not. R. Astron. Soc., 338, 673–686.
Bonnell I. A., Bate M., and Vine S. G. (2003) Mon. Not. R. Astron. Soc.,343, 413–418.
Bonnell I. A., Vine S. G., and Bate M. (2004) Mon. Not. R. Astron. Soc.,349, 735–741.
Cambrésy L., Petropoulou V., Kontizas M., and Kontizas E. (2006) Astron.Astrophys., 445, 999–1003.
Carpenter J. M. (2000) Astron. J., 120, 3139–3161.Carpenter J. M., Meyer M. R., Dougados C., Strom S. E., and Hillenbrand
L. A. (1997) Astron. J., 114, 198–221.Carpenter J. M., Hillenbrand L. A., and Skrutskie M. F. (2001) Astron. J.,
121, 3160–3190.Carpenter J. M., Hillenbrand L. A., SkrutskieM. F., and Meyer M. R.
(2002) Astron. J., 124, 1001–1025.Casassus S., Bronfman L., May J., and Nyman L. A. (2000) Astron. Astro-
phys., 358, 514–520.Chen H., Tafalla M., Greene T. P., Myers P. C., and Wilner D. J. (1997)
Astrophys. J., 475, 163–172.Comeron F. and Torra J. (1996) Astron. Astrophys., 314, 776–784.Dorren J. D., Guedel M., and Guinan E. F. (1995) Astrophys. J., 448, 431–
436.Evans N. J. II, Allen L. E., Blake G. A., Boogert A. C. A., Bourke T., et al.
(2003) Publ. Astron. Soc. Pac., 115, 965–980.Feigelson E. D. and Montmerle T. (1999) Ann. Rev. Astron. Astrophys.,
37, 363–408.Feigelson E. D., Getman K., Townsley L., Garmire G., Preibisch T.,
Grosso N., Montmerle T., Muench A., and McCaughrean M. (2005)Astrophys. J. Suppl., 160, 379–389.
Flaccomio E., Damiani F., Micela G., Sciortino S., Harnden F. R., MurrayS. S., and Wolk S. J. (2003) Astrophys. J., 582, 398–409.
Gladwin P. P., Kitsionas S., Boffin H. M. J., and Whitworth A. P. (1999)Mon. Not. R. Astron. Soc., 302, 305–313.
Gomez M., Hartmann L., Kenyon S. J., and Hewett R. (1993) Astron. J.,105, 1927–1937.
Greene T. P., Wilking B. A., André, P., Young, E. T., and Lada C. J. (1994)Astrophys. J., 434, 614–626.
Gutermuth R. A. (2005) Ph.D. thesis, Univ. of Rochester.Gutermuth R. A., Megeath S. T., Muzerolle J., Allen L. E., Pipher J. L.,
Myers P. C., and Fazio G. G. (2004) Astrophys. J. Suppl., 154, 374–378.
Gutermuth R. A., Megeath S. T., Pipher J. L.,Williams J. P., Allen L. E.,Myers P. C., and Raines S. N. (2005) Astrophys. J., 632, 397–420.
Haisch K. E., Lada E. A., and Lada C. J. (2001) Astrophys. J., 553, L153–L156.
Hartmann L. (2004) In Star Formation at High Angular Resolution (M.Burton et al., eds.), pp. 201–211. ASP Conf. Series 221, San Fran-cisco.
Hartmann L., Megeath S. T., Allen L., Luhman K., Calvet N., et al. (2005)Astrophys. J., 629, 881–896.
Herbig G. H. and Bell K. R. (1998) Lick Observatory Bulletin, SantaCruz: Lick Observatory, 1995, VizieR Online Data Catalog, 5073.
Herbig G. H. and Dahm S. E. (2002) Astron. J., 123, 304–327.Hillenbrand L. A. (1995) Ph.D. thesis, Univ. of Massachusetts.Hillenbrand L. A. and Hartmann L. (1998) Astrophys. J., 492, 540.Hillenbrand L. A., Strom S. E., Vrba F. J., and Keene J. (1992) Astrophys.
J., 397, 613–643.Hillenbrand L. A., Massey P., Strom S. E., and Merrill K. M. (1993)
Astron. J., 106, 1906–1946.Horner D. J., Lada E. A., and Lada C. J. (1997) Astron. J., 113, 1788–
1798.Johnstone D., Hollenbach D. J., and Bally J. (1998) Astrophys. J., 499,
758–776.Kaas A. A. (1999) Astron. J., 118, 558–571.Kaas A. A., Olofsson G., Bontemps S., André P., Nordh L., et al. (2004)
Astron. Astrophys., 421, 623–642.Kobayashi H. and Ida S. (2001) Icarus, 153, 416–429.Lada C. J. and Lada E. A. (1995) Astron. J., 109, 1682–1696.
Lada C. J. and Lada E. A. (2003) Ann. Rev. Astron. Astrophys., 41, 57–115.
Lada C. J., Margulis M., and Dearborn D. (1984) Astrophys. J., 285, 141–152.
Lada C. J., Alves J., and Lada E. A. (1996) Astron. J., 1111, 1964–1976.Lada C. J., Muench A. A., Haisch K. E., Lada E. A., Alves J. F., Tollestrup
E. V., and Willner S. P. (2000) Astron. J., 120, 3162–3176.Lada E. A., Evans N. J. II, Depoy D. L., and Gatley I. (1991) Astrophys. J.,
371, 171–182.Larson R. B. (1985) Mon. Not. R. Astron. Soc., 214, 379–398.Leisawitz D., Bash F. N., and Thaddeus P. (1989) Astrophys. J. Suppl.,
70, 731–812.Luhman K. L., Stauffer J. R., Muench A. A., Rieke G. H., Lada E. A.,
Bouvier J., and Lada C. J. (2003) Astrophys. J., 593, 1093–1115.Matzner C. D. and McKee C. F. (2000) Astrophys. J., 545, 364–378.McMillan S. L. W. and Hut P. (1996) Astrophys. J., 467, 348–358.Megeath S. T. and Wilson T. L. (1997) Astron. J., 114, 1106–1120.Megeath S. T., Biller B., Dame, T. M., Leass E., Whitaker R. S., and
Wilson T. L. (2002) Hot Star Workshop III: The Earliest Stages ofMassive Star Formation (P. A. Crowther, ed.), pp. 257–265. ASPConf. Series 267, San Francisco.
Megeath S. T., Allen L. E., Gutermuth R. A., Pipher J. L., Myers P. C.,et al. (2004) Astrophys. J. Suppl., 154, 367–373.
Megeath S. T., Flaherty K. M., Hora J., Allen L. E., Fazio G. G., et al.(2005) Massive Star Birth: A Crossroads of Astrophysics (R. Cesaroniet al., eds.), pp. 383–388. Cambridge Univ., Cambridge.
Micela G., Sciortino S., Serio S., Vaiana G. S., Bookbinder J., Golub L.,Harnden F. R., and Rosner R. (1985) Astrophys. J., 292, 172–180.
Miesch M. S. and Bally J. (1994) Astrophys. J., 429, 645–671.Morris P. W., Noriega-Crespo A., Marleau F. R., Teplitz H. I., Uchida K. I.,
and Armus L. (2004) Astrophys. J. Suppl., 154, 339–343.Motte F., André P., and Neri R. (1998) Astron. Astrophys., 336, 150–172.Motte F., André P., Ward-Thompson D., and Bontemps S. (2001) Astron.
Astrophys., 372, L41–L44.Muench A. A., Lada E. A., Lada C. J., Elston R. J., Alves J. F., Horrobin
M., Huard T. H., et al. (2003) Astron. J., 125, 2029–2049.Muzerolle J., Megeath S. T., Gutermuth R. A., Allen L. E., Pipher J. L.,
et al. (2004) Astrophys. J. Suppl., 154, 379–384.Myers P. C. and Ladd E. F. (1993) Astrophys. J., 413, L47–L50.Nutter D. J., Ward-Thompson D., and André P. (2005) Mon. Not. R.
Astron. Soc., 357, 975–982.Ostriker E. C. (1994) Astrophys. J., 424, 292–318.Peretto N., André P., and Belloche A. (2006) Astron. Astrophys., 445, 879–
998.Porras A., Christopher M., Allen L., Di Francesco J., Megeath S. T., and
Myers P. C. (2003) Astron. J., 126, 1916–1924.Quillen A. C., Thorndike S. L., Cunninghman A., Frank A., Gutermuth
R. A., Blackmann E. G., Pipher J. L, and Ridge N. (2005) Astrophys.J., 632, 941–955.
Rasio F. A., McMillan S., and Hut P. (1995) Astrophys. J., 438, L33–L36.
Rodríguez L. F., Anglada G., and Curiel S. (1999) Astrophys. J. Suppl.,125, 427–438.
Sandell G. and Knee L. B. G. (2001) Astrophys. J., 546, L49–L52.Shu F. H., Johnstone D., and Hollenbach D. J. (1993) Icarus, 106, 92–
101.Smith K. W. and Bonnell I. A. (2001) Mon. Not. R. Astron. Soc., 322,
L1–L4.Stern D., Eisenhardt P., Gorjian V., Kochanek C. S., and Caldwell N.
(2005) Astrophys. J., 631, 163–168.Störzer H. and Hollenbach D. (1999) Astrophys. J., 515, 669–684.Teixeira P. S., Lada C. J., Young E. T., Marengo M., and Muench A., et al.
(2006) Astrophys. J., 636, L45–L48.Testi L. (2002) In Modes of Star Formation and the Origin of Field Popu-
lations (E. K. Grebel and W. Brandner, eds.), pp. 60–70. ASP Conf.Series 285, San Francisco.
Walsh A. J., Myers P. C., and Burton M. G. (2004) Astrophys. J., 614,194–202.

376 Protostars and Planets V
Walter F. M. and Barry D. C. (1991) The Sun in Time (C. P. Sonett et al.,eds.), pp. 633–657. Univ. of Arizona, Tucson.
Whitney B. A., Wood K., Bjorkman J. E., and Cohen M. (2003) Astro-phys. J., 598, 1079–1099.
Wilking B. A., Schwartz R. D., and Blackwell J.-H. (1987) Astron. J., 94,106–110.
Wilking B. A., Lada C. J., and Young E. T. (1989) Astrophys. J., 340,823–852.
Wiramihardja S. D., Kogure T., Yoshida S., Ogura K., and Nakano M.(1989) Publ. Astron. Soc. Pac., 41, 155–174.
Wolk S., Spitzbart B. D., Bourke T. L., and Alves J. (2006) Astron. J., 132,1100–1125.
Young E. T., Teixeira P., Lada C. J., Muzerolle J., Persson S. E., et al.(2006) Astrophys. J., 642, 972–978.