the structure of hematite {001} surfaces by scanning ... of applied earth sciences, stanford...
TRANSCRIPT

American Mineralogist, Volume 77, pages 911-922, 1992
The structure of hematite {001} surfaces by scanning tunneling microscopy:Image interpretation, surface relaxation, and step structure
C.q.nnrcx M. Eccr,nsroNxDepartment of Applied Earth Sciences, Stanford University, Stanford, California 94305-2225,U.5.4.
Mrcrr,tnr, F. HocrrBr.r.a, Jn.Department of Geology, Stanford University, Stanford, California 94305-2115, U.S.A.
Ansrntcr
Scanning tunneling microscopy (STM) is used to study the structure of {001} hematitesingle-crystal surfaces. STM images taken at negative sample bias consistently show ahexagonal array ofatomic sites with 3-A periodicity, as expected for the surface O arrayand in agreement with photoelectron spectroscopy studies of hematite surfaces after O,and HrO exposure which show that states at the top ofthe valence band have O character.Molecular orbital calculations suggest that these states are localized on O sites. In contrast,STM images taken at positive sample bias were variable, sometimes showing hexagonalarrays with O periodicity and sometimes showing arrays with equivalent Fe periodicity.Moreover, because the states at the base ofthe conduction band are not necessarily local-ized on atomic sites, the STM images taken at positive sample bias may not show atomicposrtrons.
With the above findings in mind, we used negative bias images to study relaxation ofO positions on the hematite {001} surface. Surface O positions are apparently relaxed toa regularized hexagonal array with a single-mode distribution of O-O interatomic distanc-es; in the equivalent bulk plane, O-O distances form a bimodal distribution because ofdistortion by octahedral face sharing across the (001) plane.
STM images also show that step densities on hematite {001} fracture surfaces are high,often one step every 20-30 A. The atomic structure near step edges appears to be recon-structed relative to terraces, but convolution of atomic and electronic structure informa-tion in STM images makes precise interpretation of step structure difficult.
INrnonuct:roN
Many geochemically important reactions occur at min-eral surfaces and are strongly influenced by surface atom-ic and electronic structure (e.g., see Hochella, 1990). Thesestructures determine the variety and nature of bondingenvironments and energetic pathways available to reac-tants as they adsorb, diffuse across the surface, and par-ticipate in surface reactions. In general, the structure ofasolid surface differs from that of a simple bulk termina-tion. Surface reconstruction refers to a surface reorgani-zation that results in a surface unit cell of different size(and often symmetry) from that of the equivalent bulkplane. Reconstruction usually involves the breakage andformation of bonds, and activation energies for recon-struction are therefore relatively high. Surface relaxationrefers to slight displacements of surface atoms in responseto force asymmetries at the surface; the surface unit cellremains nearly unchanged (e.g., Hochella et al., 1990;Hochella, 1990; Brown, 1990). In general, all surfacesrelax to some extent (Somorjai, 1981).
* Present address: Swiss Federal Institute of Technology, EA-WAG/ETHZ, CH-8600 Diibendorf, Switzerland.
0003404x/92l0910-o9l l$02.00 9l I
An example of surface reconstruction is the technolog-ically important Si (l I l) 7 x 7, whose surface unit cellis seven times larger along both axes than the unrecon-structed cell, hence "7 x 7." In vacuum, this reconstruc-tion reduces the number of dangling bonds at the surfacefrom 49 to 19 per unit cell. Surface energy is thus mini-mized by satisfaction of dangling bonds; dangling bondsmay also be satisfied by chemisorption (for a geologicexample, see Parks, 1984). In contrast, surface relaxationreduces surface energy because surface atoms adjust tominimum potential energy positions within the asym-metric force environment at the surface.
Direct probing of surface structure can thus lead to newunderstanding of reaction mechanisms (e.g., Eggleston andHochella, 1991) as well as of the thermodynamics of sur-faces (e.g., Williams and Bartelt, l99l); that is, we maystudy the microscopic structural basis for properties pre-viously only observed indirectly. For example, surface orinterfacial energy (a thermodynamic property) is a crucialpart of theories concerned with the nucleation of newphases (e.g.,Zhang and Nancollas, 1990), the nucleationof etch pits (Lasaga and Blum, 1986; Brantley et al., 1986),and brittle fracture (Lawn and Wilshaw, 1975). Ther-

912 EGGLESTON AND HOCHELLA: STM OF HEMATITE {OOI} SURFACES
t 00 t l
ttoo'l
Shared Edges
short O-O dlstances
Tr iang les w l th long 0-0 d ls tances
Fig. 1. (A) A model of a segnent of the bulk hematite struc-ture (calculated from the refinement of Blake et al., 1966). Crys-tallographic directions are indicated. O layers alternate with Felayers in the [001] direction. High-Fe atoms on the {001 } surfacesit above shared octahedral faces, and low-Fe atoms sit aboveunshared faces. (B) Polyhedron model of the hematite bulkstructure. Several face-sharing and edge-sharing octahedra aremarked. (C) The hematite structure projected on {001i. A sur-face unit cell, corresponding in size to the bulk unit-cell face inthe {001} plane, is drawn so as to connect equivalent O posi-tions. Three O triangles are indicated with connecting lines toillustrate the occurrence oflarge and small O triplets within anO plane. The site marked A is referred to in Figure 6.
modynamic discussions of solid surface energies may befound in Jaycock and Parfitt (1981), Adamson (1982),and Parks (1990), and treatments relating simple surfaceatomic structures to surface energies may be found inBenson and Yun (1967), Giese (1974), and Sparnaay(1985 ) .
In this paper, we report the results of a scanning tun-neling microscopy (STM) study of the atomic structureof hematite {001} surfaces, including interpretation ofSTM images taken under various imaging conditions, ev-idence for surface relaxation, and indications of recon-struction along step edges. Iron oxides and oxyhydroxides
are ofinterest because they are ubiquitous in nature andmay often influence natural HrO chemistry (e.g., Schwert-mann and Taylor, 1977;,Bolt and Van Riemsdijk, 1987;Stumm and Sulzberger, 1992). They are particularly im-portant in natural redox processes (e.g., Waite, 1990), andtheir redox and photoredox reactivity is a strong functionof surface atomic and electronic structure (Leland andBard, 1987). Hematite redox activity has led to interestin hematite electrodes for industrial purposes (e.g., Kurtzand Henrich, 1983; Henrich, 1985). From a purely struc-tural point of view, hematite is an interesting materialbecause its bulk structure contains distorted edge- andface-sharing octahedra, suggesting the possibility of sig-nifi cant surface relaxations.
Hntrarrrn srRUcruRE
Bulk structure
The bulk hematite structure may be thought of as ahexagonally closest-packed array of O atoms, with Fe at-oms in two-thirds of the octahedral sites. Figure lA showsa section of bulk structure in which O layers alternatewith layers of Fe along [001]. The high-Fe atoms on the(001) face ofFigure lA are above O triplets that consti-tute a shared octahedral face with the next layer down;Fe-Fe repulsion causes these Fe atoms to move as faraway from the shared face as possible. The low-Fe atomsare above unshared faces (vacancies in the layer below).Figure lB illustrates some face-sharing, edge-sharing, andvacant octahedra. This face and edge sharing causes sub-stantial distortion of the ideal hexagonal closest-packedstructure (Lindsley, 1976). Specifically, the three O atomsof the shared octahedral face move closer together thanthey would be in an ideal octahedron, and the O atomsof the unshared faces move farther apart. Therefore, withina single (001) O plane (see Fig. lC), two large O triangles(edge length 3.035 A) alternate with single small O tri-angles (edge length 2.669 A;. fne Fe-O bond lengths are1.945 A to the unshared face and 2.116 A to the sharedface. These may be compared with an Fe-O distance of2.06 A for maghemite (Fasiska, 1967), which has nearlyideal octahedral site geometry (Lindsley, 1976; Sherman,1985); Fe-O bonds in hematite are strained relative tothis "unstrained" Fe-O distance.
Surface structure
Hematite parts along {001}. During fracture, the {001}plane provides a pathway along which only long Fe-Obonds need be broken (Krrtz and Henrich, 1983; Johns-son et al., 1991). If this occurs, the Fe atoms bonded tothe unshared faces (the low-Fe atoms in Fig. 1A) are leftbehind, creating a polar surface; that is, the top layer ofatorns on each ofthe opposing fracture surfaces consistsentirely of positive charge. This, together with the strainednature of the bulk structure, is thought to provide a largedriving force for chemisorption, relaxation, or recon-struction (Henrich, 1985; Pisani et al., 1987).
Few studies have been made of the hematite {001}surface structure. Kurtz and Henrich (1983) used low-
Tr l ang le w l t h

EGGLESTON AND HOCHELLA: STM OF HEMATITE {001} SURFACES 9t3
energy electron diffraction (LEED) and X-ray photo-electron spectroscopy (XPS) to study hematite {001} inultrahigh vacuum (UHV) after ion sputter cleaning andannealing at 700 and 820 'C. Their surface treatmentsproduced an O-deficient surface containing Fe2* and Feoin addition to Fe3* and exhibiting2 x 2,16 x f3R30'(R : rotated), and "complicated incommensurate" re-constructions. These structures result from sputtering andannealing in UHV (with loss of O from the surface) andprobably do not exist under ambient conditions (Kurtzand Henrich, 1983). Hochella et al. (1989) studied he-matite {001 } by LEED at room temperature, without pre-treatment, and found an unreconstructed I x 1 surface.Heil et al. (1989) imaged hematite with STM ar roomtemperature and described the results as consistent withthe structure expected from a bulk termination (i.e., I x1), although details ofinterpretation were not addressed(see below). Johnsson et al. (1991) studied hematite {001}surfaces with both STM and scanning force microscopy(SFM) and found a I x I surface structure (see below).
Alumina (a-AlrOJ is isostructural with hematite andis more extensively studied because of its importance asa catalytic support and as a template for the epitaxialgrowth of Si. Charig (1967) and Chang (1968), usingLEED, found unreconstructed surfaces for unheated sam-ples. Heating over 900 'C produced either a V3 "\43R30", a 3\/3 x 3\a3R30", or a r/3T x V3TRtan t(3/,r)'/2 reconstruction. Heating over 1400 "C pro-duced V4T x 1,r3lR tar t(3/,,)t/2 structure over the entiresurface. French and Somorjai (1970) found similar re-sults, attributed the reconstructions to surface nonstoi-chiometry (O, was detected by mass spectrometry duringheating in UHV), and suggested that isostructural com-pounds might behave similarly (this prediction is at leastpartially confirmed for hematite by Kurtz and Henrich,1983). Susnitzky and Carter (1984) found evidence for a16 t r,|inf0o surface structure in TEM studies of thina-AlrO. f,lms; the reconstruction probably resulted fromelectron beam heating.
The available information on a-FerO, and a-AlrO,{001} surface structures suggests that an unreconstructedI x I surface structure should be stable up to 700 "C onhematite in UHV. The I x I structure is stable to evenhigher temperatures in air; Charig (1967) found that heat-ing a-AlrO. to 1250 oC in air did not reconstruct thesurface. None of these studies attempted to determinesurface atomic positions; surface relaxation on hematite{001} and a-AlrO3 has, to our knowledge, never beenexperimentally examined.
Several theoretical studies have been made of surfacerelaxation on a-AlrO, {001}. Pisani et al. (1987) used amolecular orbital (MO) approach and a slab model of thesurface in which only relaxation of the surface Al atomsparallel to the [001] direction was considered. They founda 0.4-A relaxation of the surface Al atoms toward thefirst O layer (in effect, their calculation predicts that sur-face Al becomes embedded in the first O layer to form acharge-balanced surface). Causa et al. (1989) extended theresults ofPisani et at. (1987) and found 0.4-A rehxation
of first-layer Al toward the surface, wrJ.h a 260/o reductionin surface energy relative to the unrelaxed surface.
None of the experimental or theoretical studies ofa-FerO, and a-AlrO, {001} consider the possibility ofsurface relaxation within the {001} plane or ofrelaxationof O atoms in the [001] direction. Also, most of the stud-ies mentioned above apply only to UHV; the threefold-coordinated-surface Al atoms in the theoretical studies(together with the surface energy and relaxation calculat-ed for this configuration) would not be expected to existunder ambient conditions. Because STM can be used inair or under fluids, our results extend the studies men-tioned above to conditions more closely approximatingthose under which hematite surfaces would participate ingeochemical reactions.
Electronic structure
Molecular orbital (MO) calculations have been madefor FeO!- clusters by Tossell etal. (1973,1974), Debnathand Anderson (1982), and Sherman (1985). These cal-culations suggest that the highest occupied molecular or-bitals (HOMOs) in hematiteJike clusters are crystal-fieldorbitals with substantial Fe 3d character and that stateswith O 2p character occur just below these HOMOs andare localized on O sites. The lowest unoccupied MOs(LUMOs) have mixed Fe and O character and are spa-tially diffuse (Tossell et al., 1974), with substantial statedensity in the interatomic region. The HOMOs andLUMOs of these cluster calculations would spread intobands in the bulk solid.
Valence band photoelectron spectra of hematite {001}surfaces are found in Tossell etal. (1973), Henrich (1985),Hendewerk et al. (1986), and Kurtz and Henrich (1987).By varying the O content of hematite surfaces by sput-tering, annealing, and exposure to Or, Kurtz and Henrich(1987) show that an Fe-related surface state lies at thetop ofthe valence band, within the bulk band gap, andthat states with O character lie below this state. BecauseSTM is sensitive to the electronic states closest to theFermi level (E.), surface states play an important role inimaging. Kurtz and Henrich (1987) show that exposureof hematite {001} surfaces to O, depopulates the Fe-re-lated surface state, leaving states with O character at thetop ofthe valence band.
This situation may be rationalized by considering thecreation of a hematite (001) surface by fracture in vacu-um; the newly created surface has threefold-coordinatedFe in the first layer (Fe is sixfold coordinated in bulk) andthreefold coordinated O in the second layer (O is fourfoldcoordinated in bulk; see Fig. lC). Changes in electrostaticsite potential because of coordinative undersaturation atthe surface will stabilize or destabilize states in energy,creating surface states. Because surface Fe is less bulklikethan surface O for the fresh (001) surface in vacuum, thesurface states are likely to be mostly Fe related, as ob-served by Kurtz and Henrich (1987). However, in air orHrO, surface Fe and O would be recoordinated by H'O,02, OH , etc. Fe sites would regain octahedral coordi-nation, except for asymmetry caused by differences in Fe
914 EGGLESTON AND HOCHELLA: STM OF HEMATITE {001} SURFACES
bonding to O in sorbate species (e.g., HrO). Presumably,surface O dangling bonds would also be satisfied bychemisorption but not by bonding to Fe atoms as in thebulk. The most likely adsorbate would be H atoms in, ordissociated from, HrO molecules (see Hendewerk et a1.,1986; Kurtz and Henrich, 1987). Thus, after chemisorp-tion of species from air, we might predict that surface Osites would be less bulklike than Fe sites and that surfacestates would most likely have O character. These stateswould correspond to partially satisfied O 2p dangling bondstates at the surface, localized on O sites. Waite (1990)suggests that for a relatively ionic crystal such as hema-tite, surface states below.Eo are indeed most likely to haveanionic character, whereas surface states above E, arelikely to have cationic character. This overall result is inagreement with the photoelectron spectra discussed abovefor hematite surfaces after O, and HrO exposure.
Expnnrnmxr.Lr,
Samples
Large, specular hematite crystals from Minas Gerais,Brazil, were obtained from the Stanford Mineral Collec-tion. Samples were fractured along the (001) parting planein air, and suitably flat surfaces were used for STM im-aging. All imaged surfaces had been exposed to air for atleast several hours. Hematite is an extrinsic semiconduc-tor; charge carriers are contributed by impurities in thenatural samples, and hematite can be either n or p type(Shuey, 1975; Waite, 1990). We have not determinedwhether our samples were n or p type, but we predict thatthey are p type: XPS of fresh {001} surfaces showed theexpected composition and Fe oxidation state, and minorMn impurities were found that would be expected to cre-ate holes in the valence band.
Tunneling microscopy
STM has been reviewed elsewhere (e.g., Hochella et al.,1989; Avouris, 1990; Eggleston and Hochella, 1990).Briefly, a very sharp metal tip is piezoelectrically scannedover a conducting or semiconducting sample surface, closeenough (approximately l0 A) for overlap of tip and sam-ple electron density. Electrons can tunnel across the tip-sample gap, and when a small bias voltage (2") is applieda net tunneling current (1-) can be measured. The con-stant-height imaging mode is used for atomic-resolutionimaging in this study because it requires little mechanicalresponse, often resulting in less noisy images. Thus, inthe gray-scale images, dark areas represent low 1, andlight areas represent high 1r. A feedback loop keeps theaverage I, as close as possible to a user-defined setpointcurrent, 1r.",. In efect, the tip-sample separation is keptnearly constant.
STM images show essentially the local density of states(LDOS) near -8. at the surface (e.g., Avouris, 1990). Thebias voltage and its polarity determine which states of thesample are imaged. In this study, bias voltage is appliedto the sample; negative Zu causes electrons to tunnel from
occupied sample states to the tip, and positive tr/" causestunneling from the tip to unoccupied sample states.
STM imaging was accomplished using a Digital Instru-ments Nanoscope II. W tips were made by electrochem-ical etching in I M KOH. Specific imaging conditions(Vu, 1r"",) are given in the figure captions. Samples wereimaged under polyphenyl ether, a high molecular weight,nonpolar oil; nonconductive oils do not appear in or in-terfere with atomic-resolution STM images (Schneir andHansma, 1987; Hochella et al., 1989). Imaging under oiloften results in less noisy images, perhaps by minimizingionic leakage currents.
The images presented below show effects of thermaland piezoelectric drift, efects which are ubiquitous inSTM imaging. Drift causes nonorthogonality in the tipraster pattern and results in artifactual distortion of theatomic arrangement. Drift effects are usually obvious be-cause they vary in a systematic way with scan directionand rate. Drift effects, together with vibrational noise andpiezoelectric calibration errors, make determination ofatomic positions and atom-atom distances from STMimages inexact. However, if one has drift-independentinformation about the size and symmetry of the surfaceunit cell, drift effects can be accounted for. LEED byHochella et al. (1989) shows that the hematite surfaceunit cell has a size and symmetry that is within error ofthe bulk unit cell in the {001} plane. Thus we may safelyassume that the apparent distortions in unit-cell size andsymmetry in the STM images are drift efects. As we shalldiscuss, however, the arrangement of atoms within thesurface unit cell may differ from that in the equivalentbulk plane.
Rnsur,rs AND DrscussloN
Irnage interpretation
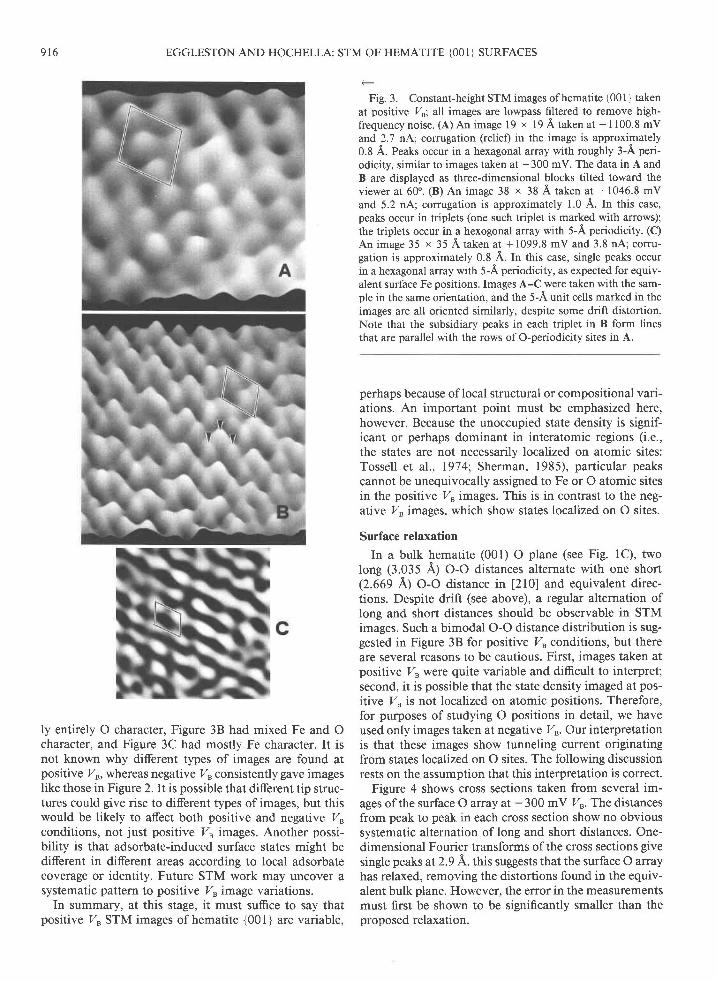
Figure 2 shows two examples of STM images of a he-matite {001} surface taken at -300 mV 2", conditionsunder which electrons tunnel from occupied valence band(or surface) states into the tip; a surface unit cell corre-sponding to the bulk (001) plane (Fig. lC) has been su-perimposed on these images. There are peaks at each cor-ner of the cell and two peaks entirely within it; these peakpositions correspond approximately (but not exactly, aswe discuss below) to O positions in the model cell (Fig.lC). Fe sites do not occur in the pattern observed in Fig-ure 2. Many images were taken under negative VB con-ditions, using various samples and tips, and all consis-tently showed arrays similar to those in Figure 2.
If any Fe atoms lie above the O planes imaged in Figure2, they are not imaged. Although UV photoelectron spec-troscopy (UPS) studies of the hematite {001} surface inUHV show an Fe-related surface state at the top of thevalence band (Kurtz and Henrich, 1987), the electronicstructure in air or HrO is likely to differ from that in UHVbecause of O or HrO chemisorption (i.e., sorbate-inducedsurface states; see above). Fe exposed at the surface wouldnot remain threefold coordinated but would chemisorbHrO, O, and other molecules from the air to satisfu dan-

EGGLESTON AND HOCHELLA: STM OF HEMATITE {001} SURFACES 9 1 5
gling bonds (e.g., see Parks, 1984; Hochella, 1990). HrOinitially sorbs to hematite {001} dissociatively but sorbswithout dissociation at higher coverage (Thiel and Ma-dey, 1987; Kurtz and Henrich, 1987). O, is inert to he-matite {001} at low pressure (Henrich, 1985; Hendewerket al., 1986; Kurtz and Henrich, 1987). At atmosphericpressure, O, chemisorbs and depopulates the Fe-charac-ter surface state (Ilenrich, 1985; Kurtz and Henrich, 1987).As discussed above, this leaves the O 2p states as thehighest occupied states and thus explains the absence ofFe in the images taken at negative V". The chemisorbedspecies themselves probably lack electronic states near E,and so do not appear in the STM images. For example,the MO calculations of Debnath and Anderson (1982)show that O 2p-like states are about 2 eV deeper in thevalence band for OH bonded to Fe than for O in anFerOr-like cluster. Also, photoelectron spectra (Kurtz andHenrich, 1987) show that OH and HrO contribute to thestate density too deep in the valence band (greater than4 or 5 eV) to contribute to 1, in the STM images in Figure2. Thus the simple assignment of STM image features tocalculated MO states is not always safe because of adsor-bate-induced surface states. Gilbert and Kennedy (1989)demonstrated this in a tunneling spectroscopy study ofTiO, and a-FerO. surfaces in air. Most probably, in Fig-ure 2 (at negative V"), we have imaged states localizedon O sites in the top layer of O of the hematite surface(i.e., the sites illustrated in Fig. 1C), and Fe or chemi-sorbed species above this layer do not contribute to thetunneling current under the imaging conditions used.
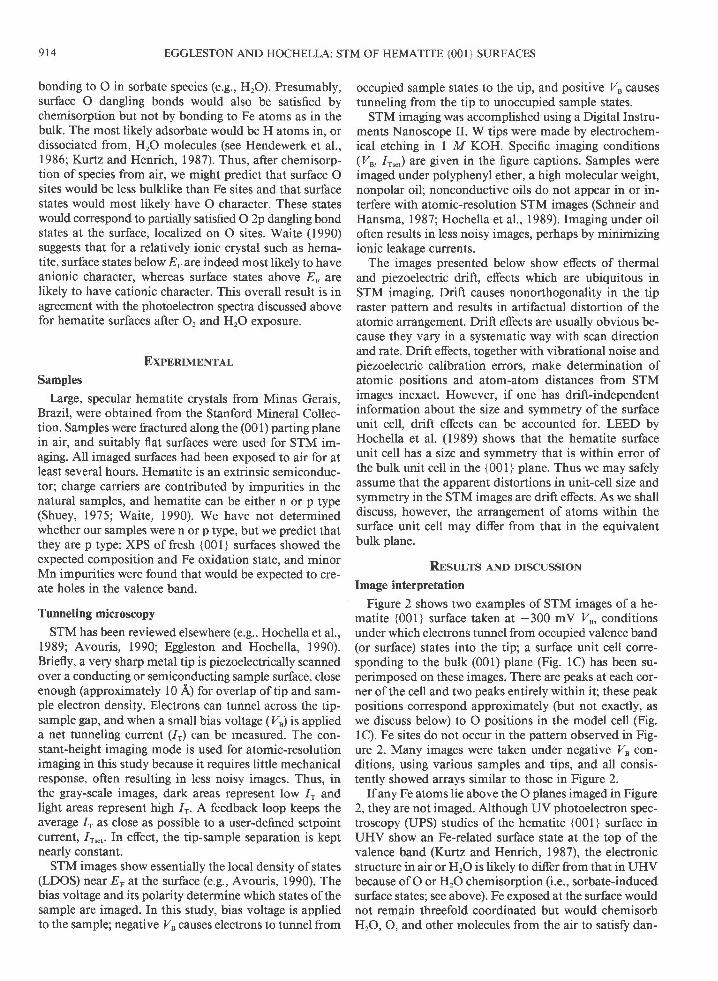
Images taken at positive I were more variable thanthose taken at negative 2". Figure 3A shows peaks in ahexagonal array with 3-A periodicity, similar to Figure2. In another image taken in a different area of the samesample (Fig. 3B), an array of triplet peaks appears; thetriplets are arranged in a hexagonal array with 5-A peri-odicity. An image similar to Figure 38 was obtained byHeil et al. (1989), also at positive (+0.514 Zu. Our resultssuggest that their image is only one of many types ofimages one may obtain from hematite surfaces underpositive Zu conditions, and their assignment of tripletpeaks to shared octahedral faces is not a unique interpre-tation.
Figure 3C gives an example of the most common typeof image obtained at positive Zu: single peaks in a hex-agonal array with a periodicity of 5 A (see also STMimage in Johnsson et al., l99l). Such images are similarto those obtained using scanning force microscopy(Johnsson et al., l99l), a technique that is not sensitiveto LDOS near Er, as is STM, but to the total electrondensity. Johnsson et al. (1991) attributed such an arrayto surface Fe sites. Indeed, only states attributed to equiv-alent Fe states near the surface could occur in the arrayimaged in Figure 3C, and both the MO and surface statearguments presented above suggest that the unoccupiedstates above -8. should have Fe character.
Because the images in Figure 3 were taken during oneimaging session with the sample in the same orientation,
Fig. 2. (A), (B) Constant-height STM images of hematite{001 } taken at -300 mV and 2.2 nA. Peaks occur in a hexagonalarray (slightly distorted as a result of drift; see text) with ap-proximately 3-A periodicity, as characteristic of the surface Oarray. Unit cells are marked in both images. We show two im-ages to illustrate drift effects; although both images were takenunder the same Z" and 1r,", conditions, they have different de-grees of drift and therefore show slightly diferent degrees ofdistortion in the marked surface unit cell, which without drift,would be perfectly hexagonal. The data are displayed in three-dimensional blocks tilted toward the viewer at 30' in A and at60" in B. Scales are in nanometers. Both images have been low-pass filtered to remove high-frequency noise.
we may further examine the angular relationships be-tween the peaks in the different images. The peaks (ortriplet peaks) in Figures 38 and 3C with 5-A periodicity(and which therefore indicate some contribution fromunoccupied states with Fe character) have similarly ori-ented hexagonal arrangements. In contrast, the peaks with3-A periodicity in Figure 3A are oriented in a hexagonalarray that is rotated 30'relative to those in Figures 38and 3C. This relationship is identical to that expected forFe vs. O arrays (e.g., compare the arrangement of equiv-alent Fe sites in Fig. lC with that of O sites). Thus, itappears that the states to which electrons were tunnelingin the different images taken at positive Zu contain dif-fering degrees ofFe and O character; Figure 3,A, had near-
9 t 6 EGGLESTON AND HOCHELLA: STM OF HEMATITE {OOI} SURFACES
ly entirely O character, Figure 38 had mixed Fe and Ocharacter, and Figure 3C had mostly Fe character. It isnot known why different types of images are found atpositive [, whereas negative Z" consistently gave imageslike those in Figure 2. It is possible that different tip struc-tures could give rise to different types of images, but thiswould be likely to affect both positive and negative Zuconditions, not just positive Z" images. Another possi-bility is that adsorbate-induced surface states might bediferent in different areas according to local adsorbatecoverage or identity. Future STM work may uncover asystematic pattern to positive V" image variations.
In summary, at this stage, it must suffice to say thatpositive ti STM images of hematite {001} are variable,
(-Fig. 3. Constant-height STM images of hematite {001i taken
at positive Zu; all images are lowpass fiftered to remove high-frequency noise. (A) An image 19 x 19 A taken at + 1100.8 mVar'd 2.7 nA; corrugation (relief) in the image is approximately0.8 A. Peaks occur in a hexagonal array with roughly 3-A peri-odicity, similar to images taken at -300 mV. The data in A andB are displayed as three-dimensional blocks tilted toward theviewer at 60'. (B) An image 38 x 38 A taken at +1046.8 mVand 5.2 nA; corrugation is approximately 1.0 A. In this case,peaks occur in triplets (one such triplet is marked with arrows);the triplets occur in a hexogonal array with 5-A periodicity. (C)An image 35 x 35 A taken at + 1099.8 mV and 3.8 nA; comr-gation is approximately 0.8 A. In this case, single peaks occurin a hexagonal array with 5-A periodicity, as expected for equiv-alent surface Fe positions. Images A-C were taken with the sam-ple in the same orientation, and the 5-A unit cells marked in theimages are all oriented similarly, despite some drift distortion.Note that the subsidiary peaks in each triplet in B form linesthat are parallel with the rows of O-periodicity sites in A.
perhaps because of local structural or compositional vari-ations. An important point must be emphasized here,however. Because the unoccupied state density is signif-icant or perhaps dominant in interatomic regions (i.e.,the states are not necessarily localized on atomic sites:Tossell et al., 1974; Sherman, 1985), particular peakscannot be unequivocally assigned to Fe or O atomic sitesin the positive Zu images. This is in contrast to the neg-ative Vu images, which show states localized on O sites.
Surface relaxation
In a bulk hematite (001) O plane (see Fig. 1C), twolong (3.035 A) O-O distances alternate with one short
Q.669 A) O-O distance in [210] and equivalent direc-tions. Despite drift (see above), a regular alternation oflong and short distances should be observable in STMimages. Such a bimodal O-O distance distribution is sug-gested in Figure 38 for positive Zu conditions, but thereare several reasons to be cautious. First, images taken atpositive Vuwere quite variable and difrcult to interpret;second, it is possible that the state density imaged at pos-ilive Vu is not localized on atomic positions. Therefore,for purposes of studying O positions in detail, we haveused only images taken at negative Zu. Our interpretationis that these images show tunneling current originatingfrom states localized on O sites. The following discussionrests on the assumption that this interpretation is correct.
Figure 4 shows cross sections taken from several im-ages of the surface O array at -300 mY Vu. The distancesfrom peak to peak in each cross section show no obvioussystematic alternation of long and short distances. One-dimensional Fourier transforms of the cross sections givesingle peaks at2.9 A. this suggests that the surface O arrayhas relaxed, removing the distortions found in the equiv-alent bulk plane. However, the error in the measurementsmust first be shown to be significantly smaller than theproposed relaxation.

EGGLESTON AND HOCHELLA: STM OF HEMATITE {001} SURFACES 9t7
Fig. 4. Cross sections of STM images of hematite {001} takenat -300 mV; scales are in nanometers. (A) The triangular cur-sors mark atoms that are 3.0 A apart; a one-dimensional fastFourier transform of this cross section into frequency space gavea single peak at 2.9 A. (B) The triangular cursors mark atomsthat are 2.9 A apart; a one-dimensional fast Fourier transformofthis cross section gave a single peak at 2.9 A. Note that thecomrgation (vertical relief) in the two cross sections is similar(approximately 0.5 A). In an unrelaxed O array in the bulk {001}plane, short (2.7 L) O-O distances should alternate with long(3.0 A) distances. No such regular alternation is seen in thesecloss sectrons.
A problem with measuring distances directly from theSTM images is the systematic error introduced by drifteffects (see above). Drift may distort the surface unit-cellsymmetry as displayed in an STM image, causing dis-tances to be too small in one direction and too large inanother direction. Drift effects can be accounted for byrecognizing that the average O-O distance would be 2.91 3A in the unrelaxed bulk hematite (001) plane as well asin a relaxed (regularized) surface array but that the dis-tribution of O-O distances would be bimodal for the un-relaxed surface and single mode for the relaxed surface.We removed systematic drift error as follows:
Step l: Measure individual O-O distances (designatedX) from STM images, making sure to group only mea-surements made in a particular direction (direction is des-ignated by the index i). The resulting data consist of anumber n, of measurements {. Step 2: For each data setI, calculate Xy" : (>X,)/n,. Step 3: Because of drift, gen-erally Xi". is not equal to 2.913 A. fnis discrepancy isdue to drift error because LEED results (Hochella et al.,1989) show that the surface unit cell is not different insize from the bulk structure in the (001) plane. Therefore,we calculate a scaling facter S, where S, : XT"/(2.913).Then, for each Xb we calculate {(S,). SV definition,{21X/5,)l}/n, : 2.913 A. As a result, the numbers .{ (S,)are comparable for different i because drift effects havebeen removed, so the data for different directions i canbe collected into one data set and plotted as number ofobservations vs. drift-corrected O-O distance.
The frequency distribution resulting from the above
150
1 %
0.25 0.250 0.n5 0.300 0.325 0.350
Distarrce (nm)
Fig. 5. Frequency distribution for 777 individually measuredO-O distances. The measurements were made on six high-res-olution STM images taken at -300 mY Vr. The measured dis-tances form a single-mode distribution (dashed line). For com-parison, bulk hematite O-O distances in the {001} plane form abimodal distribution (solid line). The example bimodal distri-bution is composed of two Gaussian distributions (dotted lines)which were calculated from the standard deviations given by themeasured distribution (i.e., the example bimodal distribution isplotted as it would appear if it were subject to the same mea-surement errors that the observed single-mode distribution wassubject to, except that the measured distribution is not perfectlyGaussian). Surface O-O distances apparently do not retain thebimodal distribution characteristic of the bulk.
procedure is plotted in Figure 5. The O-O distances forma single-mode distribution. For comparison, peaks re-flecting the bimodal distribution of O-O distances in thebulk (001) plane are plotted as Gaussian curves whosepeak widths are calculated from the standard deviationsof the measured distribution (which was not exactlyGaussian). The measured single-mode distribution is suf-ficiently narrow that it could not mask a bimodal distri-bution, even with the substantial measurement errors.Again, this supports the idea that the surface O array hasrelaxed away from the distorted bulk structure (whichwould give the bimodal distribution) to a more regulararray (giving the observed single-mode distribution).
Surface relaxation: Consistency with surface forces
In this section we consider a simple, qualitative modelof the forces acting on surface O atoms in relation to therelaxations suggested by our observations.
Although ionic attraction and repulsion are significantover distances of l0 A or more in an ionic crystal (Smf.th,1989), their strength decays with the square ofthe dis-tance, and consideration of nearest-neighbor Fe and Oshould serve to form a useful qualitative picture of theforces acting on an O site at a surface. For purposes ofqualitative argument, we may think of Fe-O interactionsas approximated by a Lennard-Jones-type potential inwhich Fe-O bond lengths less than the length of an un-
100(tC
g7sE
l.|-
50
25
BI
{p\\ \Oo
\o

9 1 8 EGGLESTON AND HOCHELLA: STM OF HEMATITE {001} SURFACES
O-O Reouls ion
Repu ls Ion
lO0 I I ls near ly perpendlcularto the page; a [00 I ] vectorwould connect ts2 and Bl .
Fig. 6. Model of a single O site, together with arrows indi-cating the direction of forces exerted on the O by its first coor-dination sphere ofFe and by nearest-neighbor O. This site cor-responds to the site marked A in Figure lC. Fe sites Al and B2are below the plane ofthe page, and sites A2 and Bl are abovethe plane of the page. Bonds labeled 1 and 2 are short relativeto unstrained Fe-O bonds and exert repulsive net forces on theO; bonds labeled 3 and 4 are long relative to unstrained Fe-Obonds and exert attractive forces on the O. The net force vectorpoints in the [00] direction. This force is balanced by O-Orepulsion (the two arrows indicating O-O repulsion indicate thedirection ofshort O-O distances in the bulk (001) plane). IftheFe labeled Bl is removed, as is likely during the creation of a{001} surface, the net force due to Fe-O interaction will be re-duced and the O should relax back along [100] in response. Suchrelaxation would result in a regularized surface array because theO relaxes away from its closest O neighbors.
distorted bond (about 2.06 A; see above) should give netrepulsive forces between Fe and O, and Fe-O bond lengthsgreater than 2.06 A should give net attractive forces be-tween Fe and O. O-O repulsion can be approximated byan ionic potential, which always gives repulsive forcesbetween O ions. Figure 6 shows an O atom, together withthe four Fe atoms that coordinate it, plucked from thehematite bulk structure. To place this O atom in its struc-tural context, it is equivalent to the one marked A inFigure lC.
Of course, the forces exerted on an atom in a bulkstnrcture are balanced, i.e., the position around which anatom vibrates represents a local minimum in its potentialfield. Considering the O atom in Figure 6, we see quali-tatively that the short Fe-O bonds (marked I and 2) bothexert repulsive forces on the O, and long Fe-O bonds(marked 3 and 4) both exert attractive forces on the O;the net force on the O from Fe-O interaction is in the[00] direction. In the bulk structure, these forces arecounteracted by repulsion between the O and its neigh-boring O atoms; the short O-O distances (see Fig. lC)
exert forces in the opposite direction [T00]. This simplepicture is consistent with the thermal ellipsoids for he-matite calculated in Blake et al. (1966); for O, the thermalellipsoid is elongated toward the vacant octahedral site,which is precisely the direction along which force gradi-ents are lowest in Figure 6.
We may now consider what would happen to this bal-ance if the Fe marked Bl were removed, leaving behindonly the low Fe on the surface (see above). The pull ex-erted by B1 would be removed, resulting in a net forceon the O back along the [T00] direction as well as downinto the surface slightly. Chemisorption of HrO and O tocoordinate the remaining surface Fe atoms might alterthis situation, but would probably not inhibit relaxation;the low Fe (A2) exerts a push on the O because of Fe-Ferepulsions between face-sharing octahedra that push theFe down against the O atoms. Because surface Fe (A2) isno longer face sharing, but coordinated by O, HrO, orperhaps other adventitious species, the push exerted byit on the central O would be expected to decrease, whichwould also contribute to O relaxation back along [00]as well as allow the Fe (A2) to relax upward along [001].
Because all O positions are symmetrically equivalent,the arguments presented above apply to all surface O at-oms. Therefore, it appears that a regularization of thesurface O array is consistent with a simple comparisonof forces acting on O atoms at surfaces relative to theforces in the bulk structure. The above arguments showthat the relaxation we proposed is essentially the resultof removing, at the surface, the distortion in the O arraycaused by face sharing of Fe octahedra in the bulk struc-ture. O relaxation as described above would also resultin slight rotation ofthe large O triangles in the surface Oarray (see Fig. lC); this is because O atoms would relaxalong [100] and equivalent directions, whereas the direc-tion of nearest-neighbor O atoms on a (001) plane arealong [210] and equivalent directions (see Fig. 7).
An accurate accounting of the likely magnitude of theeffect of surface relaxation on the surface energy of he-matite {001} would require knowing the exact extent ofrelaxation both laterally and vertically, accurate potentialfunctions for both Fe-O and O-O interactions, and theeffects of chemisorbed species on relaxation. Althoughsuch information is unavailable, we anticipate that thesmall shifts required to make a regularized array couldbe responsible only for a few percent reduction in surfaceenergy from that of an unrelaxed surface structure, simplybecause such small shifts produce small changes in energyrelative to the energy required to break a bond.
Microtopography
Steps varying in height from 2.3 A lcorresponding toone O layer) to several nanometers (several unit cells)were frequently observed on hematite {001} parting sur-faces. Steps occur parallel to visible striations and edgeson hematite parting surfaces, and when imaged at theatomic scale are found to occur parallel to [210] andequivalent directions. At moderate resolution, flat sur-
I

EGGLESTON AND HOCHELLA: STM OF HEMATITE {OOI} SURFACES 919
Fig. 7. A model of a small segment of the hematite {001}surface. Unfilled small circles represent O positions in the un-relaxed bulk {001} plane. Filled small circles represent O posi-tions in a perfectly regular surface O array, as suggested by theSTM images. Large open circles represent Fe positions above orbelow the O plane. Note that relaxation expands the shared oc-tahedral face (lower part of the figure) and slightly rotates thelarger, unshared octahedral faces (upper part ofthe figure).
faces (surfaces that, for example, would appear flat in anSEM image) were found to have step spacings of roughly2-3 nm (Fig. 8). Edge energies associated with step edgeson surfaces with such high step densities might be ex-pected to contribute to the overall surface energy (e.g.,Williams and Bartelt, I 99 I ), and the unique coordinationenvironments of step-edge and kink sites might occur insufficiently high concentration to play a key role in he-matite surface reactivity.
Figure 9 is a high-resolution STM image of two suc-cessive steps spaced approximately 25 A apart. This im-age was taken at -300 mV V, and thus shows stateslocalized on O positions (see above). The "up" and"down" sides ofthe steps can be discerned ifone consid-ers the imaging mechanism; Figure 9 is an image of tun-neling current (1r) variation taken with the tip scanningat essentially constant height from right to left. Runningthe feedback loop at low gain settings allows for controlofthe average tip-sample separation over lateral distanc-es in the l-2 nm range but gives little z-piezo responseto tunneling current variations on the atomic scale. Whenthe tip, scanning from right to left, reaches a step down,1, drops drastically because the tip-sample separation in-creases by a few angstroms. In response, the feedbackloop gradually moves the tip closer to the sample over adistance ofabout 2 nm (in this case) in order to keep theaverage 1r constant, i.e., maintain constant height. There-fore, the steps in Figure 9 step down from upper right to
30 . o
20,o
1 0 . 0
o 10 .0 z f J .o 30 .0
Fig. 8. A constant-heieht STM image of steps "" "
n.rrl"ln.{001} parting surface, taken at -300 mV and 1.5 nA. The scaleis in nanometers. The horizontal streaks are a rastering artifact.Despite the noise in the image, steps can be seen that trend fromupper left to lower rieht. It is apparent that the step density islarge, with steps spaced approximately every 20-30 A. glgtr-resolution images taken near this area ate presented in Figures9 a n d 1 l .
lower left. Unfortunately, the atomic structure on the im-mediate down side of each step is often lost as the tipposition equilibrates; also, because these surfaces havebeen exposed to air, adsorbates may be segregated alongsteps and affect 1r, both by intervening between tip andsample and by altering the local electronic structure.
Figure l0 is a model of a step; the line labeled I illus-trates the offset of O rows as one goes from terrace toterrace. In Figure 9, the line labeled I shows this offsetin the STM image. In addition, the regular O row spac-ings appear to be intemrpted at the step edge. The dis-tance between the atomic rows marked 2 and 3 (the rowsnearest the step edge) in Figure 9 is 1.5 times larger thanthe usual row spacing on a terrace; there is also a dimlyvisible row between the rows marked 2 and 3. A similarsituation exists for the second step with rows marked 4and 5, except that the row between 4 and 5 is bright ratherthan dim.
The "ideal" step illustrated in Figure l0 shows five-fold-coordinated Fe sites and that two occupied Fe sitesalternate with single vacant sites (marked with arrows)along the step. O sites at the ideal step edge occur intriplets; e.9., see the groups of three O atoms along thestep edge and between the black arrows in Figure 10. Ineach O triplet, the two O atoms on the ends are onlytwofold coordinated and the middle O is threefold co-ordinated. Thus, the fivefold-coordinated Fe sites at stepsare more bulklike than on terraces. and two-thirds of the

920
Fig. 9. Aconstant-heightSTM image, 54 x 54A, oftwo stepson a hematite {001} parting surface, taken at -300 mV and 1.5nA. Terraces step down from upper right to lower left (see text).The height of each step is approximately 2.5 A, based on vari-ation in tunneling current. The line labeled I shows the ofset ofO rows on terraces ofdiferent elevation (see Fig. 10). The stepstructure is different from the terrace structure; the spacing ofthe rows labeled 2 and 3 and ofthe rows labeled 4 and 5 is 1.5times the normal spacing of O rows. Between rows 2 and 3 andbetween rows 4 and 5 is a row of sites that is poorly resolvedand whose origin is not understood. The steps appear to be re-laxed or reconstructed.
O sites are less coordinated than on terraces. Coordina-tive undersaturation would tend to destabilize the occu-pied O 2p-like states near the top of the valence band,raising their energy (e.g., Sherman, 1985). In an STMimage, this would result in brighter sites at step edges
2.
Fig. 10. A model of a step on a hematite {001} surface. Theoffset of O rows on the terraces above and below the step isillustrated by the line labeled l. Along a row of Fe atoms at astep Qabeled 2), Fe vacancies occur at every third site (markedwith arrows). Along the step, between Fe vacancies, O atomsoccur in triplets (see text).
EGGLESTON AND HOCHELLA: STM OF HEMATITE {001} SURFACES
Fig. ll. A constant-height STM image taken only a fewnanometers away from the area imaged in Figure 9. The dataare displayed in a three-dimensional block tilted toward theviewer at 60". Total relief is approximately 10 A. A kink siteappears near the center ofthe image. Terraces step dou,n fromupper right to lower left. The sites along each step edge appearas taller bumps than sites on terraces, indicating a difference inelectronic structure, O position, or both at step edges as com-pared with terrace sites.
relative to sites within terraces. In Figure 9, there is someevidence that sites at the step edges are brighter thanthose on terraces, especially in row 5, but there is noevidence for an alternation of two-bright, one-dark sitesas suggested by the above afguments.
The bright spots at the step edge in Figure 9 occur inpositions that appear to be directly over the Fe sites atthe step (i.e., the row of Fe marked 2 in Fig. l0). Onepossibility is that, because O-O repulsion is unbalancedat the step edge, O may relax away from the step andoccupy sites above Fe atoms. Although such relaxationmay indeed occur at steps, neither this nor the previousargument explains the dim rows between rows 2 and 3and between rows 4 and 5 in Figure 9. Also, such relax-ation would differ for twofold- and threefold-coordinatedO atoms along the step, and no evidence of periodic al-ternation ofsites is apparent along the step edges in Fig-ure 9.
These arguments illustrate one difficulty of STM imageinterpretation, namely, that electronic and atomic struc-ture information is intimately convolved. We cannot tell,for example, to what extent the extra brightness of stepedge sites is due to the atoms being physically higher(perhaps because of relaxation at the step edge) and towhat extent the extra brightness is due to shifts in elec-tronic structure. Our arguments explain some of, but notall of, the features of steps in STM images. Without in-dependent information on the location of Fe in relationto O and on the potential role of adsorbates in alteringlocal geometric and electronic structure at the step, a sin-

EGGLESTON AND HOCHELLA: STM OF HEMATITE {OOI} SURFACES 92r
gle model cannot be proven. For example, Becker andVickers (1990) point out in their STM study ofsteps onAs-terminated Ge (l I l) surfaces that one must be partic-ularly cautious in interpreting STM images of steps andother one-dimensional structures. They were unable toachieve an unequivocal correspondence between severalproposed step models (and attendant electronic structurecalculations) and their STM data.
Figure l1 was taken only a few nanometers away fromthe area imaged in Figure 9, except with different gainsettings. The steps in this image again step down fromupper right to lower left. The higher gain settings causethe tip to overshoot as it corrects for changes in tip-sam-ple separation at steps. This overshoot often causes anoscillation that swamps the atomic structure on the ter-races when steps are closely spaced, as in this case. FigureI I again shows the reconstruction of the step edge and,in addition, shows a kink site in one of the steps. Theability to image kink sites should prove valuable in thefuture, as kink sites may often be important in overallsurface reactivity. The atoms along the step edges in Fig-ure I I again appear to be higher than those on terraces,in agreement with the destabilization of O 2p states alongstep edges discussed above. Although we cannot solve thereconstructed step structure on the basis of these STMimages, the above discussion suggests that O sites aremost likely to be perturbed at step edges, either by chang-ing positions or by changing electronic structure, andprobably by both efects.
At present, it must sufrce to say that the STM imagesshow strong evidence for relaxation or reconstruction atstep edges, but the precise nature ofthe structural changesis not clear. In any case, such a reconstruction could haveimportant implications for hematite reactivity. Elucida-tion of step structures appears to be a useful goal forfuture STM studies of hematite and other minerals.
CoNcr-usroNs
In summary, we have interpreted STM data for he-matite {001} surfaces in relation to calculated and exper-imentally investigated electronic structures. Using our in-terpretation, we discussed features of hematite surfaces,such as relaxation and step structure. We wish to empha-size that STM images show the distribution of electronicstate density at surfaces. STM images can be used withconfidence to investigate atomic structures only if inde-pendent electronic structure information can be used toform an understanding ofhow electronic states are likelyto be distributed.
AcxNowr,nocMENTS
This research was supported by the Petroleum Research Fund of theAmerican Chemical Society (22892-ACS,2 to M.F.H.), the National Sci-ence Foundation (EAR-9105000 to M.F.H.), and the McGee Fund of theSchool of Earth Sciences at Stanford (to C.M.E.). We also thank the Centerfor Materials Research at Stanford for research and instrumentation sup-port. C.M.E. acknowledges the constructive influence of the late Noye M.Johnson of Dartmouth College, and the support of Werner Stumm, Bar-bara Sulzberger, and the Swiss Federal Institute for Water Resources and
Water Pollution Control (EAWAG). Virgil Elings and Kevin Kjoller pro-vided helpful information on the Digital Instruments Nanoscope II hard-ware and software. We thank Susan Stipp, Patricia Johnsson, GeorgeParks, Gordon Brown, Jr, and Jodi Junta for helpful comments and dis-cussions, and an anonymous reviewer for comments.
RnrrnnNcns CITED
Adamson, A.W. (1982) Physical chemistry of surfaces (4th edition), 664p Wiley, New York.
Avouris, Ph. (1990) Atom-resolved surface chemistry using the scanningtunneling microscope. Journal of Physical Chemistry, 94, 2246-2256.
Becker, R, and Vickers, J. (1990) Determination ofsurface atomic po-sitions by scanning tunneling microscope observations. Journal ofVac-uum Science and Technology, AB (l),226-232.
Benson, G.C., and Yun, K.S. (1967) Surface energy and surface tensionofcrystalline solids. In E.A. Flood, Ed., The solid gas interface, p. 203-269. Marcel-Decker, New York.
Blake, R.L., Hessevick, R.E., Zoltai, T., and Finger, L.W (1966) Refine-ment of the hematite structure. American Mineralogist, 51,123-129.
Bolt, G.H., and Van Riemsdijk, W.H. (1987) Surface chemical processesin soil. In W. Stumm, Ed., Aquatic surface chemistry, p. 127-164.Wiley, New York
Brantley, S.L., Crane, C.F., Crerar, D.A., Hellmann, R., and Stallard, R.(1986) Dissolution at dislocation etch pits in quartz. Geochimica etCosmochimica Acta. 50. 2349-2361.
Brown, G.E., Jr. (1990) Spectroscopic studies of chemisorption reactionmechanisms at oxide-water interfaces. In Mineralogical Society ofAmerica Reviews in Mineralogy, 23,309-363.
Causa, M., Dovesi, R., Pisani, C., and Roetti, C. (1989) Ab initio char-acterization of the (0001) and (1010) crystal surfaces of a-aluminaSurface Science, 215, 259-27 l.
Chang, C.C. (1968) LEED studies ofthe (0001) face ofa-alumina. Journalof Applied Physics, 39 (12), 557 0-557 3.
Charig, J.M. (1967) Low energy electron diffraction observation ofa-al-umina. Applied Physics Irtters, 10, 139-140.
Debnath, N.C., and Anderson, A.B. (1982) Optical spectra of ferrous andfemc oxides and the passive film: A molecular orbital study. Joumalofthe Electrochemical Society, 129 (10), 2169-2174.
Eggleston, C.M., and Hochella, M F., Jr. (1990) Scanning tunneling mi-croscopy of sulfide surfaces. Geochimica et Cosmochimica Acta, 54,1 5 1 1 - 1 5 1 7 .
- (1991) Scanning tunneling microscopy ofgalena (100) surface ox-idation and sorption of aqueous gold. Science, 254, 983-986.
Fasiska, E.J. (1967) Structural aspects of the oxides and oxyhydrates ofiron. Corrosion Science. 7. 833-839.
French, T.M., and Somorjai, G.A. (1970) Composition and surfac€ struc-ture ofthe (0001) face ofa-alumina by low energy electron difraction.Journal of Physical Chemistry, 74 (12), 2489-2495.
Giese, J.R.F. (1974) Surface energy calculations for muscovite. Nature,248 .580 -581 .
Gilbert, S.E., and Kennedy, J.H. (l 989) Observation ofhysteresis inducedby the tip field in scanning tunneling microscope spectroscopic probingofTiO, and a-FerO, single crystal surfaces. Langmuir, 5, l4l2-14\5.
Heil, J., Wesner, J., Lommel, B., Assmus, W., and Grill, W (1989) Struc-tural investigation ofblue bronzite and hematite by scanning tunnelingmicroscopy. Journal of Applied Physics, 65 (12), 5220-5222.
Hendewerk, M., Salmeron, M., and Somorjai, G.A. (1986) Water adsorp-tion on the (001) plane of FerO,: An XPS, UPS, Auger, and TPD study.Surface Science, 17 2, 544-556.
Henrich, V.E. (1985) The surfaces of metal oxides. Reports on Progressin Physics, 48, 1481-1541.
Hochella, M.F., Jr. (1990) Atomic structure, microtopography, compo-sition, and reactivity of mineral surfaces. In Mineralogical Society ofAmerica Reviews in Mineralogy, 23,87-132.
Hochella, M.F., Jr., Eggleston, C.M., Elings, V.B., Parks, G.A., Brown,G.E., Jr., Wu, C.M., and Kjoller, K.K. (1989) Mineralogy in two di-mensions: Scanning tunneling microscopy of semiconducting mineralswith implications for geochemical reactivity. American Mineralogist,74, 1233-1246.
Hochella, M.F., Jr., Eggleston, C.M., Elings, V.B., and Thompson, M.S.
922
(1990) Atomic structure and morphology ofthe albite (010) surface:An atomic force microscope and electron diffraction study. AmericanMineralogist, 7 5, 7 23-7 30.
Jaycock, M.J., and Parfitt, G.D. (1981) Chemistry of interfaces Wiley,New York.
Johnsson, P A. Eggleston, C.M., and Hochella, M.F., Jr. (1991) Imagingmolecular-scale structure and microtopography of hematite with theatomic force microscope. American Mineralogrst, 76, 1442-1445.
Kurtz, R L., and Henrich, V E (1983) Geometric structure of the a-FerO,(001) surface: A LEED and XPS study. Surface Science, 129, 345-354
- (1987) Surface electronic structure and chemisorption on corun-dum transition metal oxides: d-Fe,O,. Physical Review B, 36 (6), 34 I 3-3421.
Lasaga, A.C., and Blum, A.E. (1986) Surface chemistry, etch pits andmineral-water reactions Geochimica et Cosmochimica Acta. 50. 2363-23'79.
Lawn, B.R., and Wilshaw, T.R. (1975) Fracture of brittle solids. Cam-bridge Solid State Science Series. Cambridge University Press, Cam-bridge, U.K.
Leland, J.K., and Bard, A J. (1987) Photochemistry ofcolloidal semicon-ducting iron oxide polymorphs Journal of Physical Chemistry, 9 l, 507 6-5083
Lindsley, D H (i976) The crystal chemistry and structure ofoxide min-erals as exemplified by the Fe-Ti oxides. In Mineralogical Society ofAmerica Reviews in Mineralogy, 3, Ll-L60.
Parks, G.A. (1984) Surface and interfacial free energies ofquartz JournalofGeophysical Research, 89 (86), 3997-4008.
- (1990) Surface energy and adsorption at mineral/water interfaces:An introduction. In Mineralogical Society of America Reviews in Min-eralogy,23, 1.33-175
Pisani, C., Causa, M , Dovesi, R , and Roetti, C. (1987) Hartree-Fock ab-initio characterization ofionic crystal surfaces with a slab model. The(001) face ofc-Al:O:. Progress in Surface Science, 25, l19-137.
Schneir, J., and Hansma, P.K. (1987) Scanning tunneling microscopy andlithography of solid surfaces covered with non-polar liquids. Langmuir,3, 1025-1027
Schwertmann, U., and Taylor, R.M (1977) Iron oxide. In J.B. Dixon andS.B. Weed, Eds, Minerals and soil environments, p 145-180. SoilScience Society of America, Madrson, Wisconsin.
EGGLESTON AND HOCHELLA: STM OF HEMATITE {001} SURFACES
Sherman, M.J (1985) The electronic structures ofFer+ coordination sitesin iron oxides; applications to spectra, bonding, and magnetism. Phys-ics and Chemistry of Minerals, 12, 161-17 5.
Shuey, R.T. (1975) Semiconducting ore minerals, 415 p. Elsevier, Am-sterdam.
Smyth, J (1989) Electrostatic characterization ofoxygen sites in minerals.Geochimica et Cosmochimica Acta. 53. 1l0l-1110.
Somorjai, G.A (1981) Chemistry in two dimensions: Surfaces, 575 pCornell University Press, Ithaca, New York
Sparnaay, M.J. (1985) Thermodynamics (with emphasis on surface prob-lems). Surface Science Reports, 4,101-269-
Stumm, W, and Sulzberger, B. (1992) The cycling of iron in naturalenyironments; considerations based on laboratory studies of hetero-geneous processes Geochimica et Cosmochimica Acta, in press.
Susnitzky, D.W., and Carter, C.B. (1984) Identification of a-alumlna sur-face structures by electron diffraction Journal of the American Ceram-ics Society, 69 (9), C-217-C-220.
Thiel, P.A., and Madey, T.E. (1987) The interaction of water with solidsurfaces: Fundamental aspects. Surface Science Reports, 7,211-385.
Tossell, J A., Vaughan, D.J, and Johnson, K.H. (1973) The electronicstructure of ferric iron octahedrally coordinated to oxygen: A funda-mental polyhedral unit ofiron-beanng oxide and silicate minerals. Na-twe,244, 42-45
- (1974) The electronic structure of rutile, wustite, and hematitefrom molecular orbital calculations American Mineralogist, 59, 319-334
Waite, T.D. ( I 990) Photo-redox processes at the mineral-water interface.In Mineralogical Society of America Reviews in Mineralogy, 23,559-603.
Williams, E.D, and Bartelt, N.C. (1991) Thermodynamics of surfacemorphology. Science, 25 1, 393-400.
Zhang, J.D, and Nancollas, G.H. (1990) Mechanisms of growth and dis-solution of sparingly soluble salts In Mineralogical Society of AmericaReviews in Mineralogy, 23, 365-396.
MaNuscnrrr REcETVED Novrrvrsen 18. 1991MlNuscrrm AccEmED Mlv 11. 1992