the structure of production in the united states textile industry: the post-war period
TRANSCRIPT

The Structure of Production in the United States Textile
Industry: The Post-War Period By
Martin Williams
Contents: I. Introduction. - II. Characteristics of the Industry.- III. Model and Data. - IV. Empirical Results. - V. Concluding Remarks.
I. Introduction
M ost recently, the United States textile industry finds itself reacting to enormous problems that have been building Up over the last three decades. The trickle of imports that began almost thirty
years ago, is now a flood. Perhaps the most dramatic illustration of the level of the industry's reaction to the competitive advantage of foreign na- tions is the industry's expressed concern about cheap textile imports from Red China. The American Textile Manufacturers Institute, which represents about 85 percent of the textile companies in the United States, recently has filed an anti-dumping petition with the United States Department of Com- merce and the International Trade Commission [Montgomery, 1982].
The current challenge to the industry includes technology, investment and government. New technology that was developed in the t960s was acquired and well established in foreign plants, long before American producers made any effort to adopt similar innovations. Technologically, machinery is avail- able to the manufacturer. But a major problem is being able to pay for it. ContL-med inves*anent means that there must be enough profitability to justify it. Progress and even survival of the textile mills will, however, be threatened if their ability to compete in domestic and foreign markets is being eroded by outdated equipment and declining protection against foreign imports. This has led to considerable discussion about ways to reduce costs and improve productivity. Understanding of the issues entails having a greater knowledge of the nature of the production characteristics of the industry. This paper attempts just such an analysis of textile production technology for the post-war years.
In Section II, we briefly discuss the problems facing the industry. In Section III, we outline the essential features of the model and the data. In Section IV, we report and discuss the empirical results. In the final section, we offer a brief summary and draw some policy implications from the analysis.
Remark: Thanks are due to an anonymous referee, Paul Graeser and Ardeshir Dalai for helpful comments on an earlier version of this paper. The usual caveat applies.

156 Martin Williams
II. Characteristics of the Industry
The problems in the United States textile industry are well known and need not be discussed at length here. Briefly, the industry has been slow to modernize and automate. During the past thirty years, while other industries in the manufacturing sector accepted the risk and challenge of labor-saving automation, the textile industry remained one of the relatively stagnant, more labor-intensive industries in the United States. There were 1.19 million people employed in the manufacture of textile products in 1949. In 1981, there were .823 million employed. The ratio of payroll to value added from 1967 to 1977 averaged .46 compared with .38 for all manufacturing. Despite the slow downward trend in employment, the in- dustry retains a large proportion of workers engaged in direct production (86 percent) as compared with only 70 percent for the entire manufacturing sector.
In a recent analysis of the industry, Eisen [1980] isolated several factors which serve to explain the earlier conservative investment behavior pat- terns of producers: (1) the profit margins of producers were low, (2) the industry tended to be fragmented with a large number of small producers unable to generate sufficient internal funds to finance new expensive ma- chinery, and (3), the industry committed too little funds to research and development of new products and markets. Current investment behavior patterns are a little more encouraging. Investment in plant and equipment increased from 588 million in 1966 to 695 million in 1977 [Eisen, 1980]. However, while the level of expenditures appears adequate to enable the industry to upgrade its equipment significantly, it should be noted that a large proportion of the recent increase in plant and equipment expenditures is not targeted towards increasing scale of operation. The uptrend in modern- ization is a consequence of government policy and changes in the economic and structural forces in the industry. Revised depreciation schemes on plant and equipment and other investments contribute substantially to the trend. Interest in modernization is also stimulated by foreign competitive pressures to reduce cost and by the expectation of more favorable economic condi- tions [Eisen, 1980]. Despite this, executives [Seidel, 1981] in the industry still caution that the industry's facilities are still the most outdated in all U.S. manufacturing.
While the American textile industry is taking progressive steps to improve its competitive positions vis-~t-vis foreign producers, current conditions are not conducive to fully developing its foreign and domestic market potential. During the first quarter of 1982, textile imports increased 11 percent and exports fell 20 percent. The U.S. textile/apparel trade deficit reached $ 5.7 billion in 1981, an amount 40 percent higher than in 1980 [Montgomery, 1982]. There is speculation that this trend will continue. It is these cir-

The United States Textile Industry 157
cumstances that brought about widespread pressure for protection of the cotton textile products at a time when consistently lower wages and the development of a large and productive capacity offer a comparative advantage in production to foreign producers. Congress continues to provide very little assistance to address the problem of imports from Taiwan, South Korea, India, Pakistan, Brazil, Haiti, and Columbia. A more recent source of imports is Communist China, which now has most-favored nation status. China floods the American market with cloth causing major disruptions in the textile sector.
Recent action of the American Textile Manufacturers Institute [Mont- gomery, 1982] to seek additional protection seems to suggest that the other legal measures already in place to halt the injury to the textile sector largely have been ignored. In the 1960s, the textile producers were successful in negotiating a multilateral Long Term Agreement Regarding International Trade in Cotton and Textiles. The agreement has been revised to cover woolens as well as synthetic textiles under the Multi-Fiber Arrangement (MFA) [Roschke, 1977]. Under the terms of the agreement, quotas are imposed on textile importers. This, of course, violates GATT, which was intended to promote reductions in trade barriers and the removal of dis- crimination.
Also, excessive foreign regulation and foreign taxes on textile imports exist and undermine the potential of the American textile industry. There is little evidence to date to show that appropriate action will be taken to remove these impediments. Rather, there is some speculation that the in- dustry may experience declining protection over the longer term. As Seidel [1981, p. 75] cautions, "even the best (MFA) agreement . . . represents some- thing of a holding action.. .".
The assumption that the industry may face declining protection implies that domestic producers must find ways to reduce cost and become more productive if there is to be any substantial improvement in the competitive position of the U.S. textile industry in the long run. It is the foregoing set of circumstances which make the industry interesting as well as difficult to study. Thus, a more detailed analysis of the features of the production tech- nology would enable us to better understand the production structure in the post-war period.
HI. Model and Data
There have been several empirical studies addressing various charac- teristics of production in the cotton textile industry I. These studies were
For a summary and discussion of time-series studies see Nerlove [1967]; and for a complete review of cross-section studies, see ]orgenson [1972].

158 Mar t in Wil l iams
primarily concerned with estimating the elasticity of substitution between capital and labor inputs. There are two major problems in all the earlier empirical estimates. First, the most common functional forms used are the Cobb-Douglas (CD) and Constant Elasticity of Substitution (CES): These functional forms are restrictive in that they impose a priori restrictions on the elasticities of substitution. For example, the CD form restricts o to unity, while in the CES specification o is constant. Second, almost all the studies failed to simultaneously investigate several other key technological charac- teristics (for example, marginal output elasticities and scale elasticities of production).
We provide additional information on the production structure by em- ploying a multiplicative nonhomogeneous production function (hereafter referred to as MNH) to analyze the characteristics of the production technology during the period 1949-19791 . This specification is flexible and offers several economic properties which are more consistent with the es- sential elements of production theory, as well as offering better empirical descriptions of the production process of the textile industry over time. Specifically, within this framework there are no a priori restrictions imposed on the data. For example, the nonhomogeneous production function allows for variable elasticities of substitution among input pairs and variable re- turns to scale. The function is described by a specific functional form with no predetermined restrictions imposed. Assume that a nonhomogeneous pro- duction function exists for the U.S. textile industry and is given by:
Q = e~0 K~I + ~ , L L~2 (1)
Equation (1) can be rewritten in logarithmic form as (2):
lnQ = a0 + allnK + a21nL + a31nK �9 In L (2)
where Q is output, K and L are capital and labor inputs respectively, and the a's denote parameters 2. In equation (2), the marginal elasticities of capital (e-K) and labor (eL), also called the output elasticities of the inputs, are found by differentiating the logarithm of Q with respect to the logarithm of K and L respectively.
e K = OlnQ/OlnK = a I + cq lnL (3)
e L = 81nQ/81nL = a2 + a~ InK (4)
A detailed theoretical development of the nonhomogeneous production function is provided by Vinod [1972]. For empirical applications of the function, see Vinod [1972; 1973].
2 The function (1) can easily be generalized to incorporate more than two inputs. Note also that the specification is a generalization of the Cobb-Douglas formulation where a product term in the logarithms of the two inputs is included in the specification. The function is linear in its parameters and amenable to estimation by ordinary least squares.
The United States Textile Industry 159
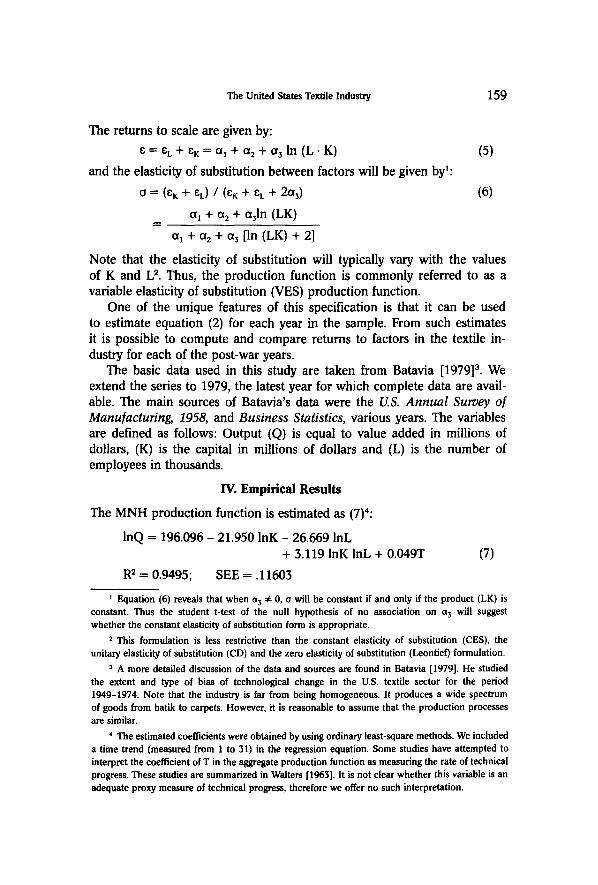
The returns to scale are given by:
e = e L + eK = al + a2 + as In (L. K) (5)
and the elasticity of substitution between factors will be given by1:
o = (eK + eL) / (e~ + eL + 2a3) (6)
al + Ct2 + a31n (LK)
al + a2 + as [In (LK) + 2]
Note that the elasticity of substitution will typically vary with the values of K and L 2. Thus, the production function is commonly referred to as a variable elasticity of substitution (VES) production function.
One of the unique features of this specification is that it can be used to estimate equation (2) for each year in the sample. From such estimates it is possible to compute and compare returns to factors in the textile in- dustry for each of the post-war years.
The basic data used in this study are taken from Batavia [1979] a. We extend the series to 1979, the latest year for which complete data are avail- able. The main sources of Batavia's data were the US. Annual Survey of Manufacturing, 1958, and Business Statistics, various years. The variables are defined as follows: Output (Q) is equal to value added in millions of dollars, (K) is the capital in millions of dollars and (L) is the number of employees in thousands.
IV. Empirical Results
The MNH production function is estimated as (7)4:
lnQ = 196.096 - 21.950 InK - 26.669 lnL + 5.119 InK lnL + 0.049T (7)
R 2 = 0.9495; SEE = .11603
Equation (6) reveals that when a s ~ 0, o will be constant if and only if the product (LK) is constant. Thus the student t-test of the null hypothesis of no association on a s will suggest whether the constant elasticity of substitution form is appropriate.
This formulation is less restrictive than the constant elasticity of substitution (CES), the unitary elasticity of substitution (CD) and the zero elasticity of substitution (Leontie0 formulation.
s A more detailed discussion of the data and sources are found in Batavia [1979]. He studied the extent and type of bias of technological change in the U.S. textile sector for the period 1949-1974. Note that the industry is far from being homogeneous. It produces a wide spectrum of goods from batik to carpets. However, it is reasonable to assume that the production processes are similar.
4 The estimated coefficients were obtained by using ordinary least-square methods. We included a time trend (measured from 1 to 31) in the regression equation. Some studies have attempted to interpret the coefficient of T in the aggregate production function as measuring the rate of technical progress. These studies are summarized in Waiters [1963]. It is not clear whether this variable is an adequate proxy measure of technical progress, therefore we offer no such interpretation.

160 Martin Williams
At the 5 percent significance level, all the coefficients are statistically significant. The variables K and L explain approximately 95 percent of the variation in output.
Now, we turn to the numerical series of marginal elasticities of labor (eL) and capital (er) as well as the scale elasticities (e) and the elasticities of factor substitution (o) which are shown in the table below. Earlier, we discussed how slow the industry has been to modernize its machinery. The results in the table show that the marginal elasticity of capital throughout
Selected Characteristics o[ Production: The United States Textile Industry, 1949-1979
Year
1949 1950 1951 1952 1953 1954 1955 . . . . . . . 1956 1957 1958 1959 1960 1961 1962 1963 1964 1965 1966 1967 1968 1969 1970 1971 1972 1973 1974 1975 1976 1977 1978 1979
Marginal Elasticity of Capital
(BK)
.133
.296
Marginal Elasticity of Labor
(CL)
0.59 - 0.97
Scale Elasticity
(c)
0.719 1.270
Elasticity of
Sustitution (o)
.103
.169 �9 .056 .043
-.268 -.236 -.298 -�9 -�9 -.578 -�9 -.753 -.715 -.760 -�9 -.641 -.516 -.526 -.415 -�9 -.468 -.542 -.513 -.595 -.571 -.827 -.780 -.788 -.796 -.669
1.12 1.23 1.31 1.28 1.27 1.33 1.36 1.32 1.32 1.34 1.38 1.43 1.44 1.48 1.60 1.79 1.88 2.01 2.07 2.08 2.15 2.24 2.32 2.30 2.40 2.28 2.44 2.46 2.29
1.360 1.282 1.357 1.006 1.038 0.896 0.653 0.743 0.683 0.630 0.717 0.678 0.724 0.955 1.274 1.357 1.597 1.683 1.608 1.604 1.722 1.724 1.732 1.572 1.487 1.487 1.654 1.664 1.621
.179
.170
.179
.139
.143 �9 1 4 2
.125
.095 �9 1 0 6
.099
.091
.103
.098 �9 1 0 4
.133
.170
.179
.204
.213
.205
.205
.215
.235
.217
.201
.193
.209
.213
.216

The United States Textile Industry 161
the post-war years is negative except for the period 1949-19531 . The marginal elasticities of labor in the table have fluctuated throughout the years but are positive. A one percent increase in labor input induced a 1.3 to 2.3 percent increase in output between 1953 and 1979 with the greatest in- creases in output generated between 1968 and 1979.
The scale elasticity (c) patterns also shown in the table are interesting. There is a considerable variability in the patterns - with levels ranging from 1.27 to 1.62 between 1965 and 1979. The 1973 value of scale elasticity (c) indicates that a one percent increase in both labor and capital inputs would lead to an increase in output of about 1.73 percent. Almost all of the increase can be attributed to the labor component. Since the scale elasticity measure is defined as the ratio of the percentage change in output with a simultaneous infinitesimal percentage change equal to all inputs, generally speaking, it can be considered to be a total factor productivity measure of growth. The results indicate that the annual rate of growth of overall pro- ductivity during the period 1966-1975 is on average approximately 4.1 percent per year.
The elasticity of substitution (o) given in the table reflects the ease with which capital is substituted for labor in response to changes in the relative productivity of the factors. In general, the results suggest slight increasing substitutability over time. The values are always less than unity, indicating that the production process is not characterized by a Cobb-Douglas produc- tion formulation. They range from .091 to .235. 2 The low estimates also have other implications for the nature of the production technology. The industry is very labor intensive and wages are generally low, compared to those paid in all manufacturing. In 1979, the average gross rate in manu- facturing was $ 6.16 per hour and for workers in the textile industry only $ 4.47 per hour. Wage rates may increase significantly in the future if labor unions continue to make gains in organizing textile workers and securing collective bargaining rights for them. Given the low estimate of the elasti- city of substitution, labor costs tend to increase and thus prices may be higher in the future. This may make it very difficult for American producers to improve their competitive position not only against foreign imports in the domestic market but in the export market as well.
Under these conditions, American producers may be forced to seek in- creasing protection against foreign imports. However, current evidence sug- gests that the future protection may decline rather than increase. For ex- ample, Montgomery [1982] recently called attention to the anti-protection
This may be due to data aggregation. The negative values provide us with additional historical information about the post-war years which might otherwise be missed.
2 The range of the estimate (o) is in close agreement with the average value of .11 which Batavia [1979] found for the industry
Weltwirtschaftliches Archiv Bd. CXX 11

162 Mart in Wil l iams
efforts of the Reagan Administration in trying to encourage the World Bank to package a $ 157.4 million loan to restructure the textile sector in the Philippines.
We proceed to test whether the VES functional form is appropriate. One way to do this is to estimate a more general functional form separately, and apply an F-test to the residuals. The purpose of our test was to see whether at standard significance levels the VES functional form is sta- tistically significant. To facilitate this procedure, we estimate a transcenden- tal logarithmic production function (translog) 1 as a more general form of the VES. The translog production function specification used to test the VES is:
lnQ = a o + a~ InK + a 2 lnL + a s InK. InK + a4 (lnL) 2 + as (INK) 2 (8)
The following hypothesis is tested: H0:a, = 0; a5 = 0; Hl:Ct 4 ~ 0; (2{ 5 ~ 0. If we are unable to reject Ho, then the VES is an appropriate functional form. The F-test requires that we compare the value of
F(2, N-K) = (SF_~E s - SF~s, og ) / SV~anslog / N-K (9)
where SE 2 is the sum of squared residuals of the respective production func- tion specifications. N is the number of observations and K is the number of estimated parameters. The computed F(2, 26) statistic is .0040. The critical value of F at the 5 percent significance level is 3.47. We see that at this level we cannot reject H 0. Thus, this result lends strong support to the appropriateness of the VES functional form to study the features of the technology of the textile industry.
V. Concluding Remarks
In this paper we tested a multiplicative nonhomogeneous production function using data from the United States textile industry for the period 1949-1979. The economic findings provide additional insights into the nature of the production structure of the textile industry during the post-war period. We find that the textile industry production process is nonhomogeneous and of a variable elasticity of substitution. In general, overall productivity growth averages around 4.1 percent per year from 1957 to 1978. There seems to be some recognition in the industry of a need to accelerate this rate. Since the industry is very labor intensive, the low estimates of the elasticity of substitution suggest that capital is not readily substituted for labor. In recent years, trade unions have de- manded increases in wages in proportion to increases in the cost of living as well as in proportion to reduction in labor input per unit of output. If unions continue to be instrumental in gaining bargaining rights for all textile workers,
This functional form was first proposed by Christensen et al. [1973].

The United States Textile Industry 163
labor cost will increase and prices will be higher. This will place domestic producers at a competitive disadvantage with cheaper foreign output both in the domestic and export markets.
The very future of the industry over the long term depends on intensive efforts to adopt revolutionary technologies that offer outstanding competitive advantages. Current investment trends suggest that the industry is setting out to meet this challenge. Quantifying the level of investment expenditures, Seidel [1981] estimated that in 1979 the industry spent between 75 to 80 percent of its retained earnings for new equipment. Future work is needed to identify the links between technological change, size and research and development expenditures in the industry.
References
Batavia, Bala, "The Estimation of Biased Technical Efficiency in the U.S. Textile Industry 1949-1979". Southern Economic Journal, Vol. 45, 1979, pp. 1091-1104.
Christen~n, laurils R., Dale W. lorgenson, and I~wronce J. Lau, "Transcendental Log- arithmic Production Frontiers". The Review o[ Economics and Statistics, Vol. 55, 1973, pp. 28-45.
Eisen, R. E, Jr., "The Textile Industry". In: John E. Ullmann (Ed.), The Improvement o[ Pro- ductivity: Myths and Realities. New York 1980, pp. 112-131.
Jorgenson, Dale W., "Investment Behavior and the Production Function". The Bell Journal of Economics and Management Science, Vol. 3, 1972, pp. 220-251.
Montgomery, Walter S., "American Textiles: Obstacles and Changes". Textile Industries, October 1982, p. 86.
Nerlo~, Marc, "Recent Empirical Studies of the CES and Related Production Functions". In: Murray Brown (Ed.), The Theory and Empirical Analysis of Production. NBER, Studies in Income and Wealth, Vol. 51, New York 1967, pp. 55-122.
Roschke, Thomas E., '~l'he GATr: problems and prospects". The Journal o[ International Law and Economics, Vol. 12, 1977, pp. 85-105.
Seidel, Loon E., "Textile Snags: Apparel productivity". Textile Industries, September 1981, pp. 72-76.
Vinod, Itrishikesh D., "Nonhomogeneous Production Functions and Applications to Tele- communications". The Bell Journal o[ Economics and Management Science, Vol. 3, 1972, pp. 531-545.
-, "Interregional Comparison of Production Structures". Journal o[ Regional Science, Vol. 15, 1975, pp. 261-267.
Waiters, A. A.,"Production and Cost Functions: An Econometric Surv~". Econometrica, Vol. 31, 1965, pp. 1-66.
Zeisel, Rose N., "Modernization and Manpower in Textile Mills". Monthly Labor Review, Vol. 96, 1975, pp. 18-25.
11"
164 Mart in Williams
Z u s a m m e n f a s s u n g: Die Produktionsstruktur der US-Textilindustrie in der Nachkriegs- zeit. - In diesem Aufsatz wird eine multiplikative nichthomogene Produktionsfunktion unter Verwendung yon Daten der US-Textilindustrie aus den Jahren 1949-1979 getestet. Die /Skonomischen Ergebnisse gewiihren zus~tzlichen Einblick in die Produktionsstruktur der Textilindustrie der Nachkriegszeit. Es zeigt sich, dalg der Produktionsprozelg in der Textilindu- strie nichthomogen ist und eine variable Substitutionselastizit~t aufweist. Generell stieg die Produktivit~t zwischen 1957 und 1978 jiihrlich um durchschnittlich 4,1 vH. In der Industrie scheint man teilweise einzusehen, dal~ diese Rate gesteigert werden mug. Da die Branche sehr arbeitsintensiv ist, deuten die niedrigen Schiitzungen der Substitutionselastizit/it darauf hin, dal~ wenig Bereitschaft zur Substitution yon Arbeit durch Kapital besteht.
R6sum6: La structure de la production dans l'industrie textile des E.U.: La p6riode d'apr~s-guerre. - D a n s cet article l'auteur teste une fonction de production multiplicative non-homog~ne en utilisant des donn6es de l'industrie textile des E.U. pour la p6riode 1949-1979. Les r6suitats 6conomiques permettent une compr6hension additionelle sur la nature de la structure de production darts l'industrie textile pendant la p6riode d'apr~s-guerre. L'auteur trouve que le processus de la production de l'industrie textile est non-homog~ne et d'une 61asticit6 de substitution variable. En g6n6ral, la moyenne croissance de la productivit6 totale 6tait 4.1 pourcent par ann6e pendant 1957 et 1978. I1 paraR que l'industrie voit la n6cessit6 d'acc61~rer ce taux. L'industrie textile est tr6s intensive a la main d'oeuvre et c'est pourquoi les estimations d'une 61asticit6 de substitution basse sugg~rent que la main d'oeuvre n'est pas facilement remplac6e par le capital.
R e s u m e n : La estructura de producci6n en la industria textil de los EEUU: el periodo de post-guerra. - En este articulo se somete a prueba una funci6n de producci6n multiplicativa no-homog6nea utilizando datos de la industria textil de los EEUU en el periodo 1949-79. Los resultados econ6micos entregan conocimientos adicionales sobre la naturaleza de la estruc- tura productiva de la industria textil durante el perfodo de post-guerra. Encontramos que el proeeso de producci6n de la industria texti les no-homog6neo y de una elasticidad de substituci6n variable. En general, el crecimiento de productividad total promedia alrededor de 4 .1% por afio desde 1957 a 1978. Parece existir cierto reconocimiento en la industria de acelerar esta tasa. Debido a que la industfia es muy intensiva en mano de obra, las estimaciones de una elasticidad de substituci6n baja sugieren que el capital no est6 siendo substituido f~icilmente por mano de obra.