the structure, organization and functioning of
TRANSCRIPT

THE STRUCTURE, ORGANIZATION AND FUNCTIONING OF
MANUFACTURING COMPANIES IN SOUTH AFRHCA.
by
WILLIAM HENRY RA UBENHEIMER
Submitted in accordance with the requirements
for the degree of
DOCTOR OF BUSINESS LEADERSlH!IP
at the
UNIVERSITY OF SOUTH AFRICA.
PROMOTER: PROFESSOR J J MURPHY.
November 1995

SUMMARY.
The research problem that this study sought to address stemmed from a lack
of knowledge about South African organizations and a dearth of empirical,
quantitative research into organizations, organization structure and
organization climate in this country. Five research hypotheses were
formulated to address this problem and its attendant subpriJblems.
A comprehensive review of the related literature and research was c~trried
out and Organization Theory was traced to its earliest beginnings. A
number of schools hased on Max Weber's bureaucratic ideal type were
described and contrasted. Much attention was paid to the work of the Aston
group m the United Kingdom and to their efforts to operationalize Weberian
concepts and to incorporate them into a replicable body of quantitative
research. Points of departure were re-examined and some new twists to
Systems Theory and Structural Functionalism were considered.
It was established that the demographic characteristics of both the sample
and the population were similar enough for the results of this study to be
generalised to the population with some degree of confidence.
Much care was taken to test and validate each of the scales that comprised
the questionnaire, and item analyses and factor analyses were carried out
for every variable and group of variables. The measures developed in other
parts of the world and by other researchers performed very well in a South
African setting - as did the measures developed specifically for this study.
Statistical associations and causal relationships between the various sets
of variables, both at the sector level and at individual industry subgroup
level, were sought by means of multiple regression analyses. Broad support
was found for a 'culture-free hypothesis' that there are a number of stable
relationships between organizations and their context; and these
relationships will be constant in direction and strength regardless of
differences in structures, or in contexts of structures between societies.
Importantly, there were also a number of significant differences between
this study and the findings of other studies which reflected South Africa's
unique blend of developed and developing cultures and value systems. These
differences provide fertile ground for future research in the field of
Organization Theory.

KEY TERMS.
Organization; Organization Theory; Organization context; Organization
climate; Organization structure; Organization design; Organization
Studies; Bureaucracy; Organic Structure; Mechanistic Structure;
Contingency Theory; Structural imperatives; Organization life-cycle;
Structuring of Activities; Quantitative methods in organization
studies; Organizational measurement; the Aston programme; Factor
analysis; Multiple Regression analysis.
BIP·l ff"'T..-- . IP-RARY
1 \UJ[f(]U~~
I ~997 °m 0 2 j C!Rs~
:· Klas. GSB. 402 RAUB i' Acces~ L,Aanwir
111\ll~ili\1 1660272

OWN WORK DECLARATION
I declare that :
THE STRUCTURE, ORGANIZATION AND FUNCTIONING OF
MANUFACTURING COMPANIES IN SOUTH AFRICA
is my own work and that all the sources that I have used or quoted
have been indicated and acknowledged hy means of complete
references.
, .. -
W H Raubeo.heimer

1.
2. 2.1
3.
3.1
3.2.
3.3.
3.4.
3.5.
4.
5.
6.
7.
6.
THE STRUCTURE. ORGANIZATION AND FUNCTIONING OF
MANUFACTURING COMPANIES IN SOUTH AFRICA.
TABLE OF CONTENTS.
CHAPTER ONE: THE PROBLEM AND ITS SETTING.
STATEMENT OF THE PROBLEM.
ORGANIZATION STRUCTURE IN THE ELECTRONICS INDUSTRY.
Technology in the Electronics Industry.
THE SUBPROBLEMS.
The First Subproblem.
The Second Subproblem.
The Third Subproblem.
The Fourth Subproblem.
The Fifth Subproblem.
FORMULATION OF THE HYPOTHESES.
The first hypothesis
The second hypothesis
The third hypothesis
The fourth hypothesis
The fifth hypothesis
THE DELIMITATIONS.
ASSUMPTIONS.
The First Assumption
The Second Assumption
The Third Assumption
The Fourth Assumption
THE IMPORTANCE OF THIS STUDY.
SUMMARY.
(i)
PAGE
1
1
2
2
3
3
4
4
4
5
5
6
6
6
6
7
7
8
8
8
9
9
9
9

CHAPTER TWO: REVIEW OF THE RELATED LITERATURE AND RESEARCH:
A HISTORICAL OVERVIEW.
1. INTRODUCTION. 11
2. FROM EARLY CIVILIZATIONS TO THE INDUSTRIAL REVOLUTION. 12
2. 1 The Egyptians. 13
2.2 Moses and the Israelites. 14
2.3 Philip of Macedon and Alexander the Great. 15
2.4 The Arsenal of Venice. 17
2.5 Europe after 1500, and the Industrial Revolution. 18
3. TOWARDS A THEORY ABOUT ORGANIZATIONS AND STRUCTURE. 21
3.1 Historical Background to Bureaucracy. 21
3.2 Weber's Bureaucratic Ideal Type. 22
3.3 The Classical School. 24
Frederick W Taylor.
Henri Fayol.
3.4 The Human Relations School.
3.5 The Contingency School.
3.6 The Dirty Linen School.
3.7 Summary.
4. THE ASTON GROUP.
4. 1 Point of Departure.
4.2 The Aston Study.
4.3 Classifying Organization Structure.
4.4 The TechnologicaL Imperative.
4.5 The National Study.
4.6 The Value of the Aston Work.
5 ASTON : EXTENSIONS, REPLICATIONS AND VARIATIONS.
5.1 The Coventry Study.
5.2 An Abbreviated Replication.
5.3 Applications in Non-commercial Organizations.
5.4 Climate and Group Level Studies.
5.5 Cross-cultural Comparisons.
.5.6 Summary
(ii)
24
25
26
28 29
30
31
31
33
35
39
40 43
44
45
45
48
49 51
.52

CHAPTER 3. REVIEW OF THE RELATED LITERATURE AND RESEARCH :
CURRENT PERSPECTIVES.
1. INTRODUCTION. 54
2. POINTS OF DEPARTURE REVISITED. 54 2.1 A problem with Words. 55 2.2 The Systems Paradigm: Another Look. 57
Interdependence. 57 Interaction. 57 Integration and E4uilibrium. 58 Conse4uence. 58 Survival. 58
2.3 Paradox in Organization Theory. 64
Opposition. 65 Spatial Separation. 65 Temporal Separation. 66 Synthesis 66
3. IMPERATIVES: FURTHER DISCUSSION. 66 3.1 Life-cycle as an Intervening Variable. 67
The Environmental Imperative. 68 The Structural Imperative. 69
The Leadership Imperative. 69 The Strategic Imperative. 69
3.2 Environmental Uncertainty & Organic or Mechanistic Structures. 70
3.3 Fine-tuning the Environment. 74
4. CONTRIBUTIONS FROM OTHER DISCIPLINES. 76
4.1 An Accounting Perspective. 76
4.2 An Organization Economics Perspective. 77
4.3 Economics Theory : the Indifference Curve. 78
5 STRUCTURAL ISSUES IN HIGH TECHNOLOGY ORGANIZATIONS. 79
(iii)
6. ORGANIZATION THEORY AWAY FROM A WESTERN ENVIRONMENT.81
6. 1 South Korea. 82
6.2 Egypt.
6.3 Japan.
6.4 Jordan.
6.5 India.
6.6 An African Perspective.
7. ORGANIZATION THEORY UNDER FIRE.
7. I. The Assault: Social Action Theory.
7.2 The Assault: Radical Structuralism.
7.3 The Riposte.
8. RECONCILING DIVERGENT VIEWPOINTS.
8.1 System versus Action: Q 1 vs Q2.
8.2 Adaptation versus Selection : Q 1 vs Q3.
8.3 Constrained Niches versus Enacted Domains: Q2 vs Q3.
8.4 Economic Aggregates versus Political Collectivities : Q3 v Q4.
8.5 Individual versus Collective Action : Q2 vs Q4.
8.6 Organization versus Institution : Q 1 vs Q4.
8. 7 Discussion.
9. SUMMARY.
CHAPTER FOUR: RESEARCH DESIGN.
1. INTRODUCTION.
2. THE SCIENTIFIC METHOD.
2. I Research design.
2. 1. 1 Research Design of this Study.
2.1.2
2.1.3.
Institutional versus Questionnaire Measures.
Relevance of the Research.
3. SUMMARY.
(iv)
84
87
91
94 97
98
99
101
102
103
104
106
108
109
Ill
113
114
114
116
116
117
118
119
120
122

CHAPTER FIVE: KEY CONCEPTS AND DEFINITIONS.
L INTRODUCTION.
2. INDEPENDENT VARIABLES.
2. 1. Organizational Size.
Operationalizing Size.
Technology.
Operationalizing Technology.
Dependence.
Operationalizing Dependence.
Power Control.
Operationalizing Power Control.
2. 1. 1.
2.2. 2.2.1.
2.3. 2.3. 1.
2.4. 2.4.1.
2.5. 2.5. L.
Environmental Uncertainty /Turbulence.
Operationalizing Uncertainty /Turbulence.
3. DEPENDENT VARIABLES.
3.1. 3.l.L.
3.2. 3.2. 1.
3.3. 3. 3. 1.
3.4.
3.4. 1.
3.5. 3.5.1.
Structuring of Activities.
Operationalizing Structuring of Activities.
Centralization.
Operationalizing Centralization.
Configuration.
Operationalizing Configuration.
Organic and Mechanistic Structures.
Operationalizing Organic and Mechanistic Structures.
Organizational Climate.
Operationalizing Organizational Climate.
4. SUMMARY.
(v)
123
123
124 124
125 125
126 126 126 127
127 128
128 129 129
129 130
130
130
131 131
132 133
133

CHAPTER SIX: COLLECTING THE DATA.
L
2.
INTRODUCTION.
THE DATA BASE.
The Research Population.
Overcoming Sampling Bias.
2. 1.
2.2.
2.3.
2.3.1
2.3.2.
Characteristics of the Sample and the Population.
2.3.3.
The Size of Organizations in the Sample and the Population.
The Type of Industries in the Sample and in the Population.
The Development Regions of the Sample and the Population.
3. THE QUESTIONNAIRE.
3. 1. Section 1: Size and Dependence.
3.1.1. Reliability and Validity.
3.2. Section 2: Technology.
3.2.1. Reliability and Validity.
3.3. Section 3: Structural Control and Environment.
3.3.1. Reliability and Validity.
Section 4: Structuring of Activities.
Reliability and Validity.
Section 5: Centralization.
Reliability and Validity.
Section 6: Organicity.
Reliability and Validity.
Section 7: Organization Climate.
Reliability and Validity.
3.4.
3.4. I.
3.5.
3. 5. 1.
3.6.
3.6.1.
3.7.
3. 7. l.
3.8.
3.8. 1.
3.9.
3.10.
Section 8: Demographic and Background Information.
Reliability and Validity.
Administration of the Questionnaire.
Pilot Study.
4. CASE STUDIES AND INTERVIEWS.
5. SUMMARY.
(vi)
135
135
137
138
138
139
140
141
142
142
143
143 144
144
145
145
146
146
147
147 147
148
148
149
150
150
151
152
153

CHAPTER SEVEN : PROCESSING AND TREATMENT OF THE DATA
1. INTRODUCTION.
2. STATISTICAL PROCESSES.
2. 1. Reliability of the Scales.
2.2. Multidimensionality and Validity of the Scales.
2.3. Multiple Regression Analysis of all the Variables.
154
154
155
156
157
3. A FRAMEWORK FOR PORTRAYING ORGANIZATION VARIABLES. 158
3.1.
3.2.
3.2.1.
3.2.2
3.2.3.
3.2.4.
3.2.5.
3.2.6.
3.2.7.
3.3.
3.3.1.
3.3.2.
3.4.
3.5.
3.5.1.
3.5.2.
3.5.3.
3.5.4.
3.5.5.
3.6.
3.6.1
3.6.2
Dependent Structural Variables: Reliability.
Dependent Structural Variables: Multidimensionality & Validity.
Functional Specialization.
Formalization.
Standardization.
Autonomy.
Centralization of Policy Decisions.
Centralization and Decision-making Discretion.
Organicity or Operating Management Philosophy.
Factoring the Structural Variables and the Fourth Hypothesis.
The Fourth Hypothesis.
Factor Analysis of the Structural Variables.
Dependent Organization Climate Variables : Reliability.
Dependent Organization Climate Variables : Multidimensionality.
Authority.
Restraint
Work Interest
Personal Relations.
Routine.
Factoring the Organization Climate Variables.
lntercorrelation Matrix.
Factor Analysis of the Organization Climate Variables.
4. INDEPENDENT VARIABLES : THE CONTEXTUAL SCALES.
4.1. Reliability.
4.2. Multidimensionality.
(vii)
158
159
160
161
163
164
166
167
168
170
171
177
180
181
182
184
184
186
187
189
190
191
193
193
194

4.2.1.
4.2.2.
4.2.3
4.2.4.
4.2.5
4.3.
Dependence.
Technology.
Power Control.
Environment.
Operating Environment.
Framework for Analysis : concluding remarks.
5. SUMMARY.
194
196
197
199
201
202
203
CHAPTER EIGHT: STATISTICAL ASSOCIATIONS AND CAUSAL RELATIONSHIPS,
1. INTRODUCTION. 204
2. PREDICTING STRUCTURE AND ORGANIZATION CLIMATE. 205
2.1. Multiple Linear Regression. 206
2.1.1. Sample Size and Linear Relationships. 207
3. ORGANIZATION STRUCTURE.
3. I. Predicting Specialization.
3.2. Predicting Formalization.
3.3. Predicting Standardization.
3.4. Predicting Configuration.
3.5.
Technology
Organization Size
Organization Age
Environment
Power control
Predicting Centralization.
Predicting Organicity. 3.6.
3.7. Predicting Structure: Concluding Remarks.
Organizational Size.
Power Control.
Environment
Organization Age.
Internal Dependence.
Technology.
(viii)
209
210
213
215
217
218
210
219
220
221
221
22.5
227
230
230
231
231
231
232

4. SUBGROUPS IN THE MANUFACTURING SECTOR.
4.1. SIC code 31: Food, Beverages, and Tobacco.
4.2.
4.3.
4.4.
4.5.
4.6.
4.7.
4.8.
Structuring of Activities
Configuration
Centralization
SIC code 32 : Textile, Clothing and Leather.
Structuring of Activities
Configuration
Centralization
Organicity
SIC code 33: Wood and Wood Product'i.
Structuring of Activities
Configuration
Centralization
SIC code 34 : Paper, Paper Products. Printing & Publishing.
Structuring of Activities
Configuration
Centralization
Organicity
SIC code 35: Chemicals, Petroleum, Rubber & Plastic.
Structuring of Activities
Configuration
Centralization
Organicity
SlC code 36 : Non-metallic Mineral Products.
Structuring of Activities
Configuration
Centralization
Organicity
SIC code 37: Ferrous & Non-ferrous Metal Basic Industries.
Structuring of Activities
Configuration
Centralization
Organicity
SIC code 38 : Fabricated Metal Products, Machinery & Equipment
& Electrical Machinery, Apparatus, Appliances & Supplies.
Structuring of Activities
Configuration
(ix)
232
237
237
239
239
239
240
241
241
242
242
243
243
243
244 245
245
246
246
246 247
248
248
248
249
249
250
251
251
251
252
253
254
254
255
255
255

4.9.
4.10. 4.11.
Centra1ization
Organicity
SIC codes 33 and 34 : Wood, Pu1p, Paper, & PuhJishing.
SIC codes 36 and 37 : Primary Materia1s Manufacturing.
SJC codes 37 and 38 : Meta1s, Machinery and Engineering.
4.12. SIC codes 36 to 38 : Metallic & Non-metallic Materials,
& Machinery
4. 13. Subgroups in the Manufacturing Sector : Concluding remarks.
5. THE SOUTH AFRICAN ELECTRONICS INDUSTRY.
5. l. The Industrial Development Corporation.
5.2. The Electronics Industries Federation.
5.3 The Allied Electronics Group.
5.4. Appropriate Structures.
6. STRUCTURAL ANALYSIS: CONCLUDING REMARKS.
7. ORGANIZATION CLIMATE.
7.1. 7. l. l.
7.1.2.
7. L3. 7.2. 7.3. 7.3.1. 7.3.2. 7.4
7.5. 7.5.1. 7.5.2. 7.6.
Authority.
Leaders' Psychological Distance.
Concern for Employee Involvement
Questioning Authority.
Restraint.
Work Interest
Scientific and Technical Orientation.
Intellectual Orientation.
Personal Relations.
Routine.
Readiness to Innovate.
Rules Orientation.
Organization Climate : General Comments.
8. SUMMARY.
(x)
257 257 258
260 26I
263 266
267 269 271 271 272
274
274 275 276 277
279 280 281 282
284 286 287
287 289
291
294

CHAPTER NINE: THE RESEARCH PROBLEM AND HYPOTHESES.
l. INTRODUCTION. 296
2. RESEARCH HYPOTHESES AND RESEARCH PROBLEM REVISITED. 296
2.1.
2.2.
2.2.1.
2.2.2.
2.2.3.
2.2.4. 2.2.5.
2.2.6. 2.3.
2.4.
2.5.
2.6.
The First Hypothesis : Contextual Imperatives.
The Second Hypothesis : Structural Relationships.
The Differential lntluence of Contextual Variables.
The Structuring of Activities Variables.
Design or Configuration Variables.
Centralization or Concentration of Authority.
Group Differences in the Manufacturing Sector.
The Second Hypothesis : Summary.
The Third Hypothesis : Organic & Mechanistic Structures.
The Fourth Hypothesis : Structural Interrelationships.
The Fifth Hypothesis : Organization Climate.
The Research Problem.
.. The first subproblem
- The second subproblem
- The third subproblem
- The Fourth subproblem
- The fifth subproblem
3. SUGGESTIONS FOR FURTHER RESEARCH.
3. 1. Same Population, Same Data.
3.2. New Population, Same Methodology.
3.3. Same Population, Different Methodology.
4. SUMMARY.
5. CONCLUSION.
BIBLIOGRAPHY.
ANNEXURES.
(xi)
297 299 299
300
301 301
302
303 303 305 306
308 309
309 309
310
310
311
311 312 312
313
313
LIST OF TABLES
Page
Table 2.1. Definition of Structural Types in Terms of Standard
Scores on Structural Dimensions. 36
Table 3.1. Structural Functional Organization Challenges. 59
Table 3.2. Properties of Open Systems. 60
Table 3.3. Universal Subsystems of Living Systems. 63
Table 3.4. Overview of Four Imperatives. 68
Table 3.5. 111ustrative Transitions between Imperatives. 70
Table 3.6. Summ.ary Results of Hypothesis Tests 72
Table 3. 7. Mean Scores on Size and Selected Structural Scales in
Aston, National and Japanese Samples. 90
Table 3.8. Summary of Correlations : Selected Structural and
Contextual Variables. 93
Table 3.9. Structuring of Activities in Poland, Britain, Japan,
Sweden, and India. 95
LIST OF ANNEXURES.
Annexure l. The Standard Industrial Classification of all Economic Activity.
Documentation supplied by the Bureau of Market Research, University
of South Africa.
Annexure 2. Summary of questionnaire dispatch details and arnalysis of
responses and respondents.
Annexure 3. The Questionnaire.
Annexure 4. The Covering Letter.
(xii)

Figure 3. 1.
Figure 4.1.
Figure 4.2.
Figure 5.1.
Figure 5.2.
Figure 6.l.
Figure 6.2.
Figure 6.3.
Figure 6.4.
Figure 6.5. Figure 6.6.
Figure 6.7.
Figure 7. 1.
Figure 7.2.
Figure 7.3.
Figure 7.4.
Figure 7.5.
Figure 7.6.
Figure 7.7.
Figure 7.8.
Figure 7.9.
LIST OF DIAGRAMS.
Divergent Viewpoints on Organization Structure.
The Scientific Method.
Main Research Designs & Methods in Organizational Research.
Mechanistic and Organic Structures.( Robbins, 1987: 154)
Mechanistic and Organic Structures.
Geographical Dispersion of SIC Manufacturing Organizations.
Manufacturing Organizations with more than 150 Employees.
Employee Size Groups of Sample and Population.
Types of Industry in the Sample and the Population.
Geographic Regions of the Sample and the Population.
Summary of BOCI Scales used in the Questionnaire.
Reliability and Validity of the BOCI Scales.
Reliability of Structural Scales.
Functional Specialization : Principal Factor Analysis.
Formalization : Principal Factor Analysis.
Standardization: Principal Factor Analysis.
Autonomy or Decentralization : Principal Factor Analysis.
Centralization (Policy Decisions): Principal Factor Analysis.
Centralization (Decision Making Discretion) : PF Analysis.
Organicity (Operating Management Philosophy) : PF Analysis.
lntercorrelations of Structural Variables.
Figure 7.10. Structural Variables: Principal Component Analysis.
Page
105
116
118
131
132
136
137
130
140
141
148
149
158
160
162 163
165 167
168
169 170
178
Figure 7. ll. Reliability of Organization Climate Scales. 181
Figure 7.12. Leaders' Psychological Distance: Principal Factor Analysis. 182
Figure 7. 13. Management Concern for Employee Involvement : PF Analysis. 183
Figure 7.14. Questioning Authority: Principal Factor Analysis. 183
Figure 7. 15. Emotional Control : Principal Factor Analysis. 184
Figure 7.16. Scientific & Technical Orientation: Principal Factor Analysis 185
Figure 7. 17. lntellectual Orientation : Principal Factor Analysis.
Figure 7.18. Interpersonal Aggression : Principal Factor Analysis.
Figure 7.19. Rules Orientation: Principal Factor Analysis.
Figure 7.20. Readiness to Innovate : Principal Factor Analysis.
Figure 7.21. Reliability & Validity of the Organization Climate Scales.
Figure 7.22. lntercorrelations of Climate Variables.
(xiii)
185
186 187
188
189
190

Figure 7.23. Organization Climate : Principal Component Analysis.
Figure 7.24. Reliability of the Contextual Scales.
Figure 7.25. Dependence: Item Correlations.
Figure 7.26. Dependence: Principal Component Analysis.
Figure 7.27. Technology : Item Correlations
Figure 7.28. Technology: Principal Component Analysis.
Figure 7.29. Power Control : Item Correlation.
Figure 7.30. Power Control: Principal Component Analysis.
Figure 7.31. Environment : Item Correlations.
Figure 7.32. Environment : Principal Factor Analysis.
Figure 7.33. Operating Environment: Item Correlations.
Figure 7.34. Operating Environment: Principal Component Analysis.
Figure 8.1. Independent and Dependent Variables.
Figure 8.2. Linear Relationships ( 1).
Figure 8.3. Linear Relationships (2).
Predicting Specialization.
Predicting Formalization.
Predicting Standardization.
Predicting Configuration.
Predicting Centralization.
Predicting Organicity.
Figure
Figure
Figure
Figure
Figure
Figure
Figure
8.4.
8.5.
8.6.
8.7.
8.8.
8.9.
8.10. Stepwise Multiple Regression : All SIC codes.
Figure 8.11. Mean Scores of all Independent and Dependent Variables.
Figure 8. 12. Stepwise Multiple Regression : SIC code 31.
Figure 8.13. Stepwise Multiple Regression: SIC code 32.
Figure 8.14. Stepwise Multiple Regression: SIC code 33.
Figure 8.15. Stepwise Multiple Regression : SIC code 34.
Figure 8.16. Stepwise Multiple Regression: SIC code 35.
Figure 8.17. Stepwise Multiple Regression : SIC code 36.
Figure 8.18. Stepwise Multiple Regression: SIC code 37.
Figure 8.19. Stepwise Multiple Regression: SIC code 38.
Figure 8.20. Stepwise Multiple Regression: SIC codes 33 and 34.
Figure 8.21. Stepwise Multiple Regression : SIC codes 36 and 37.
Figure 8.22. Stepwise Multiple Regression: SIC codes 37 and 38.
Figure 8.23. Stepwise Multiple Regression: SIC codes 36 to 38.
Figure 8.24. Predicting Leaders' Psychological Distance.
Figure 8.25. Predicting Concern for Employee Involvement
(xiv)
192
193
195
195
196
197
107
198
199
200
201
202
205
208
208
211
213
215
218
222
225
228
234
238
240
242
244
247
250
252
256
258
260
262
264
276
277

Figure 8.26. Predicting Questioning Authority. 279
Figure 8.27. Predicting Emotional Control. 280
Figure 8.28. Predicting Scientific and Technical Orientation. 282
Figure 8.29. Predicting Intellectual Orientation. 285
Figure 8.30. Predicting Interpersonal Aggression. 286
Figure 8.31. Predicting Readiness to Innovate. 288
Figure 8.32. Predicting Rules Orientation. 290
Figure 8.33. Climate: Frequency Distribution of Independent Variables. 291
Figure 9.1. Frequency and Importance of Independent Variables. 298
Figure 9.2. Relationships Between Context and Climate. 307
(xv)

PREFACE AND ACKNOWLEDGEMENTS.
After I had completed my MBL degree a question that was often asked of me
was. "So when are you going to do your doctorate?" My standard response
was, "Only when a subject stands up and bites me."
In the end it was more a case that the subject crept up and nibbled at
me. Eventually the gnawing became so incessant and demanding that
something had to he done about it It was, particularly, the seeming
structural anomalies within the Electronics Industry that finally
precipitated the desire to study South African Organizations and their
structures and climate.
When an initial literature search revealed that very little had been done
in the field of quantitative Organization Theory in this country, the
urge to make a purely South African contribution became quite consuming.
Insofar as acknowledgements are concerned, the people to whom thanks are
owed can be divided into three broad groupings: those whose assistance was
tangible and material; those who provided academic support and guidance;
and, finally, those whose assistance was more in the nature of
encouragement and succour, especially when morale occasionally flagged.
Top of the list with regard to tangible assistance are, of course, the 528
senior executives who responded to my questionnaire. Virtually all of the
respondents were from the most senior ranks of their organizations'
management and this was retlected in the calibre and integrity of the data
that were gathered. I am also deeply indebted to my employers, the Allied
Technologies (Altech) group, who sponsored my research in its entirety.
In particular I must thank Dr David Jacobson who provided the initial
direction and endorsement of my research proposal, and Kevin Godwin, who
approved all the applications for financial assistance. On a more
practical level, thanks are due to Donay, Ria, Charmaine, Angie and
Patrick who packed 2 380 envelopes with questionnaires, covering letters
and stamped return envelopes and then glued and posted them.
(xvi)

Under the heading of academic assistance l must, firstly, make special
mention of my promoter, Professor Johan Murphy, who provided valuable
assistance but who, nevertheless, kept his advice and guidance low key and
allowed me to explore in my own way. Paolo Candotti, friend and cum
laude MBL graduate, proof-read the manuscript and provided valuable
insights. The team from the department of statistics at the University of
South Africa, especially, Professor Steffens and Riette Eiselen, helped me
immeasurably in ci>ming to grips with some of the more tricky statistical
1ssues. Lorraine Grobler, from the department of Library Services at
Unisa, was always quick to respond to my requests for information and
provided research assistance that was efficient and effective. Finally, I
must also thank Professor Peter Clark of the University of Aston Business
School in the United Kingdom for answering all of my questions on the
Aston research, and also providing me with a recent example of the Aston
methodolgy in practice.
Support of an encouraging and inspiring nature was forthcoming from many
people but especially from friends and family. In this respect I am
particularly beholden to my wife, Anne, for her advice and willingness to
listen and for her unconditional and unstinting encouragement; and also to
my elderly mother whose greatest expectation is now to attend my
graduation ceremony.
A doctorate is the ultimate academic achievement and, at the er;td of the
day, the path to this particular achievement started long ago in another
time and another country with the first tentative registration to do a
Bachelors degree by correspondence. This one is for you, Dad.
(xvii)

Know that wisdom is thus for your soul;
If you find it, then there will be a future,
And your hope will not be cut off.
Proverbs 24 : 14

CHAPTER ONE: THE PROBLEM AND ITS SETTING.
1. STATEMENT OF THE PROBLEM.
This thesis examines South African Industry, specifically compames m
the manufacturing sector, in an effort, firstly, to discover the
nature of the organization structures within this industry and,
secondly, to identify the exogenous factors and intluences from an
Organization Theory viewpoint that exerctse a critical effect on
the structure and function of the compames that comprise the
Manufacturing Industry.
Organization Theory is a relatively new science to the extent that
there is still some argument among theorists as to where it belongs in
the world of academe. Certainly, the discipline's roots are firmly in
the Behavioural Science faculty and its foundations are steeped in the
work of sociologists and social psychologists. Names of prominent
social scientists such as Weber, Parsons, Pareto, Mayo and many others
are still frequently encountered, even in the work of modern day
organization theorists. In recent years, however, their has been a
distinct shift away from the sociological base and into the Business
Schools. This seems to be only logical since by far the majority of
organizations are business institutions. With the increasing study of
business organizations over the past 25 years or so, a mountain of
empirical organizational research has been generated in most advanced
economies of the world.
This is a phenomenon that seems to have by-passed South Africa, even
though abstract organizational and environmental concepts were first
successfully operationalized in the late 1960s and early 1970s. In the
words of Dr Piet Human ( 1993: 205):
There is a paucity of serious scientific studies of the South African business firm .... Our researchers and writers on organization appear to be exclusively interested in idealistic futures and exotic answers and would seem to find the very important project of explaining reality for what it is, distinctly unattractive.
The research problem, then, that this study attempts to address
relates to the lack of knowledge about South African organizations. I

-2-
This lack of knowledge is sometimes retlected in the ambiguities and
enigmas that are revealed when classical management theories and struc
tural models are applied to local organizations. ln fact, it was the
seemmg paradoxes and inapplicability of accepted organization theory
concepts in the South African Electronics Industry that triggered this
research. Before looking at the research problem in more detail, it
may be instructive to briefly pursue these apparent structural
anomalies in the Electronics Industry.
2. ORGANIZATION STRUCTURE IN THE ELECTRONICS INDUSTRY.
On the surface, the Electronics Industry in South Africa appears to be
characterized hy predominantly bureaucratic structures; mechanistic m
form and function and strongly hierarchical. The reward and remunera
tion systems are extraordinary in order to cope with a historical
shortage of skilled professional people. There is, therefore, a high
degree of formalization and strong emphasis is placed on job grading
systems and salary scales, particularly as they relate to fringe
benefits such as a company car entitlement.
The conventional wisdom would have us believe that an orgamc struct
ure ts by far the best design for a high technology environment, and
that a mechanistic form is incapable of providing the flexibility and
speed required to he competitive in a fast-changing, dynamic
industry. And yet, among South African high tech. firms, the organic
form is the exception rather than the rule.
Does this suggest that, in terms of classical organization theory, the
firms that make up the South African Electronics Industry are structur
ally ill-equipped to face the challenges of the turbulent, competitive
world markets?
2.1 Technology in the Electronics Industry.
The technology employed by the South African Electronics Industry
is largely imported, with successful adaptations being engineered

-3-
m South Africa for local operating conditions. There have been
important local breakthroughs as well, particularly in the ·fields
of weaponry and defence. In conversation with the writer, Dr David
J acohson, Technology Development Executive of the Allied Electron
ics group, has said that South Africa's information systems techno
logy is up with the best in the world. Local software industries
have also developed adaptations and products that can legitimately
he described as leading edge applications.
Paradoxically, this translates into an industry that, despite its
apparent structural aberrations, IS
technologically speaking.
effective - competitively and
' How is this possible? And how do other South African Industries
compare with the accepted precepts of Organization Theory? It will
he seen later in this study that the South African Electronics
Industry has functioned in an environment that is very different
from the typical high technology context of advanced, Western
economies. The mechanisitc form was, in fact, entirely
appropriate to South African circumstances.
3. THE SUBPROBLEMS.
Turning hack to the broader research problem which is the subject of
this study, closer examination has indicated that it could be
subdivided into five facets which lent themselves to the formulation
of hypotheses to be tested.
outlined below.
3.1 The First Subproblem.
These five facets, or subproblems, are
There has been little empirical research done on the structure and
environment of organizations in South Africa and no quantitative,
structural research, as far as is known, has been conducted on

-4-
organizations m the South African Manufacturing Sector. The
first subproblem, then, was to make a contribution to Organization
Theory as it relates to South African business or~tanizations by
determinin~ whether there are contingencies and imperatives which
shape the structures o{ companies in the Manufacturing sector.
3.2. The Second Subproblem.
In order to gauge the appropriateness of the organization
structures of manufacturing firms, it was necessary to analyse the
context within which they function and to evaluate their
interactions with their task environment and domain. The second
subproblem was to evaluate the operating environment of the South
African Manufacturing Sector to establish its de~tree of turbulence
and uncenainty; and to ident~fy the major factors, exogenous to
organizations, which influence and mould structure.
3.3. The Third Subproblem
Imported Organization Theory concepts may simply not apply in
the South African milieu - and assuming that they do may have the
effect of negating the good management decisions that are made, or
compounding the bad ones. The third subproblem was to evaluate
whether conventional wisdom (e.g. organic structures should
predominate in a high tech. industry) is applicable to the South
African environment.
3.4. The Fourth Subproblem
The Founh subproblem was to evaluate and analyse the treated data
to gauge the effects, ~f any, of South Africa's uniqueness on its
organizational structures. This uniqueness is, inter alia,

characterized by :
more than 30 years as the world's polecat
decades of ever-increasing sanctions
years of "affirmative action" for· the white Afrikaner
section of the population
exemplified by the Public Sector, until one in every four
employees was a civil servant; a record beaten only by the
monolithic bureaucracies of the former communist world
the most developed economic sector in Africa
a unique combination of first and third world elements,
particularly the post-Wiehahn labour movement
a chronic shortage of high calibre managers as well as
skilled and professional people
a high level of taxation and government intervention m the
economy, both by regulation or through controlled industries
and, finally, the most recent fundamental sociopolitical
redefinition of South African society.
3.5. The Fifth Subproblem.
Having established the critical relationships at a macro level, one
is left with the question of the impact of organization structure
at a more focused level of analysis. The .fifth subproblem.
therefore, was to explore the influence of structure at
organization and group level 10 establish the linkages, (f any,
between aspects of structure, environment, and organization climate
and organization culture.
4. FORMULATION OF THE HYPOTHESES.
A number of hypotheses were suggested to test for relationships among
selected environmental or contextual variables and various aspects of
organization structure, configuration and climate.

-6-
The first hypothesis was that South African manufacturing organiza
tions are shaped and influenced by a number of contingencies and
structural imperatives which determine their structure, design and
functioning.
Prominent among these imperatives are organization size, power
control, technology, dependence on external organizations or resources
and the degree f~f environmental turbulence and change.
The second hypothesis was that organizations in the South African
Manufacturing Sector are affected differently by contextual
variables. Generally, structuring of activities (specialization,
standardization and formalization) will be more closely related to
size and power control and less closely to technology; while design or
configuration variables will be related more closely to power control
and technoloKJ and less closely to organization size. Centralization,
or concentration qf authority, will he related mostly to dependence
and power control. There will, nevertheless, be sign~ficant
differences between industries within the manufacturing sector.
The third hyf)Othesis was that, in South African Manufacturing .firms,
Organic Structures (characterized· hy participatory decision making, a
decentralized hierarchy of authority, and few formal procedures) will
be associated with conditions of high environmental uncertainty and
low dependence. Conversely, Mechanistic Strucrures will be associated
with conditions of low environmental uncertainty and high dependence.
The fourth hypothesis was that a number of internal variables and
organizational characteristics will exhibit relarionships 10 each
other that are consistent with .findings in other major organizational
research projects throughout the world:
Vertical Span of Control or Organization Depth is positively rela
ted to Formalization, Functional specialization, Decentralization,
Lateral span of control, and the administrative staff ratio.

-7-
Formalization is positively related to Functional specialization,
Professional qualifications. Decentralization, and the administra
tive staff ratio.
Functional Specialization is positively related to decentraliza
tion and the administrative staff ratio.
Decentralization is positively related to the administrative staff
ratio.
Type of structure, shape or configuration is related to Formaliza
tion, Functional specialization. and Decentralization.
The fifth h~oothesis was that contextual variables which shape struc
ture will also influence aspects of organization climate. Thus size
will be positively related to scientific and intellectual orientation,
employee involvement, readiness to innovate, interpersonal aggression,
emotional control, leaders' psychological distance, and concern with
following rules. Complex Technology is negatively related to emotion
al control, interpersonal aggression, and leader's psychological
distance, and positively related to questioning authority, scientific
and intellectual orientation, concern for employee involvement, and
readiness to innovate. Dependence will be related positively to
emotional control, interpersonal aggression, rules orientation, and
leaders' psychological distance; and negatively to questioning author
ity, concern for employee involvement, and readiness to innovate.
Finally, power control will be positively related to leaders·
psychological distance and concern for following rules and negatively
related to interpersonal aggression, questioning authority, scientific
and intellectual orientation, and concern for employee involvement.
5. THE DELIMITATIONS.
* The study was confined to the South African Manufacturing Sector
and cannot, therefore, be considered to be normative for other
sectors such as mining, service or retail.

-8-
* Industry-wide information was gleaned from the data base of the
Bureau of Market Research of the University of South Africa. · The
research population comprised all organizations with a headcount of
150 or greater who fell within the manufacturing division of the
Standard l ndustrial Classification of all Economic Activities.
This was a total of some 2380 organizations.
* The data upon which this study based its conclusions were cross
sectional in nature and no attempt was made to validate any of the
conclusions by means of longitudinal study. Most of the analysis
was quantitative, and qualitative data were not sought except for a
brief discussion of the South African Electronics Industry. Key
informants in the Electronics Industry included office bearers and
prominent people in national and industry associations as well as
executives in the Allied Electronics Group of companies.
* The study was limited to identifying and analysing the causal relat
ionships between variables and did not attempt to gauge the quality
of the "fit" between these variables in terms of organisational
performance or organization effectiveness. Nevertheless, by
including the concept of Organization Climate in the analysis of
organizations, the study did achieve an indirect measure of
organization effectiveness by establishing the degree to which an
organization's climate is functional and facilitating as opposed to
dysfunctional and inhibiting.
6. ASSUMPTIONS.
The First Assumption was that the information garnered through the
Bureau of Market Research's data base will be illustrative of the
Manufacturing sector as a whole.
The Second Assumption was that the perceptions of structure and
climate of organizations in the Manufacturing sector which are held by
the respondents in this study are representative of the Manufacturing
Industry as a whole.

-9-
The Third Assumption was that research methods which have been
developed in organizational studies throughout the world in both
developed and developing economies would be replicable in South Africa
with the minimum of adaptation to local conditions.
The Fourth Assumption concerns the sociopolitical environment and
stated that there will be relative stability flowing from the current
political changes and the forces shaping industry will be more
competitive than statutory.
7. THE IMPORTANCE OF THIS STUDY.
The importance of this study can be seen from three different perspect
Ives. Firstly, it attempted to answer the question, are
organization and management theories developed in advanced western
countries valid in a developing country - specifically, in a
country with South Africa's unique mixture of old and new worlds and
first and third world values?
Secondly, if the organization and management theories imported from
advanced western countries are. not applicable in South Africa. this
study attempted to answer the question, how and why not?
And thirdly, it attempted to make a contribution to understanding
the forces that shape South African Manufacturing organizations at
this most crucial of junctures in their history, as they stand braced
to enter the hurley-burly of international competition on an equal
footing with other players in the global market, and as they extend
their sphere of operations into areas previously unreachable.
6. SUMMARY.
In this tirst chapter the point of departure of this study has been
set out and the research problem and its attendant subproblems were

-10-
identified and discussed. Several hypotheses were spelt out and the
delimitations encountered and the assumptions that were made were also
outlined. Finally, a brief indication was given of the value of this
study and its importance to the body of scientific knowledge about
organizations, particularly in South Africa at this time.
The following two chapters will present a comprehensive review of the
related literature, beginning with the earliest recorded structural
issues and leading up to the development in recent times of a cogent
body of knowledge called Organization Theory.
In common with many other areas of scientific endeavour, the most
outstanding contributions to the tield of Organization Theory have
occurred only in recent times and by far the majority of writers,
researchers and theorists have existed in the last 100 years. And,
typically, the most substantial theoretical advances have occurred in
the latter half of the 20th Century.

CHAPTER TWO: REVIEW OF THE RELATED LITERATURE AND RESEARCH:
A HISTORICAL OVERVIEW.
1. INTRODUCTION.
Although it was said in the last chapter that Organization Theory is
very much a 20th century discipline, and that the major theoretical,
scientific and academic contributions have occurred only in the last
tOO or so years - evidence, nevertheless, abounds of the major organi
zational feats that have been undertaken by mankind since the birth of
civilization. The earliest records of Far Eastern and Middle Eastern
civilizations of four or five thousand years ago are replete with the
structural and administrative questions that have vexed human
organizations, and which still do today.
In the context of reviewing literature related to a research problem,
Behling ( 1979: 41) said, "Everything has an antecedent. To begin to
investigate any prohlem ... it is likely that one would trace that
problem ... to its deeper origins." So it is with Organization Theory.
The only question is, how far back does one go in tracing the
antecedents? Man is a gregarious creature by nature and when the
earliest beings began to hand together for mutual protection and
survival, so a pecking order emerged and the pressure to organize and
structure activities grew.
This chapter will, however, not examme the organizational and structu
ral issues associated with prehistoric man. These are concepts that
are best left to be explored by anthropologists, historians and archeo
logists. Rather, it is intended to begin with just a brief discussion
- by way of example - of one or two of the greatest Middle Eastern and
Mediterranean civilizations and their organizational achievements over
the past 4000 or so years; moving on to touch briefly on renaissance
and early industrial Europe, before concentrating on the most recent
and meaningful research and academic discourses.
In the process of analysing the related literature and research it is
inevitable that a stage will eventually be reached where certain

-12-
authors, or a particular body of scientific knowledge and research,
begin to become familiar and are catalogued more than once - or even
several times. (Behling, 1979: 43.) This is a natural process as the
focus of the examination of the literature moves from broad and
superficial to focused and thorough.
This was indeed the case with this study and, in the course of
researching empirically-based Organization Theory, the work of the
Industrial Administration Research Unit of the University of Aston in
Great Britain was encountered again and again. This was particularly
true in the context of Organization Structure and the issues of
describing and measuring the dimensions of structure. The search
of the related literature has revealed that an enormous amount has
been written about Organization Theory but not a lot of it can he
classified as useable in the sense that it represents a replicable
body of empirical research. The Aston work was a clear exception and
it has been the subject of numerous replications and extensions by
researchers throughout the world.
Early in the course of this study, contact was made with the U niver
sity of Aston. In a letter to the writer, Doctor Peter Clark, who 1s
reader at Aston, comments, "I have been approached on the beach m
Haifa and then in Sydney about the Aston scales(!) but I do not recall
a South African application." Which tends to confirm the assertion
made in the last chapter that there has been little or no empirical
research done in the field of Organization Theory in South Africa.
2. FROM EARLY CIVIUZA TIONS TO THE INDUSTRIAL REVOLUTION.
Early organizations were often of a military or religious nature and,
even in undertakings that occurred before recorded history, some form
of organization and administrative structure was necessary if the
group, tribe or nation was to achieve its goals. Excavations in
Pakistan and India have revealed that cities of 4500 years ago bore
clear evidence of the physical trappings of organization and
structure. They were planned in rectangular blocks and had water
supply and drainage systems. (Ford, Armandi & Heaton, 1988: 20.)

-13-
2.1 The E~tians.
Of the early civilizations the feats of the Egyptian kings are
often cited as bearing testament to their organizational
abilities. ln 3100 B. C. King M enes first unified the upper and
lower kingdoms and built his capital at Memphis. From here he
centralized the monarchy and his government exercised control over
the united kingdoms by means of a number of administrative and
military measures. He also undertook vast engineering schemes, one
of which was a masonry wall across the Nile which diverted the
waters of the river for irrigation purposes. (Mertz, 1982 : 895)
The early Egyptians displayed awesome organizational skills in the
process of constructing their temples and pyramids. The Great
Pyramid of Cheops, for example, has a floor area of 13 acres and is
constructed from over 2 million stone blocks. Each block weighs,
on average, 21h tons. It is calculated that more than 100 000 men
worked for 20 years to complete this project The sophisticated
organizational concepts and structural controls necessary to carry
this out must have been incredible, even by modem-day standards.
Enormous quantities of stone had to be quarried, shaped, hewn,
moved long distances - sometimes over water - and then placed
properly. This vast undertaking included the planning,
administration, coordination, and leadership of work teams as well
as the logistics of providing sustenance and materials for the
immense workforce. And then, at the end of the day, there was the
problem of keeping everyone working toward the same common long
term goal (Ford et al, 1988: 20.)
Ancient Egypt also excelled in the sphere of academic organiza
tion. This was exemplified by the library of Alexandria which
flourished under the patronage of Ptolemy H. Major poets,
writers, scholars, mathematicians, astronomers, philosophers and
scientists gravitated to the Alexandria school until it rivalled

-14-
Athens as a centre for learning and culture. At its height it had
faculties of medicine, mathematics, astronomy, literature, and many
other subjects. Its facilities included a chemical laboratory, an
astronomical observatory, an anatomical theatre, and botanical and
zoological gardens. (Baker, 1982 : 484.) There were 14 000 pupils
studying a variety of subjects at any one time. The administrative
requirements and structural controls would not have heen dissimilar
to those of any large modern-day academic institution.
2.2 Moses and the Israelites.
The following passage shows that many organizational principles
that have been developed in recent times were, in fact, clearly
understood some 3500 years ago.
And Moses' father-in-law said to him, "The thing that you are doing is not good. You will surely wear out both yourself and these people who are with you, for the task is too heavy for you; you cannot do it alone. Now listen to me: I shall give you counsel...you be the peoples' representative he fore God, and ... then teach them the statutes and the laws ... and the work they are to do. Furthermore ... select out of all the people able men ... and place these over them, as leaders of thousands, of hundreds, of fifties, and of tens. And let them judge the people at all times; and let it be that every major matter they will bring to you but every minor matter they themselves will judge. So it will be easier for you and they will bear the burden with you."
(Exodus 18: 17-22)
1 ethro, the father-in-law of Moses, is possibly one of the world's
earliest management consultants. Jethro observed that Moses spent
most of his days making judgements and decisions for his people and
was thus unable to attend to the important long term and strategic
issues which affected the nation as a whole. His advice to Moses

-15-
was to decentralize the decision-making process and to delegate
authority as a broad organizational strategy. The associated
problems of retaining control and maintaining cohesion in a large
decentralized structure were then addressed by the accepted
bureaucratic means of standardization (teaching the people the work
they are to do) and formalization (statutes and laws). And, of
course, one is able to recognise the typical pyramidal organization
chart so evident in modem companies.
It was only some 31h thousand years later that the Aston and National
studies (Child, 1972) explored the link between decentralization on
the one hand, and formalization and standardization on the other.
Certainly, Jethro understood that larger size would lead to greater
complexity, and that the concomitant decentralization would require
more formalization and standardization.
His advice to Moses would not be out of place m the board room of a
present-day top 200 company.
2.3 Philip of Macedon and Alexander the Great
As an organization becomes larger it develops distinctive needs.
These needs often give rise to novel coping mechanisms, such as
innovative organizational designs and structural variations, which
enable the organization not only to cope but to achieve even greater
heights. Such positive adaptation is, of course, predicated on a
leader who is intuitive enough to recognize the opportunities and
threats and to capitalize on them.
The armies of Philip of Macedon (382-336 B.C.) and his son Alexander
the Great (356-323 B.C.) are illustrative of how an organization can
produce a successful structural response to the needs of a
situation.

16-
Philip of Macedon. Until the time of Philip of Macedon, l!lilitary
activity was characterized more by random, marauding hands of
private militia who fought brief battles and raided one another on a
sporadic group-on-group basis. They carried all their own supplies,
ordnance and equipment and their goals were short-term and limited -
engaging the enemy, winning or losing, and then returning home.
Long term military strategy, tactics and logistics had not been
developed.
Philip created and moulded an army with which he was
disparate Hellenistic nations and city-states. lt had
ring corps, . a general staff, and a logistic supply arm.
able to sustain itself much longer in the field and
able
an
It
lent
to unite
enginee-
was thus
itself to
the achievement of more ambitious and longer term strategic goals.
Philip's army also saw the beginnings of specialization in that it
had embryonic forms of the three arms branches of infantry, cavalry
and artillery. (Griffith, 1982: 225-227.)
Alexander the Great When Philip died, his son Alexander Ill took
over his army and immediately displayed his military and
organizational genius. Alexander honed the army into a tlexible,
mobile, all-terrain fighting force of 35 000 men, 5000 of whom were
the most effective cavalry unit ever seen. Alexander took the
specializations introduced by his father and sharpened them
further. His army was remarkable for its fine balance and
combination of arms. Specialist, lightly armed Cretan and
Macedonian archers who softened up the enemy; followed by Thracian
and Agrianian javelin throwers; then the superb cavalry charge;
and, finally, the core of 9000 infantry carrying shields and 18 foot
long spears. Often, the infantry was not even required after the
archers, javelin throwers and cavalry had done their work.
(Walbank, 1982: 468-473.)
Interestingly, Alexander added lnteiJigence, Public Relations and
Propaganda functions to his army. These staff and support functions
were often able to convince potential enemies of Alexander's power

-17-
and that fighting him would be futile; predating by more than 2000
years the efforts of both Tokyo Rose and Lord Haw-Haw in the second
World War.
When he succeeded his father, Alexander had three key objectives:
he had to assert control over the Hellenistic Empire
he had to expand on his father's conquests with numerous
far-reaching and long-term campaigns in Asia and north Africa, and
he wanted his army's fighting prowess and successes to become widely
known. (Ford et al, 1988: 21.)
His response to these objectives demonstrated his tine understanding
of organizational demands. Apart from creating new types of fight
ing units, he improved support services and instituted wide ranging
structural changes which brought about a decentralized chain of comm
and more suited to the greater complexities of a large organization.
ln an army so specialized that some men became highly trained cav
alry, infantry or artillery officers, other men had to be assigned
ordinary duties and be supervised, requiring standardized rules and
procedures. Alexander, therefore, developed appropriate structural
control innovations which enabled his army to maintain its sharpness
and combat-readiness.
2.4 The Arsenal of Venice.
Renaissance Italy, apart from being in the vanguard of the cultural
and artistic revival after the dark ages, was also a world leader in
industry. The Arsenal of Venice, for example, was a ship building
facility which covered 60 acres and employed up to 2000 workers. It
was the largest industrial establishment of the 16th century. It
employed mass production techniques that were later commonly
credited to Henry Ford and the Model T. (Ford et al. 1988: 21-22)
The Arsenal had a three-fold mission. Firstly, the manufacture of

-18-
galleys, arms and equipment; secondly. the efficient storage of these
items; and, lastly, assembly and refitting as required. In order to
accomplish these tasks the Arsenal was organized into functional
areas with a foreman in charge of each department Ship building
went through three standardized and carefully preplanned stages of
production with different skilled workmen involved m each stage.
The final assembly stage involved all the departm~nts of the Arsenal
as an unprovisioned ship was towed past a series of warehouses
containing everything necessary to equip a battle-ready vessel. As
the boat passed along the warehouse area, arms and equipment were
added in the correct sequence, seams were filled with tow and pitch,
the hull was covered with tar or grease, deck fixtures were fastened
in place, and, finally, the rigging, moorings, and oars and arms for
the crew were added. (Albers, 1969: 12.)
The efficiency of the assembly stage was demonstrated to King Henry
lii of France in 1574 when a vessel was assembled, launched, and
armed in less than one hour.
The structural demands on the organization m terms of size, man
power, inventory management, and work group supervision must have
been tremendous. That the Arsenal coped and adapted to these
pressures by evolving a design and structure uniquely suited to its
situation is remarkable. And all without the benefit of the insights
provided by 20th century Contingency Theory.
2.5 Europe after 1500. and the Industrial Revolution.
There is no sharp dividing line between the economic life of the
Middle Ages and the early modern world; although 15th century Europe
did display many of the signs of the decay of an old order and the
birth of a new one.. It was, however, a slow process. Traditional
organizations associated with trade and industry were reshaped as the
ancient craft guilds began to break up and comp~nies of merchants on
the . one hand and journeyman, on the other, started to assume control
-19-
of the specialized affairs of their own members. Guild control over
industry began to crumble in the face of individual capitalists, or
groups of capitalists, who assumed control of the entire production
process from raw materials to finished goods in the textile,
leatherworking, mining and metallurgical industries. (Wilson,
Landes & Kemp, 1982: 219-255.)
The biggest influence on the structure of commercial organizations
in early modern Europe was the availability of capital. Toward the
end of the 16th century a second, more powerful, structural Impera
tive began to make itself felt. This imperative was Technology.
As demand grew in light industries such as textiles, a system of
distributing raw materials to cottage industry - the so-called
"putting out" system - was developed by entrepreneurs whereby
finished and semi-finished goods were produced by cottage workers
from raw materials and tools provided by the merchant entrepreneur.
The system offered many advantages. It shifted fixed costs to the
workers, all the merchant needed was a room for storage, and at the
same time it gave him access to a large pool of cheap labour. In
bad times he simply cut back on what he put out, with minimal
overheads and fixed costs to . carry. However, in good times and as
demand grew, the merchant entrepreneur was compel1ed to put out his
goods to an ever increasing radius of workers - thus incurring a
disproportionate increase in transport costs.
lt was in the context of frustrated opportunity that the merchant
entrepreneurs sought some way of concentrating work under one roof
where the labour force could be supervised and controlled. The
technology of the time made this impossible, until the invention of
large machines driven by centralized inanimate power. For example,
the spinning jenny invented by James Hargreaves, finally provided
the means ·to collect individual workers together in what was to
become known as a factory. This, and other innovations, heralded
the incremental process which was later dubbed the Industrial
Revolution.

-20-
The essence of the Industrial Revolution is illustrated by a number
of innovations in product and process technology:
the substitution of inanimate for animal or human power,
particularly by the coal-fired steam engine,
the substitution of machines for human strengths and skills,
the invention of new methods of transforming matter, particularly
industrial chemicals and iron and steel, and
the organization of workers in large centrally-powered units and
factories that made possible constant supervision and more efticient
allocation of labour. (Wilson et al, 1982: 231.)
The catalyst for the industrial revolution was undoubtedly the
railway. It enabled the economy to move rapidly to unprecedented
heights by providing mobility for both capital and labour and
moving unheard of quantities of goods to and from the new industrial
areas. In addition, the railway itself created an enormous demand
for iron, steel, coal, wood, brick, and other materials which
stimulated industry. Finally, the railway was a major provider of
employment. At the peak of the railway boom in Great Britain in the
1840s it employed some 300 000 men in construction alone - more than
the entire cotton industry. Spectacular engineering feats were
achieved in laying thousands of miles of track, and the organization
of labour into large gangs inspired new organizational methods.
(Wilson et al, I 982: 232.)
The trend to bigness made possible by increased mobility and
technological advances was reinforced in the 20th century by the
achievement of economies of scale. Electrical power, the internal
combustion engine, the electronic revolution, and instant
communication have all contributed to the growth of today's
mega-organizations. The concomitant imperatives and contingencies
acting on organization structure have, in the last two centuries,
increased immeasurably.

-21-
As scientists and researchers throughout history have been dr~wn to
dissect, analyse and mull over complex phenomena and systems, so it
has been with organizations. The growth in both the size and number
of organizations ultimately spawned a new scientific discipline.
3. TOWARDS A THEORY ABOUT ORGANIZATIONS AND STRUCTURE.
The birth of a theory about organizations ts generally regarded as
being heralded by the formulation of the concept of Bureaucracy by the
German sociologist Max Weber ( 1864-1920). His definitions have laid
the foundations for all subsequept work that has been done on the
subject
The -following sections will examme the historical background to the
concept of bureaucracy and will then touch upon the major schools of
thought which have contributed to the discipline of Organization
Theory, as well as looking specifically at their intluence on our
understanding of organization structure.
3. 1 Historical Back~ound to Bureaucracy.
The Roman Catholic Church existed in a bureaucratic form for hund
reds of years and many medieval city states also held a bureaucratic
form. However, it was not until the strong bureaucratic states of
Western Europe came into being, with their unitled and centralized
control of extensive territory, that it was possible for the
bureaucratic ·form to spread and assume dominance in all forms of
public, social and business life.
Initially, the activities of. the state and the royal house were
combined and only when they split did the concept of a state
department, office or bureau come into being. Bureaucratization,

-22-
once established, expanded rapidly in the 16th and 17th centuries,
dominated initially by the aristocracy as the state increasingly
absorbed the functions of local government. Bureaucratic offices
were commercialized and could be bought and sold - sometimes being
created especially for this purpose. In France in the years 1620 to
1632 the sale of bureaucratic offices accounted for one third of
state income. The opportunities for nepotism and corruption were
obviously great in such a system.
After the French revolution and widespread reforms in the rest of
Europe, pressure increased to professionalize the state bureauc
racy. As people saw themselves as citizens rather than subjects,
there was also a move to open the bureaucracy to all and it was no
longer the exclusive domain of the wealthy or nobility. Entrance
became by means of qualification - and neutrality and service to the
public was emphasized. (Mouzelis, 1982: 484-497.)
3.2 Weber's Bureaucratic Ideal Type.
Weber initially formulated his theory of an ideal type of bureaucra
tic organization to explain the unique features of Western
civilization. He was, therefore, concerned mainly with the state
apparatus; only later did he broaden his theories to encompass all
organizational forms: church, social, state and business.
The essential features of Weber's ideal type were:
1. A continuous organization with official functions bound by
rules.
2. Specific spheres of competence with division of labour and
provision of the necessary authority to office holders.
3. Organization into a hierarchy of offices with each lower
office under the control of a higher one.
4. High formalization with dependence on rules and norms to
govern behaviour. Only persons who have demonstrated ade-

-23-
quate technical training or ability considered for promotion
or appointment to official positions. Administrative acts,
decisions and rules are always committed to writing.
5. Separation of ownership and administration, and separation of
employees' organizational and personal lives. Managers are
professionals who are remunerated according to their rank or
position in the organization.
6. Career paths for employees based on achievements, seniority,
and the judgement of superiors.
7. Employees are subject to strict and systematic discipline hut
are protected from arbitrary action by the right to appeal to
a higher level of authority.
In the context of controlling an organization, Weber identified
three different types of leadership:
the traditional leader who derived loyalty by virtue of his
inherited status. Functionaries in his organization were
personal retainers dependent on the master for reward;
the charismatic leader who derived authority through his
personal characteristics or from his status as a hero.
Office bearers in this organization would be disciples of the
leader; and finally
the leader who derives his authority from legal, rational
grounds. This was the type of leadership which combined most
effectively with a professional bureaucracy.
(Weber, 1984: 13-27.)
In Weber's view a bureaucratic organization structure was exempli
fied by a strongly hierarchical configuration, high formalization
and centralization, pyramidal shape, and division of labour. His
view of organizations was as mechanistic, rational, closed systems,
and this was to exercise a very strong intluence on the way in which
subsequent theorists thought about organizations.

-24-
3. 3 The Classical School
That there 1s a classical school of Organizational Theory is general
ly agreed. The issue in dispute is whom to include and whom to
leave out. Some authors include Marxian class struggle and Michel's
Iron Law of Oligarcy (Mouzelis. 1982: 487-491), while others
include the Weberian ideal type bureaucracy. (Robbins, 1987: 478.)
There is, nevertheless, consensus that the Classical School is best
represented by the writings of Frederick W Taylor ( 1856 - 1915) and
Henri Fayol (1841- 1925).
Frederick W Taylor. Taylor (1984: 157-176) propounded a system
which he called Scientific Management and which he summarized in
four principles of management:
l. The development of a sc1ence to replace the "rule-of-thumb"
knowledge of workers. This involved describing and collating
each element of a worker's job and, with the assistance of
time and motion study techniques, determining the single best
method of carrying it out.
2. The scientific selection and progressive development of
workers as a continuous process.
3. Bringing together scientific managers and scientifically
selected and trained workers to accomplish work objectives
with the scientific method.
4. A more even distribution of work between managers and
workers, the former doing the planning and supervising and
the latter the execution. Foremen should be specialists in a
particular field. e.g. Quality or Maintenance, and should
supervise several workers within this specialized field.
In total Taylor's writings offered little focus on the issue of
structure except at the lowest organizational level. He also
proceeded from a mechanistic, closed-system viewpoint with emphasis
on the division of labour.

" -25-
Henri FayoL Whereas Taylor focused on shop floor management,
Fayol (1984: 135-156) sought to develop more general principles of
management which would be applicable to all levels of the
organization. Proceeding from a basic bureaucratic orientation, he
articulated his 14 general principles of management:
l. Division of Work. Drawn from the writing of Adam Smith;
specialization makes workers more efficient and increases
output.
2. Authority and Responsibility. Managers must be given the
requisite authority to give orders. Along with authority
comes responsibility and, to be effective, . a manager's
authority must equal his responsibility.
3. Discipline. Workers must obey the rules that govern the
organization. Good discipline is an amalgam of dear
understanding of the rules, effective leadership, and
judicious use of sanctions and penalties.
4. Unity of Command. Every employee should receive orders
from only one superior.
5. Unity of Direction. Organizational activities that have
the same objectives should be under the control of one
manager working to one plan.
6. Subordination of Individual Interest. The interests of any
employee or group of employees should not take precedence
over the general interest of the organization.
7. Remuneration. Employees must be paid a fair wage and, by
means of bonuses and profit sharing, workers and junior
management should have keenness and well-directed effort
rewarded.
8. Centralization. The degree to which decisions are
centralized with management, or decentralized to employees,
is dependent on the demands of the situation. The question
is to tind the proper proportion of employee involvement in
decision making.
9. Scaler Chain (Line of Authority). Communication should
follow the scaler chain of authority from low level employees

-26-
to top management unless it creates unnecessary del~ys; in
which case, and with the permission of all, direct communica
tion between subordinates can take place provided that
superiors are kept informed.
10. Order. People and materials should be in the right place
at the right time, every time.
11. Equity. Managers should treat their subordinates tn a kind
and fair manner.
12. Stability of Tenure of Personnel. Management must plan its
manpower needs and ensure that replacements are provided
smoothly to fill vacancies. High labour turnover is
inefficient.
13. Initiative. Employees who are allowed to originate and
carry out plans will exert a high level of effort
14. Esprit de Corps. Promoting team spirit will encourage
unity and harmony in the organization.
The structural effects of Fayol's treatise can be seen mainly m the
humanizing effect it had on machine bureaucracy. Some of his
thoughts are quite at home at the cutting edge of modem organiza
tion and management theory. For example, profit sharing for workers
and junior management, and employee participation in decision
making, are both fairly modern structural innovations based on
recent motivational and productivity research.
All in all, though, Fayol still proceeded from a point of departure
steeped in bureaucratic concepts and based on a mechanistic view of
an organization as a closed system with centralized decision making
and division of labour.
3.4 The Human Relations School
A Study undertaken between 1924 and 1927 at the Western Electric
Hawthorne Works in Cicero, lllinois, in the United States resulted
in the documentation of the now famous Hawthorne effect; which

-27-
demonstrated that social and emotional factors - rather than changes
to physical conditions - lead to variations in productivity and
output.
The study was undertaken by Elton Mayo and a number of colleagues at
Harvard University and it was expanded upon during the 1930s and
1940s. This group, later to become known as the Human Relations
School, took a very different view of organizations and saw them
primarily as social systems which fulfilled mainly social needs.
The impact on the understanding of structure of this group can be
gauged by their concept of the informal organization that develops in
the work environment, within and alongside the formal structure. lt
is this informal structure that ultimately determines the status and
rewards of its members and creates norms and codes of behaviour by
catering to the emotional needs of recognition. belonging and
security.
Keller (1984: 193-203) highlighted the influence that the ideas of
Italian engineer, economist and sociologist, Vilfredo Pareto
( 1848-1923 ), exercised on the human relations school. During the
1930s and early 1940s a small but very influential group of Harvard
academics, under the leadership of Lawrence Henderson, gathered on a
regular basis to consider the ideas of Pareto.
Against the background of worldwide depression and the growth of
Marxism on university campuses, including Harvard, these academics
saw tbe conservative teachings of Pareto as an ideological defence
against radical Marxism. Most of them came from moneyed or privel
eged backgrounds and they had a vested interest in preserving the
status quo. The Pareto Circle included some prominent names, among
them Elton Mayo, Robert Merton and Talcott Parsons. The latter two
were most often associated with the birth of the structural funct
ional school of sociology which . was to influence the direction of
organizational studies for the next three decades.

-28-
Henderson, who was a medical doctor, readily took to the views of
Pareto who saw organizations as equilibrium seeking, closed systems,
comprised of a number of subsystems. Each subsystem was evaluated
by examining its consequence on other subsystems and on the system
as a whole. Conflict was seen as inconsistent with a .. healthy"
system and stability and equilibrium were valued over change or
conflict (Keller, 1984: 196-197.)
These ideas, later extended and articulated as structural function
alism, no doubt exercised a great deal of influence on the way in
which the Hawthorne studies were interpreted. One can only specu
late as to the direction the Hawthorne study would have taken if,
for example, the participantS' approached it from an open systems
viewpoint; or what the effect on organization theory would have been
if the Pareto circle was based at a less prestigious institution
than Harvard university.
3.5 The Contingency School
The contingency school grew, firstly as a response to both the
classical and human relations schools, many of whose principles were
seen as simplistic and nothing more than proverbs, which were often
contradictory. Secondly, the contingency school recognized the
influence that context and environment could have on an
organization's structure. They saw organizations as open systems
that needed to adapt and change according to the needs of the
environment Katz and Kahn (Robbins, 1987: 482) exemplified this
view and they provided compelling evidence of environmental
influence on the survival of organizations and as a major
contingency in shaping structure.
Most empirical research in recent times has flowed from this app
roach as a number of studies investigated various contingencies.
Woodward ( 1958: 4-21 ), for example, put together an impressive case
for technology being the overriding structural imperative. This
position was challenged by the Aston team (Hickson, Pugh &

-29-
Phesey, 1969: 378-397), who advanced the concept of size as being of
greater importance.
The open systems orientation of the contingency school has led to
much more flexibility in considering structural imperatives. The
contribution of the contingency approach can best he summarized by
its contention that there is no one best way to structure an
organization. The final form that structure assumes will always he
dependent on the contingencies that act on the organization in both
its internal and external environments. (Galbraith, 1977: 28.)
As was mentioned in the first chapter, the orientation of this study
is based on the contingency approach. It is the writer's opinion
that it has the most to offer, particularly in the way of empirical
research. In this respect, the work of the Aston group IS
particularly important and will he discussed in more detail later m
this chapter.
3.6 The Dirty Linen School
The final school of organization theory, which Rohhins ( 1987: 484)
said 1s currently very much in vogue, looks at an organization in
terms of the rivalry and conflicting goals of its political
groupings. Structure is seen as the result of the struggle for
power of various competing cliques within the organizational
hierarchy. Intense political activity is disguised to appear as
though it is in accordance with official policy and ideology.
Self-serving activities are couched in terms that make them appear
as though they are in the long term interests of the organization.
The final structural configuration that the organization assumes is
a product of the internal power struggles that have occurred and the
dominant coalition's personal preferences and interests.

-30-
This approach completes the picture of organizational man . as a
rational decision maker on the one hand and as a social being
seeking security and friendship, on the other, by adding a third
dimension; political man - whose mam interest is the pursuit of
power. (Mouzelis, 1982: 495-496)
Although it provides a somewhat cynical and pessimistic view, it ts
nevertheless a useful perspective. That is, provided that it does
not become exclusive and that the pursuit of political power is seen
as only one of a number of possible contingencies or structural
imperatives.
3. 7 Summary.
Having very briefly traced the history of man's earliest organiza
tional endeavours and then sketched the salient features of the tive
maJor approaches encapsulated in modem Organization Theory, the
position has been reached where it is now possible to narrow the
focus onto a particular body of research. With the application of
an open systems orientation to the prevailing structural functional
view of organization and structure, it was inevitable that the focus
would shift from purely a priori theorizing to empirical
research to match that which had been accomplished by the Hawthorne
studies and its closed system interpretation.
Among the first to accomplish this was the Aston group in Great
Britain whose work has been extended considerably and whose
methodology was valid, reliable and still widely used today.

-31
4. THE ASTON GROUP.
The Aston group started life as a four man team who came together in
the early 1960's as the Industrial Administration Research Unit of the
Birmingham College of Advanced Technology; later to become the Univer
sity of Aston in Birmingham.
Working from a disused basement m a condemned office block some dis
tance away from the main campus, the group, consisting initially of
Derek Pugh, David Hickson, Bob Hinings and Graham Harding, pursued a
line of research which, almost serendipitously, was to redefine the
nature of Organization Theory in Great Britain and elsewhere in the
world where their methods were replicated or extended in the 1970's and
1980's. The Aston work also exercised a considerable influence on the
Organization Theory debate in the United States. (Grandori, 1987: xxi.)
The Aston group's initial terms of reference were to study factory wor
ker performance and to establish how worker performance was intluenced
by contextual factors such as the size of the organization, its product
and markets, and its control structure and technology. The ideas of
Joan Woodward with respect to the effect of technology in determining
structure were becoming very intluential (Daft, 1983 : 162-165). The
Aston research team soon realized that, while they could reasonably
easily characterize and describe products, markets, size and using
Woodward's typology - technology, they had no effective way to
categorize and compare organizational structure.
The issue of Structure aroused such interest in the group that they
postponed their original research and concentrated instead on Organi
zation Structure. "Structure itself became something to be explained."
(Pugh and Hickson, 1976)
4.1 Point of Departure.
The Aston Studies were a seminal work and marked a major departure

-32-
from the individual case study methods of organizational research
that were employed by the Human Relations and Structural ·Functional
schools of Sociology, and the ideal type as a basis for the
analysis of organizational structure as expounded by Weber.
Pugh and his colleagues criticized the popular management and
administrative theorists of the time, which they believed were
exemplified by Weber and Fayol, for being over concerned with the
formal aspects of structure and functioning, or "organizations
without people". Similarly, they were critical of empirically
oriented behavioural scientists, exemplified by Mayo and Lewin,
whose sole concern was informal group behaviour and attitudes - or
"people without organizations". (Pugh, Hickson, Hinings, McDonald,
Turner and Lupton, 1963 : 289-292). They were further critical of
both these groups because their analyses had been processual rather
than factorial. In other words, organization theories had been
built around administrative system - or group interaction -
processes, with little exploration of the causal connections
between contextual factors and these administrative systems or
group behaviours.
At the outset, Pugh and his colleagues made it clear that, for
research to be meaningful, it had to be both processual and
factorial, and that they were proceeding from a strong empirical
bias. Their intention was not to build any more a prwn
theoretical models of organizational functioning.
Proceeding from thinking that was, nevertheless, steeped in
Weberian concepts their first task was to isolate a number of typ
ical and distinct elements that went into Weber's formulation of
bureaucracy. They conceptualized 6 elements as being representa
tive of structure. They maintained that by operationalizing and
measuring these six variables they would be able to break away from
considering organizations in terms of Weberian or neo-Weberian
ideal types and would instead be able to establish an empirical,
descriptive profile.

-33-
The six structural variables were :
- Specialization
- Standardization
- Formalization
- Centralization
- Configuration (Shape)
- Flexibility
In addition. they also postulated a number of contextual elements
which were exogenous to the organization and could be regarded as
independent · variables exercising a causal effect on the dimensions
of structure. These they identified as the organization's origin
and history, its ownership and control, its size, its charter, its
technology, its location and resources, and, finally, its interde
pendence with other players in its domain. (Pugh et al, 1963:
301-313.)
The Aston group's initial hypothesis that the form an organization's
structure finally assumes is largely contingent on contextual and
environmental factors - and that there is, therefore, no one ideal
way to structure an organization - anticipated hy several years what
was to become known as Contingency Theory; which was to form the
most useful and popular theoretical framework for organizational
studies in the 1970s and 1980s. (Hodge and Anthony, 1984: 40-41.)
4.2 The Aston Study.
Data were gathered from a total of 52 organizations in the English
midlands over a two year period from 1962 to 1964. The result was a
random sample of 46 organizations, stratified hy size and product or
purpose. The sample included manufacturing, retail, service,
municipal, and government organizations. (Pugh, Hickson, Hinings and
Turner, 1968: 67)

-34-
A number of papers arose out of the data that were gathered and
treated in the initial exercise and more than 10 years later the raw
data were still being manipulated to extract fresh nuances of
meaning. (Donaldson, Child and Aldrich, 1975)
Understandably, the initial emphasis was on methodology. (Pugh et
al, 1968) This is hardly surprising as it was the first study of
its type and scope to be attempted; going far beyond the unidimens-
ional approach of Woodward and others. Five of the original
dimensions of structure were operationalized. The sixth dimension,
flexibility, was excluded because, by definition, it was
longitudinal in nature and would be difficult to measure in a
cross-sectional study.
Altogether, 64 scales were developed to measure the primary dimen
sions of structure. A factor analysis, employing principal
component analysis, was used to reduce the raw data to four clusters
of underlying dimensions. These were then labelled:
{i) Structuring of activities; referring to "the degree to
which the intended behaviour of employees is overtly defined
by task specialization, standard routines, and formal paper
work." (Pugh and Hickson, 1976 : 78) This included the
structural variables of functional specialization, role
specialization, overall standardization, and overall
formalization.
{ii) Concentration of authoriry; which referred to "the degree
to which the authority for decisions rests in controlling
units outside the organization and is centralized at the
higher hierarchical levels within it." (Pugh. and Hickson,
1976 : 78) This cluster of underlying dimensions encompassed
the structural variables of centralization, organizational
autonomy, and standardization of selection and promotion
procedures.

-15-
(iii) Line control of workflow; described as "the degree to
which control is exercised hy line personnel instead of
through impersonal procedures." (Pugh and Hickson, 1976 :
78) Variables included here were of the ratio of
subordinates, formalization of job performance records, and
the percentage of workflow supervisors.
(iv) Relative size of the supportive component; which 1s
concerned with "the amount of auxiliary activities of a
non-control kind" (Pugh et al, 1968 : 87) The structural
variables measured here included the percentage of clerks,
the percentage of non-workflow personnel, and the vertical
span or height of the organizational structure.
Using the above factor combinations, the Aston researchers were able
to construct profiles of various organizations once the scores had
been standardized. In order to achieve comparability the raw scores
were standardized with a common mean of 50 and a standard deviation
of 15. This enabled not only a meaningful comparison of similar
factors between organizations hut also of disparate factors within
organizations.
The variability of the structural dimensions across organizations
that was thus illustrated had immediate implications for what the
Aston team termed the Weherian Stereotype. "It is demonstrated here
that bureaucracy is not unitary, but that organizations may he
bureaucratic in any number of ways ... the concept of the bureaucratic
type is no longer useful." (Pugh et al, 1968: 88)
4. 3 Classifying Organization Structure.
The Aston team also attempted to put together a fairly basic and

-36-
simple taxonomy of organization structures based on three of the
four underlying dimension clusters, t.e. structuring of
activities, concentration of authority, and line control of
workflow. (Pugh et al, 1969b.)
Tentatively, they identified seven distinct organizational classi
fications and then compared these with the contextual variables of
Size, Technology, Dependence, and Ownership. The results are
summarized in table 2. I.
STRUCTURAL DIMENSIONS CONTEXTVAL VARIABLES
Organization Structuring Concentration Line Control Size Workflow /nJeg-Type of Activity of Authority ojWorkflow ration of Tech-
Full Bureaucracy
NascenJ Full Bureaucracy
Workflow Bureaucracy
NascenJ Workflow Bureaucracy
Preworkjlow Bureaucracy
Personnel Bureaucracy
Implicitly Struc-tured Organi:zation
KEY: H = M L
Table 21.
no logy
H H M M
M H L M
H M M H
M L L M
L L L L
L H H M
L L H L
Standard score higher than 55 Standard score of 45 to 55 Standard score less than 45
Defmition of Structural types in terms of Standard Scores on Structural Dimensions and Contextual Variables.
L
M
H
H
H
L
L
Dependence
H
H
H
M
L
H
L

-37-
Based on this analysis, the Aston team were able to postulate 7
basic organizational typologies:
Their was only one Full Bureaucracy and it was charac-
. terized by high scores on structuring of activities and
concentration of authority. lt had a high dependence score,
probably because it was government owned, and a low score on
workflow integration because it was only a maintenance and
repair function.
The Nascent Full Bureaucracy possessed much the same
characteristics, although not to the same degree.
Workflow Bureaucracies had high scores on structuring of
activities while the relative scores on the other two struc
tural dimensions were comparatively lower and fell within the
Medium range. This group contained the largest organizations
in the Aston sample and had the highest scores on worktlow
integration of manufacturing industries - indicating a high
degree of automaticity and rigidity m the manufacturing
process.
Nascent Workflow Bureaucracies, again, showed much the
same characteristics, but not to the same degree.
Preworkflow Bureaucracies scored a lot lower on structur
ing of activities and ·showed typically workflow bureaucracy
characteristics of dispersion of authority and impersonal
line control. They were smaller in size than nascent
workflow bureaucracies and were much more independent, as
indicated by the high scores for concentration of ownership
with control.
Implicitly Structured Organizations had low structuring of
activities, dispersed authority and high line control. They
included the smallest organizations in the sample and scored
low on workflow integration, indicative of a more entrepre
neurial and organic structure. They were relatively indepen
dent with high scores for concentration of ownership with
control.

-38-
Personnel Bureaucracies, although very similar to
implicitly structured organizations in terms of low scores on
structuring of activities and high scores on line control,
nevertheless differed sharply on concentration of authority.
Read together with their high scores on dependence and low
scores on concentration of ownership with control, it· was
typical of the organizations in this cluster; namely,
government or municipal organs whose ultimate controlling
group was always above and outside the organization itself.
A developmental sequence was suggested and this is apparent in the
terminology used to describe the vanous types of structure. As an
organization develops and grows in size, looking specifically at the
dimensions of structuring and line control, it was possible to see
an increasing amount of structuring and a decreasing amount of line
control as it progressed :
from Implicitly Structured - small stze, hands-on control,
flexible technology,
through Prework.flow- less line control, more staff control,
then Nascent Workflow -. first appearance of specialists,
growth of structural and procedural controls,
and, finally, Workflow bureaucracy - with its reliance on
specialists, formalized procedures, and control through impersonal,
bureaucratic regulation. (Pugh et al, 1969b: 123-124.)
The same sequence of events would apply to the development of
nascent full bureaucracies into full bureaucracies.
The Aston Group's empirical taxonomy of structures and its concomi
tant developmental sequence again debunked the Weberian ideal type.
It also anticipated the concept of an organizational life cycle,
popular in management literature of the 1980s.

-39-
4.4 The Technolo~cal Imperative.
The final task that the Aston team undertook was to re-examme the
Technological Imperative of structure, which had been given great
prominence as a result of the work of Joan Woodward. ( 1958: 4- 21.)
In contrast to Woodward's three-fold classifications of technology,
the Aston researchers devised a single, overall variable which they
called Work.flow Integration and which was an amalgam of the
automation of equipment,
adaptability of workflow,
evaluation of operations. and
unitofthroughput
of the organization's technology.
378- 397)
(Hickson, Pugh & Pheysey, 1969:
Taken as a whole, the team's findings both contirmed and conflicted
with Woodward's tlndings. Most importantly, they could find no
support for the broad Technological Imperative hypothesis that
technology was of primary importance to structure. They concluded
instead that " ... it is size that is overwhelmingly related to
structuring of activities." (Hickson et al, 1969: 388.)
They did conclude, however, that their differences with Woodward's
study were not irreconcilable - especially if size was introduced as
an independent variable and technology was contined to those
structural variables related directly to workflow. In other words,
technology could be of overriding structural importance in a small
company, or near the operating core of a large company. "The
smaller the organization, the wider the structural effects of
technology; the larger the organization, the
confined to particular variables, and size
similar factors make greater overall impact"
395.)
more such effects are
and dependence and
(Hickson et al, 1969:

-40-
The Aston standpoint on the Technological Imperative was chall.enged
by Aldrich (1972, 26 - 43) who applied a different statistical model
(path analysis) to the Aston data. He maintained that different
outcomes or causal relationships could equally well fit the Aston
data and correlations. He also criticized the Aston methodolot,'Y for
its apparent lack of consideration of reciprocal causality and
feed-back loops. His path analysis model suggested that technolot,'Y
actually preceded both structure and size - so the causal chain was
in fact
technology • structure • stze.
In replying to Aldrich, Pugh and Hickson (Van Niekerk, 1979: 143)
emphasized that their data were cross-sectional and their study was
only aimed at establishing relationships and possible predictions.
No claims could be made for causality. Similarly, no causal links
could be inferred via the path analysis model because the data were
cross-sectional.
In an early replication of the Aston study, Child (Child &
Mansfield, 1972: 371) further developed the caveat attached to the
cross-sectional nature of the data Firstly, the data were gathered
in a much shorter time period than it would take any of the
variables being measured to actually change. Organization change
is, by its very nature, slow and incremental. Secondly,
c ross-sect i on a l d at a w o u l d b e r e f err i n g t o s im u l tan eo us l y
occurring values of different variables and, again, one would
expect the process of causality to take time. It would not be
reasonable to expect that technology, size or structure could change
instantaneously. (Child and Mansfield, 1972: 391.)
4. 5 The National Study.
The study by John Child (1972: 163-177) was the first large scale
replication of the Aston work and was undertaken by the London

-41-
Graduate School of Business Studies. Child took pains to replicate
as exactly as possible the Aston methodology, using the interview
schedules provided hy the Aston team and ensuring that his own
research assistants were trained by the Aston group.
Child's sample differed from that of the Aston team m five
important respects:
I. It included more than just one region of Great Britain -
hence it became known as the National study.
2. As far as possible the sample was confined to whole units and
did not include any sub-units of larger organizations.
3. It was confined to business organizations and excluded civil
service and local government organizations.
4. The sample was stratified hy size and confined to only six
industries, 4 manufacturing and 2 service.
5. The size of the sample was considerably larger, 82 organiza
tions as opposed to Aston's 52.
(Child, 1972: 165)
The biggest difference in the raw scores of the structural dimen
sions measured hy the two studies occurred on the dimension of
centralization, where the National mean was less than the minimum
actual score on the Aston sample. Child felt that this difference
could be accounted for because Aston had included branches in its
sample and decision making within a branch would seem to he more
centralized; whereas the National study saw branch decisions as
decentralized and occurring at a lower level.
In contrast to the Aston studies the National study aJso came up
with a negative correlation between centralization and rules (stan
dardization) and paperwork (formalization). This, it was felt,
could well be a retlection of the greater homogeneity of the Natio
nal sample in terms of status. Most of the rules and procedures of
standardization and formalization would be evident m branches and
subsidiaries, and the National sample excluded branches.

-42-
For Child, the correlation between decentralization and bureaucratic
control measures of formalization and standardization implied a
strong measure of strategic choice. Thus an early salvo in the
argument about the strategy /structure causal link was fired.
Child ( 1972: 175), therefore, queried the discarding of Weberian
concepts by the Aston team as his findings actually supported
Weber's description of decision making and decentralization in a
bureaucracy. Nevertheless, Child did find strong support for the
Aston assertion of a nexus between specialization, standardization,
formalization, and vertical span.
Child also called into question the Aston taxonomy of structures
smce some doubt had been cast on the second group of underlying
factors relating to centralization, which formed one of the axes for
Pugh et al's analysis.
However, Donaldson ( 1975: 453-456) later revisited the Aston data
and this time he controlled it for status and government organiza
tions which were highly centralized. The upshot was that the
controlled Aston data still had a mean centralization score
considerably higher than the National figure. Donaldson concluded
that, "the Aston results cannot be explained away as an aberration
produced by inconsistent measurement across units having different
organization status. And the resolution of this puzzle needs to be
looked for elsewhere." (Donaldson, 1975: 455-456.)
ln another examination of the National data, Child and Mansfield
(1972: 369-393), proceeding from an open systems perspective, looked
afresh at the Technology, Size and Structure link. They made the
point that the findings of Woodward and her colleagues were not
inconsistent with those of the Aston and National studies. They
were, in fact, measuring different aspects. In measuring structure,
Woodward had described the 'shape' of an organization while the
Aston and National studies had been more concerned with structural

-43-
variables which described strategies of control. They concluded
that the results of the Aston and National studies, taken together,
refuted any argument for technology as the single most important
structural imperative. (Child & Mansfield, 1972: 388). They did
concede, as did Hickson et a/ ( 1969), that technology played a
part near the operating core and in smaller organizations.
Another re-examination of the National data led Child ( 1973:
168-185) to focus on the linkage between s1ze and formalization.
His conclusion was that complexity, as defined by role and
functional specializations together with the level of specialist
4ualifications, should be introduced as an intervening variable. In
other words, the correlation between large size and high
formalization was not as powerful as the relationship between large
size and increased complexity on one hand, and then complexity and
formalization, on the other. An unpublished reanalysis of the
original Aston data supported the size-complexity-formalization
configuration obtained in the National study.
4.6 The Value of the Aston Work
Although the Aston work has been criticized on methodological
grounds, it has also been widely acclaimed for the manner in which
it operationalized abstract theoretical concepts, developing scales
and measuring instruments which made possible numerous
replications. The Aston team saw their own contribution in terms of
a break with Weberian ideal types and a transition from a priori
to empirical theory based on an open systems orientation. They set
objectives to identify, describe and measure the dimensions of
structure and to consider the influence of context or environment.
There can be little doubt that they succeeded. The extent of their
success can also be judged ·in the growth of a body of contingency
theory with a strong empirical bias.

-44-
Studies of context and structure using the Aston scales have been
made in the UK, USA, Canada, Sweden, West Germany, Poland, J~rdan, Egypt, India and Japan. They have also been made across manufac
turing, service, government, hospital, educational, religious and
trade union organizations (Pugh & Hinings, 1976). As a package,
the Aston studies represented a sustained approach to the study of
organizations. Its methods were based on a two-pronged thrust.
Firstly, its approach was multidisciplinary and broad-based,
encompassing as many variables as possible; and, secondly, its
methodology was systematic and deliberately designed so that others
could use it and adapt or improve on it. (Hickson & McMillan,
1981.) In a critical, replication Grinyer and Yasai-Ardekani
( 1980: 405-421) demonstrated the adaptability of the Aston methodol
ogy on a sample of 45 electrical engineering firms in south-east
England. The CUBS study, as it became known, found broad support
for all the main findings of the Aston and National studies.
The adaptability of the Aston methodology has meant that it has not
dated and it was still in widespread use during the 1980s.
5 . ASTON : EXTENSIONS. REPLICATIONS AND VARIATIONS.
After the initial study carried out on the Birmingham sample and the
published work that tlowed from it, a number of replications,
extensions and variations followed. The work of the Aston group
invoked widespread interest and comment - not least because their
methodology was so clearly spelled out and explicit that it was easy
to follow; and also easy to criticize. One of the major problems
associated with their method was the prohibitive cost of gathering
data ( Grinyer & Yasai-Ardekani, 1981: 288). The interview schedules
and measuring instruments were so comprehensive that it could take
from tive hours to several days to elicit data from one respondent,
depending on the size of the organization.

-45-
5. 1 The Coventxy Study.
The first replication of the Aston study was a small scale repeat
under similar conditions. The prime objective was to establish the
limits of the original predictions and correlations. ( Hinings &
Lee, 1976: 3-11.)
The same measuring instruments were used on 9 manufacturing organi
zations in the electrical goods sector of industry in Coventry in
the United Kingdom. By restricting the sample to the same general
product group, it was hoped that the effects of technology would be
controlled. In order to assure compatibility, comparisons were
made only with the 31 manufacturing organizations in the original
Aston sample. The methodological care taken by the original team
was reflected in the ability of fresh interviewers to take over
complete interview schedules with little difficulty.
The results of the Coventry study showed a strong correlation
between specialization, standardization and formalization - the
component variables for the dimension Structuring of Activities.
Centralization showed a significant and negative relationship to
specialization and standardization, while structuring of activities
exhibited a strong positive relationship with size. Centralization
was positively related to the contextual variable of dependence.
All in all, the results were generally in accord with Pugh et al
(1968 & 1969b). Some attempt was made to control for the effects
of technology and dependence and this seemed to indicate that the
effects of size on structure was more pervasive and applicable to a
wider range of organizations than was first thought
5.2 An Abbreviated Replication.
The problem of the volume of data required by the Aston methodology

-46-
was addressed by lnkson, Pugh and Hickson (1970: 318-329) who
developed an abbreviated schedule. Their sample consisted of 40
organizations drawn from the same population as the original Aston
study, i.e. organizations with 250 or more employees situated in
the Birmingham area. Their hope was to further encourage the
development of a widely used instrument for organizational
assessment compar.able to the psychological test batteries available
for individual assessment. They were mindful too of senior
managers in organizations becoming resistant to collaboration in
research which they perceived to be non-essential.
With these considerations in mind, they reduced the schedule to
encompass 2 contextual variables, apart from stze, and 2 structural
variables. These were:
Worktlow Integration
Dependence
Structuring of activities
Concentration of authority
Context
encompassmg technology and the degree of
automated, continuous, fixed-sequence
operation.
the relationship with owners, suppliers,
customers and other organizations in the
organization's task environment.
Structure
the degree of specialization and
formalization.
autonomy, locus of decision making,
and the degree of centralization.
An item analysis was carried out using the same methods developed

-47-
in the original study, and the results indicated very high coeftici
ents of unidimensionality. The revised schedule now took, on aver
age, about one hour to complete and, despite the much shorter time,
the indications were that the measures obtained were reliable.
The results showed a markedly similar patterns to those of the
original study, suggesting stable, recurring organization phenomena
in the population that was studied. (lnkson et al.,l970: 321-322)
Ten of the 40 organizations in the sample were also present in the
original Aston sample and so the opportunity for longitudinal study
of organizational characteristics was presented. It was found that
the contextual variables were little changed. There was, however,
a tendency for structuring scores to increase over time, and for
centralization to decrease.
Plotted on a graph whose axes were labelled: structuring of
activities and concentration of authority, the same four basic
typologies of organizations emerged as had been identified by Pugh
et al( l969b ), indicating dimensions that were concerned with
stable, meaningful structural relationships. The developmental
sequence proposed by Pugh et al( l969b) was also supported.
Structuring increased in all the organizations, except one where it
remained constant, and centralization declined in most of them.
Paradoxically, changes in structure were not correlated to changes
in size, which was in sharp contrast to the large correlation m
the original study between size and structure. This suggested a
ratchet effect in that an increase in size brings an increase in
structuring but a decrease in size is not accompanied by a
concomitant decrease in structuring.
odds with Parkinson's law.
An assertion that is not at
The reliable short form measure that was established was frequently

-48-
used in many studies thereafter. Full details were supplied by the
Aston researchers and its use was encouraged.
5.3 Applications in Non:eommercial Organizations.
A number of studies were carried out in non-profit, religious,
educational, political and voluntary organizations.
In an analysis of 81 government departments, Greenwood and
Hinings ( 1976: 87-lO I) looked to test whether the existence of an
elected official was regarded as a major structural contingency for
a government bureaucracy. Almost surprisingly, this was found not
to be the case. The British civil service had a strong managerial
ethos which permeated government departments and which transcended
political factors to the extent that continuity was preserved and
political realignment exercised only a minor intluence. This, of
course, was consonant with the ideas of Weber and the strength of
rational leadership in a professional bureaucracy. The structure
of Government bureaucracies was generaJJy consistent with the Aston
tindings.
The educational sector m the Canadian provmces of British Colum
bia and Alberta was the subject of a study by Holdaway, Newberry,
Hickson and Heron (1976: 115-135). Their sample consisted of 23
colleges and tertiary institutions. Using the Aston methodology,
the researchers constructed a number of contextual and structural
variables. Factor analysis then reduced the structural variables
to only two: bureaucratic control, and administrative configura
tion. Relating these to contextual variables, it was found that
public control was linked to bureaucratic control, while larger
size was tied to a greater administrative hierarchy. This meant
that a large publicly controlled technicai institute had both
bureaucratic control mechanisms as well as a large administrative
hierarchy, while a small private college had neither.

-49-
Looking at a sample of eight occupational interest associations
comprised of 7 trade unions and 1 professional association,
Donaldson and Warner (1976: 67-86) found fundamental relationships
with respect to size, structuring and centralization to be similar
to those of the Aston study. They did, however, find greater
centralization. They also introduced a variable to measure the
democratic aspects, which they called electoral control, and which
they found was negatively correlated with structuring of
activities. Apparently, less formalization was offset by the
greater amount of centralization.
A small scale study of nine church organizations drawn from the
Roman Catholic, Methodist, and Anglican denominations was also
carried out ( Hinings, Ranson & Bryman, 1976: 102-114 ). The same
structural variables were used, while new contextual variables were
developed. The results differed significantly from the Aston work.
Specialization, standardization and formalization were not highly
correlated and so it was not possible to speak of an overall
dimension of structuring of activities. Centralization and lack of
autonomy were also not related and size, while significant, did not
have the overall pervasive effect. The strongest contextual
imperatives were found to be belief structure and membership
characteristics. This lead the researchers to conclude that,
"Structure in churches ts, 10 itself, the embodiment of a belief."
(Hinings et al, 1976: 114.)
5.4 C)imate and Group Level Studies.
The second generation Aston researchers also attempted to relate
structure to different levels of analysis within the organization.
Virtually all of the early research was concentrated at the
macro-organizational level, with little or no effort directed at
group or individual levels within the organization.

-50-
Pheysey, Payne and Pugh ( 1971: 61-73) examined the effects of
mechanistic (bureaucratic) structures on groups in terms. of the
groups' structure, performance and climate. They isolating two
smallish organizations of similar size and product processes, but
otherwise as different as possible. One was mechanistic and
bureaucratic with high structuring of activities, while the other was
more informally structured, entrepreneurial and organic. The
research team then examined three groups from each organization
senior management, middle management and tirst line supervisory.
They found that a mechanistic structure was positively related to
lower task complexity at lower levels of the organization, while
there was also more formalization at group level and less group
autonomy and more external pressure on groups in a mechanistic struc
ture. The researchers also found that some of these relationships
could be compensatory in that an organization with a high score on
bureaucratic control could still produce a stimulatory and progres
sive climate if other aspects of its structure supported human
resource developmental systems, for example performance management
and career planning systems. It was also found that decentralization
and bureaucratic control at lower levels freed management to deal
with complex and innovative tasks. The modifying effect of other
intervening factors was also stressed by Payne and Pheysey (1971:
261-284) who used the technique of sociometric nomination to relate
communication and group interaction to aspects of structure in
organizations.
Looking specifically at organization climate, Pheysey et al( 1971)
found that a mechanistic structure scored higher on aspects of
questioning of authority, future orientation, scientific technical
orientation, intellectual orientation, job challenge, industrious
ness, altruism, rules orientation, administrative efficiency,
conventionality, and readiness to innovate. It scored lower on the
perception of the leader's psychological distance and orientation to
the wider community.

-51-
When the contextual variable of stze was introduced by exammmg
data from a much larger bureaucracy it was found that these trends
were still present and were more pronounced. (Payne & Mansfield,
1973: 515-526.)
5.5 Cross--cultural Comparisons.
The acceptance of the Aston methodology sparked a number of
studies in many countries across the world. Some of these will be
examined in section 7 which wiJJ cover Organization Theory m
developing countries.
comparisons.
Discussed below are three cross cultural
Using data on 70 organizations m Great Britain (Birmingham),
Canada (Toronto) and the United States (Ohio), McMillan, Hickson,
Hinings and Schnek (1973: 555-569) found that large organizations
in similarly industrialized nations exhibited similar bureaucratic
features. An exception was the dimension of formalization in the
United states which tended to score significantly higher than
comparable organizations in Great Britain. A possible cultural
explanation for this phenomenon was advanced which related to the
traditionalism in both countries. Whereas the United States has a
codified constitution and rules and laws which permeate all levels
of society, the United Kingdom is far more reliant on its
tradition of correctness, and genteel good manners. One should
know what's right, old Chap - there's no need to write it
down!
Another investigation, using the same data, found support for the
relationships between contextual variables, notably size, and
structure, especially formalization and specialization. This
inferred that these relationships will hold in an societies in
that the link between the contextual variables and structure will
be of similar magnitude and in the same direction. In other
words, South African organizations may tum out to be less

-52-
autonomous than American ones, but bigger South African organiza
tions will still be more formalized than smaller South African ones,
and dependent South African organizations will be less autonomous
than relatively independent ones. (Hickson, Hinings, McMillan &
Schwitter, 1974: 59-80)
A similar cross-cultural study (Horvath, McMillan, Azumi & Hickson,
1976: 60-86) was carried out, this time using data from 36
manufacturing firms from Britain, Japan and Sweden. Twelve matching
sets of three companies sorted by product line, and controlled for
branch, principal or subsidiary status, were created. General
support f0r the stability of the context-structure relationship
across cultures was found, with differing nuances of emphasis. One
important difference to earlier studies was that technology
(measured as automaticity) was found to be positively correlated to
centralization. A possible interpretation of this result postulated
that no differentiation had been made on the nature of centralized
decisions. Organizations were quite happy for routine, operative
decisions to be governed by bureaucratic controls and to be
decentralized and automated, but strategic decisions still had to be
centralized and made at the top.
5.6 Summary.
This section concludes the second of the two sections of this study
that are devoted exclusively to the work of the Aston group and the
second and third generation Aston researchers. The impact that the
Aston methods have had on Organization Theory has been enormous and
enduring. Pugh (1988: 123-135) summarizes the contribution of the
Aston programme as:
(i) the development of. a useful heuristic framework of stable,
meaningful organizational variables enabling reliable and
valid comparative measures to be made,

-53-
(ii) at the macro level of analysis the relationship between
context and structure has been sufficiently consistent to
warrant a predictive approach,
(iii) at the group level relationships, although less clear, have
heen established between ohjective · structure measures and
perceptual climate measures, and
(iv) the Aston program me has been a major factor in the
development of the contingency approach to organization
theory.
There are, nevertheless, criticisms that can be levelled at the
Aston research and its tindings. The Aston team's view of an
organization was very passive, static and almost helpless the
organization was pushed and pulled by context or environment and
there was little or no consideration for strategic choice or power
control as powerful structural contingencies.
Contextual configurations, while important, are not necessarily
overriding. Adaptations in response to contextual change do not
occur spontaneously. Some kind of intervening variable, he it
strategic choice, or whatever, is necessary. In the words of Ford
and Hegarty (1984: 272), ":··the structure-contingency perspective
does not explain the process( es) or mechanism(s) through which
(environmental) factors are translated into structure or better
performing alignments evolve."
Insofar as the methodology is concerned, Grinyer and Yasai-Ardekani
( 1981) detailed some of the problems that they encountered, mainly
in connection with costs and manipulation of the data. Nevertheless
they concluded that, "Used with care the ... scales have been found
useful and permit a high degree of consistency and prediction."
[n his essay on assuming the editorship of the Administrative
Science Quanerly in 1986, John Freeman commented that the Aston
research was one of three major milestones in organizational
studies. The other two were the Hawthorne and American Soldier
studies. ( Bryman, 1988: 6.)

CHAPTER 3. REVIEW OF THE RELATED LITERATURE AND RESEARCH
CURRENT PERSPECTIVES.
1. INTRODUCTION.
A library search conducted for this study, using the key words Organiza
tion, Theory, Structure, and Design, singly or in various combinations,
elicited a mountain of references to published work Unfortunately, a
great deal of it fell into the category of armchair theorizing and not
a lot of it was usable. It also seems that there is a good deal of
enmity between academics from different institutions and from different
schools of thought. This aspect will be pursued further m sections 7
and 8 of this chapter when the views of Donaldson ( 1985 & 1988) and
others will be discussed.
The ongomg debate m the Strategic Management literature regarding
the strategy /structure causal relationship continues to favour the 1962
viewpoint of Chandler (Galbraith, 1977: 87-88) and Child ( 1972a) that
structure follows strategy. · Porter ( 1985), for example, sees structure
purely in terms of facilitating the linkages on a company's value
chain; accordingly, he believes that an organization's structure should
be designed with this purpose in mind.
Turning to the published literature on Organization Theory, on the
other hand, it becomes apparent that there is a groundswell to a more
eclectic approach and, at the same time, many of organization theory's
accepted truths are being re-examined. This chapter will outline some
of these re-examinations, looking firstly at the basic points of
departure of organization theory, before moving on to highlight recent
research findings on structural imperatives. The contributions from
other disciplines will aJso be discussed and a look wm be taken at
high technology organizations. A summary of Organization Theory
perspectives that are drawn from developing countries will be
presented. Finally, the major critics of classical Organization Theory
will be considered and a framework for reconciling the divergent views
of the major debates in Or.ganization Theory will be suggested.
2. POINTS OF DEPARTURE REVISITED.
It is generally accepted that modern organization theory is underpinned

-55-
hy the principles of systems theory and structural functio11alism.
These perspectives are discussed below, but first the basic building
blocks of scientific theory will he discussed.
2.1 A problem with Words.
In a philosophical, almost esoteric, discourse Sandelands and Drazin
( 1989: 457-4 78) threw cold water on the popular language used hy
organizational theorists to describe the salient features of their
discipline. Sandelands and Drazin observed that most organizational
theorists tackled the problems of organizations from a Parsonian
structural-functional perspective and the central debate tn
organization theory has been between environment and strategic
choice. The question to he addressed ts: are organizations shaped
hy forces in the environment including natural selection (Exogenetic
theories), or are they shaped hy the actions and choices of managers
inside the organization and the processes tlowing from these actions
and choices (Endogenetic theories). Both theories are based on the
weaknesses of the other; i.e. strategic choice proponents do not
believe that the environment is capable of accounting for all of
structure, while environmentalists believe that organizations are
subject to inertial pressure which resists strategic choice.
Sandelands and Drazin (1989) maintained that neither perspective has
been successful in explaining organizations.
They believed that the problem ts associated with the words that are
used to describe the theories. They drew a distinction between
action verbs and achievement verbs; for example, 'running' and
'key-turning' are task verbs that refer to actual processes.
'Winning' and 'unlocking' are achievement verbs that refer to
outcomes that running and key-turning can have. Organization theory
is riddled with achievement verbs and scant attentiollll is ever paid
to the processes that lead up to the final outcome.

-56-
This emphasis on outcomes is, of course, common practice tn
contingency theory. "Theorists ... do not concentrate on the causal
bases of structure tn organizations. They ask what structures are
appropriate ... rather than what structures are generated hy certain
situations." (Hart man, 1988: 18.)
Apart from questioning the words used hy organization theorists,
Sandeland and Drazin ( 1989) also called into question the logic
used hy both endogenetic and exogenetic theorists. Regarding the
latter, they questioned the logic of explaining the organization hy
everything that ts not the organization, t.e. the
organization's environment.
Similarly, they had a problem with the concept of a strategic elite
which makes strategy, hut at the same time is made hy strategy.
Nevertheless. both the endogenetic and exogenetic theories remain
compelling, despite problems with their words. Sandelands and
Drazin ( 1989) believed that the problem is not with the empirical
research that has been carried out, which remains valuable.
Rather, they felt the problem lies with the way in which the
findings have been interpreted. They spoke strongly for methods of
longitudinal process analysis, and generalizations based on
observed behaviour, and not on consequences. ln other words, they
emphasized longitudinal studies rather than cross-sectional
studies. The former will generate action verbs and descriptions of
process, while the latter will generate only achievement verbs and
an appearance of process.
While the sentiments of Sandelands and Drazin (1989) are admirable,
it is felt that with the time and cost restraints faced by most
organizationa] researchers, it would be difficult to abide by them
in most instances. Nevertheless, it is as well to be aware of the
pitfalls of cross-sectional research and to make an effort to
describe and evaluate the process as well as the outcomes. This

-57-
point was made forcefully hy the original Aston researchers who
spoke of the need for organizational research to be hoth
Processual as well as Factorial. (Pugh et at, 1963)
2.2 The Systems Paradigm: Another Look
Most modern organization theory - particularly contingency theory -
claims to he based on the open systems paradigm. (Ford et at, 1988;
Hart man, 1988; Rohhins, 1987; Daft, 1983 etc.) It also proceeds
from thinking imbued with the concepts of structural
functionalism. This was the original extension of the properties
of I i vi ng systems to organ i za ti on al and soci at phenomena,
propounded hy Talent Parsons ( 1967) and others in the 1940s and
1950s (McGee, 1975). The structural functional school has heen
mentioned several times in this study and it would prohahly he
instructive at this point to digress briefly to consider the main
features of this theoretical approach.
The point of departure for structural functional analysis is the
question: how are societal structures carried forward despite the
complete turnover of their individual members with every new
generation? The answer· to this question lies in structural
functionalism's basic assumptions. These are set out below.
Interdependence. The normal operation of one social phenomenon is
usually dependent on the normal operation of another. ht other
words, the structural components of a system or organization are
dependent on each other for the smooth operation of the total
system or organization as a whole. There is a pattern and order to
be found in the interdependence of a social system's various
components.
Interaction. The continued harmonious interaction of the compon-

-58-
ents of a social system are responsible for the continued working
and survival of that system. The term 'interaction' implies an
ongomg process - social behaviour occurring in closed circuits of
action and interaction - and the action of each component is
related to a corresponding action of another. component. Rather like
the workings of a well-oiled machine, or more accurately, like the
workings of a living, biological system.
Integration and Equilibrium. Interdependent and interacting
social phenomena cannot occur without a high degree of integration
and the maintenance of equilibrium. If all such phenomena are
integrated ·and constantly seeking equilibrium, the implication is
that all social events are functional to some extent - even if this
function is negative.
Consequence. It becomes apparent, then, that the full signific
ance and implications of a social structure or event can only he
comprehended when its consequence is considered - or when the
consequences that, in turn, produced it are considered. fn other
words, the understanding of social phenomenon is dependent on the
comprehension of its function, or of the function that was the
determining factor in bringing it about Events and structural
components which are functional can he regarded as having been
created by the system, as well as playing a part in the maintenance
of the system. Most, perhaps all, of social behaviour is
functional. Sometimes the function is not readily apparent and,
until a social phenomenon can be shown to be systems-created and
systems-maintaining, it has not been fu11y explained functionally.
(McGee, 1975: 240-242.)
Survival Certain basic tasks must he performed if a system is to
continue. Thus the actions of certain subsystems and components
are not only dependent on each other but have the important
function of the preservation of the system as a whole. The basic
universality and broad similarity of different organizations and
systems can be explained functionally. The functional requisite of

I.
2.
3.
4.
-59-
survival ts responsible for certain kinds of social action m every
system to ensure the continuance of that system. Ultimately,
success is judged by only one criterion survival. (Hodges, 1975:
58-59.)
According to Parsons ( 1967), an organization has four basic problems
to overcome. They are summarised in Table 3. L
ORGANIZATION CHALLENGE IMPLICATIONS
Adaptation
Goal Attainment
Integration
Pattern Maintenance
the way an organization must adapt to its social and non-social environments.
every organization must marshal its resources to attain goals through cooperative effort of its subsystems.
integration of all its component parts to legitimate authority and develop regulative norms.
maintaining cohesion and order by internalizing norms and values and regulating tension.
Table 3.1. Structural Functional Organization Challenges.
Again, success in resolving these basic organizational problems can
be evaluated in only one way - the survival of the organization.
(Parsons, 1967.)
Turning now to focus specifically on the open systems approach, in
recent times, so went the argument of Ashmos and Huber ( 1987:
607-621 ), the emphasis in organization theory has shifted away from
the systems paradigm as a point of departure. They argued cogently
that such a move is premature and that the full value of the systems
paradigm has not been exploited. They also believed that organiza
tional theorists have been functioning under two misconceptions.
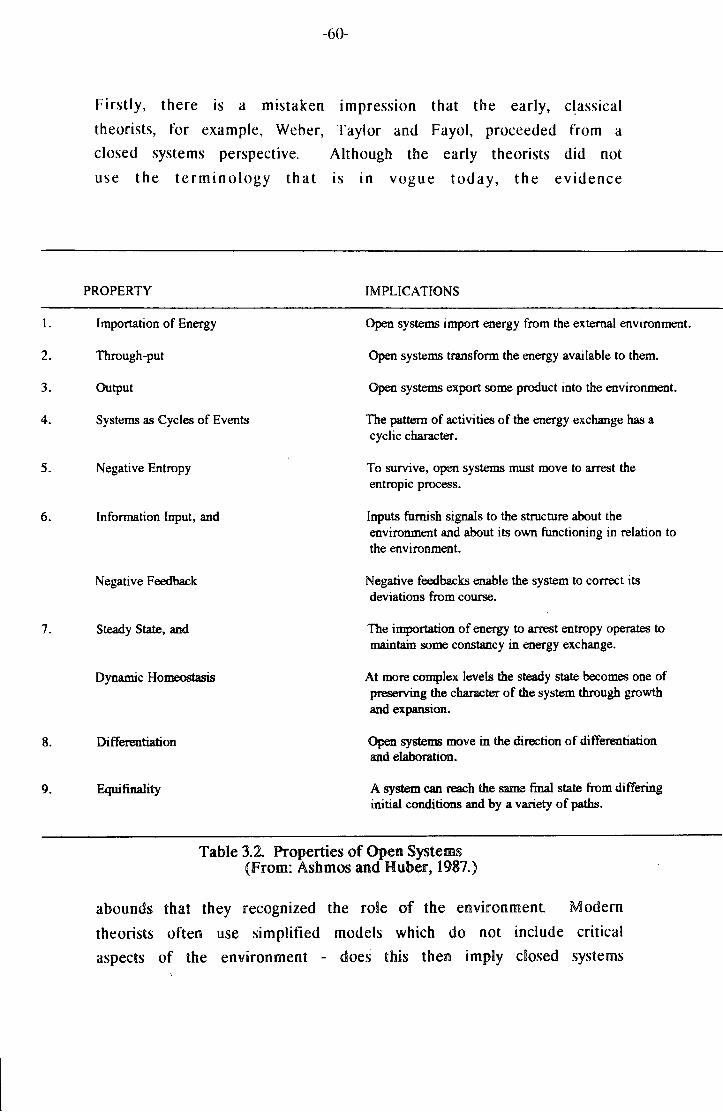
1.
2.
3.
4.
5.
6.
7.
8.
9.
-60-
Firstly, there is a mistaken impression that the early, classical
theorists, for example, Weher, Taylor and Fayol, proceeded from a
closed systems perspective. Although the early theorists did not
use the terminology that Is 1n vogue today, the evidence
PROPERTY
Importation of Energy
Through-put
Output
Systems as Cycles of Events
Negative Entropy
Information Input, and
Negative Feedback
Steady State, and
Dynamic Homeostasis
Differentiation
Equifinality
IMPLICATIONS
Open systems import energy from the external environment.
Open systems transform the energy available to them.
Open systems export some product into the environment.
The pattern of activities of the energy exchange has a cyclic character.
To survive, open systems must move to arrest the entropic process.
Inputs furnish signals to the structure about the environment and about its own functioning in relation to the environment.
Negative feedbacks enable the system to correct its deviations from course.
The importation of energy to arrest entropy operates to maintain some constancy in energy exchange.
At more complex levels the steady state becomes one of preserving the character of the system through growth and expansion.
Open systems move in the direction of differentiation and elaboration.
A system can reach the same final state from differing initial conditions and by a variety of paths.
Table 3.2. Properties of Open Systems (From: Ashmos and Huber, 1987.)
abounds that they recognized the role of the environment. Modem
theorists often use simplified models which do not include critical
aspects of the environment - does this then imply dosed systems

-61-
thinking? A model, by definition, is a simplification and is,
therefore, tlawed. "The matter is straightforward - there is a
difference between (a) believing that organizations are closed
systems and (h) using closed systems models ... (to analyse
organizations)." (Ashmos & Huber, 1987: 609.)
The second widely held misapprehension is that open systems theory
has guided organizational research. Ashmos and H uher ( 1987)
believed that this is true only to a limited extent; for example,
with respect to properties 6 and 8 in Table 3.2. Generally, studies
which took some cognisance of the environment were labelled open
systems. This process was exacerbated by the widely held view that
closed system thinking was 'had', while open systems thinking was
'good'.
As a consequence of these misconceptions, a number of research
opportunities have been missed. Organization studies over a period
of 50 years have been disappointing in terms of the low explanatory
power and lack of widely-held and well-defined classification
regt mes. lt was suggested that the properties and features of
living systems have not been exploited by organization theorists to
develop a viable classification system. Such a rigorous
classification system is, on the other hand, the domain of the
living systems paradigm, as is illustrated in Table 3.3. lt
provides classifications in terms of subsystem functions that are
considerably richer and more comprehensive than the standard
classification schemes that are used by organizational theorists.
Arising from this missed opportunity, a second foregone research
application bas been the lack of development of valuable cross-level
hypotheses (Ashmos & Huber, 1987: 614-615). For example, studies
relating to the size of the administrative staff ratio have been
largely exploratory and have sought simple linear relationships
between variables. Borrowing from living systems theory, a more
meaningful research hypothesis could have been phrased, "An increase

-62-
tn the number of components in a system reqmres a disproportionate
ly larger Increase tn the number of information-processing and
deciding components."
SYSTEMS THAT PROCESS INFORMATION ONLY
Input Transducer
Internal Transducer
Channel and Net
Decoder
Associator
Memory
Decider
Encoder
Output Transducer
SYSTEMS THAT PROCESS
SUBSYSTEM FUNCTION
Receives information from system's environment
Receives information from other subsystems about alterations in their status.
Transmits information to all parts of the system
Alters the code of information received by input transducer into a system.
Carries out first stage of learning process, forming associations among items of information.
Carries out 2nd stage of learning process, storing information.
Receives information inputs from all other subsystems & transmits information outputs that control entire system.
Alters the code of information input from subsystems, changing 'private' code to 'public' that can be interpreted by environmental components.
Changes information into other matter-energy forms that can be transmitted over channels in environment.
MA TIER-ENERGY ONLY SUBSYSTEM FUNCTION
Reproducer
Boundary
Gives rise to other systems similar to the one it is in.
Located at perimeter; holds components ·together protects, permits entry.
Table 3.3. Universal Subsystems of Living Systems
(From: Ashmos and Huber, 1987)
EXAMPLES IN ORGANIZATIONS
Market Research Department; Complaint Department
Bookkeeper; Payroll Dept.
Switchboard Operator; gossip
Signal Officer
Intelligence Analyst; Chief Executive Officer
Filing dept.; data input operator
Board of Directors; Executive
Advertising Dept.; Public Relations Experts
Salesperson; Publications Dept.
EXAMPLES IN ORGANIZATIONS
Member of organization who sets up a subsidiary
Personnel Office; Purchasing Dept.

-63-
SYSTEMS THAT PROCESS BOTH INFORMATION AND MATTER-ENERGY SUBSYSTEM FUNCfiON EXAMPLES IN ORGANIZATIONS
Ingestor Brings matter-energy across boundaries Recruiter; Receiving dock
Distributor Carries inputs from outside or transports . outputs armmd the system.
Forklift Operator; Elevator Operator
Convertor Changes inputs into functional form. Training Dept.; Heating Plant Operator
Producer
Storage
Extruder
Motor
Supporter
Forms stable associations among inputs or outputs for the purposes of growth, damage repair or replacement of components.
Retains deposits in the system.
Transmits matter-energy out of system in the form of wastes or products.
Moves system in relation to its environment.
Maintains proper spatial relationships among components of the system.
Table 3.3. (Continued) Universal Subsystems of Living Systems (From: Ashmos and Huber, 1987)
Maintenance Worker
Stockroom or File Cabinet
Shipping department; Hospital discharge unit
Executive Jet Pilot
(No living supporter at this level); office building; aircraft carrier.
This version of the research hypothesis would test for non-linear
relationships and would more precisely operationalize the
administrative component variable. It would also have the advantage
of having been validated at several living system levels. More
rapid advances in Organization Theory would come about if the
knowledge base of other disciplines was drawn upon.
And so the fina! missed opportunity relates to the reciprocal
knowledge transfer that could take place. Organization theorists
have made no effort to study open systems and to identify research
directions. Conversely, there has been no effort to update and
enrich the systems paradigm with advances that have been made in the
field of Organization Theory. ln order to better utilize the open
systems paradigm, organization scientists need to re-evaluate their

-64-
beliefs of open systems and, perhaps, re-educate themselves on how
to study organizations as open systems. (Ashmos & Huber, 1987:
614-618.)
2.3 Paradox in Organization Theory.
The study of organizations has spawned a number of theoretical
perspectives. Despite the rival and sometimes apparently
contradictory theoretical schemes of Organization Theory, there is a
growing body of opinion that the so-called acute differences between
them are, in many cases, not irreconcilable.
Hartman (1988: 42):
In the words of
We have found reason to believe that the choice among competing theoretical frameworks will sometimes be extraordinarily difficult. But it hears saying now that we do and should use competing theoretical frameworks, even if they are irreconcilable. In some cases ... explanations with profoundly different conceptual roots need each other in order to make sense.
Robins ( 1987: 482) spoke of the contlict between thesis and
antithesis, and its resolution through synthesis resulting in a
more viable body of .Organization Theory. Ford et al ( 1988:
446-567), in discussing the Organization Theory' of the future, spoke
of the necessity for a dynamic model that would describe and explain
the dynamic interrelationships between structural variables,
leadership preferences, membership characteristics, organization
culture, myths, legend and history. Such a dynamic model would
finally unite the disparate theoretical viewpoints in the fields of
both Organization Behaviour and Organization Theory.
Poole and van de V en ( 1989: 562-578) suggested an approach which
would go some way toward resolving the conflicting theoretical
viewpoints. They proposed that theoretical tensions and oppositions
shouJd be actively sought, and then used to stimulate and develop a
more encompassing theory. They listed a number of these 'tensions'

-65-
10 Organization Theory; for example, (i) the structure .versus
strategy causal conundrum; (ii) environment or strategic choice as
the main structural imperative; (iii) organization climate as an
aggregation of individual perceptions or as a property of the macro
system; (iv) organizations as seeking equilibrium and resisting
change or continuously changing and mutating; and, finally, (v) the
trade-off between individual identity in groups or the collective
nature of group actions.
Each of these dichotomies or tensions were seen by Poole and van de
Yen as paradoxes. They detlned a paradox as, "Two contrary or even
contradictory propositions to which we are led by apparently sound
arguments." They went on to say that, "each side of these tensions
has been advocated ... by different theorists, but together they form
a ... theoretical discourse ... richer than either theory by itself."
(Poole & van de V en, 1989: 564.)
These writers suggested four methods whereby opposmg theses may he
reconciled.
Opposition. This involved accepting that the paradox existed
and learning to live with it. It is a positive stance that would
require resistance to pressure toward cognitive consonance, as
well as acknowledgement that opposing views can inform one
another. Ultimately, models remain models, and are incapable of
capturing every nuance of reality. However, different models
could lead a vigilant researcher to discover underlying tensions
and inconsistencies and so heighten the awareness of the
explanatory potential of the models.
Spatial Separation. This tactic would require separat!,.··
between different levels of organization analysis, and to then
explore the connections between them. For any theory at one
level of analysis, the researcher can seek oppositions at another
level and thus generate a more comprehensive theory.

-66-
Temporal Separation. Temporal separation involves longitudinal
examination to establish times when one or other theory was
ascendant; and then to establish a possible morphogenic cycle
between them. This approach can also be used to uncover further
tensions and anomalies by looking for points in time when the
theory did not fit.
Synthesis. Synthesis requires developing a whole new conception
which incorporates both theories hy dissolving or superseding the
oppositions that they contain. This method may, of course, lead
to a whole range of new paradoxes which would then need to he
characterized and reconciled into a new construct.
It is doubtful if researchers can ever avoid paradoxes. Resolut-
ion in one aspect often creates tension in another, making it
unlikely that theoretical paradoxes can ever be escaped or
resolved completely. (Poole & van de Yen, 1989: 564-576.)
An interesting application of how paradoxes can be resolved is
contained in the work of Danny Miller ( 1987) which is discussed
in the following paragraphs. )
3. IMPERATIVES: FURTHER DISCUSSION.
The central debate around organization structure has been on the
subject of the so-caned structural imperatives. Ever since Woodward
( 1958) announced her findings with respect to the technological impera
tive the discussion has intensitied. The Aston team (Hickson et al,
1969) added their findings on size as an imperative, and various others
have argued for different aspects of the environment as being of causal
significance. The following sections will Look at organizational
life-cycle as a structural influence, and will then examine some recent
research with respect to the linkage between environmental uncertainty

-67-
and organic structures. Finally, a closer look will be taken at the
environment itself and at the efforts that have been made to broaden
and fine-tune measures of the environment.
3. I Life=eycle as an Intervening Variable.
In a wide-ranging consolidation of all the major Organization Theory
viewpoints, Miller (I 987: 686-70 I) disti lied the main themes,
in tluences and typologies. He coalesced them into a global
Organization Theory perspective comprised of four key forces which
he labelled Imperatives.
Each of Miller's (I 987) Imperatives had to comply with three
criteria for inclusion into his model;
(i) they had to have been put forward as fundamental and
central driving forces in organizations,
(ii) they had to have empirical support, and
(iii) they had to have played a major role in generating
organization structures that occur frequently.
Examination of table 3.4 reveals that the main Organization Theory
perspectives were indeed covered, although some theorists may have
difficulty with Miller's ordering system. For example, elements of
the first two imperatives, environment and structure, are most often
conceptually combined into Contingency Theory (Neghandi, 1990), and
it is the writer's opinion that Contingency Theory could
legitimately be expanded to include aspects from all four of
Miller's imperatives.
Nevertheless, Miller ( 1987) believed that all of an organization's
problems and response patterns could be characterized in each of his
imperatives.

-68-
IMPERATIVES
Structure Leadership Environment heoretical models Contingency theory; ~~digms Population ecology;
Indust. economics
Resource dependance; Personality theory; Strategy Business Polil-1'; Strategic Planning Theory of Psychodynamic
bureaucracies
)Uirce of Influence Environmental challenges; Competition; Technology
Structural Constraints & patterns of interaction
b.emes & Elements Adaptation of struct- Control of task en-
onditions of >plicalbility
lustrative pes_
ature of changes ithin configur:ions
ure & strategy to vironments via str-environment & techn- ucture; Internal ology; Scanning focus; Co-option of
environment
Uncertain and dynamic environment; Much competition; Small size
Organic (Burns & Stalker, 1961); Adaptive (Miller & Friesen, 1984)
Barriers to entry; Stable environment; Large size: Trade protection, patents & monopoly; Slack resources
Machine bureaucracy and adhocracy (Mintzberg, 1979; Crozier, 1964)
Responsive adaptation Insulation & Resisto environment; Quick tance to adaptation incremental change punctuated by revo
lutions in response to crisis
literature
CEO's motives, goals fantasies, neuroses, & talents
Strategy, structure & environment reflect CEO's personality
Normative concepts of strategy, plans & distinctive competencies
Explicit strategies & plans; Competitive ad- : vantage: selection of markets
Centralized power & Commitment to strateg}'l ownership
Compulsive & paranoid Conglomerates (Miller configurations (Kets & Friesen, 1984): Cost de Vries & Miller, leaders (Porter, 1980) 1984 ); Simple & ent- Prospectors & De fen-repreneurial firms ders (Miles & Snow, (Mintzberg, 1979; 1978) 1973)
Adherence to one basic orientation that resists dissoiution until the CEO departs
Proactive change that seeks out opportunity and enacts the environment
Table 3. 4. Overview of the Four Imperatives (From: D Miller, 1987: 687)
The Environmental Imperative. The environmental imperative ts
characterized by a dynamic, challenging environment which calls for
prompt responses from organizations in terms of their adaptations to

-69-
strategy and structure. There is conformity through imitation in
the industry and wide use is made of environmental awareness proced
ures. It is also characterized hy smaller firms in unconcentrated
industries with strong competition.
The Structural Imperative. The structural imperative 1s marked by
bureaucratic structures and high resource dependence. It is strong
on conformity and resistant to change. Large size, high market
share and regulatory measures contribute to a climate that is stable
within a munificent environment.
The Leadership Imperative. In the leadership imperative the
dominant coalition is perceived as the overriding influence on
goals, strategies, decision-making styles, and structure. The
emphasis is on personalities and politics and achievement needs and
power are the predominant motivators. The personality of the Chief
Executive is imprinted on the organization, either directly or
through the organization's culture.
The Strategic Imperative. The strategic imperative follows the
prescriptions of business policy and strategic management theorists;
product market dimensions correlating with structural and
environmental dimensions. Strategy will influence the choice of
both the environment and the structure and will precede hoth.
Explicit and planned product market scope and strategy, and the
development of distinctive competencies and competitive advantage,
are developed and coordinated by sophisticated planning departments
and committees. The strategic imperative is prevalent in turnaround
situations; or where strategy has political support; or in
diversified companies with the necessary support and planning staff.
The most important aspect of Miller's (1987) organizational
Imperatives is that . he introduced the concept of the organization
life cycle as an intervening variable. He postulated that the

-70-
COMMON TRANSITIONS BETWEEN IMPERATIVES OVER THE LIFE CYCLE
Phase of Cycle Birth Growth Maturity Revival
Factors initiating Founding CEO; More dynamic More monpoly Deregulation Imperative Smail Size; market; Broader power; Trade Poor perfonnance;
Centralization; Scope; Founder barriers; Market Diversification; Charismatic retires; More stabilizes; Turnaround; leader competition Less competition; Strategic planning
Patents; Slack resources.
Resulting Leadership Environment Structure Strategy Imperative Leadership
Table 3.5 Illustrative Transitions between Imperatives (From: D Miller, 1987: 690)
different imperatives would predominate at different life-cycle
stages, as is illustrated in Table 3.5.
Miller's proposition is also an example of the effective use and
resolution of paradox in Organization Theory. Firstly he used
opposition as a means to clarify and describe a number of apparently
contradictory perspectives; and secondly, he effectively used
temporal separation by introducing the concept of the organizational
life-cycle. The entire field of Organization Theory was thus tied
together and made more relevant.
3.2 Environmental Uncertainty and Organic or Mechanistic Structures.
Environment
The dichotomy of mechanistic and organic structures that was first
identified by Burns and Stalker ( 1961) has been the subject of much
discussion and empirical investigation (Galbraith, 1977: 28-30).
-7 I-
Among the more recent studies, Koherg and Ungson (1987: 725-737)
performed a study in which they tested specific hypotheses relating
to:
the link between high environmental uncertainty and organtc
structures;
the link between low environmental uncertainty and mechanistic
structures; and
predictions for performance depending on the appropriate fit
between environment and structure.
Their sample comprised 88 school units as the mechanistically
structured group, and 98 operating units of a multinational oil firm
as the group with organic structures. Various measures of
environmental uncertainty, resource dependence, organizational
structure, organizational performance and environment /structure fit
were developed and applied.
Surprisingly, the researchers found no relationship between supenor
performance and fit on the organic structure /uncertain environment
dimension; and only limited support for superior performance and the
fit between mechanistic structures and an environment of low
uncertainty. They also reported that, confronted with the demands
of an uncertain environment, organizational units tended to
centralize control and to develop more bureaucratic structures,
while simplifying and standardizing work procedures. (Koberg and
Ungson, 1987: 725-737.)
This group's findings contradicted Bums and Stalker ( 1961) as well
as the Aston (Pugh et al, 1969) and National (Child, 1972) studies.
Their results should, however, he treated with caution as there are
obvious tlaws in their research design. For example, comparing
school units and oil companies is hardly comparing apples with
apples. They also designated the oil industry as an uncertain
environment, yet it is by no means characterized by rapid changes in
technology and new product development - as, for instance, the
semiconductor industry. What they measured in the oil industry was

-72-
more likely cnsts reaction rather than ongoing accommodation of a
dynamic environment. Finally, all the units in the oil industry
sample came from the one multinational group; and so they were
effectively branches or subsidiaries. The Aston research
demonstrated the misleading effect this could have, especially on
perceptions and measures of centralization.
Another study which pursued the relationship between environmental
uncertainty and organic or mechanistic structures was that of Miller
(l987a: 55-76), who added strategic variables to the
environment-structure equation with a view to examining the 3-way
linkages between strategy, environment and structure.
STRATEGiES
Strategic Variables CPI MD B GI GS cc Relationships* HS C HS HSC HS C HSC HSC
Structural Classes
Bureaucratic uncertainty - - 0 ++ + +0 +? + reduction Organic uncertainty +++ ++ +++ reduction Bureaucratic +++ +? ., 0 differentiation Organic differentiation +++ + +? +++ - - 0
Bureaucratic integration ++ +- - +++ Organic Integration +++ ++ +? +
E a'tirQame.araL C. lasses.
Dynamism +++ +++ - ? ? - - 0 Heterogeneity +++ +++ +++ hostility ++
* H S C =the Hypothesized, Static data, and Change data relationships -, + =relationships, ifthe same as l)ypothesized, 66% or more correlation ., =Correlations in the predicted direction but less than 66%
0 =No apparent relationship.
Tabie 3.6. Summary Results of Hypothesis Tests. (From: Miller, 1987: 69)

-73-
Strategy, Miller believed, would have important implications for
both structure and environment; for instance, the commonly cited fit
between a dynamic environment, product innovation strategies, and
organic structures. The strategic variables which Miller factored
into the structure-environment equation were:
CPI : Complex Product Innovation
MD: Marketing Differentiation
B Breadth, the opposite of Porter's ( 1985) dimension of
focus
G I Growth through Innovation
GS · Growth through expansion into Stahle markets.
CC Cost Control.
Miller's research team used two data bases to test their hypo
theses. The first was a static profile of 161 major US firms at a
gtven point m their histories. The second data base was
longitudinal and analysed changes over a five year period tn a
sample of 110 Canadian and Australian companies.
Table 3.5 summarizes the research in terms of the hypothesized
relationships and the actual . relationships found in both the static
profile and the change data. Most of the hypothesized relationships
were supported by the research. When a strategy increased the
stable, predictable contingencies facing an organization, it was
likely to be accompanied by bureaucratic uncertainty reduction
devices in the form of formalized rules and precedents,
standardization, and formal hierarchical authority. Conversely, a
strategy that increased uncertainty of the contingencies faced by an
organization elicited organic uncertainty reduction devices, such as
environmental scanning, delegation of routine decisions, group
decision-making sessions, and allocation of expertise-based
authority.
They also found that strategic and environmental variables were
significantly related. Innovative CPl and GI strategies were

-74-
commonly followed in dynamic environments, the CC strategy was
present in a stable environment and the MD strategy was associated
with a hostile environment. (Miller, 1987: 65-71.)
Although the research design was well constructed and the results
were significant, Miller was nevertheless careful to reiterate that
he was not making any claims for causality. "It should be
stressed ... that we cannot claim strategies to be causing ... certain
structures, any more than we can claim the opposite direction of
causality." All that could be said was that certain strategies and
structures commonly went together and were found in particular types
of environments. (Miller, 1987: 70.)
3.3 Fine-tuning the Environment
The somewhat nebulous term 'environmental uncertainty' was the
subject of an investigation by Wholey and Brittain ( 1989: 867-882),
who proposed that the commonly used measures which gauged a
manager's perception
possibly inaccurate.
of total environmental uncertainty were
Environmental uncertainty was probably
composed of several variables and by using only one measure it was
likely that most researchers had missed certain critical components
of uncertainty. The commonly used measures looked at the amplitude
of environmental variations and took no cognisance of their
frequency and predictability. This proposition was tested using
time series monthly production and sales data from five thousand
manufacturing companies and 1097 restaurants. The researchers
tested their operationalized definitions of amplitude, frequency and
predictability. The results indicated that they were, indeed,
discrete and measurable variables. They concluded that their
research made a positive contribution to empirical Organization
Theory by enhancing its measurability and its scientific viability.
On a similar tack, the effects of environmental munificence, or

-75-
scarcity, on the relationship of context to structure was e"'plored
by Yasai-Ardekani (1989: 131-156). He postulated that munificence
or scarcity would have a mediating effect on the classic
relationship between turbulent environments and organic structures
in that . the structure will only tend toward organicity if the
environment is both uncertain and munificent. Under conditions of
scarcity, a turbulent environment is more likely to elicit a
crisis-like reaction resulting in a mechanistic response of greater
centralization and bureaucratic controls.
Looking at its effect on technology, environmental munificence would
lessen the need to protect the organization's core technology; while
conditions of scarcity would increase the need for protection. This
situation would be exacerbated if the technology was intlexible and
rigid. Organizations with intlexible technology were more likely to
increase their complexity in terms of the range and number of
specialists that they deploy in conditions of environmental
scarcity. (Yasai-Ardekani, 1989: 132-138.)
The relationship between size and structure, Yasai-Ardekani ( 1989:
140) suggested, would be unaffected by environmental munificence.
Greater size always leads to more complexity, formalization and
decentralization regardless of whether the environment is munificent
or scarce. In smaller organizations, though, the slope of the
relationship, while tending in the same direction, may be different
Yasai-Ardekani's (1989) sample consisted of the 45 electrical
engineering companies of the CUBS study (Grinyer & Yasai- Ardekani,
1980.) Structural measures were obtained using the abbreviated
Aston methodology, while munificence and scarcity was defined as the
rate of demand for an organization's products or services. He found
general support for his contention that scarcity or munificence
would exercise a ·mediating effect on the context/structure
relationship. He also confirmed that a combination of an uncertain
environment and scarcity was more likely to trigger a cns1s

-76-
reaction, resulting in a move towards a mechanistic structure
combined with formalization, standardization and centralization.
( Y asai-Ardekani, 1 Y~Y: 150-151.)
4. CONTRIBUTIONS FROM OTHER DISCIPLINES.
The discipline of Organization Theory is sometimes regarded as the
orphan child of Sociology ( Hinings, 1 Y~~), and as such attempts are
often made by other behavioural science disciplines to adopt the
tledgling science.
4. 1 An Accounting Perspective.
An accountant's perspective of Organization Theory is provided by
Jensen ( 1983: 319-349). Proceeding from the viewpoint that, "acc
ounting is a basic part of the structure of every organization," he
proposed that greater understanding of an organization's structure
could be obtained by examining its accounting system. He developed
a three-part taxonomy to characterize and classify organizations by
their control systems:
(i) the performance measurement and evaluation system,
(ii) the reward and punishment system, and
(iii) the system for dividing and assigning decision-making
authority.
An organization was defined as, "a legal entity that serves as a
nexus for a complex set of contracts ... among disparate individuals."
(Jensen, 1983:326~
Jensen believed that the nexus of contracts viewpoint helped to
explain why certain contractual relations, or structures, arose and

-77-
how they interacted with the environment. !n other words, it lent
understanding to the behaviour of individuals and groups with
diverse and contlicting objectives who, nevertheless, worked toward
preserving a common equilibrium. Ultimately, the survival of an
organization was dependent on the delivery of products and services
at the lowest price while covering costs.
With its emphasis on interacting systems (contractual relations),
environmental exchange, and success being judged on the basis of
survival, Jensen's accounting viewpoint can be loosely classified as
falling with the open systems ambit - a sort of "financial
structural functionalism".
4.2 An Or~:anization Economics Perspective.
The vtew of organizations as nexus of contracts is supported by
Hesterly, Liebeskind and Zenger ( 1990: 402-420), who saw
organizations as governance mechanisms supporting the exchange
of goods and services under less-than-perfect conditions which were
susceptible to cheating and misrepresentation.
Hesterly et al ( 1990) called ·their point of departure an Organiza
tional Economics perspective. They explained the diversity of struc
tural arrangements as being dictated by the demands of the exchanges
that take place on the one hand, and the governance mechanisms that
are used on the other. Another structural imperative can also be
added to the contingency theorist's repertoire - that of
cost-effectiveness. The eventual type of organizational structure
that is assumed will depend on its costs when compared to other al
ternative arrangements. They believed that Organizational Economics
is a structural functional perspective in that it attempted to
explain organizations in terms of their consequences or functions
rather than in terms of the processes that brought them about.
( H esterly et al, 1990: 405-406.)

-78-
Hesterly et al (1990), in common with Jensen's (1983) accounting
view, placed emphasis on the authority mechanisms of an organization
and its systems of reward and punishment as descriptive dimensions
of structure. ln this respect, both the accounting and the organi
zational economics viewpoints are closer to Taylor's scientific
management or McGreggor's Theory 'X' principles, than they are to
modern behavioural and motivational theory. Nevertheless, both
viewpoints do provide some useful insights and could be of some use
in empirical research; for instance, in operationalizing bureaucra
tic control mechanisms, or in refining typologies of structure.
4.3 Economics theor.y: the Indifference Curve.
An interesting insight into the application of classical economic
theory to a very topical Organization Theory dilemma was illustrated
by Zeffane (l989: 327-352). He applied the concept of an indiffer
ence curve to the centralization/formalization conundrum of
bureaucratic control. Referring to the Aston (Pugh et al, 1969) and
National (Child, 1972) studies, Zeffane (1989) discussed the
apparently contradictory tindings on centralization between these
two studies and maintained that an element of choice or trade-off is
indicated. As an organization increases in size the pressure to
decentralize, with its concomitant loss of control, is compensated
for by increasing indirect control through formalized rules and
procedures. This is the basis of the theory of bureaucracy. But
the question is: how much decentralization and how much
formalization? Essentially, the organization's dominant coalition
must choose between equally viable means of structural control in a
way which maximizes organizational effectiveness.
The concept of the indifference curve was introduced by Zeffane
( 1989) in an effort to find this ideal mix of decentralization and
formalization. The indifference curve embodies the idea of marginal
utility which defines the point at which the trade-off between one

-79-
structural control mechanism becomes less desirable or feasible and
the other becomes more desirable or feasible.
In operationalizing the concepts. Zeffane was able to define central
ization and formalization quantitatively in terms of costs. He also
added a subjective factor, Propensity to Formalize I Decentralize, as
a weighting factor to cater for the effects of organizational clim
ate and culture. He was then able to compile the standard economics
equations to illustrate indifference curves and equilibrium points,
at which the optimal centralization /formalization situation existed
within the constraint of size. (Zeffane, 1989: 340..342.)
Zeffane ( 1989) suggested that the apparent discrepancies between the
Aston and National tindings on centralization and formalization was
partially due to organizations in the samples not being at their
equilibrium, or optimal, points. All in all, Zeffane's (1989)
perspective adds to the understanding of Organization Theory by
illustrating that centralization and formalization are not a simple
dichotomy and that considerable variation is possible. The biggest
problem in the practical application of this perspective will be
plugging in accurate numbers into the operationalized definitions
and equations. This is a problem that is also fairly common in the
rest of the field of micro-economics.
5 STRUCTURAL ISSUES IN HIGH TECHNOLOGY ORGANIZATIONS.
To conclude this section on current perspectives on Organization Theory
and Structure, some structural issues which are unique to High
Technology industries will be touched upon. It will be recalled that
it was the apparent structural anomalies in the South African
Electronics Industry that were used to illustrate the research problem
that is the subject of this ·study. Doubtless, there are special
circumstances that apply in a high technology environment and some
understanding of them would be profitable. A high technology industry

-80-
can be categorized by three factors:
(i) businesses require a strong scientific-technical base,
(ii) new technology can quickly make old technology obsolete, and
(iii) as new technologies come on stream their applications create
or revolutionize markets and demand. (Covin, Prescott &
Slevin, 1990: 485.)
Implicit in these characteristics IS a turbulent environment. The
relationship between an unsettled environment and structures which tend
toward organic configuration has bee.v well documented and has been
discussed in the preceding sections of this study.
Covin et at (1990: 485-510), working with a sample of 344 smaller firms
(400 people or less) again found strong support for this relationship.
However, there have occasionally been inconsistencies and
contradictions of this relationship in the research literature (Koberg
& U ngson, 1987; Yasai-Ardekani, 1989). And so the relationship between
environmental uncertainty or turbulence and organic structures remains
problematic to a degree, with high technology firms sometimes
exhibiting both mechanistic and organic characteristics.
A study by Bahrami and Evans ( 1989: 25-50) tried to shed light on this
apparent paradox by means of a 5-year longitudinal study of 33 high
technology firms in Silicon Valley, California in the United States.
The researchers found that the life cycle stages of high technology
firms tended to be rapid and characterized by sometimes cataclysmic
changes from one life cycle stage to another. Growth tended to be
rapid and strategic and organizational adjustments complicated.
To cope with these pressures, high technology firms had developed a new
structural variant, dubbed Stratocracy by Bahrami and Evans
( 1989: 39). This was a bimodal form which enabled a firm to be both

centralized and decentralized and to utilize both mechanistic. and
organic responses.
The stratocracy was accomplished by realigning the strategic apex and
the operating core so that the former could, when necessary, talk direc
tly to the latter. Centralization was thus enhanced but decentraliza
tion was also fostered by allowing line managers the authority to take
decisions independently within the parameters of structural constr
aints. Specially appointed executives at key connective, or nodal,
points in the organization facilitated communication and co-ordinated
action. The stratocratic structure was able to successfully harness
and deploy the tensions between creativity and discipline, flexibility
and cohesion, responsiveness and coordination, and, finally, cost
control and product innovation.
The success of the stratocratic alignment is, of course, largely
dependent on the personality and operating style of the Chief Executive
and the dominant coalition. In a South African context this is well
illustrated in the Altron group of companies where the Chief Executive,
Doctor Bill Venter, has never lost sight of his entrepreneurial roots.
Despite the huge size of this electronics giant, it is common knowledge
and practice that Dr Venter can, and very often does, speak directly to
anyone at any level in the organization. The action generated by this
direct communication style is in accord with an organic response
pattern; and yet the group loses none of the benefits of being a large
bureaucracy.
The strength of the Stratocratic form is the achievement of the
advantages from bureaucracy's high efficiency through standardization
while, at the same time, obtaining tlexibility from entrepreneurship.
6. ORGANIZATION THEORY AWAY FROM A WESTERN ENVIRONMENT.
ln keeping with the trends in most of the management sciences, nearly

all of the significant research in the field of Organization Theory has
been carried out in Western society in a heavily industrialized
environment. Any research emanating from third world or developing
countries has come mainly from the Far East. Although in a lot of
instances the term developing country is now ·a misnomer; particularly
when one considers that Japan has become the world's second largest
economy - and is expected by many economists to be the largest by the
turn of the century (Time Magazine, 10 February, 1992).
The following paragraphs will present a cross section of some of the
countries where quantitative research has been carried out, namely
South Korea, Egypt, Japan, Jordan, and india. There has, as far as is
known, been no published quantitative research in Africa south of the
Sahara; and so this section will conclude with a brief qualitative look
at Organization Theory in Africa.
6. 1 South Korea.
The question of the applicability of advanced Western, usually Amer
ican, organization and management theories to developing countries
was pursued by Kim and Utterback (1983: 1 U~5-1197). They looked
specifically at the relationships between operations technology,
environment, structure, innovation and size. They stated that the
generally accepted wisdom in developed countries is that an
organization evolves from small size, t1exible technology, high
innovation and organic structure in its infancy, to large size,
rigid process technology, less innovation and mechanistic structure
as it matures and grows. These changes follow environmental
intluences as a new industry with high uncertainty and many product
innovations develops into a stable industry with fewer innovations,
allowing a more rigid structure and operations technology.
Using a sample of 31 manufacturing organizations in the South Korean
electronics industry, Kim and Utterback resolved to test whether

-83-
this pattern of evolution holds true in a developing country.
Ideally, their research needed to he longitudinal hut this was not
possible. To simulate longitudinal research they divided their
sample into two groups; one group consisted of 17 older companies
and the other of 14 younger companies. The patterns of associations
that they found were very different from those of developed
countries.
Using Aston and other measures, they measured the variables of
technology, structure, environment, size, and the amount of innovat
IOn. They found that in Korea manufacturing organizations in young
industries had adaptable operations technology, mechanistic
structures, infrequent product changes, and were mainly concerned
with the assembly of imported, standardized products with little
local technical capability. Looking at the environment, they
perceived government incentives and raw material and equipment
suppliers as the most important influences.
Conversely, in the older industries the researchers found more rigid
operations technology, greater size,
frequent product changes. Older firms
competitors, suppliers and technical and
most important environmental intluences.
1194-1196)
organic structures, and
perceived their customers,
capital investment as the
(Kim & Utterback, 1983:
The research team found that, apart from operations technology which
follows the normal development pattern, the process was virtually
the opposite of that in a developed country. Operations technology
followed the normal route but for different reasorns; its initial
capital intensity and tlexibility was because it was labour
intensive in order to take advantage of the almost limitless cheap
labour.
Kim and Utterback (1983: 1194-1196) speculated on the possible
reasons for this very different sequence of evolution in a

-84-
developing country. Unlike the situation tn a developed country, a
Korean organization's early functioning was actually in a stable
environment in terms of technology and markets. This was because
the technology was imported and was tried and tested, while the
market was purely local and heavily protected by legislation. As
local improvements were made on the imported technology, and
markets expanded to include both export and internal competitors,
so pressure increased for the organization to adopt response
patterns more suited to a turbulent and competitive milieu.
Kim and Utterback's ( 1983) study is interesting but, nevertheless,
should not be regarded as anything more than exploratory. Longitud
inal measurements cannot really be simulated and genuine longitudi
nal studies would have to be conducted in order to confirm their
initial results.
6.2 ~
Having discussed the monumental organizational feats of the ancient
Egyptians the previous chapter, it was interesting to return to
Egypt five thousand years later. The public sector in Egypt was
the subject of a study by Badran and Hinings (1981: 3-21) who
attempted to test theoretical concepts developed in Western
industrial society on public enterprise in a developing country.
The empirical thrust of their study went further than the purely
conceptual work that had been done in developing countries up to
that time.
The Egyptian economy was broadly socialist and so they postulated
that public enterprise would be highly structured and centralized.
They also examined the effects of the contextual variables of size,
technology and dependence; hypothesizing that:
size and technological complexity would be positively related to
structuring of activities and decentralization, and

-85-
dependence would be positively related to structuring of
activities and negatively related to decentralization.
The sample consisted of 31 public sector companies m the metal,
spinning, weaving, food, chemical, construction and service indust
ries. The Aston short form schedule was used to collect data.
Comparing the overall results with those of the Aston study,
Egyptian organizations showed less technological sophistication,
although they did score higher than another Middle Eastern country,
. Jordan (Ayoubi, 1981). The dependence scores of Aston and Egypt
were roughly the same, and the size of the Egyptian firms was gener
ally large. Functional specialization scored higher in Egypt indi
cating more offices involved in the public sector. Standardization
was markedly higher, also indicating the public accountability and
central planning of a socialist economy. Formalization scored
about the same as Aston, although there was less variability -
signifying the presence of written policies and job descriptions
but not much in the way of research and development procedures.
All in all, Egyptian public enterprise was synonymous to Pugh et
al's (1969) Personnel Bureaucracy. (Badran & Hinings, 1981: 12-17)
As in the Aston studies, the factors comprising the structuring of
activities variable, i.e. specialization, standardization and
formalization, were highly correlated - also providing convincing
support for the hypothesized high level of structuring and
centralization. Structuring was found to be · positively correlated
to both size and technology. This differed from the Aston findings
in that technological complexity was positively related to stze,
whereas the Aston team (Hickson et al, 1969) had said that
technology was only an important structural determinant in small
organizations, or at the operating core of larger organizations.
Badran and Hinings (1981) speculated that the reason for the
different Egyptian results was that the technology was mostly
imported and expensive and involved high capital outlays. More

-86-
specialists would be employed to look after expensive equipment. and
it would most likely be allocated to larger organizations. Decent
ralization increased with size - and technological sophistication
also encouraged decentralized decision making close to the point of
operations. Strong dependence on external structures meant that
the locus of policy-making decisions was concentrated. A wide
range of political, administrative and executive bodies typical of
a socialist economy produced strong structures of formal accountabi
lity. The tentative separation of operational decisions and policy
decisions was also explored by Azumi and McMillan (1981) in their
Japanese study and is discussed in section 6.3 below.
The relationship between size and technology in the Egyptian study
was particularly strong while dependence was negatively related to
both. The effects of size and technology on structuring were more
complex and suggested an interactive effect of both size and
technology, with neither being dearly dominant This was also at
variance with the Aston findings and was probably also due to the
expense of imported technology and the fact that it was al1ocated
to larger companies, as was discussed earlier. Another
contributing factor was that Egyptian public enterprise was not
involved m either large scale process industries or major retail
outlets - both of which would exercise a moderating effect on the
size /technology relationship.
The researchers also spoke of the possible 'late starter effect' on
Egyptian industry in that late starter countries are inclined to
show more developed forms of bureaucracy from the very beginning.
This was evidenced in the relatively high technological level and
the clearer relationship between technology and structure than was
present in many other studies which had used the Aston framework.
Genera11y the relationships identified by Bad ran and lH inings (1981)
had been consonant with those identified in earlier research in
Western countries. In addition they had determined the impact that
a specific political economy could have in producing organizations
with high levels of structuring and concentration of authority.

-87-
6.3 ~
It was said earlier that Japan could hardly be classified a devel
oping country any longer. Its enormous technological and industri
al advances, and propensity to assimilate only the best of Western
Organization Theory and management concepts, has transformed it
from a largely rural and isolated economy to a world leader.
Pucik, Beechler and Ito ( 1986: 20-26) traced the development of
Japanese Organization Theory from its importation from the United
States after World War 2, to its refinement and development in the
1950s and 1960s, to its re-export back to the West during the 1970s
and 1980s. They believed that the· basis for a truly international
Organization Theory as propounded by convergence theorists is
likely to spring mostly from Japan.
ln a wide-ranging study of 50 organizations tn the Okayama
prefecture in south-western Japan, Marsh and Mannari (1981: 33-57)
re-examined the causal importance of both size and technology on
organization structure. They made it clear at the outset that they
were seriously questioning the size imperative and that they
doubted that either size or culture would exercise an overriding
causal effect on the structure of Japanese industry.
They collected data using the standard Aston schedule items, toge
ther with items from other research. Their sample of 50 firms rep
resented 13 out of a total of 21 industries classified in Japan's
census of manufacturing. The independent variables were size and
technology. The first was measured in the normal way as a factor
of total headcount Because Technology was the focus of the study
the researchers decided to measure it in three ways; the first
using Woodward's (1958) classification, the second using a system
devised by Amber and Amber, and, finally, measures developed by
Khandwalla and based on Woodward's classification. (Marsh &
Mannari, 1981: 37-38.)

-88-
In addition to the independent variables, the researchers identif
ied a number of contextual variables which they intended to control
in order to isolate the effects of size or technology. The Aston
researchers had classitied autonomy as a dependent structural vari
able but Marsh and Mannari ( 1981) disagreed with this and said that
it was more correctly a contextual variable because of its similar
ity to dependence and its significant effect on centralization.
The control variables, therefore, were dependence, autonomy, age,
and the number of sites.
The dependent variables were very broadly defined and, apart from
the normal structuring of activities - here labelled structural
differentiation - they included such diverse items as costs and
wages, labour inputs, and union-management relations.
The results indicated ·a strong size influence on structural
differentiation, which was also affected by some of the control
variables. The researchers found, however, that technology was
more closely related to labour inputs, the percentage of graduates,
costs and wages, and union recognition. Mixed relationships were
present between size and technology and centralization and
authority structure, and horizontal span of control. The Chief
Executive's span of control was more a function of technology and
foremen's span was a function of both technology and size. The
size and formalization relationship discovered by the Aston group
was strongly supported. Altogether, the Okayama researchers
believed that they had found new support for the technological
imperative. Size, they maintained only intluenced 2 variables:
structural complexity and formalization. They discounted cultural
explanations for their data and firmly believed that they had
discovered a new lease of life for the technology imperative,
supporting the causal chain of:
technology ~> structure ~> size
which had first been proposed by Aldrich ( 1972) In his
re-examination of the Aston data. (Marsh & Mannari, 1981: 52-54)

-89-
The Okayama data were subjected to a critical re-analysis by Singh
( 1986: 800-812) who strongly disagreed with the tin dings of the
original research team. He demonstrated a lack of construct
validity in their research design and pointed to the consequent
errors in the measurement of causal parameters. He also provided a
detailed and painstaking critique of the Okayama research model,
maintaining that it did not fit the data. He also questioned the
technology measures that were used and said that the Khandwalla
scale, which had been discounted hy Marsh and M annari ( 1981 ), was
in fact a better measure than the ones they finally used. Finally,
he objected strongly to their very broad definitions:
One important implication of these findings is that it is inappropriate to place unrealistically wide boundaries on the concept of organizational structure and to consider dimensions as diverse as costs and wages, structural differentiation, owner-management differentiation, and labour inputs to he aspects of structure. Further studies should ... be more precise ... theorizing about specific structural dimensions, rather than structure as a monolithic construct. (Singh, 1986: 81 0).
ln summary, Singh ( 1986) could find no support for the Okayama
researchers contention that they had discovered a new lease of life
for the technology imperative.
A study (Azumi & McMillan, 1981: 155-172) was carried out in
another Japanese prefecture, Tochigi, which is 150 kilometres north
of Tokyo. It also involved a sample of 50 companies, but this time
including 19 of the 21 industries classified in the Japanese census
of industries. Again, the objective of the researchers was to test
the applicability of Western Organization Theory concepts developed
in the United States and the United Kingdom in Japanese organizati
ons. They also wanted to evaluate the significance, or otherwise,
of Japanese culture on its organizations; for example, the strong
hierarchy, cultural homogeneity, unique decision-making processes,
and lifetime employment. Ultimately, despite the different
cultural milieu, 1 apanese organizations were still faced with the
same organizational constraints including stze, technology and
operating context

-90-
The researchers used the Aston methodology identical to that used
by Pugh et al ( 1969) and Child ( 1972). The Japanese sample was
similar to the Aston sample in terms of its heterogeneity and organ
izational status, i.e. branches and principal units. This meant
that the results could he compared with the Aston and National stu-
n Size
Aston* 46 3370
NationaH** 82 1542
Japan 50 946
Specialization
10,2
10,1
9,1
FormalizatiolDl
27,1
26,7
32,9
Centralization
77,5
50,0
122,1
Table 3. 7. Mean scores on size and selected structura! scales in Aston, National and Japanese samples. (From Azumi & McMillam, 1981)
*Pugh et al, 1969 **Child, 1972
dies; this ts illustrated in Table 3. 7. The most striking immedi-
ate differences are the dearly higher scores on formalization and
centralization. Generally, Japanese firms were found to be more
formalized, more centralized and less specialized, but with more
vertical levels.
The higher scores on both formalization and centralization appeared
to give the lie to the 'alternative strategies of control' hypothe
sis developed by Child ( 1972) and others. In considering this
apparent anomaly, Azumi and McMillan ( 1981: 162) were reluctant to
pursue explanations rooted in cultural or sampling differences.
Instead, they looked at a tiner definition of decision-making as it
applied to centralization in their study; and which they believed
would also clarify the apparent discrepancies between the Aston and
National studies with respect to centralization. They drew a
distinction between operational and strategic decisions and found
that the latter were generally centralized while the former were

-91-
delegated.
This, they believed. argued against a unidimensional centralization
scale. Sifting out the strategic decisions that affected the
entire organization, they found that there was indeed support for
alternative control strategies. This was expressed as high
centralization of strategic decisions and high formalization. lt
was not necessarily accompanied by more specialists. Similarly,
increased size led to greater delegation of operational decisions
and more formalization. "One could say that managerial decisions
are either significant, in which case they are not delegated, or
delegated, ·in which case they are not significant" (Azumn &
McMillan, 1981: 163-171.)
In summary, they found a consistent pattern of strategic decisions
being centralized, regardless of the size of the organization or
its technology. Greater size was associated with more delegation
and increased formalization and support staff. Size did affect the
range of decisions that were delegated. In general, Japanese firms
made more use of production, worldlow and design specialists, as
opposed to British and US firms which are dominated by accounting
and tinancial experts.
6.4 Jordan.
In another Middle Eastern study Ayoubi (1981: 95-114) used the
Aston methodology in Jordan. His objectives were stated in the, by
now familiar, framework of ascertaining:
(i) whether theories generated in industrialized countries had
validity in terms of the size-structure-technology linkages
in a developing country, ·and
(ii) whether scales and methods used in industrialized countries
could be regarded as valid and reliable in developing
countries.

-92-
lndustrial activity tn Jordan was very concentrated with a small
number of generally small-sized firms. Most were family-owned or
dominated. For the purpose of testing hypotheses, Ayouhi split
structure into configuration on the one hand and structuring of
activities on the other. He postulated that the former would be
correlated mainly with technology and the latter mainly with size.
He also proposed that centralization would be correlated with the
amount of government ownership.
Data were collected from 34 firms which represented 64% of the
largest firms in the country. The standard Aston Schedules were
used and tested for construct validity and internal consistency.
Some elimination of items was needed in each scale and, eventuaJJy,
a high internal consistency was achieved on the revised scales.
Most adjustment was required on the technology scales. The
unrevised Aston scale achieved an internal consistency reliability
coefficient of only 0,23. Ultimately, a scale was devised which
was a composite of Aston, Woodward, and Amber and Amber (Ayoubi,
1981: 103) and it had an internal consistency of 0,92.
The results indicated firstly that, compared to similar studies in
industrialized countries, the scores for specialization and
formalization were very much lower. Two reason were advanced for
this: firstly, the number of scale items had been reduced, but,
more likely, it was because the 1 ordanian bureaucracy was in its
infancy. The technology relationship to configuration was stronger
than in industrial countries, providing support for Hickson et aJ's
( 1969) contention that technology exercised a much greater causal
effect on small organizations.
summarized in Table 3.8.
The major relationships are
It will be seen that size was the strongest explanatory variable of
specialization, standardization, formalization, vertical span and
span of the chief Executive, and ratio of administrative
employees. Production continuity exercised the strongest
explanatory influence on the subordinate/supervisor ratio and the

-93-
percentage of direct workers, non-workflow personnel, and
university graduates.
Strongest Explanatory Variable
Organization Structure Size Productiollll Automation Throughput % ofGovt Variables continuity continuity ownership
Functional Specialization X Overall Standardization X Overall Formalization X Centralization Vertical Span X Chief Executive Span X
% of total number of employees in
Transport X Administration X
Subordinate /supervisor ratio X
% of total number of employees who are
Direct Workers X Non-worktlow Personnel X Indirect Workers X University Graduates X Purchasing and stores X Clerical Workers X Maintenance X Accounts X Inspection X
Table 3.8. Summary of Correlations: Selected Structural & Contextuan Variables. (From Ayoubi, 1981: 107)
Ayoubi ( 1981) suggested that similar research directions should be
pursued in other developing countries to test his hypotheses in a
variety of wider se~tings. Technology, in particular, needs further
definitional clarity in a developing environment; it appears that de
veloping countries move quicker down the unit /batch I mass-production
paradigm. Development of technology in a developing country is more
a function of the transfer of technology in incremental bits
X

-94-
from another country, as well as the ability to then operate the
technology locally, with the minimum of social and other
adjustments.
Government ownership in Jordan presented interesting relationships
to centralization, which appeared to be opposite to the effect of
stze. Ayoubi ( 1981) detected tension between government funding
and increased pressure for more central control on one hand, and
growth and increased pressure for decentralization, on the other.
The implications of the I ordanian study for developed countries
was, in the· view of Ayoubi ( 1981 ), mainly evident in the size
versus technology imperatives. Size, he had determined, was more
important to specialization, formalization and standardization;
t.e. Aston's structuring of activities. Technology, on the other
hand, was a more important intluence on configuration variables.
This standpoint provided further support for Child's (1972) find
ings and his contention that, "The dispute between technology and
size theorists derives largely from the fact that they have been
studying different facets of organization." (Child. 1973: 383).
Perhaps the most important finding of the I ordanian study is that,
after testing for validity and reliability, the Aston measures,
with the possible exception of the technology scale, held up well
in a developing country. However, the timespan of the research
could be problematic. Because of the volatility inherent in most
third world and developing countries, two or three years to pursue
a research direction, is often just not possible.
6.5 .lrulia.
In another Far Eastern appliCation of the Aston methodo!ogy, Shenoy
(1981: 133-154) examined a number of organizations within the
broadly socialistic economy of India. The mam objectives of his
study were expressed by Shenoy (1981) as being to determine the

-95-
dimensions of structure and context and to examine the relation
ships between and among structural and contextual dimensions with a
view to comparing them to those from elsewhere.
Shenoy's (1981) sample consisted of 35 units employing 200 or more
people and covering the full range of 9 different industries in the
population from which the sample was drawn. The standard Aston
scales were modified to suit local conditions, with the fewest
modifications required in the critical scales of specialization,
formalization and centralization.
Shenoy ( 1981) found no support for the idea of alternative control
strategies. Instead, he found that in Indian organizations centra
lization and formalization existed as independent rather than
alternative strategies. It was to be expected that the Indian
scores on structuring of activities would be higher than other
nations because of the centuries of exposure to British colonial
bureaucracy.
Formalization -X S.D. Range
Poland ( n = 11) 29,6 8.6 25-41
Britain (n = ll) 27,4 7,3 14-37
Japan (n = 11) 28,6 9,5 10-41
Sweden (n = I I) 22,6 ll,O 13-37
India (n = 11) 34,3 5,8 23-41
Specialization
X S.D. !Range
12,8 2,3
7,3 3,3
8,2 3,0
8,3 2,6
7,1 1.7
10-14
0-U
0-13
6-15
4-10
Centralization
X S.D. Range
172,6 16,4 139-180
119,9 12,5 104-141
120,0 25,5 66-162
125,4 9,5 lll-142
401,2 173,2 183-696
Table 3.9. Structuring of Activities in Poland, Britain, Japan, Sweden and India. (From Shenoy, 1981: 143).
Table 3. 9 compares the Indian structural scores with a
cross-cultural study that was performed by Kuc, Hickson and
McMillan (1980). Although manipulation of the scales to adjust for
local conditions prevents prectse comparisons, it ts evident that

-96-
the Indian score on specialization is lower while those. on
centralization and formalization are considerably higher. Shenoy
(l981: 142-144) conjectured that the high formalization was a
direct result of British bureaucratic management tradition while
the high centralization retlected the dire shortage of skilled
middle management. Most decisions, especially in the smaller
firms, are made by the managing director.
The question that Shenoy ( 198 l: 143) asked with respect to struc
ture and context was, can the intluences of size and dependence
outweigh the effects of India's ancient and powerful culture? The
answer was. that apparently they do. The core cross-cultural rela
tionship proposed by Hickson et at (1974) appeared to be present in
the Indian data. Size was positively associated with formalization
and s~ecialization in common with the general direction of the
relationships in virtually all the other countries where the Aston
research had been replicated. Similarly, dependence correlated
with centralization, although the stable hierarchy of Indian
society probably made centralization easier to achieve.
The relationship of technology to structure was not as straight
forward. In keeping with the results of studies in other
developing countries (Kim & · Utterback, 1983; Badran & Hinings,
1981; Ayoubi, 1981) Shenoy (1981) found that the fact that most
technology was imported exercised a different affect on structure
than in industrialized countries. In India production technology
was positively related to structure and the tendency was for firms
to simultaneously centralize and bureaucratize as technology became
more advanced. Managerial and technical skills were concentrated
at the apex where decisions were taken, while, at the same time,
specialists were taken on to control the more complex technology,
leading to more formalization.
Shenoy ( 1981: 144) concluded his study by saymg that the broad
similarity of Indian organizations to the rest of the world
indicated that there was an overall accommodation between

-97-
bureaucratization as a process on one hand, and the ancient ways on
the other.
6.6 An African Perspective.
Apart from the Egyptian study of Badran and Hinings ( 1981 ), there
has been little or no focused study of organizations in Africa,
particularly of organizations in countries south of the Sahara.
Blunt (1983: 147) maintained that managers of African enterprises
did not see their organizations as open systems and generally
subscribed to the "one best way" viewpoint They were largely
unaffected by the contributions of contingency theory and a study
of Zambian copper mines reinforced the perceptions of outdated
management methods and philosophy.
As to relationships between context and structure in Africa, Blunt
( 1983) believed that the normal causal relationships would be
present but, unlike other developing countries, culture would
exercise an important effect on structure, particularly in the
context of the turbulent environment and socio-political upheaval
that characterizes Africa. He also documented the effects of
tribal kinship and culture in a study of two Kenyan organizations.
(Blunt, 1983: 136-141).
In the first organization, a senior supervisor from the Luo tribe
was appointed to a position where he controlled recruitment and
allocation of duties. Within a year of his appointment the
percentage of Luos in the organization bad more than doubled.
Allocation of duties had been reconstituted to comply with tribal
custom; older men performed lighter work and day shifts while
younger men did the more unpleasant work and night shifts. Counter
to expectations there were no grievances with these arrangements.
On the contrary, absenteeism was slashed, there were fewer customer

-98-
complaints, and damage to company property declined drastically.
The second organization was owned by a white man who recognised the
unique cultural aspect of African organizations and had capitalized
on them. He used the strong bonds of tribal kinship and solidarity
of his Luo employees to improve organizational control.
In a Nigerian study Blunt ( 1983: 138), emphasized tribal and ethnic
affiliations in reward and assessment functions. Although there
was little difference between Nigerian and US perceptions of <
submission to legitimate authority, the Nigerian sample expected
ethnic and tribal factors to intervene in the work situation.
The culture of colonialism has also left an enormous tradition m
Africa.
The legal and government 'culture' of colonialism, which was served by rigid bureaucratic structures, and designed to further and maintain the interests of the ruling elite, has, in the eyes of some observers, continued to perform the same function for new elites since independence. (Blunt, 1983: 139).
In summary, Organization Theory in Africa is complicated by a
turbulent political environment to the extent that the stability of
cultural influences may exercise a greater effect on structure than
in other, more settled, societies. The work by Blunt (1983)
appears to be the only substantive comment on Organization Theory
in Africa. A computer search carried out by the library of the
University of South Africa has failed to reveal any South African
Organization Theory references to research done in this country.
7. ORGANIZATION THEORY UNDER FIRE.
Earlier in this study the point was made that Organization Theory is a
young science which has its origins in the discipline of Sociology.

-99-
Hinings ( 1988: 2-7) traced the maJor changes that have occurred in
Organization Theory, the most important of which was its migration
from the Sociology faculty to the Business School or Management Centre
on campuses throughout the world over the past 25 or so years.
Initially, this entailed the physical relocation of people but,
increasingly, the schism has become institutionalized - to the extent
that Graduate Business Schools are offering fully-fledged doctoral
programmes in Organization Studies. The professional basis for
Organization Theory has, therefore, changed drastically.
Hinings ( 1988) also alludes to the great differences 10 the
perceptions of ·Organization Theory that exist in North America, which
is tied to its traditions of Structural Functionalism, and Europe -
particularly the United Kingdom. In fact, most of the criticism of
Organization Theory, and its foundations in systems theory and
structural functionalism have come from theorists in the UK.
Donaldson ( 1985) lamented the fact that despite the enormous advances
in empirical and theoretical knowledge over a period of three decades,
nobody from what he called the functionalist-positivist school of
Organization Theory was prepared to take on the increasingly strident
attacks that were being made. Organization Theory was variously being
labelled tautological, philosophically naive, ideological,
managerially biased, and methodologically flawed.
The assault on Organization Theory has come from two mam quarters;
from proponents of Social Action Theory on one hand, and from
theorists wedded to radical-structuralism or neo-Marxism on the other.
7. 1. The Assault: Social Action Theory.
Social Action Theorists criticize Organization Theory as being too
concerned with structure while ignoring the actions of individual
members of the organization and the meanings that they attach to
their social interactions. The exponents of individual motives

-100-
find problems, firstly, with systems theory and structural function
alism which ascribe goal-directed behaviour to organizations.
This, the individualistic critics maintain, reifies the organiza
tion and fallaciously attributes concrete existence and motives to
it. This, in their view, is nonsense since only individuals can
have motives or goal-directed behaviour. The language of
Organization Theory and talk of organizational analysis is, they
continue, an effort hy sociologists to endorse management's view of
the organization and to confuse individual employees so that they
can he manipulated into compliance. Structural functionalism is a
static theory and is, therefore, incapable of explaining change.
(Donaldson, 1985.)
By contrast, Social Action theorists believe that their approach is
more sociologically acceptable and has more utility for "suffering
humanity". Analysis of individual perceptions and values will
uncover the origins and manifestations of contlict. Aspects which
a structural approach is not capable of doing because it focuses on
equilibrium and is not able to recognise change or contlict. It is
an ideology for preserving the status quo by manipulating workers
and only presenting management's viewpoints.
Insofar as scientific analysis is concerned, Social Action theor
ists believe that meaningful human action can only be explained and
understood by examining the rules, artifacts and language used by a
particular group or society. Methods of analysis consist of parti-
cipant observation, qualitative methods, hermeneutics, historical
and processual studies, with a view to explaining the meaning of
action in a specific context. This obviously leads to rejection of
comparative methods, quantification, operationalized variables,
questionnaires, and other organizational measurement tools.
The Social Action critics maintain that each individual has a view
of the situation which is coloured by his personal interests, and
the differing interests of individuals is the basis of contlict.
Often the structural form and configuration that an organization

-101-
assumes 1s a reflection of the conflicts and compromises between
groups and individuals. This, the critics argue, is a better model
for describing both structure and organizational change.
(Donaldson, 1985.)
7.2 The Assault Radical Structuralism
The other mam source of attack of orthodox Organization Theory
comes from radical structuralism, or neo-Marxism, theorists who
believe that Organization Theory fails to locate the organization
in the broader social structure of society. They believe that
society is characterized by inequities and oppression and that
organizations should be analysed in terms of their contributory
role in this oppressive social system.
Neo-Marxians expand on the Social Action theorist's concepts of
interest, power and contlict by emphasizing the way in which
organizations apparently work to exploit and manipulate their
members.
The neo-Marxians' organizational analysis is expressed in terms of
class struggle, and imperial and government systems. The motives
of the principal actors can be expressed in terms of Marxian politi
cal economic theory, regardless of whether the individual perceives
it that way or not So the objective interest of capitalists is to
maximize profits and minimize wages, while the objective interest
of workers is the opposite. Power differences are expressed in
terms of structure which seeks to dominate and exploit Contlict
and raised consciousness of the working classes wm ultimately
result in massive social transformation - the revolution of the pro
letariat. For the neo-Marxian the organization must be explained
in terms of this conflict model. Regular Organization Theory is
just another tool for domination, subjugation, and exploitation.
(Donaldson, 1985: 123-135.)

-I02-
7.3 The Riposte.
In replying to the critics, Donaldson ( 1985) traced the history of
Organization Theory and its split with Sociology. He argued that
the growing influence of Social Action and Marxist theories was
undesirable and the Jack of effective counter argument negligent on
the part of organization theorists. His book had been written with
a view to not only halting the critical trend but reversing it.
Looking first at social Action theory, Donaldson ( 1985: 107-113)
noted that its atomistic view of society overstated individual
will, under-rated the importance of socio-economic determinants,
and completely ignored cognitive processes that are not strictly
rational.
Nevertheless, Donaldson (I 985: I 13) was careful to acknowledge the
utility of Social Action Theory in explaining differing percepti
ons, beliefs and values; and perceived interests and conflict.
However, its explanatory power was limited and its generalizability
restricted. He believed that it was a "primitive theory, leading
to low level, unconnected, localized generalizations" (Donaldson,
1985: 113.)
Turning to the neo-Marxian theorists, Donaldson (1985: 123-134)
maintained that Marxian sociology was not an organization theory at
all and could not, therefore, be used to displace orthodox
Organization Theory. The level of analysis of the two approaches
was totally different and so they were not mutually exclusive.
Attempts to build an Organization Theory that was Marxian had
resulted in perspectives that were conventional sociology of a
neo-Weberian variety and which were quite compatible with normal
Organization Theory. Because Marxism is not an Organization Theory
it cannot be used to explain organizational concepts.

-103-
In a follow-up to his book, Donaldson (1988) pursued the theme of
apparently irreconcilable paradigms and stated that, in his view,
they were often not incommensurable. The concepts, theories,
metatheories, and epistemologies, were, rather, references to a
variety of dependent or independent variables.
The lessons of recent organization structure research is that simple, general, functionalist-positivist theories can prove to he robust and powerful if the analysis is prosecuted, rather than being dissipated in a confusion of theories and factors. (Donaldson, L 985: 32)
8. RECONCILING DIVERGENT VIEWPOINTS.
From the foregoing discussion of Donaldson's work as well as the wide
range of structural viewpoints drawn from many divergent disciplines -
of which a small cross-section has been presented in this chapter - it
must seem that there is more discord than agreement among theorists in
the field of Organization Theory. Nevertheless, there have been
several notable attempts to reconcile these apparent divisions. On
page 64 of this study the concept of Paradox in Organization Theory
was examined in the context of harnessing the seeming contradic
tions in various theoretical viewpoints in such a way that their
explanatory power was enhanced and complemented
Astley and Graham (1983 : 245-273) further built upon these concepts
and have developed a model which achieves a partial reconciliation
between theoretically compartmentalized and apparently contradictory
points of departure. They began their analysis by outlining six
questions on the nature of organization structure that currently
predominate in the literature:
(i) Are organizations functionally rational. technically constrained
systems; or ar.e they socially constructed, subjectively
meaningful embodiments of individual action?
(ii) Are changes in organizational forms explained by internal
adaptation, or by environmental selection?

-104-
(iii) Is organizational life determined by intractable environmental
constraints; or is it actively created through strategic
managerial choices?
(iv) Is the environment to be viewed as a simple aggregation of
organizations governed by external economic forces, or as an
integrated collectivity of organizations governed by its own
internal social and political forces?
(v) Is organizational behaviour principally concerned with
individual or collective action?
(vi) Are organizations neutral technical instruments engineered to
achieve a goal, or are they institutionalized manifestations of
the vested interests and power structure of the wider society?
Astley and Graham said that no complete resolution of these questions
is ever likely to come about, but some integration is possible if it
is accepted that different perspectives can present totally different
pictures of the same organizational phenomenon without negating each
other. To illustrate the major theoretical viewpoints at a metatheore
tical level, the authors devised a matrix across two analytical dimen
sions : (i) the level of organizational analysis, and (ii) the degree
to which human nature is seen to be deterministic or voluntaristic.
The following discussion is based entirely on their dialectic approach
to Organization Theory models. (Astley and Graham, 1983: 245-273).
The resultant four basic views of Organization Theory can be seen in
figure 3. l. It will be seen that this model presents a format into
which all of the Organization Perspectives that have been discussed in
this chapter can be fitted with a certain amount of ease. Each of the
quadrants is self explanatory but provides only a partial explanation
of reality. Together they provide an accumulation of complimentary
ways to address organizational phenomena and this is accomplished by
sequentially juxtaposing the four viewpoints until all six possible
combinations have been counterposed and contrasted.
8.1 System versus Action : Q 1 vs Q2.
Are organizations functionally rational, technically constrained systems; or are they socially constructed, subjectively. meaningful

CRO I
ula~~nd I munities of 1
MICRO LEVEL iividual
;anizations)
I
I
-105-
NATURAL SELECfiON VIEW
Schools: Population ecology, industrial economics,
economic history.
Structure: Environmental competition and carrying capacity
predefine niches. Industrial structure is
economically and technically determined.
Change: A natural evolution of environmental variation,
selection and retention. The economic context
circumscribes the direction and extent of organi
zation growth.
Behaviour: Random, natural. or economic environmental
selection.
COLLECfiVE-ACfiON VIEW
Schools: Human Ecology, political economy. pluralism.
Structure: Communities or networks of semi -autonomous
partisan groups that interact to modify or
construct their collective environment. rules,
options. Organization is collective -action
controlling, liberating, and expanding individual
action.
Change : Collective bargaining, conflict. negotiation. and
compromise through partisan mutual adjustments.
Behaviour : Reasonable, collectively constructed, and
politically negotiated orders.
Manager Role : Inactive
03 io4 Manager Role: Interactive.
SYSTEMS-STRUCfURAL VIEW
Schools : Systems theory, structural functionalism,
contingency theory.
Structure : Roles and positions hierarchically arranged to
efficiently achieve the function of the system.
Change: Divide and integrate roles to adapt subsystems
to changes in environment, technology, size,
and resource needs.
Behaviour: Determined, constrained and adaptive.
Manager Role : Reactive.
Ql :Q2 STRATEGIC CHOICE VIEW
Schools: Action theory, contemporary decision theory,
strategic management.
Structure: People and their relationships organized and
socialized to serve the choices and purposes of
people in power.
Change: Environment and structure are enacted and
embody the meanings of action of people in
power.
Behaviour : Constructed, autonomous and enacted.
Manager Role : Proactive.
DETERMINISTIC ORIENTATION •
VOLUNTARISTIC • ORIENTATION
Figure 3.1 Divergent Viewpoints on Organization Structure.
embodiments of individual action? This debate 1s concerned
with the question of whether individual action is the derivative of
the social system, or whether the social system ts a derivative of

-106-
individual action. Reconciliation between these vtews .must
recogntse that individual action is always tn some measure
constrained by the rules and norms of the system - or else the
system would disintegrate. The individual is free to adopt
strategies within the rules of the game since abandoning the game
altogether would not serve his interests.
The dichotomy between these viewpoints ts also illustrated in the
decision-making process and the question of whether decisions are
rational, goal directed behaviour, or whether decisions are made
after the fact in an attempt to rationalize action that has already
occurred.
Another illustration of this system /action debate concerns the
environment. One viewpoint holds that the environment has causal
primacy and organizations adapt within the contextual constraints
acting upon them. The other view is that management has leeway to
create and define the organization's environment and to proactively
incorporate the environmental elements that they choose. Critical
to this choice is the concept of "goodness of fit" between organtza
tion context and structure. So, while managers may expenence
environmental constraints, they may still have a certain amount of
choice as to what the constraints are to be.
8.2 Adaptation versus Selection : Q 1 vs Q3.
A. re changes in organizational forms explained by internal adaptation. or by environmental selection? Historically, the
internal adaptation view has been predominant Based on systems
theory and the contingency approach, this view posits that an
organization responds to change by modifying and elaborating its
structure to maintain an isomorphic relationship with its
environment For example,- turbulence in the environment must be
matched internally by differentiated and tlexible structures if
organizational effectiveness is to be preserved.

-l07-
Population ecologists, on the other hand say that this v1ew
exaggerates the degree of freedom individual managers have to
adjust structural forms. Sunken costs, political resistance to
change, and historical precedence induce structural inertia and if
the niche that an organization occupies no longer supports that
particular organizational form, it is simply "selected out".
Both the adaptation and selection views are deterministic 10 their
approach but they differ considerably in their level of analysis.
The adaptation position is that organizations respond individually
to change by fine-tuning themselves to suit the contingencies 10
the environment By contrast, the natural selection argument is
that no amount of fine-tuning will work if, in the long run, an
organization's niche disappears altogether. The focus thus shifts
to entire populations of organizations that come and go in surges
as complete industries are created and annihilated.
The problem with the natural selection view is that very large
organizations do not come and go in waves and are seldom selected
out. Herein lies a possible reconciliation of the two viewpoints.
Small organizations are at greater risk of being selected out
because they normally only occupy one or maybe two niches.
Conversely, large organizations are able to spread themselves
across several niches and can avoid being selected out by altering
portfolios and transferring resources to more profitable niches.
A logical extension to this perspective is the "market failures"
perspective. This view proposes that, when markets cease to
function properly and no longer optimally allocate scarce
resources, a large organization can bring its superior monitoring
and control capabilities to bear and restore efficiency. This
leads to the growth of large hierarchical organizations that
supplant and re-establish the economic rationality that IS no
longer present in the market Again, the analysis is at a macro
level and extends the natural selection view to large corporations.

-108-
The concept of hierarchies supplanting markets can, nevertheless,
also be argued from an adaptation context. Hierarchies are not
just by-products of market failure that act as alternative
mechanisms for distributing economic resources. They could equally
he managerial tactics for reducing uncertainty and neutralizing
contingencies that threaten the organization. This is particularly
so when expansion of operations into the environment is in the
direction of crucial contingencies with a view to absorbing
environmental elements as a means of protecting the technical core
of an organization.
8.3 Constrained Niches versus Enacted Domains: Q2 ys Ql
Is organizational life determined by intractable environmental
constraints; or is it actively created through strategic managerial
choices? The argument here is between industrial economics and
population ecology on the one hand and strategic management on the
other. Industrial economists assume that all firms in an industry
will react in a similar way, given a particular set of economic
circumstances. Strategic management theorists, however, look more
to the individual firm as a umque entity and they emphasize the
creativity and visiOn displayed by organizations in changing the
rules of the game to suit their own needs in their particular
industries.
The industrial economics view disputes the effectiveness of
managerial action and asserts that the forces underlying the
emergence and destruction of market niches will always overwhelm
strategic managerial action. Conversely, proponents of strategic
management maintain that the environment is a domain within which
managers enact, define and influence key market forces. Individual
organizations employ unique strategies and are able to intluence
industry structure by, for example, erecting barriers to entry.
The market structure then becomes a dependent variable that, over
time, reflects the collective strategies of firms in the industry.

109-
Herein lies the possible reconciliation of the two views. The
industrial economics and population ecology view attributes to the
environment what is actually the result of a collective or
population level of analysis. By taking a macro view of the
population one automatically foregoes a micro view of individual
organizations. Although the actions of one small organization may
count for little in the context of long run trends at a collective
level of analysis, it would be wrong to argue that this proves the
existence of amorphous, invisible forces that determine and shape
markets and organizations. This is reinforced by the fact that it
is still possible to employ a population level of analysis with a
voluntaristic, as opposed to deterministic, orientation; as the
following discussion shows.
8.4 Economic Aggregates versus Political Collectivities : Q3 vs Q4.
Is the environment to be viewed as a simple aggregation of
organizations governed by external economic forces, or as an
integrated collectivity of organizations governed by its own
internal social and political forces? Both parts of this
question focus on the population as the level of analysis. The
themes that are at issue concern, tirstly, the detinition of what
constitutes the "population" and, secondly, whether organization
populations are directed by economic or by social and political
dynamics.
Population ecologists view the population as an aggregation of rela
tively homogeneous organizations which share certain elements that
constitute a common form. They also share a common vulnerability
to the environment and interorganizational relationships are
comensalistic and based on economic competition for scarce
resources. The view of ·organizations is of open systems that
interact directly with the environment and are influenced by it
-110-
Human ecologists, on the other hand, believe that a population only
exists when some sort of corporate wholeness or internal cohesion
can be attributed to it. Some organizations become functionally
specialized in obtaining resources directly from the environment
while others obtain what they need indirectly from boundary
spanning organizations. lnterorganizational relationships are
symbiotic and functionally interdependent and develop on the basis
of complimentary differences between heterogeneous units. The view
of organizations is of symbiotic networks that have a tendency to
closure and thus to isolate the organization from the effects of
the environment
In summary, then, population ecology focuses on the natural environ
ment which is made up of forces beyond the organization's control.
Organizations compete for environmental resources and, ultimately,
their continued existence is dependent on the natural environment.
The dynamic which underlies organizational activity is that of
economic competitiOn, and relationships between organizations are
mediated by a process akin to Adam Smith's "invisible hand". In
contrast, human ecology focuses on the active construction of a
proactive social environment that displaces the natural environment
as the critical influence. There is symbiotic collusion between
organizations which ensures the continued existence of
interorganizational networks and organizational survival as a
whole. The underlying dynamic here is of social and political,
rather than economic, forces.
interorganizational networks.
Power plays an explicit role within
Those closest to the environment
exercise the most power because they can control the acquisition
and distribution of resources to other members of the network
The tension between the vtews of population and human ecologists,
respectively, is reflected m a similar debate between industrial
economists on one hand and political economists on the other,
relating specifically to the dominance of big business at the
centre of interorganizational networks. The construction of social
networks is one way of protecting an organization from the harsh

-I I I-
realities of the natural environment. Another equally eff~ctive
way would he to absorb elements of the natural environment and thus
obtain control of the environment by eliminating market exchange as
means of resource distribution. In both cases it is the political
power forces that are emphasised rather than economic forces.
Another view is that it is economic forces, particularly the
economic advantages of vertical integration, that have led to the
emergence of large scale organizations. Those organizations that
did not adjust to changing market and technological conditions by
internalizing the environment were unable to compete and were selec
ted out. ·Of course, this view does not consider the possibility
that vertical integration could take place with the more basic aim
of strangling competitors' supply lines and dominating distribution
outlets. While economic factors may provide the necessary
conditions to permit vertical integration, it is power and market
control that provide the motivation for it to take place.
Taken as a whole, the disparate views of organizational analysis at
the macro level of investigation can he reconciled along three
complementary and dialectic dimensions: industrial concentration is
hegemonic power; economic success is political domination;
corporate organization is social control.
8.5 Individual versus Collective Action : Q2 vs Q4.
Is organizational behaviour principally concerned with individual
or collective action? This question focuses on the basic tens-
ion between self and col1ective frames of reference. Historically,
organization and management theories have tended to accentuate self
interest and rationality as their point of departure. Individuals
and organizations · are credited with having clearly defined
objectives and a consistent preference order by which actions that
maximize the self interest of the organization are judged. This
concept is based on the premise that individual organization

-112-
members have shared common goals. Where there are contlicting
goals, a number of pressures are brought to hear to achieve
consensus : remuneration, promotion and reward, as well as
elaborate evaluative and motivational systems.
Critics of this view argue that there is no rational justification
for individuals to contribute to the collective good. In small
groups individuals may he willing to subordinate their own goals
for the sake of reciprocity, trust, friendship, social pressure or
altruistic concern for the group as a whole. In larger groups,
though, these pressures towards conformity are less pronounced and
there is greater difficulty in generating collective actions.
Ultimately, individuals will pursue their own goals and will
maximize their own self-interest Consequently, contlict and
disruption are as omnipresent as consensus and order.
However, the question remains: if organizations represent sectional
interests of individuals, why do the individuals bother to adhere
to collective working rules at all? The answer lies in the
interactions of members of the organization. As expedient response
patterns are discovered through trial and error, the successful
ones tend to he repeated and then generalized to similar
situations. Eventually, individuals who consistently interact come
to realize that there is "a way we do things around here." Norms
become dissociated from specific situations from which they first
arose and are generalized to cover broad areas of collective
activity. Ultimately, these norms are imbued with a sense of moral
obligation, thus freeing the individual from the need to initiate
new response patterns for each situation that he encounters. It is
also in this context that we can speak of organizational culture.
So the self or collective action dichotomy, ultimately, Is
reconciled by recognising that organizational members are both
independent actors and involved members of a larger organization.
On the one hand they act individually to maximise their own self
interest, but, on the other hand, they do also adhere to unifying

-113-
patterns of cultural and social norms as they take on responsi
bilities as part of a larger social entity.
8.6 Organization versus Institution : Q 1 vs Q4.
Are organizations neutral technical instruments engineered to
achieve a goal, or are they institutionalized manifestations of the
vested interests and power structure of the wider society? The
point of departure for this debate is encapsulated m the
distinction between an "organization" and an "institution". In
this context, organizations can he seen as rational man-made
creations that are designed to efficiently mobilize activity to
achieve prescribed goals. As such, they can be seen as technical
instruments or tools that are ultimately expendable.
Institutions, on the other hand, are imbued with a value beyond
that of the technical requirements of goal attainment They are
responsive-adaptive organisms that grow according to the social
demands and forces that fashion and form them. As such, they
retlect the vested interests of the society that spawned them and
they mirror the norms and values of the societal structures in
which they are embedded.
The idea of organizations as rational, technical tools is the one
that has had most currency in organizational literature. The most
strident attacks against this concept have come from radical
Marxist and political economy theorists. These theorists reject
the notion of rational logic and technical effectiveness and
maintain that these concepts are ideologies that support and
disguise the repressive machinations of a managerial elite bent on
exploiting the workers. The conventional arguments in favour of
capitalist efficiency .are refuted by the assertion that efficiency
is defined with a management bias and represents nothing for
workers except exploitation and domination.

-114-
In this context, worker-management relations are nothing more than
a microcosm of the larger dass conflict in society. In taking
such a standpoint, the radical Marxists and Political Economists go
beyond the realms of Organization Theory, as was made clear in the
earlier discussion of Donaldson's work. While Marx emphasized
discord and struggle between classes, he underplayed the importance
of the forces of cohesion and solidarity within classes.
Nevertheless, there is a measure of reconciliation between the two
viewpoints in the recognition that as the analysis proceeds from
the micro to the macro level the forces that underlie organization
and structure tend to he more political than adaptive.
8. 7 Discussion.
This concludes the discussion of Astley and Van de Yen's (1983)
model which attempted to reconcile the major perspectives in
Organization Theory. In their treatise the authors went on to
contrast the left and right sides (structural forms and personnel
actions), and the top and bottom halves (Part-whole relationships),
of their model. They concluded that in order to have a proper
understanding of Organization Theory, it was necessary to recognize
the discipline's basically antithetical nature. "Contradictions
are pervasive in organizations and theories that capture discrete
segments of organizational life must also inevitably be
contradictory and can he reconciled only dialectically." (Astley
and Van de Ven, 1983: 269).
9. SUMMARY.
In this second chapter dealing with the related literature and
research into the field of Organization Theory the current state of
the discipline was summarised. The newest contributions which
re-evaluate Organization Theory's traditional points of departure were
described including a re-examination of open systems theory and the
structural imperatives employed by contingency theory.

-115-
The structural issues that occur tn high technology organizations were
explored separately and a modern response in the form of the
stratocracy was described. Organization Theory issues that occur in
societies that cannot be described as advanced Western economies were
also described.
Finally, the maJor academic assaults on classical Organization Theory
were outlined and then a framework for resolving the divergent
opinions in the field was put forward. This framework proposed a
model which described nearly all the major viewpoints along two axes:
(i) the level of organizational analysis, and (ii) the degree to which
human nature is seen to be deterministic or voluntaristic.
This chapter concludes the examination of the background, theoretical
basis and academic foundations of this study. In the following
chapters the research methodology that was used will he described and
some attention will be paid to the research design and key concepts
and definitions. Thereafter the actual collection of data and the
research population will be described before moving on to discuss how
the data were treated and processed. Finally, the key statistical
associations and findings of this study will be described and some
suggestions for future research will be suggested.

CHAPTER FOUR: RESEARCH DESIGN.
1. INTRODUCTION.
The research methods and designs employed by Organization Theorists are
strongly steeped in the traditions of the behavioural sciences and
sociological research methods. This is hardly surprising since - as
was pointed out in chapter one - the discipline grew out of, and some
believe it is still firmly rooted in, the behavioural sciences. There
is, therefore, a robust concern for the validity and reliability of
research findings, and a critical approach to the various research
strategies and methods is encouraged.
It is axiomatic, then, that classical Organization Theory literature
and texts lay. strong emphasis on quantitative techniques and the
scientific method.
2. THE SCIENTIFIC METHOD.
Conceptually, the scientific method can be illustrated as m figure 4. 1
below.
Main phases Intervening processes
r----------- Theory · ·
~---------------Deduction Hypothesis ·
~--------------- Operationalization
Observations /Data collection
~---------------Data processing
Data Analysis
~-. ---. -----------Interpretation
Findings
~---------------Induction
Figure 4. i. The Scientific Method (from: Bryman, 1989: 7)

-117-
Leedy (1989 : 80) defined the scientific method as, " ... a means whereby
an undiscovered truth is sought by ( 1) identifying the problem that
defines the goal of the quest, (2) gathering data with the . hope of
resolving the problem, (3) positioning a hypothesis both as a logical
means of locating the data and as an aid to resolving the problem, and
( 4) empirically testing the hypothesis by processing and interpreting
the data to ... resolve the question that initiated the research."
A key objective of this study was to preserve the principles of the
scientific method and to follow the steps and phases that are outlined
in figure 4. I. This process included gathering, processing and
interpreting quantitative data and then testing specitic hypotheses
which were grounded on accepted theoretical foundations.
2. 1 Research design
Podsakoff and Dalton ( L 987), in a revtew of the research methodology
used in organization studies, pointed out that certain quantitative
methods have become preferred and, through sheer repetition, have
become entrenched - despite the sometimes apparent shortcomings of
some of them.
This research, for the most part, followed the traditional methods.
Because of its seminal nature in the South African context, it did
not become involved in the higher order methodological debate.
That, perhaps, will be the domain of a later exercise. So, for the
purpose of this study it was accepted that:
(i) the data was cross-sectional and not Longitudinal,
(ii) it was not possible to cross-validate findings with any other
South African study, and
(iii) many of the variables were tested for construct validity m a
local situation for the first time.

-118-
2. 1. 1 Research Design of this Study.
There are a number of options that can he followed m putting
together a research design; illustrated in figure 4.1. below.
DESIGNS
D I Experiment (major
distinctions : laboratory &
field experiments; experiments
and quasi-experiments)
D2 Survey (including longitudinal
survey design)
D3 Qualitative research
D4 Case study
D5 Action Research
METHODS
M l Self-administered
questionnaire
M2 Structured interview
M3 Participant
observation
M4 Unstructured Interview
-ing
M5 Structured observation
M6 Simulation
M7 Archival sources of data
Figure 4.2. Main research designs & methods in organizational
research. (source: Bryman, 1989: 29)
Following the outline of the mam research designs and methods
proposed by Bryman ( 1989) the structure of this study consisted

-119-
mainly of design 02 (Survey), together with limited elements of
D3 (Qualitative) and D4 (Case Study) designs, respectively.
As to methods, the majority of data was gathered by means of M l
(Self-administered questionnaire). There was also some use of M7
{Archival) data, for example in the search of related literature,
and M4 (Unstructured interviews). The latter included discuss
ions that were held with Mr Dirk Desmet, the general secretary of
the Electronics Industries Federation; M r Gerard Morse, senior
general manager and head of the Industrial Development Corpora
tion's standing committee on the Electronics Industry; and,
finally, Professor David Jacobson, Technology Executive for the
Allied Electronics Group and past president of the South African
Institute of Electrical Engineers. All of these interviews were
conducted primarily to cast light on the questions in the
electronics industry that originally triggered this research.
2.1.2 Institutional versus Questionnaire Measures.
Some writers, e.g. Sathe (1978), Ford ( 1979), Lincoln and Zeitz
{ 1980), have drawn a distinction between what they termed institu
tional measures of organizations - such as charts, documents and
interviews with key informants and questionnaire measures of
organization, in which sample data are gathered from organization
members and are then aggregated in order to obtain measures of
structure.
The contention ts that institutional measures gauge the
designed or actual organization, while questionnaire measures
gauge the emergent or experienced organization. The debate
as to the degree of convergence between the two has been spirited
- although Ford (1979 : 601-610) maintains that the emergent
organization will, over time, become the designed organization as
behaviour and response patterns are institutionalized into the
organization culture.

-120-
This study made use of mainly questionnaire measures, with
limited institutional measures confined to aspects such as s1ze,
ownership, and configuration. However, because the level of
analysis was the organizations that comprised the manufacturing
industry, and the respondents consisted of one key informant in
each organization, the level of aggregation was the industry and
not the individual firms. Thus the dichotomy between the
emergent organization and the designed organization was probably
not as pronounced and should not have impacted unduly on
correlations between variables.
2.1.3. Relevance of the Research.
Considerations of the relevance of the research are of critical
importance and should he built into the research project at the
design stage. Thomas and Tymon (1982 : 345-352) proposed a
five-point checklist, using the practitioner as the ultimate
point of reference.
(i) Descriptive relevance refers to the accuracy of
research findings in describing phenomena actually
experienced in an organizational setting.
(ii) Goal relevance is the degree to which the dependent
variables correspond to things the practitioner wants to
influence. Research is likely to be useful to practition
ers only if dependent variables (outcomes) are of concern
to the practitioner.
(iii) Operational validity - the ability of the practitioner
to manipulate causal or independent variables in order to
effect change in the dependent variables. Some research,
although descriptively valid, is of limited applied
relevance because manipulating independent variables would
have catastrophic consequences for the organization.

121-
(iv) Non-obviousness is the degree to which theory me~ts or
exceeds the common sense applications already employed by the practitioner.
(v) Timeliness - to be of use to the practitioner. theory
must be available in time to deal with problems.
As this study progressed, the above principles were regularly
reviewed and adherence to them evaluated. Taken as a whole, the
following comments can be made :
(i) Descriptive relevance. Organization Theory principals
and measures are well established in advanced economies.
The generalizability of particularly the Aston methodology
(Hickson and McMillan, 1981) has also been demonstrated in
cross-cultural studies, and now also in South Africa.
(ii) Goal relevance. · The dependent (outcome) variables are
discussed in detail in section 3 of the next chapter. It
is considered that most, if not all, would be of concern
to the practitioner at various stages.
(iii) Operational validity. Independent variables are also
discussed below. It is within the bounds of the
practitioner to exercise varying degrees of intluence on
all of them. They are often incorporated into a company's
strategic options with a view to gaining competitive
advantage by establishing control over them.
(iv) Non-obviousness. The relationships between variables
became clearer as the study progressed. As was expected,
the conventional wisdom did not always apply
case with the electronics Industry and certain
the manufacturing industry.
as was the
sectors of
(v) Timeliness. The timeliness of this exercise could not
have been better. With the macro-political and economic
changes that have taken place together with increasing
global competition, organizational issues have assumed
compelling importance.

-122-
3. SUMMARY.
The research design of this study was strongly based on the practical
application of the scientific method. This entailed an empirical
approach with a strong quantitative bias. Data were gathered in a
structured manner with a view to testing specific hypotheses based on
detined research problems, which were, m tum, drawn from a body of
accepted theory.
Criteria for establishing and evaluating relevance were identified and
were regularly reviewed with a view to preventing the study from
becoming a self-indulgent and valueless exercise.
In the following chapter the key concepts are isolated and examined and
those that were measured are operationaJiy defined.

CHAPTER FIVE: KEY CONCEPTS AND DEFINITIONS.
1. INTRODUCTION.
In an earlier chapter a brief history of the development of Organiza
tion Theory was sketched. The pioneering research in the 1960s and
1970s of a group led by Derick Pugh in Birmingham, England, was
described. These researchers, who became known as the Aston group,
were the first to operationalize and measure abstract dimensions of
organization structure. Previously, all Organization Theory had been
rooted in Weberian Bureaucracy and academic discussion centred around
hypothetical constructs, ideal types, and individual case study.
The Aston methodology broke free from the bonds of a priori theoriz
ing and armchair speculation and put Organization .Theory on a new and
empirical footing. Their research has been duplicated, enlarged and
developed throughout the world in the intervening 25-odd years.
This study reflects the ongoing development of Organization Theory in
that, of the 25 scales that comprise the Questionnaire that was used,
less than half represented the original Aston scales. The majority are
improvements by later researchers or entirely new scales. Neverthe
less. the influence of the work of the Aston group on this project is
still considerable.
In the following sections the key concepts are discussed and operation
ally defined, beginning with a number of independent or causal
variables. Secondly, several dependent or outcome variables are
discussed and operational definitions for them will also be proposed.
2. INDEPENDENT VARIABLES.
Most organization studies have distilled a number of exogenous
variables which have been used in similar research in many countries
throughout the world. This study followed the trend and made use of
the five most commonly cited exogenous, or independent, variables.
They are:

-124-
(i) Size
(ii) Technology
(iii) Dependence on other organizations
(iv) Power control, and
(v) Environmental uncertainty or turbulence.
There are, certainly, other variables that could have been considered
such as age and life cycle stage, government influence, environmental
munificence, cultural pressures, and so on. Some of these were given
peripheral consideration. However, the above five have evolved into
the core causal variables and other factors tend to be situational and
useful for specific studies of limited scope.
2.1. Organizational Size.
The importance that the role of stze plays in determining an
organization's structure has been widely debated. There is general
agreement that the causal link between size and structure is strong;
hut whether it is overriding, or just contributory, is still
unresolved.
2.1.1. Operationalizing Size.
Organizational stze can he measured in any one of a number of
different ways depending on the application that is required.
These could range from measures of turnover, profits, assets,
salary bill, and acreage, to a simple headcount The latter
measure has in fact been found to the most effective for
organizational research. Size according to headcount has two
aspects, firstly the size of the organization under study and
then the size of the holding group. In this study, the size of
the organizations varied from a minimum of 150 to several
thousand. To overcome possible problems associated with such a
wide range, size was expressed as the logarithm of the headcount.

-125-
Similarly, the wide range of s1zes associated with each
organization's holding group was overcome by expressing the size
of the organization as a percentage of the total holding group.
This statistic was also more useful when it was factored into the
causal variable of Dependence.
2.2. Technolo~.
The early debate 10 Organization Theory centred on the relative imp
ortance of size versus technology as the only structural impera
tive. Woodward ( 1959) argued strongly for an exclusive technology
imperative, claiming that only differences in technology, and not
other variables, were related to differences in structure.
Technology refers to the process whereby an organization converts
inputs into outputs. The concept has a much broader application
than just manufacturing. lt can be applied to virtually any organ
ization and embraces operations technology, knowledge technology,
service technology and materials technology, to name but a few.
2.Z: 1. Operationalizing Technolo~.
A common theme that emerges in discussions of technology is the
degree to which it has been automated and the amount of routine
that it contains. Related concepts are the amount of rigidity or
flexibility of throughputs, and the continuity of the units of
throughput
The Aston researchers developed the concept of automaticity
to encompass these aspects (Pugh & Hickson, 1976). Their scale
consisted of two measures - one which rated the most automated
~ piece of equipment and another which assessed the .b..u1k of the equipment. The automaticity score is the sum of the
two. Used in conjunction with other measures, such as the
Khandwalla process technology scale (discussed in chapter six),

-126-
the Aston scale has proved quite effective.
2. 3. Dependence.
Dependance refers to the extent that an organization is reliant on
other organizations in its operating environment This reliance, or
dependence. has two forms: firstly, ~organizational dependence
with other players in its operating domain such as suppliers,
customers and competitors; and secondly, intraorganizational
dependence meaning its relationship with its owning group and the
status, accountability, and origin of the organization itself.
Intraorganizational dependence is likely to have more of an effect
on structure. It was difticult to test interorganizational depen
dence because of the sensitivity of the data that was required.
Some attempt was still made by including 2 short Aston scales in the
demographics section of the Questionnaire.
2. 3. 1. Operationalizing Dependence.
lntraorganizational dependence was a composite measure derived
from four factors :
(i) rating the degree of personalization of the organization's
origin,
(ii) rating its status according to whether it is a branch or
principal unit,
(iii) rating its public accountability, and finally,
(iv) rating its size as a percentage of the owning group.
Interorganizational dependence was a simple rating measure of the
amount of integration with suppliers or customers.
2.4. Power Control
The power control variable is one that has come into vpgue only in

-127-
recent times and was not considered by the Aston group and their
contemporaries. Power control as a structural imperative looks at
the organization purely in terms of those in power, . the dominant
coalition, selecting a structure that will maximize their control.
This viewpoint postulates that the dominant coalition is not neces
sarily synonymous with those who hold formal authority, and decision
making is always self-serving - even if it is couched in terms of
maximizing organizational effectiveness. (Robbins, 1987: 176-200).
2.4. 1. Operationalizing Power Control
An extensive literature search failed to reveal a worthwhile
gauge of power control. Pennings ( 1987: 223-240) suggested that
power control is the inverse of dependence, and so the negative
correlation between them should be strong. But this was not
really an effective measure of the power control variable, per
se. Accordingly, a perceptual scale was devised, based on
Robbins' ( 1987) definition, in which the presence or absence of 5
different factors was assessed.
The 5 factors were: (i) structural choices to enhance power, (ii)
structural constancy, (iii) self serving ideas, (iv) occasionally
·illogical strategies, (v) a dominant coalition differing from the
formal authority structure.
2.5. Environmental Uncertainty/Turbulence.
The best measures of environmental uncertainty and turbulence take
cognisance of historical trends and factor in the predictability,
frequency and amplitude of environmental change. Such comprehensive
measures are, unfortunately, predicated on longitudinal data and
were, therefore, not possible in this study.
In keeping with the cross-sectional nature of this study, environ
mental turbulence was a snapshot impression gleaned from a number of

-128-
respondents at a particular moment in time. No doubt the
aggregation of data enhanced the validity of this type of measure.
2.5.1. Operationalizing Uncertainty/Turbulence.
Once agatn perceptual measures were employed. Firstly,
respondents estimated the impact on their organizations of
sociopolitical and economic changes, and changes in work methods
and techniques. Secondly, a measure of the predicta~ility of 8
environmental influences was employed. These encompassed
operations technology, competitors' actions, market demand,
product attributes, raw material availability, government
regulations, labour union actions, and raw material prices.
Finally, a scale based on the research of Anshoff and Sullivan
( 1993) measured environmental change in terms of its familiarity,
rapidity, visibility, and complexity.
3. DEPENDENT VARIABLES.
A number of dependent or outcome variables have, again, through custom
and practice become entrenched as the core variables m organization
studies. These include the classic bureaucratic dimensions of speciali
zation, standardization, formalization and centralization. A factor
analysis performed by the Aston researchers found that specialization,
standardization and formalization were actually composite variables of
an underlying factor grouping which they dubbed Structuring of
Activities. (Pugh et al, 1968). Centralization formed part of a second
factor grouping which they called Concentration of Authority.
Other outcome variables which were used in this study included measures
of configuration and. span of control; measures of organic or
mechanistic structure after Burns and Stalker ( 1961); and, tinally,
measures of organizational climate drawn from Payne and Phesey's (1971)
Business Organizational Climate Index, or BOCI.

-129-
3.1. Structuring of Activities.
The constituent elements of the structuring of activities dependent
variable are :
specialization, or the division of labour m an organtza
tion
standardization, or the existence of rules that cover all
circumstances and that apply invariably
- formalization, or the extent to which rules, procedures,
instructions and communications are written down.
lntrinsically, formalization and standardization are two side of the
same coin, with formalization being an indication of the extent to
which standardization is committed to writing.
3.1.1. Operationalizing Structuring of Activities.
Structuring of activities was operationalized mainly by institu
tional measures. These consisted, firstly, of a straightforward
count from a predetermined list of the number of specializations
in the organization. Secondly, the number, type, usage and
distribution of documents was determined to gauge the amount of
formalization, also by means of a simple count from a
predetermined list
These measures were backed up by a simple perceptual measure of
the degree of standardization in the organization.
3.2. Centralization.
Centralization refers to the locus of decision making and reflects

-130-
the degree to which authority is concentrated at high levels within
the organization, or rests in controlling units outside the organiza
tion. Some studies have also found that distinguishing the nature
of decisions was also important. For example, technology as an
independent variable will trigger different types of decisions at
different levels in the organization. ( Azumi and McMillan, l 981 ).
3.2.1. Operationalizing Centralization.
The operational measure of centralization was primarily an ins
titutional ·procedure in which decisions from a predetermined list
were counted as being taken either within the organization or
outside the organization at a level higher than the Chief
Executive. In addition, questionnaire measures were used to sift
out perceptions of the type of decisions that were centralized
and the degree to which operating decisions were centralized.
3.3. Configuration.
Configuration variables relate to the physical shape of the
organization's structure. These were, in fact, the tirst variables
of interest to researchers. (Woodward, 1958). They include measures
of organizational depth and span, and ratios of production to
administrative and support staff.
3.3.1. Operationalizing Configuration.
Operationalized configuration variables consisted of simple
counts of the number of levels from the very top to the very
bottom of the organizatio.n, the number of direct reports to the

-I 3 I-
CEO, the ratio of direct workers to first line supervisors, and
estimates of the percentages of clerical, supervisory and direct
workers.
3.4. Organic and Mechanistic Structures.
The differences between organic and mechanistic structures, first
outlined by Burns and Stalker ( 1961 ), have been discussed at length
in organizational literature. They are summarized again below:
CHARACTERISTIC MECHANISTIC ORGANIC
Task definition Rigid Flexible
Communication Vertical Lateral
Formalization High Low
Influence Authority Expertise
Coritrol Centralized Diverse
Figure 5.1. Mechanistic and Organic Structures. (Robbins, 1987: 154)
3.4.1. Operationalizin~: Or~:anic and Mechanistic Structures.
The structuring of activities variables described earlier should,
obviously, be strong indicators of the degree to which an organi-
zation is mechanistic or orgamc. In addition, a questionnaire
measure (Covin et al, 1990: 507) was used in which the items in
figure 5. 1. acted as five poles on a continuum to which another 3
items were added : management style, reaction to change, and
attitude to procedures.

-132-
So the full operational definition of organic /mechanistic
structures is as summarized in figure 5.2.
CHARACTERISTIC MECHANISTIC ORGANIC
Task definition Rigid Flexible
Communication Vertical Lateral
Formalization High Low
Influence Authority Expertise
Control Centralized Diverse
Management style Uniform Free ranging
Reaction to change Precedent & principles Adapting freely
Procedures Strict adherence Getting things
done
Figure 5.2. Mechanistic and Organic Structures.
3.5. Organizational Oimate.
The Business Organization Climate Index (BOCI) was devised by Payne
and Pheysey (1971) specifically to test for relationships between
organizational climate and both the independent and dependent
variables of structure.· The · BOCI looks at the processual aspects of
structure and consists of 254 items which fall into 24 conceptual
groupmgs or scales. The scales are broadly classified under stx
headings authority, restraint, work interest, personal relations,
routine or control, and wider community.

-133-
3.5.1. Operationalizin& Or&anizational Climate.
Each of the BOCI scales consists of eight items in the form of a
four point scale ranging from definitely true to definitely
false. For the purpose of this study, the number of scales was
reduced from 24 to 9, giving a total of 72 items. These tested 5
of the 6 categories - excluding the category "wider community
orientation", which was not really relevant to this study.
So the nine scales that were used are :
1. Authority
(i) Leaders' psychological distance
(ii) Concern for employee development
(iii) Questioning authority
2. Restraint
(iv) Emotional control
3. Work Interest
(v) Scientific and technical orientation
(vi) lntellectual orientation
4. Personal Relations
(vii) Interpersonal aggression
5. Routine
(viii) Rules orientation
(ix) Readiness to innovate
The principle of goal relevance discussed in the previous chapter
was used to distil these nine scales. There is a good chance that
any or all will be of concern to the practitioner.
4. SUMMARY.
In this chapter the key concepts and variables were described and
operational definitions were discussed, in keeping with the precepts of

-134-
the scientific method. Strong reliance was placed on existing
Organization Theory concepts and operational definitions - although no
operational description of the power control variable could be found.
An original definition for this variable had to be developed.
In the next chapter the methods of gathering data that were used will
be outlined and the questionnaire and its composite items will be
examined. Brief attention will also be paid to the interview methods
and case studies that were used as an adjunct to the questionnaire.

CHAPTER SIX: COLLECTING THE DATA
1. INTRODUCTION.
Ultimately, this research report will be as legitimate as the data upon
which it is based and as reliable and valid as the instruments that
collected the data A number of key issues, therefore, had to he
addressed to preserve the integrity of the data collection process.
In the following sections the target population is defined and its
general characteristics discussed. Methods of eliciting information
from the target population are then considered; the prime method being
a comprehensive Questionnaire, which is examined in some detail.
Some limited use was also made of case study and interview techniques
which were confined to key informants in high technology industries and
to companies in the Allied Electronics group.
2. THE DATA BASE.
The Bureau of Market Research of the University of South Africa has a
data base which it calls the Standard Industrial Classification of all
Economic activity, or SIC. In the category Manufacturing there
are records of 14 964 organizations, and it
that the research population was drawn.
was from this data base
That the population was
confined to manufacturing organizations was a deliberate decision. It
was felt that the effects of technology as a causal variable were
likely to be significant in manufacturing organizations and, therefore,
more apparent and measurable than in, for exampie, service or retail
organizations.
The types of activities embraced by organizations classified under the
SlC's heading of Manufacturing includes food, beverages and tobacco;
textiles and clothing; wood including furniture; paper, printing and

-136-
publishing; industrial chemicals, plastics and refineries; glass and
non-metallic substances; iron, steel and non-ferrous metals; and
electrical machinery, machinery, motor vehicles, fabricated metal
products and scientific equipment. A full breakdown of the number of
companies in each activity is provided as Annexure I.
The geographical dispersion of manufacturing organizations tn the
SIC's data base is illustrated in figure 6.1. below. Although the
areas are based on designations prior to the recent provincial
demarcations, the geographical groupings employed are, nevertheless,
quite analogous to the nine new provinces of South Africa.
Geographical Area
Cape
Northern Cape
Orange Free State and Qwa Qwa
Eastern Province
Natal and KwaZulu
Eastern Transvaal and KaNgwane
Northern Transvaal, Gazankulu & Lebowa
PWV and KwaNdebele
Western Transvaal
Other
Totals
Number
2 282
235
537
968
2 644
444
303
6 732
348
269
14 964
Figure 6.1. Geographical dispersion of SIC manufacturing organizations.
%
16,6
1,6
3,6
6,5
17,7
2,9
2,0
45,0
2,3
1,8
100,0
It will be seen that the regions of the Cape, Natal KwaZulu, and the PWV
(Gauteng) between them account for 80% of all manufacturing activity,
with Gauteng alone soaking up 45%.
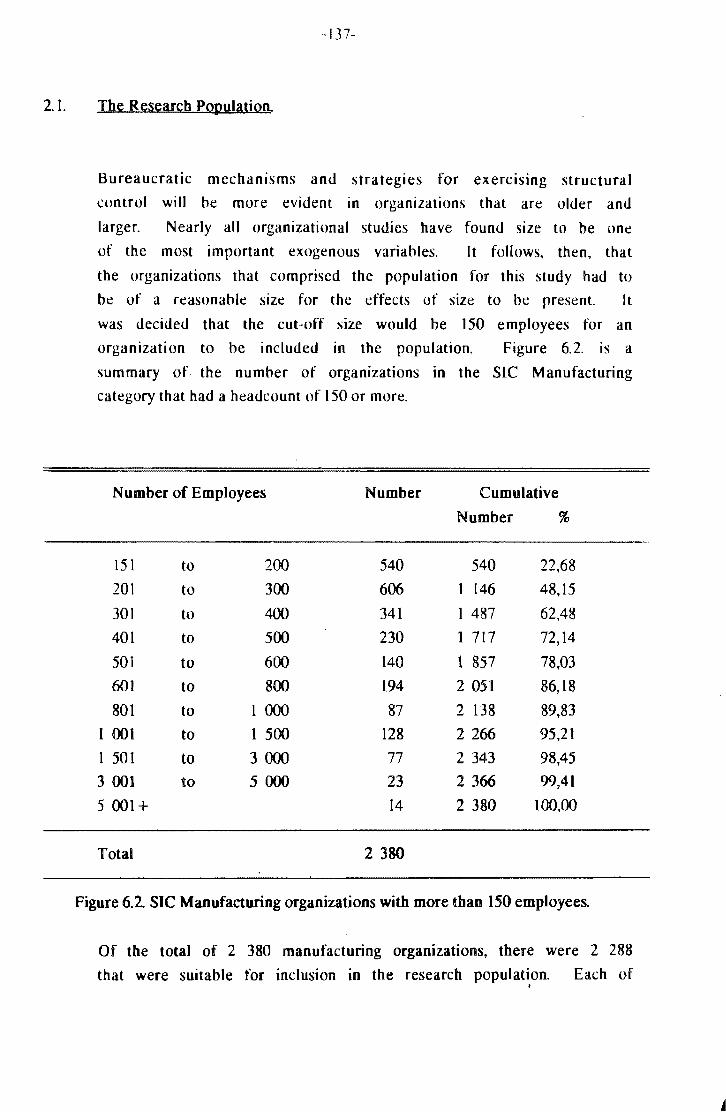
-137-
2. 1. The Research Population.
Bureaucratic mechanisms and strategies for exercising structural
control will he more evident in organizations that are older and
larger. Nearly all organizational studies have found size to be one
of the most important exogenous variahles. It follows, then, that
the organizations that comprised the population for this study had to
be of a reasonahle size for the effects of size to he present. It
was decided that the cut-off size would be 150 employees for an
organization to he included in the population. Figure 6.2. is a
summary of the number of organizations in the SlC Manufacturing
category that had a headcount of I 50 or more.
Number of Employees Number Cumulative
Number %
151 to 200 540 540 22,68
201 to 300 606 I 146 48,15
301 to 400 341 I 487 62,48
401 to 500 230 1 717 72,14
501 to 600 140 1 857 78,03
601 to 800 194 2 051 86,18
801 to l 000 87 2 138 89,83
l 001 to 1 500 128 2266 95,21
l 501 to 3 000 77 2 343 98,45
3 001 to 5 000 23 2366 99,41
5 001+ 14 2 380 100,00
Total 2380
Figure 6.2. SIC Manufacturing organizations with more than 150 employees.
Of the total of 2 380 manufacturing organizations, there were 2 288
that were suitable for inclusion in the research population. Each of •

-138-
these organizations was contacted and the total number of responses
from this population then became the research sample.
2.2. Overcomin~ Samplin~ Bias.
By including all of the organizations from the SIC data base that com
ply with the criteria of (i) falling into the manufacturing category,
and (ii) having more than 150 employees - i.e. a complete census, and
not a smaller, stratified sample - it was considered that problems
associated with sampling bias would be overcome. The analysis in the
following sections seems to indicate that this was indeed the case
and the eventual aggregate of respondents which would comprise the re
search sample was clearly representative of the research population.
A final factor affecting possible bias has to do with the integrity
of the Bureau of Market Research's SIC data base. Assurances were
given by the Bureau that their data base is the largest and most
current of its kind in South Africa, outside of the bureau of
statistics of the Department of Manpower.
2.3: Characteristics of the Sample and the Population.
The SIC data base provides three key parameters by which constituent
organizations can be described and compared. They are: the size of
the organization, the development region in which it is situated,
and, finally, its type of activity as indicated by its SIC code.
It was felt that a reasonably high response rate of 528 returned ques
tionnaires enhanced the representativeness and generalizability of
the data The raw data upon which the following analysis and graphs
are based is contained in annexure 2. The criteria used for includ-
ing questionnaires were very strict. If, for example, a respondent
failed to complete just one section or scale, the entire question
naire was discarded. The final number of usable questionnaires was
458 or 22 %. Annexure 2 details this computation.

-1 J<)-
2.3.1 The Size of Or~anizations in the Sample and the Population.
The size codes that are used by the SIC are set out below :
Size code Number of Employees
13 151 200 14 201 300 15 301 400 16 401 500 17 501 600 l~ 601 ~uu l~ MOl 1000 20 1001 1500 21 1501 JUOO 22 3001 5000 23 5001+
Using these stze codes it was possible to plot a comparative bar
chart of the size of organizations in both the sample and the
population. This is illustrated in figure 6.3 below.
Percentage of Total
0 5 10 15 20 25 30
Size Code
~population ~sample
Figure 6.3. Employee size groups of sample and population.
lt becomes apparent that the correspondence between the distribu
tion of organizations of a similar size within the sample and the

-140-
population was very close. ln both cases the majority of
organizations fell within the code 14 category, followed by codes
13, 15, and 16, respectively.
The degree to which the s1ze of organizations m the sample can be
regarded as predicting the size of organizations in the population
can be gauged by the Pearson correlation coefficient between the
range of scores in both; which, in this case, was 0,997. This ind
icated that the association between the sample and the population
along the parameter of organization size was almost perfect.
2. 3. 2. The Type· of Industries in the Sample and in the Population.
Percentage
of Total
A similar comparison between the types of industries m both the
sample and the population is shown in figure 6.4.
15
14 ~
~ Br 12 ~
I
11~ 10~
I 9i- R 8~
~ i 71-
6~ ~ 5
4
3 2
1
0 300 312 314 322 324 332 342
311 313 321 32..1 331 341 351 353 355 361 369 372 Standard Industrial
~ population ~ sample Classification Codes
Figure 6.4. Types of industry in the sample and the population.
Although the association between the types of industries that
compose the sample and the population is not as close as that of
size; it is, nevertheless, quite compelling with a correlation

-141-
coefficient of O,H67.
2.3.3. The Development Regions ofthe Sample and the Population.
The final comparison between the characteristics of the population
and the sample concerns the geographical regions from which they
were drawn. This is shown in figure 6.5. below.
Development
Region
Percentage of total
0 10 20 30
~population ~sample
40
Figure 6.5. Geographic regions of the sample and the population.
50
It will be seen that the association between the sample and the
population with respect to their geographic dispersion throughout
the country was also very strong. A correlation coefticient of
0,989 indicated that there is substantial predictability between
the two groups along this dimension.
Taken as a whole, then, it can be said with confidence that the
sample and the population are comparable along three descriptive
dimensions. There is, therefore, ample justitication for generali
zing the results of this study to the population from which it is
drawn.

-142-
3. THE QUESTIONNAIRE.
The guiding principle in putting together the Questionnaire (attached to
this report as Annexure 3) has been described most effectively by Sudman
and Bradburn (1982: 119-120) :
The best advice we can offer to those starting out to w r i t e ... q u est i on s is to p I a g i a r i z e. Wh i I e plagiarism is regarded as a vice in most matters, it is a virtue in questionnaire writing - assuming, of course, that you plagiarize good-quality questions . ... You can spare yourself much agony over the formulation ... and extensive pretesting. If the questions have been used frequently before, most of the bugs will have been ironed out of them.
Of course plagiarism is a strong word and implies theft of another's
ideas without acknowledgement. This was not the intention of this study
and full acknowledgement is given for all scales used and adapted in the
Questionnaire.
The following paragraphs will deal with each individual section of the
Questionnaire.
3. 1. Section 1: Size and Dependence.
All the scales used in the first section were either original Aston
measures or modifications of the abbreviated Aston scales. (lnkson et
al, 1970). They were designed to put numbers to the independent
variables of Size and Dependence. As discussed in the previous
chapter, size was expressed as the natural logarithm of total
headcount Dependence was expressed as the sum of the scores on the
sub-scales of origin, status, public accountability, and, finally,
size relative to owning group. ·
The Aston model was modified m that a fourth category was added to
the public accountability scale - that of ownership by a foreign

-143-
multinational. There was obviously no call for such a category in
the original British sample. Scoring on the individual items was
also different in that, whereas Aston numbered from 0 to 3, this
study numbered from l to 4. This meant that it was impossible for an
organization to score zero for dependence. This apparent anomaly was
created because it was considered that respondents may be
uncomfortable choosing 0 as an option on the Questionnaire. The
original Aston scales were in the form of interview schedules and so
this problem did not arise for them.
In any event, for the statistical techniques that were used to test
for relationships it was felt that consistency in application and
relative scores were more important than absolute scores.
3.1.1. Reliability and Validity.
The developers of the abbreviated scales, lnkson et al ( 1970), ran
tests on the same sample of 52 organizations as the original Aston
studies and obtained very high correlations with the original
study. Dependence, for example, had a correlation of 0,91 with
the original research. Studies throughout the world have
demonstrated the replicability and integrity of the Aston measures
in general. (Hickson and McMillan, 1981).
3.2 Section 2: Technol<>i)'.
The measurement of technology has been a contentious nssue in organi
zational research. Consequently, methods and operational detinitions
have differed widely. It was, therefore, decided to follow the
example of the Okayama study (Marsh and Mannari, 1981) and to use two
diverse measures: firstly the Aston measure, entitled Workflow
Integration, and then a scale called Process Technology, developed by
Khandwalla and also used by the Okayama researchers. (Marsh and
Mannari, 1981).

-144-
Scoring on the workflow integration scale was simply the sum of the
responses in the two columns, indicating the automaticity of the bulk
of equipment and the most automated single piece of equipment. The
score for process technology was arrived at by multiplying the
incremental number assigned to each type of technology by the extent
of its usage and then summing all of these to obtain an overall
score.
3.2.1. Reliability and Validity.
The workflow integration scale has exhibited very high test-retest
and unidimensionality coefficients of 0,96 and 0,79, respectively.
Factor analysis has revealed a large first factor accounting for
53% of variability, with all items loading signiticantly on this
factor with a mean loading of0,76. (Stewart et at, 1981: 1.2[ I)).
As to the Khandwalla process technology scale, Singh (1985:
800-812), in a critique of the Okayama study, maintained that
process technology was actually a better measure than worktlow
integration and explained 40% more variance.
3.3. Section 3: Structural Control and Environment
The term structural control was used in preference to power control
as it is more neutral and possibly has fewer negative connotations.
For this reason the power control scale was also combined with a six
item organization change scale of Lincoln and Zeitz ( 1980). Items I
to 9 of section 3.1. comprised the power control scale and items 10
to 15 were the organization change scale. The predictability meas
ure, section 3.2., was taken straight from Robbins (1987: 162) with
only minor amendment to the scoring system to make it more explicit.
The Anshoff and Sullivan (1993) scale was reworded to suit an African
context and by adding the qualifier "operating" to the word "environ
ment" throughout This was important because it was felt that the

- !45-
recent momentous political changes would intluence most respondents
to rate their environments as being very turbulent. This would
obviously skew the measured effect of environment on organization
structure. The introduction to this item also attempted to focus
respondents' minds on the operating environment, hut with limited
success. The recent political changes undoubtedly did colour
perceptions of the operating environment and this no doubt affected
the scale's reliability, as will he seen later in this report.
Scoring on each of the four scales was a straightforward total of the
responses checked. Item 4 on the power control scale was negatively
keyed.
3.3.1. Reliability and Validity.
Lincoln and Zeitz (I 980) unfortunately did not provide any
information on their organization change scale, and the power
control scale is original and was tested for the tirst time in
this study. Robbins ( t 987) offered his predictability scale with
no comment except to say that it provides a "reasonably good
guide" for assessing environmental uncertainty.
Sullivan (1993) offered no information on their scale.
3.4. Section 4: Structuring of Activities.
Anshoff and
The items in section 4 of the Questionnaire begin to tum the spot
light onto the dependent variables by presenting scales for function
al specialization, formalization, standardization and configuration.
The functional specialization scale was a development by Reimann
(Stewart et al, 1981) of the original specialization index of the
Aston researchers. Formalization was measured by an adaptation of
the original Aston scale, as was contiguration. The standardization
scale was drawn from the work of Hage and Aiken. (Price, 1972: 151).

-146-
Scoring of specialization was a simple count of the number of yes
responses and formalization was scored as the total of the responses
marked. For items 4 to 9 each yes response counted 1. Standardiza
tion was scored as the total of the responses; the first and second
items were negatively keyed. Finally, the configuration variables
were scored as discrete numbers for the first three items and ratios
for the second three. No summing of individual items took place in
this case.
3.4.1. Reliability and Validity.
On the structuring of activities variables, a test-retest reliabil
ity exercise carried out in the United Kingdom displayed a correla
tion of 0,97. (Inkson et al, 1970). Commenting on Hage and
Aiken's standardization scale, Stewart et at ( 1981 : 2. 9f2 I) said
that, while reliability data was sparse, the scale's validity was
good.
3.5. Section 5: Centralization.
Centralization and its relationship to other variables has also been
the subject of much debate in Organization Theory circles. The point
was made earlier that it is important to distinguish between the
~of decisions that are centralized.
To this end, Inkson et at's ( 1970) autonomy scale was supplemented by
two further measures. These were a decision making discretion scale
from Robbins (1987) and a policy decision scaJe by Reimann (Stewart
et al, 1981).
Scoring for autonomy was by means of a binary scale, i.e. decisions
that are made inside the organization were scored as I and decisions
made by levels above the chief executive were scored 0. The total
score out of 23 indicated the degree of autonomy or decentralization.

147-
Robbins'( 1987) decision making and discretion scale consisted of a
total of ten 5-point items. The sum of the scores on these items
indicated the degree of centralization out of a possible 50.
Finally, Reimann's policy decision making scale also consisted of a
total of six 3-point items. There were no negatively keyed items and
the total score out of 18 indicated the degree to which authority was
concentrated in fewer people at higher levels.
3.5. l. Reliability and Validity.
The autonomy scale has, according to Price ( 1972: 41-41 ), been
subject to the rigours of test and retest validity and has proven
to have high levels of reliability and validity. There was no
information available on Robbins' decision making and discretion
scale. Reimann's policy decision making scale was described by
Stewart et at ( 1981) as being of acceptable reliability and
adequate validity.
3.6. Section 6: Organicity.
The 7-item Organicity scale developed by Covin et al (1990) was based
on a similar scale devised by Khandwalla to assess an organization's
tendency to organic or mechanistic structure. The mean score across
all seven items was the organization's organicity score. The higher
the score out of 7, the more organic the organization's structure.
3.6.1. Reliability and Validity.
There was no information available on the organicity scale's relia
bility and validity. However, it was expected that the items on
the scale would be highly correlated with the structuring of activ-

-148-
ities variables and one would expect to see a strong negative
relationship between the structuring variables and organicity.
3. 7. Section 7: Organization Climate.
1.
2.
3.
4.
5.
The mne scales chosen from the 24 comprising the Business
Organization Climate Index were combined under a single section of
the questionnaire. In all cases, the scales comprised 8 items scored
along a 4-point continuum. The scoring system was a simple total of
all the responses, with scores for negatively keyed items being
reversed. The BOCI scales used are summarized in figure 6.6.
Scale Items Negatively keyed
Items
Authority
Leaders' Psychological Distance 17 to 24 None
Concern for Employee Involvement 25 to 32 28,29 and 30
Questioning Authority 65 to 72 69
Restraint
Emotional Control 49 to 56 49, 50, 51,54 & 56
Work Interest
Scientific & Technical Orientation 1 to 8 3 and 4
Intellectual Orientation 8 to 16 10, 11 and 12
Personal Relations
Interpersonal Aggression 41 to 48 42
Routine
Rules Orientation 57 to 64 60 and 63
Readiness to Innovate 33 to40 33, 34, 35,37 & 39
Figure 6.6. Summary of BOCI scales used in the Questionnaire.
3. 7.1. Reliability and Validity.
Stewart et al (1981) have provided extensive information on the

-149-
validity and reliability of the BOCI scales. These are summarized
below in figure 6. 7.
Scale Reliability Validity
1. Authority
Leaders' Psychological Distance poor acceptable
Concern for Employee Involvement good not clear
Questioning Authority acceptable acceptable
2. Restraint
Emotional Control adequate unclear
3. Work Interest
Scientific & Technical Orientation good good
Intellectual Orientation good uncertain
4. Personal Relations
Interpersonal Aggression good acceptable
5. Routine
Readiness to Innovate good suspect
Rules Orientation acceptable good
Figure 6.7. Reliability & validity of the BOCI scales (Stewart et al, 1981)
3.8. Section 8: Dem~aphic and Backi:round Information.
Apart from the usual question on the position of the respondent, this
section also called for information on the organization's life cycle
stage, major industry and sector, age, and approximate turnover. U
was felt that any or all of these factors could prove important from
the point of view of controlling for extraneous variables - or even
testing additional hypotheses that may have occurred in the course of
the research. Conceivably, life cycle stage, type of industry, and
age of the organization could all have some effect on structuring of
activities.
In addition, an abbreviated scale to test for interorganizational or
external dependence was included. (Hickson and McMillan, 1981: 202).

-150-
The information derived was used to supplement hypotheses testing,
using dependence as an independent variable.
3. 8. 1. Reliability and Validity.
Most of the items m the last section were straightforward
institutional measures and were considered, therefore, to be very
reliable and valid. Hickson and McM ill am ( 1981) offered their
abbreviated measure of external dependence without comment on its
reliability or validity. They did say that it was a useful
research· concept and that organizations in different cultures
differed sharply in their reactions to external dependence.
(Hickson and McMillan, 1981: 182-183).
3. 9. Administration of the Questionnaire.
The questionnaire was printed on good quality paper usmg a double
sided format to minimize its bulk. Labels for the 2288 organizations
that comprised the research population were purchased from the Bureau
of Market Research and these were aftixed to sturdy A4 size envelopes
so the questionnaire would not be folded.
posted together with a carefully drafted
stamped return envelope. The covering letter
and covered the following points :
what the study is about and its usefulness
why the respondent is important
Each questionnaire was
covering letter and a
was one page in length
promise of confidentiality and explanation of identification
number
reward for participation
what to do if questions arise·
thanks to the respondent
An example of the covenng letter ts included as annexure 4 to this
report.
-151-
Some of these points were reiterated in the introduction to the
actual questionnaire, and willingness to share the results of the
research was communicated both in the covering letter and tn the
questionnaire.
The data capture of completed questionnaires was carried out by the
researcher over a three month period. The format used was a
Lotus l23 spreadsheet which is compatible with most statistical
software packages. It also allowed for the inclusion of formulae to
calculate item totals, to reverse negatively keyed items, and to
perform ad hoc manipulations of data before they were downloaded
onto the statistical software package.
The statistical software package that was used was SPSS/PC+. This
package was acquired after extensive consultations with experts in
the fields of computer software and statistics. Statisticians from
both the Graduate School of Business Leadership as well as the
Department of Statistics of the University of South Africa commended
the choice of SPSS /PC+ as the software package.
3.10. Pilot Study.
A pilot study was carried out on 23 respondents drawn from vanous
industrial organizations on the East Rand as well as from the
membership of management forums to which the writer belongs.
The Questionnaire was generally well received and very few problems
were experienced by the participants. The problems that arose were
minor and were addressed by rewording the instructions to the
Technology scales slightly, and by repositioning the centralization
scales. One centralization scale was found to be redundant and was
dropped from the final Questionnaire.

-l52-
4. CASE STUDIES AND INTERVIEWS.
Case study material was assembled and interviews conducted specifically
with a view to providing clarity on the research problem which concerned
the relationship between organic structures and high tech. industries,
which seemed to be different in South Africa than in developed
countries.
Case studies were confined to companies in the Allied Electronics group
of companies where, because the researcher is an employee of the group,
access did not prove to be a problem.
Similarly, interviews were carried out with key informants within the
electronics industry. The following persons were approached and
indicated their willingness to assist:
(i) Dr David Jacobson, Technology Executive of the Altron
group,
(ii) Mr Gerard Morse, Senior General Manager of the
Industrial Development Corporation and Chairman of the
Standing Committee for the Electronics Industry; and
(iii) Mr Dirk Desmet, General Secretary of the Electronics
Industries Federation.
As was anticipated, all of the information elicited by case studies and
interviews was qualitative rather than quantitative and did not form
part of the quantitative tests for relationships between structural and
environmental variables, nor was it be used to test specific hypotheses.
Nevertheless, the qualitative information that was gleaned not only
proved interesting in itself but provided some valuable insights and
possible explanations for the seeming aberrations within South African
Organization Theory.

-153-
5. SUMMARY.
This chapter has dealt with the collection of the data. The method that
was used to define the research population was described and the method
of extracting a representative sample was discussed. The research
population comprised the entire src data base of 2380 manufacturing
organizations who have more than 150 employees, and the research sample
was the total of 528 organizations who responded to the questionnaires.
An analysis of the characteristics of the sample and the population
indicated a high degree of consonance between critical aspects of both
groups; gtvmg rise to the assertion that the findings of this research
can be generalized to the population with a considerable amount of
confidence.
The Questionnaire was considered on an item-by-item basis and the origin
of the various measures or scales was discussed, together with the
scoring methods for every scale and, where available, information on
their reliability and validity was also provided. The results of a
pilot study were briefly outlined. Proposed interview and case study
methods to elicit qualitative information were also brietly touched on.
ln the following chapter the emphasis falls on the quantifiable
information which tlowed from the questionnaire, and the processing and
treatment of the research data is considered in more detail. The
chapter consists in large part of a comprehensive item analysis of the
scales used in the questionnaire and considerable attention is paid to
establishing the reliability, validity, multidimensionality and
integrity of the data

CHAPTER SEVEN: PROCESSING AND TREATMENT OF THE DATA.
1. INTRODUCTION.
The intention of this chapter is to provide a detailed account of the
statistical processes and data treatment methods that were used in this
study. Although it is important to have an understanding of what stat
istical procedures to use, when to use them and why one should use
them, no claims are made to expertise in how to design and structure
sophisticated statistical models. Fortunately, in this day and age the
availability of· advanced computer software packages has largely taken
care of this problem. As was stated earlier, the computer software used
in this study was SPSS I PC+ (Statistical Package for the Social Sciences)
Release 5.
In the end, though, it is also important to remember that this thesis is
about Organization Theory and not about statistical methods used
in organizational studies.
Even so, a lot of emphasis will be placed on the analysis and evaluation
of the measuring instruments. As far as is known, most of the scales
were used for the first time in South Africa and some of the modifica
tions and original scales were being used for the first time anywhere.
The following sections will begin by outlining the statistical steps
that were followed; before moving on to address the analyses of the
results obtained by the various scales. These analyses consist of a
tabular framework setting out the critical correlations and factor and
item analyses for all the dependent and independent variables. This
tabular framework will then be carried over into the next chapter where
the relationships postulated in the research hypotheses will be tested.
2. STATISTICAL PROCESSES.
The statistical analyses carried out 10 this study involved three
stages:
(i) testing the reliability and validity of the scales,
(ii) testing the scales for multidimensionality by

-155-
searching for underlying factors, and, finally,
(iii) multiple regression analysis of the independent and
dependent variables.
Each of these stages is briefly discussed below.
2. 1. Reliability of the Scales.
Insofar as assessing reliability is concerned, this was accomplished
by using either Cronbach's Coefficient Alpha or the Kuder-Richardson
Formula 20,' depending on whether or not the items on the scale were
dichotomous. Estimation of the validity of each scale formed part
the factor analysis exercise. See section 2.2. below.
Coefficient Alpha was used for all non-dichotomous items. It is
based on the mean split-half correlation coefficient implying all
possible permutations of the split half:
rkk _k_ k - 1
where k is the number of items on the scale, Esi 2 is the
sum of the variance of item scores, and
all k items on the scale.
sx2 is the variance on
The Kuder-Richardson Formula 20 is a widely used index of
internal consistency and can he regarded as a special case
Coefficient Alpha for items that are scored dichotomously:
rll _k_ k - 1

-156-
where
pi
qi
the number of items on the scale the variance of total scores on the scale the proportion of positive responses I - pi the proportion of negative responses
2.2. Multidimensionality and Validity of the Scales.
All of the scales that consisted of a number of composite items were
examined to establish the extent to which they included one or more
dimensions. Factor analysis was used for this examination.
Multidimensionality was expected in the structural and organizational
climate scales because they contained items which are grounded in
global concepts.
Clark ( 1990), in a Canadian application of the Aston methodology,
said that there are two grounds for distinguishing between Principal
Component Analysis (PCA) and Principal Factor Analysis (PFA).
Firstly, PCA assumes that all variation can be explained in terms of
common factors, whereas PFA assumes that each variable has its own
unique variation which cannot be explained in terms of common
factors. Secondly, PCA is a data reduction technique whereas PF A
describes the data.
Hair et al (1979: 224-225) pursued this distinction by describing
the variance that is extracted or lost in either method. PCA methods
incorporate total variance, which is comprised of three aspects:
common variance, or the variance in a variable which is shared with
all other variables, specific variance, or the variance associated
with only one variable, and error variance, or variance due to data
gathering inaccuracies. PF A methods, on the other hand, incorporate
only the common variance of the analysis and exclude both the error
and specific variances. In practical terms, this is accomplished by
inserting communalities in the diagonal of the correlation matrix
upon which the factor analysis is based - rather than inserting the
more usual unities.

-157-
In this study it was decided to use both PCA and PF A meth.ods, as
deemed appropriate, with varimax rotated solutions in a search for
simple, interpretable factors.
Factor analysis methods were also used to establish the validity of
the scales. (Brown, 1976: 132-133). It was possible to assess both
their construct validity and content validity by using PCA
and PF A techniques, respectively.
2.3. Multiple Regression Analysis of all the Variables.
In the original Aston study, a forward selection procedure was used
m the multiple regression exercise to explain the effect on
structural factors exercised by contextual variables. This meant
that only the variable that would make the most significant addition
would be added to those already in the equation.
This is not an entirely satisfactory procedure and could even he
misleading as the significance of variables already in the regression
alters as the exercise continues. For example, Clark (l990) found
that the contextual variable of size was the most important single
predictor of formalization. However, after including two more
significant variables size became and remained insignificant
Consequently, a "step-wise" regression procedure was preferred for
this study. In other words, variables no longer making a significant
contribution were removed from the regression at each step before any
new and potentially significant variables were added. This involved
both the forward selection and backward elimination procedures. The
default criteria for the inclusion or elimination of variables into
the regression equation were those recommended by both the SPSS /PC+
software as well as · statistical experts from the University of South
Africa. The regression procedure is discussed in more detail in
chapter 8.

-158-
3. A FRAMEWORK FOR PORTRAYING ORGANIZATION VARIABLES.
The following pages provide the framework within which the analysis of
the data gathered by the scales and measures used in the questionnaire
took place. Firstly, the dependent variables will be examined and
tables illustrating the reliability and multidimensionality of all the
scales will be set out.
Thereafter, the independent or contextual variables will be examined.
Again, reliability data will be displayed and discussed together with
factor analyses, item analyses and intercorrelations for each scale.
3.1. Dependent Structural Variables: Reliability.
1.
2.
3.
4.
5.
After the raw data gathered from the Questionnaire resp<,mses were
loaded onto a computer data base, a number of statistical manipula
tions and operations were carried out. The results with respect to
the dependent, structural variables are illustrated below, beginning
with reliability values.
SCALE ALPHA <r KUDER-RIOiARaiDN
Functional Specialization 0,853
Formalization 0,811
Standardization 0,791
Centralization
autonomy I decentralization 0,865
decision making discretion 0,774
policy decision making 0,715
Organicity 0,788
Figure 7.1. Reliability of Structural Scales.

-159-
Reliability data, i.e. the results of either the Kuder- Richardson or
Coefficient Alpha analyses are displayed in figure 7. I. In hi~ Cana
dian study, Clark ( 1990: 49) indicated that a reliability coefficient
of 0,75 or higher was desirable; but for an exploratory study (such
as this one) a level of0,60 or higher would be acceptable.
Taken as a whole, then, the scales measuring the dependent variables
showed an entirely acceptable level of reliability. Interestingly,
the three scales exhibiting coefficients better than 0,80 were all
Aston measures; reflecting, in what is probably its first South
African application, the soundness and wide applicability of the
Aston methodology.
3.2. Dependent Structural Variables: Multidimensionality and Validity.
The results of factor analyses carried out on each of the structural
scales are displayed in Figures 7.2 through Figure 7.8. In evalua
ting whether or not the factor loadings are significant, the criteria
proposed by Hair et al ( 1979 :234-235) were followed in this
study. In brief:
the larger the sample size the sma11er the loading for it to be
considered significant;
the larger the number of variables the smaller the loading for
it to be considered significant; and
the larger the number of factors the larger the loadings on
later factors need to be for them to be considered signiticant
Hair et al ( 1979: 234) said that, in general, a loading of 0,30
is considered significant, a loading of 0,40 is considered more
significant, and, finally, a loading of 0,50 is considered to be very
significant These estimates can shrink considerably as the sample
size increases and · Hair et al spoke of loadings of 0,15 being
significant at the one percent level if the sample size exceeds 300.
The large sample size of this study enabled the use of stricter crite-

-160-
na to evaluate the significance of loadings; and so only factor load
ings in excess of 0,30 were considered to be significant. It was
also felt that applying such rigorous norms would enhance the
credibility of any comments that are made with respect to a scale's
validity.
3.2. 1. Functional Specialization.
I Item Factor 1 Factor 2 Factor 3! I
I Public Relations 0.08581 0.46418 o.t907o 1
! Sales 0.64049 O.ll511 0.059231
I Transport 0.34970 0.15455 -0.00539
I Employment 0.34378 0.23480 0.57052 I Education & Training 0.09597 0.28665 0.63625 I Welfare 0.19954 0.33328 0.64297 I
i Purchasing 0.67140 0.10547 0.16584
I Maintenance 0.44525 0.11860 0.20178 I 1 Accounts 0.77957 0.01445 0.06939
· Production Control 0.46322 0.16469 0.25679 i
I Inspection 0.49105 0.12420 0.29435 i I Methods 0.12778 0.40911 0.29190 i ! Research/Development 0.14896 0.45055 0.23577 1 Records 0.22301 0.45798 0.12887
Legal/Secretarial 0.08474 0.63837 0.07219
Market Research 0.07350 0.69684 0.176261
MIS 0.39056 0.37297 0.25550
I Rotated Factor Matrix: Varimax converged in 6 iterations.
Figure 7.2 Functional Specialization: principal factor analysis
The principal factor analysis for the first of the structural
scales - that of Functional Specialization - is set out in tigure
7.2. It will be seen that every variable, or item, has at least
one significant loading and that three easily identifiable factors
emerged.
These were labelled :
Factor l: Core Activities throughput and airect support

-161-
Factor 2: Ancillary Activities
Factor 3: Human Resources
boundary spanning and indirect
support
procurement, development and
care of people.
An indication of the construct validity of the functional
specialization scale can be gauged by looking at the stze of the
first factor that was extracted by the PCA method and the amount
of variance that it explains. It is quite large and accounts for
30,3% of the total variance - and, taken together, all three
factors account for 48,5% of variance.
On the whole, then, the Functional Specialization scale can be
regarded as a reasonably valid measure of specialization. The
three underlying critical areas of business activity that are
illustrated in the principal factor analysis also point to an
acceptable level of content validity. Alpha coefficients for the
three factors extracted were calculated and these were as follows:
FACTOR ALPHA COEFFICHENT
Factor 1:
Factor 2:
Factor 3:
3.2.2 Formalization.
Core Activities
Ancillary Activities
Human Resources
0,7906
0,7352
0,7585
Turning now to the factor analysis of the Formalization data
(figure 7.3), it is evident that all of the variables except one
load significantly on at least one factor. Three factors were
extracted by the PF A method:
Factor 1 :
Factor 2:
FlJctOr 3:
Formalization of roles and relationships
Formalization of procedures and policies
Formalization of information and organization
renewal.
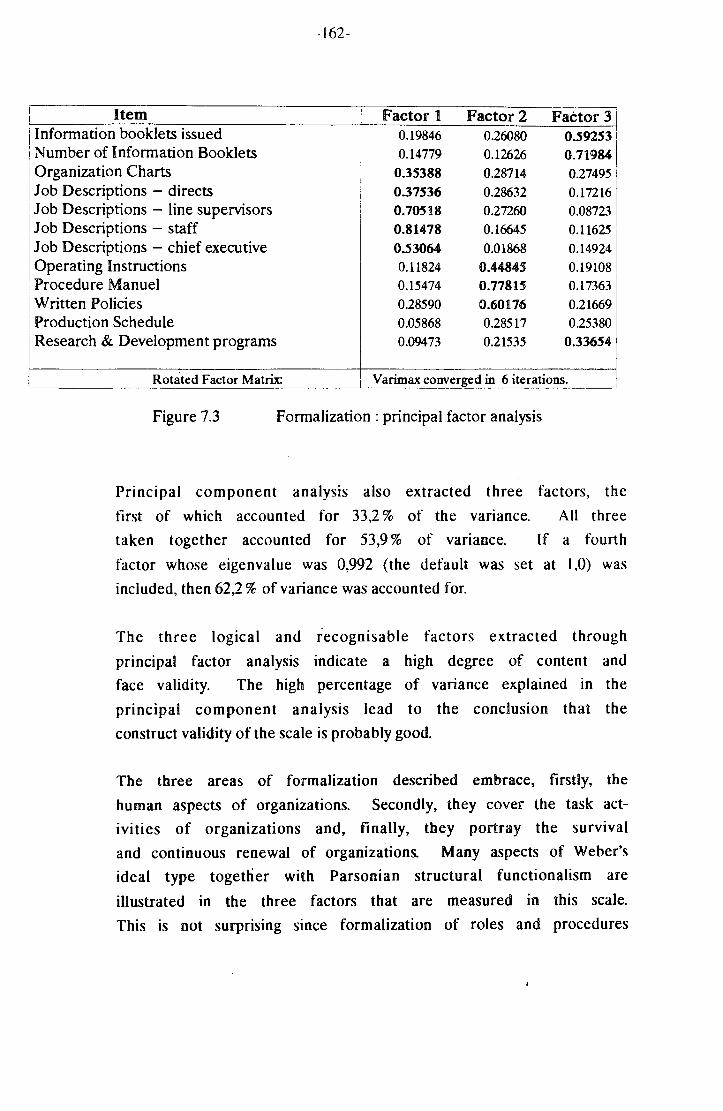
l Itenn 1 Information booklets issued i Number of Information Booklets Organization Charts Job Descriptions - directs Job Descriptions - line supervisors Job Descriptions - staff Job Descriptions- chief executive Operating Instructions Procedure Manuel Written Policies Production Schedule Research & Development programs
Rotated Factor Matrix:
-162-
Factor 1 Factor 2 Factor 31 0.19846 0.26080 0.59253'
0.14779 0.12626 0.7li984 0.35388 0.28714 0.27495 0.37536 0.28632 0.17216 0.70518 0.27260 0.08723 0.81478 0.16645 0.116251 0.53064 0.01868 0.14924 0.11824 0.44845 0.19108 0.15474 0.77815 0.17363
0.28590 0.60176 0.21669
0.05868 0.28517 0.25380
0.09473 0.21535 0.33654
Varimax converged in 6 iterations.
Figure 7.3 Formalization : principal factor analysis
Principal component analysis also extracted three factors, the
tirst of which accounted for 33,2% of the variance. All three
taken together accounted for 53,9% of variance. If a fourth
factor whose eigenvalue was 0,992 (the default was set at I ,0) was
included, then 62,2% of variance was accounted for.
The three logical and recognisable factors extracted through
principal factor analysis indicate a high degree of content and
face validity. The high percentage of variance explained in the
principal component analysis lead to the conclusion that the
construct validity of the scale is probably good.
The three areas of formalization described embrace, firstly, the
human aspects of organizations. Secondly, they cover the task act
ivities of organizations and, finally, they portray the survival
and continuous renewal of organizations. Many aspects of Weber's
ideal type together with Parsonian structural functionalism are
illustrated in the three factors that are measured in this scale.
This is not surprising since formalization of roles and procedures

Factor 1:
Factor 2:
Factor 3:
-163-
lies at the nub of Weberian Bureaucracy. And in terms of the
structural functional viewpoint, formalization presents an
effective strategy to overcome the preservation and renewal
challenges of adaptation, goal attainment, integration, and
pattern maintenance.
The Alpha Coefficients for the three factors that were extracted
were:
FACTOR
Formalization of roles and relationships
Formalization of procedures and policies
Formalization of information
ALPHA COEFFICIENT
0,7415
0,6925
0,6102
3.2.3. Standardization.
The objectives of factor analysis are, tirstly, to parsimoniously
represent relationships among sets of variables and, secondly, to
extract factors that are meaningful and interpretable. The stand
ardization scale resulted in a single factor solution and all the
Item Factor 1 [Aunountofroutine 0.43793
People do the same job every day 0.60641
Variety of work 0.69654
Most jobs have something new 0.82355
Something different every day 0.73046
Unrotated Single Factor Matrix:
Figure 7.4: Standardization : principal factor analysis
items loaded very significantly, as shown in tigure 7.4. Princi-
pal component analysis indicated that the first, and only, factor
accounted for 55,1% of the variance. So the assertion can be made
that the scale measures what it is intended to measure and its

-164-
construct validity is good. The high factor loadings probably
also retlect well on the content validity.
Despite these positive comments, the scale still seems a little
simplistic. The Aston measures of standardization are no doubt
far better, but they are very comprehensive and it was not
possible to include them in this Questionnaire which was already
quite bulky. It was noted that in the abbreviated Aston study
( lnkson et at l Y7U: J UFi29) the concept of standardization
was dropped altogether from the structuring of activities var
iables. This made sense to them because formalization is, in any
event, the other side of the same coin and is simply a measure of
the degree to which standardization has been committed to writing.
Being a single factor solution there was, obviously, no need to
recalculate Alpha Coefficients and the original coefficient as
displayed on page 158 still applied.
3. 2.4. Autonomy.
Principal factor analysis of the Autonomy or decentralization
scale, shown in figure 7.5, yielded a five factor solution - which
possibly contlicts with the objective of parsimony in factor
analysis. Weighed against this, though, must be the large number
of items that comprise the scale; so five factors is still
acceptable. Clark (l9YO: 50-51), in his analysis of Canadian
textile firms, also produced a five factor solution for his
decentralization scale.
Analysis of the factors indicated logical groupings which were
labelled:
Factor 1: Decentralization: Decisions affecting the management corps
Factor2: Decentralization : Operating policies and responsibilities
Factor 3: Decentralization : Strategic marketing decisions
Factor 4,: Decentralization : Operational expansion decisions
Factor 5: Decentralization : Extraordinary expenditure decisions

-165-
~~----~~t~e_m~~----------~--F_a~ct~o~r~l~~F~a~c~to~r~2=-~F~a=c~to~r~3--~F~a=c=t=o~r~4--~Factor5/ Management headcount 0.51142 0.04913 0.27312 0.14079 0.243341 Appoint managers 0.70702 0.11193 0.20626 0.16036 0.095261 Promote managers 0.83018 0.07720 0.14456 0.06305 0.08..,56 i
1 Managers' salaries 0.64075 0.06736 0.13404 0.02464 0.27906 i · Dismiss a manager 0.57330 0.08048 0.04654 0.12847 0.063921
New products/services 0.13245 0.19734 0.64301 0.06335 0.14534\ Market territories covered 0.08776 0.00682 0.61925 0.03746 0.069621
:Extent/type of markets 0.13139 0.01003 0.77802 0.02.,38 0.027251
i Price of output 0.23786 0.21347 0.51990 0.16128 0.11565 / I Type/brand new equipment 0.31958 0.23535 0.05919 0.03155 0.24005 I
I What will be casted 0.12561 0.29231 0.33173 0.15083 0.21295 What will be inspected -0.13436 0.50316 0.13760 0.03263 0.12.'; 11
Operations to be workstudied -0.012.'2 0.55841 0.08453 0.04501 0.00659 Suppliers of materials 0.11052 0.40652 -0.01123 -0.00563 0.08935 Buying procedures 0.20962 0.53982 0.13882 0.08955 0.19189 Training methods 0.22482 0.42700 0.02270 -0.05168 0.00847 What/extent welfare facilities 0.29700 0.21382 0.12008 0.12283 0.30331
i Unbudgeted capital expense 0.24429 -0.00055 0.06068 0.08851 0.649671
i Unbudgeted re~e_n_u~ expen~e . 0.12.'42 0.14388 0.17682 0.05218 0.46965! : Define responstbthties: spectahsts 0.13683 0.56820 0.18993 0.20423 0.04872 i j Define responsibilities: line depts. 0.05355 0.53021 -0.00854 0.09098 -0.022.'61 1 Create a new department 0.32.,02 0.17490 0.20377 0.86030 0.166981
1 Crearte a new job 0.45292 0.21115 0.13497 0.416569 0.16158 1
I i Rotated Factor Matrix: Varimax converged in 5 iterations. I
Figure 7. 5 Autonomy or Decentralization: principal factor analysis
The only iiJogicality occurred m the tirst factor where the type
and brand of new equipment was included in decisions affecting the
management corps. Perhaps respondents had in mind that uniquely
South African institution, the company car tleet, when they marked
this item. Nevertheless, the difference between loadings on the
five management corps variables and the new equipment variable is
so great that the latter item can safely be ignored.
Every single variable loaded on at least one factor and a pnnct
pal component analysis indicated that the five factors accounted
for 53,7% of the total variance in the scale. The construct
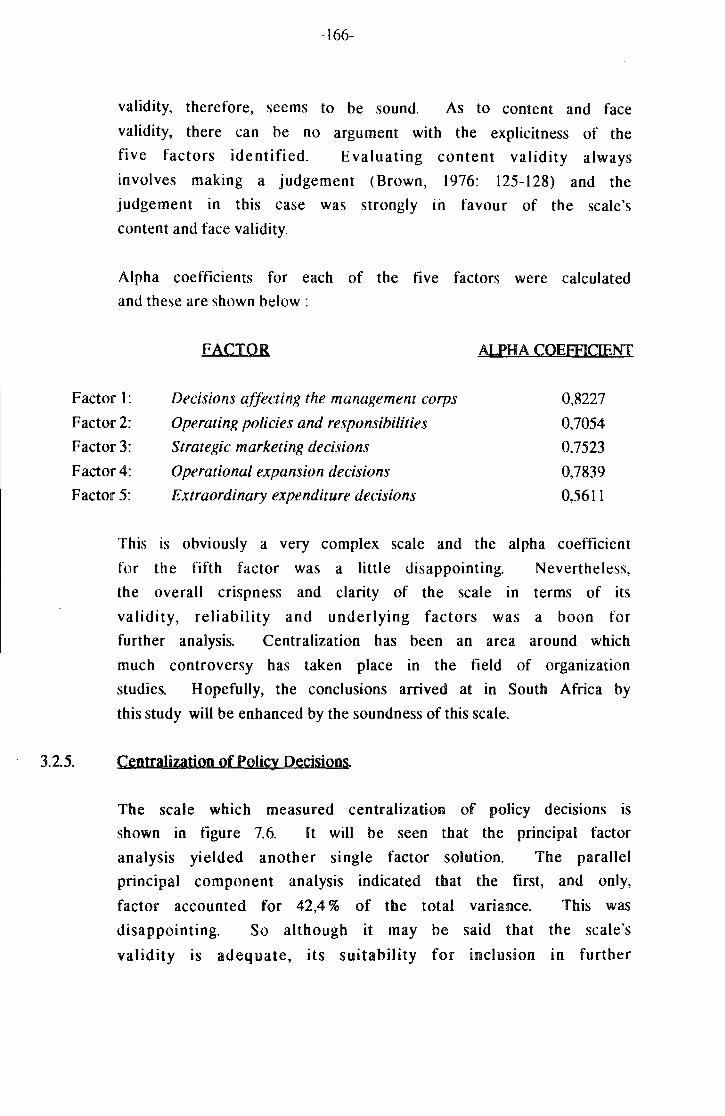
-166-
validity, therefore, seems to he sound. As to content and face
validity, there can he no argument with the explicitness of the
five factors identified. Evaluating content validity always
involves making a judgement (Brown, 1976: 125-128) and the
judgement in this case was strongly in favour of the scale's
content and face validity.
Alpha coefficients for each of the five factors were calculated
and these are shown below :
Factor 1:
Factor 2:
Factor 3:
Factm 4:
Factor 5:
FACTOR
Decisions affecting the management corps
Operating policies and responsibilities
Strategic marketing decisions
Operational expansion decisions
Extraordinary expenditure decisions
ALPHA COEFFICIENT
0,8227
0,7054
0,7523
0,7839
0,5611
This is obviously a very complex scale and the alpha coefficient
for the fifth factor was a little disappointing. Nevertheless,
the overall crispness and clarity of the scale in terms of its
validity, reliability and underlying factors was a boon for
further analysis. Centralization has been an area around which
much controversy has taken place in the field of organization
studies. Hopefully, the conclusions arrived at in South Africa by
this study will be enhanced by the soundness of this scale.
3.2.5. Centralization of Policy Decisions.
The scale which measured centralization of policy decisions is
shown in figure 7.6. [t will be seen that the principal factor
analysis yielded another single factor solution. The parallel
principal component analysis indicated that the first, and only,
factor accounted for 42,4% of the total variance. This was
disappointing. So although it may be said that the scale's
validity is adequate, its suitability for inclusion tn further

I Item i Major policy decisions [ Sales policy decisions ! Product mix decisions
-167-
Production standards i Manpower policies 1 Selection of executive personnel I I
: Unrotated Single Factor Matrix:
Factor 11 0.30068 i 0.737B I 0.71686 i
0..565761 I
0.558361
0.398021
I
Figure 7.6. Centralization (policy decisions): principal factor analysis
analyses. is. at best, limited. Generally speaking, the factors
extracted from the decentralization I autonomy scale presented a
more viable breakdown of decision-making, including policy
decisions.
3.2.6. Centralization and Decision-making Discretion.
Centralization and decision-making discretion was a scale that was
taken straight from the standard MBL/MBA text book by Rohhins
( 1987: 486-493) who presented it as part of a group of three
structural questionnaires. He asserted that his intention was to
" ... avoid the precision that the researcher would demand and
settle for simple measures that will provide reasonable estimates
of each dimension." In this statement Robbins probably undersells
his centralization scale. Figure 7. 7 reveals that the scale
presents two very clear factors, both of which exhibit extremely
high loadings on every single one of the variables. These factors
are readily labelled :
Factor 1:
Factor2:
Centralization:
Centralization:·
Top management involvement
First line supervisory discretion
In a principal component analysis the first factor accounted for

-168-
38,8% of the total vanance and both factors together took care of
59,2% of the variance.
I
Item Factor 1 Factor 21 I ! ToQ Management involvement : I 1- gathering information -0.05797 0.7!3051
interpreting information -0.03963 0.73233 controlling decision execution 0.09158 0.70962
1st line SUQervisory discretion : establishing budgets 0.71626 0.07915 I
I= performance evaluation 0.73125 -0.02098 I hiring and firing 0.60684 -0.03247 increases and promotions 0.70593 -0.01812 buying equipment & supplies 0.74667 0.01032 establishing new programs 0.71507 -0.04310 hanlin work exce tions I 0.61359 0.01536 I
Rotated Factor Matrix: I V arimax converged in 3 iterations
Figure 7.7 Centralization (decision making discretion): principal factor analysis
Factor 1:
Factor2:
Alpha coefficients for the two factors are indicated below :
FACTOR
Cemralization: Top management involvement
Centralization: First line supervisory discretion
ALPHA COEFACIENT
0,7601
0,8644
All in all, the scale proved to be a robust measure with very
strong construct, content and face validity.
used with confidence in all further analyses.
One which can be
3.2 7. Or~anicity or Operating Mana~ement Philosophy.
The Last of the structural scales, that of organicity or operating
management philosophy, is shown in figure 7.8. This scale also
distilled two very strong factors on which all of the items loaded
very significantly.

-169-
Item Factor 1 Factor 21 Communication
I 0.11573 0.65149
Management style 0.22085 0.67418 I
Influence 0.21456 0.35477 I . Reaction to change I
0.24145 0.57035:
I Procedures 0.66303 0.35170 I
Control I 0.78250 0.14973
i Task definition I 0.72013 0.26553
I Rotated Factor Matrix: I V arimax converged in I 3 iterations I
Figure 7.8 Organicity (operating management philosophy) : principal factor analysis
The factors were labelled :
Factor l:
Factor 2:
Structural aspects
Behavioural aspects
procedures, controls, and parameters
management style, communication and
response patterns.
The strength and darity of the factors indicated that the face
and content validity were very good. The principal component
analysis of the scale extracted two factors, the first of which
accounted for 44,6% of variance and both factors together were
responsible for 60,9% of the total variance in the scale. So the
construct validity is also very good. The Alpha coefficients for
the two factors came out as follows :
Factor 1:
Factor 2:
FACTOR
Structural aspects
Behavioural aspects
ALPHA COEFFICIENT
0,6807
0,8059
The organicity scale, then, also proved to be quite a sturdy
measuring instrument which could be used with confidence in
pursuing further analyses.
l !

-170-
3.3. Factorin~ the Structural Variables and the Fourth Hypothesis.
The next step in the data treatment procedure was to establish the
extent to which the structural variables of specialization, formaliza
tion, standardization. configuration. centralization, and organicity
were independent of each other. In other words are they completely
separate factors or do they have areas of commonality?
To answer this question the raw scores from the study were submitted
to a correlational analysis ( tigure 7. 9) as well as a factor analysis
(figure 7. 10). This methodology differed from the item analysis desc
ribed in the previous sections of this chapter in that only a princi-
pal compon·ent analysis was
a principal factor analysis.
analysis was dealing with
used to extract underlying factors and not
This was deemed appropriate because the
the agglomeration of all the structural
scales. Principal component analysis. as a data reduction technique
which also accounts for the maximum portion of the total variance
represented by the diverse group of original scales. appeared more
suitable.
Figure 7. 9 illustrates the intercorrelations of all the structural
2 3 4 5 6 7 8 9 10 11 I. Functional Special.i2atinn
1, I:· J·'·
I Variable
Formalization
Standardization
Autonomy
1
4.
5. Policy decision making
I 6. Decision making discretion
1
7. Organicity
8. E"tecutive span
J9. Subordinate ratio
1 10. Organization depth
' 11. Management ratio
12. Support staff ratio
I o.40 -0.17
1.00
-0.28 1.00
0.11 0.04 -0.10 1.00
-0.21 -O.lS -0.21 -0.09 1.00
-0.17 -0.27 0.26 -0.07 0.29 1.00
-0.03 -0.05 -0.21 0.23 -0.03 -0.28 1.00
I 0.12 O.ot -0.16
-0.02 -0.17 0.21
0.07 -0.06 0.02 0.03 1.00
O.o7 0.10 0.10 -0.04 0.04 1.00
O.l5 0.05 0.04 0.05 0.01 0.04 -0.07 0.07 0.01
0.12 O.Z4 -0.22 0.01 -0.13 -0.06 -0.03 0.15 -0.23
0.13 -0.13 0.06 0.00 0.11 0.07 0.04 -0.03 0.10
1.00
0.06 1.00
0.01 -0.06
12 13
1.00
13. Clerical staff ratio 0.05 0.10 -0.08 0.14 -0.06 -0.07 -0.06 0.07 -0.07 -0.02 0.33 0.07 1.00
2-tailed significance: Bold = .001 Italics = .01
Figure 7.9 Intercorrelations of structural variables.
variables. lt is immediately apparent that the most significant
correlation is between Functional Specialization and Formalization.
-171-
This was not surpnsmg and is consistent with findings throughout
the world. The link between specialization and formalization is an
intrinsic part of the Aston group's Structuring of Activities compo
site variable which arose out of the principal component analysis of
their original data. Unusually, though, Standardization was
negatively correlated with both the specialization and formalization
measures. The three centralization scales exhibited the expected
relationships with each other and with most other variables, bearing
in mind that the autonomy scale is a measure of decentralization.
rn terms of classical Organization Theory, the organicity
variable displayed the expected relationships with the other
structuring variables; namely, a strong positive correlation with
decentralization and strong negative correlations with both
centralization and standardization. The expected negative
correlation with formalization was present, but it was very weak.
Paradoxically, Organicity displayed no significant relationships with
any of the configuration variables. The relationships were present -
and all in the right directions - hut all of them were far too weak
to he considered significant.
3.3.1. The Fourth Hypothesis.
The fourth research hypothesis dealt specifically with the
relationships between internal variables and, with the aid of
figure 7.9, it was now possible to take a preliminary look at the
postulated relationships.
The first sub-hypothesis stated that vertical span, or
organization depth, would be positively related to spec
ialization, formalization, decentralization, lateral
span of control and the administrative staff ratios.
The correlation analysis indicated that :
there is a weak positive relationship between
Organization Depth and Functional Specialization;

-172-
there is no significant relationship between
Organization Depth and Formalization:
in terms of all three measures of centralization or
decentralization, there is no significant relation
ship between Organization Depth and decentraliza
tion:
there is no significant relationship between Organi
zation Depth and span of control, neither at the
level of chief executive nor first line supervisor;
and
Organization Depth is not signiticantly related to
administrative staff ratios, neither clerical staff
nor indirect support staff.
The second sub-hypothesis stated that formalization
will be positively related to specialization,
decentralization and the administrative staff ratios.
Examination of figure 7. 9 indicated that :
the relationship between Functional Specialization
and Formalization is quite strong and significant
at the 0,001 level;
although there 1s no relationship between
Formalization and decentralization as depicted in
the autonomy measure, there is still support for
this sub-hypothesis in the fairly strong negative
correlations between Formalization and the other
two centralization scales: both of which are
significant at the 0,001 level. In other words,
the greater the degree of formalization, the more
an organization 1s able to decentralize its
decision making. So support is provided in a South
-173-
African context for Child's 0 972: 163-177) proposi
tion of alternative strategies of control.
The administrative staff relationships with
Formalization are inconclusive in that the indirect
support staff ratio is negatively correlated and
the clerical staff ratio is positively correlated.
Both correlations are very weak.
In addition, there were fairly significant relation
ships at the 0,001 level between Formalization and :
Standardization (negative),
the first line Subordinate Ratio, and
the Management Ratio.
None of these were postulated m the original fourth
hypothesis hut they are covered in more detail when the
final sub-hypothesis is discussed.
The third sub-hypothesis proposed that there would he a
positive relationship between specialization, and
decentralization and the administrative staff ratios.
This was indeed so, with all three of the
centralization I decentralization measures correlating
with specialization, twice at the 0,001 level. The
Support Staff ratio was weakly correlated at the 0,01
level but there was no significant relationship with
the Clerical Staff ratio.
The fourth sub-hypothesis said that decentralization
will be positively related to the administrative staff
ratios. There was limited support for this proposal in
that autonomy (decentralization) showed a small
relationship with the indirect Support Staff ratio.
Conversely, Policy Decision Making (centralization)
correlated positively, albeit weakly, with the Clerical
Staff ratio.

-174-
The tinal sub-hypothesis suggested that
shape or configuration would be related
ation, decentralization and formalization.
ration variables in figure 7.9 are numbered
the following relationships are apparent :
organizational
to specializ
The contigu-
8 to 13 and
Functional Specialization is positively related to
the chief executive's span of control, as well as
to Organization Depth, the Management ratio, and
the indirect Support Staff ratio. All of these
relationships are significant at the 0,0 I level.
The relationships between the configuration
variables and centralization are generally quite
weak although they do follow the directions that
were anticipated. The Subordinate ratio 1s
positively correlated with the centralization of
policy and discretionary decision making. Policy
Decision making is negatively correlated with the
Management ratio and positively correlated with the
Support Staff ratio, both at the 0,01 level of
significance. Finally, the Clerical Staff ratio 1s
positively correlated with autonomy or
decentralization.
In summary, then, the more decisions are
centralized, the less need for managers and the
more the need for purely administrative staff.
Formalization is positively related to the
Management ratio, significant at the 0,001 level,
and weakly related to the Clerical Staff ratio.
But there is a negative relationship with the tirst
line Subordinate ratio, also significant at the
0,00 l level, and a negative relationship with the

-175-
indirect Support Staff ratio at the 0,01 level of
significance.
In other words, the greater the degree of formaliza
tion, the more the number of managers and the fewer
the number of subordinates and support staff. This
is a puzzling conclusion and is quite the opposite
of the accepted wisdom. Formalized systems and
controls are usually surrogates for managers - all
owing fewer managers to control more subordinates.
Perhaps the answer to this apparent conundrum lies
in the other unexpected negative correlation
discussed earlier - that of Standardization and
Formalization. Standardization measured the amount
of routine in an organization and it now becomes
apparent that, in this research application, stand
ardization and formalization were not two sides of
the same coin, as was apparently the case in other
studies. lndeed, comparing the correlations with
other variables where both standardization and
formalization were simultaneously significant, the
directions of the relationships in every case were
the opposite of each other. So, in this study,
standardization and formalization appear to have
very different applications.
Turning back to the apparent conundrum, it becomes
clear that it is standardization or routine, and
not formalization, that is a surrogate for managers
and that allows fewer managers to control more sub
ordinates. The key to understanding the difference
between formalization and standardization appears
to lie in these two variables' relationship with
centralization. So Child's alternative
strategies of control thesis can be extended by

-176-
proposing a four-way relationship between
centralization, formalization and standardization.
On the one hand :
the more the formalization, the more the
decentralization;
the more the decentralization the more the need
for managers as decentralized decision makers
and the less the need for administrative staff.
And on the other hand :
the more the centralization, the more the
standardization or routine;
the more the standardization or routine, the
less the need for managers and the more the
need for subordinate and administrative staff.
The question which now anses IS, could the above
pairs of relationships be a pointer to South
African manufacturing organizations' structural
uniqueness in terms of their mix of third world and
first world components? The first pair of
relationships is closer to the more classical and
expected configuration and would undoubtedly apply
to the first world component of the workforce.
In terms of the third world component, formaliza
tion could not work as an alternative control stra
tegy simply because large parts of the labour force
are illiterate. Management is often dealing with a
labour intensive, unsophisticated workforce which
is poorly educated and alienated from the dominant
capitalist and first world business norms. In such

-177-
an environment, a high degree of routi~e and
standardization would appear to be a more viable
control strategy.
Looking at the fourth hypothesis overall, there seemed to be
general support for the internal structural relationships that
were proposed - with three possible exceptions :
(i) Of five anticipated correlations, Organization Depth showed
a weak relationship to one variable and no significant
relationship with the other four.
(ii) The relationship between formalization and the Subordinate
ratios was also the opposite of what was anticipated.
(iii) Standardization was negatively correlated to both speciali
zation and formalization, contrary to expectations and to
the findings of other studies in advanced economies. The
relationships between formalization, centralization and
standardization or routine also exhibited characteristics
which are dissimilar to those found in other studies.
3.3.2. Factor Analysis of the Structural Variables.
A factor analysis of aJJ the dependent structural variables toge
ther yielded a five factor solution, with every variable loading
significantly on at least one factor. Many of the loadings were
quite high and the mean of all the significant loadings came out a
at 0,6013. Each of the five factors was interpretable and the
labels that were assigned to them together with the portion of
variance accounted for by each factor were as follows :
% ofVar Cum% Var
Factor 1: Alternative Strategies for Control 18,6 18,6
Factor2: lntrapreneurship 11,0 29,6
Factor 3: Labour Intensity 9,8 39,4
Factor4: Leadership and Administration 9,4 48,8
Factor 5: Shape 7,7 56,6

-I 78-
[__Variable I Factor 1 Factor 2 Factor 3 Factor 4 !1. Functional Specialization 0.67137 -0.03027 0.07096 -0.02163 I
12. Formalization 0.77130 -0.06423 -0.16507 0.11865 3. Standardization -0.26822 -0.46379 0.44017 -0.15961
14. Autonomy 0.12617 0.55.529 0.28776 -0.01228 i 5. Policy decision making -0.64696 -0.13745 0.09152 -0.03306 16. Decision making discretion -0.51134 -0.45173 0.08812 -0.04034 7. Organicity -0.06913 0.81032 -0.04904 -0.07626 8. Executive span -0.11800 0.22421 -0.18903 0.12647 9. Subordinate ratio -0.05620 0.00162 0.72038 -0.11571 10. Organization depth 0.13670 -0.15994 0.17855 -0.03527 11. Management ratio 0.15768 -0.02901 -0.41239 0.62015 12. Support staff ratio -0.22706 0.12751 0.50903 0.45403 13. Clerical staff ratio 0.08820 -0.04256 -0.00034 0.81598
I Rotated Factor MatriX: Vanmax converged m 11Iterauons.
Figure 7.10. Structural variables : Principal component analysis.
Looking at each of the factors in turn, the following points
emerged:
Factor 1:
Factor2:
Alternative Strategies for Control: this factor
was not the expected Structuring of Activities
variable that often emerges as the tirst factor in
similar analyses in Europe, America and other
advanced economies. Nevertheless, the clear nexus
between specialization and formalization on the one
hand and decentralization on the other, make this
factor strongly analogous to Child's ( 1972)
Alternative Strategies of Bureaucratic Control.
lntrapreneurship: or Entrepreneurship if the
organization is a principal unit and not part of a
group. This factor is a combination of low
routine, high autonomy and decentralized decision
making, and very high organicity. It smacks of the
kind of critical success factors necessary 1n a
turbulent environment and at the beginning of an
organization's life cycle.
Factor 5 0.36222 0.02432
-0.09689 0.27907 0.07072 0.29544
-0.10992 0.70845 0.13176 0.56136 0.22604
-0.16753 -0.010051

Factor 3:
Factor4:
Factor 5:
-179-
Labour Intensity the third factor 1s a
combination of high routine, a larger number of
subordinates, fewer managers, and lots of support
staff. This factor does seem to be peculiar to
this study and again seems to be associated with
control strategies for the third world element of a
manufacturing organization's workforce.
Leadership and Administration this factor is
concerned only with control and processing in terms
of the numbers of managers and clerks in an
organization.
Shape : the final factor is simply the depth and
width of an organization's structure. These are
the two elements that were missing from the tirst
factor for it to have been the classical Weberian
concept of Structuring of Activities.
The most notable difference between this study and other studies,
particularly those of the Aston genre which were mainly
conducted in Western economies, is the absence of the two
composite variables of Structuring of Activities and Concentration
of Authority as the major factors emerging from a principal
component analysis of structural variables.
Again, the question needs to be asked, are we seeing something
unique to South Africa in the factors that emerged from this
analysis? For example, both the first and third factors appear to
deal with strategies for exercising control. Varimax is an
orthogonal rotation and this means that the factors are
independent of each other and are not correlated at aU. So the
control strategies embodied in Factor 1 are very different from
those in Factor 3 and their deployment would tend to be mutually
exclusive. This appears to be another manifestation of the
differing strategies employed to deal with the tirst world and
third world elements of the labour force. High specialization

-l ~(}-
and formalizatiOn coupled with decentralization (factor 1) is
aimed at the more sophisticated, better educated first world elem
ent, while control of the less literate third world component is
achieved through high routine or standardization, proportionately
fewer managers, more subordinates, and more indirect support
staff.
The second factor, that of Intra I Entrepreneurship, also holds int
eresting connotations for South African manufacturing companies at
this time. The current emphasis on economic growth, development
and job creation are inextricably linked to the international com
petitiveness of local organizations. So the independent variables
that bring about a spirit of entrepreneurship are of interest and
will be pursued in the next chapter when multiple regression
analysis is carried out.
This discussion concludes the tirst part of the analyses of the
dependent variables. ln the following sections the emphasis
shifts from the structural variables to the concept of
Organization Climate.
3.4. Dependent Or~:anization Oimate Variables: Reliability.
A similar procedure to that followed with respect to the structural
scales was followed in dealing with the 9 Organization Climate
scales. Reliability data displayed in tigure 7.11 are all based on
Cronbach's Coefficient Alpha. None of the Organization Climate
scales are dichotomous and so the Kuder-Richardson Formula 20 was not
used.
Apart from the measure for Emotional Control, an of the scales
showed reliability coefficients that varied from good to very good.
It will be remembered that the lower limit set earlier for
acceptability of the structural scales was 0,60. Applying the same
criterion to the Organization Climate scales seemed reasonable and
consistent, and so their reliability was considered acceptable.

-18 t
SCALE
1. Authority
Leaders' psychological distance
Concern for employee development
Questioning authority
2. Restraint
Emotional control
3. Work Interest
Scientific and technical orientation
Intellectual o·rientation
4. Personal Relations
Interpersonal aggression
5. Routine
Rules orientation
Readiness to innovate
Figure 7.11 Reliability of Organization Climate scales.
COEFFICIENT ALPHA
0)5
0,80
0,72
0,55
0,79
0,81
0,80
0,70
0,74
3.5. Dependent Or~anization Climate Variables : Multidimensionality.
The results of factor analysis carried out on the organization
climate scales are displayed in figures 7.12 through 7.19.
Significant factor loadings are highlighted and discussed with each
diagram. Although principle factor analysis and principal component
analysis was carried out for each scale, this was mainly for the
purpose of estimating validity. No attempt was made to formally
label the factors extracted by each analysis; although in most cases
the concepts associated with each factor were fairly obvious.
Each scale is in fact a subscale of the larger group of 72 items
comprising the total Organization Climate measure. These items were

-l82-
drawn from the Business Organization Climate Index (BOCI) devised by
Payne and Pheysey ( 1971). The original BOCI consisted of 192 items
which, in tum, were derived from 300 items on an Organization
Climate Index formulated by Stern in the 1960s. So a considerably
amount of refinement and distillation of the ·final scales had already
taken place.
For the most part, each of the scales is quite strongly unidimen
sional, consisting of only two factors with a first factor that loads
strongly and accounts for a large portion of the total variance of
the scale. The scale for Employee Involvement was even more
unidimensional and extracted only one factor.
3.5.1. Authority.
i Item ! Factor 1 Factor 2 ! Mode of address 0.03168 0.79637 ! Politeness imperative 0.41571 0.43210 I I Use of surnames 0.21724 0.24726 1 Expectation of respect 0.37182 0.33896 [Looking for compliments 0.50539 0.21711 i Jealous of authority 0.75877 0.17550 Bootlicking 0.57698 0.22746 Group of priveleged leaders 0.58783 0.054581
i
Rotated Factor Matrix: Varimax converged in I
3 iterations I Figure 7.12 Leaders' psychological distance : principal factor analysis
The first of three scales that fall under the heading of Authority
is that of Leaders' Psychological Distance. It yielded two
factors, as can be seen in figure 7.12. The first was concerned
with political manipulating and manoeuvring and the second focus
ing on the nature of interactions between levels of employees.
The first factor loaded on six of the eight scale items and
accounted for 37,1 % of the variance. Both factors accounted for
50,8% of variance.

-l83-
Alpha coefficients were calculated for both factors and. these
were, respectively, 0,75 and 0,58; indicating the strength of the
first factor and the unidimensionality of the scale.
Item Policy goals explained Criticism encouraged Caring enforcement of rules Access to senior personnel Concern for personal problems Tolerance of complaints Helpful senior personnel Listening senior personnel
j Unrotated single factor matrix
Factor 1 0.51380 0.47473 0.56390 0.50190
0.613721 0.73227 0.64013 II
0.633561
Figure 7.13 Management concern for employee involvement : principal factor analysis
The second Authority scale, Management Concern for Employee
Involvement, is shown in figure 7.13. Principal factor
analysis yielded a single factor solution, which according to a
principal component analysis, accounted for 42,7% of variance.
The Alpha coefficient was 0,80; validity and unidimensionality
were both apparently strong.
I Item Factor 1 Factor 2 I Criticism of policies 0.62475 0.03352 j Working to change policies 0.55073 0.26133 :Non-acceptance of ineptitude 0.28411 0.31420 ; Proclaiming dissatisfaction 0.44486 0.50019 Avoidance of clashes 0.48061 0.19327 Opposition to management 0.15519 0.38356 Expectation of retaliation 0.54144 0.24665 Delight in challenging policies 0.05047 0.57172
Rotated Factor Matrix: Varimax converged in 3 iterations.
Figure 7.14 Questioning authority :principal factor analysis
The last of the three Authority scales was Questioning

-184-
Authority. Although the items seemed to be quite homogeneous,
figure 7.14 shows that two factors were stiJJ extracted. The
first loaded on five of the eight items and accounted for 34,4% of
vanance. Both together accounted for 48,2% of variance. All in
alJ, it was difficult to arrive at a conclusion with respect to
the scale's validity. Revised Alpha coefficients were calculated
as 0,71 and 0,55 for the two factors, respectively.
3.5.2. Restraint
Item Expressing feelings
1 Heated discussions 1 Felings not hidden 1l Arousing excitement , Displays of emotion I No secret dislikes I Deeper feelings hidden l Mood swings I
I Rotated Factor Matrix: i
1 Factor 1 ! 0.63681
0.40585 0.60117 o.41n9 0.45415 0.05434 0.52120
-0.19100
Factor 2
I
Varimaxconverged in 3 iterations.
Figure 7.15 Emotional Control : principal factor analysis
The only measure of Restraint, the scale for Emotional Control
is shown in figure 7. 15. Two factors are illustrated, the
first dealing with the display of feelings or emotions, and the
second addressing the lability or quantity of emotion. This scale
did not come highly recommended from its United Kingdom applica
tion (Stewart er al, 1981) and its weakness was also apparent
in this study. Alpha coefficients for the two factors were 0,66
and 0,41 respectively. The first factor accounted for 28,7% of
variance and both together for 46,9 %.
3.5.3. Work Interest
The Scientific and Technical Orientation scale (figure 7.16)

-185-
ts one of two under the heading of Work Interest. A principal fac-
' Item Factor 1 Factor 2
Scientific method encouraged I
0.65821 0.11297 Latest technical developments 0.63994 0.21283 Attending technical lectures 0.11817 0.655691 Background in science 0.17732 0.749751 Letest scientific inventions 0.434751 0.40505 Scientific/managment journals 0.46439 0.45670 Expertise 0.41846 0.07763 Research consciousness 0.68176 0.27472
i Rotated Factor Matrix: [ Varimax converged in 1 3 iterations
Figure 7.16 Scientific and Technical orientation : principal factor analysis
tor analysis obtained two factors, both of which loaded quite
strongly on all of the items. Broadly, the tirst factor focused
on expertise and research and the second on technological develop
ments. The first factor was quite large and accounted for 41,5%
of the variance; both together took care of 56,5 %. Recalculated
Alpha's were 0,78 and 0,73 respectively for each factor.
i Item Factor 1 Factor 2 I Tackling complex problems 0.37525 0.45598 1 Attending managment lectures 0.56515 0.06151 I Intellectual stimulation 0.81039 0.18704 Deep thinking challenge 0.83367 0.22845 Well-read 0.52674 0.24653 Intellectual discussions 0.50783 0.41973 Acceptance of serious discussion 0.09719 0.57979 Reasoning and logic valued 0.12356 0.61577
Rotated Factor Matrix: Varimax converged in 3 iterations
!Figure 7.17 Intellectual orientation : principal factor analysis
The second measure in the Work Interest grouping was the scale for
Intellectual Orientation. Figure 7. 17 illustrates the two
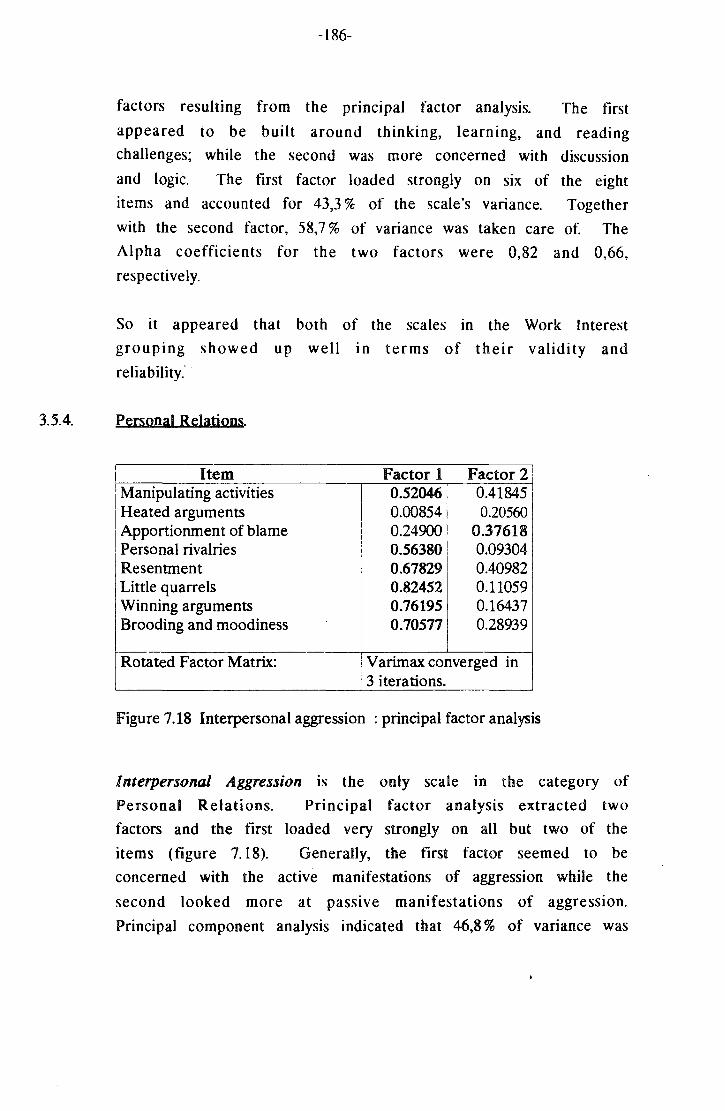
-186-
factors resulting from the principal factor analysis. The first
appeared to be built around thinking, learning, and reading
challenges; while the second was more concerned with discussion
and logic. The first factor loaded strongly on six of the eight
items and accounted for 43,3% of the scale's variance. Together
with the second factor, 58,7% of variance was taken care of. The
Alpha coefficients for the two factors were 0,82 and 0,66,
respectively.
So it appeared that both of the scales in the Work Interest
grouping showed up well in terms of their validity and
reliability."
3.5.4. Personal Relations.
Item Factor 1 Factor 2J ' '
I Manipulating activities I 0.52046 0.41845 1 Heated arguments I 0.00854 0.20560 i Apportionment of blame I 0.24900 0.37618 l Personal rivalries
I 0.56380 0.09304
1 Resentment 0.67829 0.40982
' Little quarrels I
0.82452 0.11059 Winning arguments I 0.76195 0.16437 Brooding and moodiness
I 0.70577 0.28939
Rotated Factor Matrix: Varimax converged in 3 iterations.
figure 7.18 Interpersonal aggression :principal factor analysis
Interpersonal Aggression is the only scale in the category of
Personal Relations. Principal factor analysis extracted two
factors and the first loaded very strongly on all but two of the
items (figure 7.18). Generally, the first factor seemed to be
concerned with the active manifestations of aggression while the
second looked more at passive manifestations of aggression.
Principal component analysis indicated that 46,8% of variance was

-187-
accounted for by the first factor and 59,6% by both factors
together. Alpha coefticients were 0,86 and 0,49 for the two
factors. So the tirst factor seemed to be very strong and quite
unidimensional, which retlected well on the scale's validity.
3.5.5. Routine.
I Item I Factor 1 Factor 2 I Violations reported 0.59898 0.11571 Attendance checked 0.65450 0.18087 What is done and not done 0.59194 0.13768 Attention to rules 0.33049 0.50487 Asking permission 0.36819 0.40593 Importance of rules 0.54027 0.23408 Display of rules -0.04801 0.31522 Tolerance of deviation 0.44352 -0.07267
l Rotated Factor Matrix: i Varimax converged in I 13 iterations.
Figure 7.19 Rules orientation: principal factor analysis
Principal factor analysis of the Rules Orientation scale is
shown in figure 7.19. On the first factor all but one of the
items loaded significantly. The first factor dealt with the
display of rules and the expectation of obedience. The second
factor was more concerned with the actual compliance with rules.
The first factor accounted for 35,0% of variance and both together
for 49,3 %. The recalculated Alpha coefficients were 0,74 and
0,34, respectively. So the validity seemed to be reasonable and
the reliability acceptable.
The second measure under the heading of Routine was the scale
intended to gauge Readiness to Innovate. It is illustrated
in figure 7.20. Again, it consisted of the customary two factors
with the first loading on six of the eight items in the scale.

-188-
The first factor deals with generation of ideas, invention.s and
discoveries, while the second is more concerned with speed and
tlexihility.
! Item i Factor 1 Factor 2 ~ Rate of policy change I 0.08227 0.57478 Speed of decisions and actions 0.22247 0.79925 Search for alternatives 0.39807 0.10426 New ideas 0.54208 0.31023 Latest scientific discoveries 0.42355 0.03348 Encouragement of plans 0.68039 0.11484 Conventionality 0.54180 0.25788 Programme flexibility 0.46807 0.40614
Rotated Factor Matrix: Varimax converged in 3 iterations
Figure 7.20 Readiness to innovate principal factor analysis
The principal component analysis indicated that the first factor
accounted for 36,9% and both for 51,7% of the total variance. The
two highest factor loadings actually occurred in the second
factor, hence the relatively low first factor variance. So the
validity may also be less than satisfactory.
Alpha coefficients were 0,71 and 0,69, respectively.
The recalculated
In summary, the reliability and validity of the BOCI scales used in
this study are illustrated in tigure 7.21. Compared to their showing
in the British applications (Stewart et al, 1981), most of the
scales have maintained or improved their evaluative rating - with
three possible exceptions :
- the validity of the Questioning Authority scale declined
somewhat in the local application,
... the reliability of the ·Readiness to Innovate scale appeared to
decline a good deal, and
... the validity of the Rules Orientation scale also seemed to be
weaker in this study.

Scale
1. Authority
Leaders' Psychological Distance
Concern for Employee Involvement
Questioning Authority
2. Restraint
Emotional Control
3. Work Interest
Scientific & Technical Orientation
Intellectual Orientation
4. Personal Relations
Interpersonal Aggression
5. Routine
Readiness to Innovate
Rules Orientation
-189-
Reliability Validlity
acceptable acceptable
good good
acceptable uncertain
adequate adequate
good good
good good
good good
good uncertain
acceptable adequate
Figure 7.21. Reliability & validity of the Organization Climate Scales.
It must, of course, he rememhered that validity of the climate scales
in the context of this study has to be a preliminary, subjective
judgement The scales would have to be used and analysed in a local
context many more times before a final definitive statement could be
made regarding their construct and content validity.
3.6. Factorin& the Or.&anization Climate Variables.
The next step in the process was to establish the extent to which the
organization climate variables are independent of each other. In
other words, are they completely separate factors or do they have
areas of commonality?
To address this question, the raw scores from the study were
submitted to a correlation analysis (figure 7.22) as well as a factor

-190-
analysis (figure 7.23). A similar procedure was followed to that
which was carried out with the structural variables. That ts, a
principal component analysis endeavoured to trace the extent to which
separate dimensions were involved as well as reducing the amount of
data resulting from the agglomeration of all the organization climate
scales.
3.6.1 lntercorrelation Matrix.
The intercorrelation matrix for all the organization climate
variables is depicted in figure 7.22. No specific hypotheses were
I Variable ! 1 2 3 4 5 6 7 8 9 11. Leaders' psychological distance I 1.00
1 2. Concern tor employee involvement l-0.54 1.00
13. Questioning authority l-o.29 0.41 1.00
14. Emotional control I 0.21 -0.21 -0.39 1.00
Is. Scientific & Technical orientation 1
1
-o.09 o.25 o.25 -0.19 1.00
\ 6. Intellectual orientation -0.15 0.34 0.29 -0.28 0.68 1.00
i 7. Interpersonal aggression o.54 -0.58 -o.2o om -0.16 -0.23 1.00
8. Rules orientation o.t6 o.n -o.12 0.10 0.04 o.os -o.os 1.00 \
9. Readiness to innovate -0.35 o.5o 0.36 -0.28 0.40 o.36 -0.38 -o.o5 1.00 i 2- tailed significance: Bold = .001 Italics = .01
Figure 7.22 Intercorrelations of climate variables
put forward with respect to the interrelationships between the
nine organization climate variables. The matrix is, therefore,
tabulated here with just the following two general comments :
§ Organizations which have leaders who are perceived to be
psychologically distant also have a high level of interpersonal
aggression, lack of emotional control and lack of employee
involvement . Leadership that is perceived to be distant does
not square with an organization climate in which limits are
challenged, questions are asked, and innovation thrives.
§ Conversely, an organization which is perceived as being concern-

-191-
ed about employee involvement shows little sign of emotional
volatility and interpersonal aggression. It IS marked by a
questioning, intellectual, scientific bias and is quick to
innovate.
The interrelationships that are summarised in these two general
comments are interesting mainly because they are empirically based
facts and not a priori theorizing or the " ... idealistic
futures and exotic answers ... " referred to by Human (1993: 205)
and quoted on page 1 of this report.
The concept of Organization Effectiveness and its evaluation and
measurement was deliberately avoided in the course of formulating
the research problem for this study. It was felt that the concept
was too big and too complex to include and would muddy the waters
if it was embodied as part of this project Nevertheless, it IS
still possible to make some sort of preliminary assessment of
organization effectiveness by establishing the extent to which an
organization's climate is either facilitating and functional or
obstructive and dysfunctional. So the associations between
contextual and structural variables, and their effects on
organization climate, that . will be pursued in the next chapter
hold significance from an organizational effectiveness point of
view as well.
3.6.2 Factor Analysis of the Or~anization Oimate Variables.
The principal component analysis of ali of the organization
climate measures together presented a three factor solution. All
of the variables loaded significantly. The three factors were
labelled as follows :
Factor 1:
Factor2:
Factor 3:
Supportive Organization Values
Cerebral Stimulation
Acceptance of Rules and Restraints
% ofVar
36,5
15,7
13,7
Cum% Var
36,5
52.2
65,9

-192-
The elements which comprise the three factors are illustrated in
figure 7.23. They are very self explanatory and will, therefore,
not be examined any further here.
Item 1. Scientific & Technical orientation I
2. Intellectual orientation 3. Leaders' psychological distance 4. Concern for employee involvement 5. Readiness to innovate 6. Interpersonal aggression 7. Emotional control 8. Rules orientation 9. Questioning authority
Factor 1 0.06081 0.15133
-0.79710 0.81200 0.51993
-0.84546 -0.09895
0.07748 0.33351
Factor 2 0.86753 0.85915 0.06580 0.27615 0.44761
-0.08230 -0.34304
0.25661 0.33558
Factor 3 -0.03859 -0.04808
0.26981 i -0.037371 -0.24509 -0.12415
0.62943 0.75250 I
-0.556131
Rotated Factor Matrix: Varimax converged in 4 iterations.
Figure 7.23 Organization Climate : principal component analysis
In a British application of the BOCI, Payne and Pheysey (197lb)
extracted two meaningful factors which they labelled Organization
Progressiveness and Normative Control. Their two factors are
loosely analogous to the first and third factors identified in
this study, except that the Scientific and Technical Orientation
variable and the Intellectual Orientation variable were both
included in their first factor. It was interesting to find in
the local application, therefore, that both of these variables
came out as a very strong and independent second factor which was
labelled Cerebral Stimulation.
There was also some difference in the amount of variance accounted
for by the factors extracted in the British study, viz:
Factor 1:
Factor 2:
Factor 3:
Organization Progressiveness
Normative Control
(Unidentifiable & Insignificant)
% ofVar
36,3
9,3
5,7
Cum% Var
36,3
45,9
51,6
It seems, then, that the application of a shortened form BOCI in this

-193-
study has stood up quite well and, in some respects, has pert·ormed
better in terms of validity and reliability in South African
conditions.
4. INDEPENDENT VARIABLES : THE CONTEXTUAL SCALES.
A similar procedure to that followed with respect to structural and
organization climate scales was followed in dealing with the 6
contextual scales, bearing in mind that some of them, such as size and
age, were point measures and did not require any further analysis.
4.1. Reliability. ·
Reliability data m the form of Coefficient Alpha ts displayed m
figure 7.24.
SCALE ALPHA COEFFICIENT
I.
2.
3.
Size
Age
Dependence
internal
external
4. Technology
workflow integration
process technology
5. Power control
6. Environment
change & predictability
operating environment
Point measure
Point measure
0,63
0,09
0,66
0,89
059"' '
064"'* '
0,43
Figure 7.24. Reliability of the contextual scales.
* grows to 0,66 if 2 items containing double negatives are omitted.
** two similar scales combined.

-194-
A couple of problem areas are apparent; firstly, in the scale of
external dependence, and then in the measure of the operating
environment. It will be recalled that the wording of the operating
environment scale was problematic because of the recent momentous
political changes. It does seem possible that, as was feared, many
respondents did allow their perceptions of the recent political
environment to colour their perceptions of the operating environment
within which their organizations have historically functioned. This
is probably not a retlection on the value of the scale per se and
subsequent analyses which used this scale took cognisance of this
fact
Insofar as the external dependence scale was concerned, it would
appear that the two dimensions which comprise the scale did not
combine well in a South African situation. Several measures of
reliability were tried but none could improve on the very poor Alpha
coefficient. The two dimensions of the scale were, therefore, split
and treated as separate variables for all subsequent analyses,
thereby turning them into a form of point measurement. In his
Canadian study, Clark also had a problem with this scale which, in
that instance, achieved a reliability coefficient of only 0,28.
4.2. Multidimensionality.
Where appropriate, item correlations and factor analyses were carried
out on the contextual scales and are displayed in Figures 7.25
through Figure 7.32. Significant correlations and factor loadings
are highlighted and discussed with each diagram.
4.2.1. Dependence.
The correlation matrix for all of the dependence measures together
is shown as figure 7.25. It will be seen that all of the most
significant correlations occur along the dimensions of public
accountability and size relative to owning group.

-l95-
I Variable 1 2 3 1. Origin
1
2. Status of establishment 1.000
0.138 1.000
5 6
I I 3. Public Accountability
14. Relative size 0.374 0.193 1.000
0.293 0.364 0.542 I
1.000
I Is. Dependence on supplier 6. De endence on customer
0.073 0.103 -0.031
0.026 0.014 0.044
0.082 1.000
0.108 0.047 I
1.000 I
2 - tailed significance : Bold = .001 Italics = .01
Figure 7.25 Dependence: Item correlations
It would seem, therefore, that the most significant relationships
insofar as dependence is concerned are internal and connected to
ownership and accountability. The two external dependence
variables showed no significant correlations, either to themselves
or to the other dependence measures.
iitem Factor 1 Factor 21 IL Origin 0.63341 1 -0.009321 12. Status of establishment 0.48479 0.34716 i 13. Public Accountability 0.82325 -0.123491 14. Relative size 0.805021 0.17211!
15 Dependence on supplier -0.02889 0.83551
6. Dependence on customer 0.050131 0.48400
i 1 Rotated Factor Matrix: Varimax converged in
i 3 iterations.
Figure 7.26 Dependence : principal component analysis
Turning to the factor analysis of this scale, a principal compon
ent analysis (figure 7.26) provided results that allowed for a
different interpretation. Two distinct factors were thrown up :
the first to do with ownership and accountability and the second,
quite clearly, to do with external dependence. So external
dependence does present an independent dimension which has
possible significance for causality. The percentage of variance
explained by each of the factors is as follows :
Factor 1:
Factor 2:
Ownership and Accountability
External Dependence
% ofYar
33,5
17,6
Cum %Yar
33,5
51,1

-196-
4.2.2. Technolon.
;1. 12. 3.
For the purpose of item analysis, both of the Technology scales of
Workflow Integration and Process Technology were combined into a
single matrix. The correlation matrix is shown as figure 7.27.
Variable 1 2 3 4 5 6 Mode I 1.000 I Range \ 0.501 1.000
Custom 1-0.168 -0.080 1.000
4. Small batch I l-0.180 -0.080 0.449 1.000
/s. Large batch I
-0.044 -0.048 -0.001 0.053 1.000
6. Mass production -0.025 0.111 -0.106 -0.074 0.233 1.000
7. Continuous recess 0.365 0.234 -0.164 -0.363 -0.158 0.006
2 - tailed significance : Bold = .001
Figure 7.27 Technology: Item correlations
Apart from the first two items which comprise the Workflow Integ
ration scale and are, therefore, strongly correlated with each
other, most of the other correlations were negative. This is to
be expected as most organizations would be married to a single dom
inant technology and the choices open to them are largely mutually
exclusive. Interestingly, though, there was a signiticant correl
ation between Custom and Small Batch technologies, throwing up the
possibility of a "customized small batches" category of process
technology. It was also noted that the Workflow Integration
variables are correlated with the most automated level of the
Process Technology scale. This is logical since the Workflow
Integration actuaJiy measures the degree of automaticity.
The factor analysis for the Technology scales is shown in tigure
7.28. Three factors were extracted and their Alpha coefficients
and explanation of variance are set out below :
7
1.000
Factor 1:
Factor2:
Factor 3:
Automaticity
Customized I small batch
Large batch/mass
Alpha
0,52
0,62
0,38
% ofYar
29,6
18,5
.17,2
Cum% Yar 29,6
48,1
65,3

-197-
Item I Factor 1 Factor 2 Factor 3 1. Mode 0.83117 -0.13621 -0.04786 2. Range 0.84942 0.04563 0.11305 3. Custom -0.02284 0.78986 -0.12702 4. Small batch -0.08937 . 0.85188 0.02561
i 5. Large batch I -0.08256 0.08722 0.77048 · 6. Mass production 0.08085 -0.14260 0.76790 7. Continuous process 0.50101 -0.46157 -0.23787
L Rotated Factor Matnx; I 1 Vanmax converged m 5 Iterations.
I
Figure 7.28 Technology : principal component analysis
All of the items load very significantly and the logic of the
three factors follows that of the original measures closely, i.e.
a measure of automaticity combined with an evaluation of increas
mg levels of continuity of throughput or automation. Separating
out the factors has a considerably deleterious effect on reliabi
lity and so it is doubtful whether any worthwhile purpose would be
served by pursuing any of the factors separately.
4.2.3 Power Control
The Power Control scale was improved by dropping two items which
had apparently been clumsily worded and had caused some confusion.
Variable 1 2 3 4 5 6 1. Structure independent of strategy 1.000
2. Power enhancing structural choices 0.319 1.000
3. Self-serving ideas 0.178 0.431 1.000
4. Dominant coalition 0.009 0.099 0.132 1.000
5. Structure independent of size 0.242 0.115 0.087 0.039 1.000
6. Struct. independent of technology 0.352 0.182 0.087 -0.024 0.361 1.000
7. Struct. independent of environment 0.550 0.266 0.136 -0,015 0.318 0.617
2 - tailed significaoce : Bold = .001 Italics = .01
Figure 7.29 Power Control: Item correlations
This improved the reliability coefficient to the extent indicated
earlier in figure 7.24. The correlation matrix is shown above in
7
1.000

I
-198-
figure 7.29. The most significant correlations indicate~ that
organization structure is simultaneously independent of strategy,
size, technology, and environment. At the same time, self serving
ideas and power enhancing structural choices are positively
related to each other. So there does not seem to be any linkage
between structure and any of traditional structural imperatives of
strategy, size, technology or environment.
A first reading of these interrelationships certainly seems to
indicate that there may well be some support for the power control
viewpoint In other words, organization structure is nothing more
than the result of the dominant coalition seeking those controls
and designs that will enhance their power.
The factor analysis extracted two fairly clear dimensions of this
scale. These were labelled Structural Independence and Political
Manipulation respectively. Examination of figure 7.30 indicates
that the component dimensions are quite self explanatory and do
not need further elucidation.
Item I Factor 1 Factor 2 1. Structure independent of strategy 0.68842 0.23914 2. Power enhancing structural choices 0.29052 0.73894 3. Self-serving ideas 0.10021 0.80103 4. Dominant coalition -0.12352 0.47973 5. Structure independent of size 0.58867 -0.01688 6. Struct. independent of technology 0.80949 -0.04453 7. Struct. independent of environment 0.85476 0.07725
Rotated Factor Matrix: Varimax converged in 3 iterations.
Figure 7.30 Power Control : principal component analysis
Alpha coefficients and percentages of variance accounted for are
detailed below :
Factor 1: Structural Independence
Political Manipulation
Alpha 0,73
0,45
% ofYar 35,6
18,7
Cum% Yar 35,6
54,3 Factor2:

-199-
In summary, it appeared that once the Power Control scale had been
modified to remove the two doubtful items it performed quite well
as an independent variable in this study.
4.2.4. Environment
For item analysis purposes, it was decided that the scales for env
ironmental change and environmental predictability were conceptual
ly close enough to combine into a single measure of environmental
uncertainty. Figure 7.31 illustrates the resultant correlation
matrix. The first six items comprised the change scale and the
next eight were from the predictability scale.
1 Variable 1 2 3 4 5 6 7 8 9 10 11 jl. Job changes over 5 years LOO 2. Socio-economic & political 0.22 1.00
! 3. Community & professional 0.15 0.41 1.00
14. Work methods & requirements 0.11 0.05 0.06 1.00 Is. New techniques & methods 0.21 0.27 0.24 -0.04 1.00
16. New types of problems 0.28 0.21 0.16 0.17 0.41 1.00
1 7. Operations technology 0.05 -0.02 -0.02 0.03 0.10 0.14 1.00
I 8. Competitors• actions 0.08 0.01 -0.05 0.08 -0.03 0.12 0.20 1.00
19. Market demand 0.04 0.03 -0.02 O.Dl -0.03 O.D7 0.08 0.24 1.00
10. Product attributes/design 0.00 -0.02 0.04 0.09 0.06 0.12 0.27 0.14 0.20 1.00
1 11. Raw material availability -0.04 -0.04 -0.02 0.00 -0.02 O.Dl 0.11 0.17 0.11 0.2S 1.00
O.D7 0.05 O.Q3 0.04 0.02 O.D7 0.09 0.08 0.11 0.16 0.2S
12
1.00 j 12. Government regulations 1 13. Labour union actions 0.11 0.02 -O.Dl 0.04 0.05 0.05 0.16 0.19 0.18 0.09 0.15 0.29 I
i 14. Raw material rice -0,03 0.06 0.01 0.06 0.07 0.02 0.14 0.15 0.12 0.22 0.42 0.26
2-tailed significance : Bold = .001 Italics = .01
Figure 7.31 Environment : Item correlations.
It will be seen that the significant correlations mirror these two
composite dimensions of the total scale. The top half of the mat
rix highlights relationships between socio-political and community
variables, as well as between work methods and new techniques and
problems. The bottom half looks at associations involving govern
ment regulations, trade union activities, and, finally, material
availability and prices. These relationships were crystalized
further in the factor analysis.
13 14
1.00
0.23 t.OO!

-200-
Principal component analysis yielded five factors, two of which
showed no clear rationale or ease of analysis. A principal factor
analysis was then carried out and again five factors were gener
ated, as shown in figure 7.32. This time, however, all five of
the factors lent themselves to analysis and examination. A five
factor solution is, obviously, not congruent with the objective of
parsimony in the analysis. Nevertheless, the environment is, by
definition, diverse and complex and it would be inherently diffi
cult to devise a simple, unidimensional measure. A homogeneous
environmental measure is, perhaps, a contradiction in terms. For
this reason it was probably better that principal factor analysis
was used as a data description technique rather than the principal
component data reduction technique.
Variable ' Factor 1 Factor 2 Factor 3 Factor 4 1. Job changes over 5 years -0.12724 0.29271
0.16001 0.14936 0.05554 0 66910
0.22729 0.68891 0.55257 0.07697 023666
0.18279 0.04491
"-0.00933 0.21822 0 12435
2. Socio-economic & political 3. Community & professional 4. Work methods & requirements 5 New techniques & methods 6. New types of problems 7. Operations technology 8. Competitors' actions 9. Market demand 10. Product attributes/design 11. Raw material availability 12. Government regulations 13. Labour union actions 14. Raw material price
I
-0.01149 0.02167
-0.00208 0 08241 0.00159 0.25463 0.13660 0.14170 0.41919 0.61463 0.30085 0.14039 0.58462
-. 0.59827 0.15858 0.26127 0.19126 -0.10675 0.25911 0.01894 -0.05379 0.45693
-0.02590 -0.00486 0.34848 0.10843 -0.03604 0.30996
-0.05834 -0.02916 0.09460 0.01649 0.05893 0.09191 0.05713 -0.02762 0.18039
-0.00447 0.06279 0.04142
Factor 5 0.153871
-~:~;~I 0.008561 0 01876 I o:oo264/ 0.04200 I 0.141021 0.153341
-0.04998 0.12259 0.36346 0.60878 0.23684
Rotated Factor Matrix: Varimax converged in 8 iterations.
Figure 7.32 Environment : principalfactor analysis
The five factors that emerged were all reasonably easily labelled
and the recalculated alpha coefficients together with the table of
variance percentages interpreted by each of the factors is set out
below. The division between the two aspects of the combined scale
is again apparent in the factor analysis. The second and third
factors are loosely analogous to the first six items or the change

Factor 1:
Factor 2:
Factor 3:
Factor4:
Factor 5:
-201-
scale. while the next eight appear to reflect the remaining items,
or the predictability scale.
Al12ha % QfVar Cum~ Var Material: price & availability 0,56 17,4 17,4
Technological demands 0,58 14, I 31,5
Community & Socio-economic 0,58 8,5 40,0
Strategic Marketing demands 0,39 7,8 47,8
Politico-legal pressures 0,45 7,3 55,1
Bearing in mind that later factors should load heavier to be signi
ficant and coupled with the small percentage of variance explained
by the rast two factors, it becomes apparent that the first three
environmental factors are the most prominent The most important
factors are procurement of materials and technological challenges,
which is probably in keeping with South Africa's status as a
developing country. Significantly, strategic market demands come
a distant fourth, barely making it into the reckoning of critical
intluences.
4.2.5 012eratin& EnviTQnment
The final contextual measure was the debatable Operating Environ
ment scale. lt consisted of only four dimensions and these are
exhibited in figure 7.33. It will be seen that the first three
items are reasonably clearly related to each other and the fourth
is not related at all to any of the others.
Variable 1 2 3 4 1. Familiarity of events 1.000
2. Rapidity of change 0.208 1.000
3. Visibility of the future 0.436 0.234 1.000
4. Complexity 0.051 -0.014 0.032 1.000
2-tailed significance: Bold = .001
Figure 7.33 Operating Environment : Item correlations.

-202-
The factor analysis revealed a two factor solution (tlgure 7.34)
with all of the items loading very highly. Although Anshotl and
Sullivan ( l Y'JJ) used the term complexity to describe the last item
on the scale, it is possibly a misnomer. All of the options on
this item in fact concerned only the geographical scope of the
organization's business operations.
Item Factor 1 Factor 2j 1. Familiarity of events
I
0.77862 0.123571 2. Rapidity of change 0.59767 -0.188621 3. Visibility of the future 0.79627 0.06936 4. Complexity 0.01183 0.97730
Rotated Factor Matrix: J Varimax converged in 3 iterations.
Figure 7.34 Operating Environment principal component analysis
So the two factors can be labelled (i) operating environmental
turbulence, and (ii) scope of operating environment. The
recalculated alpha coefficient for the first factor came out at
0,54. It was not possible to provide a revised alpha coefticient
for the second factor because it consisted of only one item. The
percentages of variances explained by the two factors were :
% ofVar Cum% Var
Factor 1: Turbulence · 40,0 40,0
Factor 2: Scope 25.2 65,2
So, in terms of homogeneity, this scale was fairly unidimensional,
despite being a measure of environment Insofar as it confined
itself to only certain aspects of the operating environment, its
performance seemed to be quite satisfactory.
4. 3. Framework for Analysis : concludina: remarks.
The above section concludes the framework for analysing the
organizational and contextual variables. The contextual variables

-203-
were quite obviously discrete and independent of each otheJ;. So
there was no requirement to perform either a correlational analysis
or a factor analysis on all the variables combined as a whole.
With the generation of the above 34 summary diagrams the position was
reached where the relationships between contextual and organizational
variables could be thoroughly explored. The next chapter describes
how this was done.
5. SUMMARY.
In this chapter each of the scales and measures that comprised the Ques
tionnaire measuring instrument were subjected to detailed item analyses
to establish their strength and suitability for inclusion in further
analyses to explore causal relationships. In order to accomplish this
item analysis the data gathered by each scale were subject to
statistical procedures in order to establish the scales' reliability,
multidimensionality, and, tinally, their construct and content validity.
In summary, it may be said that the dependent variable scales of struc
ture and organization climate, as well as the independent contextual
variable scales, all performed sufficiently well to justify their
inclusion in further analyses. Although there were one or two areas of
concern in both the dependent and
highlighted in the course of the item
serious enough to render any of the
be precluded from the causal analysis.
independent scales. These were
analyses but none were considered
scales so deticient that it had to
Having established the strengths and weaknesses of the measures used it
became possible to use these as building blocks to explore the causal
relationships that possibly existed between the independent contextual
variables and the dependent structural and organization climate
variables. This exploration forms the subject of the next chapter.

CHAPTER EIGHT: STATISTICAL ASSOCIATIONS AND CAUSAL RELATIONSHIPS.
1. INTRODUCTION.
In this chapter the statistical associations and possible causal
relationships that became evident in the course of this study will he
pursued. The point has been made in many similar studies throughout the
world that causality has not been proven. Aldrich ( 1972), in
particular, challenged the claims to causality put forward by the Aston
group. Using path analysis techniques Aldrich suggested that the
direction of some of the relationships identified by the Aston
researchers could in fact be the opposite to what they had postulated.
For the purpose of this study and the discussions of statistical
associations the term causal will still sometimes be used for the sake
of conventence. However, it is accepted that the most that can he said
of the independent variables is that they predict elements of
structure and climate, and that they do not necessarily cause them.
The chapter will begin by outlining again the independent and dependent
variables. This will include a brief discussion of the Multiple Linear
Regression statistical model and some problems encountered because of
the diversity and large size of the total sample. The structure of
organizations in the manufacturing industry will then be examined from a
global point of view and some conclusions will be drawn with respect to
the main associations arising from the multiple regression analysis.
The level of analysis will then move into a more focused perspective as
the sample is stratified according to the various Standard Industrial
Classification (SIC) codes which comprise the manufacturing sector.
Significant relationships within - and differences between - industries
will he highlighted and discussed.
Finally, the analysis will shift to Organization Climate and both the
contextual variables and the structural variables wili be treated as
independent variables for the purpose of extracting noteworthy
relationships.

I
-205-
In the next chapter, the research problem will be revisited and the
hypotheses will be re-examined with a view to establishing the degree to
which they have been supported in this South African study.
2. PREDICTING STRUCTURE AND ORGANIZATION CLIMATE.
I
1.
2.
3.
4.
5.
6.
Figure 8.1. summanses all of the independent contextual variables as
well as the internal dependent variables. The procedure was to treat
Independent I Dependent Contextual Structural Variables Variables
Actual size 1. Specialization
Age 2. Formalization
Technology 3. Standardization workflow integration process technology 4. Configuration
Dependence 5. Centralization internal dependence customer dependence 6. Organicity supplier dependence
7. Organization Power Control Climate
Environment change uncertainty operating environment
Figure 8.1. Independent and Dependent Variables.
each of the six structural variables and eight organization climate
variables as dependent variables and to ascertain how much of the statis
tical variance in each dependent variable could be predicted by the
independent contextual variables. The exercise was repeated with the
organization climate variables and then expanded in that each of the in-

-206-
ternal structural variables was also treated as an independent variable
for the purpose of predicting and analysing organization climate. The
search for statistically meaningful relationships was carried out by
means of multiple linear regression.
2.1. Multiple Linear Regression.
The multiple linear regression procedure can be extremely complex and
elaborate, particularly if the analysis includes a detailed examina
tion of the residuals from every regression equation. This is often
done in order to establish that the basic assumptions of multiple
regression analysis have not been violated.
Such a detailed scrutiny of residuals was at odds with the objectives
of this study, which were to keep the statistical procedures as
simple as possible. The point was made earlier that this study is
about Organization Theory, and not about statistical procedures used
in organization studies.
Nevertheless, it was felt that a basic analysis of residuals was
desirable and so it was carried out for each of the structural
regression equations. The residual analyses consisted of:
(i) the Durbin- Watson statistic - to test for sequential
independence of observations,
(ii) standardized outliers - extracting the ten cases with
the largest absolute values after residual scores have been
standardized,
(iii) histogram of standardized residuals - which plots the
observed residuals against an expected normal distribution
and highlights skewness and non-normality in the residual
display, and

-207-
(iv) normal probability plot of standardized residuals -
which also checks for normality by plotting the cumulative
probability of observed residuals on the expected residuals
(i.e. a straight line).
In one or two instances a transformation of the data, e.g. by taking
the natural log of the dependent variable, did achieve a better
solution.
2. 1. 1. Sample Size and Linear Relationships.
A large sample siZe IS normally considered advantageous to
statistical analysis because it enhances the credibility of the
statistics drawn from the sample and Increases their
generalizability to the population from which they are drawn.
An apparent problem encountered early in this study was the
generally low levels of both correlation ( R) and the concomitant
amount of variance explained in the multiple regression analysis
( R 2). Although these statistics were not really low in absolute
terms, they were certainly a fair amount lower than those
encountered in similar studies carried out overseas.
However, the sample sizes of most of these overseas studies were
considerably smaller than the sample size of this study and this
fact pointed to the most likely explanation for the smaller South
African correlations.
The strongest predictive relationship between two variables yield
ing a perfect correlation (R = 1,0) would be shown graphically as
a straight line. In practice, a batch of observations which
exhibits a strong linear relationship between variables comes out
as an elliptical cluster when displayed on a graph, as in figure
8.2. The more the distribution resembles a circle, the closer the

-208-
correlation approaches zero, indicating no linear relaqonship
between the variables ( R = 0).
y
... • :1. ••• : . . . : . . . . . . . : . . . : . . .. : . . . . . . . . . . . . . .
: i : : . : . : : . : . : .
. . . . . . . . . . ..... :. :::.
. . . . . .
. .
Figure 8.2. Linear relationship (1) X
It becomes apparent that if a second group of data showing just as
strong a relationship on the same variables, but on a different
scale - such as in tigure 8.3 - is combined with the first set,
the overall distribution is now no longer elliptical in shape and,
therefore, it is not as strongly c·orrelated.
y
. .
. . . : . . ... . . . . . . . . . . . . .. . . . . . . . . . ..
. . . . . . . .
. . . . . . . . . : . . . : . . . . . . . . . ..
. . :. \ .
Figure 8.3. Linear relationship (2)
: ..
X

-209-
This is indeed what appeared to happen in this study. Although
the research population was classified under the broad heading of
Manufacturing Organizations, it soon became clear that there
was a good deal of differences and nuances within and between ind
ividual sub-groups and types of manufacturers. This line of
thought is pursued in section 4 of this chapter which describes
how the analysis was conducted at a more focused level when the
sample was stratified according to the SIC codes. Where the
number of cases per sample approximated more closely the sample
numbers of the overseas studies, the correlations also went much
higher and resembled those of these earlier studies.
3. ORGANIZATION STRUCTURE.
Each of the dependent structural variables was submitted in turn to a
step-wise multiple regression, and the results are shown below in fig
ure 8.4 to tigure 8.9. These tables list the main predictor variables,
i.e. those that passed the inclusion criteria for the analysis, in order
of their magnitude or importance. The column headed 'Single R' contains
the correlation for each variable and the column headed 'R 2' shows the
. total amount of variance explained. The ·Multiple R' column indicates
the multiple correlation coefficient for the combined variables.
The 'F Ratio' column is the F statistic for the null hypothesis that
there is no linear relationship between the dependent and independent
variables. The final column is the level of significance for each parti
cular null hypothesis. If the F statistic is large and the level of
significance is small then the null hypothesis is rejected in favour of
the alternate hypothesis that there is a linear relationship between the
variables. In nearly every case the F statistic is indeed very large
and the level of significance is minuscule. This happy situation is a
function of the large sample size since the number of observations (N)
is a factor in the calculation of both the F statistic and the level of
significance.

-210-
The degree to which the independent variables affect the dependent
variables is also intluenced by the degree to which the independent
variables are related to each other. If the causal variables are
closely related it would be difficult to isolate one variable's
predictive effect on the outcome variable. Ideally, one would prefer
that the independent variables are totally independent of each other,
for the sake of clear analysis and valid causal inferences.
A measure of the relatedness, or collinearity, was, therefore, included
in each regression equation. The measure that was used is a statistic
called the Tolerance of a variable. The Tolerance of an independent
variable is defined as 1 - R; where Ri is the multiple
correlation coefficient when that particular independent variable is
predicted from the other independent variables. So the smaller the
Tolerance, the greater the linear relationship between the independent
variables; and the greater the Tolerance - i.e. the more it approaches a
value of 1,0- the more independent the variables are of each other.
In the process of analysing the residuals from each regression equation,
the lO most extreme values, or outliers, were isolated as part of the
analysis. It was found that removing these outliers from subsequent
analyses had the effect of a fair improvement in the clarity of the
results with only a very marginal loss of sample size.
3. l. Predictin& Specialization.
Figure 8.4 iJJustrates the main independent variables which
influenced the structural variable of Functional Specialization.
There are four significant predictors which together have a multiple
correlation of nearly 0,44 and account for almost 20% of the
variance. AU four exhibit positively directed relationships. So
the amount of Specialization in manufacturing organizations increases
in relation to the size of the organizations as well as the age of

I !
the organizations.
dent on its owning
group, the greater
-211-
Furthermore, the more an organization IS depen
group and on other organizations within its owning
will be the amount of Specialization. Finally,
the more turbulent the organization's operating environment, the more
likely the organization is to respond by increasing the amount of
Specialization in the organization.
Significance! : lndeEendent Variables '
R2 F Ratio Level · I
Organiz~tion Size 0.4007 0.4007 0.1606 84.940 0.0000 Organization Age 0.2009 0.4177 0.1744 46.775 0.0000 Internal Dependence
I 0.1022 0.4302 0.1851 33.461 0.0000
Operating Environment 0.1576 0.4387 0.1925 26.276 0.0000
Figure 8.4. Predicting Specialization
Of the four predictors, Organization Size is by far the most signiti
cant. This is in keeping with most other studies in both advanced
economies as well as in developing economies. Certainly, the studies
that have followed the Aston methodology have been unanimous in their
evaluation of the importance of Size in predicting Specialization.
This lead Hickson et al ( 1974) to propound their "Culture-free
Hypothesis" regarding the pervasive effect of Organization Size on
Specialization and Formalization which extends across cultural
barriers.
Intriguingly, though, Technology did not feature at all as a
predictor of Specialization in this study. This has not been the
case in other studies, particularly third world studies, where
Technology usually does feature. Hickson and McMillan (1981)
indicated a number of studies where Technology is consistently among
the top four causal variables of Specialization. These include
Jordan (2nd), the United States (3rd), Egypt (2nd), Rndia (2nd),
Britain (3rd), Japan (4th), and Sweden (4th). Although Clark ( 1990)
in his study of Canadian Textile firms also highlighted no signiti-
I
I

-212-
cant relationship between Technology and Specialization, this seems
to be the minority view. Generally, it seems that among developing
economies Technology is more prominent in predicting Specialization
than it is in developed countries. Shenoy ( 1981) speculated that the
reason for this situation in India lies in the fact that technology
is almost always imported and expensive. So specialists are appoin
ted to safeguard valuable assets and firms tend to bureaucratize
their controls as technology advances.
Why, then, does Technology not feature as a causal imperative for
Specialization in South African manufacturing organizations? There
are probably a number of reasons. For example, a history of economic
sanctions and a two-tier currency system and strict exchange controls
may have discouraged investment and resulted in a capital base of
plant and equipment that is old, outmoded, and technologically
unsophisticated. The Monitor Company's recent evaluation of the
South African economy drew attention . to this country's lack of
sophisticated machinery as a strategic weakness. (Monitor Co, 1995).
Another possible reason could lie in the First world /Third world
dichotomy that was highlighted in the previous chapter. In a labour
intensive situation where a large part of the workforce is poorly
educated and unsophisticated, it is unlikely that Technology would
exercise pressure on the way an organization chooses to structure its
activities or that it would spawn specializations.
The Tolerance statistics for the four predictor variables of
specialization were
Organization Size
Organization Age
Internal Dependence
Operating Environment
0,8839
0,9407
0,9787
0,8403
Intrinsically, one would have estimated that the variables of Size,
Age, and Internal Dependence would be related to each other to some
degree. Yet their tolerance levels were very high, indicating strong
independence and lack of collinearity. Almost surprisingly the opera
ting Environment variable exhibited the lowest Tolerance, despite

-213-
being the only independent variable which cannot be associated with a
specific organization.
3.2. Predicting Formalization.
I I
I
The most powerful predictor of Formalization in manufacturing organi
zations is the degree of Internal Dependence; this variable on its
own accounted for l2% of the variance and had a correlation of 0,35.
So the greater the dependence of an organization on its parent comp
any or owning group, the greater the degree to which its normal day
to day activities will be formalized and committed to writing.
Size, Technology and the amount of environmental change are also
important factors in determining the amount of Formalization and
together they account for a further 15% of the variance, as can be
see in figure 8.5. Thereafter the additional variance accounted for
I
Single I Multiple Significance! i Independent Variables R R Rz F Ratio Level
I Internal Dependence I 0.3445 0.3445 0.1187 60.078 0.0000 Organization Size 0.2926 0.4582 0.2099 59.121 0.0000 Workflow Integration 0.2889 0.4957 0.2457 48.210 0.0000 Environmental Change 0.2305 0.5228 0.2733 41.659 0.0000 Organization Age 0.1611 0.5315 0.2825 34.802 0.0000 Power Control -0.2394 0.5386 0.2901 30.030 0.0000
Figure 8.5. Predicting Formalization.
by the final two causal variables becomes smaller and altogether the
six predictors have a multiple correlation of 0,54 which accounts for
29% of the variance.
Interestingly, the direction of the relationship with Power Control
is negative, so the tess an organization is driven by internal
political forces, manoeuvring and in-fighting, the more formalized

-214-
its structures and procedures will be. Assuming the converse to he
true, then a more politically oriented organization is likely to have
fewer formalized routines and systems. Bearing in mind that Formali
zation is an alternative control strategy, particularly with the more
advanced and literate sections of the workforce, one would anticipate
that the relationship between Power Control and Centralization should
be quite strong. In other words, a strongly politically driven
organization would rely on Centralization rather than Formalization
to maintain control. It is to be expected that the members of the
dominant coalition in a very politically active organization would
find it difficult to relinquish the reigns of power to facilitate
decentralization. Examination of the Centralization variables,
which is discussed in section 3.5 below, seemed to indicate that was
so.
Comparing the results of the multiple regression with respect to
Formalization to similar studies done in other countries, the triad
of Internal Dependence, Size and Technology are familiar features of
comparable analyses in both developed and developing economies.
Again, the situation in this South African study lends support to
Hickson (1974} et al's Culture-free Hypothesis.
The degree to which the six causal variables were independent of each
other or, alternatively, exhibited collinearity is apparent in their
Tolerance statistics:
Internal Dependence 0,9709
Organization size 0,8584
Workflow Integration 0,9041
Environmental Change 0,8561
Organization Age 0,9368
Power Control 0,8394
All of the Tolerance statistics are large enough to encourage the
belief that the Independent Variables were not related to each other
to any significant degree.

-215-
3.3. Predictin2 Standardization.
It will be remembered from the discussion surrounding the operation
alizing of the dependent variables in chapter 5 that the measure of
Standardization that was eventually used in this study incorporates
the concept of Routinization. In other words, it includes not just
similarity of tasks but also simplicity and repetition of tasks.
Figure 8.6 illustrates the four main predictors of Standardization
which, between them, have a multiple correlation of 0,40 and account
lnde endent Variables
Operating Environment· Environmental Change Organization Age Workflow Integration
1
Single : Multiple R I R
1
-0.29831 -0.27761
,-0.12751 1 -0.1647 1
0.2983 0.3567 0.3793 0.3979
0.0890 0.1272 0.1439 0.1583
Figure 8.6. Predicting Standardization.
F Ratio
43.571 32.427 24.876 20.828
Significance! Level
0.0000 0.0000 0.0000 0.0000
for 16% of the vanance.
directed.
All of the relationships are negatively
So the less turbulent the Operating Environment and the fewer the
Environmental Changes, the more the degree of standardization and
routine. This would make sense in terms of an organization structur
ing its activities to respond to and capitalize on events in its
environment while maintaining the optimum level of internal control.
In terms of internal control, organizations tend toward bureaucratiza
tion - and a stable and settled environment would allow for the
implementation of routine and mechanistic structures and procedures.
The other side of the coin is that the more turbulence and change

-216-
there is m the environment, the more likely an organization 1s to
respond with organic, tlexible and non-routine structures and activities.
The significance of the relationships exhibited by the third and
fourth independent variables, i.e. Age and Technology, are much less
obvious. [t seems that in the South African Manufacturing Sector the
younger an organization and the less automated its technology, the
more the amount of standardization and routine it will have. These
relationships are almost the opposite of classical Organization
Theory which normally holds that as an organization develops along
its life cyde its technology tends to become more automated and
rigid and so standardized controls and routine activities are more
prevalent in older organizations.
In a study of 31 South Korean organizations, Kim and Utterback ( 1983)
made the following observations with respect to organizational
evolution in a developing country :
fn a developing country, manufacturing organizations in the early stages of an industry are small, have adaptable operations technologies and a mechanistic organization structure, produce infrequent product changes, perform merely assembly of standardized products with low indigenous technical capability and perceive that raw material and equipment suppliers together with government incentive programs are important components of the task environment Conversely, organizations in the later stage of an industry are large, have relatively more rigid operations technology and relatively organic structure, produce frequent product changes, and perceive that the customers, competitors, and suppliers and government controls that affect technical and capital investments are important components of the task environment
Although the development of operations technology appears . to follow
the same direction as in a developed economy, i.e. from adaptive and
less automated to rigid and automated, it does so for different
reasons. In a developed country the technology is initially
non-routine and adaptive to accommodate a dynamic environment and
rapid product changes until market position is established and opera
tions technology becomes more standardized and routine to, accommodate

-217-
larger production runs and to achieve cost advantages in a more
stable environment rn a developing country, on the other hand, oper
ations technology is adaptable, not to accommodate product changes
since products and technologies are largely imported and standard
ized, but rather to take advantage of abundant and relatively cheap
skilled and semi-skilled labour. (Kim and Utterback, 1983: 1195).
Kim and Utterback ( 1983 : 1196) speculated that the differences
between developed and developing countries stems from directional
differences in environmental change. The environment is hypothesized
to evolve from turbulent to more stable in a developed country, while
m a developing country it moves from relatively stable to more turbu
lent as an organization grows and is less protected and comes into
contact with foreign competition for the tirst time. The structuring
of its activities would then need to be more orgamc and tlexible at
a later stage of its life cycle as a strategic response to environmen
tal pressure as the organization develops and grows.
Examining the collinearity of the independent variables for the
regression analysis of the Standardization variable, the following
Tolerance statistics emerged :
Operating Environment 0,9068
Environmental Change 0,9007
Organization Age 0,9920
Worldlow Integration 0,9663
Tolerances above the 0,9 level again encouraged the belief that the
independent variables are not related to each other.
3.4. Predictin& Confi&uration.
All SIX configuration variables are displayed together in tigure 8. 7
along with the main predictors for each dependent variable. Most
overseas studies have concentrated on the three structuring of activi-

-218-
ties variables, i.e. Specialization, Formalization and Standardiza
tion which, together with Centralization, have formed the basis of
most of the discourses on organization structure. Scant attention is
paid to Configuration these days, despite the fact that many of the
earliest organization studies, for example Woodward (1958), regarded
configuration or shape as the entire scope of the study of organiza
tion structure. The impact on Configuration of the main predictive
variables in this study is outlined below.
j Dependent variables Single 1 Multiple R I R
Significance! 1 lnde endent Variables R2 F Ratio Level I ! Executive Span
Organization Size Or anization e
Organization Size Workflow Integration Operating Environment
Organization Depth Organization Size Power Control Workflow Integration
Management Ratio Operating Environment Organization Age Environmental Change
Indirect Worker ratio
I Power Control Organization Age
1 Clerical worker ratio Organization Age Process Technology Operating Environment Customer Dependence
0.2999 0.2999 0.15361 0.3136
: 0.1342 I 0.1342 1-0.1183 i 0.2069 -0.1163 0.2504
0.3835 0.3835 0.3748 0.3953
. 0.1820 0.4084
0.1528 0.1528 .I 0.1099 0.1858 I
0.1287 0.2076 !
0.11791 0.1179 0.1175 0.1655
0.1658 0.1658 -0.1475 0.2121
0.1197 0.2396 -0.1045 0.2614
0.0899 0.0984
0.0180 0.0428 0.0627
0.1471 0.1563 0.1668
0.0234 0.0345 0.0431
0.0139 0.0274
0.0275 0.0449 0.0574 0.0683
Figure 8.7. Predicting Configuration.
44.086 24.273
8.106 9.860 9.810
76.041 40.751 29.300
10.665 7.956 6.668
5.942 5.941
12.602 10.480 9.015 8.123
0.0000 0.0000
0.0046 0.0001 0.0000
0.0000 0.0000 0.0000
0.0012 0.0004 0.0002
0.0152 0.0029
0.0004 0.0000 0.0000 0.0000
Technoloay - Woodward (1958) also postulated that Technology was the
only structural imperative and she believed that the ultimate shape
that an organization structure assumes is attributable exclusively to
I I I I
I
I l
-219-
its operations technology. This hypothesis has been attacked many
times, most notably by the Aston researchers (Hickson et al,
1969), who proposed that Organization Size was a much more
influential predictor of structure.
Certainly, Woodward's view of technological exclusivity is not
supported among South African manufacturing organizations either -
although Technology does feature among the causal variables of three
of the configuration measures, viz:
the less automated the technology, the greater the ratio of
subordinates to first line supervisors. Job shop and small
batch operations would tend to be more labour intensive.
- the more automated the technology, the greater the organization's
depth. Highly automated technology is more sophisticated and
would require more specializations and more layers of support and
management staff
- the less continuous the production throughput, the greater the
ratio of clerical workers. Discontinuous production throughput
has connotations of more complicated scheduling, planning and
procurement operations which would mean a concomitant increase in
the number of clerical personnel.
Or2anization Size - Size features quite strongly in determining the
number of subordinates per first line supervisor, the depth of the
organization and, finally, the chief executive's span of control. So
the bigger the organization, the greater the Chief executive's span
of control, the more subordinates there are per first line supervi
sor, and, finally, the more layers there are in the organization
hierarchy.
Or2anization A2e - Insofar as the Age variable is concerned, there
are possible indications of, and support for, Parkinson's law. The
older a manufacturing organization gets, the greater the. number of
-220-
its clerical staff and the higher its ratio of indirect workers and
managers.
Parkinson formulated his law as a result of studies that he conducted
with the British Royal Navy. He discovered that over a fourteen year
period from 1914 to l928 total personnel in the navy decreased by 32%
while the number of new ships commissioned also decreased by 68 per
cent. This apparently had no bearing on the numbers of administrat
ive and support staff and the number of on-shore clerks and officials
increased by 40% while the officer corps increased an amazing 78
percent! (Robbins, 1987: 113- 116).
This tendency for an organization's support and administrative
functions to grow over time has been demonstrated in many other
studies, although, unlike the Royal Navy, in commercial organizations
it is usually accompanied by an increase in organization size and
activity level. It appears, though, that decreases m size and
activity level are not often accompanied, certainly in the short
term, by a concomitant decrease in the size of the administrative
component. (Robbins, 1987 : 116). lnkson et al (1970) speak of a
'ratchet mechanism' which sees increases in size resulting in
increases in structuring of activities, but decreases in size not
resulting in less structuring.
Environment - The effect of the Operating Environment as a predictor
is apparent on three of the Configuration ratios - management, first
line subordinates, and clerical workers. Environmental Change is
also evident as a predictor in the Management Ratio.
So the greater the amount of environmental turbulence in manufactur
ing organizations, the more managers, first line subordinates and
clerical workers they tend to have. This is a curious finding and
its significance was . not immediately clear. An organization could
well respond to increased turbulence and change by appointing a
larger management corps in an effort to manage and control the

-22 I-
environment's influence on the organization - but why would it have
more clerical workers and tirst line subordinates'! Perhaps it could
be the influence of a third or intervening variable such as the type
of industry in which the organization is engaged. In other words,
some industries may function in more turbulent, competitive environ
ments but, at the same time, they could lend themselves to more
labour intensive methods which employ more direct and lower level
workers. Examination of individual industries and industry groups
according to their SIC codes is pursued in section 4 below.
Power control - The political nature of the Power Control variable
is illustrated by its effects on Configuration. The two variables
affected by Power Control are Organization Depth and the Indirect
Worker Ratio. In other words, the more politically driven an
organization is the more layers of management it will have and the
greater will be the number of support staff. Both of these effects
smack of nepotism and reward for doing the bidding of the dominant
coalition. In addition, the creation of artificial layers of
authority and support-type jobs will have the effect of stacking the
deck in favour of the dominant coalition in terms of creating a power
base, as well as in maintaining centralized control. In support of
this assertion, Centralization ~nd Power Control were found to be
significantly related to each other, as will become evident in the
following section.
Collinearity did not appear to be a problem among the independent
variables in each of the multiple regression equations of the Config
uration dependent variables. Only two variables had Tolerances
marginally below the 0,90 level and more than half showed Tolerance
statistics of 0,95 or greater.
3.5. Predictine Centralization.
The results of the multiple regression of the three measures of Cent
ralization that were used in this study are illustrated m a combined

-222-
format in figure 8.8. It will be recaiJed that Autonomy Is an
overall measure of decentralization, while the other two scales
measured centralization. Specifically, the degree to which policy
decisions, on one hand, and first-line supervisory decisions, on the
other, were centralized.
i Dependent variables I
1 Single ! Multiple I I
Significancei I Independent Variables R R Rz F Ratio Level
:Autonomy
I
Internal Dependence -0.2889 0.2889 0.0834 40.604 0.0000 Operating Environment 0.1502 0.3442 0.1185 29.898 0.0000 Power Control l-0.1160 0.3597 0.1294 21.999 0.0000
Policy Decision Level Power Control 0.3415 0.3415 0.1167 58.895 0.0000 Organization Size -0.2746 0.4105 0.1685 45.082 0.0000 Environmental Change -0.2571 0.4288 0.1839 33.342 0.0000 Internal Dependence -0.1239 0.4447 0.1977 27.298 0.0000 Workflow Integration -0.2269 0.4563 0.2082 23.248 0.0000 Customer Dependence 0.0806 0.4641 0.2154 20.176 0.0000 Organization Life Cycle -0.1049 0.4716 0.2224 17.974 0.0000
First line discretion Power Control 0.2746 0.2746 0.0754 36.385 0.0000 Organization Age -0.1091 0.2966 0.0880 21.459 0.0000 Environmental Change -0.1860 0.3125 0.0976 16.014 0.0000
Figure 8.8. Predicting Centralization
Taken as a whole, there were no real surprises in the results of the
multiple regression of Centralization - except, perhaps, for the
absence of Organization Size as a predictor of Autonomy. The factors
that spark decisions to centralize or decentralize seemed to be quite
consistent with the accepted wisdom that has been inferred from other
studies, although the sequence may sometimes be a little different to
that which is followed in a developed economy.
Insofar as Autonomy was concerned, there were three significant
predictors of the overall decentralization or autonomy of organizat
IOns. These were Internal Dependence, the Operating Environment and,
1 I I I I I
-223-
finally, Power Control. The relationships between Autonomy and both
Dependence and Power Control were negatively directed, while the
relationship with the Operating Environment was positive. So the
less dependent on its owning company or holding group and the less
politically driven an organization was, the more autonomous and
decentralized it also was. Also, the more turbulent the operating
environment, the more autonomous was the organization.
It has become accepted that in a very turbulent environment tlex.ibil
ity and speed of reaction are essential elements to an organization's
survival - and centralized control and decision making hampers both
speed and. flexibility. Nevertheless, a typical short-term, or
crisis, reaction to intensified environmental turmoil is to enhance
centralization and direct management control. One would, therefore,
expect the Power Control variable to be associated with centraliza
tion in short term crisis situations only. In the longer term, a
rapidly changing environment would produce pressure to decentralize
decision making in order to enhance the pace and effectiveness of
responses to environmental changes. This situation appears to be
supported by the regression analysis of the Autonomy variable. In
other words, a manufacturing organization which : (i) functions in a
turbulent environment, (ii) is subject to less direct rule and
control from its dominant coalition, and (iii) is less dependent
on, or influenced by, its controlling group or holding company will
respond by decentralizing its controls and decision making.
Looking at the Centralization of Policy Decisions, there were
several significant predictors, which altogether presented a multiple
correlation of 0,47 accounting for 22% of the variance. By far the
greatest predictor was Power Control which had a correlation of 0,34
and accounted for 12 percent of the variance. This finding reinfor
ces the assertion made in Section 3.2. Predicting Formalization
that organizations which are· very political and exhibit a high degree
of Power Control would find it difficult to decentralize. This seems
to be especially so for an organization's policy decisions.

-224-
Taking all of the independent variables together, one 1s able to put
together a profile of "typical" organization that centralizes its
policy decisions:
It is a small organization, probably near the beginning of its
life cycle. It functions in a fairly stable environment, probably
because it is protected from overseas competition by government
policies and import barriers. It has little or no dependence on a
holding group or parent company, so its structure and ownership
are still quite simple and the influence of the owner. chief exec
utive, or dominant coalition, as the case may be, is very direct.
It is very dependent on its largest customer. The technology
employed is at an elementary stage and is relatively unsophisti
cated and unautomated. One would expect that as the organization
develops along its life cycle curve and becomes bigger and more
complex, so the pressure to decentralize would also increase.
It is interesting to note the similarity between this impression of a
South African manufacturing organization at the beginning of its life
cycle and the similar picture that was sketched on page 216 by Kim
and Utterback (1983) of young organizations in South Korea. So it
seems that there could well he common factors in the growth of
industries in developing countries which are different to the
accepted sequence and circumstances that. prevail in developed
economies.
Tlh.e final measure of Centralization concerned First Line Discretio
.D..I!:J decisions. Three independent variables were significant in
predicting centralization of lower level operating decisions. They
were Power Control, Organization Age, and Environmental Change.
These findings corroborated the results of the regression analyses of
both the Autonomy and Policy Decision variables. Again, Power
Control exercised the greatest influence on centralization and
organizations that sought to centralize their lower level decisions
also exhibited a high degree of Power Control. They also tended to

-225-
be younger and to function in a more stable environment with less
frequent environmental change. All in all, the situation was not
dissimilar to that of organizations that centralize their policy
decisions.
An examination of the Tolerance statistics indicated a generally acc
eptable level of collinearity between the predictor variables in the
analysis of the centralization variables. The two lowest Tolerances
both occurred in the Policy Decision regression equation and they
were for Power Control at 0,83 and Environmental Change at 0,86.
There may, in fact, be a degree of collinearity between these two
independent variables in that the reaction to perceived environmental
threat or turbulence is often the consolidation and centralization of
power by the organization's ruling alliance,
reaction.
i.e. the crisis
Other than these two variables, all of the other independent
variables m all three regression equations scored above the 0,90
level.
3.6. Predictin& Organicity.
The four main predictors of Organicity are displayed m figure 8. 9.
Single Multiple Significance lndeoendent Variables R R R2 F Ratio Level
Power Control -0.2112 0.2221 0.0446 20.820 0.0000 Internal Dependence -0.1586 0.2778 0.0772 18.609 0.0000 Environmental Change 0.1859 0.3006 0.0904 14.704 0.0000 Organization Size -0.0630 0.3237 0.1048 12.958 0.0000
Figure 8.9. Predicting Organicity
lt will be seen that all four together had a multiple correlation
coefficient of 0,32 and accounted for nearly 11 percent of the

-226-
vanance.
Robbins ( 1987 : 498) defined an orgamc structure as being flexible
and adaptive with emphasis on lateral communication, non-authority
based influence, and loosely defined responsibilities.
The relationship between Power Control - which was the most
significant of the independent variables - and Organicity was
negatively directed. This is to be expected because a high degree of
political machination and domination by a ruling clique would be
anathema to the open communication and free delegation of authority
and power th'at characterises an organic structure.
Other predictors of organic structure were independence from a cont
rolling group or holding company, smaller organizational s1ze, and an
environment characterised by a high degree of change and uncertainty.
All of these are factors which contribute to what is pretty much the
'classical' picture of organically structured organizations function
ing in a turbulent environment
The concept of environmental turbulence is central to any discussion
on organicity. Burns and .Stalker ( 1961), who coined the labels
Organic and Mechanistic to describe organization structures,
were among the first researchers to discover that organization
structures that existed in dynamic environments were very often quite
different. from those that were dominant in a more stable and settled
setting.
Bums and Stalker ( 1961) recognised that the mechanistic and orgamc
forms were ideal types and that they constituted polarities along a
continuum. No organization is purely organic or purely mechanistic
but, rather, is inclined toward one pole or the other. Efforts to
test their research conclusions have met with general support
throughout the world (Robbins, 1987 : 154), and this study is no
exception.

-227-
The relationship between Organicity and Environmental Change was the
only positively directed one to emerge from the regression equation.
lt will be remembered that the scale which measured Environmental
Uncertainty was an amalgam of environmental change and unpredictabi
lity. And so this study has confirmed ·that the nexus between
environmental uncertainty and organic structures also exists in South
African organizations - at least in a milieu typified by a large
amount of Environmental Change.
Finally, looking at the Tolerance statistics for the independent
variables, the following picture emerges :
Power Control 0,8544
Internal Dependence 0,9879
Environmental Change 0,8599
Organization Size 0,9594
Again, the lowest Tolerances were for the Power Control and Environ
mental Change variables, indicating a possible degree of simultaneous
occurrence and collinearity - for the reasons discussed in the previ
ous section; i.e. the reaction to perceived environmental threat or
turbulence is often the consolidation of power by the organization's
dominant coalition, i.e. the crisis reaction.
Generally it was felt that the levels of Tolerance were sufficient to
draw valid conclusions.
3. 7. Predictin& Structure : Concludina; Remarks.
The above section concludes the discussion with respect to the
possible predictive relationships that exist between the dependent
and independent variables that were catalogued at the beginning of
this chapter. A number of trends are apparent and these are brietly
explored below. All of the dependent variables and their main causal
variables are illustrated in figure 8.l0 overleaf.

-228-
I Dependent variables 1 Single 1 Multiple Si "fi I I gm cancer
Indeoendent Variables R I R R2 F Ratio Level i Functtonal Spectallzatton
Organization Size 0.4007 0.4007 0.1606 84.940 0.0000 Organization Age 0.2009 0.4177 0.1744 46.775 0.0000 Internal Dependence 0.1022 0.4302 0.1851 33.461 0.0000 Opera tim! Environment 0.1576 0.4387 0.1925 26.276 0.0000
Formalization
I Internal Dependence 0.3445 0.3445 0.1187 60.078 0.0000 Organization Size 0.2926 0.4582 0.2099 59.121 0.0000
I Worktlow Integration 0.2889 0.4957 0.2457 48.210 0.0000 I
I
Environmental Change 0.2305 0.5228 0.2733 41.659 0.0000 I Organization Age 0.1611 0.5315 0.2825 34.802 0.0000 I
I Power Control -0.2394 0.5386 0.2901 30.030 0.0000 I
1 Standardization I I
I Operating Environment -0.2983 0.2983 0.0890 43.571 0.0000 I Environmental Change -0.2776 0.3567 0.1272 32.427 0.0000 I
I Organization Age -0.1275 0.3793 0.1439 24.876 0.0000 I
Worktlow Integration -0.16471 0.3979 0.1583 20.828 0.0000 Executive Span
Organization Size 0.2999 0.2999 0.0899 44.086 0.0000 OrganizationA.ge 0.1536 0.3136 0.0984 24.273 0.0000
Subordinate Ratio Organization Size 0.1342 0.1342 0.0180 8.106 0.0046 Worktlow Integration -0.1183 0.2069 0.0428 9.860 0.0001 Operatin_g Envuonment -0.1163 0.2504 0.0627 9.810 0.0000
1 Organization Depth
Organization Size 0.3835 0.3835 0.1471 76.041 0.0000 Power Control 0.3748 0.3953 0.1563 40.751 0.0000 Workflow Inte_gration 0.1820 0.4084 0.1668 29.300 0.0000
Management Ratio I I
Operating Environment 0.1528 0.1528 0.0234 10.665 0.0012 I
I Organization Age 0.1099 0.1858 0.0345 7.956 0.0004 Environmental Chan_ge 0.1287 0.2076 0.0431 6.668 0.0002 I
I I
1 Indirect Worker ratio Power Control 0.1179 0.1179 0.0139 5.942 0.0152
I I Organization Age 0.1175 0.1655 0.0274 5.941 0.0029 j Clerical worker ratio
Organization ~e 0.1658 0.1658 0.0275 12.602 0.0004 Process Techno ogy -0.1475 0.2121 0.0449 10.480 0.0000 Operating Environment 0.1197 0.2396 0.0574 9.015 0.0000 Customer Dependence -0.1045 0.2614 0.0683 8.123 0.0000
Autonomy Internal Dependence -0.2889 0.2889 0.0834 40.604 0.0000 Operating Environment 0.1502 0.3442 0.1185 29.898 0.0000 Power Control -0.1160 0.3597 0.1294 21.999 0.0000
Policy Decision Level Power Control 0.3415 03415 0.1167 58.895 0.0000 Organization Size -0.2746 0.4105 0.1685 45.082 0.0000 Environmental Change -0.2571 0.4288 0.1839 33.342 0.0000 Internal Dependence -0.1239 0.4447 0.1977 27.298 0.0000 Workflow Integration -0.2269 0.4563 0.2082 23.248 0.0000 Customer Dependence 0.0806 0.4641 0.2154 20.176 0.0000 Organization Life Cvcle -0.1049 0.4716 0.2224 17.974 0.0000
First line discretion Power Control 0.2746 0.2746 0.0754 36.385 0.0000 Organization Age -0.1091 0.2966 0.0880 21.459 0.0000 Environmental Chan_ge -0.1860 0.3125 0.0976 16.014 0.0000
Organicity Power Control -0.2112 0.2221 0.0446 20.820 0.0000 Internal Dependence -0.1586 0.2778 0.0772 18.609 0.0000 Environmental Change 0.1859 0.3006 0.0904 14.704 0.0000 Onrn.nization Size -0.0630 0.3237 0.1048 12.958 0.0000
Figure 8.10. Stepwise Multiple Regression : All SIC codes (N =458)
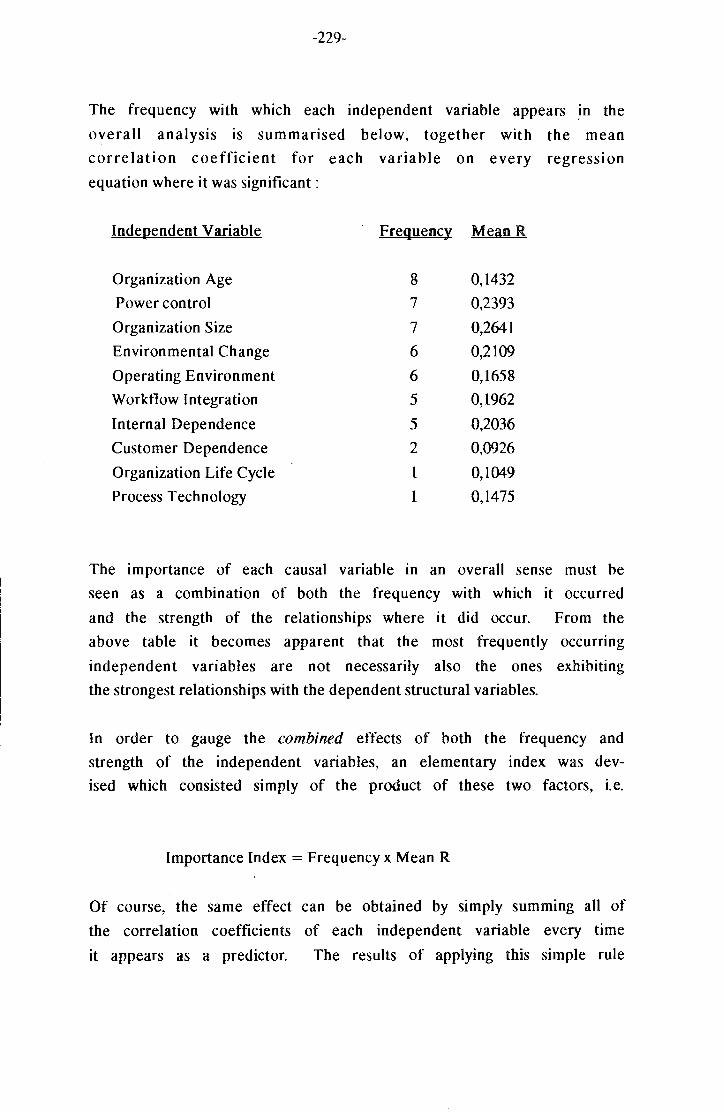
-229-
The frequency with which each independent variable appears ~n the
overall analysis is summarised below, together with the mean
correlation coefficient for each variable on every regression
equation where it was significant :
Independent Variable Frequency MeanR
Organization Age 8 0,1432
Power control 7 0,2393
Organization Size 7 0,2641
Environmental Change 6 0,2109
Operating Environment 6 0,1658
Worktlow Integration 5 0,1962
Internal Dependence 5 0,2036
Customer Dependence 2 0,0926
Organization Life Cycle 1 0,1049
Process Technology I 0,1475
The importance of each causal variable in an overall sense must he
seen as a combination of both the frequency with which it occurred
and the strength of the relationships where it did occur. From the
above table it becomes apparent that the most frequently occurnng
independent variables are not necessarily also the ones exhibiting
the strongest relationships with the dependent structural variables.
In order to gauge the combined effects of both the frequency and
strength of the independent variables, an elementary index was dev
ised which consisted simply of the product of these two factors, i.e.
Importance Index = Frequency x Mean R
Of course, the same effect can be obtained by simply summing all of
the correlation coefficients of each independent variable every time
it appears as a predictor. The results of applying this simple rule

-230-
of thumb is illustrated below; where these variables have been
arranged in descending order of importance :
ln~h;~vendent Yariable Imvortance
Index
Organization Size 1,85
Power control 1,68
Environmental Change 1,27
Organization Age 1,15
Internal Dependence 1,02
Operating Environment 0,99
Worktlow Integration 0,98
Customer Dependence 0,11}
Process Technology 0,15
Organization Life Cycle 0,10
Despite the simplicity and imperfection of this Importance Index it,
nevertheless, provides a very useful indicator of broad trends.
These are considered below.
Organizational Size. Looking at the South African manufacturing
sector as a whole, one can see that Organization Size seems to be the
most important predictor of organization structure. This is a
finding which is in keeping with most other similar studies that have
been carried out in both advanced and less developed countries or
economies, particularly those that have followed the Aston
methodology. The point needs to be made again, though, that the
pervasiveness of size as an independent variable does not necessarily
imply causality - or even that the relationship is unidirectional.
Size may indeed cause structure, but, equaJJy, structure may actually
cause stze. A longitudinal study would have to be carried out before
causal inferences could be made.
Power CQntr()l. interestingly, the Power Control variable - which
has not been tested to any great extent in other studies - came
through as a very powerful predictor of structure; even more

-231-
powerful than Internal Dependence or any of the environmental
variables. It is important to grasp, however, that Power Control as
a structural imperative does not exclude the intluence of the more
'traditional' causal variables of size, environment, dependence and
technology. In other words, it is quite possible that size,
technology, dependence and the environment would set the parameters
within which the power control imperative then sets to work in
determining organizational structure.
Environment The influence of the environment on organizations m
the manufacturing sector was, as expected, also quite significant.
Uncertainty in terms of the amount of environmental change exercised
the most influence. Turbulence within the operating environment
exercised less intluence but was still important. Curiously, the
Unpredictability measure did not feature at all in the overall
analysis, although it was significant in some specific
will become evident later in this chapter when the
analysis stratified by SJC codes is outlined.
areas. This
results of an
Organization Age. The tendency of organizations to move toward
bureaucratization over time, and to increase structuring as a means
of control while decentralizing, has been well documented and so the
influence of age as a predictor of structure 10 manufacturing
organizations is to be expected. Also the effects of Parkinson's law
are germane, as was seen earlier in this chapter in the context of
the Configuration variables.
Internal Dependence. The overall importance of internal dependence,
i.e. dependence on a holding group or company, is also consistent
with other studies in many parts of the world. The original Aston
studies defined dependence in very broad interorganizational terms
and included dependence on all organizations external to the unit
under study. Later studies, however, separated the effects of
interorganizational from intraorganizational dependence.
This procedure was also followed in this study and the overall trend

-232-
indicated that this method was probably more sound. While the
effects of Internal Dependence were quite pronounced, only one of the
external organizational measures - that of dependence on customers -
showed any significance at all and the other - that of dependence on
suppliers - did not feature in any of the regression equations.
Technology. The last word on this discussion of broad trends in the
manufacturing sector is reserved for Technology. Ht will be
remembered that one of the reasons why manufacturing organizations
were chosen as the research population for this study was the belief
that the effects of technology would be more readily apparent than
in, say, a ·service or retail environment.
technology that were used were :
The two measures of
Workflow Integration - which measured the automaticity of the
manufacturing process, and
Process Technology - which measured the throughput continuity
(and flexibility) of the manufacturing process.
Both of the measures of Technology were important predictors of
structure in manufacturing organizations, although the degree of
automation appeared to exe~cise a lot more influence than the
continuity or flexibility of throughputs. In the analysis of
organizations by their SIC codes some interesting nuances also
emerged with respect to Technology.
4. SUBGROUPS IN THE MANUFACTURING SECTOR.
In the following sections a second analysis of the entire research sam
ple, stratified according to each organization's SlC code, is presented.
The procedure that was followed was the same as that for the combined
sample. Each of the structural variables was subject to a multiple
linear regression analysis in respect of each group of organizations
that comprised every SIC code. This time, however, it was decided to
dispense with any form of examination of the residuals from the

-233-
regression equations. Similarly, it was not felt necessary to calculate
the Tolerance statistic for each independent variable. Collinearity, or
the lack of it, had been quite well established in the main analysis.
The full list of industries that make up the SIC codes is presented as
Annexure 1. Shown below is a summary list of SIC codes and their
descriptive headings. In addition, four comb.inations of SIC codes are
presented which, it was felt, could logically be grouped together and
analysed as additional sub-groups. There was also a group of 10
organizations which fell under the heading of 'other'.
included in this portion if the analysis.
It was not
SIC Code
31
32
33
34
35 36
37
38
33 & 34
36 & 37
37 & 38
36 to 38
Type of Industries Number of
Organizations
Food, Beverage and Tobacco
Textile, Clothing and Leather
Wood and Wood Products
Paper, Paper Products, Publishing & Printing
Chemicals, Petroleum, Rubber & Plastic Products
Non-metallic Mineral Products
Ferrous & Non-ferrous Metal Basic Industries
Fabricated Metal Products, Machinery and Equipment
Wood, Pulp, Paper and Publishing
Primary Materials Manufacturing
Metals, Machinery and Engineering
Metallic & Non-metallic Materials, and Machinery
81
69 20
40
68
29
18
123
60
47 141
170
The mean raw scores of every independent and dependent variable is
presented overleaf as figure 8.11, which provides an overview of compa
rative differences within the manufacturing sector. In terms of the
first three variables of Organization Life Cycle Stage, Size and Age the
responding organizations were pretty homogeneous. On average they were
in the maturity stage of their life cycle curves, their average size was
about 500 people, and their average ages were between 20 and 29 years.
Looking at dependence, Textile and Leather firms were the least

-234-
interna11y dependent on a holding group or owning company and . Paper,
Publishing and Printing were the most internally dependent. Externally,
I Variable SIC 31 SIC32 SIC33 SIC34 SIC35 SIC36 SIC37 SIC38 Total I Sampl Organization Life Cycle 3.2 3.0 3.2 3.1 3.2 3.3 3.3 3.2 3.2 Organization Size 2.8 2.7 2.7 2.7 2.7 2.7 2.7 2.7 2.7 Organization Age 4.5 4.1 4.1 4.4 4.4 4.7 4.4 4.4 4.4 Internal dependence 8.6 7.4 7.8 9.5 9.0 8.2 8.81 8.5 8.5 Supplier Dependence 2.71 2.7 2.8 3.1 2.7 2.3 3.1 2.6 2.7 Customer Dependence 2.1 2.3 2.8 2.1 2.1 2.0 2.41 2.3 2.2 Worktlow Integration 6.0 5.1 4.8 6.5 6.2 5.2 5.9 4.9 5.5 Process Technology 54.7 47.9 55.4 50.3 53.1 59.0 50.7 46.9 50.9 Power Control 35.4 35.8 37.8 33.7 32.6 33.3 32.6 33.1 34.1
Environmental Change J 25.8 25.6 26.2 26.1 26.3 25.9 26.6 26.4 26.1 Unpredictability 19.1 22.5 20.7 19.2 18.8 17.4 19.4 20.0 19.8 Operating Environment 12.5 13.1 12.1 12.4 12.8 11.6 12.9 13.4 12.8 Functional Specializatio 13.1 11.9 12.6 12.3 13.7 13.3 12.6 13.3 12.9 Formalization 12.8 .9.9 9.6 12.4 14.4 13.3 13.6 13.1 12.6 Standardization 13.3 13.5 14.8 13.6 12.7 12.9 13.3 12.9 13.2 Executive Span 7.2 6.9 5.9 7.4 6.2 6.5 6.3 7.0 6.8 Subordinate Ratio 18.6 21.3 23.8 18.4 14.8 21.1 18.3 18.2 18.7 Organization Depth 6.2 6.5 6.4 4.9 6.0 5.8 6.3 5.3 5.8 Management Ratio 11.5 9.3 8.6 12.4 14.4 13.6 9.9 12.2 11.8 Indirect Worker Ratio 44.4 39.5 49.4 36.5 35.5 45.6 38.9 37.2 39.6 Clerical Worker Ratio 8.2 7.2 4.7 11.3 11.1 7.0 5.9 11.0 9.2 Autonomy 16.6 20.0 16.9 19.0 18.7 18.1 17.9 19.6 18.6 Policy Decision Level 10.1 11.5 11.5 9.9 10.0 10.1 10.4 10.0 10.3 First Line Discretion 36.2 38.8 34.7 34.2 34.2 35.2 35.2 34.7 35.5 Organicity 4.2 4.2 4.4 4.4 4.1 4.4 4.5 4.3 4.3
Figure 8.11. Mean Scores of All Independent and Dependent Variables.
Paper, Publishing and Printing, together with ferrous & Non-ferrous
Metal Industries, were the most dependent on their largest supplier;
while Food, and Textile and Leather, were the least dependent on a
single supplier. Examining dependence on their single largest customer,
most industries were in the region of 9% dependent on their largest
customer with the exception of Wood and Wood Products which showed
closer to 35% dependence on its biggest customer.
In terms of Technology, companies in the Wood Products category scored
the lowest on Workflow Integration or automaticity, but very highly on

-235-
the other Technology measure - Process Technology, or throughput
continuity.
Technology
This situation illustrates the difference between the two
measures. Whereas woodworking machinery may be fairly
unsophisticated in terms of sawing, milling, planing and shaping, the
Process Technology in the Wood Products industry would tend towards mass
production of throughput with strong elements of continuous process.
The highest average score on Worktlow Integration occurred in the Paper,
Paper Products, Publishing & Printing industry while the highest Process
Technology score was in the Non-metallic Mineral Products category. The
Fabricated Metal Products, Machinery and Equipment group scored quite
low on both measures of Technology; speaking of an industry with
relatively uncomplicated production machinery and production throughput
which tends toward batch and custom units of production.
In terms of the Power Control variable, there was not much differentia
tion between the various groups. Overall, the Wood and Wood Products
industry is marginally the most politically driven while both the
Chemicals, Petroleum, Rubber & Plastic Products as well as the Ferrous &
Non-ferrous Basic Metal rndustries were the least politically driven.
Taking all three of the environmental measures together, the Textile,
Clothing and Leather industries seemed to be functioning m the most
turbulent environment, with the Non-metallic Mineral Products group in
the least turbulent No doubt a good deal of the perceived turmoil in
the Textile, Clothing and Leather companies' environment is directly
related to the fashion industry.
Turning to the dependent variables and looking firstly at the structur
ing of activities, the Chemicals, Petroleum, Rubber & Plastic Products
group exhibited the highest average on specialization, while textile
Clothing and Leather had the lowest. The Wood and Wood Products group
had interesting average scores on formalization and standardization:
showing the highest score on standardization but the lowest on
formalization. This recalled the earlier discussion that in many cases
in South African organizations, standardization and not formalization is
the most viable control strategy because of the low literacy levels in

-236-
some labour intensive industries. This may also be reflected in the
Wood industry's high subordinate ratio and its high indirect worker
ratio, as well as its greater organization depth and smaller numbers of
managers and clerical workers.
The flattest organizations apparently turned up in the Paper, Paper
Products, Publishing & Printing group where the broadest CEO span of
control and the fewest organization levels occurred. The Chemicals,
Petroleum, Rubber & Plastic Products group showed the second narrowest
CEO span of control and the smallest first line subordinate ratio as
well as the smallest indirect worker ratio. Nevertheless, it had the
largest ratio of managers and the second largest ratio of clerical
workers - a situation that is probably in keeping with the high degree
of structuring of activities in this industry.
The situation regarding the three measures of Centralization is
intriguing with respect to the Textile, Clothing and Leather industry
which scored highest on Autonomy, or decentralization, but, at the same
time, also scored highest on the centralization of both policy decisions
as well as first line discretionary decisions. This situation must be
read in conjunction with this group's low average score on Internal
Dependence and reinforces the value of distinguishing between the types
of decisions that are centralized. So organizations in the Textile,
Clothing and Leather industry are largely autonomous from centralized
control by a holding group or owning company and, within this autonomy,
individual units generally choose to centralize their own policy and
first line discretionary decisions.
Looking at the final dependent variable, Organicity, the scores of all
the SIC groups are generally quite similar and tend slightly toward the
organic, rather than mechanistic, pole on a seven-point bipolar scale.
The Ferrous & Non-ferrous Metal Basic Industries group tended to be the
most organic and the Chemicals, Petroleum, Rubber & Plastic Products
group tended to be the least organic or the most mechanistic.
-237-
This concludes the general discussion of the raw score means of all the
dimensions that were measured in this study. Obviously, no firm
conclusions can be drawn without comparative norms and statistical
parameters to compare them with. Nevertheless, they were useful in
order to gain an overall 'feel' for the situation in the manufacturing
sector.
In the following sections a multiple regressiOn analysis is presented
for each SIC code, as well as for the four combination groups, in an
effort to come to grips with the possible linkages between the dependent
and independent variables at a disaggregated level. Although this analy
SIS IS on a more scientific elevation than the above genera) discussion,
it is still accepted that each descriptive summary and treatment will
not be to the same analytical depth as that presented in the main
analysis of the total sample. No doubt, the detailed analysis of each
SIC code presents fertile ground for future possible research
directions. The format followed is similar to that of the main analysis
except that all of the variables for each SIC code will be shown on a
single diagram.
4.1. SIC code 31 : Food. Beverages. and Tobacco.
The first SIC subgroup to be analysed was that of the food, Beverage
and Tobacco industries. The main predictive relationships are
illustrated in figure 8.12 overleaf. There were 81 organizations in
this category. Three of the dependent variables failed to reveal any
kind of relationship at all at the 0,05 level of significance. They
were the Configuration variables of the CEO's Span of Control and the
Clerical Worker Ratio, as well as the Organicity variable.
Structuring of Activities Size, Age and Technology were the
main predictors of Specialization, while Technology and Age were the
variables associated with Formalization. Standardization, on the
other hand, was mainly influenced by the organizations' Operating
Environment and Life Cycle stage, and the relationship with the

-238-
Operating Environment was negatively directed. So a less turbulent
environment encouraged more standardization.
Single Multiple R R
Significance R2 F Ratio Level
Organization Size I 0.3616 0.3616 0.1307 11.886 0.0009 Organization Age 1 0.33551 0.4469 0.1996 9.730 0.0002 Workflow Integration I 0.3234 0.5068 0.2568 8.860 0.0000 Process Technology 0.5561 0.3292 8.500 0.0000 -0.1981
Formalization Workflow Integration 0.32481 0.3248 0.1055 9.318 0.0031 Organization age 0.2706 0.4059 0.1648 7.694 0.0009
Standardization Operating Environment -0.4203 0.4203 0.1767 16.958 0.0001 Organization life cycle 0.2472 0.4835 0.2337 11.897 0.0000
Executive Span No significant correlations at the 0.05 level
Subordinate Ratio Operating Environment -0.2749 0.2749 0.0755 6.455 0.0130 Organization life cycle 0.2263 0.3526 0.1243 5.536 0.0056
Organization Depth No significant correlations at the 0.05 level
Management Ratio Power Control 0.2621 0.2621 0.0687 5.826 0.0181
Indirect Worker ratio Environmental Change 0.3036 0.3026 0.0916 7.962 0.0060
Clerical worker ratio No significant correlations at the 0.05 level
I Autonomy Internal Dependence -0.3005 0.3005 0.0903 7.844 0.0064 Workflow Integration 0.2686 0.4079 0.1664 7.786 0.0008 Supplier Dependence 0.1161 0.4581 0.2099 6.818 0.0004
Policy Decision Level Environmental Change -0.3237 0.3237 0.1048 9.246 0.0032 Supplier Dependence -0.1844 0.4020 0.1616 7.518 0.0010 Organization Size -0.2378 0.4620 0.2135 6.965 0.0003
First line discretion Organization Size -0.2344 0.2344 0.0549 4.591 0.0352
Organicity No significant correlations at the 0.05 level
Figure 8.12. Stepwise Multiple Regression : SIC code 31. (N = 81)
So the larger and older the organizations m this group, and the more
automated their Technology, the more Specialization they showed. The
relationship of Specialization with Process Technology is negatively
directed - so the more discontinuous and flexible the throughput, the
I
I
I

-239-
more the degree of Specialization. Formalization also increased with
technological automation and with Organization Age. Finally, looking
at Standardization, the more settled the organization's operating
environment, and the more mature the organization m terms of its
life cycle stage, the more the organization tends to increase its
Standardization as a control strategy.
Configuration Only three Configuration variables exhibited
significant relationships at the default level. The first line
subordinate ratio was associated with a less turbulent operating
environment as well as a more mature Life Cycle stage. The Manage
ment Ratio was positively related to Power Control, so the more
politically driven organizations in the Food, Beverage and Tobacco
industry tended to have the highest number of managers. Finally, an
environment that changed frequently was reflected in a greater number
of indirect workers in these organizations.
Centralization Autonomy, or decentralization, was predicted by
Internal Dependence, workflow integration, and Supplier Dependence.
The relationship with Internal dependence was negatively directed so
the less dependent organizations were on a holding group or company,
the greater their autonomy. lnsofar as Policy Decisions were
concerned, all three of the significant independent variables were
negatively directed. So the less the amount of environmental change,
and the less dependent the organization is on its biggest supplier,
and the smaller the organization, the more it will centralize its
policy decisions. The final centralization measure, First Line
Discretion, showed a dear link only with Organization Size. So, in
smaller organizations in the Food, Beverage and Tobacco industry,
first line discretion tends to be limited.
4.2. SIC code 32: Textile. Clothing and Leather.
In the Textile, Clothing and Leather SIC group there were 69 Organi-
zations. There were two areas that elicited no relationships at all
at the default level of significance. These were the Indirect Worker
Ratio and the Autonomy measure of decentralization. The main
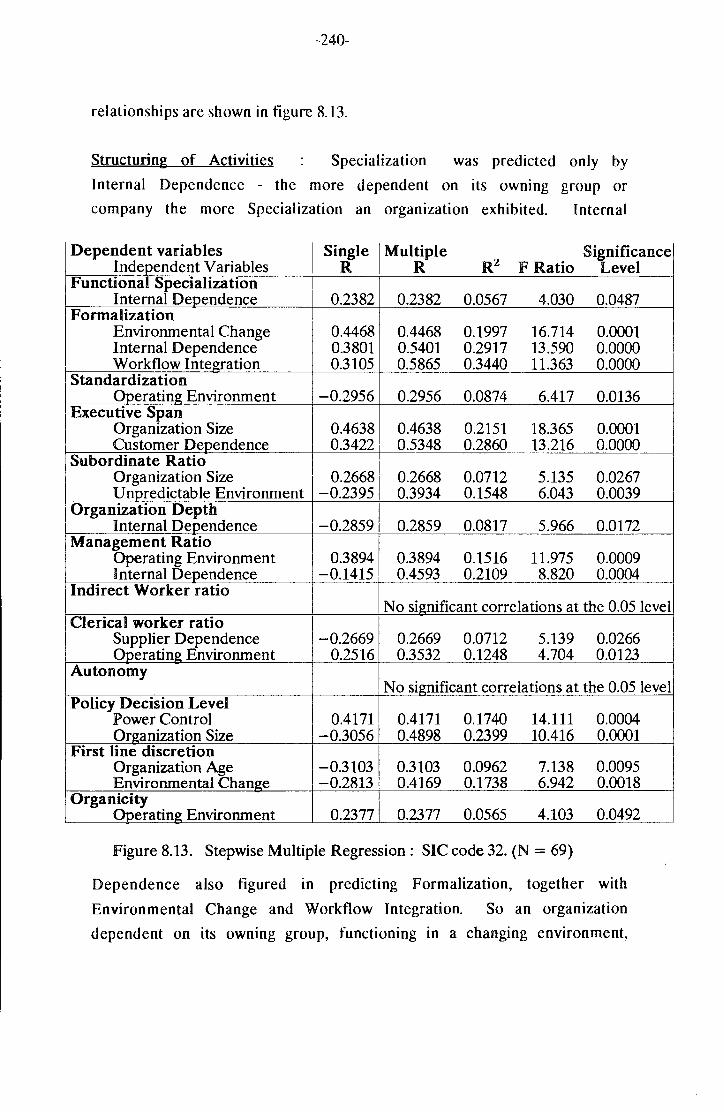
-240-
relationships are shown in figure 8.13.
Structuring of Activities Specialization was predicted only by
Internal Dependence - the more dependent on its owning group or
company the more Specialization an organization exhibited. Internal
Dependent variables I Si':(le I Mul:ple R:z. Significance
Independent Variables F Ratio Level Functional Specialization
I Internal Dependence 0.2382 0.2382 0.0567 4.030 0.0487 Formalization
Environmental Change 0.4468 0.4468 0.1997 16.714 0.0001 Internal Dependence 0.3801 0.5401 0.2917 13.590 0.0000 Workflow Integration 0.3105 0.5865 0.3440 11.363 0.0000
Standardization Operating Environment -0.2956 0.2956 0.0874 6.417 0.0136
Executive Span Organization Size 0.4638 0.4638 0.2151 18.365 0.0001 Customer Dependence 0.3422 0.5348 0.2860 13.216 0.0000
Subordinate Ratio I 0.26681 Organization Size 0.2668 0.0712 5.135 0.0267
Unpredictable Environment -0.2395 0.3934 0.1548 6.043 0.0039 1 Organization Depth
Internal Dependence -0.2859 0.2859 0.0817 5.966 0.0172 Management Ratio I
Operating Environment 0.3894 0.3894 0.1516 11.975 0.0009 Internal Dependence -0.1415 0.4593 0.2109 8.820 0.0004
Indirect Worker ratio No significant correlations at the 0.05 level
Clerical worker ratio Supplier Dependence -0.2669 0.2669 0.0712 5.139 0.0266 oPerating Environment 0.2516 0.3532 0.1248 4.704 0.0123
Autonomy No significant correlations at the 0.05 level
Policy Decision Level Power Control 0.4171 0.4171 0.1740 14.111 0.0004 Organization Size -0.3056 0.4898 0.2399 10.416 0.0001
First line discretion Organization Age -0.3103 0.3103 0.0962 7.138 0.0095 Environmental Change -0.2813 0.4169 0.1738 6.942 0.0018
Organicity Operating Environment 0.2377 0.2377 0.0565 4.103 0.0492
Figure 8.13. Stepwise Multiple Regression: SIC code 32. (N = 69)
Dependence also figured in predicting Formalization, together with
Environmental Change and Workflow Integration. So an organization
dependent on its owning group, functioning in a changing environment,

-241-
and with more sophisticated and automated technology would also tend
to be more formalized.
Similarly to SIC code 31, Standardization showed a negatively
directed relationship with the Operating Environment. So a stable
environment seems to encourage opportunities to standardize controls
and procedures. It was interesting that Formalization is positively
related to the amount of environmental change; perhaps hinting that
differing control strategies also applied to the Textile, Clothing
and Leather industries.
Configuration The important predictors for the Configuration
variables were all combinations of Organization Size, Environment and
Dependence :
a broader CEO span is predicted by greater size and more
dependence on the single biggest customer;
a higher ratio of first line subordinates IS associated with
greater size, and a more predictable environment;
more organization depth is predicted by lack of dependence on an
owmng group or company;
an increase in the ratio of managers is linked to a more dynamic
environment and less dependence on an owning group or company; and
finally,
a higher ratio of clerical workers is predicted by less dependence
on the largest supplier, and more turbulence in the operating
environment.
Centralization Centralization of Policy Decisions was predicted
by Power Control and Organization Size. The Power Control relation
ship was negatively directed. So the more politically driven and the
smaller the organizations in this group, the more policy decisions
were centralized. Looking at First Line Discretion, there were two
predictors, Age and Environmental Change, and both were negative.
This situation is analogous to the development sequence reported by
Kim and Utterback ( 1983) which was described earlier in this chapter,

-242-
t.e. young organizations m developing countries tend to function in
a more stable environment and to have mechanistic, centralized
controls.
Organicity There was only one independent variable with
significance for predicting Organicity - the Operating Environment.
The relationship was positive, and so the more turbulent the
opera,ting environment, the more the organization structures will tend
toward organic structures. So the 'classical' linkage between
environment and organic structures prevails among manufacturing
organizations in the Textile, Clothing and Leather industry.
4.3. SIC code 33: Wood and Wood Products.
Dependent variables Single Multiple Rz
Significance Independent Variables R R F Ratio Level
Functional Specialization No significant correlations at the 0.05 level
Formalization Organization Size 0.5826 0.5826 0.3395 9.250 0.0070 Workflow Integration 0.4388 0.7435 0.5528 10.508 0.0011
Standardization Operating Environment -0.5094 0.5094 0.2595 6.308 0.0218
Executive Span No significant correlations at the 0.05 level
Subordinate Ratio No significant correlations at the 0.05 level
Organization Depth Workflow Integration 0.4817 0.4817 0.2320 5.439 0.0315
Management Ratio Workflow Integration 0.4562 0.4562 0.2081 4.731 0.0432
Indirect Worker ratio No significant correlations at the 0.05 level
Clerical worker ratio No significant correlations at the 0.05 level
Autonomy No significant correlations at the 0.05 level
Policy Decision Level Process Technology -0.5059 0.5059 0.2560 6.192 0.0228
First lline discretion Power Control 0.5334 0.5334 0.2848 7.156 0.0154
Organicity No significant correlations at the 0.05 level
Figure 8.14. Stepwise Multiple Regression: SIC code 33 (N = 20)

-243-
The organizations m SIC code 33 are concerned with the manufacture
and processing of wood and wood products. There were 20 of them
altogether. Examination of figure 8.14 on the previous page shows
that seven, or half, of the dependent variables did not elicit a
significant correlation at the 0,05 level. All of the other seven
that did show significant relationships exhibited multiple R's and
R 2's that were generally stronger than the relationships in most of
the other SIC codes.
Structuring of Activities Formalization was positively related
to both Organization size and Workflow Integration, and Standardiza
tion was negatively related to the Operating Environment. So the
larger the organizations in this group and the more automated their
production machinery, the more formalized they were. A more tranquil
operating environment was reflected in a higher degree of standardiz
ation of controls and procedures.
Configuration The only Configuration variables to throw up any
kind of linkage with the independent variables were Organization
Depth and the Management Ratio. Both showed positive relationships
with Workflow Integration. So the more automated this group's
technology, the more layers the organizations were comprised of, and
the greater the number of their managers.
Centralization The centralization of Policy Decisions was also
related to technology, but this time it was negatively linked to Proc
ess Technology. So the less continuous and flexible the production
throughput, the more these organizations centralized their policy
decisions. One is left wondering if this relationship might be
peculiar to the lumber industry, as was discussed earlier, in that a
fair amount of the production machinery is mobile and flexible in the
cutting, harvesting and collection phase, while the milling and
sawing phase consists of static machining processes with fixed units
of throughput.

-244-
The centralization of first line discretionary decisions was. quite
strongly linked to Power Control, indicating that the politically
driven organizations in this sector were more prone to limiting the
discretion of their first line supervisors.
4.4. SIC code 34 : Paper. Paper Products. Printing and Publishing.
There were 40 organizations m the section that made up the Paper,
Paper Products, Printing and Publishing industries and. the signific-
Dependent variables Single Multiple Rz
Significance Indeoendent Variables R R F Ratio Level
Functional SpectaJization Unpredictable Environment -0.4645 0.4645 0.2158 10.456 0.0025
Formalization Supplier Dependence -0.3506 0.3506 0.1230 5.327 0.0265 Or~anization Size 0.2942 0.4677 0.2188 5.182 0.0104
Standardization Internal Dependence 0.4253 0.4253 0.1809 8.392 0.0062 Operatin~ Environment -0.1996 0.5488 0.3012 7.975 0.0013
Executive Span Internal Dependence -0.4898 0.4898 0.2399 11.996 0.0013
Subordinate Ratio Supplier Dependence 0.4296 0.4296 0.1845 8.600 0.0057
Organization Depth Unpredictable Environment -0.3433 0.3433 0.1178 5.076 0.0301
Management Ratio Workflow Integration 0.3560 0.3560 0.1267 5.515 0.0242 Or~anization Size -0.2336 0.4727 0.2235 5.323 0.0093
Indirect Worker ratio Environmental Chan~e 0.3991 0.3991 0.1593 7.200 0.0107
Clerical worker ratio No si®ificant correlations at the 0.05 level
Autonomy Knternal Dependence -0.3851 0.3851 0.1483 6.618 0.0141
Policy Decision Level Knternal Dependence 0.4549 0.4549 0.2069 9.915 0.0032 Unpredictable Environment -0.3671 0.5550 0.3080 8.233 0.0011 Workflow lnte~ation -0.3724 0.6227 0.3878 7.600 0.0005
First line discretion Workflow Inte~ation -0.3376 0.3376 0.1140 4.887 0.0332
Organicity Workflow Inte~ration 0.3467 0.3467 0.1201 5.190 0.0284
lFigure 8.15. Stepwise Multiple Regression: SIC code 34 (N = 40)

-245-
ant predictive relationships are set out in figure 8.15. Only one
regression equation, that of the Clerical Worker Ratio, failed to
throw up a significant relationship between independent and dependent
variables.
Structuring of Activities In this SIC group Specialization
showed a tendency to increase when the environment was predictable.
Formalization showed an inclination to be more prevalent when organi
zations where less dependent on their largest supplier, and more
prevalent as the organization's size increased. Standardization
increased when Internal Dependence increased and also increased when
environmental turbulence decreased.
Configuration The multiple regressiOn of the Configuration
variables revealed a broad range of relationships :
The less the organizations in this group were dependent on a
parent company or owning group, the broader was the CEO's span of
control.
More dependence on a single supplier was tied to an increased
ratio of first line subordinates.
Organization Depth was negatively related to environmental
unpredictability, so a more predictable environment was linked to
greater organization depth.
The Management Ratio was positively related to Worktlow Integra
tion and negatively related to Organization Size. So more
automated machinery was linked to more managers, and smaller size
was also linked to more managers. This finding is puzzling and,
perhaps, is an indication of direct workers being replaced by more
sophisticated technology. This could result in downsizing and an
apparent increase in the ratio of managers.
Finally, the ratio of indirect workers was related to the envuon
ment in that the more environmental change there was, the larger
the ratio of indirect workers. Again, the reasons for this
situation are not immediately apparent. Perhaps companies in the
Paper, Printing and Publishing industry cope with environmental

-246-
uncertainty by increasing their numbers of support staff But
then why does organization depth as well as the number of special
ists decrease with increased environmental unpredictability?
Maybe the answer lies in the fact that unpredictability and change
measure different aspects of environmental uncertainty.
Centralization Autonomy showed the negative relationship with
Internal Dependence that was to become familiar in many of the other
groups that were analysed. Centralization of Policy decisions was
tied to three independent variables: Internal Dependence, Environmen
tal Unpredictability, and Worktlow Integration. The latter two
relationships were negatively directed. So the more dependent on a
holding group or owning company, the more policy decisions were
centralized; and the more predictable the environment and the less
automated the technology, the more policy decisions were centralized.
Looking at the converse of these relationships makes them a bit more
clear : , an unpredictable environment, sophisticated technology, and
lack of dependence on a holding group are associated with
decentralization.
Organicity Organicity was also predicted by Workflow Integra-
tion, although this time the relationship was positively directed.
In other words, more automated technology in the Paper, Printing and
Publishing industries was associated with structures that are more
organic.
4.5. SIC code 35: Chemicals. Petroleum, Rubber & Plastic Products.
There were 68 organizations in the group comprising Chemicals,
Petroleum, Rubber and Plastic Products. It will be seen from figure
8.16 overleaf that three of the dependent variables did not produce a
significant correlation at the default level of analysis.

-247-
Dependent variables 1 Single Multiple Rz
Significance Indeoendent Variables R R F Ratio Level
.FunctiOnal ~pectaltzation Organization Size 0.3506 0.3506 0.1229 9.250 0.0034
Formalization Internal Dependence 0.3581 0.3581 0.1283 9.709 0.0027 Organization Size 0.3371 0.4980 0.2480 10.718 0.0001 Environmental Change 0.3418 0.5598 0.3133 9.734 0.0000 Su22lier Dependence -0.2946 0.5999 0.3599 8.858 0.0000
Standardization Environmental Change -0.3764 0.3764 0.1417 10.892 0.0016 Internal Dependence -0.2668 0.4546 0.2067 8.468 0.0005
Executive Span Organization Size 0.3319 0.3319 0.1102 8.173 0.0057 Organization Age 0.2611 0.4298 0.1847 7.363 0.0013
Subordinate Ratio Internal Dependence -0.2655 0.2655 0.0705 5.005 0.0287 Unpredictable Environment -0.2569 0.3610 0.1303 4.870 0.0107
Organization Depth No significant correlations at the 0.05 level
Management Ratio Supplier Dependence -0.2965 0.2965 0.0879 6.359 0.0141
Indirect Worker ratio No significant correlations at the 0.05 level
Clerical worker ratio Supplier Dependence -0.3253 0.3253 0.1058 7.810 0.0068
Autonomy Internal Dependence -0.3527 0.3527 0.1244 9.377 0.0032
Policy Decision Level Environmental Change -0.3084 0.3084 0.0951 6.935 0.0105 Workflow Integration -0.2583 0.3906 0.1526 5.851 0.0046
First line discretion No significant correlations at the 0.05 level
Organicity Supplier Dependence 0.3406 0.3406 0.1160 8.662 0.0045 Environmental Change 0.3192 0.4834 0.2337 9.911 0.0002 Customer Dependence -0.1221 0.5392 0.2907 8.742 0.0001
Figure 8.16. Stepwise Multiple Regression : SIC code 35 (N = 68)
Structuring of Activities Organization size was the only predic-
tor of specialization, which means that as organizations in this
group grow larger they acquire more specializations. Formalization
was linked to four independent variables : Internal Dependence,
Organization Size, Environm.ental Change, and Supplier Dependence.
The last relationship was negatively directed. So organizations in
this group that are : (i) larger in size, (ii) more dependent on a
holding company or group, (iii) functioning in an environment that is

-248-
characterized by constant change, and (iv) less dependence on a
single supplier, tend to have more formalized structures.
Finally, Standardization showed a negatively directed relationship
with both Environmental Change and Internal Dependence. So the less
the dependence on an owning company or group and the more predictable
the environment, the more standardized were the companies in this
group.
Configuration Four of the stx independent variables identified
with the Configuration Variables showed negatively directed
relationships. The two positive relationships were both with the
CEO's span of control.
The larger and the older the organization the greater the CEO's
span of control.
Less dependence on a holding company or owning group and a more
predictable environment were linked to a higher ratio of first
line subordinates.
Both the Management Ratio and the Clerical Worker Ratio were
negatively tied to the degree of dependence on the organization's
largest single supplier. So the less dependent organizations were
on a single supplier, the more managers and clerks they tended to
have. No doubt the higher numbers of clerks and managers would be
partly associated with a more complex procurement procedure.
Centralization Internal Dependence, Environment and Technology
were the main influences on centralization. The less dependent
organizations were on their owning group, the more autonomous they
were tn terms of overall centralization. In terms of Policy
Decision, fewer environmental changes and less automated operations
technology were reflected in more centralization. So a placid
environment and simple technology seem to create conditions in which
centralized control can take place.
Organicity There were three predictors of Organicity. Apart
from the normal positive relationship with environmental change or

-249-
turbulence, there was also a connection with both Supplier Dep~ndence
and Customer Dependence. The latter was negatively directed. So
less dependence on a single customer and more dependence on a single
supplier encouraged the formation of organic structures. This
situation is possibly best understood in the context of the strategic
nature of petroleum and petroleum products during the sanctions years
and the many years of government intrusion into the supply and distri
bution of these strategic materials. Significantly, even though the
raw scores of Supplier Dependence were only average for the Chemic
als, Petroleum, Rubber and Plastic Products group overall, this indep
endent variable features more often as a predictor of the dependent
structural variables in this SIC group than in any of the others.
4.6. SIC code 36 : Non-metallic Mineral Products.
The category of non-metallic mineral products includes industries
such as pottery, china, glass, clay, bricks, cement, plaster, stone,
and fibre glass products. H consisted of 29 organizations and five
of the dependent variables yielded no significant predictors when
they were subjected to a multiple regression analysis. Generally,
the multiple R's and R 2's were high, probably because there was a
fair similarity in the type of industry but a reasonable spread of
difference in the values of the Independent variables.
predictors are shown in Figure 8.17 overleaf.
The main
Structuring of Activities As in the previous SIC group, Organi-
zation Size was the only predictor of Specialization, but the relat
ionship was much stronger at R = 0,65. So larger organizations in
this group are confidently expected to exhibit far more specializa
tion. Formalization showed the familiar linkages with Internal
Dependence and Organization Size. Bigger organizations and organiza
tions that were dependent on their owning group or company tend to
have more formalized systems. Additionally there was an interesting
and strong negatively directed relationship with Power Control. So
the less politically driven organizations in this group relied more

-250-
on formalization as a higher order control strategy. Finally,
Looking at Standardization, the by-now-familiar negative link with
Environmental Change was present - indicating that standardization
tends to tlourish in a more stable environment. In addition, there
Dependent variables Single Multiple Rz
Significance Independent Variables R R F Ratio Level
.Functional SpecializatiOn 0.65471 Organization Size 0.6547 0.4287 20.259 0.0001
Formalization Power Control -0.6125 0.6125 0.3751 16.209 0.0004 Internal Dependence 0.5827 0.6881 0.4745 11.736 0.0002 Organization Size 0.5298 0.7629 0.5821 11.606 0.0001
Standardization Environmental Change -0.4636 0.4636 0.2149 7.390 0.0113 Organization Lifecvcle 0.1742 0.5982 0.3578 7.2449 0.0032
Executive Span No significant correlations at the 0.05 level
Subordinate Ratio Power Control 0.5322 0.5322 0.2832 10.668 0.0030
Organization Depth Organization Size 0.5729 0.5729 0.3283 13.193 0.0012
Management Ratio No significant correlations at the 0.05 level
Indirect Worker ratio Internal Dependence -0.5076 0.5076 0.2576 9.369 0.0049
Clerical worker ratio No significant correlations at the 0.05 level
Autonomy No significant correlations at the 0.05 level
Policy Decision Level -0.4141 Internal Dependence 0.4141 0.1714 5.587 0.0256
Supplier Dependence -0.3063 0.5364 0.2877 5.251 0.0121 First line discretion
No significant correlations at the 0.05 level Organicity
Organization Size -0.4401 0.4401 0.1937 6.484 0.0169 Process Technology -0.3324 0.5743 0.3298 6.398 0.0055
Figure 8.17. Stepwise Multiple Regression: SIC code 36 (N = 29)
was a link with the organization's life cycle stage in that more
mature organizations were inclined exercise more standardization.
Configuration Only three independent variables were present m

-251-
the entire spread of Configuration variables :
the greater the amount of Power Control the more first line
subordinates there are,
the larger the organization's size the more layers it had, and
the less dependent on a holding group or owning company the higher
was the ratio of indirect workers.
In summary, a larger, more politically driven organization which is
independent of its owning group will have more depth, and more first
line subordinates and indirect workers. It appears that pressure to
downsize or shed staff in this SIC group comes from IH!ead Oftice, and
in the absence of this pressure, empires are inclined to increase and
prosper.
Centralization Only the Policy Decision variable showed up any
significant relationships, with two predictors. Both were negatively
directed. This means that the less dependent a company is on both
its holding group or company and its largest supplier, the more
policy decisions are centralized. So lack of dependence in general
seems to be the incentive to centralize among companies in the
non-metallic mineral products group.
Organicity The multiple regression equation for Organicity
revealed two predictors, both of which were negatively directed. ! n
short, smaller size and more discontinuous and flexible process
technology were associated with structures that were more organic.
4.7. SIC code 37 : Ferrous and Non-ferrous Metal Basic Industries.
This group consisted of just 18 organizations and, as will be seen in
figure 8.18 overleaf, seven of the multiple regression equations
yielded no significant predictor variables at the default level of
0,05. The relationships that did arise exhibited correlations that
were generally very high. Again, this was probably a function of the
overall homogeneity of the type of industry in the group and the

-252-
heterogeneity of the individual organizations with respect to the
independent variables.
Dependent variables Single Multiple Significance Independent Variables R R Rz F Ratio Level
FunctiOnal Spectahzatmn Organization Size 0.7544 0.7544 0.5691 21.133 0.0003 Process Technology 0.5101 0.9033 0.8159 33.233 0.0000 Customer Dependence 0.1191 0.9383 0.8805 34.393 0.0000
Formalization No significant correlations at the 0.05 level
Standardization Organization Size -0.4850 0.4850 0.2352 4.921 0.0413
Executive Span No significant correlations at the 0.05 level
Subordinate Ratio No significant correlations at the 0.05 level
Organization Depth Supplier Dependence -0.4720 0.4720 0.2228 4.587 0.0480 Organization age -0.4365 0.6501 0.4227 5.491 0.0162
Management Ratio No significant correlations at the 0.05 level
Indirect Worker ratio No significant correlations at the 0.05 level
Clerical worker ratio Customer Dependence -0.5337 0.5337 0.2848 6.372 0.0225
Autonomy Customer Dependence 0.4809 0.4809 0.2313 4.814 0.0433
Policy Decision Level No significant correlations at the 0.05 level
First line discretion No significant correlations at the 0.05 level
Organicity Process Technology -0.4849 0.4849 0.2351 4.919 0.0414
Figure 8.18. Stepwise Multiple Regression : SIC code 37 (N = 18)
Structuring of Activities Organization Size, Process Technology,
and Customer Dependence were the main predictors of Specialization,
yielding a very high multiple correlation of 0,94 which explained
more than 88% of the variance. Size and Technology accounted for by
far the majority of this statistic. So the larger the organizations
that comprised this group and the more continuous their production
throughput, the more specializations there were in the organizations.

-253-
Dependence on an owning group or company also exercised some intlu
ence on the amount of specialization. Looking at Standardization,
only stze was related, negatively, to the amount of standardization.
So smaller organizations tended to make more use of standardization
as a means of control. The complete lack of Formalization as a
control strategy is possibly explained by the very high correlations
on the Specialization variable. It will be remembered that the
Ferrous and Non-ferrous Metal Basic Industries group also scored
highest on Organicity. One of the main sources of intluence and
control in organic structures is expertise, rather than the more
traditional and hierarchical regulatory and authority mechanisms.
Implicit in a high degree of expertise or specialization is the
'bought-in' formalization that comes with formal qualifications and
expertise in a particular discipline.
Configuration There were only three significant correlations
among the Configuration variables and they were confined to just two
of the dependent variables - Organization Depth and the Clerical
Worker Ratio. All of the relationships were negatively directed :
The less dependent an organization in this group was on its
biggest single supplier and the younger it was, the more layers it
had in its physical design.
The less dependent it was on its largest single customer, the more
clerical workers it had.
Both of these relationships are perplexing - all the more so because
they are quite strong and have a high level of significance. Clearly,
this is another area that could do with further study and investigation.
Two possible explanations are suggested by looking at the converse of
these relationships :
(i) With respect to Organization Depth, a high degree of supplier
dependence, or backward integration, may mean that an organization
has achieved a degree of strategic symbiosis with its key supplier
which allows it to structure itself into a more simple configura
tion; thus allowing it to dispense with extraneous layers of

-254-
authority. So the more dependent an organization is on its
largest supplier, the shallower its structure will be. To
achieve this state would take time and hence the negative
relationship with Organization Age.
(ii) Regarding the Clerical Worker Ratio, a similar situation could
arise, except that the dependence is now in the direction of the
largest customer, i.e. forward integration. This would result in
a more secure market and guaranteed channels of distribution. The
stability tlowing from this situation would result in less need
for support personnel such as clerks.
Signiticantly, the environment does not tigure as a predictor in any
of the regression equations, even though the raw scores for all three
of the environmental measures were on, or above, the average for the
total sample. All of this appears to indicate that, at a macro level
of analysis, the Basic Metal Industries group may have achieved a
large measure of control of the crucial contingencies in the
industry's domain. This situation is very reminiscent of Astley and
Graham's ( 1983) collective action view of organization functioning
which was described on pages 106 to 108 of this study.
Centralization Only one of the Centralization variables, that of
Autonomy, showed a significant relationship. The predictor variable
was dependence on the organization's largest customer. So the more
dependent an organization was on its largest customer, the more
autonomous it was. Again, this is a possible pointer to the synergy
that exists between organizations in the Basic Metal Industries and
their major customers. Organizations derive strength and autonomy
from sound, symbiotic relationships.
Organicity Organicity showed a negatively directed relationship
with Process Technology, indicating that more discontinuous and
flexible production th.roughput was linked to organic structures. The
nature of Basic Metal [ndustries is such that organizations would
tend toward custom or batch process technology rather than mass prod
uction or continuous process technology. And this tendency toward
flexibility and discontinuity is reflected in these organizations'
-255-
tendency toward more organic, rather than mechanistic, structures.
4.8. SIC code 38 : Fabricated Metal Products. Machinery and Equipment. and
Electrical Machinery. Apparatus. Appliances and Supplies.
The final SIC code is also the largest, consisting of 123 organiza
tions. All of the multiple regression equations that were conducted
for the dependent variables yielded significant predictors. These
are illustrated in figure 8. 19 overleaf.
Structuring of Activities Specialization was related to both
size and dependence. These were fairly common relationships in all
of the SIC groups - greater size and more dependence on a holding
group or company was reflected in more specialization within the org-
anization. Formalization presented similar relationships with these
two independent variables and, in addition, there was a positive
relationship between the degree of formalization and the Operating
Environment So organizations m this group also seemed to cope with
environmental turbulence by increasing the formalization of their
structures and procedures. Final1y, Standardization showed the
familiar negative link with the operating environment, as well as a
negative link with age. So the less turbulent the environment and
the younger the organizations in this group, the more they tend to
standardize their activities. Again, the similarity to the reverse
developmental cycle in developing countries that was postulated by
Kim Utterback (1983) is apparent
Configuration All of the configuration variables displayed a
wide variety of relationships :
The larger the organization and the less continuous its production
throughput, the broader the CEO's band of direct reports.
The larger the organization, the more first line subordinates it
has.
- The larger the organization and the more continuous its production
throughput and the less the amount of environmental change, the

-256-
greater will be the organization's depth.
Dependent variables Single Multiple Rz
Significance Kndeoendent Variables R R F Ratio Level
.Funct!lonal ~peciahzation Organization Size 0.5035 0.5035 0.2535 41.098 0.0000 Internal Dependence 0.2912 0.5545 0.3075 26.644 0.0000
Formalization Organization Size 0.3261 0.3261 0.1063 14.396 0.0002 Internal Dependence 0.3091 0.4245 0.1802 13.191 0.0000 Operating Environment 0.2488 0.4610 0.2209 11.245 0.0000
Standardization Operating Environment -0.2949 0.2949 0.0870 11.524 0.0009 Organization Age -0.2589 0.3858 0.1488 10.490 0.0001
Executive Span Organization Size 0.2527 0.2527 0.0639 8.255 0.0048 Process Technology -0.1296 0.3143 0.0988 6.578 0.0019
Subordinate Ratio Organization Size 0.2242 0.2242 0.0503 6.403 0.0127
Organization Depth Organization Size 0.3786 0.3786 0.1434 20.249 0.0000 Process Technology 0.2807 0.4309 0.1857 13.683 0.0000 Environmental Change -0.1719 0.4891 0.2392 12.469 0.0000
Management Ratio Organization Age 0.2565 0.2565 0.0658 8.524 0.0042 Supplier Dependence -0.1837 0.3374 0.1138 7.708 0.0007
Indirect Worker ratio Supplier Dependence 0.2636 0.2636 0.0695 9.037 0.0032 Environmental Change -0.2157 0.3320 0.1102 7.432 0.0009
Clerical worker ratio Workflow Integration 0.1881 0.1881 0.0354 4.441 0.0372 Process Technology -0.1797 0.3270 0.1069 7.184 0.0011 Internal Dependence 0.1490 0.3715 0.1380 6.349 0.0005
Autonomy Internal Dependence -0.3093 0.3093 0.0957 12.799 0.0005 Supplier Dependence -0.2837 0.4031 0.1625 11.639 0.0000
Policy Decision Level Organization Size -0.2719 0.2719 0.0739 9.659 0.0023 Power Control 0.2587 0.3627 0.1315 9.086 0.0002
First line discretion Power Control 0.1994 0.1994 0.0398 5.009 0.0270
Organicity Power Control -0.2646 0.2646 0.0700 9.108 0.0031 Internal Dependence -0.2505 0.3713 0.1379 9.593 0.0001 Organization Size -0.2161 0.4247 0.1804 8.729 0.0000
Figure 8.19. Stepwise Multiple Regression: SIC code 38 (N =123)
The older the organization and the less dependent it is on its
biggest supplier, the more managers it will have.
The more dependent the organization is on its biggest supplier and

-257-
the less environmental change it is subject to, the larger will be
the ratio of its indirect workers.
The more automated the technology and the less continuous the
units of throughput and the more dependent the organization IS on
its owning group or company, the larger will be the number of its
clerical workers.
The import of some of the above relationships is also somewhat
obscure and not always readily apparent. Again, it is an area that
would definitely benefit from further study.
Centralization An organization's degree of autonomy in this SIC
group was linked to both Internal Dependence and Supplier dependence.
Both relationships were negatively directed. This meant that the
less dependent on its owning group and the less dependent on its bigg
est supplier, the more autonomous was an organization in this group.
In terms of policy decisions, a negative relationship with size and a
positive relationship with Power Control were revealed - so organiza
tions that centralized their policy decisions tended to be smaller
and more politically driven. Finally, first line discretion was also
linked to Power Control, so the more political the organization, the
less discretion was passed down tq the first line supervisor.
Organicity Organicity was characterized by three negatively
directed relationships with Power Control, Internal Dependence, and
Organization Size. So organic structures were predicted by less
political activity, less dependence on the organization's holding
group, and, finally, smaller organization size. All of these
relationships are generally consistent with the accepted wisdom and
with everything that has been said about organic and mechanistic
structures. The addition of a turbulent or changing environment
would complete the picture of classical organic structures.
The above section concludes the overview of the manufacturing sector
split into its various constituent, SIC-coded parts. Each of the SIC
codes is worthy, in its own right, of a review similar in scope to

-258-
this entire study. So the treatment given here has of necessity been
quite superficial or even cursory. This section of the study is
concluded below by a brief look at the effects of combining a number
of SrC codes into four groups. No specific criteria were used to
lump them together, except that they were the most interesting of all
the combinations that were tried and, logically, they seemed to fit
together and are often associated.
4.9. SIC codes 33 and 34 : Wood. Pulp, Paper. and Publishing.
Dependent variables Single I Multiple R:z
Significance Indeoendent Variables R I R F Ratio Level
Functional Specialization Unpredictable Environment -0.3110 0.3110 0.0968 6.213 0.0156
Formalization Organization Size 0.3865 0.3865 0.1494 10.185 0.002.1 Internal Dependence 0.2837 0.4539 0.2060 7.396 0.0014 Supplier Dependence -0.2476 0.5136 0.2638 6.688 0.0006
Standardization Operating Environment -0.3082 0.3082 0.0950 6.088 0.0166
Executive Span Workflow Integration 0.3286 0.3286 0.1080 7.022 0.0104 Environmental Change 0.2934 0.4428 0.1961 6.952 0.0020
Subordinate Ratio Supplier Dependence 0.3398 0.3398 0.1155 7.572 0.0079 Workflow Integration -0.3275 0.4498 0.2024 7.230 0.0016
Organization Depth Customer Dependence 0.2718 0.2718 0.0739 4.626 0.0357
Management Ratio Workflow Integration 0.4073 0.4073 0.1659 11.534 0.0012
Indirect Worker ratio Environmental Change 0.2619 0.2619 0.0686 4.272 0.0432
Clerical worker ratio No significant correlations at the 0.05 level
Autonomy Power Control -0.3162 0.3162 0.0999 6.441 0.0139
Policy Decision Level Workflow Integration -0.4464 0.4464 0.1993 14.431 0.0004
First lline discretion Power Control 0.3730 0.3730 0.1392 9.375 0.0033
Organicity Power Control -0.2738 0.2738 0.0750 4.699 0.0343
Figure 8.20. Stepwise Multiple Regression : SIC codes 33 and 34. (N = 60)

-259-
The first combined group consisted of SIC codes 33 and 34 a.nd was
designated Wood, Pulp, Paper and Publishing. The areas of activity
carried out by the 60 organizations that comprise this group are
fairly diverse and the main predictors are shown in figure 8.20.
There were no significant correlations for the Configuration variable
of the Clerical Worker Ratio. Independent variables that became
significant as a result of combining the two SIC codes into one group
were:
Internal Dependence as a predictor for Formalization;
Workflow Integration and Environmental Change as predictors for
the CEO's span of control;
Workflow Integration as a predictor for the Subordinate Ratio;
Customer Dependence as a predictor for Organization Depth;
Power Control as a predictor for Autonomy; and, finally,
Power Control as a predictor for Organicity.
Independent variables that were discarded as predictors by the step
wise regression analysis after the two SIC groups were combined were:
Workflow Integration for Formalization;
Internal dependence for Standardization;
Internal dependence for the CEO's span of Control;
Unpredictable Environment and Workflow integration for
Organization Depth;
Organization Size for the Management Ratio;
Internal dependence for Autonomy;
Process Technology, Internal dependence, and Unpredictable
Environment for Policy Decision centralization;
Worldlow Integration for First Line Discretion; and, finally,
Workflow Integration for Organicity.
Completely new causal variables were disclosed in the larger, combin
ed group for the dependent variables of CEO's Span of Control,
Organization Depth, Autonomy, and Organicity.

-260-
4.10. SIC codes 36 and 37 : Primary Materials Manufacturing.
The second combined group was an amalgam of SIC codes 36 and 37 and
was labelled Primary Materials Manufacturing.
relationships are shown in figure 8.21.
The key predictive
Dependent variables Single Multiple Rz
Significance independent Variables R R F Ratio Level
.Functional Specialization Organization Size 0.6692 0.6692 0.4477 36.488 0.0000 Organization Life Cycle 0.2275 0.7078 0.5010 22.089 0.0000
Formalization Organization Size 0.4974 0.4974 0.2474 14.794 0.0004 Internal Dependence 0.4927 0.6678 0.4460 17.709 0.0000
Standardization Environmental Change -0.3521 0.3521 0.1239 6.638 0.0152
Executive Span No significant correlations at the 0.05 level
Subordinate Ratio Power Control 0.3911 0.3911 0.1529 8.127 0.0066
Organization Depth Organization Size 0.3699 0.3699 0.1368 7.131 0.0105 Customer Dependence 0.2990 0.5102 0.2603 7.741 0.0013 Environmental Change -0.2341 0.5869 0.3445 7.533 0.0004 Internal Dependence 0.1896 0.6359 0.4044 7.129 0.0002
Management Ratio Organization Life Cycle 0.2912 0.2912 0.0848 4.169 0.0470
Indirect Worker ratio Internal Dependence -0.3129 0.3129 0.0979 4.885 0.0322
Clerical worker ratio No shmificant correlations at the 0.05 level
Autonomy No sig11ificant correlations at the 0.05 level
Policy Decision Level Environmental Change -0.3990 0.3990 0.1592 8.519 0.0055 Organization Size -0.3083 0.5025 0.2525 7.433 0.0017
First line discretion No significant correlations at the 0.05 level
Organicity Process Technology -0.4088 0.4088 0.1671 9.027 0.0043
Figure 8.21. Stepwise Multiple Regression: SIC codes 36 and 37 (N = 47)
The combination of the heavy manufacturing, or 'smokestack', indust
nes in these two groups resulted in a larger batch of 47 organiza-

-261-
tions. The independent variables that became significant as a result
of the combination of SIC codes 36 and 37 were:
Life-cycle stage as a predictor for Specialization;
Customer Dependence, Environmental Change, and Internal
Dependence as predictors for Organization Depth;
Life-cycle stage as a predictor for the Management Ratio; and,
Environmental Change and Organization Size as predictors for
Policy Decision centralization.
A number of independent variables were dropped as predictors after
the stepwise multiple regression analysis of the combined SIC
groups. These were :
Process Technology and Customer Dependence for Specialization;
Power Control for Formalization;
Organization Size and Environ mental Change for Standardization;
Supplier Dependence and Organization Age for Organization
Depth;
Customer Dependence for Clerical Worker Ratio;
Customer Dependence for Autonomy;
Internal Dependence and Supplier Dependence for Policy Decision
centralization; and, finally,
Organization Size for Organicity.
Completely new causal variables or combinations of causal variables
were found for the Configuration variable of the Management Ratio, as
well as for the Policy Decision centralization variable.
4.11. SIC codes 37 and 38 : Metals. Machinecy and Engineering.
The combination of SIC codes 37 and 38 also resulted m a group of
'smokestack' industries, but excluded all non-metal manufacturing
organizations. The total number of organizations in this merged

-262-
group was 141 and the major predictors are shown in figure 8.22.
Dependent variables Single Multiple Significance Indeoendent Variables R R Rz F Ratio Level
Functional Spectahzatton Organization Size 0.5256 0.5256 0.2762 53.044 0.0000 Internal Dependence 0.2923 0.5741 0.3295 33.913 0.0000
Formalization Organization Size 0.3277 0.3277 0.1074 16.721 0.0001 Internal Dependence 0.3004 0.4202 0.1765 14.793 0.0000 Operating Environment 0.2263 0.4545 0.2066 11.891 0.0000
Standardization Organization age -0.2507 0.2507 0.0629 9.325 0.0027 Operating Environment -0.2360 0.3413 0.1165 9.098 0.0002
Executive Span Organization Size 0.2708 0.2708 0.0733 10.999 0.0012
Subordinate Ratio Organization Size 0.2088 0.2088 0.0436 6.339 0.0129
Organization Depth Organization Size 0.3099 0.3099 0.0960 14.767 0.0002 Process Technology 0.2872 0.3881 0.1506 12.233 0.0000 Environmental Change -0.1824 0.4587 0.2104 12.171 0.0000
Management Ratio Organization age 0.2099 0.2099 0.0441 6.406 0.0125 Supplier Dependence -0.1876 0.2979 0.0888 6.720 0.0016
Indirect Worker ratio Supplier Dependence 0.2116 0.2116 0.0448 6.517 0.0118
Clerical worker ratio Process Technology -0.1814 0.1814 0.0329 4.729 0.0313 Workflow Integration 0.1292 0.2816 0.0791 5.922 0.0034 Internal Dependence 0.1359 0.3295 0.1086 5.562 0.0012
Autonomy Internal Dependence -0.2959 0.2959 0.0876 13.341 0.0004 Supplier Dependence -0.2953 0.4033 0.1627 13.404 0.0000 Process Technology 0.0744 0.4331 0.1876 10.542 0.0000
Policy Decision Level Organize Size -0.2647 0.2647 0.0700 10.469 0.0015 Power Control 0.2551 0.3500 0.1225 9.635 0.0001 Internal Dependence -0.2059 0.3883 0.1508 8.106 0.0001
First line discretion Power Control 0.1988 0.1988 0.0395 5.717 0.0181
Organicity Internal Dependence -0.2626 0.2626 0.0690 10.297 0.0017 Power Control -0.2161 0.3479 0.1210 9.499 0.0001 Customer Dependence -0.1878 0.3824 0.1462 7.822 0.0001 Organize Size -0.1565 0.4174 0.1742 7.172 0.0000
Figure 8.22. Stepwise Multiple Regression: SIC codes 37 and 38 (N =141)
There were three independent variables that became significant as a
result of the combination of these two SIC codes. They were:
Process Technology as a predictor for Autonomy;

-263-
J nternal Dependence as a predictor for Policy Decision
centralization, and
Customer Dependence as a predictor for Organicity.
Seven independent variables were terminated as predictors after the
stepwise multiple regressiOn analysis of the combined SIC groups.
These were:
Process Technology and Customer Dependence for Specialization;
Process Technology for the CEO's Span of Control;
Supplier Dependence and Organization Age for Organization
Depth;
Environmental Change for the Indirect Worker Ratio;
Process Technology and Customer Dependence for the Clerical
Worker Ratio;
Customer Dependence for Autonomy; and, finally,
Process Technology for Organicity.
The disparity in size between these two SIC groups was quite consider
able: 123 organizations for SIC code 38 versus only 18 for SIC code
37. It seems that many of the predictors for the smaller group were
simply swallowed in the larger analysis and no major emergence of
completely new causal variable combinations emerged.
4.12. SIC codes 36 to 38
Machinery.
Metallic & Non-metallic Materials. and
The final SIC combination was that of all the large 'smokestack' indu
stries - both metal and non-metal. The total number of organizations
now grew to 170 and the main predictors are iJlustrated in figure
8.23 overleaf. The Configuration variable of the Subordinate Ratio,
which had produced a predictor variable when just SIC codes 37 and 38
were combined, now showed no significant correlations at the default
level of significance. This was despite the fact that, before its

-264-
addition to this group, SIC code 36 did have a predictor for the
Subordinate Ratio dependent variable when it was analysed on its own.
Dependent variables Single Multiple Rz
Significance Independent Variables R R F Ratio Level
Functional Specialization Organization Size 0.5387 0.5387 0.2902 68.697 0.0000 Internal Dependence 0.2760 0.5803 0.3367 42.392 0.0000
Formalization Organization Size 0.3676 0.3676 0.1351 26.245 0.0000 Internal Dependence 0.3496 0.4805 0.2309 25.066 0.0000 Workflow Integration 0.2918 0.5083 0.2583 19.274 0.0000 Operating Environment 0.2714 0.5297 0.2806 16.093 0.0000
Standardization Organization Age -0.2172 0.2172 0.0472 8.317 0.0044 Operating Environment -0.1959 0.2980 0.0888 8.138 0.0004
Executive Span Organization Size 0.2581 0.2581 0.0666 11.989 0.0007
Subordinate Ratio No significant correlations at the 0.05 level
Organization Depth Organization Size 0.3699 0.3699 0.1367 26.612 0.0000 Environmental Change -0.1904 0.4268 0.1822 18.602 0.0000 Process Technology 0.2089 0.4686 0.2195 15.565 0.0000 Customer Dependence 0.0849 0.4879 0.2381 12.890 0.0000
Management Ratio Environmental Change 0.1650 0.1650 0.0272 4.702 0.0315
Indirect Worker ratio Operating Environment -0.1763 0.1763 0.0311 5.391 0.0214
Clerical worker ratio Process Technology -0.1763 0.1763 0.0311 5.391 0.0214 Workflow Integration 0.1102 0.2542 0.0646 5.767 0.0038
Autonomy Internal Dependence -0.2673 0.2673 0.0715 12.931 0.0004 Supplier Dependence -0.2148 0.3339 0.1115 10.481 0.0001
Policy Decision Level Organization Size -0.2809 0.2809 0.0789 14.395 0.0002 Environmental Change -0.2561 0.3692 0.1363 13.175 0.0000 Internal Dependence -0.2556 0.4171 0.1740 11.684 0.0000
First line discretion Power Control 0.1637 0.1638 0.0268 4.630 0.0328
Organicity Process Technology -0.2278 0.2278 0.0519 9.199 0.0028 Organization Size -0.2028 0.2854 0.0815 7.406 0.0008 Power Control -0.1488 0.3362 0.1130 7.052 0.0002 Internal Dependenc~ -0.2040 0.3770 0.1421 6.834 0.0000
Figure 8.23. Stepwise Multiple Regression : SIC codes 36 to 38 (N = 170)
After the three groups were combined, five independent variables
became significant. These were :

-265-
Worktlow Integration as a predictor for Formalization;
Customer Dependence as a predictor for Organization Depth;
Environmental Change as a predictor for the Management Ratio;
Operating Environment as a predictor for the rndirect Worker
Ratio; and,
Environmental Change as a predictor for Policy Decision
centralization.
The addition of SIC code 36 to the group of SIC codes 37 and 38 resul
ted in a startling twelve predictor variables being discarded by
the stepwise multiple regression analysis. These were :
Process Technology and Customer Dependence for Specialization;
Power Control for Formalization;
Environmental Change, Organization Life-cycle, and Organization
Size for Standardization;
Process Technology for the CEO's Span of Control;
Organization Size and Power Control for the Subordinate Ratio;
Supplier Dependence and Organization Age for Organization
Depth;
Organization Age and Supplier Dependence for the Management
Ratio;
internal Dependence, Supplier Dependence, and Environmental
Change for the lndirect Worker Ratio;
Customer Dependence and Internal Dependence for the Clerical
Worker Ratio;
Customer Dependence for Autonomy;
Power Control and Supplier Dependence for Policy Decision
centralization; and, finally,
Organization Size for Organicity.
The Configuration variables of the Management Ratio and the Indirect
Worker Ratio both showed completely new causal variables. So the
addition of the thirty-seven organizations that comprised SIC code 36
had a considerable overall intluence on this group.

-266-
4. 13. Subgroups in the Manufacturing Sector : Concluding remarks.
The above analysis concludes the examination of the total research
sample at a more focused level. A number of nuances between the
various SIC-coded subgroups and combinations of subgroups were
highlighted, illustrating the sensitivity of the predictive
relationships to the type of industry or activity that is carried out
by a particular subgroup. Obviously, the relationships and the
variables that were identified were very dependent upon the default
admission or exclusion criteria that were employed in the regression
analysis. A higher, or lower, level of significance would have made
considerable difference to the actual numbers of variables included
or excluded at each step. Nevertheless, the overall trend would have
remained similar.
It was not possible to employ the Importance Index that was developed
earlier m this chapter to evaluate the overall importance of each
dependent variable, simply because the sample sizes for the various
subgroups varied too much. It will be recalled the effect of the
sample size on the magnitude of the correlation coefficients was
quite substantial. So smaller groups with much larger R values would
skew any attempt to calculate an Importance Index. All the same,
some idea of overall tendencies with respect to the independent
variables can be gauged by simply looking the frequency with which
they occurred. These are illustrated below :
Independent Variable
Organization Size
Internal Dependence
Workflow Integration
Environmental Change
Supplier Dependence
Power Control
Operating Environment
Process Technology
Frequency
43
36
20
21
20
17
16
15

-267-
Organization Age 10
Customer Dependence 9
Unpredictable Environment 6
Organization Life-cycle 5
Once agam, the pervasiveness of the original causal variables of
Size, Dependence and Technology, which were tlrst identified by the
Aston group, is apparent.
This section concludes the quantitative analysis of the possible
links between organization structures and their environments in the
manufacturing sector. The search for meaningful causal relationships
will now shift to the concept of Organization Climate in an
attempt to identify the intluences both within an organization and
external to an organization that shape and mould its climate.
However, before the analysis of organization climate ts presented -
and in the context of the structural arrangements of industry
subgroups, it would be appropriate at this juncture to digress
brietly and revisit the South African Electronics Industry.
5. THE SOUTH AFRICAN ELECTRONICS INDUSTRY.
It will be recalled that it was the apparent structural anomalies within
the Electronics Industry in South Africa that first triggered the desire
to follow this line of research. There is no SlC code in the Bureau of
Market Research's data base which is devoted to the Electronics lindustry
exclusively. in any event, the Electronics industry, per se, is not
entirely a manufacturing industry and much of its dealings are also
devoted to service, supply, project management, engineering and research
and development activities. The information that was gathered for this
study with respect to the Electronics Industry is mainly qualitative and
was gleaned from the writer's own experience as a senior manager in the
Allied Electronics group, as well as in conversation with a number of
key informants in the industry.

-268-
The apparent incongruities in the South African Electronics Industry
which were touched upon in the first chapter are recapped below.
The Electronics Industry in South Africa appears to be characterized by
predominantly bureaucratic structures. Organizations are generally
mechanistic in form and function and are strongly hierarchical. The
reward and remuneration systems are extraordinary in order to cope with
a historical shortage of skilled professional people. There is,
therefore, a high degree of structuring of activities and formaliza
tion. For example, strong emphasis is placed on formalized systems such
as job grading schemes and salary scales, particularly as they relate to
fringe benefits such as a company car entitlement.
The conventional wisdom is that high tech. industries, by definition,
function in a fast-changing and turbulent environment. A mechanistic
form would, therefore, be incapable of providing the flexibility and
speed required to be competitive in such a fast-changing, dynamic
industry. And yet, among South African high tech. firms, the organic
form is the exception rather than the rule.
Apart from important local advances, particularly in the fields of
telecommunications, weaponry and defence, the technology employed by the
South African Electronics Industry is mainly imported, with successful
variations being engineered for South African operating conditions.
Adaptations and products developed by local software industries can
legitimately be described as leading edge applications - and South
Africa's information systems technology is up with the best in the
world.
The paradox, then, is that despite its apparent structural peculiari
ties, the South African Electronics Industry is generally effective -
both competitively and technologically speaking. It was in pursuit of
answers to this apparent paradox that three key role players in the
Electronics Industry were contacted and their views were canvassed. The
three key role players were :
(i) Mr Gerard Morse, Senior General Manager of the Industrial

-269-
Development Corporation and Chairman of the ~tanding
Committee for the Electronics Industry;
(ii) Dr David Jacobson, Technology Executive of the Altron
group and President of the South African Institute of
Electrical Engineers, and
(iii) Mr Dirk Desmet, General Secretary of the Electronics
Industries Federation.
The common thread that emerged from interviews with all three of these
key people was the influence of government on the industry and on the
industry's environment.
5. 1. The Industrial Development Corporation.
The Industrial Development Corporation, or I DC, is a state-owned body
whose purpose is to promote South African industry. This it does by
providing financial assistance as well as by its own business
initiatives in partnership with established companies. rt has a
number of relationships with firms in South Africa, and in the
Electronics Industry it has a shareholding in both electronics firms
Siemens and Sames.
One of the key objectives of the IDC ts to provide an advisory
servtce to Government on such matters as, for example, the reform of
tariff policies. With respect to the Electronics Industry, the
vehicle by which the IDC carries out this function is the Standing
Committee for Electronics, of which Mr Gerard Morse is the Chairman.
The Standing Committee for Electronics is a forum consisting of about
30 people drawn from the private sector, government, organized labour
and the large utilities such as Telkom, Escom and Transnet. The
Standing Committee is tasked with formulating broad strategy. This
it does by means of ·a number of working groups, which are active m
areas such as, education, smart cards, and deregulation. In
addition, the Standing Committee promotes ongoing initiatives in the
form of a Support Programme for Industrial Innovation as well as
facilitating the efforts of the Electronics lndustries Federation.

-270-
Historically, the Electronics Industry in South Africa has been very
protected. In the 1960s and 1970s two parties, Telkom and Armscor,
decided that they wanted a local Electronics Industry. Proceeding
from a mindset that supported local industry, they entered into very
long term ( 15 year) contracts with local manufacturers and suppliers.
ln the years of international sanctions and boycotts, it became
apparent that in order to keep the country's aging telecommunications
and defence systems, including aircraft and warships, up to date, a
local key electronics capability would have to be developed. Joint
projects and cost-plus financing arrangements were entered into and,
at one stage, government agencies accounted for 50% of all
electronics output.
All of this, obviously, had very strong implications for the envuon-
ment in which the local industry functioned. In the words of Mr
Morse, a capable local electronics industry was developed; although
an internationally competitive industry did not happen. Certain
ly, the lack of turbulence and competitive pressure resulting from
supportive government policies meant that the Electronics Industry
was able to institute the types of bureaucratic controls associated
with maximum control and efficiency in a relatively placid operating
environment. Hence the proliferation of mechanistic structures.
As to the future, the IDC believes that confidence and certainty are
essential ingredients to the successful transition of the Electronics
Industry from a protected local industry into a competitive global
player. Mr Morse chairs a working group in the Standing Committee
which is dedicated to strategy formulation, providing recommendations
on how government can positively intluence, intervene in, and guide
the industry. He believes that government guidance is critical in
aiding and assisting the industry. He cited examples in the United
States such as man on the moon, star wars, the Hubbel telescope, and
the proposed permanent space station as being major government
initiatives which will benefit the Electronics lndustry enormously.

-271-
5.2. The Electronics Industries Federation.
As its name suggests, the Electronics Industries Federation (ElF) is
a representative body of organizations that are active in the
Electronics Industry. The ElF represents all of the major players in
the Electronics Industry in South Africa.
Mr Dirk Desmet is the General Secretary of the ElF and he was also
interviewed by the writer. Significantly, he also dwelt on the
impending changes in the environment of the industry. The EIF has
coined the slogan "Transition without Trauma" to characterize the
changes that are now faced by the Electronics Industry, and the
influences that need to be brought to bear to facilitate the
transition.
Historically, the South African Electronics Industry has been
dominated by just six large organizations and the basic research was
mainly from overseas. This is set to change rapidly as local markets
become open and as local needs are identified.
A recent survey, for example, had shown that access to communication
was a primary need in developing households, coming third in order of
importance after housing and food. Prepaid or smart cards are,
therefore, important for future development as an easy means of
payment for utilities and services.
Mr Desmet said that the largest threat to South African manufacturers
lay in their poor productivity. The local companies that succeed
will be those that have invested in Technology and are competitive.
5.3 The Allied Electronics Group.
The Allied Electronics (Altron) group of compames ts by far the
largest player in the Electronics lndustry in Southern Africa. lts
Chairman, Dr Bill Venter, is a member of numerous national and indust-

-272-
ry policy formulating bodies, including the !President's Economic
Advisory Council. The influence of the Altron organization on the
Electronics Industry is, therefore, substantial.
For the purpose of this study, the Group Technology Executive of
Altron, Dr David H Jacobson was interviewed. Dr Jacobson is also a
member of several national and industry bodies, including the
Governing Council of the ElF and the I DC's Standing Committee for
Electronics, that was mentioned earlier.
Dr 1 acobson's special brief is Technology Development and in the
interview he also focused on the transition that is facing the
Electronics Industry and what the government's response should be in
terms of helping the industry to steer a course for survival and
growth. He highlighted seven incentives to encourage small, medium
and large businesses in a variety of fields: (Jacobson, 1993)
Tax credits for expanding Technology Development facilities and
for Technology Development projects.
Accelerated depreciation.
Tax credits for new equipment designed and /or manufactured
locally.
Direct grants or 'matching funds' for Technology Development
Export incentives and overseas marketing assistance.
Inexpensive ground, factory and home rentals on 'technology
parks'.
Tax holidays for new enterprises.
All of these measures, and more, have been successfully applied in
Pacific Rim countries. Implicit in all of the incentive measures is
an attempt to provide stability and predictability to the operating
environment.
5.4. Appropriate Structures.
'Appropriate Technology' is a buzz-word that is much. favoured by
Dr Jacobson when he speaks of the development of local solutions for
local problems. Similarly, one may speak in terms of Appropriate

-273-
Structures m the context of local organization designs to suit local
conditions.
Certainly, it becomes apparent that mechanistic structures have, up
until now, been entirely appropriate for the· South African Electron
Ics Industry. So the apparent structural anomalies that triggered
this research project are not so anomalous when considered against
the background of the prevailing operating conditions and
environment.
A lot of attention has been paid in this chapter to the study carried
out by Kim and Utterback (1983) in South Korea and their finding that
organization structures tend to follow a reverse life-cycle in a
developing country. They speculated that the differences between
developed and developing countries stemmed from directional differen
ces m environmental change. In a developing country the environment
moves from relatively stable to more turbulent as an organization
grows and is less protected and comes into contact with foreign
competition for the first time. Its structure would then become more
organic and flexible at a later stage of its life cycle as a
strategic response to increased environmental pressure.
Although this sequence is analogous to the South African situation,
there are some key differences. The main difference is that the
protected, stable phase has endured very much longer than in other
developing countries as a result of this country's status as
international pariah for so many years. Mechanistic structures have,
therefore, become very much more entrenched. The close relationship
between the Electronics Industry and government agencies, coupled
with a pervasive siege mentality, has a1so reinforced the value of a
structured, bureaucratic, almost militaristic way of doing things.
It is important for the leaders of the Electronics Industry to grasp
that, despite the pressure to reorganize to face the threat of
overseas competition, there are still numerous advantages to be had
from being a large bureaucracy. It is likely, therefore, that a

-274-
local hybrid organizational type will evolve quite rapidly to cope
with new external pressures but, at the same time, retain most. of the
efficiencies and controls that have been acquired and built up over
many years. Something like the Stratocracy variant of organization
structure that was described on pages 79 to 81, which combines the
reaction speed of an organic structure with the efficiencies of a
mechanistic structure.
6. STRUCTURAL ANALYSIS: CONCLUDING REMARKS.
At the outset, the purpose of this chapter was stated as being to
thoroughly explore the relationships that exist between manufacturing
organizations and their environments and to highlight the statistical
associations. With the extensive multiple regression equations that
were constructed for the total sample and also for the various SIC
groups, this objective has now been fulfilled from a quantitative point
of view. From a purely qualitative base, the discussion of the South
African Electronics Industry has provided support for the causal
connections that were apparent in the quantitative analysis; as well as
vindicating the viewpoint that circumstances in South Africa often are
very different from those of developed countries. Consequently, some of
the precepts of 'classical' Organization Theory either do not apply or
apply differently in a local setting.
The focus of the causal analysis will now shift to Organization Climate.
In the pursuit of extracting meaningful relationships, both contextual
elements and structural influences were treated as independent variables
for the purpose of extracting important relationships.
7. ORGANIZATION CLIMATE.
The multiple regression analyses of the mne Organization Climate van
abies that were used in this study are presented in the following pages.
The variables are set out again below, according to the categories into
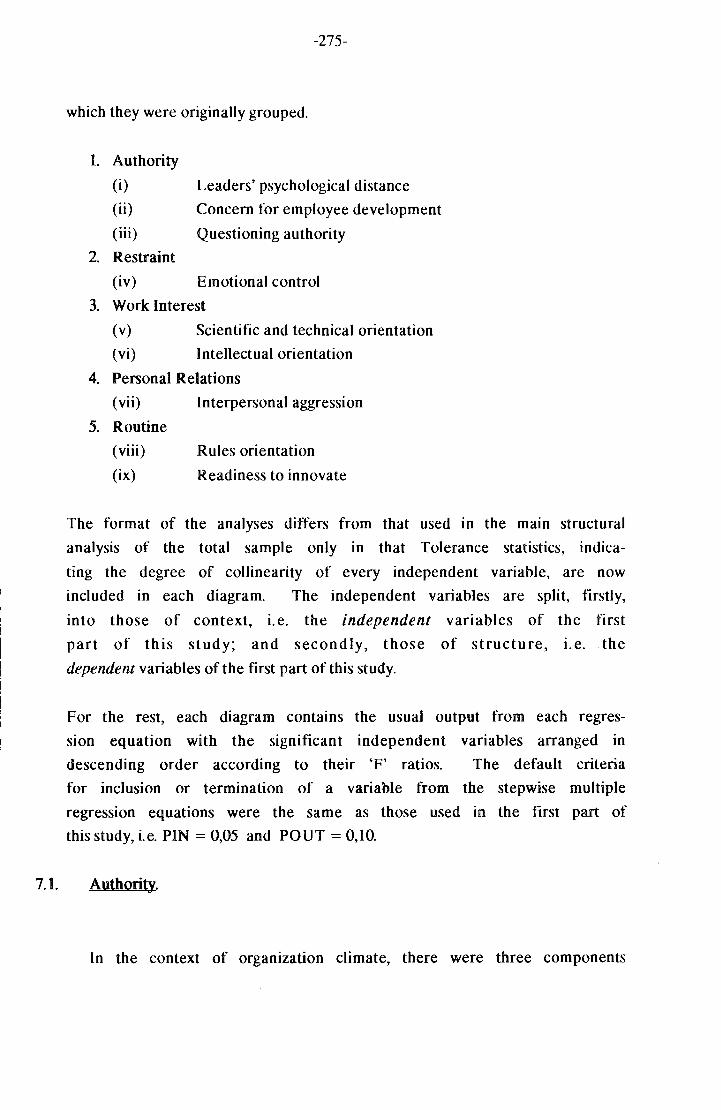
-275-
which they were originally grouped.
L Authority
(i) Leaders' psychological distance
(ii) Concern for employee development
(iii) Questioning authority
2. Restraint
(iv) Emotional control
3. Work Interest
(v) Scientific and technical orientation
(vi) Intellectual orientation
4. Personal Relations
(vii)
5. Routine
(viii)
(ix)
Interpersonal aggression
Rules orientation
Readiness to innovate
The format of the analyses differs from that used in the mam structural
analysis of the total sample only in that Tolerance statistics, indica
ting the degree of collinearity of every independent variable, are now
included in each diagram. The independent variables are split, firstly,
into those of context, i.e. the independent variables of the first
part of this study; and secondly, those of structure, t.e. the
dependent variables of the first part of this study.
For the rest, each diagram contains the usual output from each regres
sion equation with the significant independent variables arranged in
descending order according to their 'F' ratios. The default criteria
for inclusion or termination of a variable from the stepwise multiple
regression equations were the same as those used in the first part of
this study, i.e. PIN = 0,05 and POUT= 0,10.
7.1. Authority.
In the context of organization climate, there were three components

-276-
to the perceptions of Authority within an organization that were
examined by this study. The three components were : (i) Leaders'
Psychological Distance, (ii) Concern for Employee Involvement and
(iii) Questioning Authority. The multiple regression analyses of
both the contextual and structural independent variables are set out
below.
7.1.1. Leaders' Psychological Distance.
The main predictive relationships with respect to the perceptions
of organization leaders' psychological distance are illustrated in
figure 8.24.
Single Multiple Significance Independent Variables R R Rz F Ratio Level
Context: Power Control 0.2217 0.2217 0.0492 23.5700 0.0000 Organization Size 0.0893 0.2547 0.0649 15.7790 0.0000
Structure: Organicity -0.2802 0.2802 0.0785 38.8500 0.0000 Policy Decisions 0.1703 0.3223 0.1039 26.3777 0.0000 Autonomy -0.1706 0.3363 0.1131 19.2980 0.0000 Executive Span 0.0690 0.3486 0.1215 15.6691 0.0000
Figure 8.24 Predicting Leaders' Psychological Distance.
Insofar as the contextual independent variables are concerned,
there is a positive relationship with both Power Control and
Organization Size. So leadership is perceived to be distant when
there is a high degree of political activity and as organizations
get larger, and relationships possibly become less intimate and
more formal. It will be recalled that the item analysis of the
scale which measured Leaders' Psychological Distance revealed two
factors : one dealing with political manipulation and manoeuvring
and the other with the mode of address and politeness toward
senior employees. So the contextual variables seem to be very
consonant with what this scale actually measured.
Toler-a nee
0.9758 0.9758
0.9466 0.9887 0.9372 0.9929

-277-
Looking at the structural independent variables that were signific
ant, there were negatively directed relationships with Organicity
and Autonomy and positively directed relationships with Policy
Decision Centralization and the CEO's Span of Control. So mechan
istic structure is associated with perceptions of psychologically
distant leadership. Centralization of policy decisions and lack
of autonomy from a holding group or company also contribute to
this perception. Finally, there is a small contribution by the
span of the CEO's direct subordinates - the broader the span the
more distant the leadership is perceived to be.
In terrris of the possible collinearity of the independent
variables, examination of the Tolerance statistics indicates that
they are all very high. And so collinearity of the independent
variables was not a problem.
7.1.2. Concern for Empl<zyee Involvement
The second component of the Authority dimension of organization
climate is concerned with the perception of the amount of concern
Single Multiple Significance Independent Variables R R R2 F Ratio Level
Context: Power Control -0.2477 0.24TI 0.0613 29.7958 0.0000 Organization Age -0.1091 0.2699 0.0729 17.8768 0.0000 Operating Environment -0.0291 0.2847 0.0811 13.3501 0.0000
Structure: Autonomy 0.2490 0.2490 0.0620 30.1523 0.0000 Formalization 0.1686 0.2956 0.0874 21.7868 0.0000 Organicity 0.2082 0.3389 0.1148 19.6312 0.0000
Figure 8.25 Predicting Concern for Employee Involvement.
that is shown m an organization for the total involvement of all
its employees. The main predictive relationships are shown in
Toler-ance
0.9376 0.9991 0.9370
0.9446 0.9945 0.9433

-278-
figure 8.25, where it will be seen that there were three variables
each from both the contextual group and the structural group which
passed the default criteria for inclusion in the regression
equation. It will be recalled that the item analysis for this
particular measure yielded a unidimensional solution.
Insofar as the contextual variables are concerned, all three
exhibited negatively directed relationships. This means that
concern for employee involvement is apparently more evident in
younger organizations, where there is less political activity, and
which function in a relatively placid operating environment.
Looking at the structural influences. Autonomy. Formalization and
Organicity were all positive predictors of a climate which values
employee involvement. So one would expect employee involvement to
be greater in organizations that: (i) are free from direct control
by a holding group or company, (ii) have a high degree of
formalization, and (iii) have an organic structure and management
philosophy.
The situation regarding formalization is interesting and deserves
further comment There is no doubt that some aspects of organiza
tion climate are more desirable than others, particularly when
looked at from an organization effectiveness point of view.
Depending on the objectives of the organization, aspects of its
climate can assist and be facilitating, or can hinder and be
obstructive. In this study, formalization appeared several times
as a causal variable which was positively related to the
facilitating aspects of organization climate; and sometimes the
link was surprisingly strong.
This tends to give the lie to the somewhat trendy viewpoint,
popular particularly among many creative people such as electronic
engineers and the like, that formalized systems and methods act as
shackles to the free tlow of thoughts and ideas, and are
antithetical to inventiveness, cerebral challenge and innovation.

-279-
This line of thought is pursued in the sections helow where forma
lization occurs several more times as a significant predictor.
7.1.3. Questioning Authority.
The third aspect of the Authority perception of organization
climate concerns the degree to which questioning of authority is
hoth condoned and encouraged. There were two relationships
identified with the contextual independent variahles and tive with
the structural independent variahles.
tigure 8.26.
These are illustrated in
---·-I j Single Multiple Significance I Toler~ I
F Ratio Level ance I I Independent Variables I R R Rl 1 Context: I Power Control -0.2603 0.2603 0.0678 33.1491 0.0000
Environmental Change ! Structure :
Organicity Formalization Autonomy Standardization Organization Depth
0.2177 0.2925
I 0.3069 0.3069
I 0.1994 0.3754 0.2115 0.3986
J-0.2440 I 0.4161 i -0.1218 I 0.4313
0.0856 21.2899
0.0942 47.4218 0.1409 37.3169 0.1588 28.5766 0.1731 23.7066 0.1860 20.6602
Figure 8.26 Predicting Questioning Authority.
0.0000
0.0000 0.0000 0.0000 0.0000 0.0000
The contextual variahles were Power Control, which showed a
negatively directed relationship, and Environmental Change which
was positively related. So one would find that organizations that
are less politically driven and which operate in a changing
environment to he more inclined to a climate which challenges the
status quo and which questions authority.
These circumstanc·es are supported hy the relationships with the
structural variables. Organicity, which is itself associated with
non-political leadership and a changing environment, exercises the
greatest influence on a climate in which people feel encouraged to
0.87231 0.87231
0.8929 0.9055
! 0.9389 1 o.8681 ! 0.9865
!

-280-
test limits and to challenge accepted policies and methods.
Leaving aside formalization for a moment, the relationships with
the final three structural predictors also support this view and
the linkages are fairly obvious; viz. organizations that :
are independent of control by a holding company or group,
- are low on routine and standardization, and
- have shallower structures
are supportive of a questioning climate.
Looking at formalization, the relationship ts, agam, less obvious
and even seems to be out of place in the context of shallow,
organic structures which are independent, free from routine and
political power struggles, and which function in a changing
environment. Formalization is, after all, the dimension of
organization structure that is most readily associated with
bureaucracy.
Does this mean that bureaucracy and orgamc structures are not
necessarily mutually exclusive?
7.2. Restraint
I
Multiple Significance , Toler~ I
Independent Variables I R F Ratio Level 1 ance / Context· .
Environmental Change -0.1767 0.1767 0.0312 14.6930 0.0001 Power Control 0.1735 0.2126 0.0452 10.7658 0.0000 Supplier Dependence -0.0774 0.2333 0.0544 8.7133 0.0000
Structure: Organicity -0.2399 0.2399 0.0576 27.8532 0.0000 Standardization 0.2357 0.3056 0.0934 23.4344 0.0000 Autonomy -0.1914 0.3320 0.1102 18.7478 0.0000 Policy_ Decisions 0.1574 0.3471 0.1205 15.5156 0.0000
Figure 8.27 Predicting Emotional Control.
There was only a single measure of the concept of Restraint as it
applies to perceptions of organization climate. This was a scale for
Emotional Control. lt will be remembered that this scale, when
I 1 0.8674 I 0.8718
0.9916
0.9110 0.9123 0.9389 0.9493

-281-
subject to an item analysis, yielded two factors - one dealing with
the display of feelings or emotion and the other with the amount of
emotion. The main predictive relationships are shown in figure
8.27. It will be seen that there were three contextual variables and
four structural variables which were highlighted as significant by
the regression analysis.
Two of the contextual relationships are negatively directed and one
of these, that with Supplier Dependence, is a very weak correlation.
Essentially, then, looking at the other two relationships, it may be
said that organizations that are politically driven and controlled
and which · function in a stable environment, would tend toward a
higher degree of emotional control.
Looking at the influence of the structural variables, positive
relationships were thrown up for Standardization and Centralization
of Policy Decisions; while negative relationships were indicated for
Organicity and Autonomy. So one would expect emotional control to be
more prevalent in organizations that have mechanistic structures and
a high degree of standardization and routine. Control by a holding
group or company and centralization of decisions affecting policy
would also exercise an intluence on the degree of emotional control.
The multicollinearity analysis indicated that two independent
variables had Tolerance statistics slightly below ·the 0,90 level.
These were Power Control and Environmental Change. It is possible
that a weak collinear relationship did exist between these variables
because the only time that the tolerance level of Power Control
dropped below 0,90 is when it appeared concurrently with
Environmental Change. Nevertheless, the magnitude of the Tolerance
statistics is still acceptable and the possible collinearity is so
smaiJ that it can be discounted.
7.3. Work Interest
The third element of organization climate that was examined concerns

-282-
Work Interest and was made up of two components : (i) Scientific and
Technical Orientation, and (ii) Intellectual Orientation. It will he
recalled that when the factor analysis of all the organization clim
ate variables together was performed (see pages 191 and 192), these
two items were combined into one component factor which was labelled
'Cerebral Stimulation'.
The regression analyses for both of these scales produced a large
number of predictors and, considering that the full sample was used,
some of the correlations and multiple correlations were very high
indeed.
7.3.1. Scientific and Technical Orientation.
1-
I
The multiple regressiOn analysis of the Scientific and Technical
Orientation scale yielded 6 contextual and 4 structural indepen
dent variables, as shown in tigure 8.28.
Single 1 Multiple R I R
Significance I Toler~ R 2 F Ratio Level I ance 1 lndeQendent Variables I
Context: Workflow Integration 0.2915 0.2914 0.0849 42.330 0.0000 Power Control -0.2603 0.3587 0.1286 33.596 0.0000 Environmental Change 0.2211 0.3797 0.1441 25.495 0.0000 Process Technology 0.1541 0.3934 0.1547 20.740 0.0000 Operating Environment 0.1825 0.4039 0.1631 17.625 0.0000 Supplier Dependence -0.0868 0.4133 0.1708 15.492 0.0000
Structure: Formalization 0.4419 0.4418 0.1952 110.64 0.0000 Standardization -0.3078 0.4820 0.2323 68.852 0.0000 Policy Decisions -0.2663 0.4912 0.2413 48.148 0.0000 Autonomy 0.1263 0.4986 0.2486 37.473 0.0000
Figure 8.28. Predicting Scientific and Technical Orientation.
In terms of organizational context, the following relationships
were evident :
.. More automated technology is associated with a scientitic and
technical orientation. It is to be expected that technological
I I
0.9034 0.8139 0.8121 0.9241 0.8889 0.9836
0.8336 0.9011 0.8581 0.9844

-283-
sophistication would be reflected in organization climate .
.... Power Control is negatively related to a scientific and techni
cal orientation. The converse of this relationship is that one
would expect that a high degree of political infighting would
hinder the purely scientific and technical thinking chaiJenge
in an organization.
- A higher degree of environmental change is also a predictor of
scientific and technical activity. The latest technological
advances in an organization's environment would, no doubt,
actively influence this aspect of its climate.
Process technology, in the same vein as the other technology
measure, also exercises an influence on the degree to which a
company's climate is scientifically and technically oriented.
An organization's operating environment is positively associa
ted with its scientific and technical orientation. Turbulence
in the operating environment possibly acts as a stimulus to sol
ving the technological problems brought about by environmental
uncertainty.
- The final contextual relationship is a
weak link with Supplier Dependence.
negatively directed and
Quite why backward
integration should influence climate, albeit weakly, is not
immediately clear.
Turning to the four structural independent variables, it will be
seen that the strongest link by some way is with Formalization.
Insofar as the other three independent variables, apart from forma
lization, are concerned, their relationships with an organiza
tion's scientific and technical orientation are characterized by
freedom: freedom from routine, freedom from centralized decision
making, and freedom from control by a holding company or group.
Again, formalization appears to tly in the face of this trend in
that one would have expected freedom from bureaucracy to be
associated with the trend. And yet formalization is strongly
related to a scientific and technical orientation to the extent of
a correlation of 0,44, which is very strong, and an F Ratio that
is exceptionally high and very signiticant

-284-
So, far from inhibiting and stifling the creative proce~ses, it
seems that a high degree of formalization actually stimulates them!
Every job has its banal and routine aspects. The existence of for
malized systems and routines could well take care of the humdrum
things that must he done; and organization members are then freed
to pursue creative activities in an unfettered way. Formalization
could thus he the foundation upon which free-tlowing creativity is
based.
Examination of the possible collinearity that exists in this
particular regression equation indicates that, of the structural
variables, formalization and centralization of policy decisions
both have Tolerance statistics that are less than 0,90. The
situation here is possibly similar to that of Power Control and
Environmental Change in that whenever these variables occur concur
rently their Tolerance levels fall slightly, indicating the possi
bility of some slight collinearity. Nevertheless, the tolerance
statistics are still high enough to be considered satisfactory and
not to pose any threat to the integrity of the analysis.
7.3.2. Intellectual Orientation.
The second variable in the Work Interest category of organization
climate was that of lntellectual Orientation. This measure was
the other half of the 'Cerebral Stimulation' factor that was
extracted during the factor analysis. The trends emerging from
the multiple regression were very similar to those of the
Scientific and Technical Orientation. This is evident in figure
8.29, except that the contextual variables now number four and the
structural variables number six in total.
Looking firstly at the contextual predictors, the similarity to
the relationships identified in the previous section are quite

-2~5-
I Single I Multiple I R l R
Significance : Toler-i F Ratio Level ! ance ! Independent Variables
Context: Workflow Integration Power Control Environmental Change Process Technology
Structure: Formalization Standardization Policy Decisions First Line Discretion Autonomy Clerical Worker Ratio
I :
I I I o.2868l
1
-0.2682 o.2460 I
i 0.14231
I I
I
0.39771 -0.3112
1-0.30741 1-0.2736
I 0.1442 0.1522
0.2868 0.3603 0.3897 0.4000
0.3977 0.4492 0.4748 0.4863 0.4955 0.5045
0.0822 0.1298 0.1519 0.1600
0.1581 0.2018 0.2254 0.2365 0.2455 0.2545
40.8642 33.9278 27.0955 21.5758
85.6530 57.5008 44.0447 35.0763 29.4209 25.6632
Figure 8.29 Predicting Intellectual Orientation
0.0000 0.0000 0.0000 0.0000
0.0000 0.0000 0.0000 0.0000 0.0000 0.0000
apparent. All of the relationships are in the same direction and
are of the same sort of magnitude as the other Work Interest
variable. The comments that were made with respect to these four
variables in the previous section would apply again in this
section.
Turning to the structural variables, the analogy with the prev1ous
section continues. Formalization is the major predictor of
Intellectual Orientation with high correlations and a very
significant F ratio. Freedom from routine, centralization and
control is supplemented by the inclusion of a negatively directed
relationship with another centralization measure - that of first
line discretion. So freedom of tirst line supervisors to use
their own discretion can be added to the other 'freedoms' inherent
in a climate that stimulates cerebral challenge and thinking
activity. The tinal addition to the ranks of structural variables
is the Clerical Worker Ratio. So a larger number of clerical
workers and support activities is also associated with an
organization where thinking activities are more prevalent.
Oddly, the intluence of organic structures was absent from both
measures of Work Interest or 'cerebral stimulation'. One of the
I I I I i 0.90771
II 0.83341
0.86081 I ' i 0.92791
I I 0.8135 I
i 0.8708
1 0.8238 I 0.8511 I 0.9830
0.9851

-286-
accepted spin-offs of an orgamc structure ts supposedly its
propensity to encourage lateral communication and the free tlow of
ideas and the interchange of viewpoints between different discip
lines and departments. This is apparently not so in South African
manufacturing organizations, although this assertion must be read
together with the findings on the Readiness to Innovate scale on
page 288 below.
Finally, looking at the collinearity of the independent variables,
all of the Tolerance statistics were high enough to encourage
confidence that any possible collinearity was within acceptable
limits. . The situation regarding the possible weak link between
Power Control and Environmental Change, and between Formalization
and Policy Decision Centralization, was again apparent
7.4 Personal Relations
l I I I I
The only measure used to gauge organization climate with respect to
the dimension of Personal Relations was a scale for Interpersonal
Aggression. The main relationships are illustrated in figure 8.30.
Single I Multiple Significance i Toler_; F Ratio Level I ance I Independent Variables R R Ra
Context: Power Control 0.2029 0.2029 0.0412 19.5826 0.0000 Operating Environment 0.0649 0.2354 0.0554 13.3446 0.0000
Structure: First Line Discretion 0.1496 0.1496 0.0224 10.4323 0.0000 Autonomy -0.1472 0.2022 0.0409 9.6967 0.0000 Formalization -0.1322 0.2227 0.0496 7.8964 0.0000
Figure 8.30 Predicting Interpersonal Aggression.
lt will be remembered from the item analysis of the organization clim
ate scales that this measure was concerned primarily with the outward
and physical manifestations of aggression. It is, therefore, not
surprising that Power Control comes out as the most potent predictor
I
0.9378 0.9378
0.9244 0.9937 0.9285

-287-
of all the independent variables.
One would assume that, most of the time, interpersonal aggression
would be an undesirable organization trait - particularly if it is
allowed to reach pathological proportions. .While it is accepted that
a certain, minimal, amount of tension, or aggression, or stress - or
call it what you will - is necessary for optimal functioning, one
can, nevertheless, make the general statement that a climate of inter
personal aggression within an organization is probably dysfunctional.
From a structural variable point of view, interpersonal aggression 1s
predicted by the restriction of autonomy and first line supervisory
discretion. Interestingly, formalization - which is so strongly
linked to the positive dimensions of organization climate - is here
evident in a negatively directed relationship. So a lack of
formalization 1s a possible cause of interpersonal aggression within
an organization.
Looking at Tolerance statistics, all of the independent variables
for both context and structure were very high. So collinearity did
not enter into the equation.
7.5. Routine.
The final element of organization climate to form part of this study
was that of Routine. It consisted of two components : (i) Readiness
to innovate, and (ii) Rules Orientation. Both of these variables
formed the major part of a factor called ·Acceptance of Rules and
Restraints' which was identified in the factor analysis of all the
organization climate variables.
7.5.1. Readiness to Innovate.
According to the item analysis that was carried out earlier m
this study on the Readiness to Innovate scale, it. consisted of

-288-
two factors. The first was concerned with the generation of ideas
inventions, and discoveries, and the second was concerned with
speed and flexibility.
The regression analysis isolated I 1 independent variables - four
were contextual variables and the other seven were structural.
They are all illustrated in figure 8.31.
Single I Multiple R I R
Significance i Toler~ R 2 F Ratio Level I ance I lnde~ndent Variables
Context: Power Control -0.3249 0.3249 0.1055 53.8072 0.0000 Environmental Change 0.2995 0.3796 0.1441 38.2974 0.0000 Organization Size -0.0491 0.3997 0.1597 28.7647 0.0000 internal Dependence I -0.0822 0.4169 0.1738 23.8293 0.0000
Structure: Organicity 0.3892 0.3892 0.1515 81.3920 0.0000 Autonomy . 0.2993 0.4449 0.1979 56.1376 0.0000 Standardization -0.2791 0.4837 0.2340 46.2232 0.0000 Formalization 0.1784 0.5032 0.2533 38.4081 0.0000 Policy Decisions -0.2010 0.5118 0.2619 32.0838 0.0000 Executive Span -0.0380 0.5198 0.2702 27.8222 0.0000 Organization Depth -0.1006 0.5258 0.2765 24.5688 0.0000
Figure 8.31 Predicting Readiness to Innovate.
Three of the contextual relationships - with Power Control, Size
and lnternaJ Dependence - were negatively directed. So, in terms
of its context, an organization can be expected to exhibit a
climate which facilitates innovation if:
- it is not characterized by political scheming and machinations,
- it functions in a changing environment,
it is relatively smaller, and
- it is less dependent on a holding group or owning company.
Insofar as the structural intluences are concerned, four of the
independent structural variables exhibited relationships that were
negatively directed. These were Standardization, Centralization,
CEO's Span of Control, and Organization Depth. The positively
directed relationships, therefore, were with Organicity, Autonomy,
1 0.8544 I
0.8600 0.9594 0.9879
0.89251 0.9323 0.8356 0.8152 0.8562
I o.9626 0.9792

-289-
and Formalization. So a climate of readiness to innovate thrives
in organizations that :
are more organically structured,
... are decentralized and autonomous,
... have less routine and standardization,
.. have a higher degree of formalization,
have a higher degree of centralization of policy decisions, and
have a shallow structure with fewer direct reports to the CEO.
In contrast to the two measures of Work Interest or 'cerebral
stimulation', Organicity features very strongly as a predictor of
an innovative climate - which is, of course, in keeping with the
'classical' features that are attributed to an organic structure.
Again, formalization stands out as the emgma in that a higher
degree of formalization also appears to be conducive to an
innovative climate.
As usual, a look was taken at the Tolerance statistics of the
independent variables of the regression equation. Because of the
larger amount of predictors there was a fair spread of values of
the Tolerance statistics, ranging from 0,815 at the low end to
0,988 at the highest On balance, it was considered that the
degree of collinearity did not pose any great concern to the
validity of the analysis.
7.5.2. Rules Orientation
The second component of the Routine element of organization cli
mate concerned an organization's orientation to rules. Here, in
the item analysis carried out earlier, two factors were revealed.
One had to do with the display of rules and the expectation of
obedience, while the other was more concerned with the degree of
actual compliance.

-290-
Independent Variables I Single I Multiple I R ! R
Significance Ji Toler---1 F Ratio Level , a nee i
i Context: . c I ustomer D d epen ence I o 12161 o 1216 I 00148 6 8453 o oo92 I 1 oooo I
I
Structure: I Organicity -0.2954 1
0.2954 0.0872 43.5822 0.0000 Formalization
I
0.1133 0.3111 0.0968 24.3756 0.0000 Policy Decisions 0.1043 I 0.3395 0.1153 19.7141 0.0000 Standardization 0.14361 0.3545 0.1257 16.2818 0.0000
Figure 8.32 Predicting Rules Orientation.
The regressiOn analysis revealed only one contextual predictor
variable and four structural predictors, as can be seen in figure
8.32. The single contextual relationship was a smallish positive
link with Customer Dependence, indicating that the more dependent
an organization is on its single biggest customer, the more
inclined the organization is to display and obey rules and
regulations. Possibly, the single biggest customer ts m a power
position which allows it to dictate its own terms and conditions
to ensure continuity of supply from the organization.
Regarding the structural independent variables, organizations with
a strong rules orientation tended to be more mechanistic in struc
ture; and more formalized, centralized and standardized. All of
these relationships are probably to be expected in an environment
where compliance is paramount - and so there were no real
surprises in this analysis.
Collinearity was considered to he within acceptable limits, as was
indicated by the Tolerance statistics.
To conclude this discussion on the predictive relationships that
were identified in the multiple regression analysis of the
organization climate variables, some general observations are set
out below.
0.9407 0.8209 0.8618 0.8596

-291-
7.6. Organization Climate General Comments.
The comparative frequencies with which each independent variable
occurred is set out below in figure 8.33 for both the contextual
variables and the structural variables.
~ Contextual Structural I Variables Frequency Variables !Frequency
Power Control 8 Autonomy 8 Environmental Change 5 Formalization 7
Operating Environment 3 Policy Decisions 6 Organization Size 2 Organicity 6
Process Technology 2 Standardization 6 Supplier Dependence 2 First Line Discretion 2 Workflow Integration 2 Executive Span 2
Organization Age 1 Organization Depth 2 Customer Dependence 1 Clerical Worker Ratio 1
Internal De ndence 1
Figure 8.33. Climate: Frequency Distribution of Independent Variables
Insofar as the contextual variables are concerned, Power Control is
by far the most pervasive predictor and this variable, together with
the two environmental measures, account for the majority of the exter
nal contextual influences that shape and mould organization climate
as a whole. The intluence of the structural variables is more evenly
spread with Centralization, Formalization, Standardization and
Organicity all exercising a fair amount of intluence on climate.
Irn a study carried out in the United kingdom, Payne and Manstield
( 1973) found that Organization Size, Internal Dependence, Organiza
tion Age, and Workflow Integration were the primary contextual
predictors; and Specialization, Formalization, Executive Span and
Autonomy were the main structural influences. Size and dependence
were by far the most intluential pressures on organization climate
and, in this regard, their tindings are similar to the original Aston
findings with respect to organization structure.

-292-
The total absence of Specialization as a predictor of organization
climate in South African manufacturing organizations is intriguing.
Specialization, as a structural variable, would reflect the
expertise, tertiary qualifications, and collective brain power of an
organization. And yet it did not feature as a predictor in any of
the elements of organization climate - least of all the Innovation
and Cerebral Stimulation variables. By contrast, in the United
Kingdom study, Payne and Mansfield ( 1973) identified quite strong
links between specialization and Scientific and Technical Orientation
(R = 0,43), Intellectual Orientation (R = 0,34), and Readiness to
Innovate ( R =0,35).
Payne and Mansfield ( 1973) make the point that there is sometimes a
considerable difference between the perceptions of organization clim
ate that are held hy an organization's management corps when compared
to, say, its first line hourly-paid operators. --:,e same situation
would ohviously apply with respect to this study and the perceptions
of climate that have been analysed here are very definitely managem
ent perceptions. Of course, the situation is ex.acerhated in South
Africa by the dichotomy between the first world and third world
elements of the lahour force, which was discussed in some detail in
the previous chapter. It would also be true to say, then, that the
perceptions of climate detailed in this study are those of the first
world element of the workforce.
The strength of formalization as a predictor of organization climate
is worthy of another mention. Formalization is the measure which
most obviously taps aspects of hureaucracy and it was surprising to
find that it was so powerfully connected to the innovative and
thinking challenge activities of an organization. This perception of
formalization is complemented by examining its co-relationships with
respect to standardization and to organicity.
Formalization and standardization appear concurrently four times as
causal variables, and on three of these occasions the causality is in
opposite directions. So while formalization seems to he indicated

-293-
for creativity, innovation and thinking activities; standardization
is contra-indicated for the same activities. Again, the distinction
between these two structural variables in a South African context is
apparent. It will be recalled that, in this· study, formalization and
standardization are not simply two sides of the same coin with resp
ect to alternative control strategies, as was found to be the case in
most other studies. Apparently, the same situation now also holds
true with respect these variables' influence on organization climate.
Looking at the simultaneous <Y:currence of formalization and organtct
ty, of the four times that this occurs, three are in the same direc
tion of causality. So the situation here is that organic structure
and bureaucracy, as measured by formalization, occurred concurrently
75% of the time. What this means is that in South African manufac
turing organizations it is possible for an organization to be both
bureaucratic and organic at the same time. The implication is that
bureaucracy, as exemplitied by a high degree of formalization, is not
necessarily synonymous with mechanistic organization structure, as is
often assumed to be the case.
This finding should also help to alleviate the bad press that
bureaucracy has had for some time. Bureaucracy, per se, is not
synonymous with inefficiency, ineptitude and waste. "Bureaucracy is
merely a type of structure. It is not, . . .of itself, good or bad.
In some situations it is inefficient In others . . . it can be
highly efficient" (Robbins, 1987 : 232).
In conclusion, it is worth noting that the configuration variables
exercised very little influence on organization climate. This
finding emphasises the futility of shuffling the physical structure
and design of an organization in an attempt to positively influence
its climate. Many South African companies - particularly in the high
technology industries - have a penchant for reorganization as a
knee-jerk response to any perceived peril, whether it be increased
competition or declining profits. What this analysis has shown is

-294-
that, to be effective, any structural re-engineering or reorganizat
ion must be accompanit:!d by the appropriate change levers that are
illustrated in figure 8.33.
8. SUMMARY: PREDICTING STRUCTURE AND ORGANIZATION CLIMATE.
The above sections conclude the search for statistical associations and
possible causal relationships with respect to the contextual, structural
and organization climate variables that were examined in this study and
for which data were gathered, treated and analysed.
The stage has now been reached in the sequential application of the
Scientitic Method - as was outlined in tigure 4.1. on page 116 - where
the research problem and the research hypotheses can be revisited with a
view to testing the hypotheses and drawing some conclusions with respect
to the resolution of the research problem.
This is the direction that this thesis will now pursue in the following
pages. Clearly, when the research hypotheses were tirst formulated the
extent of the information processed and the scope of the research
tindings could not be envisaged. And so another objective of the
following sections of this exercise will be to suggest avenues for
further research. These avenues of further research could take the form
of further manipulation and treatment of the data gathered for this
study; or they could include a completely fresh approach with other
sectors of South African commerce or industry.

-294-
that, to be effective, any structural re-engineering or reorganizat
ion must be accompanied by the appropriate change levers that are
illustrated in figure 8.33.
8. SUMMARY.
In this chapter the search for statistical associations and possible
causal relationships with respect to the contextual, structural and
organization climate variables for which data were gathered, treated and
analysed was carried out.
The total sample was analysed first and each dependent structural van
able was subject to a multiple linear regression analysis using all of
the contextual variables as independent variables. The main predictive
relationships that emerged at the default level of significance were
then sequentially illustrated and discussed. Generally, the relation
ships that emerged were consonant with what has been established in
studies that have been conducted elsewhere, although there were one or
two notable exceptions. For example, technology did not feature at all
as a predictor of specialization, and some support was found for a struc
tural life cycle that is the reverse of that in developed countries. A
situation that is similar to that of South Korea. (Kim and Utterback,
1983 ). Power Control, which is a variable not encountered in other
studies and which was measured by a scale developed especially for this
study, proved to be a compelling predictor of structure.
The level of analysis was then reduced to that of individual subgroups
of industries that comprised the sample, based on their SIC codes.
Again, a multiple linear regression analysis was conducted for every
dependent variable in every SIC-coded subgroup and the prominent
relationships were illustrated and discussed.
The apparent conundrum of mechanistic structures dominating in the South
African electronics industry was then briefly re-examined and it was est
ablished that mechanistic structures and a high leve! of bureaucratic

-295-
control had, historically, been quite appropriate for the situation in
the local electronics industry since its inception.
Finally, the analysis shifted to the concept of organization climate and
the same procedure was followed. A multiple regression analysis was
carried out for each of the organization climate variables using all of
the contextual variables as independent variables. In addition, a
second regression analysis was conducted for each climate variable using
the structural variables as independent variables. All of these relat
ionships were then illustrated and discussed. Compared to a similar
study which was done in the United Kingdom (Payne and Mansfield, 1973),
there were some significant differences in the South African situation.
For example, size was not nearly as pervasive as it was in the British
study and specialization, which featured very strongly in the British
study, did not feature at all as a predictor of climate in South African
manufacturing organizations. The relationship of formalization was also
unusual in that it featured as a very strong predictor of innovation and
scientific and intellectual orientation. The Power Control variable,
which was absent from the British study, was the most powerful
predictor of climate among the contextual variables in this study.
The stage has now been reached in the sequential application of the
Scientific Method as was outlined in figure 4.1. on page 116 - where
the research problem and the research hypotheses can be revisited with a
view to testing the hypotheses and drawing some conclusions with respect
to the resolution of the research problem.
This is the direction that this thesis will now pursue in the following
chapter.

CHAPTER NINE: THE RESEARCH PROBLEM AND HYPOTHESES.
1. INTRODUCTION.
In this, the final chapter, the research hypotheses will be examined to
establish whether or not the results of this research support, partially
support, or reject the various hypotheses. Although this study speaks
of 'testing' the various hypotheses, it should be noted that the evalua
tion of whether or not the hypotheses are supported is a judgemental
assessment In other words, it is important for a study of this nature
to establish whether there is panial support for a posttton or even
the amount of support that exists. A simple go /no-go statistical
test would, therefore, be inappropriate. In any event, the need for
statistical purity was addressed at the stage of the multiple regressiOn
analyses when an F ratio was calculated for each and every combination
of dependent and independent variables to express the null hypothesis
that there was no linear relationship between the variables.
The research problem and its attendant subproblems will then also be
recapped with a view to evaluating the degree to which the objectives
that are implicit in the subproblems have been achieved by this study.
Clearly, when the research problem and hypotheses were first formulated
the volume of the information that was gathered and processed and the
scope of the research findings could not he envisaged. And so another
objective of this final chapter will be to suggest avenues for further
research. These avenues of further research could take the form of more
manipulation and treatment of the data gathered for this study; or they
could include a completely fresh approach with other sectors of South
African commerce or industry, apart from manufacturing.
2. RESEARCH HYPOTHESES AND RESEARCH PROBLEM REVISITED
It will be recalled that the fourth research hypothesis was dealt with
and resolved earlier in this study. Its treatment here will, therefore,
be confined to just a short summary of the earlier discussion.
-297-
2.1. The First Hypothesis Contextual Imperatives.
The first research hypothesis stated that :
South African manufacturing organizations are shaped and influenced
by a number of contingencies and structural imperatives which
determine their structure, design and functioning.
Prominent among these imperatives are organization size, power
control, technology, dependence on external organizations or
resources and the degree of environmental turbulence and change.
The results of this study have indicated broad support for this
hypothesis, which accords with similar studies that have been carried
out overseas in both developed and developing countries. There was
also support for the 'culture free hypothesis' originally put forward
by the Aston researchers, viz :
The consistency of relationships between variables of organization context and of organization structure . . . support the 'bold' hypothesis that these relationships, notably between size and specialization and formalization and between dependence and autonomy, will hold for work organizations in all societies. The hypothesis infers that relationships will be constant in direction and . . . in magnitude irrespective of differences in structures or in contexts of structures . . . between societies. (Hickson et al, 1974: 74)
Organization Size was the most pervasive causal variable in South
African manufacturing organizations and the hypothesized links
between dependence and autonomy were also present The influence of
Technology, especially the Workflow Integration variable which
incorporated the automaticity of an organization's primary
technology, was also strong.
New variables and variables not often used in other studies were also
included in this study. For example, the Power Control independent

-298-
variable was developed specially for this study and proved t~ he a
potent predictor of organization structure - to the extent that it
out-performed all of the 'traditional' independent variables except
organization size.
Three measures of an organization's environment were identified and
refined for use in this study. One of these was labelled Unpredicta
bility, hut it unfortunately did not feature at all as a causal
variable. The other two were much more successful as imperatives of
organization structure. The most intluential was the Operating Envir
onment variable which incorporated familiarity of events, reaction
speed to events, visibility of the future, and the geographical scope
of business operations. The final measure of an organization's
environment was a variable called Environmental Change which included
the influence of socio-political, professional, methodological, and
work skills-related change on an organization and its work.
Independent Variable
Organization Size Power control Environmental Change Organization Age Internal Dependence Operating Environment Workflow Integration Customer Dependence Process Technology Organization Life Cycle
i I i Frequency Importance i Index
7 7 6 8 5 6 5 2 1 1
1,85 1,68 1,27 1,15 1,02 0,99 0,98 0,19 0,15 0,10
Figure 9.1. Frequency & Importance of Independent Variables.
The relative frequ·ency and importance of aU the contextual
influences or variables was discussed in some detail on pages 227 to
232. They are summarised above in figure 9.1.

-299-
2.2. The Second Hypothesis Structural Relationships.
The second hypothesis stated that :
OrRanizations in the South African Manufacturing Sector are affected
differently by contextual variables. Generally, structuring of
activities (specialization, standardization and formalization) will
he more closely related to size and power control and less closely to
technology; while design or configuration variables will be related
more closely to power control and technology and less closely to
organization size. Centralization, or concentration of authority,
will be related mostly to dependence and power control. There will,
nevertheless, be sign(ficant d(fferences between industries within
the manufacturing sector.
There are five elements that make up this hypothesis : (i) the
differential influence of contextual variables, (ii) the structuring
of activities variables, (iii) the design or configuration variables,
(iv) centralization or concentration of authority, and finally
(v) group differences within the manufacturing sector. Each of these
elements is treated sequentially below.
2.2.1. The Differential Influence of Contextual variables.
In the course of the multiple regression analyses that were
carried out on all of the structural variables it became it became
clear that, while there were some contextual variables that were
more pervasive than others, each of the dependent structural
variables was linked to its own unique group or combination of
contextual variables. Figure 8. 10 illustrates this point very
clearly. So this first aspect of the second hypothesis is
supported by the findings of the research.

-300-
2.2.2. The Structuring of Activities Variables.
One of the first things that became clear during the item analyses
and factor analyses of the dependent structuring variables was
that the usual 'structuring of activities' cluster of variables
that has normally been found in other studies did not apply in
this study. Most notably, standardization was not simply the
other side of the same coin as formalization, neither did it bear
the usual close relationship with the other structural variables.
This is, no doubt, partly due to the fact that a different scale
to the normal Aston measure was used which embodied routinization
rather than just standardization.
The hypothesized relationship with stze was present for both
specialization and formalization but not for standardization.
The postulated relationship with Power Control was only present
for formalization, where it was negatively directed and weaker
than the relationship with technology.
Technology was present as a predictor for standardization, but the
other predictors for standardization were the environment and age
and did not include either size· or power control.
The relationships with size and technology were present for
formalization and in the hypothesized proportions.
In summary, size was signiticant in 2 out of the 3 structuring of
activities variables and power control was significant in only
one. Technology feature in 2 of the 3 structuring of activities
variables, but only once did it appear in the expected
co-relationship with size. Relationships between structural
variables and dependence and the environmental variables were
significant but did not form part of this hypothesis.
In total, there was support for this aspect of the hypothesis but
it was incomplete.

-301-
2.2.3. Desi&:n or Configuration Variables.
The three independent variables around which this aspect of the
second hypothesis is formulated were present concurrently only
once in the six configuration variables; and then the relationship
is virtually the reverse of that postulated, i.e. organization
depth was related more closely to size than to power control and
technology. Size also figured as the most important predictor in
the CEO's span of control and the subordinate ratio. In the
latter case it appeared together with technology in a reversal of
the postulated co-relationship. Of the other configuration
variables, power control was the most important predictor for the
indirect worker ratio and technology was the second most important
for the clerical worker ratio.
In summary, the postulated strength of power control as a
predictor of configuration did not materialize. While technology
was apparent as a predictor for three of the six configuration
variables it was never the most important Size, on the other
hand, was the most signiticant in three of the six relationships :
with the CEO's span of ~ontrol, with the subordinate ratio, and
with organization depth. So, in the ongoing 'dispute' between
advocates of the Technology imperative versus the Size imperative,
as exemplified by Woodward (1958) and Hickson et a/(1969), the
situation in South Africa lends support to the size imperative.
Other variables which were intluential in predicting configuration
but which did not form part of this hypothesis were the operating
environment, organization age, and dependence. Taken altogether,
there was no support at all for this portion of the hypothesis in
the form that it was expressed.
2.2.4. Centralization or Concentration of Authority.
Although it is not spelt out, the expected dire.ction of the

-302-
relationship between centralization and dependence, and centrali
zation and power control was positive in both cases, meaning that
the relationship with autonomy, or decentralization, would be
negative for both contextual variables.
Power control appeared in the expected direction in all three of
the centralization measures and it was very significant in the cen
tralization of both policy decisions and first line discretion.
Dependence displayed the expected strong relationship with autono
my, but showed only a weak relationship with the centralization of
policy decisions and no relationship at all with the centraliza
tion of first line supervisory discretion.
So, of the six expected relationships, four were present, one was
present but in the opposite direction and one was not present at
all. Again, there· is some support for this part of the
hypothesis, but it is incomplete.
2.2.5. Group Differences in the Manufacturing Sector.
Section 4 of chapter eight dwelt at some length on the intergroup
differences between the various SIC codes that made up the
research population. Figure 8.11 illustrated the range of mean
scores on all of the contextual and structural variables for each
of the eight SIC-coded subgroups of organizations. Each of the
multiple regression analyses that were carried out for every SIC
code revealed significant intergroup differences in the
application and influence of the contextual variables. to the
structural variables.
These differences were also illustrated by the three trial
combinations of ·SIC groups where it was demonstrated that the
combination of seemingly similar industries into a larger aggre
gated group exercised a considerable effect on the independent
variables that were identified as being significant predictors.

-303-
This final aspect of the second hypothesis can, therefqre, he
considered as being strongly supported hy the research tindings at
a group level. Nevertheless, it was interesting to note that when
the results of all the SIC groups' regression equations were taken
together, the most frequently occurring variables were still the
traditional ones of Size, Internal Dependence, and Technology. So
despite many noteworthy intergroup variations there was still
constancy in the overall occurrence of the core variables.
2.2.6. The Second Hypothesis : Summary.
In summary, there was modest support for the second hypothesis as
a whole. There was complete support for the first and last
aspects - independent contextual variables exercised differential
influence on the structural variables; and there were significant
differences between subgroups in the manufacturing industry in
terms of the causal relationships between context and structure.
There was some support for the second and fourth aspects which
depicted the relationships between context and structuring of
activities, and context and centralization.
And, finally, there was no support at all for the third aspect
which held that power control and technology would he the
overriding predictors of configuration. lnstead, the more
traditional influences of size and technology were paramount
2.3. The Third Hypothesis : Or&anic and Mechanistic Structures.
The third hypothesis stated that :
In South African Manufacturing firms, Organic Structures (character
ized by participatory decision making, a decentralized hierarchy of

-304-
authority, and few formal procedures) will he associated with
conditions of high environmental uncertainty and low dependence.
Conversely, Mechanistic Structures will he associated with conditions
of low environmental uncertainty and high dependence.
Testing the third hypothesis is somewhat problematic because some of
the assumptions upon which it is based have been contradicted and
challenged in another part of this study, albeit indirectly. It will
he recalled that, in the discussion of organization climate, there
was a strong link between formalization and many aspects of organiza
tion climate which are normally assumed to be the product of an organ
ic structure and are supposedly antithetical to a bureaucratic
structure. So the following comments must be read bearing in mind
formalization's status as a possible 'wild card'.
Figure 7. 9 on page 170 indicated that, in terms of the classical
picture of organic structures, the expected links as depicted by
their correlation coefficients were all present and 10 the expected
directions :
there was a strong positive correlation between organicity and
decentralization,
- there were strong negative correlations with hoth centralization
and standardization, and
- the expected negative correlation with formalization was present
but it was quite weak.
So the organicity variable that was used in this study is a valid
measure of organic structure in the classical mode.
Figure 8.10 on page 228 indicates that the relationship between
organic structure, as characterised by the organicity measure, and
environmental uncertainty, and organic structure and dependence are
both present and both are in the expected direction. ln other words,
internal dependence is negatively related to organicity, and

-305-
environmental change is positively related to organicity.
The third hypothesis is, therefore, supported by the results of this
study. It should be noted, though. that the most important predictor
of an organic structure is a negatively directed relationship with
power control. This was a connection that was not anticipated in the
original hypothesis but it is an important factor. One would expect
that a positive relationship with power control would have the capac
ity to negate the intluence of the other two variables as predictors.
2.4. The Fourth Hypothesis : Structural Interrelationships.
The fourth hypothesis stated that :
A number of internal variables and organizational characteristics
will exhibit relationships to each other that are consistent with
findings in other major organizational research projects throughout
the world:
Venical Span of Control or Organization Depth is positively related
to Formalization, Functional specialization, Decentralization,
Lateral span of control, and the administrative staff ratio.
Formalization is positively related to Functional specialization.
Professional qualifications, Decentralization, and the administrative
staff ratio.
Functional Specialization is positively related to decentralization
and the administrative staff ratio.
Decentralization is positively related to the administrative staff
ratio.
Type of structure, shape or configuration is related to Formaliza
tion, Functional specialization, and Decentralization.

-306-
The fourth hypothesis was discussed in some depth on pages 171 to 177
and the discussion will not be repeated here, except for the
following brief summary.
"Looking at the fourth hypothesis overall, there seemed to be
general support for the internal structural relationships . that
were proposed -with three possible exceptions :
(i) Of five anticipated correlations, Organization Depth showed
a weak relationship to one variable and no significant
relationship with the other four.
(ii) The relationship between formalization and the Subordinate
ratios was also the opposite of what was anticipated.
(iii) Standardization was negatively correlated to both speciali
zation and formalization, contrary to expectations and to
the findings of other studies in advanced economies. The
relationships between formalization, centralization and
standardization or routine also exhibited characteristics
which are dissimilar to those found in other studies."
2.5. The Fifth Hypothesis : Organizi!tion Climate.
The fifth, and final, hypothesis stated that :
Contextual variables which shape structure will also influence asp
ects of organization climate. Thus size will be positively related
to scientific and intellectual orientation, employee involvement,
readiness to innovate. interpersonal aggression, emotional control,
leaders' psychological distance, and concern with following rules.
Complex Technology is negatively related to emotional control,
interpersonal aggression, and leader's psychological distance, and
positively related to questioning authority, scientific and intellec
tual orientation, concern for employee involvement, and readiness to
innovate. Dependence will be related positively to emotional

-307-
control, interpersonal aggression, rules orientation, and leaders'
psychological distance; and negatively to questioning authority, con
cern for employee involvement. and readiness to innovate. Finally,
power control ·will be positively related to leaders' psychological
distance and concern for following rules and negatively related to
interpersonal aggression, questioning authority, scientific and
intellectual orientation, and concern for employee involvement.
It was decided not to include some of the contextual variables, or
any of the 13 structural variables, as independent variables in the
original tifth hypothesis. This was simply because the total number
of postulated relationships would have swelled to 25 in total and
this would have been too cumbersome to control. Nevertheless, the
evaluation of all of the contextual and structural variables was
an integral and very important part of the actual analyses that were
carried out.
The hypothesized relationships, therefore, concern only the relation
ships between organization climate and the selected contextual
variables of Organization Size, Technology, Dependence, and Power
Control. These are summarised below in figure 9.2 together with the
actual results of the multiple regression analysis. The first symbol
i Climate : liContext . . Size Tech- Depen- I Power
II I no logy de nee I Control I I
1. Scientific & Technical orientation + N + + 0 -2. Intellectual orientation + N + + 0 N I 3. Leaders' psychological distance
I + + t=! N + N
4. Concern for employee involvement + N N - N I 5. Readiness to innovate + - N I - -6. Interpersonal aggression + N - N + N 7. Emotional control + N - N + -8. Rules orientation + N 0 N + + l 9. Questioning authorjty 0 N +N - N
Figure 9.2. Relationships Between Context and Climate.
+ = Positive relationshil_) - = Negative relationship 0 = No postulated relationship N = No relationship at 0,05 level
- -- -+ + - -0-- + 0 + + N --
I
i

-308-
in each cell refers to the hypothesized relationship betwe.en the
climate variable and the contextual variable while the second symbol
refers to the actual relationship.
The relationship of size with the climate variables was only present
twice out of the hypothesized eight occasions and one of these was in
the opposite direction. In terms of technology, of the eight
hypothesized relationships two were confirmed and both were in the
direction expected. There were seven hypothesized relationships
involving dependence. Three occurred and one of these was in the
opposite direction to that expected. Finally, power control embodied
seven hypothesized relationships and of these six were present
although one was in the opposite direction.
So support for the fifth hypothesis is, at best, sketchy at the 0,05
level of significance. The relationship between organization climate
and aspects of context is unclear and does not bear much similarity
to other overseas studies. (Payne & Mansfield, 1973 and Payne &
Pheysey, 197lb).
Although no hypothesized relationships were put forward for the
structural variables and organization climate for the reasons that
were set out above, it is clear that many of the relationships that
did emerge between these two sets of variables would have been quite
different from those that may have been hypothesized on the basis of
similar studies carried out elsewhere. This would have been particu
larly so for relationships involving perceptions of bureaucracy as
exemplified by the structural variable of formalization.
2.6. The Research Problem
The research problem that was the basis for this study related to the
lack of knowledge about South African organizations, particularly
from an Organization Theory point of view. The research problem

-309-
was broken down into a number of subproblems and these formed the
foundation of the research hypotheses. To conclude this discussion
on the research hypotheses it will he instructive to briefly revisit
each of the subproblems again to establish whether the objectives
that they embody have been achieved.
The first subproblem was to make a contribution to Organization
Theory as it relates to South African business organizations by
determining whether there are contingencies and imperatives ~vhich
shape the structures of companies in the Manufacturing sector.
The objectives of the first subproblem were encapsulated in the
first research hypothesis. A number of factors were identified
and tested and their linkages with the structures of companies was
confirmed. In the process, a great deal of empirical information
was assembled, sifted and studied. That a contribution was made
to the greater Organization Theory is beyond doubt,
particularly when one considers the paucity of similar research in
South Africa.
... The second subproblem was to evaluate the operating environment
of the South African Manufacturing Sector to establish its degree
of turbulence and uncenainty; and to identify the major factors,
exogenous to organizations, which influence and mould structure.
The objectives of the second subproblem were incorporated into the
first three research hypotheses. Turbulence and uncertainty were
measured by the three environmental scales of Operating Environ
ment, Environmental Change, and Unpredictability. A number of
factors exogenous to the organization were treated as corntextual
or independent variables and their effects on structure were
measured and analysed.
... The third subproblem was to evaluate whether conventional wisdom
(e.g. organic structures should predominate in a high technology
industry) is applicable to the South African environment.

-310-
Although general support for most Organization Theory concepts
was established in this study, there were, nevertheless, some
noteworthy exceptions. For example, the situation regarding
alternative strategies of bureaucratic control; the unexpected
effects of formalization on organization climate; and the total
lack of influence of specialization on key aspects of climate are
just three instances of Organization Theory principals applying
differently in a South African context.
- The Founh suboroblem was to evaluate and analyse the treated
data to gauge the effects, if any, of South Africa's uniqueness on
its organizational structures.
The effects of South Africa's uniqueness m terms of its blend of
third world and tirst world cultures and values was apparent in
the differing composition of the structuring of activities
variables and in the factors that emerged from the factor analysis
of all the structural variables. In terms of organization
climate, there were also indications of South Africa's uniqueness
in the factors that emerged as well as the performance of some of
the variables. The unexpected effects of formalization as the
most potent measure of bureaucracy is again germane in this
context. In addition, the situation with respect to the South
African electronics industry and the preponderance of mechanistic
structures was another indicator of how this country's uniqueness
has affected its organization structures. In this case it was the
country's outcast status coupled with trade sanctions and strong
government support for strategic industries that was probably the
overriding influence on structure.
- The Mh subproblem was to explore the influence of structure at
organization and group level to establish the linkages, if any,
between aspects of structure, environment, and organization
climate and organization culture.
The linkages and causal relationships between contextual, struc
tural and organization climate variables are what the bulk of

-311-
the previous chapter was about. AJI of these relationships have
been extensively explored both at the industry level and at the
group level.
In conclusion. it may confidently he said that the research problem
that initiated this study and the subproblems and hypotheses that it
spawned have all been adequately addressed and resolved. An inevit
able consequence of this exercise has been that the generation of a
large amount of information has triggered a host of new questions and
potential research directions. In the following section some
suggestions are put forward with respect to the possibilities that
exist for further research.
3. SUGGESTIONS FOR FURTHER RESEARCH.
The following list of possible research directions is split into three
sections: (i) Same population, same data; (ii) New population, same
methodology; and (iii) Same population, different methodology.
Obviously, the list is not exhaustive and many other useful avenues may
occur to the reader.
3.1. Same Population. Same Data
The comprehensive nature of the questionnaire and the gratifying
response that it produced has resulted in a very large sample of
tested and reliable data. There are many more nuances of information
that can still be gleaned from this data base. Some examples may
include:
exploring the linkages between climate and context and structure
at SIC subgroup level,
,_ analysing demographic ·differences by development regiOn or
province, and
_ testing the 'reverse life cycle' hypothesis by controlling for age
and life cycle stage.

-312-
3.2. New Population. Same Methodology.
This study appears to be the first of its kind in South Africa and
most of the scales were used for the first time in a local applica
tion. The need exists, therefore, for other studies to be done on
different populations using the same methodology so that comparative
norms can be established. Some directions to follow could include :
validation of the scales used, both those that were imported and
those that were created specially for this study;
the power control scale was a potent predictor but it 1s largely
untested and needs more work and refinement;
other contextual and structural variables also need to be
identified, operationalized and tested; and
the aspect of South Africa's umqueness and the non-applicability
of some Or~anization Theory concepts also needs to be pursued
in another population.
3.3. Same Population, Different Methodology.
The emphasis of this study was clearly on quantitative methods and
the objective was to quantify and measure independent and dependent
variables in a parametric, cross-sectional study. ' The way is thus
left open for other approaches to the same research population, which
may compliment, amplify or even dispute the results of this study.
Some instances could be :
- non-parametric, qualitative studies using interpretive, processual
methods at the individual organization level of analysis;
.. a longitudinal study of the variables identified in this study;
and
pursuit of a hybrid manufacturing organization structure for South
Africa which embodies its uniqueness and that is going to compete
successfully with. advanced Western economies as well as the
Pacific Rim tigers. We have seen in this study that organicity
has less to do with structure and more to do with an ethos or
philosophy. As such, it was quite possible for organizations to

-313-
be both bureaucratic and organic at the same time. In this
context, perhaps the concept of 'Ubuntu' applied to South Africa's
traditional bureaucracies may be well worth following up.
4. SUMMARY
In this final chapter· three objectives were set. Firstly, the research
hypotheses were recalled and the degree to which this study supported
each hypothesis was evaluated. It was established that there was
support for the first and third hypotheses while the fourth had general
support with the exception of three of its aspects. There was modest
support for the second hypothesis resulting from complete support for
two of its dimensions, some support for another two, and no support at
all for a fifth dimension. The fifth hypothesis had only superficial
support, pointing to significant differences between organization
climate in South Africa and a similar study conducted in the United
Kingdom.
A second objective of this chapter was to re-evaluate the research
problem and its ancillary subproblems to gauge the degree to which the
goals embodied in the subproblems had been achieved by this study. The
judgment was that all of the subproblems had been successfully resolved.
The third objective of this final chapter was to suggest. possible direct
ions for future research. Ten suggestions were put forward, some of
which involved further manipulation and treatment of the data gathered
for this study; and others involved a completely fresh approach with
other sectors of the economy, using either the same or different
methodology.
5. CONCLUSION.
And so the point has been reached where a conclusion to this thesis can
be written. The path that was travelled began with the identification

-314-
of a problem that was worth researching; which then grew into a number
of research hypotheses and a fully tledged research project
A· comprehensive review of the related literature and research in other
parts of the world was carried out and made up the second and third
chapters of this study. The second chapter traced the antecedents of
modern day organization theory to its earliest beginnings and looked at
the organizational issues with which early Mediterranean and Middle
Eastern societies grappled. Some of the more awesome organizational
accomplishments of mankind up to and including the industrial revolution
and the early modern world were recounted, leading to the tirst attempts
at putting together a cohesive theory about organizations. German socio
logist, Max Weber, is generally regarded as being the father of organiza
tion theory and a number of schools based on Weber's bureaucratic ideal
type were described and contrasted. A lot of attention was paid to the
work of the Aston group and to their efforts to operationalize Weberian
concepts of bureaucracy and to develop a cogent and replicable body of
quantitative research. The replications and extensions of the Aston
work throughout the world were outlined.
Chapter three continued the examination of related literature and
research and looked at selected works chosen from the mountain of
literature that exists under the heading of Organization Theory.
Points of departure were re-examined and some new twists to Systems
Theory and Structural Functionalism were considered. Current views on
the influence of the environment and other structural imperatives were
considered and a look was taken at the special issues involving high
technology companies. The chapter continued with a brief survey of
organizational studies that have been carried out in countries other
than advanced Western economies. Finally, the major opposing viewpoints
of organization theorists were summarised and contrasted and an attempt
was made to reconcile the main disputing perspectives by means of a
model developed by Astley and Graham (1983).
Chapter four set the tone for the ensuing investigative exercise by deti
ning the principles of the Scientific Method and positioning this study

-315-
with respect to certain critical prerequisites of the credibility and
relevance of the research. The fifth chapter took a detailed look at
all of the key concepts and defined all of the independent and dependent
variables both conceptually and operationally; while the sixth chapter
described the data gathering instrument - the questionnaire - and
compared the demographic characteristics of both the sample and the
population from which it was drawn. After a number of statistical
parameters were calculated it was concluded that the sample was very
representative and the results of the study could, therefore, be
generalised to the population with some degree of confidence.
In the seventh chapter the processing and treatment of the data that
were gathered by the questionnaire was described. A great deal of care
was taken to test and validate each of the scales that comprised the
questionnaire. The results of the study would only be as valid and as
credible as the data upon which it was based. Reliability statistics,
item analyses and factor analysis were carried out for each and every
variable and group of variables.
In chapter eight the emphasis shifted to the search for statistical asso
ciations and causal relationships between the various sets of variables,
both at the sector level and at individual industry subgroup level. A
detailed and painstaking analysis· was carried out, firstly, on the total
sample to establish the linkages between the contextual variables and
organization structure. Secondly, a similar analysis was conducted at
SIC group level; and, finally, organization climate was examined to
establish its predictors both among the contextual variables and the
structural variables. A number of areas where this study was both simil
ar to, and different from, other studies were highlighted and discussed.
In the final chapter, the research problem, its subproblems and the
research hypotheses were restated and discussed. Some firm conclusions
were drawn regarding the degree to which the hypotheses had been
supported or not, and whether the research problem and subproblems had
been resolved.
suggested.
Finally, some ideas for future research directions were

SOURCE LIST AND BIBLIOGRAPHY.
At1ti, A. A. & A zen, S P.
Ahrne, G.
Albers, H. H.
Aldrich, H. E.
Alvesson, M
Anderson, A.J. B.
Ansoff, I & Sullivan, P.A.
Ashmos, D.P. & Huber, G.
Astley, W. G.
Astley, W.G. & van de Ven, A
Ayoubi, Z.M.
Azumi, I{ & McMiHan, C.J.
Badram, M & Hinings, Bob.
Baker, B.W.
1979 Statistic a I An a I y sis : A compute r oriented approach. New York: Academic Press.
1990 Agency and Organization. London: Sage Publications
1969 Principles of Management. London: John Wiley & Sons.
1972 Technology and Organizational Structure: a re-examination of the findings of the Aston Group. Administrative Science Quarterly. vol 17 26-43.
1987 0 r g a n i z a t i o n T h e o r y a n d T e c h n o c r a t i c Consciousness. Berlin: Walter de Gruyter.
1990 Interpreting Data: a first course in statistics. London: Chapman & Hall.
1993 Empirical Support for a Paradigmic Theory of Success Behaviours of Environment Serving Organizations. (paper) San Diego: United States International University.
1987 The Systems Paradigm in Organization Theory: correcting the record and suggesting the future. Academy of Management Review. vol 12, no 4, 607-621.
1984 Structural Sources of Intraorganizational Power: a theoretical synthesis. Academy of Management Review. vol 9, no 1, 104-113
1983 Central Perspectives and Debates in Organization Theory. Administrative Science Quarterly. Vol 28, June 1983,245-273.
1981 Technology, Size and Organization Structure in a developing country: Jordan. In: Organization & Nation: the Aston programme 4; edited by D.J. Hickson & C.J. McMillan, Westmead: Gower Publishing, 1981.
1981 Management Strategy and Organization Structure: a Japanese comparative study. In: Organization & Nation: the Aston prouamme 4; edited by D.J. Hickson & C.J. McMillan, Westmead: Gower Publishing, 1981.
1981 Strategies of Administrative control and Contextual constraints in a less-developed country: the case of Egyptian Public Enterprise. Organization Studies. vol2, no 1, 3-21.
1982 History of Egypt In: Encyclopaedia Britannica; Chicago: University of Chicago. •

Bahrami, H. & Evans, S.
Barnett, V.
Beckmann, Martin J.
Behling, John H.
Blunt, P.
Brass,D.J.
Brown, F. B.
Bryman, Alan
Bryman, A & Pettitt, AN.
Bryman, Alan
Burns T
Burns, T & Stalker, G. M.
Chatfield, C. & Collins, A.
Child, John
Child, John
Child, J. & Mansfield, R.
1989 Emerging Organization Regimes in High Technology Firms: the bimodal form. Human Resources Management. vol 28, no 1, 25-50.
1991 Sample Survey: principles and methods. London: Edward Arnold.
1983 Tinberger Lectures on Organization Theory. Berlin: Springer-Verlag.
1979 Guidelines for Preparing the Research Proposal. Washington: University Press of America.
1983 Organization Theory and Behaviour : an African perspective. New York: Longman.
1984 Being in the Right Place: a structural analysis of individual influence in an organization. Administrative Science Quarterly. vol 29, Dec 1984,518-539.
1976 Principles of Educational and Psychological Testing. Hew York: Holt, Reinhart & Winston.
1988 Doing Research in Organizations. London: Routledge.
1985 Problems of Short Scales: the case of the Aston studies. Quality and Quantity. vol 19, no 4, 375-382.
1989 Research Methods and Organization Studies. London: Unwin Hyman.
1984 Mechanistic and Organismic Structures. In: Organization Theory: selected readings; edited by D.S. Pugh, Harmondsworth: Penguin Books, 1984.
1961 The Management of Innovation. London: Tavistock.
1980 Introduction to Multivariate Analysis. London: Chapman & Hall.
1972a Organization Structure and Strategies of Control: a replication of the Aston study. Administrative Science Quarterly. vol 17, no 2, 163-177.
1973 Pre d i c tin g and U n de r standing 0 r g ani z at ion Structure. Administrative Science Quarterly. vol 18, 168-185.
1972 Technology, Size and Organization Structure. Sociology. September, 369-393.
Christie, P., Lessem, R. & Mbigi, L.
Clark, Peter.
Clegg, S. R. (editor)
Conner, Patrick E.
Converse, J. M.
Covin, J. G.; Prescott, J. F & Slevin, D.P.
Crozier, M.
Daft, R.L.
Daft, R.L. & Dohlen, l<.M.
Denison, Daniel R.
Donaldson, Lex
Donaldson, Lex
Donaldson, L; Child, J & Aldrich, H.
Donaldson, L. & Warner, M.
Fayol, H
1993 African Management: philosophies. concepts and applications. Johannesburg: Knowledge
Resources.
1990 D esc rib in g and E x plain i n g the S t r u c t u r e of Canadian Textile Firms. Birmingham: Aston
1990 Organization Theory and Class Analysis: new approaches and issues. Berlin: Walter de Gruyter.
1984 Organization Structure and Design. Chicago: Science Research Associates.
1986 Survey Questions: handcrafting the standardized questionnaire. Beverley Hills: Sage Publications.
1990 The Effects of Technological Sophistication on Strategic Profiles, Structure and Firm
Performance. Journal of Management Studies. vol27, no 5, 485-510.
1964 The Bureaucratic Phenomenon. Chicago: University of Chicago.
1983 Organization Theory and Design. St Paul: West Publishing Company.
1984 Organization Theory: cases and applications. St Paul: West Publishing Company.
1990 Corporate Culture and Organization Effectiveness. New York: John Wiley & son.
1985 In Defence of Organization Theory. Cambridge: Cambridge University Press.
1988 In Successful Defence of Organization Theory: a Routing of the Critics. Organization Studies vol 9, 28-32.
1975 The Aston Findings on Centralization: further discussion. Administrative Science Quarterly.
vol 20, 453-460.
197 6 B u r e a u c rat i c and De m ocr at i c S t r u c t u r e i n Occupational Interest Groups. In: Organization Structure: Extensions and Replications: the Aston Programme 2; edited by D S Pugh and C J Hinings, Westmead: Saxon House, 1976.
1984 General Principals of Management. In: Organization Theory: selected readings; edited by D.S. Pugh, Harmondsworth: Penguin Books, 1984.

Ford, J.D.
Ford, J.D., & Hegarty, W. H.
Ford, R.C., Armandi, B. R. & Heaton, C.P.
Freund, J. E., Williams, F.J. and Benjamin, M.P.
Galbraith, Jay R.
Grandori, Anna.
Greenwood, R & Hinings, C. R.
Griffith, G. T.
Grimes. A.J.
Grinyer, P. H. & Yasai-Ardekani, M.
Grinyer, P. H. & Yasai-Ardekani, M.
Hartman, E.M.
Hesterly, W.S.; Liebeskind, H. & Zenger, T. R.
Hickson, D.
1979 Research Notes: questionnaire measures of organization structure: a re-examination. Academy of Management Journal. vol 22, no 3, 601-610.
1984 Decision Makers' Beliefs about the Causes and Effects of Structure: an exploratory study. Academy of Management Journal vol 27, no 2, 271-291.
1988 Organization Theory: an integrative approach. New York: Harper & Row.
1988 Elementary Business Statistics: the modern approach. Englewood Cliffs: Prentice-Hall.
1977 Organization Design. Reading, Massachusetts: Addison-Wesley.
1987 Perspectives on Organization Theory. Cambridge, Massachusetts: Ballinger.
1976 Contingency Theory and Public Bureaucracies. In: Organization Structure: Extensions and Replications: the Aston Programme 2; edited by D S Pugh and C J Hinings, Westmead: Saxon House, 1976.
1982 Philip of Macedonia. ln: Encyclopaedia Britannica; Chicago: University of Chicago.
1978 Authority, Power, Influence and Social Control: a theoretical synthesis. Academy of Management Review. no 3, Oct, 724-735.
1980 Dimension of Organization Structure: a critical replication. Academy of Management Journal. vol 23, no 3, 405-421.
1981 Research Note: Some Problems with Measurement of Macro-organizational Structure. Organiza-tion Studies. vol 2, 287-196.
1988 Conceptual Foundations of Organizational Theory. Cambridge, Massachusetts: Ballinger.
1990 Organizational Economics: an impending revolution in Organization Theory. Academy of Management Review. vol 15, no. 3, 402-420.
1988 Offence and Defence: a symposium with Hinings, Clegg,Child, Aldrich, Karpik and Donaldson. Organization Studies. vol9, no. l, 1-32.

Hickson, D.J.; Hinings, C. R.; Lee, C. A., Schneck,R. E. and Pennings, J.M.
Hickson, D.J.; Hinings, C.R.; Me Millan, C.J. & Schwitter,J. B.
Hickson, D.J. & Me Millan, C.
Hickson, D.J.; Pugh, D.S. & Pheysey, D.C.
Hinings, C. R.
Hinings, C. R., Hickson, D.J. Pennings, 1. M. & Schneck, R. E.
H inings, C. R. & Lee, G. L.
Hinings, C. R.; Ranson, S. & Bryman, A.
Hodge, B.J. & Anthony, W.P.
Hodges, H.M.
1971 A Structural Contingencies Theory of lntraorgan izational Power. Administrative Science Quarterly. vol 15, 216-229.
1974 The Culture-free Context of Organization Structure: a tri-national comparison. Sociology. vol 8, 59-80.
1981 Organization and Nation: the Aston programme 4. Westmead: Gower Publishing.
1969 Operations Technology and Organization Structure: an empirical reappraisal. Administrative Science Quarterly. vol 14, 378-397.
1988 Defending Organization Theory: a British vtew from America. Organization Studies. vol 9, no. 1, 2-7.
1974 Structural Conditions of Intraorganizational Power. Administrative Science Quarterly. no 19, 22-44.
1976 Dimensions of Organization Structure and their Context: a replication. In: Organization Structure: extensions and replications: the Aston Programme 2; edited by D.S. Pugh & C. R. Hinings, Westmead: Saxon House, 1976.
1976 Churches as Organizations: structure and context. In: Organization Structure: extensions and replications: the Aston Programme 2; edited by D.S. Pugh & C.R. Hinings, Westmead: Saxon House, 1976.
1984 Organization Theory. 2nd edition. Boston: Allyn & Bacon Inc.
1975 Conflict and Consensus: an introduction to Sociology. New York: Harper and Row.
Holdaway, E.A.; Newberry, 1975 Dimensions of Organizations in Complex Societies: 1. F., Hickson, D.J. & Heron, R.P.
Horvath, D.; McMillan, C.J.; Azumi, K. & Hickson, D.J.
the education sector. In: Organization Structure: extensions and replications: the Aston Programme 2; edited by D.S. Pugh & C.R. Hinings, Westmead: Saxon House, 1976.
1976 The Culture-free Context of Organizational Control: an international comparison. International Studies of Management and Organization. vol 6, 60-86.

Human, P.
lnkson, J. H. K.; Pugh, D.S. & Hickson, D.J.
Jensen, M.C.
Jacobson, Dr David H.
Jacobson, Dr David H.
Jacobson, Dr David H.
Jorgensen,J.; Hafsi,T. & Kiggundu, M.
Keller, Robert T.
Kendall, Sir M.
Kets de Vries, M & Miller, D.
Kim, L & Utterback, J.M.
Kuc, B.; Hickson, D.J. & McMillan C.J.
Koberg, C.S. & Ungson, G.R.
Lawler, E. E. & Associates
Leedy, Paul D.
1993 A Population Ecology Perspective. ln: African Management Philosophies: concepts and applications. edited by Christie, Lessem & Mbigi. Johannesburg: Knowledge Resources.
1976 Organization Context and Structure: an abbreviated replication. Ad mi nis.trative Scie nee Quarterly. vol 15, 318-329.
1983 Organization Theory and Methodology. Accounting Review. vol58, no. 2, 319-349.
1993 Technology and Management Paper delivered at a Conference on Technology; Dept of Public Administration, Unisa.
1993 The Electronics lndustry : a bright star 10 the new South Africa. Unpublished paper.
U /K An lnternational Perspective on South African Technology. Unpublished paper.
1986 Towards a Market Imperfections Theory of Organization Structure in Developing Countries. Journal of Management Studies. vo123, 417-442.
1984 The Harvard "Pareto Circle" and the Historical Development of Organization Theory. Journal of Management vol 10, no. 2, 193-203.
1980 Multivariate Analysis. High Wycombe: Charles Griffen.
1986 Personality. Culture and Organization. Academy of Man·agement Review. vo1 11, 266-279.
1983 The Evolution of Organizational Structure and Technology in a Developing Country. Management Science. vo129, 1185-1197.
1980 Centrally Planned Development: a comparison of Polish factories with equivalents in Britain, Japan 7 Sweden. Organization Studies. vol 1, no 3.
1987 The Effects of Environmental Uncertainty and Dependence on Organization Structure: a comparative study. Journal of Management vol 13, no. 4, 725-737.
1985 Doing Research that is Useful for Theory and Practice. San Francisco: J ossey-Bass.
1989 Practical Research Planning and Design. New York: MacMillan.

Leblebici, H.; Marlow, E.K. & Rowland, K.M.
Lin, Y.C.
Lincoln, J. R. & Zetiz, G.
Lincoln, Y.S.
1983
1988
1980
1985
Maciver, R.M. & Page, C. H. 1962
Marsh, R.M. & Manneri, H. 1981
McGee, R. 1975
Me Millan, C.J.; Hickson, 1973 D.J, H inings, C. R. & Schneck, R.E.
Maxwell, A. E. 1977
M edcoff, J. W. 1985
Mertz, Barbara, G. 1982
Miles, R. & Snow, C. 1978
M i11er, Danny. 1987b
Miller, Danny. 1987a
Miller, D. & Friesen 1984
Mills, Peter K. 1980
Research Note: a longitudinal study of the stabi-lity of interpretative schemes, organizational structure and their contextual correlations. Organizational Studies. vol 4, 165-184.
Two essays in lnd ustrial Organization Theory. Ann Arbour: University Microfilms International.
Organizational Properties from Aggregated Data: separating individual and structural effects. American Sociological Review. vol 45, no 3, 39I-408.
Organizational Theory and lnquiry: the paradigm revolution. Beverley Hills: Sage Publication.
Society: an introductory analysis. MacMillan
London:
Technology & Size as Determinants of Organization Structure of Japanese Factories. Administrative Science Quarterly vol 26, 33-57.
Points of Departure: basic concepts in sociology. Hinsdale: Holt, Rinehart and Winston.
The Structure of Work Organizations across Societ ies. Academy of Management Journal. vol 16, 555-569.
Multivariate Analysis in Behavioural Research. London: Chapman & Hall.
The Power Motive in Organization Structure: a micro-macro connection. Canadian Journal of Administrative Science. vo12, no 1, 95-113.
Memphis, Egypt. In: Encyclopaedia Britannica; Chicago: University of Chicago
Organization Strategy. Structure and Process. New York: McGraw-Hill.
The Genesis of Configuration. Academy of Management Review. voll2, no. 4, 686-701.
The Structural and Environmental Correlates of Business Strategy. Strategic Management Journal vol 8, no. 1, 55-76.
Organizations: a quantum view. Englewood Cliffs: Prentice-Hall.
A comparative Study in Organizational Design among Post Industrial or Service Organizations. Ann Arbour: University Microfilms lnternational.

Mintzberg, H.
Mintzberg, H.
Monitor Company
Mouzelis, N. P.
Negandhi, R
Negandhi, R
Norusis, M.J.
Norusis, M.J.
Norusis, M.J.
1973 Strategy Making in Three Models. California Management Review. vol 16, no. 3 44-58.
1979 The Structuring of Organizations. Englewood Cliffs: Prentice-Hall.
1995 Global Advantage of South Africa Project. prepared for the National Economic Forum.
Report
1982 Bureaucracy. In: Encyclopaedia Britannica; Chicago: University of Chicago.
1973 Orga ni za ti on Theory and In terorgani za tiona I Analysis. Kent, Ohio: Kent State University.
1990 Comparative Management and Organization Theory: a marriage needed. In: Global Organization Theory Perspectives; edited by J Sheth, G Eshghi, Cincinnati: South Western Publishing.
1992a SPSS/PC+ Base System Users Guide Version 5.0. Chicago: SPSS Inc.
1992b SPSS I PC+ Professional Statistics Version 5.0. Chicago: SPSS Inc.
1992c SPSS /PC+ Advanced Statistics Version 5.0. Chicago: SPSS Inc.
Parsons, T. 1967 Sociological Theory and Modern Society. New York: Free Press.
Payne, R.L. & Mansfield, 1973 Relationship of Perceptions of Organizational Climate R. to Structure, Context and Hierarchical Position.
Payne, R.L. & Pheysey, D.C.
Payne, R.L. & Pheysey, D.C.
Pennings, J.M.
Pheysey, D.C.; Payne, R. L. & Pugh, D.S.
Podsakoff, P.M. & Dalton, D.R.
Administrative Science Quarterly. vol 18,515-526.
1971 Organization Structure and Sociometric Nominations amongst Line Managers in Three Contrasted Organizations. European Journal of Social Psychology. vol1, 261-284.
1971 Stern's Organization Climate Index: a reconceptualization and application to business organizations. Or~:anization Behaviour and human Performance. vol 6, 77-98.
1987 Structural Contingency Theory: a multivariate test. Organization Studies. vol 8, no 3, 223-240.
197.1 Influence of Structure at Organization and Group Levels. Administrative Science Quarterly. vol 16, 61-73.
1987 Research Methodology in Organizational Studies. Journal of Management voll3, no 2, 419-441.

Poole, M.S. and van de V en, J.
Porter, M. E.
Porter, M. E.
Price, James L.
Pucik, V.; Beechler, S & lto,K
Pugh, D.S.
Pugh, D.S.
Pugh, D.S. & Hickson, D.J.
Pugh, D.S. & Hinings, C. R. ·
Pugh, D.S.; Hickson, D.J.; Hinings, C. R.; McDonald, J ,; Turner, C. & Lupton, G.
Pugh, D.S.; Hickson, D.J.; Hinings, C. R. & Turner, C.
Pugh, D.S.; Hickson, D.J. & H inings, C. R. ·
Pugh, D.S. & Payne, R.L.
Robbins, Stephen P.
Sandelands, L. and Drazin, R.
Sathe, V.
Shenoy, S.
1989 Using Paradox. to Build Management and Organization Theory. Academy of Management Review. vol 14, no. 4, 562-578.
1980 Co mp e tit i v e Strategy: tee h n iq u es for an a lysing industries and competitors. New York: Free Press.
1985 Competitive Advantage: creating and sustaining superior performance. New York: Free Press.
1972 Handbook of Organizational Measurement. Lexington, Massachusetts: DC Heath and Co.
1986 American Organization Theory in Japan: Western concepts, Japanese spirit. Sociology and Social Research. vol 71, no. 1, 20-26.
1984 0 r g an i z at i on Theory : S e I e c ted read i n g s. Harmondsworth: Penguin Books.
1988 The Aston Research Programme. ln: Doing Research in Organizations; edited by A Bryman, London: Routledge.
1976 Organization Structure in its Context: the Aston programme l. Westmead: Saxon House.
1976 Organization Structure: Extensions and Replications: the Aston programme 2. Westmead: Saxon House.
1963 A Conceptual Scheme for Organizational Analysis. Administrative Science Quarterly. vol 8, 289-315.
1968 Dimensions of Organization Structure. Administrative Science Quarterly. vol 13, 65-105.
1969b An Empirical Taxonomy of Structures of Work Organizations. Administrative Science Quarterly. vol 14, 115-126.
1977 Organization Behaviour in its Context: the Aston programme 3. Westmead: Saxon House.
1987 Organization Theory: structure. design and apvlications. Englewood Cliffs: Prentice-Hall.
1989 On the Language of Organization Theory. Organization Studies. vol 10, no. 4 457-478.
1978 Institutional versus Questionnaire Measures of Organizational Structure. Academy of Management Journal vol21, no 2, 227-238.
1981 Organization Structure and Context: a replication of the Aston study in India. In; Organization and Nation: the Aston programme 4; edited by D.J. Hickson and C.J. McMillan, Westmead: Gower.

Sheth, J. & Eshghi, G. 1990 Global Organization Theory Perspectives. Cincinnati: South Western Publishing Company.
Singh, J. V. 1985 Technology, Size and Organization Structure: a re-examination of the Okayama study data. Academy of Management Journal. vol29, 800-812.
Stewart, B Hetherington, G. 1981 Survey Item Bank. London: MCB University Press. & Smith, M.
Sudman, S. & Bradburn, N.M. 1982 Asking Questions: a practical guide to question-naire design. San Francisco: Jossey-Bass.
Sutton, R.I. 1989 Reaction of Nonparticipants as Additional Rather than Missing Data: Opportunities for Organizational Research. Human Relations. vol42, 423-439
aylor, F. W. 1984 Scientific Management In: Organization Theory: selected readings; edited by D.S. Pugh, Harmondsworth: Penguin Books, 1884, 157-176.
Thomas, K.W. & Tymon, W.G. 1982 Necessary Properties of Relevant Research: lessons from recent criticisms of the organizational sciences. Academy of Management Review. vol 7, no 3, 345-352.
Thompson, J.D. & Vroom, V. H. 1971 Organizational Research and Design. Pittsburgh:
Van Niekerk, Chris.
Van Zyl, S.J.J., Martins, J. H and Steenkamp, H.A.
Weber, M.
Walbank, F. W.
Wallace, Sally A.
Webb, E & Weick, K.E.
Wholey, D. R. & Brittain, J.
Williamson, Oliver E.
University of Pittsburgh Press.
1979 0 r g a n i z a t i o n T h e o r y : h is t or i c a 1- t h eo ret i c a I development and the implications of technology. Cape Town: University of Cape Town.
1981 A Guide to the Standard Industrial Classification of All Economic Activity. Pretoria: U nisa.
1984 Legitimate Authority and Bureaucracy. In: Organization Theory: selected readings; edited by D.S. Pugh, Harmondsworth: Penguin Books, 1884, 13-27.
1982 Alexander 3 the Great. In: Encyclopaedia Britannica; Chicago: University of Chicago.
1989 The Culture of an Organization. a case study. Ann Arbor: University Microfilms International.
1979 Unobtrusive Measures in Organizational Theory: a Reminder. Administrative Science Quarterly. vol
.24, 650-659.
1989 Characterizing Environmental Variation. Academy of Management Journal. vol32, no. 4, 867-882
1990 Organization Theory from Chester Barnard to the Present and Beyond. New York: Oxford University Press.

Wilson, C. H.; Landes, D.S. & Kemp, T.
Woodward, J.
Yasai-Ardekani, M.
Zeffane, Rachid M.
1982 Economic History since 1500. In: Encyclopaedia Britannica; Chicago: University of Chicago.
1958 Management and Technology. Her Majesty's Stationery Office. 4-21.
1989 Effects of Environmental Scarcity and Munificence on the Relationship of Context to Organizational Structure. Academy of Management Journal. vol32,no. 1, 131-156.
1989 Centralization or Formalization: indifference curves for strategic control. Organization Studies. vol 10, no. 3. 327-352.

j
I I t
I
Annexure 1.
ll
10.2.2 Mumb2r of manufactur~rs by SIC code (Major Division 3)
Type of manufacturer
:='Jod .=.::cdr."' c . -. 3:;vera9::s ir.dustr~es Tobacco products
Textiles Clothing Leather and leather substitutes ?oot•11ear
... . .. Wood and cork products furniture and fixtures ( 'lload en) ..
Paper and paper products Printing and pubiishing
InC:.;s::-~:1: c;;:mic~!s 0 :he: chemica is Petroleum ref1neri~s P~troleum and co a 1 products Rubber products Piastic products
Pottery and .
china Glass and glass products Other non-metallic mineral products
rron and steel basic industries Non-ferrous metal basic industries
Fabricated metal products Machinery -· . . .. ma(;hinery :.t:~:r-~C::I
:~o t.: r veni:i~s and par:s Iran sport ~quipment Scientific equipment
Othe:- manufac:uring
Nan-manufact~r~ng he:.d offices and
.
holding c~moa.;des
s rc cede I Nurr.Oer
2:1 3l2 .,. ~ ~ .!.J ..,,.1 j! .
3l
.., ~ 1 ~.:.
322 323 324 22
322 33
34 =·
352 353 ~C:l
355
35
361 262 369 36
371 372
331 j82 j :J., ...... i;;: '! .,.1..1'"'!"
385 386 38 =
390 39
300 30
i
~ -
l
I
~ -
:..
2 .!.
~
; --
. <.!. -
422 . ~ ~ l ._ ..... __ _,
2(''' ~""'!'
20 .,..., ..... ""' :.c~
623 913 143 125 3~0
6CO 6d7 211/
238 ~ ,...'? o:_ :JSO
-. ~75
21 49
107 380 278
62 48
780 890
198 84
~
~82
055 135 ~- 1 01-=~,::) WW*
C)'"' .. :;,
192 -~-I/ I '-·
692 592
-::.: . . --. .
,.., ~, :'':'-
I
I
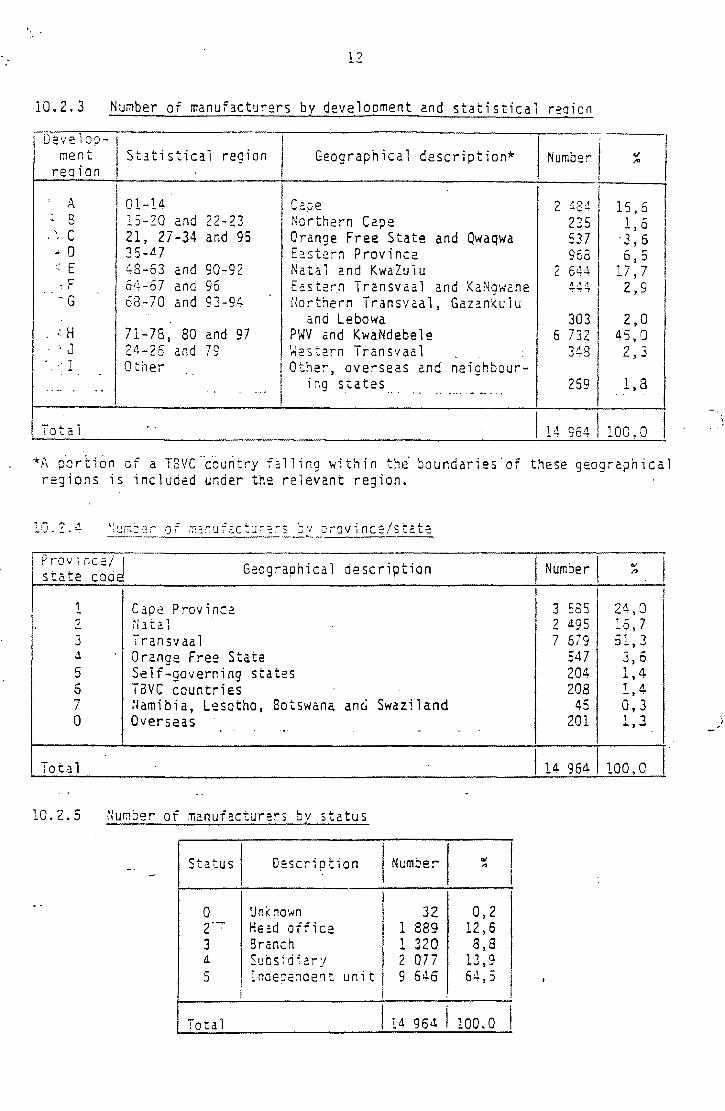
12
10.2.3 Number of manufact~rers bv develooment and statistical reaion
Develop-Number/~ ment Statistical region Geographica1 description*
reo ion
A 1 01-14 Cepe 2 4. Q .~ 15,5 .U""t
' B lS-20 c.nd 22-23 Northern Cape 235 l) 6 . ' c 121, 27-34 and 95 Orange Free State and Qwaqwa 537 . 3. 6 .. .. 0 35-47 Eastern Province Q,...~ 6,5 ~co
~ E I 48-63 c.nd 90-92 Nata 1 and KwaZu1u 2 64ci 1 17,7 )F 64-67 and 96 Ea.s ter.n Transvaa 1 and KaNg·n'ane /l,1 ,1 2,9 ""!"~"'1'
'' -G 63-70 and 93-94 Northern Transvaa1, Gazanku1u and Lebowa 303 2,0
~ H 71-78, 80 and 97 PWV and KwaNdebele 6 732 45,0 ' ) J 24-25 and 79 'n'estern Transvaa1 348 2,3
·r Other Other, .. overseas and neighbour-.. -· .. i ng states 259 1,8 '. . .. - .. . ... . ...... ' - .....
To ta 1 . ' I 14 cr~ I 100,0 I ~a..,.
*A portion of a TSVC·~~uritry falling within thi boundaries"of these geographical regions is included under the relevant region.
l0.2.4 \1 ,, ince/stc.te
I Pr·ovince./ J state cod G -eograpn1ca aescnpt1on umoer I'>
I I I 1 Cape P rov i nee I 3 5351 21,0 ? ~~at a 1 2 495 16,7 3 iransv aa 1 7 679 -· ? ::>l, ... d Orange Free State 547 3,6 5 Self-governing states 204 1) 4 6 TSVC countries 208 , 11. -, . 7 Namibia, Lesotho, Botswana an c.; Swaziland 45 0,3 0 Overseas 201 1,3
·•· .
Tota 1 114 964,100' 0 I 10.2.5 Number of manufacture~s bv status
Status Oescri p tion Numbe; ol I ... I
0 Unk:1own 32 0,2 2 ·-:- He:.d office 1 889 12,6 3 Branch 1 320 8,8 a. Subs~diary 2 077 11 a ...... , ... 5 I nde~e:1den t unit 9 646 64,5
I
I
Tota 1 I l4 96J. I 100.0 I
)

13
10.2.5 Number of manufacturers by em.:Jloyment arauo
Size code I E:7iployees I Nr.;;nber
00 Head offices 1 053 01 1 - 3 l QC:1 .,_,
02 t1 - 6 1 . ,. -100
03 7 - 10 1 392 0~ 11 - 15 l 213 05 16 - 20 977 06 21 - 30 1 315 07 31 - C.Q 01·1
-V-
08 ill - 50 6~' Q.j
09 ~~ _,_ - EO 520 10 61 - 80 776 11 81 - 100 605 12 101 150 "823 i - I ... ,., ! ·ts-1--------zco 540 -.J "- \1 14 - 201 3GO 606 -15 301 - 400 341 1 --0 4Cl - 500 230 17 501 - 600 l4G 18 l 601 - 800 l9J. 19 801 - 1 000 87 20 l 001 - l 500 123 21 1 SOl - 3 000 77 22 3 001 - 5 000 ~' 'j 23 5 OOl+ l~
' ~' l I ~ - .......... , ··:::: .....
I Tota 1 ~~~--------------------~~+--'
10.2.7 Number of manufacturers b1 ~lec:;icity cr~uo
Size code j Eiectricity (kW.h} I Number!
- ' ... ' -' -'
00 Head offices 1 312 01 1 - 1 000 1 857 02 1 001 - 2 000 1 575 03 2 001 - 4 000 l T? ,_ 04 4 001 - 7 000 1 576 OS 7 001 - 11 000 1 119 06 11 001 - 15 000 818 07 1 ,..
.0 001 - 23 000 751 03 23 001 - 32 000 675 09 32 001 - 4<1 000 570 10 44 001 - 50 000 d,"ll . .; -11 €0 001 - 80 000 343 12 eo 001 - 110 ceo "l "l, ----. ., 110 001 ' - 151) GOO 257 L.) - .
14 - 1:0 001 200 000 "?0 - '--· 15 200 001 - 270 000 188 16 270 001 - 360 000 , ~.
.:..0!.
l.i 360 001 - 460 000 109 18 4.60 001 - . sao 000 90 19 580 001 - . 730 000 81 2'] 730 001 . 930 000 :z ~1 ,_ 930 001 - 1 200 000 :a
I "'7 l 200 001 - 500 000 31 '-- .. ,~ ! 500 001+ 't14. c.l
~381 24 Unkno·,o~n
I ! 7' ·J ':::. ! .. ... ... t ~
.!.- ~':)'- :
I C:.:::-:ul=7:ive I i'(L!T.be r I "' -~
1 058 7,1 2 lll 1 <! ' 1 3 277 .., 1 0 '-,-4 669 j 1 ?
.J,..1_
5 947 39,7 6 92~ t!6,3 8 ~"Q (...:;># 55, l 9 1::0 6l,l 9 823
,., ,. O.),O
lO 343 69,1 ll 119 74,3 ll 72~ 78,3 . ~ ::;::7 83,9 1~ ~"-1 ~ _j 092 87,5 1 ? • .J 6j3 91,5 14 o~a JJ 93,8 14 269 95,4 1' _.., L.IJ9 95,3 - ' E03 97,6 ·,!_~
,. ,, .... ~r"\ 98,2 .:.""':' O>J
1 ·' _.,. 813 99,0 1 .1 _.,. 895 99,5 l.l 9~3 CC: -•• ' I ll 922 ! ·:~' 3 ~ c;;' -.,
,- .- J
;: :.;rr;u 1 c c i v e .'1\Ji-;jCer I "' ...
-~· ··-·- . -- --·· .. - ..... 1 312 8,3 3 169 21,2 4 744 31,7 6 515 43,5 8 092 54,1 9 211 - 61,6
lO 029 67,0 10 780 72,0 . 11 4.:5 76,6 1' 025 80,:! 12 <157 83,2 12 8CS
I 85,5
13 1,- 87,3 .. o l3 :!Q3 8?,5 13 632 Q 1 ' --, l
13 320 0? :1 ---1.
l3 98! 93,4. 14 090 0<1 ?
"" ' '-L4 180 94,8 14 251 QC: , .. ... , .... 1' .;.~ 313 or -
~:,o
14 ., .... QC: a ..:: !. "' ... , .... L.i 332 or .
.. 0' .l
14 525 97,1 1 A .... 964 100,0
I
!
I L
I I
I
I !

RESPONSE SUMMARY
Total number of Questionnaires posted
Less:
- 2288
Duplications, returns and errors, say - 200
TOTAL POPULATION 2088
Total number of questionnaires returned - 528
Total number of usable questionnaires ~ 458
Annexure 2
(25,3%)
(22,0%)

NUMBER OF RESPONDENTS BY JOB TITlE
Group General Manager Divisional General Manager General Manager Group HR Manager Senior HR Manager Other
X 54 X 71 X 141 X 18 X 35 X 139
Breakdown of Respondents in Category of 'Other'.
Accountant X 7 HR Officer X 1 Admin Director X 1 lndust. Eng Manager X 1 Admin Manager X 3 Maintenance Manager X 1 Admin & Audit Manager x 1 Managing Director X 23 Business Manager X 1 Manufacturing Manager x 1 Chief Accountant X 2 Man. Mkt Intelligence X 1 Chief Executive X 4 Marketing Director X 2 Commercial Manager X 1 Mat & Syst Manager X 1 Controller X 1 Mfg Div Director X 1 Cost Accountant X 1 Mktng Manager X 1 Department Manager X 1 Not Stated X 8 Director X 7 Operations Manager X 5 Div Financial Dir X 1 Owner X 1 Div Ops Manager X 1 Owner Manager/MD X 2 Executive Director X 2 PA to GM/MD X 2 Executive Officer X 1 Production Director X 3 Factory manager X 4 Production Manager X 4 Finance/HR Man X 1 Productivity Services Max 1 Finance/Pers Man X 1 QA Manager X 1 Financial Director X 14 Quality Manager X 1 Financial Manager X 9 Quality Syst Manager X 1 Grp Fin Man X 1 Sales Director X 1 Grp Financial Director X 1 Sales & Prod Manager X 1 Grp Ops Man X 1 Tech Director X 1 Harvesting Man. X 1 Technical Manager X 2 Head Mkt Serv X 1 Works Manager X 2

Organization Structure and Context :
a South African Study.
Annexure 3

Organization Structure and Context :
a South African Study.
This questionnaire has been designed for computer analysis and, for the most part, all that you need to do is circle the number that best describes your response to the statement or question. In a few cases, where specific information is called for, it may be that you are not able to provide precise data. In that case, please provide your best guess or estimation, preferably after conferring with colleagues.
The anonymity of all respondents will be strictly observed and guaranteed, so please do not write your name on the questionnaire. A good response rate is essential for a survey of this nature. The questionnaires have been numbered purely for administrative purposes, and to make it possible to send reminders to companies if necessary.
If you would like to add any additional comments, please use the space provided at the end of the questionnaire. If any aspect of the questionnaire is not clear, or if you have queries, please contact the researcher at the contact telephone number provided on the last page.
When you have finished please return the completed questionnaire in the enclosed postage-paid envelope.

1. SIZE AND DEPENDENCE
Please circle your response where applicable. Where you cannot provide precise information, please give your best guess orr estimate :
1. 1. Ori in
Was your company founded by
A person or persons, i.e. not an existing organization An existing organisation
1.2. Status of organisation unit
Is your company a
Principal unit Subsidiary (with legal identity) Main branch (with headquarters at the same location) Branch
1.3. Public accountability of owning group
Is the unit or group which ultimately owns your company
Unquoted Quoted on the stock exchange Foreign Multinational State or para- statal
1.4. Size of organization, and size relative to owning group
~ I l : r-------' I 2 ! . __ .
(Circle) j-------:----ll I i ~
~ i 4 I
(Circ;l~
Ill ,--J-: - I
!Ji ~ ! __ .. _1
Approximately how many employees are there in your company? Please write the number in the box below :
Total no. of employees
How big is your company (in terms of headcount) relative to the unit or group that ultimately owns your company?
Over 90% of owning group 30 - 89% of owning group 5 - 29% of owning group Under 5% of owning group
fa'tl r---l--i L..i..J

2. 1. Workflow Integration . Which of the following categories best describes :
(a) the BULK of the equipment used by the organization in its workflow, and (b) the most AUTOMATIC piece of equipment used by the organization in its workflow.
Please circle the highest number in column (a). Do the same in column (b):
(a) (b) the bulk of equipment (circle one only)
the most automatic·
(circle one only)
Handtools and manual machines · (e.g. pliers, hammer, file, screwdriver, etc.) !
'Powered machines and tools : Muscles are replaced for the basic machine function, but machine action and control · are completely dependent on the operator. Uses mechanical power but man positions :work and machine for desired action. (e.g. electric tools, soldering iron, etc.) I
:Single-cycle automatic and self-feeding machines ; Completes an action when initiated by an operator. Operator must set up, load, initiate ; actions, adjust, and unload. (e.g. production machines without automatic control systems) I
; Automatic which repeats cycles ; All energy is mechanized and carries out routine instructions without aid by man. Starts :cycle and repeats action automatically. Self-feeding : loads, goes through sequence of operations and unloads to next station or machine. Not self-correcting but obeys internal
: program such as cams, tapes or cards. (e.g production lines, self-feeding press lines etc.) I
' Self- measuring and adjusting by feedback I Measures and compares results to desired state and adjusts to minimize error. Information ~ activities are increasingly automated and judgement is the human attribute mechanized. : (e.g. feedback from product, automatic sizing, positional control of machine table or tools)
Computer controlled :automatic cognition ' Evaluation is the human attribute mechanized. Computer monitors multiple factors on which machine or process performance is predicated; evaluates and reconciles by means of computer operations to determine proper control actions.
2.2 . Process Technology
0
2 I
3
4
5
Please indicate the extent to which each of the five technologies listed below are used in your organization :
0 '
2
3
4
5
I EXTENT to WHICH THEY ARE USED TECHNOLOGIES _icircle one on ev4!_1Y lin~ i
I Not IVery Slight~ Moderj Consi~ Exten~ Exclus;
I I ately : erably_ I sively 1 ively i used slightl
1. Custom technology : production. or fabrication of a single or few units to I I
I i I
I ! customer specifications. 1 2 I 3 4 I 5 6 i 7
2. Small batch (job shop) technology : production of small batches I I
I I I I i I I
1 2 3 i 4 5 6 I
7
3. Large batch technology: production·of large batches such as components i i
I
i I i for subseQuent assembly, or of finished products. 1 2 3 4 5 I 6 7 :
I ' 4. Masa production technology : as on an assembly line
I
I
! I ! I
I 1 2 3 4 I 5 6 7 I
1 5. Continuous process technology : production of liquids, gasses, l 1 i I i I
i or solid shapes. 1 2 3 4 5 I
6 ! 7 '

3. STRUCTURAL CONTROL AND ENVIRONMENT Page 3
3. 1. Control, Change & Uncertainty
Please indicate your response by circling the number that best describes the extent to which the statement applies to your company :
I EntireiJ Mainly i Slightl~ 50% I
[ Slightl~ Mainly i Entire!~ I ' I I ' I ' I untrue untrue I untrue i true : true ' true ; true
I 1. The structure of the organization tends to remain constant, despite !
i changes to its strateg~. 2 3 4 5 6 7 '2. The organization's structure is mainly a result of those in power
selecting a structure that will maximize and enhance their control. 2 I 3 4 I 5 6 7 i 3. Managers often try to "sell" self-serving ideas and decisions by I eackaging them in terms of organizational effectiveness. 2 3 4 5 6 7 :4. The strategic choices exercised by the company's senior manage-
ment are never illogical. 2 3 4 5 6 7
i 5. Those who hold real power in the organization are not always the
' same as those who hold formal authori~ in toe management eositioms. 2 3 4 5 6 7
:6. Fluctuations in size don't really affect the way that this organization is structured. 2 3 4 5 6 I 7
; 7. Decisions taken by senior management are never inconsistent with I the overall goals of the organization. 2 3 4 5 6 7 i
i 8. I
2 ! 3 4 5 6 7 ; 9. ! this organization remains constant over time. 2 3 4 5 6 7 I
: 10. The jobs or positions occupied in the company change quite
considerably over a five-year period. 2 3 4 5 6 7 I
; 11. Changes in the social. economic, or political conditions outside I the company affect the organization and i1s work. 2 3 4 5 6 7 1 12. People in the organization find that ideas in the community or their I professions influence the methods and techniques that they use. 2 3 4 5 6 7 I
1 13. People in the organization are sometimes uncertain of the requirements
or methods to be used in their work. 2 3 4 5 6 ' 7
! 14. New techniques or methods are often applied to the jobs
that are done in the organization. 2 3 i 4 5 6 7
I 15. The people in the organization often encounter new types
I of eroblems in their work. 1 2 3 4 5 6 7
3.2. Predictability
Please rate the following variables according to the situation as it applies in your organization. Again, if you are not certain
please give your best guess.
:Highly Somewhat I Difficult to 1 Somewhat Highly 1
i predictable predictable say I unpredictablE unpredictabl~ I
I I I I
Operations tachnology 1 2 3 4 5 ~
12. I I I I Competitors' actions I 1 2 3 4 I 5 I
I I
I i I I
! 3. Market demand ! 1 2 3 4 I 5
r-- I
I I I
I I
! ; 4. Product attributes/design I 1 2 3 4 5' I I I I
I I ! '5. Raw material availability I 1 2 3 4 5
I I
I !
I 4
! 5 [6. Government regulations I 1 2 3
!
Labour union actions 2 3 4 5
,a. Raw material price 2 3 4 5

3. STRUCTURAL CONTROL AND ENVIRONMENT (Cont.)
3.3. Operating Environment
Over the past ten years (1985 to 1994), which of the following statements best describes the ~ situation in your organization's operating environment. Please confine your evaluation to the~ operating environment and do not include the recent political changes in your assessment.
1.
2.
Your organization's familiarity with events in its operating environment nothing really changed much in the environment changes in the environment were repetitions of past experience
changes were understood when we thought of historical development changes were different. but we explained them when we thought of past experience changes were new and not experienced before.
The response of your organization to changes in its operating environment
things changed in the environment much slower than our response to them things changed in the environment somewhat slower than our response to them the speed of change in the environment was comparable with our response to it things changed in the environment somewhat faster than our response to them things changed in the environment much faster than our response to them
3. The visibility of the future in the organization's operating environment . the environment remained substantially unchanged
4.
the environment evolved in a historically logical manner
the environment was predictable through analysis of threats and opportunities the environment was difficult to predict
the environment was characterized by unpredictable surprises The scope of your organization's business operations
the scope of business operations was local the scope of business operations was national
the scope of business operations was local plus adjacent countries the scope of business operations included most of Africa the scope of business operations was global
4. STRUCTURING OF ACTIVITIES
Please circle your response where applicable. Where you cannot provide precise information, please give your best guess or estimate
4. 1. Functional Specialization
This section is designed to establish the number of functions in your organization. If there is at least one person who performs the function full time, please circle the ''yes" option. Status of the incumbent is immaterial - there need be only one person engaged full time on the function for you to answer yes.
1 If no single person is engaged full time on the function, circle the "no" option.
I I i 1. Develop, legitimize and symbolize the organization's purpose (e.g. public relations, advertising, etc.) I 2,
l3. ! 4.
5. 6. 7.
I 8. I J9.
10.
11.
12. 13.
I 14.
[15.
1
16.
17.
Dispose, distribute or service the products of your organization (e.g. sales, service, customer complaints, etc.)
Carry the outputs and resources from place to place (e.g. transport) Acquire and allocate human resources (e.g. employment) Develop and transform human resources (e.g. education. training) Maintain human resources & promote identification with the orgization (e.g. welfare, safety, sport, social, etc.) Obtain and control materials and equipment (e.g. buying, material control, stores, stock control) Maintain and erect buildings and equipment (e.g. maintenance, works engineer) Record and control financial resources (e.g. accounts, costing, wages) Control the workflow (e.g. planning, progress chasing)
Control the quality of materials, equipment and outputs (e.g. inspection and Testing) Assess and devise ways of producing the output (e.g. work study, 0 and M study, industrial engineering)
Devise new outputs, euipment and processes (e.g. research and development) Develop and operate administrative procedures (e.g. registry. filing, statistics, etc.) Deal with legal and insurance requirements (e.g. legal, registrar, company secretary, licencing, etc.) Acquire information on the operational field (e.g. market research)
Process information (e.g. electronic data processing)
Page 4
(Circle) 1
2 3 4
5
1
2 3
4
5
1 2
3 4
5
1
2 3
4
5
(Circle) 1 I YES I NO I
2. YES I NO I 3. YES /NO I 4. YES /NO I 5. YES /NO I 6. YES/ NO I 7. YES I NO i 8. YES I NO I.
9. YES/ NO
10. YES/ NO j I
11. 1 YES I NO I 1 2. ! YES I NO 1
I I 13. i YES I NO I 14. : YES I NO I 15. i YES/ NO
16. i YES I NO
17.1 YES/ NO

4. STRUCTURING OF ACTIVITIES (Continued.)
4.2. Formalization
The degree of formalization in an organization is indicated by the number of specific, role-defining documents from the following list that exist in the organization and, in some cases, by the extent of their application and distribution.
Page 5
~~~--~~~~~----~------------------------------------------------------------~Circle) 1 . Information booklets are given to : none o
(circle one) few employees many employees all employees
2. Number of information booklets (circle one)
. 3. Organization charts are given to : (circle one)
none one two three four or more
none chief executive only chief executive plus one other executive
2 I
3
0
1
2
3 4
0 1
2
chief executive + all/most department heads 3
' 4. Written job descriptions are available for : (circle as applicable)
i 5. Written operating instructions are issued to all direct workers
! 6. A manual of procedures is available
~ 7. Written policies are available
8. There is a written production schedule or programme
: 9. There are written research programmes or reports
direct workers line supervisors staff other than line supervisors the chief executive
4.3. Standardization/Routinization
1.
3.
. 4. I '
! '5.
The following statements concern the amount of routine work involved in your organization. Even though it may be hard to decide, be sure not to miss any questions :
How would you describe the amount of routine in your job? highly routine somewhat routine somewhat non- routine highly non- routine
People in this organization do the same job in the same way every day
One thing people like in this organization is the variety of work
Most jobs have something new happening every day
There is something different to do every day
definitely true more true than false more false than true definitely false
definitely true more true than false more false than true definitely false
definitely true more true than false more false than true definitely false
definitely true more true than false more false than true definitely false
YES I NO
YES I NO
YES I NO
YES I NO
YES I NO
YES I NO
YES I NO
YES I NO
YES I NO
(Circle) 1
2
3 4
1
2 3 4
1
2 3 4
1
2 3 4
1
2 3 4

4. STRUCTURING OF ACTIVITIES:(Continued.)
Configuration refers to the actual physical shape of an organization in terms of its height and horizontal span. It is unlikely that you would have precise information on all of the variables, so please provide approximations based on your best guess :
1. How many subordinates, irrespective of their status. report directly. with no intervening levels, to the chief executive?
2. At the lowest level of the organization. approximately how many
subordinates (direct workers) are there per fir.st line supervisor?
3. How many jobs or layers are there in the longest line between direct workers
and chief executive (inclusive of both), excluding secretaries & assistants?
4. Approximately what percentage of the jobs in your organization are occupied by managers or supervisors?
5. Approximately what percentage of the jobs in your organization are occupied by employees who have no direct or supervisory responsibility for work on outputs?
6. What percentage of employees are engaged purely in clerical duties?
5. CENTRALIZATION
5. 1. Concentration of Authority
Concentration of authority describes the level at which formal authority rests. Authority means action can be taken without waiting for confirmation, even if the decision is later ratified at a higher level. "Inside the organization" means at the level of the chief executive or below. Above the chief executive means at controlling board or parent company level, or at head office departmental level, where applicable.
IS AUTHORITY INSIDE AUTHORITY TO DECIDE THE ORGANIZATION?
(circle)
1. Managerial Headcount/establishment 1. I YES NO
2. Appointment of :"'lanagerial staff from outside the organization 2.1 YES NOI
3. Promotion of managerial staff 3.J YES NO/
4. Salaries of managerial staff 4.; YES NOi 5. To dismiss a manager 5., YES No:
I I 6. To determine a new product or service 6.1 YES NO[
7. To determine marketing territories covered 7.1 YES NO
8. The extent and type of market to be aimed for 8., YES NO
9. The price of output 9.1 YES NO
10. What type, or what brand, new equipment is to be purchased 10. YES NO
11. What shall be costed and included in the costing system 11. i YES NO
12. What shall be inspected and included in the inspection system 12. i YES NO I
13. What operations shall be work studied 13.1YES NO
14. What suppliers of materials are to be used 14.!YES NO
15. What procedures are to be followed when buying materials 15.1 YES NO
16. Training methods to be used 16. YES NO I
17. _ What, and how many, welfare facilities are to be provided 17.1 YES NO
18. To spend unbudgeted or unallocated money on capital items 18. YES NO
19. To spend unbudgeted or unallocated money on revenue items 19.
1
YES NO
20. To alter responsibilities I areas of work of specialist departments 20. YES NO
21. To alter responsibilities I areas of work of line departments 21.1
YES NO
22. To create a new department 22. ! YES NO
23. To create a new job 23. I YES I NO,
PageS

~-'- CENTRA_l-IZA TION (Cont.)
5.2. Policy Decision Making
Who makes major policy decisions?
a broad representation of executives and shareholders a top level executive committee
the chief executive or the owner acting on their own
Who makes decisions concerning sales policy?
. 3. Who decides upon the product mix?
an executive committee with representation of all functional areas
the chief executive with the help of the sales manager the chief executive or owner only
Page 7
(circle) 1
2 3
1
2 3
an executive committee with representation of all functional areas 1
the chief executive with the help of the production or marketing manager 2 the chief executive or owner only
Who decides upon production standards? an executive committee with representation of all functional areas
The chief executive or the production manager. or both together
the chief executive or owner only :5. Who decides upon manpower policies?
an executive committee with representation of all functional areas
the chief executive with human resources manager
the chief executive or owner only
!e. Who decides upon the selection of Executive Personnel? an executive committee with representation of all functional arees the chief executive with human resources manager
§.3. Decision Making & Discretion I
i 1. How much direct involvement does top management have in gathering the information they will use in making decisions? '
3.
none little some a great deal a very great deal
To what degree does top management participate in the interpretation of the information input? 0- 20%
21 - 40% 41 - 60% 61 - 80% 81 - 100%
To what degree does top management directly control execution of the decision? 0 20%
21 - 40% 41 - 60% 61 - 80% 81 - 100%
4. How much discretion does the typical first-line supervisor have over establishing his or her unit's budget?
5. How much discretion does the typical first-line supervisor have over determining how his unit's performance will be evaluated?
6. How much discretion does the typical first-line supervisor have over hiring and firing personnel?
very great great some little none
very great great some little none
very great great
(circle) 1 2 3 4 5
1 2 3 4 5
1 2 3 4 5
1 2 3 4 5
j
2 3 4 5
1 2
3
2
3
1
2 3
1
2

5. CENTRALIZATION (Cont.)
5.3. Decision Making & Discretion (cont.)
7. How much discretion does the typical first-line supervisor have over personnel rewards (i.e. salary increases, promotions)
8. How much discretion does the typical first-line supervisor have over purchasing of equipment and supplies?
: 9. How much discretion does the typical first-line supervisor have over establishing a new project or programme?
I
i 1 0. How much discretion does the typical first-line supervisor have over ! i how work exceptions are to be handled?
6. ORGANICITY
6. 1. Operating Management Philosophy
Page 8
very great 1 great 2 some 3 little 4 none 5
very great 1 great 2 some 3 little 4 none 5
very great 1 great 2 some 3 little 4 none 5
very great 1 great 2 some 3 little 4 none 5
Organicity refers to the degree to which your company is characterized by informal control mechanisms, flexibility, and open communication channels.
In general, the operating management philosophy in my firm favours ...
, Highly structured channels of communication and a
highly restricted access to important financial and
: operating information
: A strong insistance on a uniform managerial style
. throughout the organization I
i A strong emphasis on giving the most say in decision making to formal line managers
: A strong emphasis on holding fast t~ tried and true
· management principles despite any changes in business conditions
A strong emphasis on always getting personnel to
, follow the formally laid down procedures I
I ! Tight formal control of most operations by means
i of sophisticated control and information systems
I [ A strong emphasis on getting line and staff personnel
I to adhere closely to formal job descriptions
(circle)
2 3 4 5
2 3 4 5
2 3 4 5
2 3 4 5
2 3 4 5
2 3 4 5
2 3 4 5
6 7
6 7
6 7
6 7
6 7
6 7
6 7
Open channels of communication with important financial and operating information flowing quite
freely throughout the organization
Managers' operating styles allowed to range freel~ from very formal to the very informal
A strong tendency to let the expert in a given situation have the most say in decision making,
even if this means temporarily by-passing formal line authority
A strong emphasis to adapting freely to changing
circumstances without too much concern for past
practice
A strong emphasis on getting things done even if
this means disregarding formal procedures
Loose, informal control; heavy dependence on
informal relationships and norm of cooperation
for getting work done
A strong tendency to let the requirements of the
situation and the individual's personality define
proper on -the- job behaviour

7. ORGANIZATION CLIMATE
In addition to context and structure, organizations also need processes that help them achieve their goals. The following section looks at the organizational processes within your company.
Please indicate your response by circling the number that best describes the extent to which the statement applies to your company :
?age 9
I Totally! Mainlyj Mainly: Totally! false false true ·true
:1. Applications of research, experimental analysis, and other forms of scientific method 1 2 i 3 4 are encouraged.
:2. A discussion about the latest technical developments would not be uncommon in 2 3 I 4 I this organization. '3. Few people would be interested in attending a lecture by an outstanding scientist. 2 3 4 I
:4. Few people in this organization have any background in science. 2 3 4
I 5. A discussion about the latest scientific inventions would not be uncommon here. 2 3 I 4
~ 6. Magazines about new developments in science and management techniques are read 2 3 4 I
by many eeoele who work here. I i 7. Senior personnel here are considered experts in their respective fields. 2 I 3 4
' I I
:8. This organization is research conscious. 2 3 I 4
:9. People here spend a great deal of time thinking about and discussing complex problems. 2 3 4 I !
110. Few people here would be interested in attending a lecture by an outstanding industrialist. 2 3 4 i ; 11. Few people here are stimulated by intellectual activities and problems. 2 3 4 I
,12. Few people here are challenged by deep thinking. 2 3 4 I
13. Most people here are well-read. 2 3 I 4
• 14 .. People here often get involved in long serious intellectual discussions . 2 3 4
: 15. People who attempt discussions on serious subjects are made to feel foolish and out of 2 3 4 lace here.
16. Careful reasoning and clear logic are highly valued here. 2 3 4
; 17. Important people here are always addressed as "Sir". 2 3 4
: 18. It's necessary to be polite under all circumstances to stay out of trouble here. 2 3 4
. 19. I
Senior personnel rarely refer to one another by their first names . 2 3 4 I
. 20. The important people in this place expect others to show proper respect for them . 2 I 3 4
• 21. People here are always looking for compliments . 2 3 4 I
! ; 22. Senior personnel are frequently jealous of their authority. 3 4 I
123. There is a lot of boot-licking around here. 4
124. There is a recognised group of leaders who receive special privileges. 4 I
i 25. Policy goals and objec11ves are carefully explained to everyone. 2 3 4
i 26. Criticism or advice from a superior is usually welcomed. 2 3 4 ~
127. Regulations are interpreted and enforced in an understanding manner. 2 3 4
j28. There are few opportunities for informal conversation with senior personnel. 2 3 4
129. This organization does not concern itself with the personal problems of the 2 3 4 eeoele who work here.
i 30. Senior personnel have little tolerance for complaints and protests. 2 3 4 I

7. ORGANIZATION CLIMATE (Cont.) Page 1
Totally Mainly Mainiy, Total I
personnel will go out of their way to help you with your work. 2 3 4
personnel are prepared to listen to people as well as direct them. 2 3 4
and only after considerable deliberation. 2 3 4
'34. Quick decisions and actions are not characteristic of this place. 2 3 4
135. Thinking of alternative ways in which problems might be solved or things done differently 2 3 4 . is discoura ed here. ·
36. New ideas are always being tried out here. 2 3 4
:37. The latest scientific discoveries make few changes in the way this place is run. 2 ! 3 4
; 38. Unusual or exciting plans are encouraged here. 2 3 4
'39. are conventional ways of doing things here which are rarely changed. 2 3 4 I
[ 40. Programmes here are quickly changed to meet new conditions. 2 3 4
:41. People are always trying to manipulate the activities of others for their own advantage. '
2 3 4
l 42. People can get into very heated arguments with one another, and be the best 2 3 4 I
143. of friends the next da .
Almost everyone is likely to be blamed, even those who had little to do with it. 2 3 4 if some thing ha~~ens to go wrong.
:44. Personal rivalries are fairly common in this place. 2 3 4
45. A lot of people in this place walk around with a chip on their shoulder. 2 3 4
• 46. There always seems to be a lot of little quarrels going on here. 2 3 4
47. People here are always trying to win an argument. 4
Many people here seem to brood a lot, act moodily and it is hard to make them out. 4
openly. 4
150. Discussions get quite heated with a lot of display of feeling. 4
51. People here do not try _to hide their feelings. 2 3 4 I
52. There are very few issues here that arouse much excitement or feeling. 2 3 4
:53. Open displays of emotion have no place here. 2 3 4 . ' ! 54. When people dislike someone here they make no secret of it. I 1
I 2 3 ! 4
I ! I t 55. People here tend to hide their deeper feelings from each other. I 1 I 2 3
I 4
:56. People here can be wildly happy one minute and hopelessly depressed the next. 1 I 2 I 3 I 4 ! !
' 157. People are expected to report violations of rules and regulations. 1 2
I
3 4 I i I
158. I 1 I
2 3 4 Attendance is checked carefully. I i
I
I 159. I
People qutckly learn what IS done and not done around here. 4.
:60. Most people pay little attention to rules and regulations. 4 i
i 61. People ask permission before deviating from common policies or practice. 2 3 4
I i 62. Formal rules and regulations have a very important place here. 2 3 4 I
63. Procedures to be followed in case of fires and accidents are not prominently displayed. 2 3 4
164. It is expected that there will be no deviation from established practices. no matter 2 3 4 what the circumstances.

_,_,7 .'--=0-'-'R=G'-'--'A'-'--'N=I ZA"'-'-'-T . .:.::IO=N-"---=C~L=I M~A T~E::____J(~C~on t.)
:65. Criticism of policies and practices is encouraged.
66. When people disagree with a decision. they work to get it changed.
67. People here are not likely to accept managerial ineptitude without complaint or protest.
t 68. When people dislike policy they let it be known in no uncertain terms.
: 69. People avoid direct clashes with senior personnel at all costs.
Many people will not hesitate to give strong support to a project to which
People who get pushed around here are expected to fight back.
People delight in challenging official policies.
8. BACKGROUND INFORMATION
8. 1 . Position of
Please indicate which of the following titles best describes your position in the company :
Group General Manager
Divisional General Manager
General Manager
Group Human Resources Manager
Senior Human Resources Manager
Page 1
, Totally Mainly: Mainly. Totally
' false true true
2 3
(circle)
1
4
Other (please specify) ........................................... .
2
3
4
5
6
8.2, Life-cycle stage.
Please indicate the stage of development of your company :
Infancy The organization has recently been
formed and is still establishing its
products and services in the market place.
Growth The organization has es1ablished its
position in the market and its annual
sales are rapidly increasing.
Maturity The organization has an established
reputation and its growth rate has
stabilized.
Diversification
The growth and profitability of the
organization's traditional products and
services have declined and new products
and areas of activity have been
embarked upon to provide sustained
(circle) ,
2
3
4

8. BACKGROUND INFORMATION (Cont.)
8. 3. Major Industry.
Please indicate the major industry that your company is involved in by circling one of the following options :
Autombile and related industries
Computer I Electronics
Comsumer goods
Banking I Finance I Travel
Industrial Equipment or supplies
Pharmaceuticals I Hospital & health supplies
Mining and Quarrying
Petroleum and related imdustries
Chemicals
Insurance
Advertising
Publishing
Construction
Agricultural Equipment or supplies
Distrubution of consumer goods
Distribution of industrial goods
Other (please specify) ..........
What sector(s) would you describe your major operations as encompassing? Please circle as many as appropriate
Manufacturing : Primary
Manufacturing : Secondary
Service
Supply
Retail
Import I Export
Public Administration
Other (please specify) ................................. .
8.4. Age of Organization
8.5.
I
Please indicate the age of your company:
Turnover
less than S years 6 to 9 years 1 o to 19 years 20 to 29 years 30 or more years
Please indicate the approximate annual turnover of your company :
less than A1 million A1 million to A2,S million A2,S million to AS million AS million to A1 o million A1 0 million to A2S million A2S million to ASO million more than ASO million
(circle)
1
2 3
4
5
6
7
8
9
10
11
12
13
14
15
16
17
Page 1;
(circle as appropriate)
1
2 3
4
5 6
7 8
(circle)
1
2
3
4
s
(circle)
1
2 3
4
s 6
7

8. BACKGROUND INFORMATION (Cont.) Page 1:
8. 6. Integration with suppliers and customers
Please describe your company's relationship with its single biggest supplier :
(circle)
Small outlet (less than 9% of raw material comes from one supplier) 1
Minor outlet (more than 9% of raw material comes from one supplier) 2
Medium outlet (more than 35% of raw material comes from one supplier) 3
Major outlet (more than 75% of raw material comes from one supplier) 4
Please describe your company's relationship with its single biggest customer : (circle)
Small outlet (less than 9% of output goes to one customer) 1
Minor outlet (more than 9% of output goes to one customer) 2
Medium outlet (more than 35% of output goes to one customer) 3
Major outlet (more than 75% of output goes to one customer) 4
Thank you so much for taking the time to assist in this important research project. Please check to make sure that you have not missed any questions. Feel free ~o contact the researcher on telephone (011) 899-6301 if you have any queries. Ask for Bill Raubenheimer.
Additional Comments :
~ ~ • • ~. ~ ................ - ..................... " •••••••• ,. •• 6" •• ., ...... 0 •••••••••• 0. • ................ 0 •••••• " •••••• *.' •• f' ••••••• 0 ........ 0 ••••••••• " ••••••••• 0 ••••• 0 0 0. 0 .... ..
• • • 0 ..... " ....... 0 .................. 0 ... 0 •••• 4 .............. 0 ....... s ................. 0. • .. .. • ..... 0 ................................. 0 •••••••••••••••••••• * *. * ..... ~ ~ ................. " ....... .
. . .. . . . ' .....•.• ' ............................. ~. ~· ~ ...........•.....•.•.......... ". ~~· .................. ' •............•...•........... ·~ ................. 4. 40 •••••••
. . . . . . . . ~ ... ~ .................................. -~ ..................... ~ ................... ··~ ..................... ~ .... ~ ..................... ~· .......... " ........... . • • • • • • • • ~ ••••••••••• * .................... 4 ••••• •••••••••••• ' • • • • • • • • • • • • • • • • • • •••••••••••••••••••••••••••••••• ' ••••••••••••••••••••••••••••••••••• - •••••••••• 0 • 0 ••
·········o•········································~·········~····••4••••••• ............................. ~···········~··························~··················· •• ~ ••••••••••••••••••••••••••••••••••••••••••••••••••••••••••••••••• w •••••• ~ • ~ ••••••••••••••••••• ~ ••••••••••••••••••••••••••••••••••• t •••••••••••••••••••••••••••
······~···· ••• ' ................................................ ~-· ~· ••• '"' ••••.••••••••••••••••••••••• ,.,., ...................... ••t''. '' •• ~·· •••••••• ••4 ·~ ······~··.

Dear Executive
a a ... _.,
,,, AIJ: .. [ure 4.: ~f~,.
GRADUATE SCHOOL OF BUSINESS LEADERSHIP NAGRAADSE SKOOL VIR BEDRYFSLEIDING
UNIVERSITY OF SOUTH AFRICA UNIVIiRSITEIT VAll SUID-AFRIKA
D R A N D
The Structure and Functioning of Manufacturing Organizations.
The purpose of this letter is to introduce you to a ground- breaking research project, and to request your assistance and participation by completing a simple questionnaire. The data from this study will form the basis for a Doctoral Thesis. The field covered by this research has not been undertaken before in South Africa and we believe that it is of particular importance at this point in our history.
The intention is to analyse structural relationships in manufacturing organizations to establish how organization structures that compliment effectiveness and enhance competitiveness are brought about. At the same time the research will attempt to evaluate whether or not Organisation Theory principles developed in advanced economies are applicable to our rather unique situation.
Your assistance in providing information is, therefore, of critical importance as a good- sized sample will be necessary to draw meaningful conclusions. Participants in a pilot study found that the
1concepts and questions posed were interesting and thought-provoking in themselves. We are sure that you will too.
Although the Questionnaire may seem quite lengthy, it is fairly easy to complete and, for the most part, all you need do is choose among a number of alternatives bycircling your response to a particular statement or question. It should not take more than 30 minutes of your time.
Your responses will obviously be treated in the strictest confidence. The Questionnaires are numbered purely for administrative purposes and to facilitate reminders, where necessary. Please feel free to contact the researcher at the telephone number provided on the last page of the questionnaire if you have any queries, or if you want to receive a copy of the research summary.
Thank you so much for your assistance and we look forward to receiving your input into this important project.
Yours Sincerely,
~ Professor Joban Murphy
Leadership in practice First Street Extension Midrand 1685 PO Box 392 Pretoria 0001 Tel (011) 652·0000 Fax: (011) 652·0299 International tel nr: 27·11· 652 0000
Leierskap in die Eerstestraatverlenging Mid rand 1685 Posbus 392 Pretoria 0001 Tel: (011) 652·0000 Faks: (011) 652·0299 lnternasionale tel nr: 27·11· 652 0000