the study on natural disaster management in …open_jicareport.jica.go.jp/pdf/11928850_01.pdf ·...
TRANSCRIPT

No.
09-028
J RG E D
THE STUDY ON
NATURAL DISASTER MANAGEMENT IN
INDONESIA
FINAL REPORT
VOLUME 3:
SUPPORTING REPORT
MARCH 2009
JAPAN INTERNATIONAL COOPERATION AGENCY
ORIENTAL CONSULTANTS CO., LTD. ASIAN DISASTER REDUCTION CENTER
NATIONAL DISASTER MANAGEMENT AGENCY (BNPB)

THE STUDY ON
NATURAL DISASTER MANAGEMENT IN
INDONESIA
FINAL REPORT
VOLUME 3:
SUPPORTING REPORT
MARCH 2009
JAPAN INTERNATIONAL COOPERATION AGENCY
ORIENTAL CONSULTANTS CO., LTD. ASIAN DISASTER REDUCTION CENTER
NATIONAL DISASTER MANAGEMENT AGENCY (BNPB)

Foreign Currency Exchange Rates Applied in the Study
Currency Exchange Rate/USD
Rupiah (IDR) 9430.00
Japanese Yen (JPY) 107.50
(Rate as of October 1, 2008)

Final Report
-i-
Table of Contents on the Final Report of The Study on Natural Disaster Management in Indonesia
Structure of Final Report Volume 1: Summary Volume 2: Main Report
Volume 2-1: Study Activities and Findings
Volume 2-2: National Disaster Management Plan Part 1: General Part 2: Earthquake Disaster Measures Part 3: Rain and Storm Disaster Measures
Volume 2-3: Kabupaten Jember Regional Disaster Management Plan Part 1: Rain and Storm Disaster Measures
Part 2: Earthquake Disaster Measures
Volume 2-4: Kabupaten Padang Pariaman Regional Disaster Management Plan Part 1: Earthquake Disaster Measures
Part 2: Rain and Storm Disaster Measures
Volume 2-5: Kota Pariaman Regional Disaster Management Plan Part 1: Earthquake Disaster Measures
Part 2: Rain and Storm Disaster Measures
Volume 3: Supporting Report Volume 4: General Guideline for Formulation of Regional Disaster Management Plan Part 1 : General Guideline Part 2 : Appendixes
Appendix 1: Guideline for Creation of Hazard Maps and Risk Maps for Natural disasters
Appendix 2: Guideline for Community-based Disaster Risk Management (CBDRM) Activities in Indonesia

The Study on Natural Disaster Management in Indonesia
-ii-
Table of Contents of Volume 3: Supporting Report
Table of Contents.................................................................................................................... i List of Tables .......................................................................................................................... viii List of Figures......................................................................................................................... xii Abbreviations.......................................................................................................................... xxv
CHAPTER 1 DEVELOPMENT OF GIS DATABASE AND BASICS FOR CREATIONS OF
HAZARD MAP AND RISK MAP 1.1 GIS database system turned over to counterpart organizations ..................................... 1-1 1.2 GIS Database for National Level................................................................................... 1-5
1.2.1 Data Collection and Input .................................................................................. 1-5 1.2.2 Data Integration.................................................................................................. 1-6
1.3 GIS Database for Kabupaten Jember............................................................................. 1-7 1.3.1 Data Collection and Input .................................................................................. 1-7 1.3.2 Data Integration.................................................................................................. 1-7 1.3.3 Examples of GIS Layer ...................................................................................... 1-8
1.4 GIS Database for Kabupaten Padang Pariaman ............................................................ 1-15 1.4.1 Data Collection and Input .................................................................................. 1-15 1.4.2 Data Integration.................................................................................................. 1-17 1.4.3 Examples of GIS Layers .................................................................................... 1-17
1.5 GIS Database for Kota Pariaman................................................................................... 1-25 1.5.1 Data Collection and Input .................................................................................. 1-25 1.5.2 Data Integration.................................................................................................. 1-26 1.5.3 Examples of GIS Layers .................................................................................... 1-27
1.6 Basics for Creations of Hazard Map and Risk Map ...................................................... 1-33 1.6.1 Objectives of Creations of Hazard Map and Risk Map...................................... 1-33 1.6.2 Definition of Risk, Hazard and Vulnerability..................................................... 1-33 1.6.3 Flow Chart for Creations of Hazard Map and Risk Map ................................... 1-34 1.6.4 Vulnerability Maps for Kabupaten Jember......................................................... 1-37 1.6.5 Vulnerability Maps for Kabupaten Padang Pariaman ........................................ 1-41 1.6.6 Vulnerability Maps for Kota Pariaman .............................................................. 1-45
CHAPTER 2 TOPOGRAPHY AND GEOLOGY IN PILOT REGION
2.1 Kabupaten Jember ......................................................................................................... 2-1 2.1.1 Landform of Kabupaten Jember......................................................................... 2-1 2.1.2 Geology of Kabupaten Jember ........................................................................... 2-3

Final Report
-iii-
2.1.3 Ground Type Classification and Soil Types ....................................................... 2-4 2.1.4 Target Earthquakes in Kabupaten Jember .......................................................... 2-8
2.2 Kabupaten Padang Pariaman ......................................................................................... 2-11 2.2.1 Landform of Kabupaten Padang Pariaman ........................................................ 2-11 2.2.2 Geology of Kabupaten Padang Pariaman........................................................... 2-15 2.2.3 Ground type classification and amplification analysis....................................... 2-16 2.2.4 Investigation of Target Earthquake .................................................................... 2-20
CHAPTER 3 DISASTER CHARACTERISTICS OF EARTHQUAKE AND
COUNTERMEASURES IN PILOT REGIONS 3.1 Disaster Characteristics of Earthquake and Countermeasures in Kabupaten Jember.... 3-1
3.1.1 Disaster Characteristics of Earthquake in Kabupaten Jember............................ 3-1 3.1.2 Earthquake Hazard Map in Kabupaten Jember.................................................. 3-4 3.1.3 Earthquake Risk Map in Kabupaten Jember ...................................................... 3-11 3.1.4 Possible Countermeasures against Earthquake in Kabupaten Jember ............... 3-22
3.2 Disaster Characteristics of Earthquake and Countermeasures in Kabupaten Padang Pariaman ........................................................................................................... 3-25
3.2.1 Disaster Characteristics of Earthquake in Kabupaten Padang Pariaman ........... 3-25 3.2.2 Earthquake Hazard Map in Kabupaten Padang Pariaman.................................. 3-29 3.2.3 Earthquake Risk Map in Kabupaten Padang Pariaman...................................... 3-36 3.2.4 Possible Countermeasures against Earthquake in Kabupaten Padang
Pariaman............................................................................................................. 3-48 3.3 Disaster Characteristics of Earthquake and Countermeasures in Kota Pariaman.......... 3-51
3.3.1 Disaster Characteristics of Earthquake in Kota Pariaman.................................. 3-51 3.3.2 Earthquake Hazard Map in Kota Pariaman........................................................ 3-55 3.3.3 Earthquake Risk Map in Kota Pariaman ............................................................ 3-62 3.3.4 Possible Countermeasures against Earthquake in Kota Pariaman ..................... 3-73
CHAPTER 4 DISASTER CHARACTERISTICS OF TSUNAMI DISASTER AND
COUNTERMEASURES IN PILOT REGIONS 4.1 Introduction ................................................................................................................... 4-1
4.1.1 Overview of Tsunami Hazard in Indonesia ........................................................ 4-1 4.1.2 Overview of Tsunami Disaster in Indonesia ...................................................... 4-3
4.2 Disaster Characteristics of Tsunami Disaster and Countermeasures in Kabupaten Jember ......................................................................................................... 4-4
4.2.1 Disaster Characteristics of Tsunami Disaster in Kabupaten Jember .................. 4-4 4.2.2 Tsunami Hazard Map in Kabupaten Jember ...................................................... 4-17

The Study on Natural Disaster Management in Indonesia
-iv-
4.2.3 Tsunami Risk Map in Kabupaten Jember........................................................... 4-27 4.2.4 Possible Countermeasures against Tsunami Disaster in Kabupaten Jember ...... 4-32 4.2.5 Activities for Capacity Development ................................................................. 4-37
4.3 Disaster Characteristics of Tsunami Disaster and Countermeasures in Kabupaten Padang Pariaman ......................................................................................... 4-38
4.3.1 Disaster Characteristics of Tsunami Disaster in Kabupaten Padang Pariaman............................................................................................................. 4-38
4.3.2 Tsunami Hazard Map in Kabupaten Padang Pariaman ...................................... 4-57 4.3.3 Tsunami Risk Map in Kabupaten Padang Pariaman .......................................... 4-64 4.3.4 Possible Countermeasures against Tsunami Disaster in Kabupaten
Padang Pariaman ................................................................................................ 4-70 4.3.5 Activities for Capacity Development ................................................................. 4-79
4.4 Disaster Characteristics of Tsunami Disaster and Countermeasures in Kota Pariaman ............................................................................................................... 4-80
4.4.1 Disaster Characteristics of Tsunami Disaster in Kota Pariaman ........................ 4-80 4.4.2 Tsunami Hazard Map in Kota Pariaman ............................................................ 4-83 4.4.3 Tsunami Risk Map in Kota Pariaman................................................................. 4-89 4.4.4 Possible Countermeasures against Tsunami Disaster in Kota Pariaman ............ 4-94 4.4.5 Activities for Capacity Development ................................................................. 4-102
CHAPTER 5 CHARACTERISTICS OF SEDIMENT DISASTERS AND COUNTERMEASURES
IN PILOT REGIONS 5.1 Introduction ................................................................................................................... 5-1
5.1.1 General Factors of Natural Disasters in Indonesia ............................................. 5-1 5.1.2 Present Situation of Sediment Disasters in Indonesian Provinces ..................... 5-3
5.2 Disaster Characteristics of Sediment Disaster and Countermeasures in Kabupaten Jember ......................................................................................................... 5-4
5.2.1 Disaster Characteristics of Sediment Disaster in Kabupaten Jember................. 5-4 5.2.2 Sediment Hazard Map in Kabupaten Jember ..................................................... 5-10 5.2.3 Sediment Risk Map in Kabupaten Jember ......................................................... 5-17 5.2.4 Possible Countermeasures against Sediment Disaster in Kabupaten Jember..... 5-20 5.2.5 Capacity Development Activities....................................................................... 5-28 5.2.6 Future work ........................................................................................................ 5-33
5.3 Characteristics of Sediment Disaster and Countermeasures in Kabupaten Padang Pariaman ......................................................................................... 5-34
5.3.1 Characteristics of Sediment Disaster in Kabupaten Padang Pariaman............... 5-34 5.3.2 Sediment Hazard Map in Kabupaten Padang Pariaman..................................... 5-39

Final Report
-v-
5.3.3 Sediment Risk Map in Kabupaten Padang Pariaman......................................... 5-47 5.3.4 Possible Countermeasures against Sediment Disasters in
Kabupaten Padan Pariaman................................................................................ 5-49 5.3.5 Activities for Capacity Development................................................................. 5-51 5.3.6 Future Suggestions ............................................................................................. 5-53
5.4 Disaster Characteristics of Sediment Disaster and Countermeasures in Kota Pariaman ............................................................................................................... 5-54
5.4.1 Disaster Characteristics of Sediment Disaster in Kota Pariaman....................... 5-54 5.4.2 Sediment Hazard Map in Kota Pariaman........................................................... 5-59 5.4.3 Sediment Risk Map in Kota Pariaman ............................................................... 5-67 5.4.4 Possible Countermeasures against Sediment Disaster in Kota Pariaman .......... 5-69 5.4.5 Activities for Capacity Development................................................................. 5-69 5.4.6 Future Suggestions ............................................................................................. 5-69
CHAPTER 6 DISASTER CHARACTERISTICS OF FLOOD DISASTER AND
COUNTERMEASURES IN PILOT REGIONS 6.1 Introduction ................................................................................................................... 6-1 6.2 Disaster Characteristics of Flood Disaster and Countermeasures in
Kaabupaten Jember ....................................................................................................... 6-4 6.2.1 Disaster Characteristics of Flood Disaster in Kabupaten Jember ...................... 6-4 6.2.2 Flood Hazard Map for Kabupaten Jember ......................................................... 6-8 6.2.3 Flood Risk Map in Kabupaten Jember............................................................... 6-15 6.2.4 Possible Countermeasures against Flood Disaster in Kabupaten Jember .......... 6-17 6.2.5 Activities for Capacity Development................................................................. 6-37
6.3 Disaster Characteristics of Flood Disaster and Countermeasures in Kabupaten Padang Pariaman ........................................................................................................... 6-41
6.3.1 Disaster Characteristics of Flood Disaster in Kabupaten Padang Pariaman ...... 6-41 6.3.2 Flood Hazard Map in Kabupaten Padang Pariaman .......................................... 6-45 6.3.3 Flood Risk Map in Kabupaten Padang Pariaman............................................... 6-51 6.3.4 Possible Countermeasures against Flood in Kabupaten Padang Pariaman ........ 6-53 6.3.5 Activities for Capacity Development................................................................. 6-60
6.4 Disaster Characteristics of Flood Disaster and Countermeasures in Kota Pariaman .... 6-63 6.4.1 Disaster Characteristics of Flood Disaster in Kota Pariaman ............................ 6-63 6.4.2 Flood Hazard Map in Kota Pariaman................................................................. 6-65 6.4.3 Flood Risk Map in Kota Pariaman..................................................................... 6-71 6.4.4 Possible Countermeasures against Flood Disaster in Kota Pariaman ................ 6-73 6.4.5 Activities for Capacity Development................................................................. 6-73
The Study on Natural Disaster Management in Indonesia
-vi-
CHAPTER 7 EARLY WARNING SYSTEM 7.1 General........................................................................................................................... 7-1 7.2 Existing Conditions of Early Warning System in Indonesia.......................................... 7-1
7.2.1 Concept of Meteorological Early Warning System in Indonesia by BMG ........ 7-1 7.2.2 Concept of Earthquake Information Tsunami Warning System in Indonesia..... 7-3
7.3 Existing Conditions of Early Warning in East Java Province and Kabupaten Jember............................................................................................................................ 7-4
7.3.1 Meteorological Observation and Early Warning System in East Java Province by BMG............................................................................................... 7-4 7.3.2 Meteorological Observation System and Early Warning System in Kabupaten Jember .............................................................................................. 7-5 7.3.3 Rainfall Observation by Irrigation Agency ........................................................ 7-7 7.3.4 Hydrological Observation by Irrigation Agency and Other Agencies................ 7-7 7.3.5 Information Dissemination at Community Level............................................... 7-7 7.3.6 Tsunami Early Warning System in East Java Province and Kabupaten Jember ................................................................................................................ 7-8
7.4 Plan for Early Warning and Evacuation in Kabupaten Jember...................................... 7-8 7.4.1 Basic Understanding for Making Plan ............................................................... 7-8 7.4.2 Plan..................................................................................................................... 7-9
7.5 Existing Conditions of Early Warning in West Sumatra Province, Kabupaten Padang Pariaman and Kota Pariaman............................................................................ 7-11
7.5.1 Existing Conditions of Early Warning in West Sumatra Province ..................... 7-11 7.5.2 Existing Conditions of Early Warning in Kabupaten Padang Pariaman ............ 7-11 7.5.3 Existing Conditions of Early Warning in Kota Pariaman................................... 7-15
7.6 Plan for Early Warning and Evacuation in Kabupaten Padang Pariaman and Kota Pariaman ............................................................................................................... 7-17
7.6.1 Basic Understanding for Making Plan ............................................................... 7-17 7.6.2 Plan..................................................................................................................... 7-18
CHAPTER 8 COMMUNITY BASED DISASTER RISK MANAGEMENT
8.1 Community capacities to be strengthened for effective disaster risk management ....... 8-1 8.2 Activities for Capacity Development of the Communities in Kabupaten Jember ......... 8-2
8.2.1 Community Survey and Characteristics of Community-based Disaster Management in Kabupaten Jember .................................................................... 8-2
8.2.2 Training Program for Community Leaders in Kabupaten Jember ..................... 8-12 8.2.3 Development of Disaster Awareness Material.................................................... 8-15 8.2.4 Pilot Project Plan for Pilot Community.............................................................. 8-15

Final Report
-vii-
8.2.5 Activities for Capacity Development in the Pilot Community in Kabupaten Jember.............................................................................................. 8-19
8.2.6 Evaluation of Activities...................................................................................... 8-27 8.3 Activities for Capacity Development of the Communities in Kabupaten Padang
Pariaman and Kota Pariaman ........................................................................................ 8-29 8.3.1 Community Survey and Characteristics of Community-based Disaster
Management in Kabupaten Padang Pariaman and Kota Pariaman .................... 8-29 8.3.2 Training Program for Community Leaders in Kabupaten Padang Pariaman and Kota Pariaman ............................................................................. 8-41 8.3.3 Development of Disaster Awareness Material ................................................... 8-43 8.3.4 Pilot Project Plan for Pilot Community.............................................................. 8-43 8.3.5 Activities for Capacity Development in the Pilot Community in
Kabupaten Padang Pariaman and Kota Pariaman .............................................. 8-47 8.3.6 Evaluation of Activities...................................................................................... 8-56
8.4 Conclusions and Recommendations.............................................................................. 8-57

The Study on Natural Disaster Management in Indonesia
-viii-
List of Tables of Volume 3: Supporting Report
CHAPTER 1 DEVELOPMENT OF GIS DATABASE AND BASICS FOR CREATIONS OF HAZARD MAP AND RISK MAP
Table 1.1.1 Inventory of equipments turned over to each counterpart organization .......... 1-2 Table 1.1.2 Data List in the GIS Workstations (1).............................................................. 1-3 Table 1.1.3 Data List in the GIS Workstations (2).............................................................. 1-4 Table 1.4.1 List of Building Type in Kabupaten Padang Pariaman.................................... 1-16 Table 1.5.1 List of Building Type in Kota Pariaman .......................................................... 1-25
CHAPTER 2 TOPOGRAPHY AND GEOLOGY IN PILOT REGION Table 2.1.1 Geology of Kabupaten Jember ........................................................................ 2-3 Table 2.1.2 Collected Borehole Data.................................................................................. 2-4 Table 2.1.3 Physical Values of Soil and Rock Type ........................................................... 2-8 Table 2.1.4 Fault Parameter of Target Earthquake (Interplate Earthquake at Kabupaten Jember offshore)............................................................................ 2-10 Table 2.2.1 Geomorphological Map Legend of Kabupaten Padang Pariaman................... 2-13 Table 2.2.2 Geology of Kabupaten Padang Pariaman ........................................................ 2-15 Table 2.2.3 The index of Landform type, Ground condition type and Shaking
potential ........................................................................................................... 2-17 Table 2.2.4 Landform type, subsurface geology, ground condition, well water level and liquefaction potential ................................................................................ 2-18 Table 2.2.5 Fault Parameter: Interplate Earthquakes (offshore Kabupaten Padang Pariaman) ............................................................................................ 2-24
CHAPTER 3 DISASTER CHARACTERISTICS OF EARTHQUAKE AND COUNTERMEASURES IN PILOT REGIONS
Table 3.1.1 Earthquake by Which 100 Lives or More are Lost in Indonesia (1/2) ............ 3-2 Table 3.1.2 Earthquake by Which 100 Lives or More are Lost in Indonesia (2/2) ............ 3-2 Table 3.2.1 Earthquake by Which 100 Lives or More are Lost in Indonesia (1/2) ............ 3-26 Table 3.2.2 Earthquake by Which 100 Lives or More are Lost in Indonesia (2/2) ............ 3-26 Table 3.3.1 Earthquake by Which 100 Lives or More are Lost in Indonesia (1/2) ............ 3-52 Table 3.3.2 Earthquake by Which 100 Lives or More are Lost in Indonesia (2/2) ............ 3-52
CHAPTER 4 DISASTER CHARACTERISTICS OF TSUNAMI DISASTER AND
COUNTERMEASURES IN PILOT REGIONS Table 4.1.1 Tsunami Cases in Indonesia During 1960-2006 .............................................. 4-3

Final Report
-ix-
Table 4.2.1 Tsunami Event offshore Java Island (1960-2006) ........................................... 4-4 Table 4.2.2 Statistics of human and house damage by regencies in East Java Province.... 4-8 Table 4.2.3 Statistics of human and house damage in Kabupaten Jember ......................... 4-14 Table 4.2.4 Characteristics of Each Inundation Prediction Method ................................... 4-18 Table 4.2.5 Applicability of Each Inundation Prediction Method in Kabupaten Jember... 4-19 Table 4.2.6 Tsunami Data for Calculating Water Discharge Intruding Inland ................... 4-20 Table 4.2.7 Water Volume Intruding by Tsunami ............................................................... 4-21 Table 4.2.8 Joint Field Survey and Workshop.................................................................... 4-37 Table 4.3.1 Tsunami Events Offshore from Sumatra Island............................................... 4-38 Table 4.3.2 Damage of 2007 South Sumatra...................................................................... 4-50 Table 4.3.3 Fault Parameters of Target Earthquake............................................................ 4-52 Table 4.3.4 Damage Records of Target Tsunami in 1797 and 1833 ................................... 4-55 Table 4.3.5 Applicability of Each Inundation Prediction Method in Kabupaten
Padang Pariaman ............................................................................................. 4-57 Table 4.3.6 Tsunami Data for Calculating Water Discharge Intruding Inland ................... 4-58 Table 4.3.7 Water volume intruding by tsunami ................................................................ 4-59 Table 4.3.8 Afforestation.................................................................................................... 4-72 Table 4.3.9 Possible Countermeasures for each Kechamatan ............................................ 4-78 Table 4.3.10 Joint Field Survey and Workshop.................................................................... 4-79 Table 4.4.1 Applicability of Each Inundation Prediction Method in Kota Pariaman......... 4-83 Table 4.4.2 Tsunami Data for Calculating Water Discharge Intruding Inland ................... 4-84 Table 4.4.3 Water Volume Intruding by Tsunami ............................................................... 4-85 Table 4.4.4 Afforestation.................................................................................................... 4-96 Table 4.4.5 Possible Countermeasures for each Kechamatan ............................................ 4-101
CHAPTER 5 CHARACTERISTICS OF SEDIMENT DISASTERS AND COUNTERMEASURES
IN PILOT REGIONS Table 5.1.1 Frequency of Disasters and Affected Persons in Past Periods......................... 5-1 Table 5.1.2 Statistics for Sediment Disasters in Indonesia................................................. 5-3 Table 5.2.1 Past Disaster Records with Rainfall Data in Kabupaten Jember ..................... 5-4 Table 5.2.2 Location of Rain Stations ................................................................................ 5-6 Table 5.2.3 Average Rainfall in Kabupaten Jember (1981–2004)...................................... 5-8 Table 5.2.4 Mechanical and Incitant Factors of Sediment Disasters.................................. 5-10 Table 5.2.5 Indices used for Creation of Sediment Hazard maps....................................... 5-11 Table 5.2.6 Vulnerability Indices Used for Sediment Disaster........................................... 5-17 Table 5.2.7 Characteristics of Each Sediment Disaster Area ............................................. 5-19 Table 5.2.8 Profile of S1 Area............................................................................................ 5-22

The Study on Natural Disaster Management in Indonesia
-x-
Table 5.2.9 Profile of S2 Area ............................................................................................ 5-23 Table 5.2.10 Possible Countermeasures for S1 and S2 Areas .............................................. 5-23 Table 5.2.11 Outline of the Workshops ................................................................................ 5-28 Table 5.3.1 Recent History of Kabupaten Padang Pariaman.............................................. 5-34 Table 5.3.2 Precipitation at the Time of Disaster Occurrence ............................................ 5-37 Table 5.3.3 Precipitation at the Time of Disaster Occurrence ............................................ 5-38 Table 5.3.4 Mechanical and Incitant Factors of Sediment Disasters .................................. 5-39 Table 5.3.5 Indices used for Creation of Sediment Hazard Map........................................ 5-40 Table 5.3.6 Vulnerability Indices used for Sediment Disasters .......................................... 5-47 Table 5.3.7 Possible Countermeasures against Sediment Disaster..................................... 5-50 Table 5.3.8 Outline of the Workshops ................................................................................ 5-51 Table 5.4.1 Recent Sediment disaster of Kota Pariaman.................................................... 5-54 Table 5.4.2 Precipitation at the time of disaster occurrence ............................................... 5-57 Table 5.4.3 Precipitation at the time of disaster occurrence ............................................... 5-58 Table 5.4.4 Mechanical and Incitant Factors of Sediment Disasters .................................. 5-59 Table 5.4.5 Indices used for Creations of Sediment Hard Map.......................................... 5-60 Table 5.4.6 Vulnerability Indices used for Sediment Disasters .......................................... 5-67 Table 5.4.7 Possible Countermeasures against Sediment Disaster..................................... 5-69
CHAPTER 6 DISASTER CHARACTERISTICS OF FLOOD DISASTER AND COUNTERMEASURES IN PILOT REGIONS
Table 6.1.1 Recent History of Flood Disasters in Indonesia (1/2)...................................... 6-1 Table 6.1.2 Recent History of Flood Disasters in Indonesia (2/2)...................................... 6-2 Table 6.2.1 Recent History of Major Flood and Sediment Disasters ................................. 6-4 Table 6.2.2 Main rivers in Kabupaten Jember.................................................................... 6-6 Table 6.2.3 Indices used for the creations of flood hazard map and flood risk map .......... 6-15 Table 6.2.4 Characteristics of sediment and flood disasters ............................................... 6-17 Table 6.2.5 Expected non-structural countermeasures against sediment and flood
disasters ........................................................................................................... 6-19 Table 6.2.6 Expected structural countermeasures against sediment and flood disasters .... 6-20 Table 6.2.7 Profile of F1 Area ............................................................................................ 6-22 Table 6.2.8 Profile of F2 Area ............................................................................................ 6-23 Table 6.2.9 Possible Countermeasures for F1 Area and F2 Area ....................................... 6-24 Table 6.2.10 List of technical workshops for counterpart members of Kabupaten
Jember.............................................................................................................. 6-37 Table 6.2.11 Comments from the participants for Technical Workshop .............................. 6-40 Table 6.3.1 Recent History of Major Flood and Sediment Disasters ................................. 6-41

Final Report
-xi-
Table 6.3.2 Major Rivers Flowing through Kabupaten Padang Pariaman ......................... 6-43 Table 6.3.3 Indices used for creations of flood hazard map ............................................... 6-45 Table 6.3.4 Score Table of Hazard Indices ......................................................................... 6-50 Table 6.3.5 Vulnerability Indices Used for Flood Disaster ................................................ 6-51 Table 6.3.6 Possible Countermeasures for Kecamatans in Kabupaten Padang
Pariaman .......................................................................................................... 6-54 Table 6.3.7 List of technical workshops for counterpart members of Kabupaten
Padang Pariaman including Kota Pariaman .................................................... 6-60 Table 6.3.8 Time schedule of Joint Survey ........................................................................ 6-61 Table 6.4.1 Recent History of Major Flood and Sediment Disasters ................................. 6-63 Table 6.4.2 Major Rivers Flowing through Kota Pariaman ............................................... 6-63 Table 6.4.3 Indices used for creations of flood hazard map ............................................... 6-65 Table 6.4.4 Score Table of Hazard Indices ......................................................................... 6-70 Table 6.4.5 Vulnerability Indices Used for Flood Disaster ................................................ 6-71 Table 6.4.6 Possible Countermeasures for Kecamatans in Kota Pariaman ........................ 6-73
CHAPTER 8 COMMUNITY BASED DISASTER RISK MANAGEMENT
Table 8.2.1 Selected target communities for the survey..................................................... 8-2 Table 8.2.2 Population density and main livelihood of the target communities................. 8-4 Table 8.2.3 Draft Agenda of the Leader Training............................................................... 8-14 Table 8.2.4 Capacity development plan for Kabupaten Jember ......................................... 8-18 Table 8.2.5 Agenda of the First Community Workshop..................................................... 8-20 Table 8.2.6 Agenda of the Second Community Workshop ................................................ 8-22 Table 8.2.7 Job Description of the Committee of Desa Level (draft) ................................ 8-24 Table 8.2.8 Agenda of the Third Community Workshop ................................................... 8-25 Table 8.3.1 Selected target communities for the survey..................................................... 8-29 Table 8.3.2 Agenda of the Leader Training........................................................................ 8-42 Table 8.3.3 Capacity development plan for Kabupaten Padang Pariaman and
Kota Pariaman ................................................................................................. 8-46 Table 8.3.4 Agenda of the First Community Workshop..................................................... 8-48 Table 8.3.5 Agenda of the Second Community Workshop ................................................ 8-50 Table 8.3.6 Agenda of the Third Community Workshop ................................................... 8-53

The Study on Natural Disaster Management in Indonesia
-xii-
List of Figures of Volume 3: Supporting Report
CHAPTER 1 DEVELOPMENT OF GIS DATABASE AND BASICS FOR CREATIONS OF HAZARD MAP AND RISK MAP
Figure 1.2.1 Digital Elevation Model for National Level .................................................... 1-5 Figure 1.2.2 Locations of natural disasters in Indonesia...................................................... 1-6 Figure 1.3.1 Administrative Boundaries in Kabupaten Jember ........................................... 1-8 Figure 1.3.2 Built-up Area in Kabupaten Jember ................................................................ 1-9 Figure 1.3.3 Population Density in Kabupaten Jember........................................................ 1-10 Figure 1.3.4 Building Type Distribution in Kabupaten Jember ........................................... 1-11 Figure 1.3.5 Digital Elevation Model (DEM) for Kabupaten Jember.................................. 1-12 Figure 1.3.6 Slope Map based on Digital Elevation Model (DEM) in Kabupaten Jember ........................................................................................... 1-13 Figure 1.3.7 Land Cover Map for Kabupaten Jember.......................................................... 1-14 Figure 1.4.1 Administration Boundaries in Kabupaten Padang Pariaman........................... 1-17 Figure 1.4.2 Built-Up Areas in Kabupaten Padang Pariaman.............................................. 1-18 Figure 1.4.3 Population Density in Kabupaten Padang Pariaman ....................................... 1-19 Figure 1.4.4 Building Type Distribution in Kabupaten Padang Pariaman ........................... 1-20 Figure 1.4.5 Digital Elevation Model (SRTM) for Kabupaten Padang Pariaman ............... 1-21 Figure 1.4.6 Digital Elevation Model (SPOT) for Kabupaten Padang Pariaman ................ 1-22 Figure 1.4.7 Slope Map based on DEM (SRTM) in Kabupaten Padang Pariaman ............. 1-23 Figure 1.4.8 Land Cover in Kabupaten Padang Pariaman ................................................... 1-24 Figure 1.5.1 Administrative Boundaries in Kota Pariaman ................................................. 1-27 Figure 1.5.2 Built-Up Areas in Kota Pariaman .................................................................... 1-28 Figure 1.5.3 Population Density in Kota Pariaman.............................................................. 1-29 Figure 1.5.4 Building Type Distribution in Kota Pariaman ................................................. 1-30 Figure 1.5.5 Slope Map Based on DEM (SRTM) in Kota Pariaman ................................... 1-31 Figure 1.5.6 Land Cover in Kota Pariaman ......................................................................... 1-32 Figure 1.6.1 Relation among Hazard, Vulnerability and Risk ............................................. 1-34 Figure 1.6.2 Conceptual Flow Chart for Creations of Hazard Maps and Risk Maps .......... 1-35 Figure 1.6.3 Relations among Risk, Hazard, Vulnerability, Indices and Basic Data ........... 1-36 Figure 1.6.4 Population Density Grade in Kabupaten Jember ............................................. 1-37 Figure 1.6.5 Built-up Area Grade in Kabupaten Jember...................................................... 1-38 Figure 1.6.6 Land Cover Grade in Kabupaten Jember......................................................... 1-39 Figure 1.6.7 Vegetation/Cultivated Area Grade in Kabupaten Jember ................................ 1-40 Figure 1.6.8 Population Density Grade in Kabupaten Padang Pariaman............................. 1-41 Figure 1.6.9 Built up Area Grade in Kabupaten Padang Pariaman...................................... 1-42

Final Report
-xiii-
Figure 1.6.10 Grade for Road, Railway in Steep Slope Area in Kabupaten Padang Pariaman .......................................................................................................... 1-43
Figure 1.6.11 Grade for Rice Field & Plantation in Kabupaten Padang Pariaman................ 1-44 Figure 1.6.12 Population Density Grade in Kota Pariaman................................................... 1-45 Figure 1.6.13 Built up Area Grade in Kota Pariaman............................................................ 1-46 Figure 1.6.14 Grade for Road, Railway in Steep Slope Area in Kota Pariaman.................... 1-47 Figure 1.6.15 Grade for Rice Field & Plantation in Steep Slope Area in Kota Pariaman...... 1-48
CHAPTER 2 TOPOGRAPHY AND GEOLOGY IN PILOT REGION Figure 2.1.1 Geomorphological Divisions in Jember .......................................................... 2-1 Figure 2.1.2 Ground Condition Map.................................................................................... 2-5 Figure 2.1.3 Simplified Geologic Column for Seismic Analysis (1) ................................... 2-6 Figure 2.1.4 Simplified Geologic Column for Seismic Analysis (2) ................................... 2-7 Figure 2.1.5 Tectonic Background and Past Earthquake Rapture Zones on
Andaman-Sunda Arc (Thick white arrows indicate the direction of Indian
Ocean-Australian plate movement) .............................................................. 2-9 Figure 2.1.6 Elements of Fault Parameter............................................................................ 2-10 Figure 2.2.1 Topographic Overview of West Sumatra Region ............................................ 2-11 Figure 2.2.2 Geomorphological Map of Kabupaten Padang Pariaman ............................... 2-14 Figure 2.2.3 Ground Condition Map.................................................................................... 2-17 Figure 2.2.4 Liquefaction Potential Map ............................................................................. 2-19 Figure 2.2.5 Major tectonic situation around Sumatra island .............................................. 2-20 Figure 2.2.6 Tectonic Background and Past Earthquake Rapture Zones on
Andaman-Sunda Arc (Thick white arrows indicate the direction of Indian Ocean-Australian plate movement)...................................................... 2-21
Figure 2.2.7 Locked patches offshore Kabupaten Padang Pariaman (Sieh, 2007) .............. 2-22 Figure 2.2.8 Comparison of interseismic coupling along the megathrust with the
rupture areas of the great 1797, 1833, 2005 and 2007 quakes......................... 2-23 Figure 2.2.9 The estimated 1797, 1833 and 2007 fault model and the forecast earthquake (revision of the figure from Natawidjaja et al., 2006)................... 2-24
CHAPTER 3 DISASTER CHARACTERISTICS OF EARTHQUAKE AND COUNTERMEASURES IN PILOT REGIONS
Figure 3.1.1 Sunda Trench ................................................................................................... 3-3 Figure 3.1.2 Relation between Magnitude and Return Period ............................................. 3-5 Figure 3.1.3 Peak Acceleration Value of the Base Rock at Each Part of Indonesia
(From SNI 03-1726-2002 the Indonesian code for seismic load) ................... 3-6

The Study on Natural Disaster Management in Indonesia
-xiv-
Figure 3.1.4 Peak Acceleration Value of the Base Rock and Peak Acceleration Value of Ground Surface ................................................................................. 3-7
Figure 3.1.5 Geomorphological Feature of Surface Layer around Kabupaten Jember........ 3-8 Figure 3.1.6 Segmentation of Soil Class (classified according to stiffness
of surface layer) ............................................................................................... 3-9 Figure 3.1.7 Response Spectrum Stipulated in 03-1726-2002............................................. 3-10 Figure 3.1.8 Expected Value Distribution of Ground Surface Tremor................................. 3-11 Figure 3.1.9 Ratio of the Cause of Death at 1995 Great Hanshin Earthquake..................... 3-12 Figure 3.1.10 Outline of Fragility Function Analysis ............................................................ 3-12 Figure 3.1.11 Outline of Building Model............................................................................... 3-13 Figure 3.1.12 Fragility Function (Relationship between MMI and the Damage Ratio P) ..... 3-14 Figure 3.1.13 Building Damage Per Grid .............................................................................. 3-15 Figure 3.1.14 Building Damage Ratio Per Grid..................................................................... 3-16 Figure 3.1.15 Number of Buildings in Each Survey Unit and Ratio of Each
Building Type .................................................................................................. 3-17 Figure 3.1.16 Timber Made and Bamboo Made .................................................................... 3-18 Figure 3.1.17 Brick Masonry ................................................................................................. 3-18 Figure 3.1.18 Cobble Masonry .............................................................................................. 3-19 Figure 3.1.19 Confined Masonry ........................................................................................... 3-19 Figure 3.1.20 Reinforced Concrete Moment Resisting Frame............................................... 3-20 Figure 3.1.21 Combination of Different Kinds of Construction Methods ............................. 3-20 Figure 3.1.22 Building with no Lintel and Roof Slab............................................................ 3-23 Figure 3.1.23 Destruction by Force in Out-Of-Plane Direction............................................. 3-23 Figure 3.1.24 Example of Connection Part ............................................................................ 3-23 Figure 3.2.1 Sunda Trench ................................................................................................... 3-27 Figure 3.2.2 The Great Sumatran Fault................................................................................ 3-28 Figure 3.2.3 Fault of Solok Earthquake 6 March 2007........................................................ 3-28 Figure 3.2.4 Relation between Magnitude and Return Period ............................................. 3-30 Figure 3.2.5 Peak Acceleration Value of the Base Rock at Each Part of Indonesia
(From SNI 03-1726-2002 the Indonesian code for seismic load).................... 3-31 Figure 3.2.6 PGA Ground Acceleration ............................................................................... 3-32 Figure 3.2.7 Peak Acceleration Value of the Base Rock and Peak Acceleration
Value of Ground Surface ................................................................................. 3-32 Figure 3.2.8 Geomorphological Feature of Surface Layer around Kabupaten Padang
Pariaman .......................................................................................................... 3-33 Figure 3.2.9 Segmentation of Soil Class (classified according to stiffness of surface
layer)................................................................................................................ 3-34

Final Report
-xv-
Figure 3.2.10 Response Spectrum Stipulated in 03-1726-2002............................................. 3-35 Figure 3.2.11 Expected Value Distribution of Ground Surface Tremor................................. 3-36 Figure 3.2.12 Ratio of the Cause of Death at 1995 Great Hanshin Earthquake..................... 3-37 Figure 3.2.13 Outline of Fragility Function Analysis ............................................................ 3-37 Figure 3.2.14 Outline of Building Model .............................................................................. 3-38 Figure 3.2.15 Fragility Function (Relationship between MMI and the damage ratio P) ....... 3-39 Figure 3.2.16 Building Damage Per Grid .............................................................................. 3-40 Figure 3.2.17 Building Damage Ratio Per Grid..................................................................... 3-41 Figure 3.2.18 Building Damage Ratio ................................................................................... 3-42 Figure 3.2.19 Number of Buildings in Each Grid.................................................................. 3-43 Figure 3.2.20 Number of Buildings in Each Survey Unit and Ratio of Each
Building Type .................................................................................................. 3-43 Figure 3.2.21 Timber Made and Bamboo Made .................................................................... 3-44 Figure 3.2.22 Brick Masonry ................................................................................................. 3-44 Figure 3.2.23 Cobble Masonry .............................................................................................. 3-45 Figure 3.2.24 Confined Masonry ........................................................................................... 3-45 Figure 3.2.25 Reinforced Concrete Moment Resisting Frame .............................................. 3-46 Figure 3.2.26 Combination of Different Kinds of Construction Methods ............................. 3-46 Figure 3.2.27 Building with no Lintel and Roof Slab............................................................ 3-49 Figure 3.2.28 Destruction by Force in Out-of-Plane Direction ............................................. 3-49 Figure 3.2.29 Example of Connection Part............................................................................ 3-49 Figure 3.3.1 Sunda Trench ................................................................................................... 3-53 Figure 3.3.2 The Great Sumatran Fault................................................................................ 3-54 Figure 3.3.3 Fault of Solok Earthquake 6 March 2007........................................................ 3-54 Figure 3.3.4 Relation between Magnitude and Return Period ............................................. 3-56 Figure 3.3.5 Peak Acceleration Value of the Base Rock at Each Part of Indonesia
(From SNI 03-1726-2002 the Indonesian code for seismic load) ................... 3-57 Figure 3.3.6 PGA Ground Acceleration ............................................................................... 3-58 Figure 3.3.7 Peak Acceleration Value of the Base Rock and Peak Acceleration
Value of Ground Surface ................................................................................. 3-58 Figure 3.3.8 Geomorphological Feature of Surface Layer around Kota Pariaman.............. 3-59 Figure 3.3.9 Segmentation of Soil Class (classified according to stiffness of
surface layer) ................................................................................................... 3-60 Figure 3.3.10 Response Spectrum Stipulated in 03-1726-2002............................................. 3-61 Figure 3.3.11 Expected Value Distribution of Ground Surface Tremor................................. 3-62 Figure 3.3.12 Ratio of the Cause of Death at 1995 Great Hanshin Earthquake..................... 3-63 Figure 3.3.13 Outline of Fragility Function Analysis ............................................................ 3-63

The Study on Natural Disaster Management in Indonesia
-xvi-
Figure 3.3.14 Outline of Building Model............................................................................... 3-64 Figure 3.3.15 Fragility Function (Relationship between MMI and the damage ratio P) ....... 3-65 Figure 3.3.16 Building Damage Per Grid .............................................................................. 3-66 Figure 3.3.17 Building Damage Ratio Per Grid..................................................................... 3-67 Figure 3.3.18 Number of Buildings in Each Grid .................................................................. 3-68 Figure 3.3.19 Number of Buildings in Each Survey Unit and Ratio of Each Building
Type ................................................................................................................. 3-68 Figure 3.3.20 Timber Made and Bamboo Made .................................................................... 3-69 Figure 3.3.21 Brick Masonry ................................................................................................. 3-69 Figure 3.3.22 Cobble Masonry .............................................................................................. 3-70 Figure 3.3.23 Confined Masonry ........................................................................................... 3-70 Figure 3.3.24 Reinforced Concrete Moment Resisting Frame............................................... 3-71 Figure 3.3.25 Combination of Different Kinds of Construction Methods ............................. 3-71 Figure 3.3.26 Building with no Lintel and Roof Slab............................................................ 3-74 Figure 3.3.27 Destruction by Force in Out-of-Plane Direction.............................................. 3-74 Figure 3.3.28 Example of Connection Part ............................................................................ 3-74
CHAPTER 4 DISASTER CHARACTERISTICS OF TSUNAMI DISASTER AND COUNTERMEASURES IN PILOT REGIONS
Figure 4.1.1 Location and Number of Affected Persons by Tsunami .................................. 4-2 Figure 4.1.2 Tsunami Hazard Zone Map ............................................................................. 4-2 Figure 4.2.1 Location of the Main shock and Aftershock of Sumba Earthquake
(Mw=8.3) of August 19, 1977 and Tsunami Height ........................................ 4-5 Figure 4.2.2 Distributions of Tsunami Heights, Seismic Intensity, and Aftershocks of the 1994 East Java Earthquake................................................ 4-6 Figure 4.2.3 Tide-gauge Records from Kabupaten Banyuwangi ......................................... 4-7 Figure 4.2.4 Tsunami Height and Ground Elevation ........................................................... 4-10 Figure 4.2.5 Damage due to 2006 West Java Earthquake and Tsunami............................... 4-10 Figure 4.2.6 Distribution of Tsunami Height due to 1994 East Java Tsunami..................... 4-11 Figure 4.2.7 Inundated Area due to 1994 East Java Tsunami .............................................. 4-12 Figure 4.2.8 Cross section of the Coast in Desa Kepanjen .................................................. 4-13 Figure 4.2.9 Location-map of the Areas Damaged by 1994 East Java Tsunami.................. 4-14 Figure 4.2.10 Damaged Houses in Watuulo (Payagan).......................................................... 4-15 Figure 4.2.11 Flow of Preparing Tsunami Hazard Map and Tsunami Disaster
Management Map ............................................................................................ 4-17 Figure 4.2.12 Cross Section of Model ................................................................................... 4-20 Figure 4.2.13 Modeling of Time Waveform .......................................................................... 4-21

Final Report
-xvii-
Figure 4.2.14 Inundation Area and Depth Estimated by Level Filling Method (H1) ............. 4-22 Figure 4.2.15 Tsunami Disaster Area in 1994 (H2)................................................................ 4-23 Figure 4.2.16 Inundation Area and Depth Estimated Based on Ground Elevation (H3)........ 4-24 Figure 4.2.17 Tsunami Hazard Map....................................................................................... 4-26 Figure 4.2.18 Population Density (V1)................................................................................... 4-28 Figure 4.2.19 Built-up Area (V2) ........................................................................................... 4-29 Figure 4.2.20 Distance from the Coastline (V3)..................................................................... 4-30 Figure 4.2.21 Tsunami Risk Map........................................................................................... 4-31 Figure 4.2.22 Sand Dune in Watuulo (left) and Forestation (right) ....................................... 4-33 Figure 4.2.23 Present Village of Payagan (left) and High-floored House Reinforced
against Wave (right)......................................................................................... 4-34 Figure 4.2.24 Evacuation Route in Bandialit ......................................................................... 4-35 Figure 4.3.1 Location of Historical Tsunami Source ........................................................... 4-39 Figure 4.3.2 Location Map of Padang City in 1781............................................................. 4-41 Figure 4.3.3 Composite Forward Model for the 1797 Rupture Beneath the Mentawai
Islands.............................................................................................................. 4-41 Figure 4.3.4 Location Map of Padang City in 1781............................................................. 4-43 Figure 4.3.5 Engraving of the 1833 Tsunami....................................................................... 4-43 Figure 4.3.6 Composite Forward Models for the 1833 Rupture Beneath the Mentawai
Islands.............................................................................................................. 4-44 Figure 4.3.7 Epicenter of Off-Sumatra Earthquake and Aftershock Area ........................... 4-46 Figure 4.3.8 Propagation Diagrams of Indian Ocean Tsunami (in hours) ........................... 4-47 Figure 4.3.9 Tide-gauge Records from Sibolga ................................................................... 4-47 Figure 4.3.10 The Main Shock and Aftershock in September 2007 ...................................... 4-49 Figure 4.3.11 Tidal Records in Padang on 12 September...................................................... 4-49 Figure 4.3.12 Tsunami Run-up Height due to 2007 Bengkulu Tsunami................................ 4-50 Figure 4.3.13 Fault Model of Target Earthquake ................................................................... 4-52 Figure 4.3.14 Distribution of Tsunami Height due to 1797 and 1833 Tsunamis ................... 4-53 Figure 4.3.15 Comparison between the Historical Tsunami Heights and Target
Tsunami Height................................................................................................ 4-54 Figure 4.3.16 Cross section of Coast in Pasir baru Kechamatan Sungai Limau.................... 4-54 Figure 4.3.17 Cross section of Model .................................................................................... 4-58 Figure 4.3.18 Inundation Area and Depth Estimated by Level Filling Method (H1) ............. 4-60 Figure 4.3.19 Inundation Area and Depth Estimated Based on Ground Elevation (H3)........ 4-62 Figure 4.3.20 Tsunami Hazard Map....................................................................................... 4-63 Figure 4.3.21 Population Density (V1)................................................................................... 4-65 Figure 4.3.22 Built-up Area (V2) ........................................................................................... 4-66

The Study on Natural Disaster Management in Indonesia
-xviii-
Figure 4.3.23 Distance from the Coastline (V3)..................................................................... 4-67 Figure 4.3.24 Tsunami Risk Map........................................................................................... 4-69 Figure 4.3.25 Planted Trees on the Beach.............................................................................. 4-72 Figure 4.3.26 Present Village of Ulakan (left) and High-floored House Reinforced
against Waves of Ampalu (right) ..................................................................... 4-73 Figure 4.3.27 Distribution of Evacuation Site ....................................................................... 4-75 Figure 4.4.1 Distribution of Tsunami Height due to 1797 and 1833 tsunamis .................... 4-81 Figure 4.4.2 Cross section of Coast in Pondok Kechamatan Pariaman Utara ..................... 4-81 Figure 4.4.3 Cross Section of Model ................................................................................... 4-84 Figure 4.4.4 Inundation Area and Depth Estimated by Level Filling Method (H1) ............. 4-86 Figure 4.4.5 Inundation Area and Depth Estimated Based on Ground Elevation (H3) ........ 4-87 Figure 4.4.6 Tsunami Hazard Map....................................................................................... 4-88 Figure 4.4.7 Population Density (V1)................................................................................... 4-89 Figure 4.4.8 Built-up Area (V2)............................................................................................ 4-90 Figure 4.4.9 Distance from the Coastline (V3)..................................................................... 4-91 Figure 4.4.10 Tsunami Risk Map........................................................................................... 4-93 Figure 4.4.11 Planted Trees on the Beach.............................................................................. 4-96 Figure 4.4.12 High-floored House Reinforced against Wave in Ampalu............................... 4-97 Figure 4.4.13 Distribution of Evacuation Site ....................................................................... 4-98
CHAPTER 5 CHARACTERISTICS OF SEDIMENT DISASTERS AND COUNTERMEASURES IN PILOT REGIONS
Figure 5.1.1 Location of Sediment Disasters and Affected People...................................... 5-2 Figure 5.1.2 Sediment Disaster-prone Areas........................................................................ 5-2 Figure 5.1.3 Sediment Disasters in Indonesia ...................................................................... 5-3 Figure 5.2.1 Map of Rain Stations ....................................................................................... 5-7 Figure 5.2.2 Rain Station in Plantation Area (left); Irrigation Department Rain
Station (right)................................................................................................... 5-8 Figure 5.2.3 Hazard Index Map “Slope (HJ4)”..................................................................... 5-12 Figure 5.2.4 Hazard Index Map “Geology (HJ5)” ................................................................ 5-13 Figure 5.2.5 Distribution Map of Average Annual Rainfall ................................................. 5-14 Figure 5.2.6 Annual Rainfall (HJ6)....................................................................................... 5-15 Figure 5.2.7 Hazard Map for Sediment Disaster in Kabupaten Jember............................... 5-16 Figure 5.2.8 Risk Map for Sediment Disaster...................................................................... 5-18 Figure 5.2.9 Classification of Eight Areas for Disaster Characteristics of Sediment
Disasters........................................................................................................... 5-20 Figure 5.2.10 Priority Areas for Sediment Disaster Countermeasures (S1, S2) .................... 5-21
Final Report
-xix-
Figure 5.2.11 Scene from First Workshop ............................................................................. 5-29 Figure 5.2.12 Scene from Second Workshop......................................................................... 5-29 Figure 5.2.13 Scene from Third Workshop............................................................................ 5-30 Figure 5.2.14 Scene from Fourth Workshop.......................................................................... 5-30 Figure 5.2.15 Scene from Fifth Workshop............................................................................. 5-31 Figure 5.2.16 Scene from Sixth Workshop ............................................................................ 5-31 Figure 5.2.17 Scene from Seventh Workshop........................................................................ 5-32 Figure 5.2.18 Scene from Eighth Workshop.......................................................................... 5-32 Figure 5.3.1 Rain Gauge Station Map.................................................................................. 5-36 Figure 5.3.2 Slope Classification Map using original SPOT Data ...................................... 5-41 Figure 5.3.3 Slope Classification Map using SRTM Data ................................................... 5-41 Figure 5.3.4 Hazard Index Map “Slope (HP4)” .................................................................... 5-42 Figure 5.3.5 Geology Map ................................................................................................... 5-43 Figure 5.3.6 Hazard Index Map “Geology (HP5)”................................................................ 5-44 Figure 5.3.7 Annual Rainfall Distribution Map................................................................... 5-45 Figure 5.3.8 Annual Rainfall Distribution Map (Grade) (HP6) ............................................ 5-45 Figure 5.3.9 Hazard Map for Sediment Disaster in Kabupaten Padang Pariaman .............. 5-46 Figure 5.3.10 Sediment Risk Map for Kabupaten Padang Pariaman..................................... 5-48 Figure 5.3.11 Photograph of the 1st workshop ...................................................................... 5-51 Figure 5.3.12 Photograph of the 2nd workshop..................................................................... 5-52 Figure 5.3.13 Photograph of the 3rd workshop ..................................................................... 5-52 Figure 5.4.1 Rain Gauge Station Map.................................................................................. 5-56 Figure 5.4.2 Slope Classification Map using original SPOT Data ...................................... 5-61 Figure 5.4.3 Slope Classification Map using SRTM Data ................................................... 5-61 Figure 5.4.4 Hazard Index Map “Slope (HP4)” .................................................................... 5-62 Figure 5.4.5 Geology Map ................................................................................................... 5-63 Figure 5.4.6 Hazard Index Map “Geology (HP5)”................................................................ 5-64 Figure 5.4.7 Annual Rainfall Distribution Map................................................................... 5-65 Figure 5.4.8 Annual Rainfall Distribution Map (Grade) (HP6) ............................................ 5-65 Figure 5.4.9 Sediment Disaster Hazard Map ....................................................................... 5-66 Figure 5.4.10 Sediment Disaster Risk Map ........................................................................... 5-68
CHAPTER 6 DISASTER CHARACTERISTICS OF FLOOD DISASTER AND
COUNTERMEASURES IN PILOT REGIONS Figure 6.1.1 Location and Number of Affected Persons by Flood ...................................... 6-3 Figure 6.1.2 Flood Hazard Area........................................................................................... 6-3 Figure 6.2.1 Natural Disaster Map of Kabupaten Jember.................................................... 6-5

The Study on Natural Disaster Management in Indonesia
-xx-
Figure 6.2.2 Main rivers in Kabupaten Jember.................................................................... 6-6 Figure 6.2.3 Flood Area Map based on natural disaster map published by National
Unity and Public Protection Board .................................................................. 6-9 Figure 6.2.4 Kecamatans which were suffered from the flood disasters from Jan.
’07 to Jan. ’08 provided by National Unity and Public Protection Board ....... 6-10 Figure 6.2.5 Flood area investigated by Irrigation Agency for the year of 2006 ................. 6-11 Figure 6.2.6 Flood area map provided by Irrigation Board of Lumajang ............................ 6-12 Figure 6.2.7 Flood hazard map for Kabupaten Jember ........................................................ 6-14 Figure 6.2.8 Flood risk map for Kabupaten Jember............................................................. 6-16 Figure 6.2.9 Classification of eight (8) areas for disaster characteristics of sediment and
flood disasters (corresponding to Table 6.2.4)................................................. 6-18 Figure 6.2.10 Areas which suffered seriously from flood and sediment disasters................. 6-21 Figure 6.2.11 Steps for realization of “Safe Kabupaten Jember against Water-Related
Disasters”......................................................................................................... 6-30 Figure 6.2.12 Establishment and improvement of the system for disaster data collection
and storage....................................................................................................... 6-32 Figure 6.2.13 Analysis based on the storage data .................................................................. 6-33 Figure 6.2.14 Relation between landslide occurrence and daily rainfall at Dam
Klatakan rainfall station (based on the data from 2000 to 2006)..................... 6-35 Figure 6.2.15 Daily rainfall at Dam Klatakan station at the time of sediment disaster
at Kechamatan Panti from Dec. 14 ’05 to Jan. 2 ’06 ....................................... 6-35 Figure 6.2.16 Handmade rainfall gauge made of bamboo ..................................................... 6-36 Figure 6.2.17 Workshop on Sep. 7th, ’07............................................................................... 6-38 Figure 6.2.18 Answer results to Q1 ....................................................................................... 6-39 Figure 6.2.19 Answer results to Q2 ....................................................................................... 6-39 Figure 6.3.1 Natural Disaster Map of Kabupaten Padang Pariaman ................................... 6-42 Figure 6.3.2 Past Flood Disaster Area (2003 - 2007)........................................................... 6-42 Figure 6.3.3 River basins in Kabupaten Padang Pariaman .................................................. 6-43 Figure 6.3.4 Hazard Index Map “Flatness”.......................................................................... 6-46 Figure 6.3.5 Alluvium land .................................................................................................. 6-47 Figure 6.3.6 Hazard Index Map “Alluvium land”................................................................ 6-47 Figure 6.3.7 Hazard Index Map “Flood Depth”................................................................... 6-48 Figure 6.3.8 Hazard Index Map “Flood Duration” .............................................................. 6-49 Figure 6.3.9 Flood Hazard Map for Kabupaten Padang Pariaman ...................................... 6-51 Figure 6.3.10 Flood Risk Map for Kabupaten Padang Pariaman........................................... 6-52 Figure 6.3.11 Possible Countermeasures against Flood Disaster for Kabupaten Padang
Pariaman .......................................................................................................... 6-53

Final Report
-xxi-
Figure 6.3.12 Steps for realization of “Safe Kabupaten Padang Pariaman and Kota Pariaman against Water-Related Disasters”..................................................... 6-56
Figure 6.3.13 Establishment and improvement of the system for disaster data collection and storage ...................................................................................... 6-58
Figure 6.3.14 Analysis based on the storage data .................................................................. 6-59 Figure 6.3.15 Route of Joint Survey ...................................................................................... 6-62 Figure 6.3.16 Pictures during Joint Survey on Jul. 3rd, ’08................................................... 6-62 Figure 6.4.1 Hazard Index Map “Flatness”.......................................................................... 6-66 Figure 6.4.2 Alluvium land.................................................................................................. 6-67 Figure 6.4.3 Hazard Index Map “Alluvium land” ............................................................... 6-67 Figure 6.4.4 Hazard Index Map “Flood Depth”................................................................... 6-68 Figure 6.4.5 Hazard Index Map “Flood Duration” .............................................................. 6-69 Figure 6.4.6 Flood Hazard Map for Kabupaten Padang Pariaman ...................................... 6-71 Figure 6.4.7 Flood Risk Map for Kota Pariaman................................................................. 6-72
CHAPTER 7 EARLY WARNING SYSTEM Figure 7.2.1 General Concept of Meteorological Early Warning System (MEWS)............ 7-2 Figure 7.2.2 Regional Division for Meteorological Early Warning System by BMG......... 7-2 Figure 7.2.3 Concept of Information/Warning Dissemination System................................ 7-3 Figure 7.2.4 Earthquake Information and Tsunami Warning Center ................................... 7-3
CHAPTER 8 COMMUNITY BASED DISASTER RISK MANAGEMENT Figure 8.2.1 Location of the Target communities for Survey .............................................. 8-3 Figure 8.2.2 Distribution of Respondents ............................................................................ 8-5 Figure 8.2.3 Possession of Communication & Transportation Devices............................... 8-5 Figure 8.2.4 Social Capital Condition.................................................................................. 8-6 Figure 8.2.5 Leadership in the communities........................................................................ 8-7 Figure 8.2.6 How are important decision made? ................................................................. 8-7 Figure 8.2.7 Who should solve community issues?............................................................. 8-7 Figure 8.2.8 Main Issues (Selection of 1st Issue, 2nd Issue, and 3rd Issue)........................ 8-8 Figure 8.2.9 Experience of Disasters and Risk Recognition by Respondents ..................... 8-9 Figure 8.2.10 Current condition of disaster risk management in the target communities ..... 8-10 Figure 8.2.11 Organization Structure of Public Protections Unit in Village/Sub-District ..... 8-11 Figure 8.2.12 Disaster knowledge and source of the knowledge........................................... 8-11 Figure 8.2.13 Public awareness on disaster reduction ........................................................... 8-12 Figure 8.2.14 Current condition of disaster education........................................................... 8-12 Figure 8.2.15 Lecture session of the program (left) / Group photo of participants (right) .... 8-13
The Study on Natural Disaster Management in Indonesia
-xxii-
Figure 8.2.16 Town watching (left) / Hazard mapping exercise (right)................................. 8-14 Figure 8.2.17 Population of Desa Kemiri by Age.................................................................. 8-15 Figure 8.2.18 Distribution of educational level of Desa Kemiri residents............................. 8-16 Figure 8.2.19 Trifold leaflets for flood, sediment disasters, earthquake, and Tsunami.......... 8-17 Figure 8.2.20 Opening Session (left)/ Group photo of the participants ................................. 8-20 Figure 8.2.21 Town Watching (left)/ Community Hazard Mapping (right)........................... 8-21 Figure 8.2.22 Opening Session (left)/ Group photo of the participants ................................. 8-22 Figure 8.2.23 Creation of Simple Rain Gauge (left)/ Community Hazard Map
Finalization (right) ........................................................................................... 8-23 Figure 8.2.24 Designated Committee of Desa Level (to be finalized)................................... 8-23 Figure 8.2.25 Village Committee Meeting (left)/ Evacuation map developed by
community ....................................................................................................... 8-25 Figure 8.2.26 Observation information reached to Desa office (left)/ Warning to
community by Kentongan (right) .................................................................... 8-26 Figure 8.2.27 Running to the evacuation site (left)/ Evaluation by SATLAK
Kab. Jember (right).......................................................................................... 8-26 Figure 8.3.1 Location of the Target communities for Survey .............................................. 8-30 Figure 8.3.2 Distribution of Respondents ............................................................................ 8-32 Figure 8.3.3 Ownership of Communication Devices........................................................... 8-33 Figure 8.3.4 Communication tool for emergency ................................................................ 8-33 Figure 8.3.5 Social Capital Condition.................................................................................. 8-34 Figure 8.3.6 Leadership in the communities ........................................................................ 8-34 Figure 8.3.7 How to make important decision? ................................................................... 8-35 Figure 8.3.8 Who should solve community issues? ............................................................. 8-35 Figure 8.3.9 Main Issues ...................................................................................................... 8-36 Figure 8.3.10 Experience of Disasters by Respondents ......................................................... 8-37 Figure 8.3.11 Current condition of disaster risk management in the target communities...... 8-38 Figure 8.3.12 Disaster knowledge of resident........................................................................ 8-38 Figure 8.3.13 Public awareness on disaster reduction ........................................................... 8-39 Figure 8.3.14 Current condition of disaster education ........................................................... 8-39 Figure 8.3.15 Building type ................................................................................................... 8-40 Figure 8.3.16 Structural elements of residence ...................................................................... 8-40 Figure 8.3.17 Main material of residence .............................................................................. 8-40 Figure 8.3.18 Lecture session of the program (left) / Group photo of participants (right) .... 8-42 Figure 8.3.19 Town watching (left) / Hazard mapping exercise (right)................................. 8-43 Figure 8.3.20 Trifold leaflets for earthquake, Tsunami, flood and sediment disasters........... 8-45 Figure 8.3.21 Opening Session (left)/ Group photo of the participants ................................. 8-48

Final Report
-xxiii-
Figure 8.3.22 Town Watching (left)/ Community Hazard Mapping (right)........................... 8-49 Figure 8.3.23 Opening Session (left)/ Discussion on lecture (right)...................................... 8-50 Figure 8.3.24 First aid training .............................................................................................. 8-51 Figure 8.3.25 Lecture of retrofitting (left)/ draft community (right) ..................................... 8-52 Figure 8.3.26 Discussion on Lecture (left)/ Town-Watching Program (right) ....................... 8-53 Figure 8.3.27 Discussion on Lecture (left)/ Closing Session (right)...................................... 8-55

The Study on Natural Disaster Management in Indonesia
-xxiv-
List of Photos of Volume 4: Supporting Report CHAPTER 2 TOPOGRAPHY AND GEOLOGY IN PILOT REGION
Photo 2.1.1 Latosol at Kecamatan Panti ............................................................................. 2-4 CHAPTER 7 EARLY WARNING SYSTEM
Photo 7.3.1 Observation Equipments in Jubung Station..................................................... 7-6 Photo 7.3.2 Drum put in Houses and the Rhythm Pattern by Types of Information .......... 7-6 Photo 7.3.3 Drum put in Houses and the Rhythmic Pattern by Type of Information ......... 7-8

Final Report
-xxv-
Abbreviations
Terms Bahasa English
APBN Anggaran Pendapatan dan Belanja Negara State Annual Budget APBN-P APBN - Perubahan Revision of APBN– normally in October APBD Anggaran Pendapatan dan Belanja Daerah Local government annual budget BAKORNAS PB Badan Koordinasi Nasional Penanganan
Bencana National Coordinating Board for Disaster Management
BAKOSURTANAL Badan Koordinasi Survei dan Pemetaan National Coordination Agency for Survey & MappingBAPPENAS Badan Perencanaan Pembangunan Nasional National Development Planning Agency BKKBN Badan Koordinator Keluarga Berencana
Nasional National Coordinator Agency for Family Planning
BMG Badan Meteorologi dan Geofisika Agency of Meteorology and Geophysics BNPB Badan Nasional Penanggulangan Bencana
Alam National Agency for Disaster Management
BOS Bantuan Operasional Sekolah School operational fund BPHTB Bea Perolehan Hak atas Tanah dan/Bangunan Tax on every land & building transaction BPPT Badan Pengkajian dan Penerapan Teknologi Agency for Assessment and Application of
Technology BPS Badan Pusat Statistik Statistic Indonesia BRR NAD & Nias Badan Rehabilitasi dan Rekonstruksi Nangroe
Aceh Darusallam & Nias Agency of Rehabilitation and Reconstruction for the Region and Community of Aceh and Nias
CPI Indeks Harga Konsumen (IHK) Consumer Price Index DEPDAGRI Departemen Dalam Negeri Department of Home Affairs DEPDIKNAS Departemen Pendidikan Nasional Department of National Education DEPKES Departemen Kesehatan Department of Health DEPHAN Departemen Pertahanan Department of Defense DIPA Daftar Isian Pelaksanaan Anggaran Spending Warrant DKP Departemen Kelautan dan Perikanan Department of Marine and Fisheries Affairs DPD Dewan Perwakilan Daerah Council of Region Representative (Senator) DPR Dewan Perwakilan Rakyat House of Representative (Parliament) ESDM Departemen Energi dan Sumber Daya Mineral Department of Energy and Mineral Resources GDP Produk Domestik Bruto (PDB) Gross Domestic Product INPRES Instruksi Presiden Presidential Instruction KEPPRES Keputusan Presiden Presidential Decree LAPAN Lembaga Penerbangan dan Antariksa Nasional National Institute of Aeronautics and Space LIPI Lembaga Ilmu Pengetahuan Indonesia Indonesian Institute of Science) MPR Majelis Permusyawarahan Rakyat People’s Consultative Assembly NSPM Norma,Standart, Pedoman, Manual Norm, Standardization, Guideline and Manual PBB Pajak Bumi dan Bangunan Land & Building Tax PERDA Peraturan Daerah Local Government Regulation PERMEN Peraturan Menteri Ministerial Regulation PERPRES Peraturan Presiden Presidential Regulation PERPU Peraturan Pengganti Undang-Undang Government Regulation in Lieu of Law PP Peraturan Pemerintah Government Regulation PPh Pajak Penghasilan Income Tax PPN Pajak Pertambahan Nilai Value Added Tax (VAT) PPnBM Pajak Pertambahan Nilai Barang Mewah Luxurious Goods VAT PT. KAI PT. Kereta Api Indonesia State owned Train company PT. PELNI PT. Pelayaran Nasional Indonesia State owned Shipping Company PT. Pos Indonesia PT. Pos Indonesia Indonesian Post PU Departemen Pekerjaan Umum Department of Public Works RAPBN Rancangan APBN Draft of APBN RKA-KL Rencana Kerja Anggaran –
Kementrian/Lembaga Ministries/Agencies annual working plan
UUD 1945 Undang-Undang Dasar 1945 Constitution UU Undang-Undang Law

Final Report
1-1
CHAPTER 1 DEVELOPMENT OF GIS DATABASE AND BASICS FOR CREATIONS OF HAZARD MAP AND RISK MAP
This chapter explains the profiles of GIS database systems, which will be given to the counterpart organizations (BNPB, Kabupaten Jember, Kabupaten Padang Pariaman and Kota Pariaman) at the end of the JICA project. The hazard maps and risk maps prepared in this study cover the pilot regions (Kabupaten Jember, Kabupaten Padang Pariaman and Kota Pariaman) using the GIS database for Earthquake, Tsunami disaster, Sediment disaster and Flood disaster. The basics for creations of hazard map and risk map are also explained as well as the definitions of risk, hazard and vulnerability, and the GIS layers, which are the vulnerability indices (e.g. Population density, Built-up Area, etc.).
1.1 GIS database system turned over to counterpart organizations A comprehensive GIS database was developed to grasp the current conditions of the four areas of interest of the study: namely, Indonesia at the national level, Kabupaten Jember, Kabupaten Padang Pariaman and Kota Pariaman. The database covers, in varying levels of detail, the administrative, natural, social, land cover, infrastructure, disaster and hazard conditions of the study areas. The database also supports the various analyses being conducted by multi-disciplinary experts of the study team. GIS database systems were established in the project offices in Jakarta and Kabupaten Jember, Kota Pariaman and Kabupaten Padang Pariaman, with GIS operators hired locally at each office to support the study team’s experts. The GIS database systems will be turned over to Indonesian counterpart organizations (BNPB, Kabupaten Jember, Kabupaten Padang Pariaman and Kota Pariaman) at the end of the JICA project. The study team used ArcGIS Ver 9.2 software, developed by ESRI, installed in each workstation. The GIS database was used to organize data from the hazard and risk mapping activities during the study. The system consists of hardware (e.g. Desktop Computer, Printer, etc.) and software (e.g. GIS software, etc.). The inventory of equipment turned over to counterpart organizations including GIS database systems is shown in Table 1.1.1. It should be noted that GPS units and satellite images will only be turned over to Kabupaten Jember, Kabupaten Padang Pariaman and Kota Pariaman.

The Study on Natural Disaster Management in Indonesia
1-2
Table 1.1.1 Inventory of equipment turned over to each counterpart organization
No. Items Quantity
1 Desktop Computer with LCD Monitor 20" Dell Inspiron 530S 2
2 Computer Software WINDOWS XP Professional 2
3 Computer Software Microsoft Office Professional 2007 2
4 Computer Software Norton AntiVirus 2008 2
5 Computer Software Arc GIS (Arc View) 9.2 1
6 Inkjet Printer HP Bussiness Inkjet 2800 1
7 Laser Printer HP LaserJet 5200L Series 1
8 Copy Machine Xerox Document Centre 285 1
9 Scanner HP Scanjet G4010 1
10 Mobile GPS GARMIN GPS76 1
11 Satellite Images 1 set
The following tables summarize the contents of the GIS database.

Final Report
1-3
Table 1.1.2 Data List in the GIS Workstations (1)
Layer Particulars Source Scale Year FeatureType
CoordinateSystem
Administrative Indonesia Propinsi Provincial Boundaries Bakosurtanal 1:250,000 2005 Polygon GCSKabupaten District Boundaries Bakosurtanal 1:250,000 2005 Polygon GCSPlaceNames Bakosurtanal 2005 Polygon GCSProvinsi Provincial Boundaries BPS 2005 Polygon GCSKabupaten District Boundaries BPS 2005 Polygon GCS
Jember, East Java Kabupaten District Boundaries Bakosurtanal 1:25,000 2002 Polygon UTM49SKecamatan Sub-district Boundaries Bakosurtanal 1:25,000 2002 Polygon UTM49SDesa Village Boundaries Bakosurtanal 1:25,000 2002 Polygon UTM49S
Kota Pariaman andKabupaten PadangPariaman, WestSumatra
Population and Building data perAdministrative Unit
Contains population and building data perAdministrative unit. Administrative Unit isbased on the best available detail the JSTwas able to collect. It may be byKecamatan, or Nagari
JST 2008 Polygon UTM47S
Desa Boundaries Desa Boundaries from BPS BPS 2008 Polygon UTM47SKota/Kabupaten Boundaries Kota/Kabupaten Boundaries Bappeda 2008 Polygon UTM47SKecamatan BoundariesKabupaten Padang Pariaman
Bappeda 2008 Polygon UTM47S
Kecamatan Boundaries KotaPariaman
Bappeda 2008 Polygon UTM47S
Nagari Boundaries Bappeda 2008 Polygon UTM47SIslands Bappeda 2008 Polygon UTM47S
Natural Conditions Indonesia Digital Elevation Model (ETOPO) Elevations from ETOPO2v2 (2006)database
US NationalGeophysicalData Center
Elevation @2minintervals
2006 Raster GCS
Water Bodies Bakosurtanal LineJember, East Java Contour Bakosurtanal 1:25,000 Line UTM49S
Spot Elevation Bakosurtanal 1:25,000 Point UTM49SContours along Shoreline Enhanced contours along shoreline
processed from Spot Elev & availablecontour data
Bakosurtanal &JICA StudyTeam
1:25,000 Line UTM49S
Water Bodies Bakosurtanal 1:25,000 Polygon UTM49SDigital Elevation Model DEM generated from 1:25,000 topo map Bakosurtanal 1:25,000 Raster UTM49SSlope Slope map generated from 1:25,000 topo
mapBakosurtanal 1:25,000 Raster UTM49S
Ground Condition Soil Class Types JICA StudyTeam
2007 Polygon UTM49S
Geology Pusat SurveiGeologi BadanGeologi
1:100,000 Polygon UTM49S
Kota Pariaman andKabupaten PadangPariaman, WestSumatra
Aquifer Locations Aquifer Locations MACVINS Polygon UTM47SBathimetry Bathimetry MCRMP UTM47SContour Contour Bakosurtanal
1:250,000 Topo1:250,000 Line UTM47S
Contour Contour DITTOP TNI1:50,000 Topo
1:50,000 Line UTM47S
Digital Elevation Model (SRTM) Hole-filled seamless Shuttle RadarTopography Mission Data Version 3
InternationalCentre forTropicalAgriculture(CIAT)
Elevation @90mintervals
2000 Raster UTM47S
Digital Elevation Model (SPOT) Digital Elevation Model (SPOT) SPOT Image Elevation @20mintervals
2008 Raster UTM47S
Faults and Lineaments Faults and Lineaments JST 2008 Line UTM47SGeomorphology Geomorphology JST 2008 Polygon UTM47SRainfall Stations Rainfall Stations PSDA Point UTM47SRainfall Stations Rainfall Stations JST 2008 Point UTM47SWatershed Boundaries Watershed Boundaries PSDA Polygon UTM47SRiver Branches River Branches JST Line UTM47SMain Rivers Main Rivers JST Line UTM47SRiver Polygons River Polygons DITTOP TNI
1:50,000 TopoPolygon UTM47S
Slope Failure Lines Slope Failure Lines JST 1:50,000 2008 Line UTM47SLakes and Water Bodies Lakes and Water Bodies DITTOP TNI
1:50,000 Topo1:50,000 Polygon UTM47S
Shoreline Shoreline DITTOP TNI1:50,000 Topo
1:50,000 Line UTM47S
Hazard Indonesia Indonesia Disaster Events CRED 1900~ GCSFlood Hisorical Flood Areas Bakosurtanal 1:250,000 2007 GCSLandslides Hisorical Landslide Areas Bakosurtanal 1:250,000 2007 GCSEarthquake Seismicty 1973-2007 USGS 2007 GCSTsunami Tsunami RunUp BMG 1:6,000,000 GCSFaults Active Faults BMG 1:6,000,000 2002 GCS
Jember Jember Disaster Events Database of Disasters in Jember JICA StudyTeam Survey
1:25,000 2007 Polygon GCS
Flood Hazard Map Bakesbang 2007 Polygon UTM49SFlood Hazard Map Dinas
Pengairan(IrrigationAgency)
2006 Polygon UTM49S
Flood Hazard Map PU website Polygon UTM49SFlood Hazard Map Departamen
Pertanian(Agriculture)
2004 Polygon UTM49S
Flood Hazard Location JICA StudyTeam Survey
2007 Point UTM49S
Landslide Hazrd Map Bakesbang 2007 Polygon UTM49SLandslide Hazard map PU website Polygon UTM49STsunami Hazard Map Bakesbang 2007 Polygon UTM49SCyclone Hazard Map Bakesbang 2007 Polygon UTM49SFire Hazard Map Bakesbang 2007 Polygon UTM49SClimate Prediction Zone(Rainfall)
BMG 2007 Polygon UTM49S
Kota Pariaman andKabupaten PadangPariaman, WestSumatra
Coastal Ersion Coastal Ersion MCRMP Polygon UTM47S
Coastal Ersion Coastal Ersion MCRMP Polygon UTM47SCoastal Ersion Coastal Ersion MCRMP Polygon UTM47SHistorical Earthquakes Historical Earthquakes MCRMP Points UTM47SEarthquake Zones Earthquake Zones MCRMP Polygon UTM47SFaults Faults MCRMP Line UTM47SFlooded Areas Flooded Areas PSDA Polygon UTM47SFlooded Areas Flooded Areas BAPPEDA Polygon UTM47SGeohazard Lines Geohazard Lines MCRMP Polygon UTM47SDistance To Coastlines Distance To Coastlines JST Polygon UTM47SEarthquake Incidence Earthquake Incidence MACVINS Polygon UTM47SFlooding Incidence Flooding Incidence MACVINS Polygon UTM47SLandslide Incidence Landslide Incidence MACVINS Polygon UTM47STide Rising Incidence Tide Rising Incidence MACVINS Polygon UTM47STide Incidence Tide Incidence MACVINS Polygon UTM47SPGA at Base Rock PGA at Base Rock BSN Polygon UTM47SPotential Disater by Sub District Potential Disater by Sub District MACVINS Polygon UTM47S
Flood Potential Flood Potential MACVINS Polygon UTM47SLandslide Potential Landslide Potential MACVINS Polygon UTM47STide Potential Tide Potential MACVINS Polygon UTM47SSeismic Hazard Seismic Hazard JST Polygon UTM47STsunami Hazard Tsunami Hazard BAPPEDA Polygon UTM47S
Coverage

The Study on Natural Disaster Management in Indonesia
1-4
Table 1.1.3 Data List in the GIS Workstations (2)
Layer Particulars Source Scale Year FeatureType
CoordinateSystem
Land Conditions Jember, East Jawa Land Cover Land Cover data extracted from topo map Bakosurtanal 1:25,000 1999 Polygon UTM49S
Kota Pariaman andKabupaten PadangPariaman, WestSumatra
Urban Area Urban Area BPN 2000 Polygon UTM47S
Land Cover Map Land Cover Map BAPPEDA 2007 PolygonSocio-economic Geographic Statistical Data by Desa BPS - Jember 2005 Table
Administrative Statistical Data by Desa BPS - Jember 2005 TableDemography Statistical Data by Desa BPS - Jember 2005 TableSocial Statistical Data by Desa BPS - Jember 2005 TableFinacial Statistical Data by Desa BPS - Jember 2005 TableEconomic Statistical Data by Desa BPS - Jember 2005 Table
Infrastructure Indonesia Roads Bakosurtanal Line GCSJember, East Jawa Roads Road centerlines Bakosurtanal 1:25,000 1999 Line UTM49S
Irrigation Channels Irrigation channel centerlines Bakosurtanal 1:25,000 1999 Line UTM49SRailways Railway centerlines Bakosurtanal 1:25,000 1999 Line UTM49S
Kota Pariaman andKabupaten PadangPariaman, WestSumatra
Airport Shape MCRMP Polygon U47SAirport Location MCRMP Point U47SBridge Locations JST Point U47SRailway Locations MCRMP Line U47SRoads and Railways MCRMP Line U47SShipping lanes MCRMP Line U47SIrrigation Points BAPPEDA Point U47S
Building Jember, East Jawa Buildings Symbolized Individual or Groups ofBuildings
Bakosurtanal 1:25,000 1999 Polygon UTM49S
Building Counts by Desa Total Building counts by desa BAPEMAS -BadanPemberdayaanMasyarakat(SocietyCultivationBoard)
2006 Table
Kota Pariaman andKabupaten PadangPariaman, WestSumatra
Historical Buildings Historical Buildings MCRMP Point UTM47S
Hotels Hotels MCRMP Point UTM47SImagery Jember, East Jawa Satellite Image ALOS satellite Imagery RESTEC Raster
Kota Pariaman andKabupaten PadangPariaman, WestSumatra
Satellite Image SPOT satellite Imagery SPOT Raster
Landmarks Jember, East Jawa Landmark Point Data Schools, government buildings, mosquesetc
Bakosurtanal 1:25,000 1999 Point UTM49S
Abbreviations ALOS: Advanced Land Observing Satellite BAKOSURTANAL: Badan Koordinasi Survei dan Pemetaan Nasional BAPEMAS: Badan Pemberdayaan Masyarakat (Society Cultivation Board) BAPPEDA: Badan Percanaan Pembangunan Daerah BMG: Badan Meteorologi Dan Geofisika BPN: Badan Pertanahan Nasional BPS: Badan Pusat Statistik BSN: PGA map - Badan Standardisasi Nasional DITTOP TNI: Direktorat Topografi TNI (Indonesian Army Topography Directorate) GCS: Geographic Coordinate System JST: JICA Study Team MCRMP: Marine Coastal Management Project NASA: National Aeronautics and Space Administration (USA) NGDC: National Geophysical Data Center (USA) PSDA: Pengelolaan Sumber Daya Air (Water Resources Management, Province of West Sumatra) PSGBG: Pusat Survei Geologi Badan Geologi PU: Dinas Pekerjaan Umum RESTEC: Remote Sensing Technology Center (Japan) SRTM: Shuttle Radar Topography Mission USGS: US Geological Survey UTM: Universal Transverse Mercator
Coverage
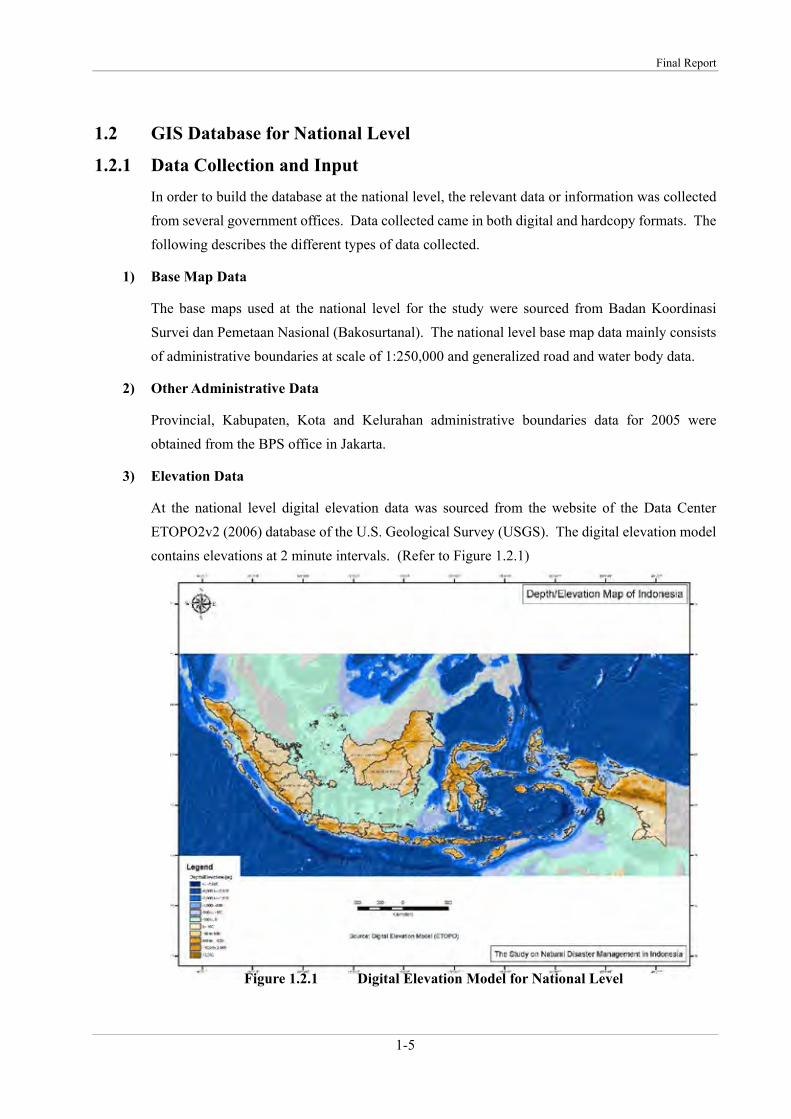
Final Report
1-5
1.2 GIS Database for National Level
1.2.1 Data Collection and Input In order to build the database at the national level, the relevant data or information was collected from several government offices. Data collected came in both digital and hardcopy formats. The following describes the different types of data collected.
1) Base Map Data
The base maps used at the national level for the study were sourced from Badan Koordinasi Survei dan Pemetaan Nasional (Bakosurtanal). The national level base map data mainly consists of administrative boundaries at scale of 1:250,000 and generalized road and water body data.
2) Other Administrative Data
Provincial, Kabupaten, Kota and Kelurahan administrative boundaries data for 2005 were obtained from the BPS office in Jakarta.
3) Elevation Data
At the national level digital elevation data was sourced from the website of the Data Center ETOPO2v2 (2006) database of the U.S. Geological Survey (USGS). The digital elevation model contains elevations at 2 minute intervals. (Refer to Figure 1.2.1)
Figure 1.2.1 Digital Elevation Model for National Level

The Study on Natural Disaster Management in Indonesia
1-6
4) Hazard Data
Hazard data were collected from several sources. At the national level, maps showing flood and landslide hazard were obtained from Bakosurtanal. Tsunami and seismic hazard maps were obtained from Badan Meteorologi Dan Geofisika (BMG).
5) Disaster Data
At the national level, a table listing historical disasters from 1907 to 2007 was obtained from EM-DAT: The OFDA/CRED International Disaster Database. Records from the EM-DAT table were then plotted using the Bakosurtanal Indonesia base map to create a GIS map. This database contains different types of natural disasters such as, earthquake, flood, landslide, wind storm, wave/surge and volcano. The thematic map produced from this data shows the distribution of the different types of disasters that occurred in Indonesia in the past. (Refer to Figure 1.2.2)
Figure 1.2.2 Locations of natural disasters in Indonesia
1.2.2 Data Integration Data collected from the different sources were then integrated into the GIS database. Data integration mainly consists of converting hardcopy data to digital form and processing digital data to conform uniform standards adopted in the study. The GIS data format adopted for the study is ESRI shapefile format. At the national level the coordinate system used Geographic Coordinate System with WGS 84 as datum.
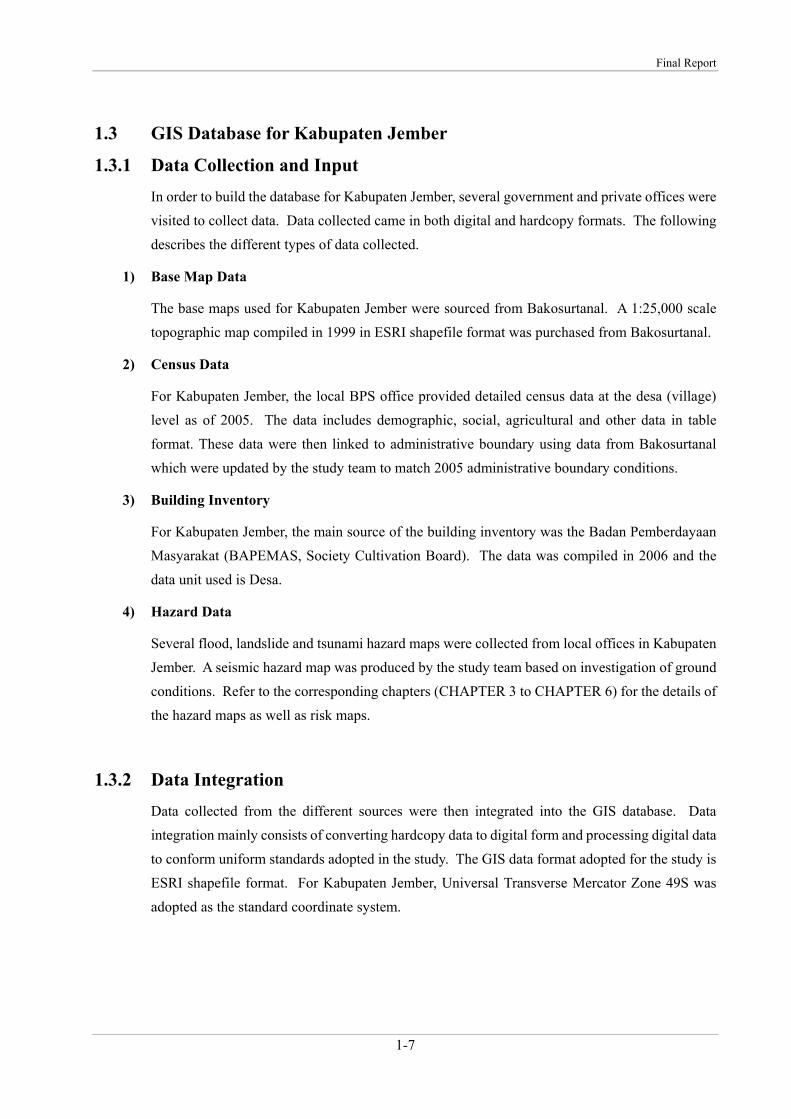
Final Report
1-7
1.3 GIS Database for Kabupaten Jember
1.3.1 Data Collection and Input In order to build the database for Kabupaten Jember, several government and private offices were visited to collect data. Data collected came in both digital and hardcopy formats. The following describes the different types of data collected.
1) Base Map Data
The base maps used for Kabupaten Jember were sourced from Bakosurtanal. A 1:25,000 scale topographic map compiled in 1999 in ESRI shapefile format was purchased from Bakosurtanal.
2) Census Data
For Kabupaten Jember, the local BPS office provided detailed census data at the desa (village) level as of 2005. The data includes demographic, social, agricultural and other data in table format. These data were then linked to administrative boundary using data from Bakosurtanal which were updated by the study team to match 2005 administrative boundary conditions.
3) Building Inventory
For Kabupaten Jember, the main source of the building inventory was the Badan Pemberdayaan Masyarakat (BAPEMAS, Society Cultivation Board). The data was compiled in 2006 and the data unit used is Desa.
4) Hazard Data
Several flood, landslide and tsunami hazard maps were collected from local offices in Kabupaten Jember. A seismic hazard map was produced by the study team based on investigation of ground conditions. Refer to the corresponding chapters (CHAPTER 3 to CHAPTER 6) for the details of the hazard maps as well as risk maps.
1.3.2 Data Integration Data collected from the different sources were then integrated into the GIS database. Data integration mainly consists of converting hardcopy data to digital form and processing digital data to conform uniform standards adopted in the study. The GIS data format adopted for the study is ESRI shapefile format. For Kabupaten Jember, Universal Transverse Mercator Zone 49S was adopted as the standard coordinate system.

The Study on Natural Disaster Management in Indonesia
1-8
1.3.3 Examples of GIS Layer 1) Administrative Boundary
The admistrative boundaries for Kabupaten Jember mainly came from the 1:25,000 base maps (as of 1999) produced by Bakosurtanal. For the purpose of the study, the administrative boundaries from Bakosurtanal was updated by the study team using data from Kecamatans in Kabupaten Jember to match administrative boundary conditions used by the BPS in its survey in 2005.
Figure 1.3.1 Administrative Boundaries in Kabupaten Jember

Final Report
1-9
2) Built-up Area
Built-up area, where buildings are densely constructed and population density are higher, for Kabupaten Jember was taken from the land cover map compiled by Bakosurtanal in 1999. The area in red indicates the built-up area.
Figure 1.3.2 Built-up Area in Kabupaten Jember

The Study on Natural Disaster Management in Indonesia
1-10
3) Population Density
Census data for Kabupaten Jember was compiled by BPS local office in Jember in 2005. For the purpose of the study, the administrative boundaries from Bakosurtanal was updated by the study team using data obtained from Kecamatans in Kabupaten Jember to match administrative boundary conditions used by the BPS in its survey in 2005. To produce a net population density map, population data were then distributed to built-up areas of Kabupaten Jember. As shown in the map, Kecamatan Patrang, Kecamatan Kaliwates and Kecamatan Sumbersari belong to relatively higher populated area (more than 100 pop./ha).
Figure 1.3.3 Population Density in Kabupaten Jember

Final Report
1-11
4) Building Type
For Kabupaten Jember, the main source of the building inventory was the Badan Pemberdayaan Masyarakat (BAPEMAS, Society Cultivation Board). The data was compiled in 2006 and the data unit used is “desa (village)”. To produce a building type distribution map, the building data was summarized by Kecamatan.
Figure 1.3.4 Building Type Distribution in Kabupaten Jember

The Study on Natural Disaster Management in Indonesia
1-12
5) Elevation (DEM)
A digital elevation model was compiled by the study team using contour and spot elevation data taken from the 1:25,000 scale topographic map produced by Bakosurtanal. The digital elevation model (DEM) contains elevations at 50 m intervals.
Figure 1.3.5 Digital Elevation Model (DEM) for Kabupaten Jember

Final Report
1-13
6) Slope
Based on the digital elevation model (as shown in Figure 1.3.5) produced by the study team, a slope map was created for the different analyses conducted by the study team. The slope in a grid shows the maximum slope among the surrounding adjacent grids in degree.
Figure 1.3.6 Slope Map based on Digital Elevation Model (DEM) in Kabupaten Jember

The Study on Natural Disaster Management in Indonesia
1-14
7) Land Cover
Land cover data compiled at scale 1:25,000 in 1999 was obtained from Bakosurtanal as shown in Figure 1.3.7. This was used for the various analyses conducted by the study team. As shown in the figure compared with the slope map in the previous page, most of “Built-up Area (Red in the map)” and “Vegitation – Cultivated (Light green in the map)” are located in flat land (less than 2.0 degree in slope) covering from the central urbanized area to south-west area of Kabupaten Jember.
Figure 1.3.7 Land Cover Map for Kabupaten Jember

Final Report
1-15
1.4 GIS Database for Kabupaten Padang Pariaman
1.4.1 Data Collection and Input In order to build the database for Kabupaten Padang Pariaman, several government and private offices were visited to collect data. Data collected came in both digital and hardcopy formats. The following describes the different types of data collected.
1) Base Map Data
The base maps used for Kabupaten Padang Pariaman were provided by Pengelolaan Sumber Daya Air (PSDA) of West Sumatra Province based on 1:50,000 topographic maps from the Indonesian Army Topography Directorate published in 1985.
2) Census Data
Population and household count data were based on the data published by the local office of BPS in Kabupaten Padang Pariaman in 2007. For Kabupaten Padanag Pariaman, the administrative unit used in the census is either Kecamatan or Nagari.
3) Building Inventory
Building data were requested from each Kecamatan in Kabupaten Padang Pariaman but not all Kecamatans were able to provide the building information. For Kecamatans that were not able to provide information, building total counts were estimated based on either population or household counts for the Kecamatans. Building counts by type of structure for the Kecamatan that were not able to provide detailed data were estimated using the ratios of each type of building to the total buildings from those Kecamatans that submitted detailed data.
The following table summarizes the building counts including estimated counts used for the purpose of the study.

The Study on Natural Disaster Management in Indonesia
1-16
Table 1.4.1 List of Building Type in Kabupaten Padang Pariaman
Kecamatan Nagari
AdministrativeData Unit Used forAnalysis
Population2007
HouseholdCount
AveragePersons perHousehold
Building CountData Source
TotalBuildings
BuildingMade ofMasonry
BuildingMade ofConfinedMasonry
WoodenBuilding
BuildingMade ofReinforcedConcrete
Other Typeof Building
2X11 Enam Lingkung - Kecamatan 17,086 Not Available Not Available Kecamatan 3,893 1,293 1,560 200 312 528
Enam Lingkung - Kecamatan 18,412 Not Available Not Available Estimated using
Population 3,682 727 2,039 294 167 455 IV Koto Aur Malintang - Kecamatan 18,937 Not Available Not Available Kecamatan 5,609 3,392 1,480 190 357 190
Nan Sabaris - Kecamatan 25,972 Not Available Not Available Estimated using
Population 5,194 1,025 2,877 415 236 642
Sintuk Toboh Gadang - Kecamatan 16,327 Not Available Not Available Estimated using
Population 3,265 644 1,808 261 148 403 V Koto Kampung Dalam - Kecamatan 22,499 Not Available Not Available Kecamatan 5,075 - 3,657 913 199 306
Anduring Nagari 7,520 1,573.00 4.78 Kecamatan 1,690 348 1,105 65 76 96 Guguk Nagari 5,868 1,085.00 5.41 Kecamatan 1,193 239 710 120 61 63 Kayu Tanam Nagari 4,900 1,215.00 4.03 Kecamatan 1,329 264 796 133 67 69 Kepala Hilalang Nagari 5,709 1,232.00 4.63 Kecamatan 1,329 266 799 135 68 61
Kasang Nagari 12,564 2,548.00 4.93 Estimated usingHousehold Count 2,548 503 1,411 204 116 315
Ketaping Nagari 12,043 2,212.00 5.44 Estimated usingHousehold Count 2,212 437 1,225 177 100 273
Sungai Buluh Nagari 19,013 3,559.00 5.34 Estimated usingHousehold Count 3,559 702 1,971 284 161 440
Gasan Gadang Nagari 5,282 1,177.00 4.49 Kecamatan 1,024 328 394 131 37 134 Malai V Suku Nagari 5,814 1,215.00 4.79 Kecamatan 1,370 259 623 218 47 223
Lubuk Alung Lubuk Alung Nagari 40,372 7,726.00 5.23 Kecamatan 8,131 118 7,418 393 145 57 Batu Kalang Nagari 2,576 576.00 4.47 Kecamatan 1,207 589 589 29 - - Koto Baru Nagari 1,712 403.00 4.25 Kecamatan 873 430 430 6 7 - Koto Dalam Nagari 3,889 982.00 3.96 Kecamatan 1,600 658 658 284 - -
Sungai Durian Nagari 4,552 1,663.00 2.74 Estimated usingHousehold Count 1,663 328 921 133 75 205
Tandikat Nagari 10,812 2,778.00 3.89 Estimated usingHousehold Count 2,778 548 1,539 222 126 343
Kuranji Hulu Nagari 19,511 5,140.00 3.80 Kecamatan 4,421 1,269 1,629 376 99 1,048 Malai III Koto Nagari 8,736 1,262.00 6.92 Kecamatan 1,261 311 391 245 151 163 Kuranji Hilir Nagari 15,374 3,069.00 5.01 Kecamatan 2,931 - 2,423 228 157 123 Pilubang Nagari 13,264 2,742.00 4.84 Kecamatan 3,025 - 2,578 190 171 86
Tapakis Nagari 13,709 Not Available Not Available Estimated using
Population 2,742 541 1,518 219 124 339
Ulakan Nagari 6,029 Not Available Not Available Estimated using
Population 1,206 238 668 96 55 149
Gunung Padang Alai Nagari 5,910 Not Available Not Available Estimated using
Population 1,182 233 655 94 54 146
Kudu Gantiang Nagari 5,646 Not Available Not Available Estimated using
Population 1,129 223 625 90 51 139
Limau Purut Nagari 3,119 Not Available Not Available Estimated using
Population 624 123 345 50 28 77 Balai Aia Nagari 8,369 1,784.00 4.69 Kecamatan 848 84 254 42 47 421 Lareh Nan Panjang Nagari 3,881 848.00 4.58 Kecamatan 1,416 142 424 70 69 711 Lurah Ampalu Nagari 6,228 1,416.00 4.40 Kecamatan 3,036 301 925 182 242 1,386 Sei Sarik Nagari 14,420 3,036.00 4.75 Kecamatan 1,784 178 535 89 95 887
386,055 - - - 84,830 16,741 46,980 6,778 3,848 10,478
V Koto Timur
VII Koto Sungai Sariak
Total
Patamuan
Sungai Geringging
Sungai Limau
Ulakan Tapakis
2X11 Kayu Tanam
Batang Anai
Batang Gasan
Padang Sago
4) Hazard Data
Hazard data were collected from several sources. PSDA of West Sumatra Province provided past flood information such as flood area, duration time and depth. Several hazard maps were collected from the Marine and Coastal Project Management in West Sumatra such as earthquake, coastal erosion and other geo-hazards.

Final Report
1-17
1.4.2 Data Integration Data collected from the different sources were then integrated into the GIS database. Data integration mainly consists of converting hardcopy data to digital form and processing digital data to conform uniform standards adopted in the study. The GIS data format adopted for the study is ESRI shapefile format. For Kabupaten Padang Pariaman, Universal Transverse Mercator Zone 47S was adopted as the standard coordinate system.
1.4.3 Examples of GIS Layers 1) Administrative Boundary
Administrative boundary data used for the study were sourced from BAPPEDA of Kabupaten Padang Pariaman. These were adjusted by the study team to match the features of the 1:50,000 topographic map published by the Indonesian Army Topography Directorate.
Figure 1.4.1 Administration Boundaries in Kabupaten Padang Pariaman

The Study on Natural Disaster Management in Indonesia
1-18
2) Built-up Area
Built-up area, where buildings are densely constructed and population density are higher, for Kabupaten Padang Pariaman was taken from the land use map produced by Badan Pertanahan Nasional (BPN) in 2000. The area in red indicates the built-up area.
Figure 1.4.2 Built-Up Areas in Kabupaten Padang Pariaman

Final Report
1-19
3) Population Density
Census data for Kabupaten Padang Pariaman were compiled by BPS local office in 2007. For the purpose of the study, the administrative boundaries from BAPPEDA were edited by the study team to match features of the topographic map produced by the Topography Directorate of the Indonesian Army. To produce a net population density map, population data were then distributed to built-up areas of Kabupaten Padang Pariaman using the urban areas map from BPN. As shown in the map, Kecamatan Lubuk Alung and Kecamatan Batang Anai, which are neighboring regions of Kota Padang known as one of the principal cities in Indonesia and Minangkabau international airport is located in, belong to relatively higher populated area (more than 5,000 pop./km2). Further, Kecamatans in the northern part of Kabupaten Padang Pariaman (Kecamatan Sungai Geringging, Kecamatan IV Koto Aur Malintang and Kecamatan Batang Gasan) have densely population. The main reason may be attributed to smaller habitable area in forestry mountainous area in the region.
Figure 1.4.3 Population Density in Kabupaten Padang Pariaman

The Study on Natural Disaster Management in Indonesia
1-20
4) Building Type
The study team was able to compile a total building count inventory using data collected from Kecamatan in Kabupaten Padang Pariaman and BPS. Building counts by type of structure were determined using either direct building count data from Kecamatan or by estimating building type distribution using ratios of each type of building to the total buildings from those Kecamatan that provided the data to the study team.
Figure 1.4.4 Building Type Distribution in Kabupaten Padang Pariaman

Final Report
1-21
5) Elevation (DEM)
Digital elevation data for Kabupaten Padang Pariaman were obtained from processed Shuttle Radar Topography Mission (SRTM) data from the International Centre for Tropical Agriculture (CIAT) and SPOT Image. The digital elevation model from CIAT contains elevations at 90 m interval while the digital elevation model purchased from SPOT Image Corporation contains elevations at 20 m intervals. Some of the areas, where SPOT data does not exist, are substituted by SRTM data. Both models were used for the different analyses conducted by the study team depending on the purpose.
Figure 1.4.5 Digital Elevation Model (SRTM) for Kabupaten Padang Pariaman

The Study on Natural Disaster Management in Indonesia
1-22
Figure 1.4.6 Digital Elevation Model (SPOT) for Kabupaten Padang Pariaman
Note: Some of the areas, where SPOT data does not exist, are substituted by SRTM data.

Final Report
1-23
6) Slope
Based on the digital elevation model (SRTM: Shuttle Radar Topography Mission) as shown in Figure 1.4.5, a slope map was created for the different analyses conducted by the study team. The slope in a grid shows the maximum slope among the surrounding adjacent grids in degrees.
Figure 1.4.7 Slope Map based on DEM (SRTM) in Kabupaten Padang Pariaman

The Study on Natural Disaster Management in Indonesia
1-24
7) Land Cover
Land cover data compiled in 2007 using SPOT Satellite Imagery was obtained from BAPPEDA of Kabupaten Padang Pariaman. As shown in the figure compared with the maps for built-up area, elevation and slope, most of built-up area, rice-field and plantation area are located in flat low-land (less than 5.0 degree in slope and less than 50m in elevation) covering from the central area (Kota Pariaman) to south-west coastal area of Kabupaten Padang Pariaman.
Figure 1.4.8 Land Cover in Kabupaten Padang Pariaman

Final Report
1-25
1.5 GIS Database for Kota Pariaman
1.5.1 Data Collection and Input In order to build the database for Kota Pariaman, several government and private offices were visited to collect data. Data collected came in both digital and hardcopy formats. The following describes the different types of data collected.
1) Base Map Data
The base maps used for Kota Pariaman were provided by Pengelolaan Sumber Daya Air (PSDA) of West Sumatra Province based on 1:50,000 topographic maps from the Indonesian Army Topography Directorate published in 1985.
2) Census Data
Population and household count data were based on the data published by the local office of BPS in Kota Pariaman in 2007. For Kota Pariaman, the administrative unit used in the census is Kecamatan.
3) Building Inventory
Building data were requested from each Kecamatan in Kota Pariaman but the Kecamatans were not able to provide the building information. Building total counts were estimated using population counts for the Kecamatan. Building counts by type of structure for the Kecamatan were estimated using the ratios of each type of building to the total buildings from those Kecamatan that submitted detailed data in Kabupaten Padang Pariaman.
The following table summarizes the building counts including estimated counts used for the purpose of the study.
Table 1.5.1 List of Building Types in Kota Pariaman
Kecamatan Nagari
AdministrativeData Unit Used forAnalysis
Population2007
HouseholdCount
AveragePersons perHousehold
Building CountData Source
TotalBuildings
BuildingMade ofMasonry
BuildingMade ofConfinedMasonry
WoodenBuilding
BuildingMade ofReinforcedConcrete
Other Typeof Building
Pariaman Utara - Kecamatan 24,188 Not Available Not Available Estimated using
Population 4,838 955 2,679 387 220 598
Pariaman Tengah - Kecamatan 32,339 Not Available Not Available Estimated using
Population 6,468 1,276 3,582 517 293 799
Pariaman Selatan - Kecamatan 20,312 Not Available Not Available Estimated using
Population 4,062 802 2,250 325 184 502
76,839 - - - 15,368 3,033 8,511 1,229 697 1,899 Total

The Study on Natural Disaster Management in Indonesia
1-26
4) Hazard Data
Hazard data were collected from several sources. PSDA of West Sumatra Province provided past flood information such as flood area, duration time and depth. Several hazard maps were collected from the Marine and Coastal Project Management in West Sumatra such as earthquake, coastal erosion and other geo-hazards.
1.5.2 Data Integration Data collected from the different sources were then integrated into the GIS database. Data integration mainly consists of converting hardcopy data to digital form and processing digital data to conform uniform standards adopted in the study. The GIS data format adopted for the study is ESRI shapefile format. For Kota Pariaman, Universal Transverse Mercator Zone 47S was adopted as the standard coordinate system.

Final Report
1-27
1.5.3 Examples of GIS Layers 1) Administrative Boundary
Administrative boundary data used for the study were sourced from BAPPEDA of Kota Pariaman. These were adjusted by the study team to match the features of the 1:50,000 topographic map published by the Indonesian Army Topography Directorate.
Figure 1.5.1 Administrative Boundaries in Kota Pariaman

The Study on Natural Disaster Management in Indonesia
1-28
2) Built-up Area
Built-up area, where buildings are densely constructed and population density are higher, for Kabupaten Padang Pariaman was taken from the land use map produced by Badan Pertanahan Nasional (BPN) in 2000. The area in red indicates the built-up area.
Figure 1.5.2 Built-Up Areas in Kota Pariaman
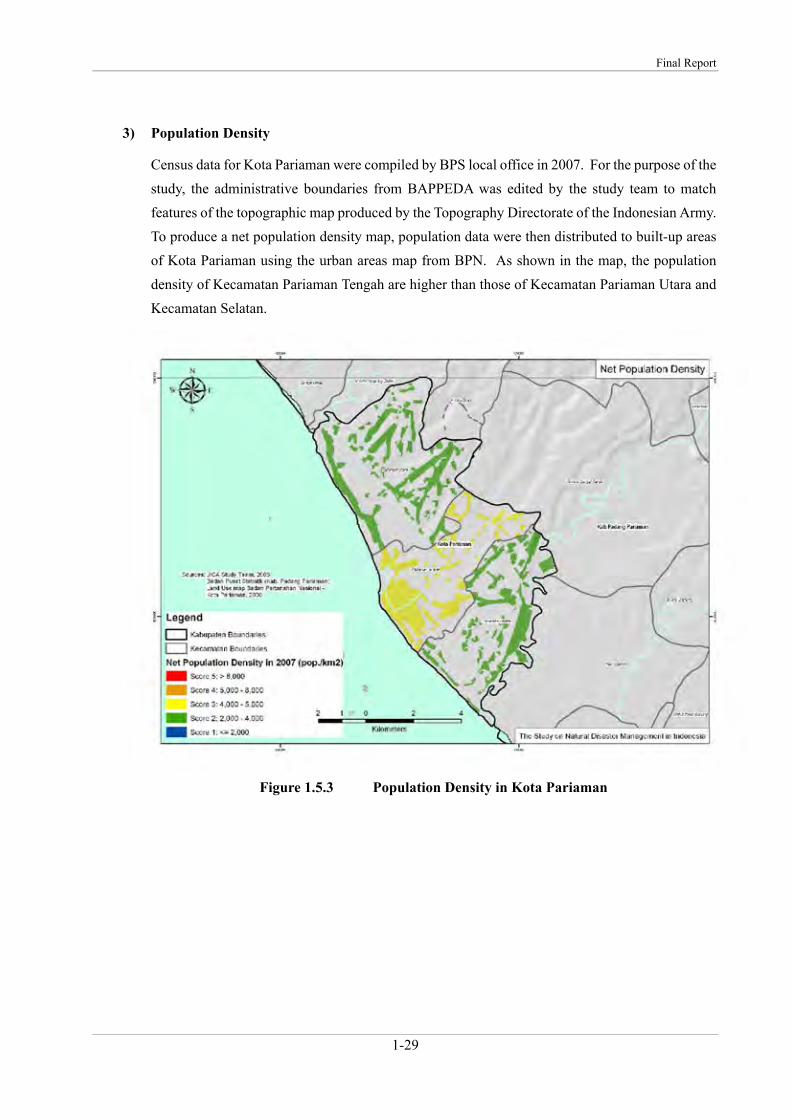
Final Report
1-29
3) Population Density
Census data for Kota Pariaman were compiled by BPS local office in 2007. For the purpose of the study, the administrative boundaries from BAPPEDA was edited by the study team to match features of the topographic map produced by the Topography Directorate of the Indonesian Army. To produce a net population density map, population data were then distributed to built-up areas of Kota Pariaman using the urban areas map from BPN. As shown in the map, the population density of Kecamatan Pariaman Tengah are higher than those of Kecamatan Pariaman Utara and Kecamatan Selatan.
Figure 1.5.3 Population Density in Kota Pariaman

The Study on Natural Disaster Management in Indonesia
1-30
4) Building Type
The study team was able to compile a total building count inventory using data collected from Kecamatan in Kota Pariaman and BPS. Building counts by type of structure were determined by estimating building type distribution using ratios of each type of building to the total buildings from those Kecamatan that submitted detailed data in Kabupaten Padang Pariaman.
Figure 1.5.4 Building Type Distribution in Kota Pariaman

Final Report
1-31
5) Elevation (DEM)
Digital elevation data for Kota Pariaman including Kabupaten Padang Pariaman were obtained from processed Shuttle Radar Topography Mission (SRTM) data from the International Centre for Tropical Agriculture (CIAT) and SPOT Image. The digital elevation model from CIAT contains elevations at 90 m interval while the digital elevation model purchased from SPOT Image Corporation contains elevations at 20 m intervals. Some of the areas, where SPOT data does not exist, are substituted by SRTM data. Both models were used for the different analyses conducted by the study team depending on the purpose.
Figures 1.4.6 and 1.4.7 show the digital elevation models including Kapbupaten Padang Pariaman from SRTM and SPOT Image covering Kota Pariaman.
6) Slope
Based on the digital elevation model (SRTM: Shuttle Radar Topography Mission) as shown in Figure 1.4.5, a slope map was created for the different analyses conducted by the study team. The slope in a grid shows the maximum slope among the surrounding adjacent grids in degrees.
Figure 1.5.5 Slope Map Based on DEM (SRTM) in Kota Pariaman

The Study on Natural Disaster Management in Indonesia
1-32
7) Land Cover
Land cover data compiled in 2007 using SPOT Satellite Imagery was obtained from BAPPEDA of Kabupaten Padang Pariaman. The land cover data also covers Kota Pariaman. As shown in the figure, the most of Kota Pariaman except for the northern part of Kecamatan Pariaman Utara are for plantation including rice-field or built-up area. The land cover of the northern part of Kecamatan Pariaman Utara is mainly forest.
Figure 1.5.6 Land Cover in Kota Pariaman

Final Report
1-33
1.6 Basics for Creations of Hazard Map and Risk Map
1.6.1 Objectives of Creations of Hazard Map and Risk Map The objectives of the creation of hazard map and risk maps are
1) to identify the areas which are considered to be high-risk to natural disasters, and
2) to identify problems facing the area of concern for consideration in the preparation of regional disaster management plan.
1.6.2 Definition of Risk, Hazard and Vulnerability According to “Living with Risk” published by Inter-Agency Secretariat of the International Strategy for Disaster Reduction (UN/ISDR) in 2004, Risk is defined as “The probability of harmful consequences, or expected losses (deaths, injuries, property, livelihoods, economic activity disrupted or environment damaged) resulting from interactions between natural or human-induced hazards and vulnerable conditions” and can be indicated in the formula below.
Risk = Hazard x Vulnerability (Eq. 1.1)
The definitions of risk, hazard and vulnerability above are the basis for the creation of hazard maps and risk maps. The relations among “Hazard”, “Vulnerability” and “Risk” are shown as a conceptual figure (Refer to Figure 1.6.1), which is sourced from white book for disaster reduction (2006). According to the white book, the following elements are pointed out.
1. “Hazard”, which is natural phenomena, is not be controlled by people. 2. For example, “Vulnerability” can be reduced by means of promotion for anti-seismic
housing/building construction, etc. against seismic hazard; hence, the damage due to earthquake may be decreased considerably.
3. It is necessary to place more emphasis on disaster reduction activities in order to reduce “Vulnerability” prior to natural disaster event.
Hazard: A potentially damaging physical event, phenomenon or human activity, which may cause the loss of life or injury, property damage, social and economic disruption or environmental degradation.
Vulnerability: The conditions determined by physical, social, economic, and environmental factors or processes, which increase the susceptibility of a community to the impact of hazards.

The Study on Natural Disaster Management in Indonesia
1-34
Source: White Book for Disaster Redution in Japan, 2006 (Altered)
Risk
Hazard
Vulnerability
Figure 1.6.1: Relation among Hazard, Vulnerability and Risk
1.6.3 Flow Chart for Creations of Hazard Map and Risk Map The conceptual flow chart for the creations of hazard map and risk map is shown in Figure1 below. There are three (3) steps to producing a hazard map: namely 1) Data collection, 2) Calculation & Selection of indices, and 3) Creation of Hazard map. Further, a risk map is derived based on the formula of “Risk = Hazard x Vulnerability” with the hazard map and the vulnerability indices (or possibly a map representing “Vulnerability”).

Final Report
1-35
Figure 1.6.2 Conceptual Flow Chart for Creations of Hazard Maps and Risk Maps
At “Data collection” stage, the basic data in terms of hazard and vulnerability will be collected (e.g. affected disaster area, number of killed or injured, damage amount, rainfall, tidal level, surface ground condition, population, poverty rate, literacy rate, land use, etc.). Then, the indices for hazard and vulnerability will be calculated during the “Calculation & Selection of Indices” stage; they will be referred to as the candidate indices. The most appropriate indices for hazard and vulnerability can be selected amongst the candidate indices after the trial derivations of hazard map and risk map. Some of the indices were selected based on the discussions with the counterpart organizations/members of the pilot regions (Kabupaten Jember, Kabupaten Padang Pariaman and Kota Pariaman) during the workshops. After the selection of indices, the hazard map is created as the summation of the indices at the stage of “Creation of Hazard Map”. The vulnerability map, consisting of the relevant selected indices, can be also created if necessary. Finally, the risk map will be created based on the formula of “Risk = Hazard x Vulnerability” as the result of the “Creation of Risk Map” stage.

The Study on Natural Disaster Management in Indonesia
1-36
Figure 1.6.3 shows the relations among risk, hazard, vulnerability, indices and basic data. “Risk” is composed of “Hazard” and “Vulnerability”. “Hazard” and “Vulnerability” consist of their indices, respectively. “Hazard” is simply the summation of the hazard indices. “Vulnerability” can also be estimated in the same manner. Each index is derived or calculated based on the collected basic data (e.g. related documents, electric data, maps, etc.) from various information sources.
Figure 1.6.3 Relations among Risk, Hazard, Vulnerability, Indices and Basic Data
Risk= Hazard x Vulnerability= ∑Hi x ∑Vi
Hazard(= ∑Hi)
Vulnerability(= ∑Vi)
Hazard Indices
Vulnerability Indices
CollectedBasic Data
Documents
Data
Maps
H1
H2
H3
Documents
Data
Maps
V1
V2
V3
CollectedBasic Data

Final Report
1-37
Legend
Score 5: > 50 (pop./ha)
Population Density (score)
Score 4: 25 – 50 (pop./ha)
Score 3: 10 -25 (pop./ha)
Score 2: 5 – 10 (pop./ha)
Score 1: <= 5 (pop./ha)
1.6.4 Vulnerability Maps for Kabupaten Jember 1) Population Density
To assess vulnerability of Kabupaten Jember in terms of population density, a population density grade map at 1,000 m grid intervals was created based on the population density map (Figure 1.3.3 on page 1-10). A scoring system to assess relative vulnerability in terms of population density ranges was then applied based on the following classification.
i) Score 5 : > 50 (pop./ha) <Highest Population Density>
ii) Score 4 : 25 – 50 (pop./ha) <Higher Population Density>
iii) Score 3 : 10 – 25 (pop./ha) <Moderate Population Density>
iv) Score 2 : 5 – 10 (pop./ha) <Lower Population Density>
v) Score 1 : <= 5 (pop./ha) <Lowest Population Density>
The figure below shows the vulnerability scoring for population density used by the study team. As shown in the map, Kecamatan Patrang, Kecamatan Kaliwates and Kecamatan Sumbersari belong to relatively highest populated area.
Figure 1.6.4 Population Density Grade in Kabupaten Jember

The Study on Natural Disaster Management in Indonesia
1-38
Legend
Score 5: > 50 (ha/km2)
Built-up Area (score)
Score 4: 30 – 50 (ha/km2)
Score 3: 20 – 30 (ha/km2)
Score 2: 5 – 20 (ha/km2)
Score 1: <= 5 (ha/km2)
2) Built-up Area
To assess vulnerability of Kabupaten Jember in terms of built-up area, a built-up area grade map at 1,000m grid intervals was created based on the land cover map (Figure 1.3.2 on page 1-9). A scoring system to assess relative vulnerability in terms of built-up area ratio was then applied based on the following classification.
i) Score 5 : > 50 (ha/km2) <Highest Ratio of Built-up Area>
ii) Score 4 : 30 – 50 (ha/km2) <Higher Ratio of Built-up Area >
iii) Score 3 : 20 – 30 (ha/km2) <Moderate Ratio of Built-up Area >
iv) Score 2 : 5 – 20 (ha/km2) <Lower Ratio of Built-up Area >
v) Score 1 : <= 5 (ha/km2) <Lowest Ratio of Built-up Area >
The figure below shows the vulnerability scoring for built-up area ratio used by the study team. As shown in the map, Kecamatan Patrang, Kecamatan Kaliwates, Kecamatan Sumbersari, Kecamatan Wuluhan and Kecamatan Ambulu have relatively higher ratio of built-up area.
Figure 1.6.5 Built-up Area Grade in Kabupaten Jember
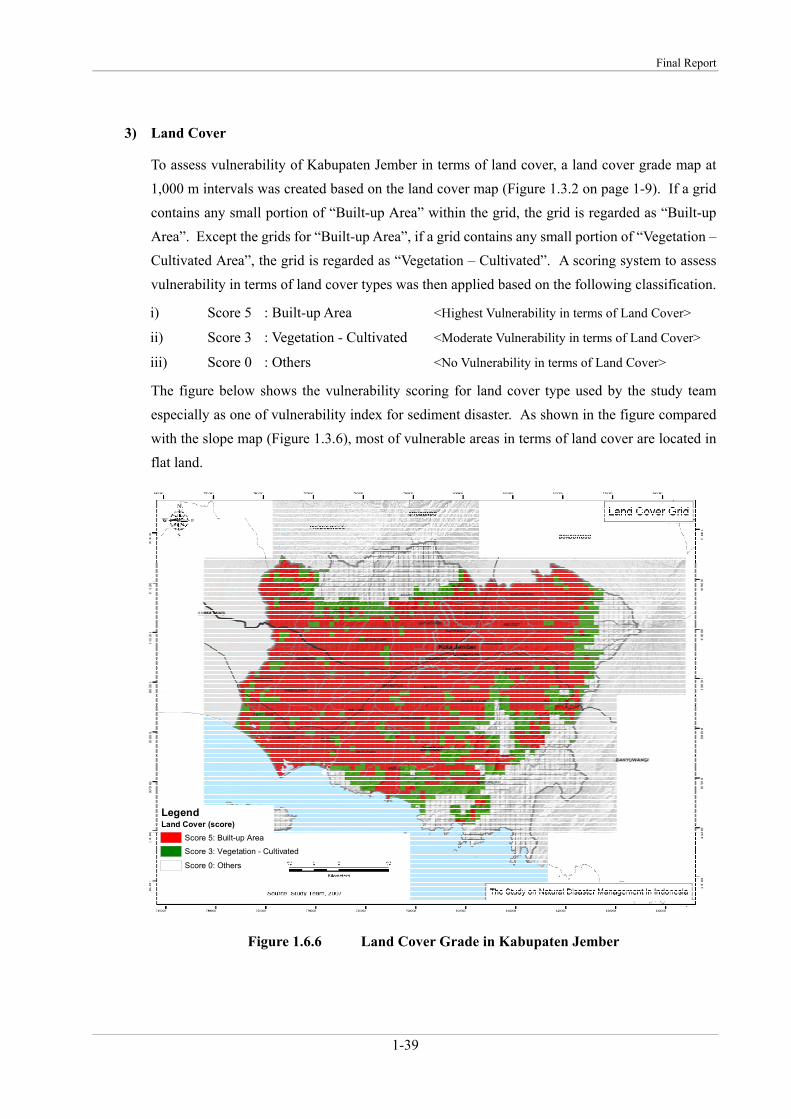
Final Report
1-39
Legend
Score 5: Built-up Area
Land Cover (score)
Score 3: Vegetation - Cultivated
Score 0: Others
3) Land Cover
To assess vulnerability of Kabupaten Jember in terms of land cover, a land cover grade map at 1,000 m intervals was created based on the land cover map (Figure 1.3.2 on page 1-9). If a grid contains any small portion of “Built-up Area” within the grid, the grid is regarded as “Built-up Area”. Except the grids for “Built-up Area”, if a grid contains any small portion of “Vegetation – Cultivated Area”, the grid is regarded as “Vegetation – Cultivated”. A scoring system to assess vulnerability in terms of land cover types was then applied based on the following classification.
i) Score 5 : Built-up Area <Highest Vulnerability in terms of Land Cover>
ii) Score 3 : Vegetation - Cultivated <Moderate Vulnerability in terms of Land Cover>
iii) Score 0 : Others <No Vulnerability in terms of Land Cover>
The figure below shows the vulnerability scoring for land cover type used by the study team especially as one of vulnerability index for sediment disaster. As shown in the figure compared with the slope map (Figure 1.3.6), most of vulnerable areas in terms of land cover are located in flat land.
Figure 1.6.6 Land Cover Grade in Kabupaten Jember
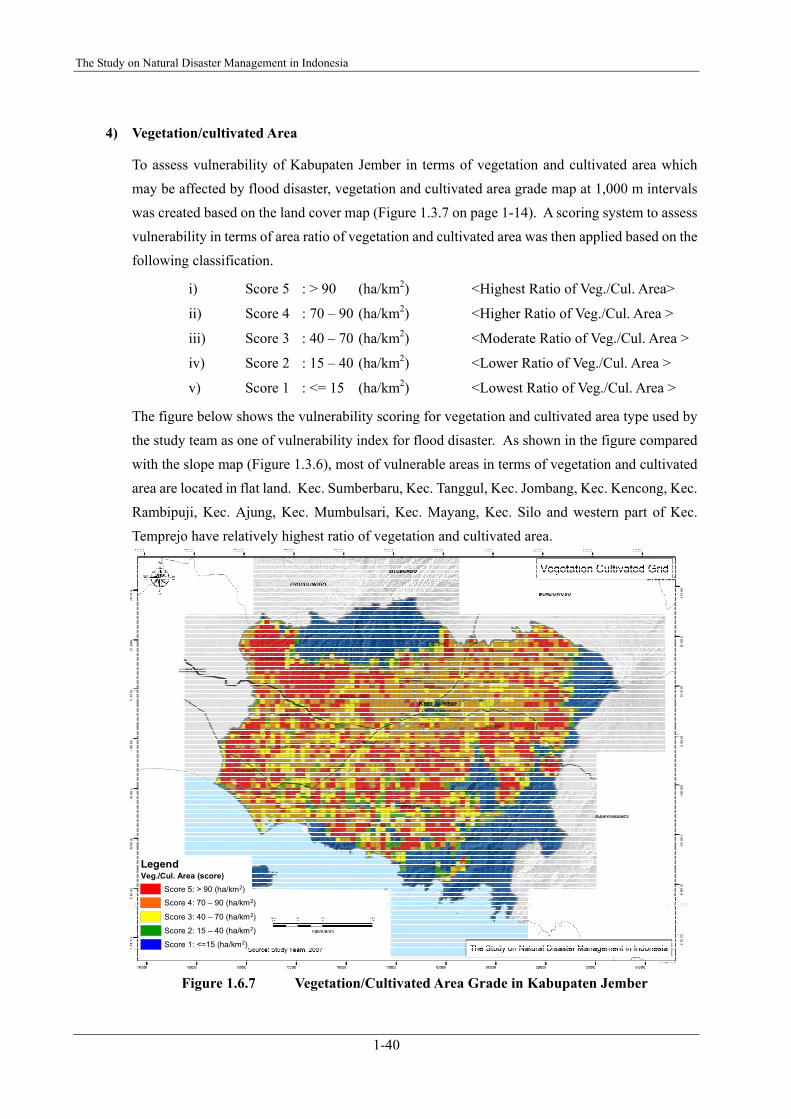
The Study on Natural Disaster Management in Indonesia
1-40
Legend
Score 5: > 90 (ha/km2)
Veg./Cul. Area (score)
Score 4: 70 – 90 (ha/km2)
Score 3: 40 – 70 (ha/km2)
Score 2: 15 – 40 (ha/km2)
Score 1: <=15 (ha/km2)
4) Vegetation/cultivated Area
To assess vulnerability of Kabupaten Jember in terms of vegetation and cultivated area which may be affected by flood disaster, vegetation and cultivated area grade map at 1,000 m intervals was created based on the land cover map (Figure 1.3.7 on page 1-14). A scoring system to assess vulnerability in terms of area ratio of vegetation and cultivated area was then applied based on the following classification.
i) Score 5 : > 90 (ha/km2) <Highest Ratio of Veg./Cul. Area>
ii) Score 4 : 70 – 90 (ha/km2) <Higher Ratio of Veg./Cul. Area >
iii) Score 3 : 40 – 70 (ha/km2) <Moderate Ratio of Veg./Cul. Area >
iv) Score 2 : 15 – 40 (ha/km2) <Lower Ratio of Veg./Cul. Area >
v) Score 1 : <= 15 (ha/km2) <Lowest Ratio of Veg./Cul. Area >
The figure below shows the vulnerability scoring for vegetation and cultivated area type used by the study team as one of vulnerability index for flood disaster. As shown in the figure compared with the slope map (Figure 1.3.6), most of vulnerable areas in terms of vegetation and cultivated area are located in flat land. Kec. Sumberbaru, Kec. Tanggul, Kec. Jombang, Kec. Kencong, Kec. Rambipuji, Kec. Ajung, Kec. Mumbulsari, Kec. Mayang, Kec. Silo and western part of Kec. Temprejo have relatively highest ratio of vegetation and cultivated area.
Figure 1.6.7 Vegetation/Cultivated Area Grade in Kabupaten Jember

Final Report
1-41
1.6.5 Vulnerability Maps for Kabupaten Padang Pariaman 1) Population Density
To assess vulnerability of Kabupaten Padang Pariaman in terms of population density, a population density grade map at 1,000 m grid intervals was created based on the population density map (Figure 1.4.3 on page 1-19). A scoring system to assess vulnerability in terms of population density was then applied based on the following classification.
i) Score 5 : > 50 (pop./ha) <Highest Population Density>
ii) Score 4 : 25 – 50 (pop./ha) <Higher Population Density>
iii) Score 3 : 10 – 25 (pop./ha) <Moderate Population Density>
iv) Score 2 : 5 – 10 (pop./ha) <Lower Population Density>
v) Score 1 : <= 5 (pop./ha) <Lowest Population Density>
vi) Score 0 : 0 (pop./ha) <No Population>
The figure below shows the vulnerability scoring for population density used by the study team.
Figure 1.6.8 Population Density Grade in Kabupaten Padang Pariaman

The Study on Natural Disaster Management in Indonesia
1-42
2) Built-up Area
To assess vulnerability of Kabupaten Padang Pariaman in terms of built-up area, a built up area grade map at 1,000 m grid intervals was created based on the built-up area map (Figure 1.4.2 on page 1-18). A scoring system to assess vulnerability in terms of built up area ratio was then applied based on the following classification.
i) Score 5 : > 50 (percent) <Highest Ratio of Built-up Area>
ii) Score 4 : 30 – 50 (percent) <Higher Ratio of Built-up Area>
iii) Score 3 : 20 – 30 (percent) <Moderate Ratio of Built-up Area>
iv) Score 2 : 5 – 20 (percent) <Lower Ratio of Built-up Area>
v) Score 1 : <= 5 (percent) <Lowest Ratio of Built-up Area>
vi) Score 0 : 0 (percent) <No Building>
The figure below shows the vulnerability scoring for built-up area ratio used by the study team.
Figure 1.6.9 Built up Area Grade in Kabupaten Padang Pariaman

Final Report
1-43
3) Road, Railway in Steep Slope Area
To assess vulnerability of Kabupaten Padang Pariaman in terms of the presence of road or railways in steep areas, a road/railway in steep area map at 1,000 m grid intervals was created based on the digital elevation maps (Figure 1.4.5 on page 1-18) as well as road and railway layers shown in Figure 1.4.1. Each grid is flagged if it satisfies the conditions that either a road or railway exists in the grid and that the grid has an average slope of greater than 30 degrees. A scoring system to assess vulnerability in terms of the presence of road or railway in steep areas was then applied. The figure below shows the vulnerability scoring for the presence of road or railway in steep areas used by the study team especially as one of vulnerability index for sediment disaster.
Figure 1.6.10 Grade for Road, Railway in Steep Slope Area in Kabupaten Padang Pariaman
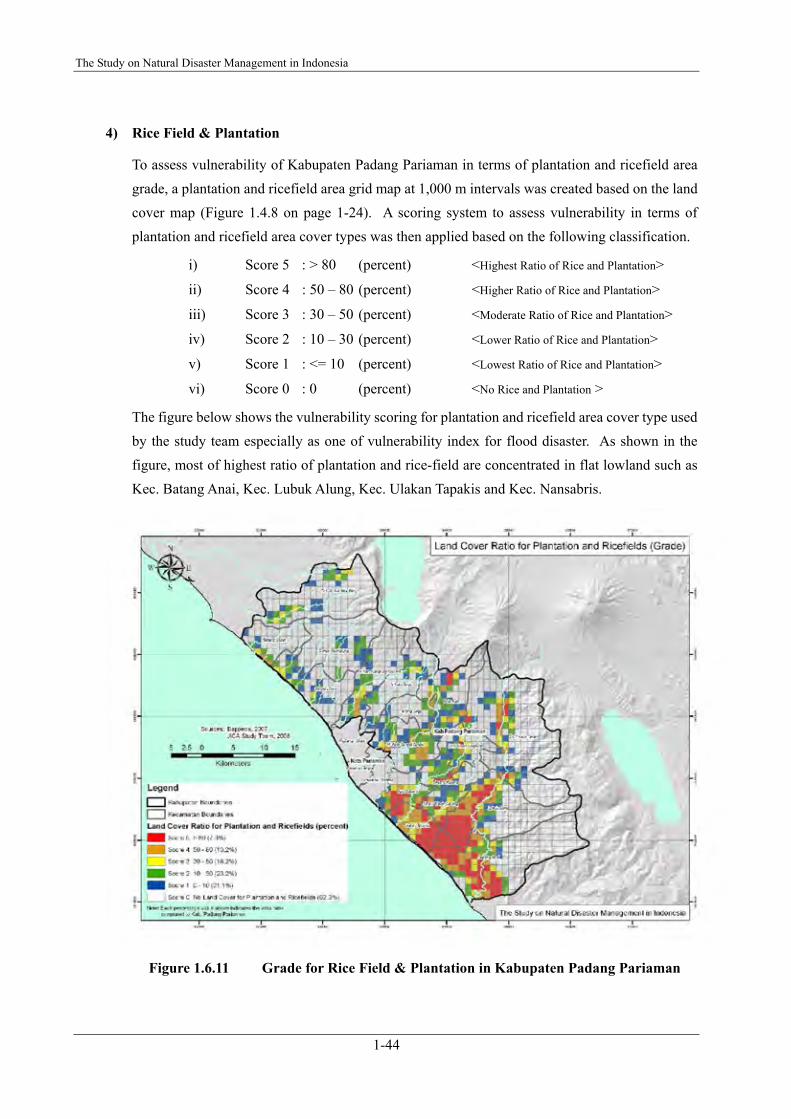
The Study on Natural Disaster Management in Indonesia
1-44
4) Rice Field & Plantation
To assess vulnerability of Kabupaten Padang Pariaman in terms of plantation and ricefield area grade, a plantation and ricefield area grid map at 1,000 m intervals was created based on the land cover map (Figure 1.4.8 on page 1-24). A scoring system to assess vulnerability in terms of plantation and ricefield area cover types was then applied based on the following classification.
i) Score 5 : > 80 (percent) <Highest Ratio of Rice and Plantation>
ii) Score 4 : 50 – 80 (percent) <Higher Ratio of Rice and Plantation>
iii) Score 3 : 30 – 50 (percent) <Moderate Ratio of Rice and Plantation>
iv) Score 2 : 10 – 30 (percent) <Lower Ratio of Rice and Plantation>
v) Score 1 : <= 10 (percent) <Lowest Ratio of Rice and Plantation>
vi) Score 0 : 0 (percent) <No Rice and Plantation >
The figure below shows the vulnerability scoring for plantation and ricefield area cover type used by the study team especially as one of vulnerability index for flood disaster. As shown in the figure, most of highest ratio of plantation and rice-field are concentrated in flat lowland such as Kec. Batang Anai, Kec. Lubuk Alung, Kec. Ulakan Tapakis and Kec. Nansabris.
Figure 1.6.11 Grade for Rice Field & Plantation in Kabupaten Padang Pariaman

Final Report
1-45
1.6.6 Vulnerability Maps for Kota Pariaman 1) Population Density
To assess vulnerability of Kota Pariaman in terms of population density, a population density grade map at 500 m grid intervals was created based on the population density map (Figure 1.5.3 on page 1-29). A scoring system to assess vulnerability in terms of population density ranges was then applied based on the following classification.
i) Score 5 : > 50 (pop./ha) <Highest Population Density>
ii) Score 4 : 20 – 50 (pop./ha) <Higher Population Density>
iii) Score 3 : 10 – 20 (pop./ha) <Moderate Population Density>
iv) Score 2 : 5 – 10 (pop./ha) <Lower Population Density>
v) Score 1 : <= 5 (pop./ha) <Lowest Population Density>
The figure below shows the vulnerability scoring for population density used by the study team.
Figure 1.6.12 Population Density Grade in Kota Pariaman

The Study on Natural Disaster Management in Indonesia
1-46
2) Built-up Area
To assess vulnerability of Kota Pariaman in terms of built-up area, a built up area ratio grade map at 500 m grid intervals was created based on the built-up area map (Figure 1.5.2 on page 1-28). A scoring system to assess vulnerability in terms of built up area ratio was then applied based on the following classification.
i) Score 5 : > 50 (percent) <Highest Ratio of Built-up Area>
ii) Score 4 : 30 – 50 (percent) <Higher Ratio of Built-up Area>
iii) Score 3 : 20 – 30 (percent) <Moderate Ratio of Built-up Area>
iv) Score 2 : 5 – 20 (percent) <Lower Ratio of Built-up Area>
v) Score 1 : <= 5 (percent) <Lowest Ratio of Built-up Area>
vi) Score 0 : 0 (percent) <No Building>
The figure below shows the vulnerability scoring for built-up area ratio used by the study team.
Figure 1.6.13 Built up Area Grade in Kota Pariaman

Final Report
1-47
3) Road, Railway in Steep Slope Area
To assess vulnerability of Kota Pariaman in terms of the presence of road or railways in steep areas, a road/railway in steep area map at 500 m grid intervals was created based on the digital elevation maps (Figure 1.4.5 on page 1-18) as well as road and railway layers shown in Figure 1.5.1. Each grid is flagged if it satisfies the conditions that either a road or railway exists in the grid and that the grid has an average slope of greater than 30 degrees. A scoring system to assess vulnerability in terms of the presence of road or railway in steep areas was then applied. The figure below shows the vulnerability scoring for the presence of road or railway in steep areas used by the study team especially as one of vulnerability index for sediment disaster.
Figure 1.6.14 Grade for Road, Railway in Steep Slope Area in Kota Pariaman
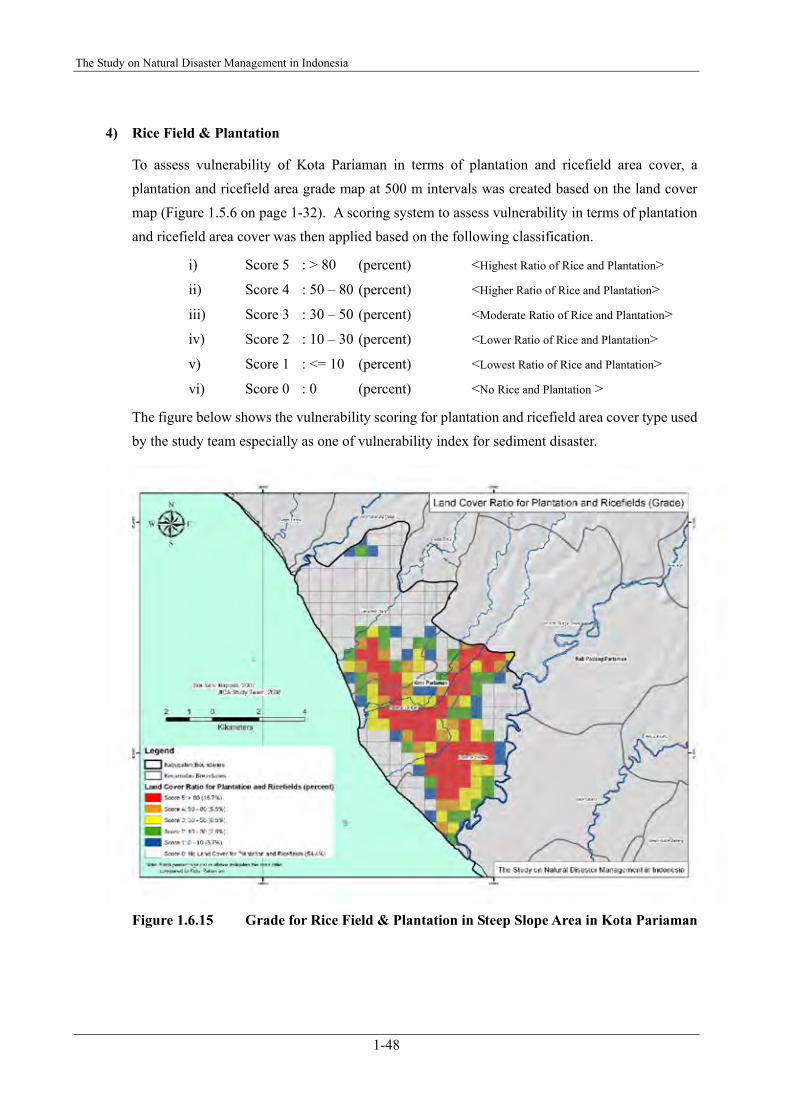
The Study on Natural Disaster Management in Indonesia
1-48
4) Rice Field & Plantation
To assess vulnerability of Kota Pariaman in terms of plantation and ricefield area cover, a plantation and ricefield area grade map at 500 m intervals was created based on the land cover map (Figure 1.5.6 on page 1-32). A scoring system to assess vulnerability in terms of plantation and ricefield area cover was then applied based on the following classification.
i) Score 5 : > 80 (percent) <Highest Ratio of Rice and Plantation>
ii) Score 4 : 50 – 80 (percent) <Higher Ratio of Rice and Plantation>
iii) Score 3 : 30 – 50 (percent) <Moderate Ratio of Rice and Plantation>
iv) Score 2 : 10 – 30 (percent) <Lower Ratio of Rice and Plantation>
v) Score 1 : <= 10 (percent) <Lowest Ratio of Rice and Plantation>
vi) Score 0 : 0 (percent) <No Rice and Plantation >
The figure below shows the vulnerability scoring for plantation and ricefield area cover type used by the study team especially as one of vulnerability index for sediment disaster.
Figure 1.6.15 Grade for Rice Field & Plantation in Steep Slope Area in Kota Pariaman