the study on potential of electrical power and energy ... · each dominant wind direction based on...
TRANSCRIPT

The Study on Potential of Electrical Power and Energy Resulted Wave Generated By Wind
Siti Noor CHAYATI and I Made Andi ARSANA, Indonesia
Keywords: Wave Generation, Sverdrup-Munk-Bretschneider, Wilson, JONSWAP, Coastal
Engineering Manual, Oscillating Water Column
SUMMARY
The need for energy in Indonesia is increasing in line with economic and population growth. The
increasing demand for electrical power will not generate a big problem if the installed electric
capacity is sufficient to accommodate all the needs of society. Ironically, conventional energy
sources such as fossil fuels which are the main energy sources in Indonesia have limited reserves.
One policy of the Ministry of Energy and Mineral Resources in addressing national issues is the
diversification of energy supply and utilisation of new energy sources, one of which is marine
energy sources. Ocean energy sources that can efficiently be converted into electrical energy is the
sea wave. This study aims to determine the potential energy and electricity that can be generated
from wind generated wave in Tangerang, Cilacap, Semarang, Surabaya, Banyuwangi, Kalianget,
and Denpasar.
This study took the wind data from Weather Underground during the year of 2013. Data at the
interpolated interval of 1 hour were used to calculate the ocean waves components, which are wave
height (H) and wave period (T). Wave generation method used in this research are SMB (Sverdrup-
Munk-Bretschneider), Wilson, JONSWAP (Joint North Sea Wave Project), and CEM (Coastal
Engineering Manual). Around 33% of total wave generated using the above methods were found to
be significant in this research. A comparative analysis between and among the generation method
was done using MAE and Scatter Index value. Potential energy and electric power are calculated at
each dominant wind direction based on the wind rose diagram by using Oscillating Water Column
model that has a chamber size of 10 m x 18 m.
SMB method is a most accurate method to be used in the calculation of wave generation than the
other methods. Based on the analysis using MAE values and Scatter Index, the result shows that
most of the SMB method has a lower value than the other three methods. Each study site has
different potential energy and power. The larger wave height, the greater potential energy will be
generated. On the other hand, the amount of power is inversely proportional to the wave period.
Results presentation and distribution of wind energy potential and power calculations are used as a
determinant of the direction of the power plant, which is the dominant wind direction that produces
the largest potential for energy and power.
The Study on Potential of Electrical Power and Energy Resulted From Wave Generated by Wind (9122)
Siti Noor Chayati and I Made Andi Arsana (Indonesia)
FIG Working Week 2017
Surveying the world of tomorrow - From digitalisation to augmented reality
Helsinki, Finland, May 29–June 2, 2017
The Study on Potential of Electrical Power and Energy Resulted From Wind Generated Wave
Siti Noor CHAYATI and I Made Andi ARSANA, Indonesia
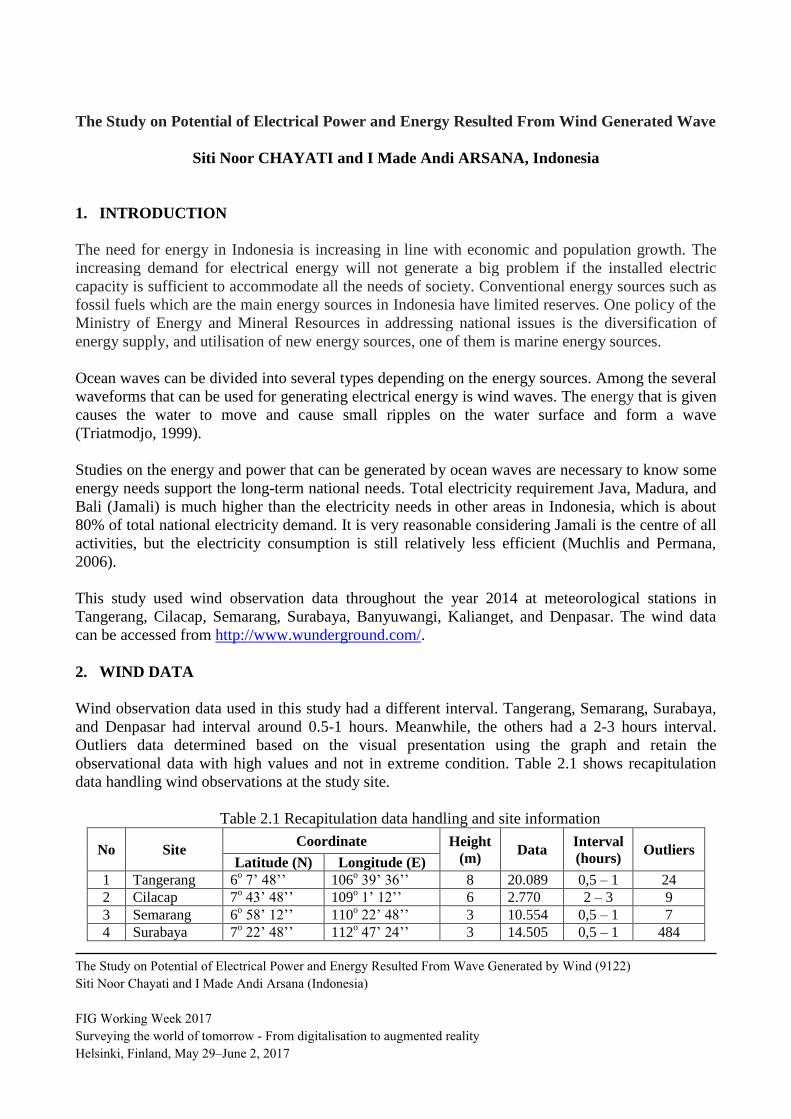
1. INTRODUCTION
The need for energy in Indonesia is increasing in line with economic and population growth. The
increasing demand for electrical energy will not generate a big problem if the installed electric
capacity is sufficient to accommodate all the needs of society. Conventional energy sources such as
fossil fuels which are the main energy sources in Indonesia have limited reserves. One policy of the
Ministry of Energy and Mineral Resources in addressing national issues is the diversification of
energy supply, and utilisation of new energy sources, one of them is marine energy sources.
Ocean waves can be divided into several types depending on the energy sources. Among the several
waveforms that can be used for generating electrical energy is wind waves. The energy that is given
causes the water to move and cause small ripples on the water surface and form a wave
(Triatmodjo, 1999).
Studies on the energy and power that can be generated by ocean waves are necessary to know some
energy needs support the long-term national needs. Total electricity requirement Java, Madura, and
Bali (Jamali) is much higher than the electricity needs in other areas in Indonesia, which is about
80% of total national electricity demand. It is very reasonable considering Jamali is the centre of all
activities, but the electricity consumption is still relatively less efficient (Muchlis and Permana,
2006).
This study used wind observation data throughout the year 2014 at meteorological stations in
Tangerang, Cilacap, Semarang, Surabaya, Banyuwangi, Kalianget, and Denpasar. The wind data
can be accessed from http://www.wunderground.com/.
2. WIND DATA
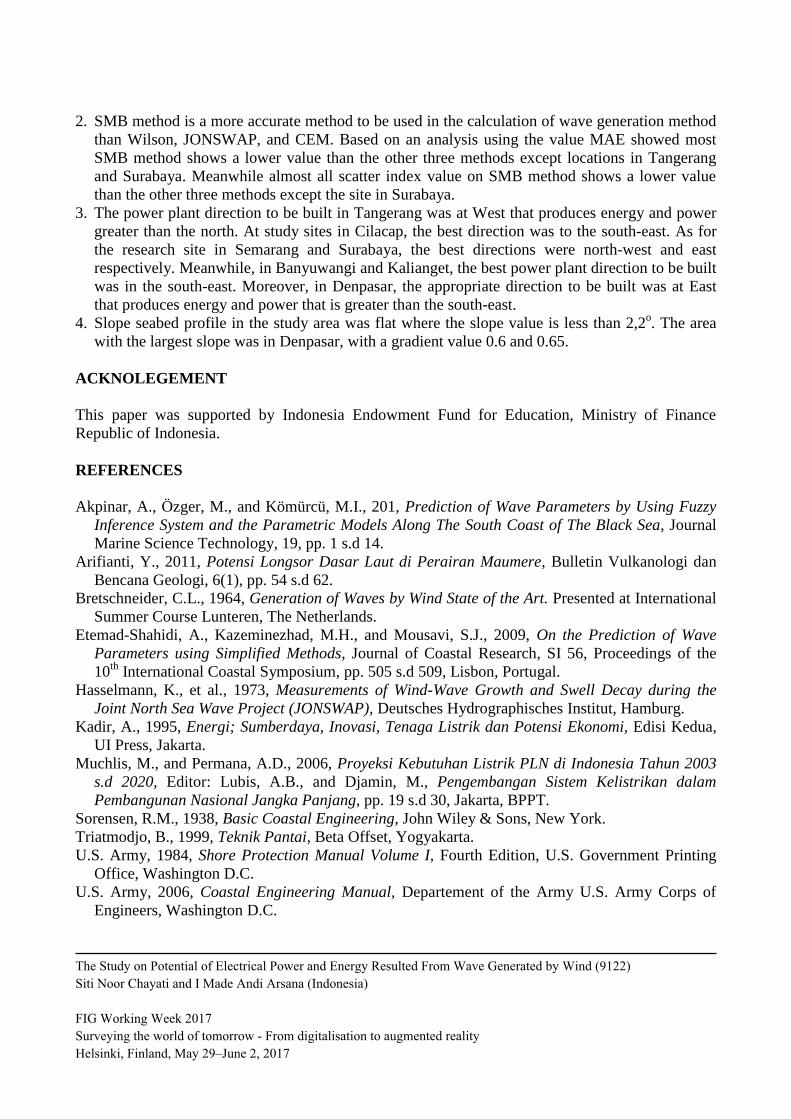
Wind observation data used in this study had a different interval. Tangerang, Semarang, Surabaya,
and Denpasar had interval around 0.5-1 hours. Meanwhile, the others had a 2-3 hours interval.
Outliers data determined based on the visual presentation using the graph and retain the
observational data with high values and not in extreme condition. Table 2.1 shows recapitulation
data handling wind observations at the study site.
Table 2.1 Recapitulation data handling and site information
No Site Coordinate Height
(m) Data
Interval
(hours) Outliers
Latitude (N) Longitude (E)
1 Tangerang 6o 7’ 48’’ 106
o 39’ 36’’ 8 20.089 0,5 – 1 24
2 Cilacap 7o 43’ 48’’ 109
o 1’ 12’’ 6 2.770 2 – 3 9
3 Semarang 6o 58’ 12’’ 110
o 22’ 48’’ 3 10.554 0,5 – 1 7
4 Surabaya 7o 22’ 48’’ 112
o 47’ 24’’ 3 14.505 0,5 – 1 484
The Study on Potential of Electrical Power and Energy Resulted From Wave Generated by Wind (9122)
Siti Noor Chayati and I Made Andi Arsana (Indonesia)
FIG Working Week 2017
Surveying the world of tomorrow - From digitalisation to augmented reality
Helsinki, Finland, May 29–June 2, 2017

5 Banyuwangi 8o 13’ 12’’ 114
o 22’ 48’’ 5 2.831 2 – 3 3
6 Kalianget 7o 3’ 0’’ 113
o 58’ 12’’ 3 2.834 2 – 3 3
7 Denpasar 8o 45’ 0’’ 115
o 10’ 12’’ 4 15.855 0,5 – 1 3
Surabaya was the study site with the biggest outliers data, which took from 13th October 17.00
GMT until 31st October 2013 16.00 GMT. Data on that time was left empty because the linear
interpolation deemed incapable of representing observational data patterns. As for the other study
sites, linear interpolation generated data at intervals of 1-hour observation.
3. THE WINDROSE AND TOPOGRAPHY ANALYSIS
Windrose was used to determine the distribution of wind direction and speed that can be obtained
frequencies greatest speed and dominant wind direction. Windrose in this study created using WR
Plot View version 7.0.0 by input data with the *.txt format. Radial lines on the wind rose shows the
distribution of wind directions which divided in eight directions. Each colour on the wind rose
indicating each interval in units m/s wind speed based on the results of equivalence by the IMO
according to Beaufort scale. The width of the radius of each colour indicates the percentage of the
wind in the period of observation.
3.1 Windrose in Tangerang
Most of the wind speed in Tangerang occurred at of 0.5-
2.1 m/s with the number of 4988 events. Wind distribution
shows that dominant wind direction place from the north
with a frequency 19.57%, consist of 1,240 data at 0.5–2.1
m/s, 430 data at 2.1–3.6 m/3, and 4 data at 3.6–5.7 m/s.
Figure 3.1 shows wind rose in Tangerang.
Figure 3.1 Windrose in Tangerang
3.2 Windrose in Cilacap
Mainly, the wind in Cilacap with the number of 4,541 events occurred at 2.1 – 3.6 m/s. Dominant
wind directions come from the south-east with a frequency 29.05% and from West with 19.06%.
Figure 3.2 shows wind rose in degrees and m/s in wind station in Cilacap.
The Study on Potential of Electrical Power and Energy Resulted From Wave Generated by Wind (9122)
Siti Noor Chayati and I Made Andi Arsana (Indonesia)
FIG Working Week 2017
Surveying the world of tomorrow - From digitalisation to augmented reality
Helsinki, Finland, May 29–June 2, 2017

Figure 3.2 Windrose in Cilacap Figure 3.3 Windrose plotting in Cilacap
Windrose visualisation at Google Earth in Figure 3.3 showed that wind direction from the west
could not be included in wave generation because the wind comes from the land. So that wind wave
generation calculated by using the third dominant wind from the east with 18.21%.
3.3 Windrose in Semarang
Most wind speeds occurred at of 0.5-2.1 m/s with the number of 3,067 events. Dominant wind
directions flow from the south-east, north, and north-west with percentage 19.28%, 17.89%, and
16.36% respectively. Figure 3.4 shows wind rose in Semarang.
Figure 3.4 Windrose in Semarang Figure 3.5 Windrose plotting
Wind directions flow from south-east cannot be included in wind wave generation because the wind
comes from the land, based on the wind rose visualisation in Figure 3.5.
3.4 Windrose in Surabaya
In Surabaya, most of the wind speed occurred at 8.7 - 14.4 m/s with 2618 events. Figure 3.6 shows
wind rose with dominant wind directions flow from the west with 27.15%. The next dominant
directions were east and south-west with 25.54% and 12.02% respectively.
The Study on Potential of Electrical Power and Energy Resulted From Wave Generated by Wind (9122)
Siti Noor Chayati and I Made Andi Arsana (Indonesia)
FIG Working Week 2017
Surveying the world of tomorrow - From digitalisation to augmented reality
Helsinki, Finland, May 29–June 2, 2017

Figure 3.6 Windrose in Surabaya Figure 3.7 Windrose plotting
Windrose visualisation at Google Earth (Figure 3.7) shows that the wind from west and south-west
cannot be included in wave generation because the wind comes from the land.
3.5 Windrose in Banyuwangi
Mostly, wind speed in Banyuwangi occurred at of 2.1 – 3.6 m/s with the number of 5,675 events.
Dominant wind directions came from the south with a frequency of 2,535 data or 26.65% and from
the south-east with 1,669 data or 19.36%. Figure 3.8 shows wind rose in degrees and m/s in wind
station in Banyuwangi.
Figure 3.8 Windrose in Banyuwangi
The Study on Potential of Electrical Power and Energy Resulted From Wave Generated by Wind (9122)
Siti Noor Chayati and I Made Andi Arsana (Indonesia)
FIG Working Week 2017
Surveying the world of tomorrow - From digitalisation to augmented reality
Helsinki, Finland, May 29–June 2, 2017

3.6 Windrose in Kalianget
As many as 4,066 events of wind speed occurred in
Kalianget at 2.1–3.6 m/s. Wind distributions show that
dominant wind directions come from the south-east with a
frequency of 2,583 data or 29.49% and from the east with
19.69%. Figure 3.9 shows wind rose in degrees and m/s in
wind station in Kalianget.
Figure 3.9 Windrose in Kalianget
3.7 Windrose in Denpasar
The biggest frequency of wind speed in Denpasar occurred at
2.1–3.6 m/s, with 4,541 events. Dominant wind directions
flew from south-east and east with frequency 25.4% and
24.06% respectively. Figure 3.10 shows wind rose in
Denpasar.
Figure 3.10 Windrose in Denpasar
4. WIND WAVE GENERATION
The wind that flows over the surface of the water could transfer energy into the water. Wind speed
raises the tension at sea surface, so the calm surface of the water initially can be disrupted and
formed small ripples on the water surface. If the wind speed increases, the ripple becomes
increasingly large, and if the wind continues to be formed waves eventually. The longer and
stronger the wind flows, the bigger the waves that formed (Triadmodjo, 1999).
According to Sorensen (1938), the height and wave period affected by the wind speed U, the wind
duration td, wind direction, and fetch F. Wind direction considered to be constant if the
amendments are not more than 15o. Furthermore, the wind speed deemed to be constant if the
changes are not more than 5 knots (2.5 m/s) to the average speed.
The Study on Potential of Electrical Power and Energy Resulted From Wave Generated by Wind (9122)
Siti Noor Chayati and I Made Andi Arsana (Indonesia)
FIG Working Week 2017
Surveying the world of tomorrow - From digitalisation to augmented reality
Helsinki, Finland, May 29–June 2, 2017

An area with unlimited fetch produced waves with certain periods and height. Wave height in these
conditions could not continue to grow and reached a maximum at the time of the energy gained
from wind balanced by the energy lost due to the outbreak of turbulence and waves. This condition
is called fully developed sea (Yuwono, 1982).
Wave forecasting is done for various purposes in activities such as coastal engineering study of the
harbour, coastal structures, coastal erosion and sediment transport, environmental studies, and
estimation of wave energy (Akpinar et al., 2014). To meet these objectives, it has developed a
variety of methods such as empirical, numerical methods and computational methods. Forecasting
waves with the empirical method assume that the wave generation has the main factors namely
wind speed (U), the long fetch (F), and wind duration (td). Empirical methods such as SMB,
Wilson, JONSWAP, and CEM is an example of a simple method for predicting a wave under
certain conditions.
According to the U.S. Army (1984), five factors must be considered in the conversion of wind data
for the generation of waves, namely: elevation, wind duration, stability correction, location effect,
and wind stress factor.
4.1 SMB Method
Sverdrup and Munk originally proposed SMB method in 1974 and later developed by Bretschneider
in 1952 and 1958 based on research conducted in Lake Ontario (Bishop, 1983 in Etemad-Shahidi et
al., 2009). According to Bretschneider (1964), wind speed (UA) which flows along the fetch (F)
produces wave component to the equation 4.1 and 4.2.
............................................................. 4.1
................................................................... 4.2
Where:
H : wave height (m)
T : wave periods (s)
F : fetch (m)
g : Earth gravitation (m/s2)
Fetch (F) are used depending on wave conditions. Wave conditions are limited duration if the
value of ttmin ≤ t. In this condition fetch value used is the minimum value of the equation 4.3 and
4.4.
........................................................................................... 4.3
.................................................................................. 4.4
Where:
tmin : minimum duration (dt)
Fmin : minimum fetch (m)
4.2 Wilson Method
The Study on Potential of Electrical Power and Energy Resulted From Wave Generated by Wind (9122)
Siti Noor Chayati and I Made Andi Arsana (Indonesia)
FIG Working Week 2017
Surveying the world of tomorrow - From digitalisation to augmented reality
Helsinki, Finland, May 29–June 2, 2017

Wilson (1965) suggested the form of wave generation equation using the value U10. Wave
component can be solved by equation 4.5, 4.6, and 4.7.
.................................................. 4.5
................................................... 4.6
.................................................................................. 4.7
4.3 JONSWAP Method
JONSWAP is the cooperative activities carried out by researchers in the UK, Netherlands, USA,
and Germany to acquire waveform data. They developed the wave function empirically based on
the results of the study at 13 sites located along the 160 km of Sylt Island in Germany toward North
Sea (Hasselmann et al., 1973). Wave components generated by the wind calculated with the
equation 4.8, 4.9, and 4.10.
........................................................................................... 4.8
.......................................................................................... 4.9
........................................................................................... 4.10
4.4 CEM Method
CEM was prepared to provide relevant guidance of shore engineering activities through the
combination development of JONSWAP and assumption that the local wave field propagates at
speeds approaching the speed 0.85 times the peak spectral wave (U.S. Army, 2006). Wave
components generated by the wind fetch and limited duration condition calculated with the equation
4.11, 4.12, and 4.13. While, for fully developed sea condition done by equation 4.14, 4.15, and
4.16.
.............................................................................. 4.11
......................................................................................... 4.12
................................................................................... 4.13
............................................................................................ 4.14
............................................................................................ 4.15
................................................................................................ 4.16
4.5 Wave Generation
Ocean wave generation by the wind in each study site performed on data derived from the dominant
wind direction. Significant wave is one of the wave types that most widely used. In this study, the
results of wave generation components (H and T) calculated a mean value of 33 percent or one-third
The Study on Potential of Electrical Power and Energy Resulted From Wave Generated by Wind (9122)
Siti Noor Chayati and I Made Andi Arsana (Indonesia)
FIG Working Week 2017
Surveying the world of tomorrow - From digitalisation to augmented reality
Helsinki, Finland, May 29–June 2, 2017

highest waves. Equation 4.17 and 4.18 are used to derive the value of the significant wave in each
direction of the dominant wind. Table 4.1 shows the calculation result of wave generation by wind.
............................................................................................ 4.17
.............................................................................................. 4.18
Where:
H33%, T33% : 33% average wave height and period
f : event frequency
Table 4.1 Wave generation calculation in Tangerang
Methods
Significant wave Waves average
Direction Hs (m) Ts (dt) H (m) T (dt)
Location: Tangerang
SMB West 0.83 1.25
0.24 0.58 North 0.38 0.82
Wilson West 0.72 1.23
0.38 0.99 North 0.52 1.11
JONSWAP West 0.60 1.09
0.32 0.88 North 0.44 0.99
CEM West 1.40 1.94
0.73 1.57 North 1.05 1.79
Location: Cilacap
SMB Southeast 0.17 1.5
0.1 1.13 East 0.16 1.46
Wilson Southeast 0.32 3.30
0.22 2.59 East 0.31 3.23
JONSWAP Southeast 0.82 3.26
0.61 2.92 East 0.8 3.23
CEM Southeast 1.75 1.82
1.63 1.91 East 1.74 1.83
Location: Semarang
SMB North 0.19 1.57
0.13 1.19 Northwest 0.30 1.98
Wilson North 0.35 3.42
0.24 2.67 Northwest 0.49 4.09
JONSWAP North 0.85 3.33
0.66 2.99 Northwest 1.08 3.61
CEM North 1.89 1.90 1.74 1.99
Location: Surabaya
SMB East 2.66 5.90
1.24 3.78 Southeast 1.27 2.66
Wilson East 1.55 7.25
1.08 5.85 Southeast 1.16 5.04
The Study on Potential of Electrical Power and Energy Resulted From Wave Generated by Wind (9122)
Siti Noor Chayati and I Made Andi Arsana (Indonesia)
FIG Working Week 2017
Surveying the world of tomorrow - From digitalisation to augmented reality
Helsinki, Finland, May 29–June 2, 2017

JONSWAP East 2.84 5.06
1.98 4.40 Southeast 2.17 4.02
CEM East 2.68 1.63
2.25 1.68 Southeast 2.27 1.7
Location: Banyuwangi
SMB South 0.08 1.03
0.05 0.8 Southeast 0.08 1.05
Wilson South 0.19 2.41
0.13 1.94 Southeast 0.19 2.46
JONSWAP South 0.56 2.86
0.45 2.64 Southeast 0.57 2.87
CEM South 1.65 1.95
1.55 2.01 Southeast 1.66 1.95
Location: Kalianget
SMB East 0.15 1.41
0.09 1.01 Southeast 0.16 1.43
Wilson East 0.30 3.14
0.19 2.33 Southeast 0.31 3.18
JONSWAP East 0.77 3.21
0.56 2.85 Southeast 0.78 3.22
CEM East 1.85 1.94
1.69 2.04 Southeast 1.86 1.93
Location: Denpasar
SMB East 0.29 1.94
0.17 1.41 Southeast 0.39 0.64
Wilson East 0.30 3.14
0.19 2.33 Southeast 0.31 3.18
JONSWAP East 1.47 7.09
0.98 5.70 Southeast 1.10 4.91
CEM East 2.55 1.60
2.12 1.64 Southeast 2.17 1.64
5. COMPARISON OF WAVE GENERATION METHODS
According to Akpinar (2014), a comparison between wind wave generation methods can be made
using the MAE. While Etemad-Shahidi et al. (2009) using a scatter index value analysis to compare
the quality/accuracy of the method. MAE is the absolute average of forecast data error, regardless
of the positive or negative sign which is calculated based on the equation 5.1. MAE measures how
much the prediction results of value is considered correct.
.................................................................................... 5.1
Where:
The Study on Potential of Electrical Power and Energy Resulted From Wave Generated by Wind (9122)
Siti Noor Chayati and I Made Andi Arsana (Indonesia)
FIG Working Week 2017
Surveying the world of tomorrow - From digitalisation to augmented reality
Helsinki, Finland, May 29–June 2, 2017

N : amount of data
yi : prediction result
x : true value (average value)
In statistics, scatter an index is a number that indicates how well the data match with the
method or statistical models. Also, it provides a measure of how well a predictable outcome is
replicated by related variables, as a proportion of the total variation in results is explained by the
model (Etemad-Shahidi et al., 2009 ). Scatter index value obtained from the equation 5.2
........................................................................................... 5.2
Where:
SI : scatter index
Based on wind wave generation using SMB, Wilson, JONSWAP, and CEM then makes a
comparison to see which method is better for wave generation. This value was calculated from the
predicted wave height. Table 5.1 presents the results of the calculation of the value of MAE at each
location.
Table 5.1. MAE Value
MAE Tangerang Cilacap Semarang Surabaya Banyuwangi Kalianget Denpasar
SMB 0.168 0.003 0.083 0.762 0.051 0.050 0.100
Wilson 0.045 0.074 0.128 0.316 0.041 0.086 0.137
JONSWAP 0.0317 0.133 0.229 0.522 0.0809 0.161 0.243
CEM 0.137 0.088 0.163 0.249 0.082 0.139 0.152
The smaller MAE value showed, the better accuracy. Figure 5.1 presents the MAE value in the
graphical form. Results presentation in graphical form shows the most value MAE on SMB method
shows a lower value than the other three methods except locations in Tangerang and Surabaya. In
Surabaya and Tangerang MAE value on SMB method is the highest value. Analysis using MAE
provide results that SMB method is the most accurate method
Figure 5.1 MAE value graphic
Comparative statistical analysis using scatter index value showed that the smaller value gives the
better accuracy. Table 5.2 presents the calculation results scatter index values at each study site.
The Study on Potential of Electrical Power and Energy Resulted From Wave Generated by Wind (9122)
Siti Noor Chayati and I Made Andi Arsana (Indonesia)
FIG Working Week 2017
Surveying the world of tomorrow - From digitalisation to augmented reality
Helsinki, Finland, May 29–June 2, 2017

Table 5.2 Scatter index value
Scatter Index Tangerang Cilacap Semarang Surabaya Banyuwangi Kalianget Denpasar
SMB 0.429 0.429 0.141 0.189 0.930 0.191 0.282
Wilson 0.478 0.569 0.357 0.599 0.581 0.398 0.430
JONSWAP 0.483 0.726 0.577 0.657 0.767 0.633 0.597
CEM 0.541 0.931 0.884 0.847 0.928 0.893 0.876
The smaller scatter index values indicated the better accuracy. Figure 5.2 presents the scatter index
values in graphical form. The chart showed almost all scatter indexes on SMB method has a lower
value than the other three methods except the location in Surabaya. Values in Surabaya scatter
index showed the highest value. Analysis using scatter index values provided results that SMB
method is the method most able to replicate the variables related to the method used.
Figure 5.2 Scatter Index graphic
Analysis using MAE and scatter index values indicated that the SMB method is a better method
used in the calculation of wave generation by wind compared with the three other methods. In
studies in Surabaya, SMB method provided the highest MAE and scatter index value. That is
because in Surabaya there were many clear data. Therefore the data predicted results do not have
good proximity to the correct value (mean value).
Wilson method and JONSWAP overall showed results in MAE and Scatter Index value higher than
SMB method. That was because the wave components of the generation of the condition were not
defined and limited duration using fetch equivalent value. While the calculation of wave
components in Jamali showed almost all the waves in conditions of limited duration. In addition to
the calculation method of Wilson and JONSWAP used conversion data at an elevation of 10 m
wind only and is not equipped with other wind corrections. CEM methods and SMB defined the
wave component in the calculation of limited duration conditions. The calculations showed that the
value of MAE and scatter index is higher than the CEM methods SMB method. That was because
of the CEM method used conversion data correction of wind stability and elevation, and it was not
equipped with a correction duration, location, and wind stress factor.
6. CALCULATION OF ENERGY AND POWER
The Study on Potential of Electrical Power and Energy Resulted From Wave Generated by Wind (9122)
Siti Noor Chayati and I Made Andi Arsana (Indonesia)
FIG Working Week 2017
Surveying the world of tomorrow - From digitalisation to augmented reality
Helsinki, Finland, May 29–June 2, 2017

The total energy of a wavelength is the sum of kinetic energy and potential energy (Triatmodjo,
1999). Thus the total energy in a wavelength as in equation 6.1.
...................................................................................... 6.1
Where:
Et : total energy (joule)
Ek : kinetic energy (joule)
Ep : potential energy (joule)
ρ : rho = water density (kg/m3)
g : Earth gravitation (m/s2)
H : wave height (m)
L : wavelength (m)
Wave power by Hulls (1981) in Kadir (1995), the power contained in the wave can be calculated by
the equation 6.2.
..................................................................................................... 6.2
Where:
P : power (W)
T : wave period (s)
: phi (3.14)
Wave for electric energy generation, the capacity and its efficiency depends on the technology used.
Energy per unit area (energy density) is calculated using the equation 6.3
................................................................... 6.3
Where, ED : energy density (J/m2)
Power per unit area (power density) is calculated using equation 6.4.
.................................................................. 6.4
Where, PD : power density (W/m2)
Calculation of energy and wave power was obtained by using the results of significant wave. The
power generated by each of the significant wave calculated using the equation 6.4. Energy and
power captured by the chamber were calculated using the assumption that the size of the chamber
was 10 x 18 m. Table 6.1 presents the results of calculation of energy and power for a significant
wave at each location.
Table 6.1 Energy and power calculation
Direction Wave Generation Method
SMB Wilson JONSWAP CEM
Location: Tangerang
North
PD (W/m2) 38,952.31 54,665.04 43,224.49 138,141.6
ED (J/m2) 32,070.51 60.723.66 42.812.9 246.841.6
West
PD (W/m2) 124,299.2 95,001.85 74,849.38 228,840
ED (J/m2) 154,828.7 116,665.4 81,815.49 443,165.3
The Study on Potential of Electrical Power and Energy Resulted From Wave Generated by Wind (9122)
Siti Noor Chayati and I Made Andi Arsana (Indonesia)
FIG Working Week 2017
Surveying the world of tomorrow - From digitalisation to augmented reality
Helsinki, Finland, May 29–June 2, 2017

Location: Cilacap
Southeast
PD (W/m2) 4,401.283 7,215.931 46,523.18 378,206.3
ED (J/m2) 6,622.083 23,790.43 151,882 688,612.3
East
PD (W/m2) 4,057.8 22,000.58 44,460.13 372,941.5
ED (J/m2) 5,983.183 6,821.306 143,788.7 682,130.6
Location: Semarang
North
PD (W/m2) 5,101.163 8,091.397 49,312.31 426,062.9
ED (J/m2) 8,009.441 27,642.74 164,038 810,997
Northwest
PD (W/m2) 10,291.14 13,135.03 73,243.11 477,797.5
ED (J/m2) 20,406.24 53,773.4 264,608.1 871,328.7
Location: Surabaya
East
PD (W/m2) 270,773 69,340.08 333,964.6 919,924.4
ED (J/m2) 1,596,679 491,326.4 1,655,000 1,470,234
Southeast
PD (W/m2) 137,239.5 55,567.55 245,766.8 651,434.7
ED (J/m2) 364,955.3 272,728.2 968,455 1,068,138
Location: Banyuwangi
South
PD (W/m2) 1.439,033 3,244.737 86,532.62 315,668.2
ED (J/m2) 1.483,462 7,830.037 247,270.4 616,675.8
Southeast
PD (W/m2) 1,525.475 3,395.618 89,409.05 320,305.8
ED (J/m2) 1,608.448 88353.867 257,371.1 623,975.5
Location: Kalianget
East
PD (W/m2) 3,773.184 6,526.539 41,654.38 401,516.3
ED (J/m2) 5,326,146 20,466.52 133,607.4 777.655.6
Southeast
PD (W/m2) 3,939.346 6,740.136 42,659.03 405,137.1
ED (J/m2) 5,645.709 21,401.97 137,557.3 782,751
Location: Denpasar
East
PD (W/m2) 9,470.318 11,660.92 65,807.97 437,493.1
ED (J/m2) 18,411.73 46,006.19 231,039.1 774,805.5
Southeast
The Study on Potential of Electrical Power and Energy Resulted From Wave Generated by Wind (9122)
Siti Noor Chayati and I Made Andi Arsana (Indonesia)
FIG Working Week 2017
Surveying the world of tomorrow - From digitalisation to augmented reality
Helsinki, Finland, May 29–June 2, 2017

PD (W/m2) 53,035.47 5,461.281 31,208.79 273,625.6
ED (J/m2) 33,972.39 13,229.49 87,761.41 536,267.8
The potential calculation of the energy and power at each location was performed on two of the
most dominant direction. The results of these calculations were used to determine the direction of
the power plant. Based on these calculations, the power plant direction to be built in Tangerang was
at West that produces energy and power greater than the north. At study sites in Cilacap, the best
direction was to the south-east. As for the research site in Semarang and Surabaya, the best
directions were north-west and east respectively. Meanwhile, in Banyuwangi and Kalianget, the
best power plant direction to be built was in the south-east. Moreover, in Denpasar, the appropriate
direction to be built is at East.
7. CALCULATION OF SEABED SLOPE
Analysis of the seabed carried out to determine the magnitude of the seabed slope. Seabed profile
that was used in each study area is profiled at dominant wind direction, drawn from the coast to
approximately 50 m depth. According Zuidam (1983) in Arifianti (2011), the profile of the seabed
that category is flat if it has a slope with 0o - 2,2
o. Table 7.1 presents the calculation results seabed
slope of the beach profile to a depth of about 50 m.
Table 7.1 Seabed Slope Calculation
Location Direction Slope (o)
Tangerang North 0.06
West 0.04
Cilacap Southeast 0.17
East 0.06
Semarang North 0.03
Northwest 0.01
Surabaya East 0.06
Southeast 0.07
Banyuwangi South 0.05
Southeast 0.1
Kalianget East 0.12
Southeast 0.17
Denpasar East 0.6
Southeast 0.65
Slope obtained from the comparison of tangent value between the ocean depths to the distance from
the coast. Slope calculation results indicated that the overall study area was a flat area, with the
slope value was less than 2.2o.
8. CONCLUSION
1. The faster wind speed, the longer wind duration and the longer will provide high-value
components and a larger wave period.
The Study on Potential of Electrical Power and Energy Resulted From Wave Generated by Wind (9122)
Siti Noor Chayati and I Made Andi Arsana (Indonesia)
FIG Working Week 2017
Surveying the world of tomorrow - From digitalisation to augmented reality
Helsinki, Finland, May 29–June 2, 2017
2. SMB method is a more accurate method to be used in the calculation of wave generation method
than Wilson, JONSWAP, and CEM. Based on an analysis using the value MAE showed most
SMB method shows a lower value than the other three methods except locations in Tangerang
and Surabaya. Meanwhile almost all scatter index value on SMB method shows a lower value
than the other three methods except the site in Surabaya.
3. The power plant direction to be built in Tangerang was at West that produces energy and power
greater than the north. At study sites in Cilacap, the best direction was to the south-east. As for
the research site in Semarang and Surabaya, the best directions were north-west and east
respectively. Meanwhile, in Banyuwangi and Kalianget, the best power plant direction to be built
was in the south-east. Moreover, in Denpasar, the appropriate direction to be built was at East
that produces energy and power that is greater than the south-east.
4. Slope seabed profile in the study area was flat where the slope value is less than 2,2o. The area
with the largest slope was in Denpasar, with a gradient value 0.6 and 0.65.
ACKNOLEGEMENT
This paper was supported by Indonesia Endowment Fund for Education, Ministry of Finance
Republic of Indonesia.
REFERENCES
Akpinar, A., Özger, M., and Kömürcü, M.I., 201, Prediction of Wave Parameters by Using Fuzzy
Inference System and the Parametric Models Along The South Coast of The Black Sea, Journal
Marine Science Technology, 19, pp. 1 s.d 14.
Arifianti, Y., 2011, Potensi Longsor Dasar Laut di Perairan Maumere, Bulletin Vulkanologi dan
Bencana Geologi, 6(1), pp. 54 s.d 62.
Bretschneider, C.L., 1964, Generation of Waves by Wind State of the Art. Presented at International
Summer Course Lunteren, The Netherlands.
Etemad-Shahidi, A., Kazeminezhad, M.H., and Mousavi, S.J., 2009, On the Prediction of Wave
Parameters using Simplified Methods, Journal of Coastal Research, SI 56, Proceedings of the
10th
International Coastal Symposium, pp. 505 s.d 509, Lisbon, Portugal.
Hasselmann, K., et al., 1973, Measurements of Wind-Wave Growth and Swell Decay during the
Joint North Sea Wave Project (JONSWAP), Deutsches Hydrographisches Institut, Hamburg.
Kadir, A., 1995, Energi; Sumberdaya, Inovasi, Tenaga Listrik dan Potensi Ekonomi, Edisi Kedua,
UI Press, Jakarta.
Muchlis, M., and Permana, A.D., 2006, Proyeksi Kebutuhan Listrik PLN di Indonesia Tahun 2003
s.d 2020, Editor: Lubis, A.B., and Djamin, M., Pengembangan Sistem Kelistrikan dalam
Pembangunan Nasional Jangka Panjang, pp. 19 s.d 30, Jakarta, BPPT.
Sorensen, R.M., 1938, Basic Coastal Engineering, John Wiley & Sons, New York.
Triatmodjo, B., 1999, Teknik Pantai, Beta Offset, Yogyakarta.
U.S. Army, 1984, Shore Protection Manual Volume I, Fourth Edition, U.S. Government Printing
Office, Washington D.C.
U.S. Army, 2006, Coastal Engineering Manual, Departement of the Army U.S. Army Corps of
Engineers, Washington D.C.
The Study on Potential of Electrical Power and Energy Resulted From Wave Generated by Wind (9122)
Siti Noor Chayati and I Made Andi Arsana (Indonesia)
FIG Working Week 2017
Surveying the world of tomorrow - From digitalisation to augmented reality
Helsinki, Finland, May 29–June 2, 2017

Wilson, B.W.,1965, Numerical Prediction of Ocean Waves in the North Atlantic for December
1959, Deutsche Hydrograph, 18 (3), pp. 114 s.d 130.
Yuwono, N., 1982, Teknik Pantai Volume I, Biro Penerbit Keluarga Mahasiswa Teknik Sipil,
Fakultas Teknik, Universitas Gadjah Mada, Yogyakarta.
BIOGRAPHICAL NOTES
Siti Noor Chayati is an MSc Hydrographic Surveying student in University College London, UK.
Chae holds a Bachelor degree in Geodetic Engineering from Universitas Gadjah Mada (UGM). Her
interests include hydrographic surveying, oceanography, and positioning.
I Made Andi Arsana is a lecturer and researcher at Geodetic Engineering, UGM. He holds Bachelor
degree in Geodetic Engineering from UGM, M.E. in Surveying & Spatial Information Systems
from the University of New South Wales, and PhD in Ocean Affairs and Law of the Sea, University
of Wollongong. His research interests include maritime and land boundary, geospatial aspects of the
law of the sea, and Geographic Information System.
CONTACTS
Siti Noor Chayati, S.T
Perum Mangunsari Asri Gang Cendana No. 56 RT 7/4
Mangunsari, Gunungpati, Semarang 50227 INDONESIA
+44 7729202719 / +62 85740729872
[email protected] / [email protected]
I Made Andi Arsana, S.T., M.E., PhD
Department of Geodetic and Geomatics Engineering
Faculty of Engineering, Universitas Gadjah Mada, Yogyakarta 55281 INDONESIA
+62 274 902121
The Study on Potential of Electrical Power and Energy Resulted From Wave Generated by Wind (9122)
Siti Noor Chayati and I Made Andi Arsana (Indonesia)
FIG Working Week 2017
Surveying the world of tomorrow - From digitalisation to augmented reality
Helsinki, Finland, May 29–June 2, 2017