the sugarland-water exercise
TRANSCRIPT

1
The Sugarland-Water Exercise
An Introduction to Environmental –Economic Accounts
for Water (SEEA-Water)
ACKNOWLEDGEMENTS
This exercise was prepared by Ricardo Martinez-Lagunes, from UNDESA, with inputs from Michael Vardon, Australian Bureau of Statistics, and Kristina Taboulchanas, UNECLAC.
6 November 2013 Rev 19

2
Water in Sugarland Sugarland is an island of 1 700 km2 with nearly 615 thousand inhabitants in 2010. The economy of the island is mainly based on the export of sugar. Sugarland also receives income from services of accommodation and food offered to the tourists that visit the island. Tourism to Sugarland is rapidly growing and offers great opportunities for development; however, it also increases significantly the demand of water, which may put the island at risk. Sugarland receives abundant precipitation, 1 300 mm of rainfall per year, but it is mainly concentrated in the summer. The island does not have lakes or artificial reservoirs to store water, so most of the runoff generated by precipitation flows to the sea through small rivers and streams. About 5% of the precipitation infiltrates to a large aquifer that is the main source of water for the island. All the water needed for the irrigation of sugarcane, for the hotels and restaurants, for households, and for other activities is abstracted from the subjacent aquifer. The aquifer is vulnerable to seawater intrusion. This means that if the water table drops below a certain level, seawater will penetrate the aquifer and salinize all the groundwater in the country. The overexploitation of the aquifer has already caused a significant drop of the water table. If the water table continues to drop, it will cause salinization of the aquifer. At the current rate of water abstraction it is expected that the aquifer will salinize after the year 2025; however, with the quick growth of the economy, the aquifer may have problems much sooner than that.
Table 1. Summary of information about Sugarland
Population in 2010 614 977
Proportion of population with piped water (%) 99%
Proportion of population connected to the sewer network (%) 96%
Area of the island (km2) 1 700
Average precipitation (mm/year) 1 300
Surface runoff (as proportion of precipitation) 65%
Infiltration to aquifers (as proportion of precipitation) 5%
Water abstracted by the water utility (hm3/year) 100 Losses in the drinking water distribution network (%) 50% Water abstracted for agriculture (hm3/year) 54 Losses in conveyance of water in agriculture 40% Water abstracted by sugar mills (hm3/year) 5 Water abstracted by various manufacturing activities (hm3/year) 5
NOTE: 1 hm3 = 1 million cubic meters There are no sales taxes in Sugarland. There are no subsidies on products either.

3
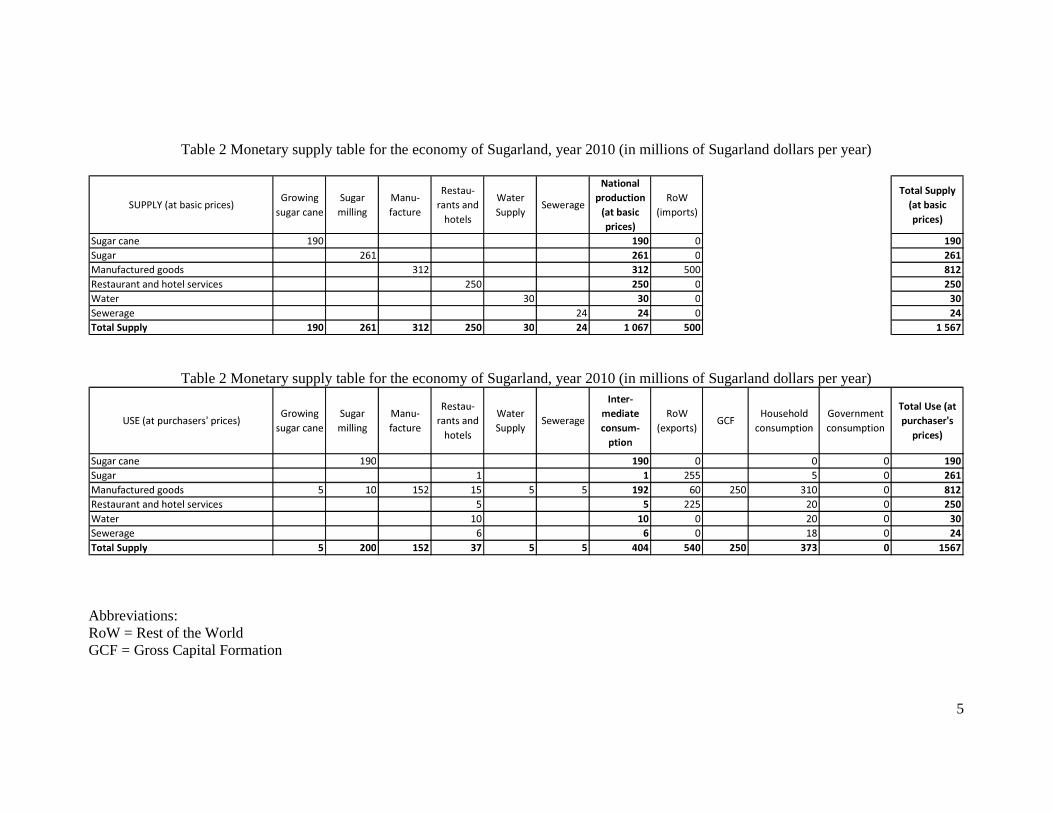
The Economy of Sugarland Tables 1 and 2 present information about the economy of Sugarland. It is a very simple economy, with only six economic activities, shown in the columns. The rows of the supply table show the products produced by each economic activity (for example, the activity of sugar milling produces sugar worth 261 million dollars). The rows of the use table show the products consumed by each of the economic activities, as well as by households and government (for example, to produce the 261 million dollars worth of sugar, it was necessary to consume 190 million dollars worth of sugar cane and 10 million dollars worth of manufactured goods). It can be noted that the total sum of each row in the supply table is equivalent to the sum of each row in the use table, since supply is equal to use. The supply table is usually compiled in basic prices and the use table is compiled in purchasers’ prices. However, for this example purchasers’ prices and basic prices are the same. Additional Assumptions
• 40% of the losses in the drinking water supply distribution network infiltrate to the aquifer, the rest go to the sea.
• “Water consumption” (water evaporated or transpired by an activity. Not to be confused with consumption as defined in the SNA) is:
o 27.5% for households. o 20% for hotels and restaurants. o 60% in sugar mills. o 60% in the different manufacturing activities. o 55% in growing sugar cane.
• The losses in conveyance of water in agriculture infiltrate to the aquifer. • Returns from sugarcane fields are discharged to surface water bodies. • Wastewater from sugar mills is discharged to surface water bodies, after
treatment. • Wastewater from manufacturing industries is discharged to the sea, after
treatment.. • The sewerage utility discharges the wastewater collected to the sea, after
treatment. • Of the water delivered through the drinking water supply network, 80% is
delivered to households and the rest is delivered to restaurants and hotels. Exercise
1. For the supply and use tables of the economy of Sugarland provided, identify the industrial activities and products according to the ISIC and CPC standards, and calculate the Gross Domestic Product (GDP). For each activity record the
4
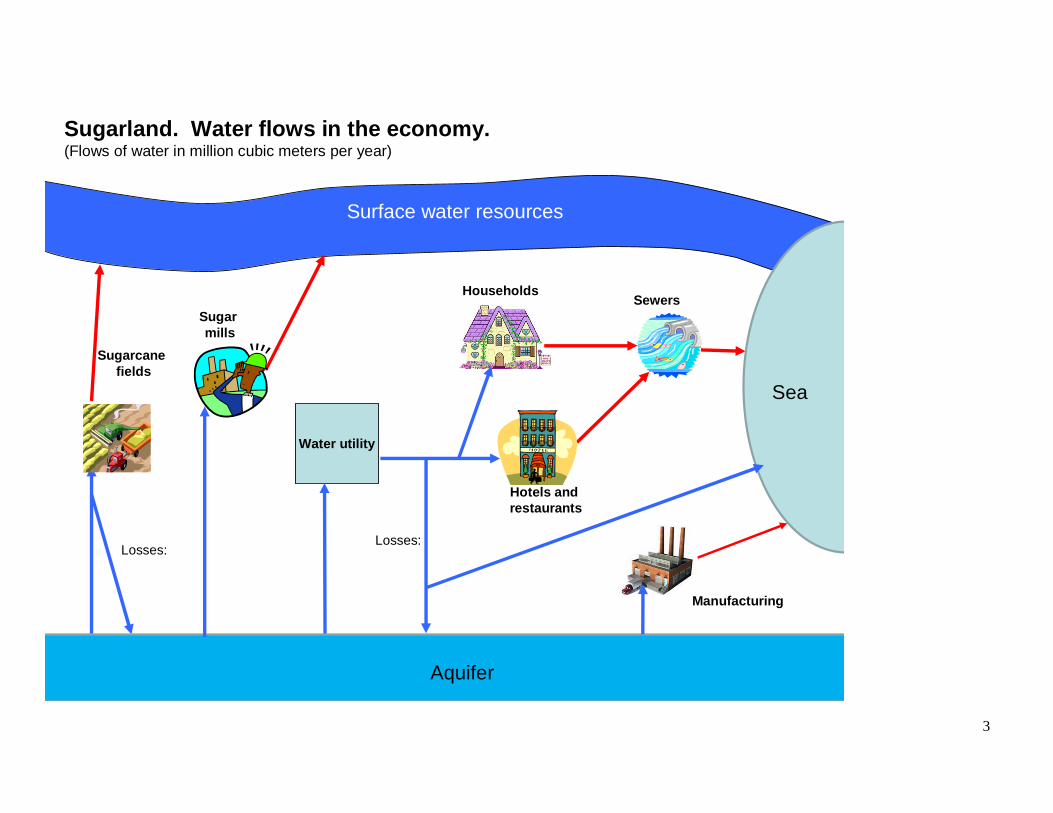
amount of water abstracted, and draw a diagram of the water flows in the island. Record the information in supply and use tables.
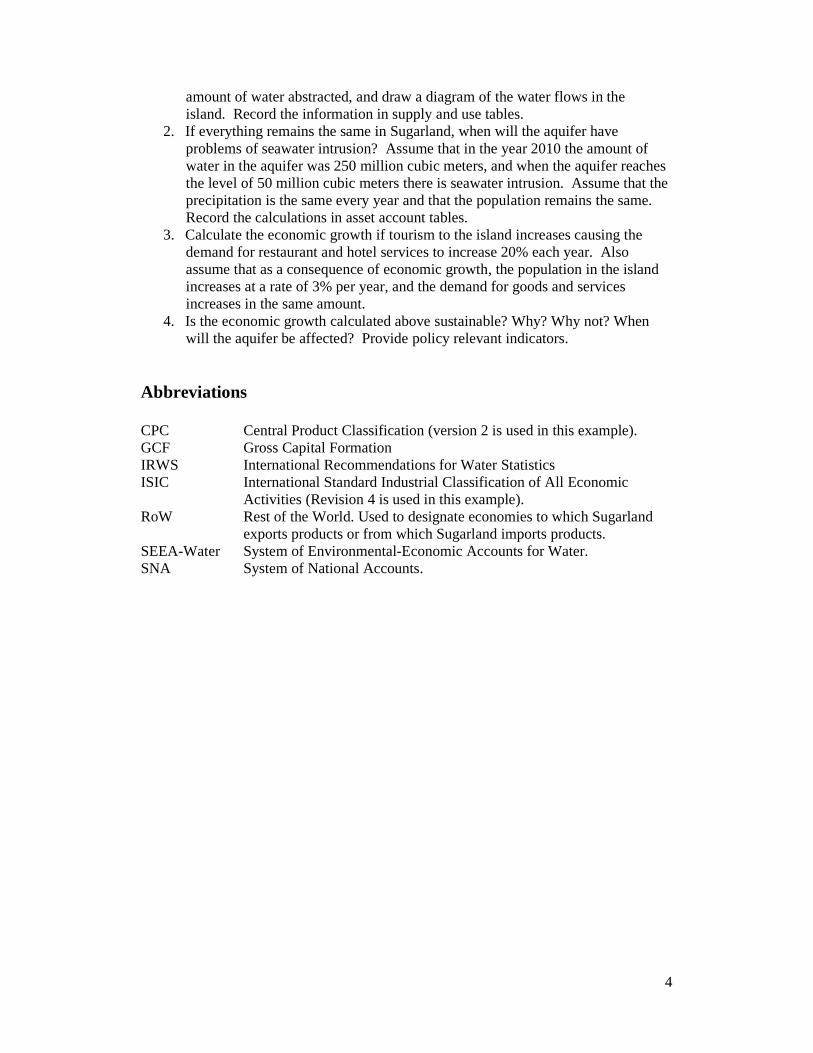
2. If everything remains the same in Sugarland, when will the aquifer have problems of seawater intrusion? Assume that in the year 2010 the amount of water in the aquifer was 250 million cubic meters, and when the aquifer reaches the level of 50 million cubic meters there is seawater intrusion. Assume that the precipitation is the same every year and that the population remains the same. Record the calculations in asset account tables.
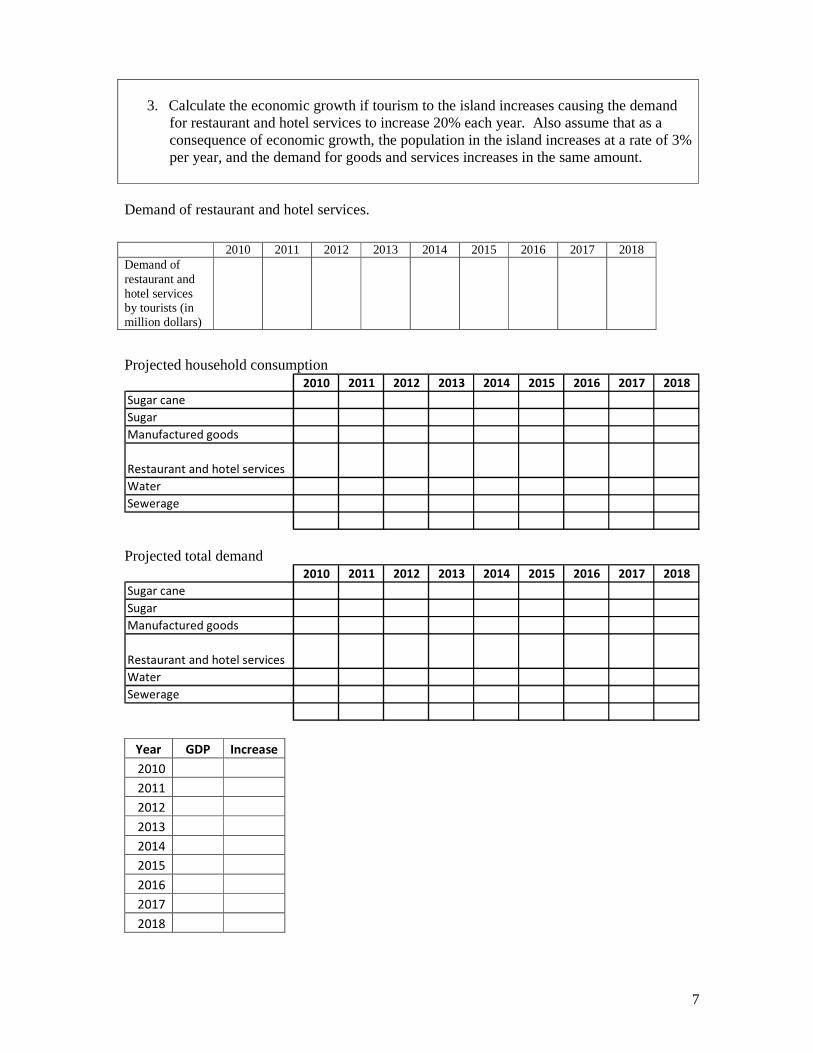
3. Calculate the economic growth if tourism to the island increases causing the demand for restaurant and hotel services to increase 20% each year. Also assume that as a consequence of economic growth, the population in the island increases at a rate of 3% per year, and the demand for goods and services increases in the same amount.
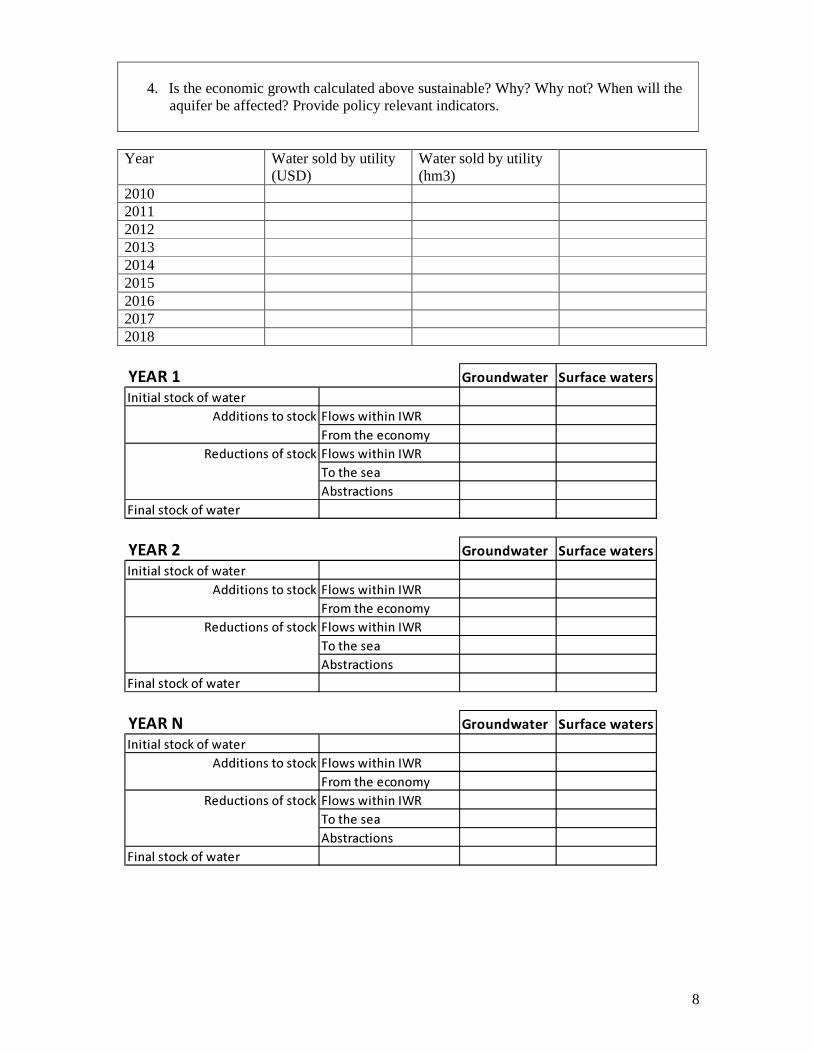
4. Is the economic growth calculated above sustainable? Why? Why not? When will the aquifer be affected? Provide policy relevant indicators.
Abbreviations CPC Central Product Classification (version 2 is used in this example). GCF Gross Capital Formation IRWS International Recommendations for Water Statistics ISIC International Standard Industrial Classification of All Economic
Activities (Revision 4 is used in this example). RoW Rest of the World. Used to designate economies to which Sugarland
exports products or from which Sugarland imports products. SEEA-Water System of Environmental-Economic Accounts for Water. SNA System of National Accounts.
5
Table 2 Monetary supply table for the economy of Sugarland, year 2010 (in millions of Sugarland dollars per year)
SUPPLY (at basic prices)Growing
sugar cane
Sugar
milling
Manu-
facture
Restau-
rants and
hotels
Water
SupplySewerage
National
production
(at basic
prices)
RoW
(imports)
Total Supply
(at basic
prices)
Sugar cane 190 190 0 190
Sugar 261 261 0 261
Manufactured goods 312 312 500 812
Restaurant and hotel services 250 250 0 250
Water 30 30 0 30
Sewerage 24 24 0 24
Total Supply 190 261 312 250 30 24 1 067 500 1 567
Table 2 Monetary supply table for the economy of Sugarland, year 2010 (in millions of Sugarland dollars per year)
USE (at purchasers' prices)Growing
sugar cane
Sugar
milling
Manu-
facture
Restau-
rants and
hotels
Water
SupplySewerage
Inter-
mediate
consum-
ption
RoW
(exports)GCF
Household
consumption
Government
consumption
Total Use (at
purchaser's
prices)
Sugar cane 190 190 0 0 0 190
Sugar 1 1 255 5 0 261
Manufactured goods 5 10 152 15 5 5 192 60 250 310 0 812
Restaurant and hotel services 5 5 225 20 0 250
Water 10 10 0 20 0 30
Sewerage 6 6 0 18 0 24
Total Supply 5 200 152 37 5 5 404 540 250 373 0 1567
Abbreviations: RoW = Rest of the World GCF = Gross Capital Formation
1
The Sugarland-Water Exercise
An Introduction to Environmental –Economic Accounts
for Water (SEEA-Water)
WORKBOOK
6 November 2013 Rev. 7

2
1. For the supply and use tables of the economy of Sugarland provided, identify the industrial activities and products according to the ISIC and CPC standards, and calculate the Gross Domestic Product (GDP). For each activity record the amount of water abstracted, and draw a diagram of the water flows in the island. Record the information in supply and use tables
Carefully review the summary of information and additional assumptions provided with the exercise to fill in the tables below and draw the diagrams.
Activity ISIC code Water abstraction
Growing of sugarcane Manufacture of sugar Various manufacturing activities Accommodation, food, and beverage
Water supply
Sewerage Households
Products CPC code
Sugarcane
Sugar Manufactured goods, services, and minerals
Restaurant and hotel services Water
Sewerage
GDP =
IRWS code and description
Quantity Calculation
B.1. Precipitation
C.1. Evapotranspiration
D.5. Surface runoff
D.6. Infiltration
3
Surface water resources
Water utility
Sugarcanefields
Losses:
Households
Sugar mills
Losses:
Sewers
Sugarland. Water flows in the economy.(Flows of water in million cubic meters per year)
Sea
Aquifer
Manufacturing
Hotels and restaurants

4
Surface water
Sugarland. Water flows to and from inland water resources(Flows of water in million cubic meters per year)
Sea
Aquifer
Soil
Returns from Sugarcanefields and sugar mills
Wastewater from sewers and Manufacturing. Losses from water supplynetwork
Losses
Abstractions
B.1C.1
D.5D.6

5
SUPPLYSugar
cane
Sugar
milling
Manufact
ure
Restaura
nts and
hotels
Drinking
Water
Sewerag
e
House-
holds
Environm
ent to
Economy
SUM
Natural inputs Surface water
Natural inputs Groundwater
CPC 18000 Water
CPC 94110 Sewerage
Residuals Losses of water
Residuals Sewage
Residuals Treated wastewater
Residuals Water returns
Residuals Water vapor ("water consumption")
SUM
USESugar
cane
Sugar
milling
Manufact
ure
Restaura
nts and
hotels
Drinking
Water
Sewerag
e
House-
holds
Economy
to
Environm
ent
SUM
Natural inputs Surface water
Natural inputs Groundwater
CPC 18000 Water
CPC 94110 Sewerage
Residuals Losses of water
Residuals Sewage
Residuals Treated wastewater
Residuals Water returns
Residuals Water vapor (evapotranspiration)
SUM

6
2. If everything remains the same in Sugarland, when will the aquifer have problems of
seawater intrusion? Assume that in the year 2010 the amount of water in the aquifer was 250 million cubic meters and when the aquifer reaches the level of 50 million cubic meters there is seawater intrusion. Assume that the precipitation is the same every year and that the population remains the same Record the calculations in asset account tables..
YEAR 1 Groundwater Surface waters
Initial stock of water
Flows within IWR
From the economy
Flows within IWR
To the sea
Abstractions
Final stock of water
YEAR 2 Groundwater Surface waters
Initial stock of water
Flows within IWR
From the economy
Flows within IWR
To the sea
Abstractions
Final stock of water
YEAR N Groundwater Surface waters
Initial stock of water
Flows within IWR
From the economy
Flows within IWR
To the sea
Abstractions
Final stock of water
Reductions of stock
Additions to stock
Additions to stock
Reductions of stock
Reductions of stock
Additions to stock
7
3. Calculate the economic growth if tourism to the island increases causing the demand for restaurant and hotel services to increase 20% each year. Also assume that as a consequence of economic growth, the population in the island increases at a rate of 3% per year, and the demand for goods and services increases in the same amount.
Demand of restaurant and hotel services.
Projected household consumption
2010 2011 2012 2013 2014 2015 2016 2017 2018
Sugar cane
Sugar
Manufactured goods
Restaurant and hotel services
Water
Sewerage
Projected total demand
2010 2011 2012 2013 2014 2015 2016 2017 2018
Sugar cane
Sugar
Manufactured goods
Restaurant and hotel services
Water
Sewerage
Year GDP Increase
2010
2011
2012
2013
2014
2015
2016
2017
2018
2010 2011 2012 2013 2014 2015 2016 2017 2018 Demand of restaurant and hotel services by tourists (in million dollars)
8
4. Is the economic growth calculated above sustainable? Why? Why not? When will the
aquifer be affected? Provide policy relevant indicators.
Year Water sold by utility
(USD) Water sold by utility (hm3)
2010 2011 2012 2013 2014 2015 2016 2017 2018
YEAR 1 Groundwater Surface waters
Initial stock of water
Flows within IWR
From the economy
Flows within IWR
To the sea
Abstractions
Final stock of water
YEAR 2 Groundwater Surface waters
Initial stock of water
Flows within IWR
From the economy
Flows within IWR
To the sea
Abstractions
Final stock of water
YEAR N Groundwater Surface waters
Initial stock of water
Flows within IWR
From the economy
Flows within IWR
To the sea
Abstractions
Final stock of water
Additions to stock
Additions to stock
Reductions of stock
Reductions of stock
Additions to stock
Reductions of stock

9
Some indicators
2009 2010 2011 2012 2013 2014 2015 2016 2017 2018 2019 2020
GDP (million dollars/year)
GDP growth (%)
water abstracted from aquifer (million m3/year)
returns to aquifer (million m3/year)
recharge of aquifer (million m3/year)
net abstraction from aquifer (million m3/year)
GDP/water abstracted (dollars/m3)
MDG 7.5 (water abstraction/TRWR)
Stock of water in the aquifer, end of year (million m3)
SEAWATER INTRUSION
1
The Sugarland-Water Exercise
An Introduction to Environmental –Economic Accounts
for Water (SEEA-Water)
SOLUTION BOOKLET
6 November 2013 Rev. 22
2
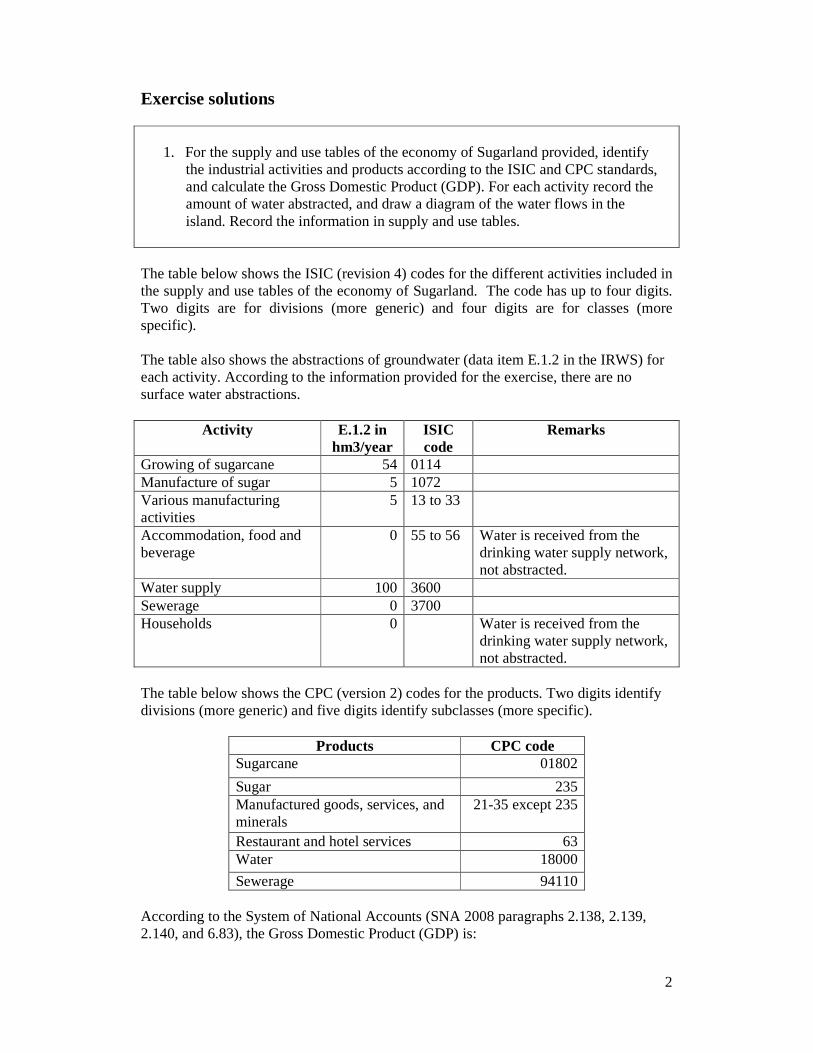
Exercise solutions
1. For the supply and use tables of the economy of Sugarland provided, identify the industrial activities and products according to the ISIC and CPC standards, and calculate the Gross Domestic Product (GDP). For each activity record the amount of water abstracted, and draw a diagram of the water flows in the island. Record the information in supply and use tables.
The table below shows the ISIC (revision 4) codes for the different activities included in the supply and use tables of the economy of Sugarland. The code has up to four digits. Two digits are for divisions (more generic) and four digits are for classes (more specific). The table also shows the abstractions of groundwater (data item E.1.2 in the IRWS) for each activity. According to the information provided for the exercise, there are no surface water abstractions.
Activity E.1.2 in hm3/year
ISIC code
Remarks
Growing of sugarcane 54 0114 Manufacture of sugar 5 1072 Various manufacturing activities
5 13 to 33
Accommodation, food and beverage
0 55 to 56 Water is received from the drinking water supply network, not abstracted.
Water supply 100 3600 Sewerage 0 3700 Households 0 Water is received from the
drinking water supply network, not abstracted.
The table below shows the CPC (version 2) codes for the products. Two digits identify divisions (more generic) and five digits identify subclasses (more specific).
Products CPC code Sugarcane 01802
Sugar 235 Manufactured goods, services, and minerals
21-35 except 235
Restaurant and hotel services 63 Water 18000
Sewerage 94110 According to the System of National Accounts (SNA 2008 paragraphs 2.138, 2.139, 2.140, and 6.83), the Gross Domestic Product (GDP) is:
3
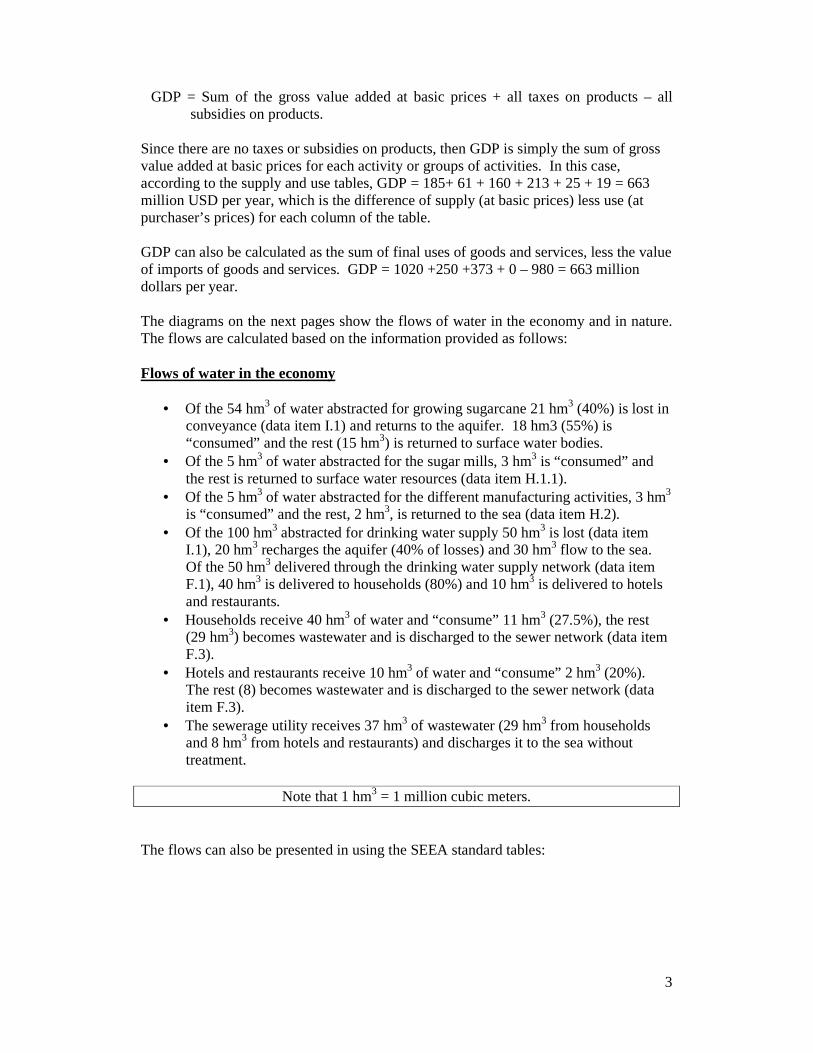
GDP = Sum of the gross value added at basic prices + all taxes on products – all subsidies on products.
Since there are no taxes or subsidies on products, then GDP is simply the sum of gross value added at basic prices for each activity or groups of activities. In this case, according to the supply and use tables, GDP = 185+ 61 + 160 + 213 + 25 + 19 = 663 million USD per year, which is the difference of supply (at basic prices) less use (at purchaser’s prices) for each column of the table. GDP can also be calculated as the sum of final uses of goods and services, less the value of imports of goods and services. GDP = 1020 +250 +373 + 0 – 980 = 663 million dollars per year. The diagrams on the next pages show the flows of water in the economy and in nature. The flows are calculated based on the information provided as follows: Flows of water in the economy
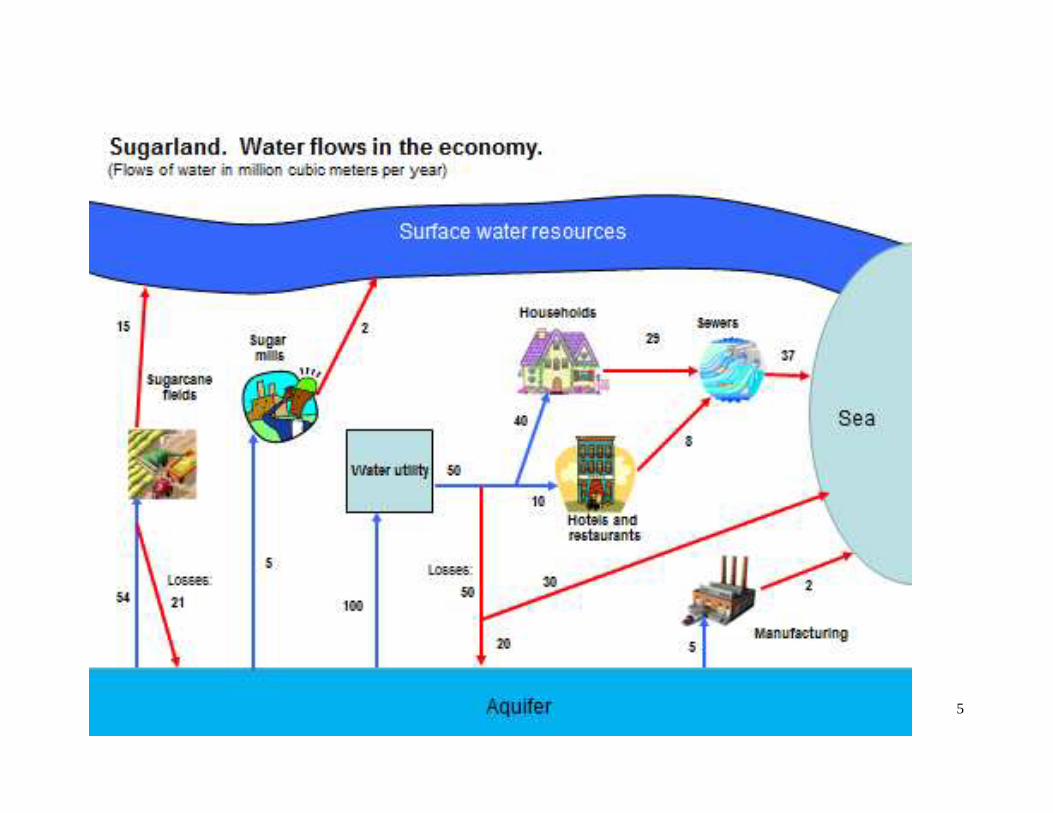
• Of the 54 hm3 of water abstracted for growing sugarcane 21 hm3 (40%) is lost in conveyance (data item I.1) and returns to the aquifer. 18 hm3 (55%) is “consumed” and the rest (15 hm3) is returned to surface water bodies.
• Of the 5 hm3 of water abstracted for the sugar mills, 3 hm3 is “consumed” and the rest is returned to surface water resources (data item H.1.1).
• Of the 5 hm3 of water abstracted for the different manufacturing activities, 3 hm3 is “consumed” and the rest, 2 hm3, is returned to the sea (data item H.2).
• Of the 100 hm3 abstracted for drinking water supply 50 hm3 is lost (data item I.1), 20 hm3 recharges the aquifer (40% of losses) and 30 hm3 flow to the sea. Of the 50 hm3 delivered through the drinking water supply network (data item F.1), 40 hm3 is delivered to households (80%) and 10 hm3 is delivered to hotels and restaurants.
• Households receive 40 hm3 of water and “consume” 11 hm3 (27.5%), the rest (29 hm3) becomes wastewater and is discharged to the sewer network (data item F.3).
• Hotels and restaurants receive 10 hm3 of water and “consume” 2 hm3 (20%). The rest (8) becomes wastewater and is discharged to the sewer network (data item F.3).
• The sewerage utility receives 37 hm3 of wastewater (29 hm3 from households and 8 hm3 from hotels and restaurants) and discharges it to the sea without treatment.
Note that 1 hm3 = 1 million cubic meters.
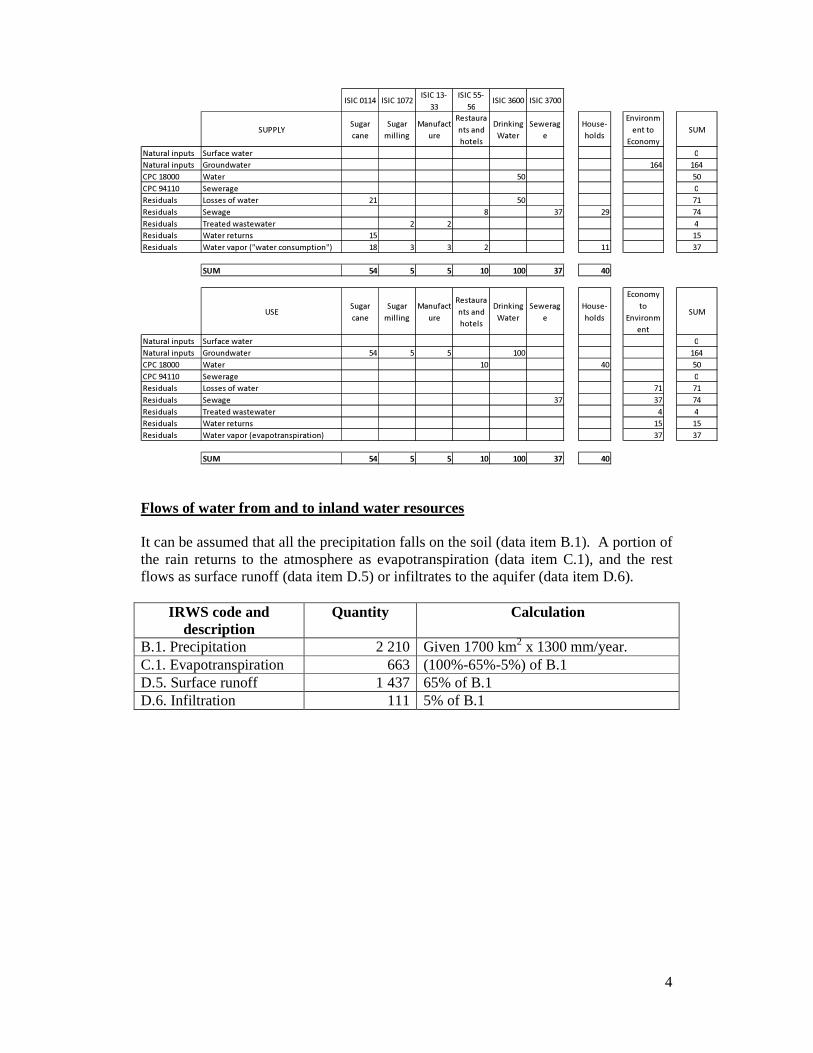
The flows can also be presented in using the SEEA standard tables:
4
ISIC 0114 ISIC 1072ISIC 13-
33
ISIC 55-
56ISIC 3600 ISIC 3700
SUPPLYSugar
cane
Sugar
milling
Manufact
ure
Restaura
nts and
hotels
Drinking
Water
Sewerag
e
House-
holds
Environm
ent to
Economy
SUM
Natural inputs Surface water 0
Natural inputs Groundwater 164 164
CPC 18000 Water 50 50
CPC 94110 Sewerage 0
Residuals Losses of water 21 50 71
Residuals Sewage 8 37 29 74
Residuals Treated wastewater 2 2 4
Residuals Water returns 15 15
Residuals Water vapor ("water consumption") 18 3 3 2 11 37
SUM 54 5 5 10 100 37 40
USESugar
cane
Sugar
milling
Manufact
ure
Restaura
nts and
hotels
Drinking
Water
Sewerag
e
House-
holds
Economy
to
Environm
ent
SUM
Natural inputs Surface water 0
Natural inputs Groundwater 54 5 5 100 164
CPC 18000 Water 10 40 50
CPC 94110 Sewerage 0
Residuals Losses of water 71 71
Residuals Sewage 37 37 74
Residuals Treated wastewater 4 4
Residuals Water returns 15 15
Residuals Water vapor (evapotranspiration) 37 37
SUM 54 5 5 10 100 37 40 Flows of water from and to inland water resources It can be assumed that all the precipitation falls on the soil (data item B.1). A portion of the rain returns to the atmosphere as evapotranspiration (data item C.1), and the rest flows as surface runoff (data item D.5) or infiltrates to the aquifer (data item D.6).
IRWS code and description
Quantity Calculation
B.1. Precipitation 2 210 Given 1700 km2 x 1300 mm/year. C.1. Evapotranspiration 663 (100%-65%-5%) of B.1 D.5. Surface runoff 1 437 65% of B.1 D.6. Infiltration 111 5% of B.1
5

6
7
2. If everything remains the same in Sugarland, when will the aquifer have
problems of seawater intrusion? Assume that in the year 2010 the amount of water in the aquifer was 250 million cubic meters and when the aquifer reaches the level of 50 million cubic meters there is seawater intrusion. Assume that the precipitation is the same every year and that the population remains the same. Record the calculations in asset account tables.
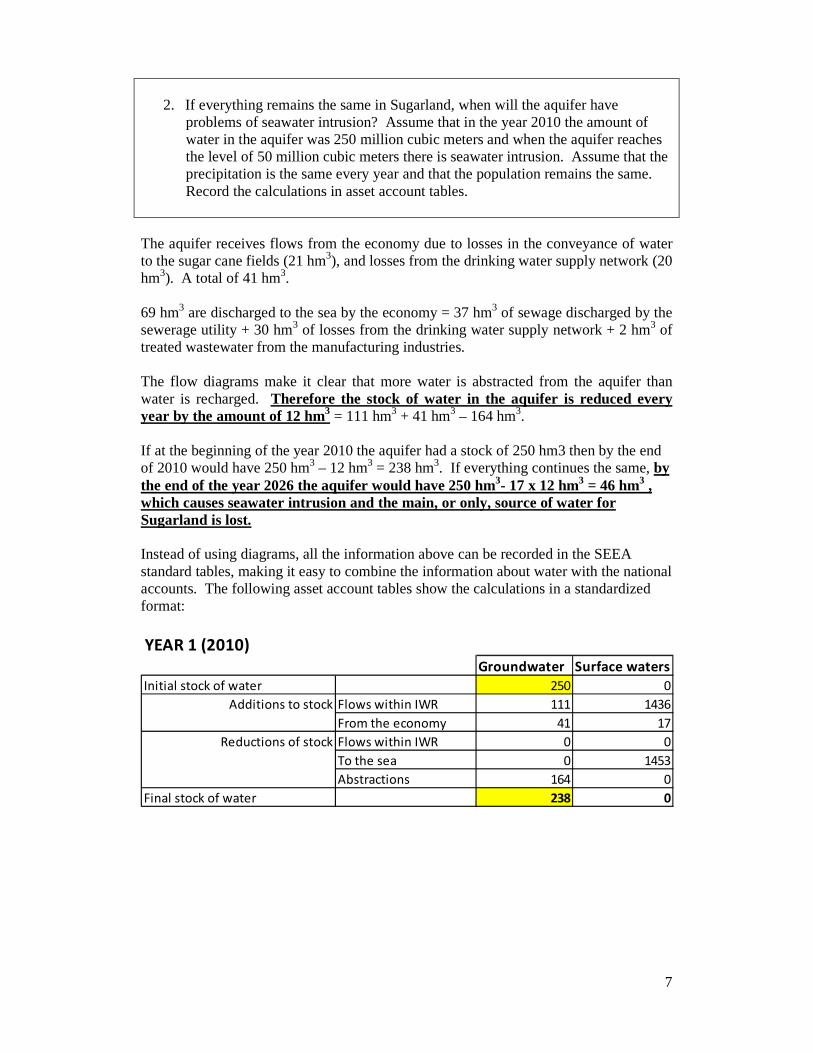
The aquifer receives flows from the economy due to losses in the conveyance of water to the sugar cane fields (21 hm3), and losses from the drinking water supply network (20 hm3). A total of 41 hm3. 69 hm3 are discharged to the sea by the economy = 37 hm3 of sewage discharged by the sewerage utility + 30 hm3 of losses from the drinking water supply network + 2 hm3 of treated wastewater from the manufacturing industries. The flow diagrams make it clear that more water is abstracted from the aquifer than water is recharged. Therefore the stock of water in the aquifer is reduced every year by the amount of 12 hm3 = 111 hm3 + 41 hm3 – 164 hm3. If at the beginning of the year 2010 the aquifer had a stock of 250 hm3 then by the end of 2010 would have 250 hm3 – 12 hm3 = 238 hm3. If everything continues the same, by the end of the year 2026 the aquifer would have 250 hm3- 17 x 12 hm3 = 46 hm3 , which causes seawater intrusion and the main, or only, source of water for Sugarland is lost. Instead of using diagrams, all the information above can be recorded in the SEEA standard tables, making it easy to combine the information about water with the national accounts. The following asset account tables show the calculations in a standardized format:
YEAR 1 (2010)
Groundwater Surface waters
Initial stock of water 250 0
Flows within IWR 111 1436
From the economy 41 17
Flows within IWR 0 0
To the sea 0 1453
Abstractions 164 0
Final stock of water 238 0
Additions to stock
Reductions of stock
8
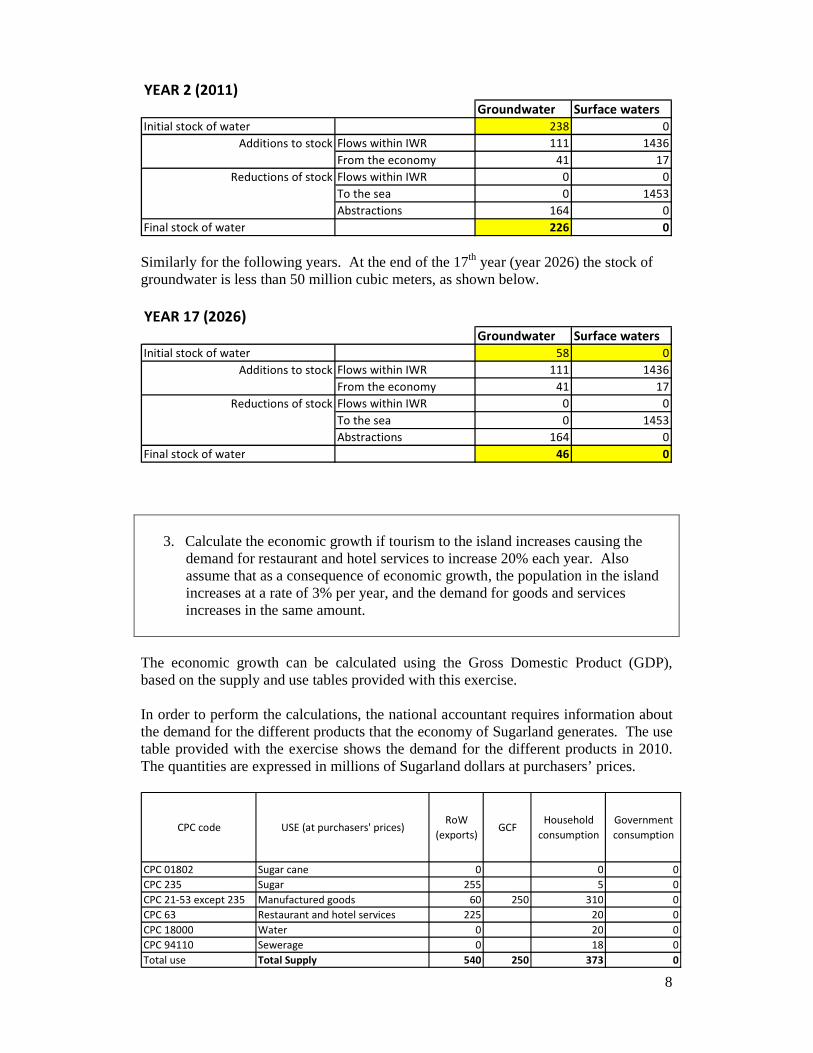
YEAR 2 (2011)
Groundwater Surface waters
Initial stock of water 238 0
Flows within IWR 111 1436
From the economy 41 17
Flows within IWR 0 0
To the sea 0 1453
Abstractions 164 0
Final stock of water 226 0
Additions to stock
Reductions of stock
Similarly for the following years. At the end of the 17th year (year 2026) the stock of groundwater is less than 50 million cubic meters, as shown below. YEAR 17 (2026)
Groundwater Surface waters
Initial stock of water 58 0
Flows within IWR 111 1436
From the economy 41 17
Flows within IWR 0 0
To the sea 0 1453
Abstractions 164 0
Final stock of water 46 0
Additions to stock
Reductions of stock
3. Calculate the economic growth if tourism to the island increases causing the demand for restaurant and hotel services to increase 20% each year. Also assume that as a consequence of economic growth, the population in the island increases at a rate of 3% per year, and the demand for goods and services increases in the same amount.
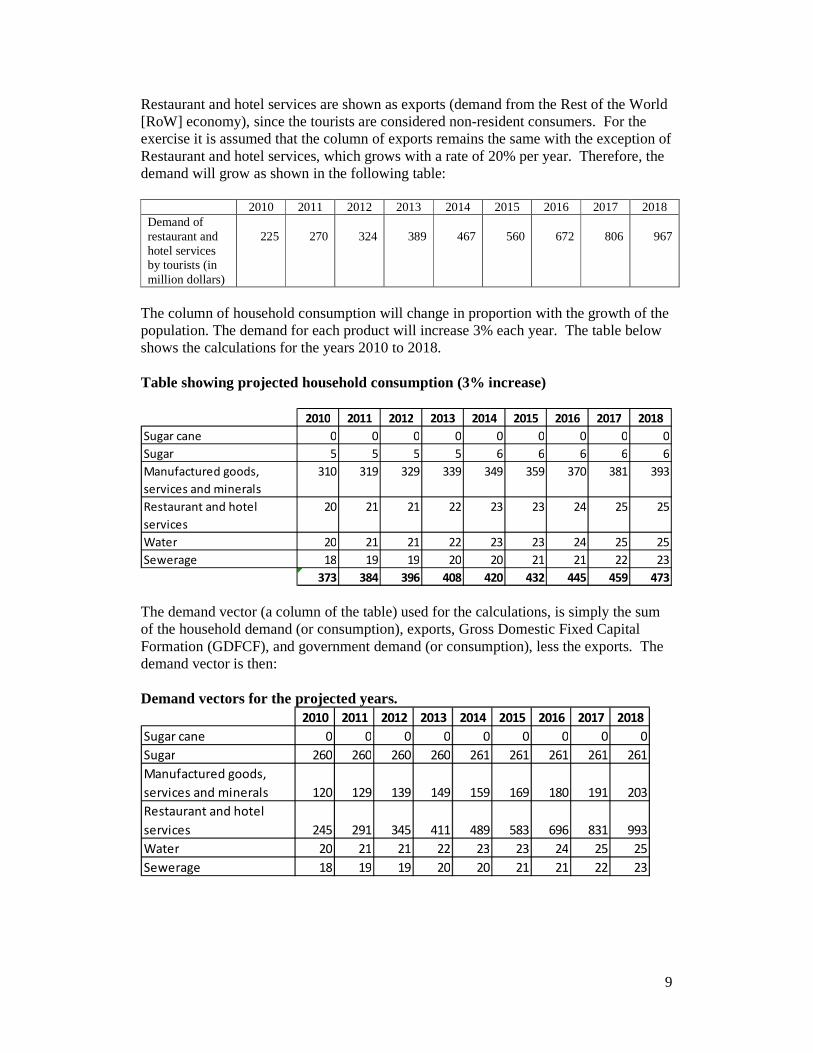
The economic growth can be calculated using the Gross Domestic Product (GDP), based on the supply and use tables provided with this exercise. In order to perform the calculations, the national accountant requires information about the demand for the different products that the economy of Sugarland generates. The use table provided with the exercise shows the demand for the different products in 2010. The quantities are expressed in millions of Sugarland dollars at purchasers’ prices.
CPC code USE (at purchasers' prices)RoW
(exports)GCF
Household
consumption
Government
consumption
CPC 01802 Sugar cane 0 0 0
CPC 235 Sugar 255 5 0
CPC 21-53 except 235 Manufactured goods 60 250 310 0
CPC 63 Restaurant and hotel services 225 20 0
CPC 18000 Water 0 20 0
CPC 94110 Sewerage 0 18 0
Total use Total Supply 540 250 373 0
9
Restaurant and hotel services are shown as exports (demand from the Rest of the World [RoW] economy), since the tourists are considered non-resident consumers. For the exercise it is assumed that the column of exports remains the same with the exception of Restaurant and hotel services, which grows with a rate of 20% per year. Therefore, the demand will grow as shown in the following table: 2010 2011 2012 2013 2014 2015 2016 2017 2018 Demand of restaurant and hotel services by tourists (in million dollars)
225
270
324
389
467
560
672
806
967
The column of household consumption will change in proportion with the growth of the population. The demand for each product will increase 3% each year. The table below shows the calculations for the years 2010 to 2018. Table showing projected household consumption (3% increase)
2010 2011 2012 2013 2014 2015 2016 2017 2018
Sugar cane 0 0 0 0 0 0 0 0 0
Sugar 5 5 5 5 6 6 6 6 6
Manufactured goods,
services and minerals
310 319 329 339 349 359 370 381 393
Restaurant and hotel
services
20 21 21 22 23 23 24 25 25
Water 20 21 21 22 23 23 24 25 25
Sewerage 18 19 19 20 20 21 21 22 23
373 384 396 408 420 432 445 459 473 The demand vector (a column of the table) used for the calculations, is simply the sum of the household demand (or consumption), exports, Gross Domestic Fixed Capital Formation (GDFCF), and government demand (or consumption), less the exports. The demand vector is then: Demand vectors for the projected years.
2010 2011 2012 2013 2014 2015 2016 2017 2018
Sugar cane 0 0 0 0 0 0 0 0 0
Sugar 260 260 260 260 261 261 261 261 261
Manufactured goods,
services and minerals 120 129 139 149 159 169 180 191 203
Restaurant and hotel
services 245 291 345 411 489 583 696 831 993
Water 20 21 21 22 23 23 24 25 25
Sewerage 18 19 19 20 20 21 21 22 23

10
Surface water resources
Water utility
Sugarcanefields
Households
Sugar mills
Sewers
Sugarland. Monetary flows. Not all flows are shown(Monetary flows in millions of dollars per year)
Sea
Aquifer
Manufacturing
Hotels and restaurants
255
10
5
6190
RoW
18
20
225
20
297
105
515
152
11
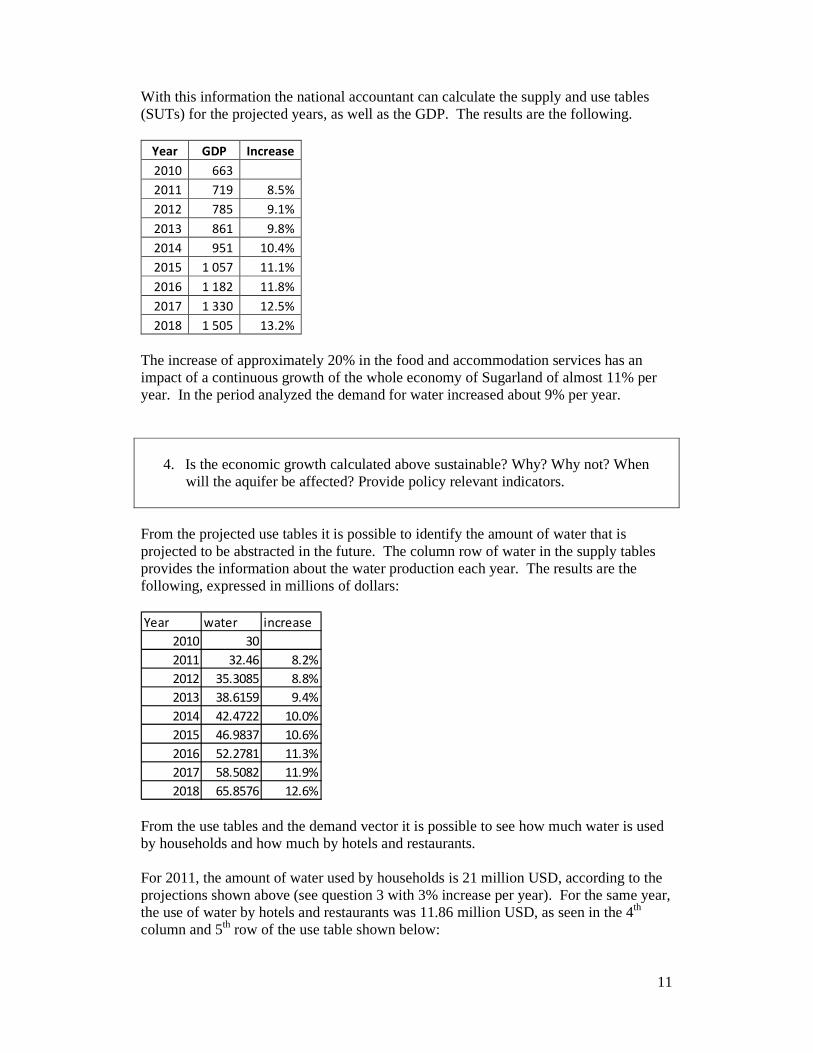
With this information the national accountant can calculate the supply and use tables (SUTs) for the projected years, as well as the GDP. The results are the following.
Year GDP Increase
2010 663
2011 719 8.5%
2012 785 9.1%
2013 861 9.8%
2014 951 10.4%
2015 1 057 11.1%
2016 1 182 11.8%
2017 1 330 12.5%
2018 1 505 13.2%
The increase of approximately 20% in the food and accommodation services has an impact of a continuous growth of the whole economy of Sugarland of almost 11% per year. In the period analyzed the demand for water increased about 9% per year.
4. Is the economic growth calculated above sustainable? Why? Why not? When will the aquifer be affected? Provide policy relevant indicators.
From the projected use tables it is possible to identify the amount of water that is projected to be abstracted in the future. The column row of water in the supply tables provides the information about the water production each year. The results are the following, expressed in millions of dollars: Year water increase
2010 30
2011 32.46 8.2%
2012 35.3085 8.8%
2013 38.6159 9.4%
2014 42.4722 10.0%
2015 46.9837 10.6%
2016 52.2781 11.3%
2017 58.5082 11.9%
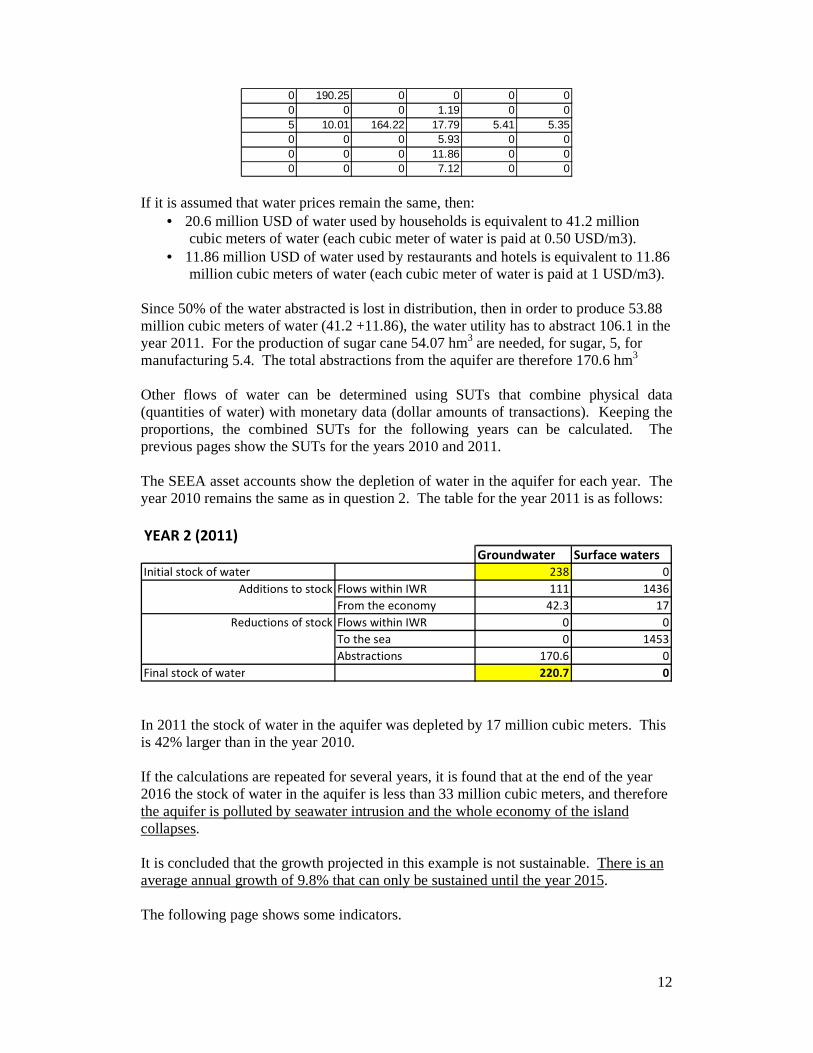
2018 65.8576 12.6% From the use tables and the demand vector it is possible to see how much water is used by households and how much by hotels and restaurants. For 2011, the amount of water used by households is 21 million USD, according to the projections shown above (see question 3 with 3% increase per year). For the same year, the use of water by hotels and restaurants was 11.86 million USD, as seen in the 4th column and 5th row of the use table shown below:
12
0 190.25 0 0 0 00 0 0 1.19 0 05 10.01 164.22 17.79 5.41 5.350 0 0 5.93 0 00 0 0 11.86 0 00 0 0 7.12 0 0
If it is assumed that water prices remain the same, then:
• 20.6 million USD of water used by households is equivalent to 41.2 million cubic meters of water (each cubic meter of water is paid at 0.50 USD/m3).
• 11.86 million USD of water used by restaurants and hotels is equivalent to 11.86 million cubic meters of water (each cubic meter of water is paid at 1 USD/m3).
Since 50% of the water abstracted is lost in distribution, then in order to produce 53.88 million cubic meters of water (41.2 +11.86), the water utility has to abstract 106.1 in the year 2011. For the production of sugar cane 54.07 hm3 are needed, for sugar, 5, for manufacturing 5.4. The total abstractions from the aquifer are therefore 170.6 hm3 Other flows of water can be determined using SUTs that combine physical data (quantities of water) with monetary data (dollar amounts of transactions). Keeping the proportions, the combined SUTs for the following years can be calculated. The previous pages show the SUTs for the years 2010 and 2011. The SEEA asset accounts show the depletion of water in the aquifer for each year. The year 2010 remains the same as in question 2. The table for the year 2011 is as follows: YEAR 2 (2011)
Groundwater Surface waters
Initial stock of water 238 0
Flows within IWR 111 1436
From the economy 42.3 17
Flows within IWR 0 0
To the sea 0 1453
Abstractions 170.6 0
Final stock of water 220.7 0
Additions to stock
Reductions of stock
In 2011 the stock of water in the aquifer was depleted by 17 million cubic meters. This is 42% larger than in the year 2010. If the calculations are repeated for several years, it is found that at the end of the year 2016 the stock of water in the aquifer is less than 33 million cubic meters, and therefore the aquifer is polluted by seawater intrusion and the whole economy of the island collapses. It is concluded that the growth projected in this example is not sustainable. There is an average annual growth of 9.8% that can only be sustained until the year 2015. The following page shows some indicators.

13
Indicators
Yearly growth of restaurant and hotel demand 20% Water losses in drinking water distribution 50%
Yearly growth of population 3% Water losses in conveyance of water for agriculture 39%
2009 2010 2011 2012 2013 2014 2015 2016 2017 2018 2019 2020
GDP (million dollars/year) 663 719 785 861 951 1 057 1 182 1 330 1 505 1 713 1 959
GDP growth (%) 8.5% 9.1% 9.8% 10.4% 11.1% 11.8% 12.5% 13.2% 13.8% 14.4%
water abstracted from aquifer (million m3/year) 164 171 178 186 196 207 220 235 252 272 295
returns to aquifer (million m3/year) 41 42 44 45 47 49 52 55 58 62 66
recharge of aquifer (million m3/year) 111 111 111 111 111 111 111 111 111 111 111
net abstraction from aquifer (million m3/year) 12.0 17.3 23.4 30.2 38.0 46.9 57.2 69.1 82.9 99.0 117.8
GDP/water abstracted (dollars/m3) 4.04 4.22 4.41 4.62 4.85 5.10 5.38 5.67 5.98 6.30 6.64
MDG 7.5 (water abstraction/TRWR) 10.6% 11.0% 11.5% 12.1% 12.7% 13.4% 14.2% 15.2% 16.3% 17.6% 19.1%
Stock of water in the aquifer, end of year (million m3) 250 238.0 220.7 197.3 167.1 129.0 82.1 24.9 -44.2 -127.1 -226.1 -343.9
SEAWATER INTRUSION
GDP and water abstracted
0
200
400
600
800
1000
1200
1400
1600
1800
2000
2009 2010 2011 2012 2013 2014 2015 2016 2017 2018 2019 2020
0
100
200
300
400
500
600
GDP (mi l l i on USD/year)water abs tracted from aqui fer (mi l l i on m3/year)