the supplemental security income program · the supplemental security income program ... we also...
TRANSCRIPT

The Supplemental Security Income Program
Mary C. DalyFederal Reserve Bank of San Francisco
101 Market Street, Mail Stop 1130San Francisco, CA 94105
(415) [email protected]
Richard V. BurkhauserCornell University
Department of Policy Analysis and ManagementN134 Martha Van Rensselaer Hall
Ithaca, NY 14853(607) 255-2097
July 2002
We thank Robert Moffitt, Kathleen McGarry, Kalman Rupp, David Wittenburg, and participants at theNBER Conference on Means-Tested Transfer Programs and two anonymous referees for helpfulcomments. We thank Andrew Houtenville, Robert Weathers, and David Wittenburg for providing data andCarol D’Souza and Heather Royer for research assistance. We also are grateful to Anita Todd andRochelle Frank for editorial assistance, and to Florence Allen for helping compile the document. Theopinions expressed in this paper do not necessarily reflect the views of the Federal Reserve Bank of SanFrancisco.

-1-
The Supplemental Security Income Program
I. Introduction
Supplemental Security Income (SSI) is a nationwide federal assistance program for aged, blind,
and disabled individuals with low incomes. SSI was enacted in 1972 and began paying benefits in 1974,
replacing a patchwork of state-run entitlement programs created under the Social Security Act of 1935 and
its Amendments in 1950. The establishment of SSI was the culmination of a four-year debate over a more
overarching welfare reform proposal—the Family Assistance Plan (FAP)—intended to extend the federal
social safety net to all low income Americans. While Congress eventually rejected the universality of FAP,
it passed SSI, a categorical welfare program based on the same negative income tax principles as FAP but
targeted on a subset of low-income individuals not expected to work—the aged, blind, and disabled.
SSI began as a relatively small program providing benefits to a largely elderly population. Since
that time SSI has grown to become the largest federal means-tested cash assistance program in the U.S.,
with a caseload dominated by children and working-age adults with disabilities. In 2001, an average of 6.7
million people—the vast majority under age 65—received federal and state SSI benefits totaling over $32
billion. Rapid program growth, the changing composition of SSI beneficiaries, and increasing pressure to
devolve federal responsibility for social programs to state governments, as well as to integrate traditional
“non-workers” into the labor market, all have raised questions about the role that SSI plays in the broader
United States social welfare system.
In 1972, those not expected to work included individuals aged 65 and older, the blind, and people
with disabilities. These categories have always been somewhat arbitrary and difficult to establish and
assess, particularly with regard to disability. But dramatic changes in social expectations over who should
work and who should be entitled to income transfers have renewed the debate over who SSI should serve.
On the one hand, individuals are living and working longer and the Americans with Disabilities Act (ADA)
has granted people with disabilities a legal right to equal access to employment, suggesting that the aged,

-2-
blind, and disabled may be better able to work than in the past. On the other hand, the normal retirement
age for Social Security benefits is increasing, welfare reforms have placed limits on the number of years
single mothers with children may receive benefits in lieu of working, and poverty rates among children
remain high. These circumstances suggest that income maintenance programs like SSI will play an
increasingly important role in the U.S. social safety net. All these factors will impact on the politically
determined boundaries of the only remaining federal cash-based means-tested entitlement program without
time limits available to both adults and children.
In this chapter we provide the basic information necessary for SSI policy makers to make informed
choices about its future. In Section II we review the program’s history and describe the structure and
evolution of SSI program rules. In Section III we provide expenditure, caseload, and program recipient
statistics. In Section IV, we summarize the primary economic issues related to the SSI program. In
Section V we review the empirical evidence regarding these issues. We summarize our findings in Section
VI.
II. History and Structure of the SSI Program
The Supplemental Security Income program is a nationwide Federal assistance program
administered by the Social Security Administration (SSA), which pays cash benefits to low-income
individuals who are 65 years of age or older or who are blind or disabled. SSI was enacted in 1972 and
began paying benefits in 1974 replacing the state Old-Age Assistance, Aid to the Permanently and Totally
Disabled, and Aid to the Blind Programs created by the Social Security Act of 1935 and its amendments in
1950. In this section we review the history of the SSI program, describe current program structure,
eligibility criteria, and benefit levels, and discuss how the program’s goals and rules have evolved over
time.
1See Burke and Burke (1974) and Smeeding (1994) for a more detailed historical discussion ofhow SSI became the nation’s first negative income tax program.
2The key features of most NIT proposals are universality, federal benefit administration, and lowbenefit reduction rates. For a fuller discussion of the origins of NIT policy see Burkhauser and Finegan(1989, 1993).
-3-
Original Rationale and Program Goals
The establishment of a federal income maintenance program for the aged, blind, and
disabled—SSI—was the culmination of a four-year debate that began with a more overarching welfare
reform proposal—the Family Assistance Plan (FAP)—proposed by President Nixon on August 8, 1969.1
FAP was the first serious attempt to institute a federal negative income tax program equivalent to those
proposed by Stigler (1946), Friedman (1962, 1968), and Tobin (1968). FAP departed from existing
welfare policy in three important ways: (1) it was universal rather than categorical, with low income and
assets as the only eligibility criteria; (2) it was run through the federal tax system rather than administered
by state and local governments; and (3) it had a low benefit reduction rate, in keeping with the notion that
low tax rates provide desirable work incentives.2
Congress eventually rejected the idea of an income maintenance program for all Americans with
low income, but on October 17, 1972 created the Supplemental Security Income program, a categorical
welfare program targeted on the subset of the poor who were aged, blind, or disabled. SSI passed after
FAP failed largely because Congress believed that providing income assistance to needy individuals not
expected to work was likely to have a much smaller negative impact on employment than a universal
negative income tax program. In 1972, those not expected to work included individuals age 65 and older,
the blind, and people with disabilities, subgroups of the population that already were targets of state-based
assistance programs.
In keeping with some of the themes of FAP, the new SSI program federalized benefit
administration, set minimum benefit standards, imposed uniform eligibility criteria, and set low benefit

3Most legislative models of the NIT, including FAP and SSI, impose both an income and asset test. Throughout this chapter we refer to income and assets as economic resources.
4Under the former state-run programs the amount of assistance could vary from recipient torecipient according to an individual’s assessed needs, age, and living situation.
5Poor children with disabilities had previously been included in state AFDC programs.
6A final category of people allowed onto the SSI rolls, despite their potential to find alternativeprivate support, were noncitizens. By law, legal immigrants had to show income sponsorship beforeimmigrating to the United States. Largely due to the definition of income in the SSI means test, the 1972legislation allowed sponsored immigrants who were poor to apply for SSI. This primarily affected the SSIaged program.
-4-
reduction rates on labor earnings. Legislative records suggest that SSI was intended to reduce variability in
the types of individuals allowed onto the rolls and in the amount of assistance they received, to make
economic resources the only determinant of eligibility for those meeting the categorical requirements, and to
provide incentives for beneficiaries to work to supplement their income and move towards rehabilitation
(U.S. House Committee on Ways and Means, 1971).3,4 Thus, under SSI, Congress federalized benefit
administration, set minimum benefit standards, imposed uniform eligibility criteria, and set relatively low
benefit reduction rates on labor earnings. In addition to adopting some of the administrative mechanisms of
FAP, the SSI program began to blur the traditional ability-to-work standard for determining who should be
entitled to public welfare payments. By extending SSI benefits to the needy families of children with
disabilities, Congress expanded the social safety net to include families headed by adults who were
“employable”.5,6
SSI Eligibility Criteria
As noted earlier, SSI is a income support program for low-income individuals who are aged, blind,
or disabled. As such, SSI eligibility is a function of three program-based categorical criteria–age,
disability, or blindness—as well as more general requirements associated with income and asset limits, and
citizenship and residency rules. The Social Security Administration is responsible for screening applicants

7For example, in 2001, the Census Bureau poverty threshold for all single person households(under and over age 65) was $754 per month ($9,044 per year). The countable income cutoff for SSI was$740 per month ($8,880 per year) in 2001.
8In certain cases, impairment-related expenses may be deducted from this total. Also, income isdisregarded when it is used for Plans for Achieving Self Support (PASS).
9As we will discuss below, for those SSI beneficiaries receiving other means-tested programbenefits, the effective marginal tax on work can be much higher.
-5-
and making awards for SSI. Table 1 summarizes the SSI eligibility requirements described in detail in the
remainder of this section.
Means-Tests. To be eligible for SSI, individuals must fall below federally mandated income and
asset limits. In 2002, the countable income limit was set at $780 per month ($9,360 per year) for
individuals and $1,170 per month ($14,040 per year) for couples. The countable income limit is
determined by the federal benefit rate (FBR) and increases annually with the average U.S. wage index. In
general, the countable income limits fall just short of the U.S. Census Bureau official poverty thresholds.7
SSI applicants also must meet countable asset limits. In 2002, asset limits were set at $2,000 for
individuals and $3,000 for couples. Unlike the countable income limits, the asset limits are not indexed for
inflation. Thus, over time, countable asset limits for SSI eligibility have become stricter. Countable asset
limits were last changed in 1989, rising from $1,500 for individuals and from $2,250 for couples.
As noted earlier, not all income received by individuals or couples is countable. Exclusions include
a $20 monthly income disregard for all forms of income with the exception of means-tested income and an
additional $65 monthly disregard for any labor income.8 After these disregards, for every $1 in labor
earnings a worker loses $0.50 in SSI benefits. Therefore, after all income disregards, an SSI recipient
faces a 50 percent implicit tax on labor earnings.9 Neither the income or asset exclusions are indexed for
inflation.

10In 2002, the dollar value on disregards on assets was $4,500 for a car or medical treatment,$1,500 on life insurance, and $2,000 on personal property and household furnishings.
11Had the asset limits of $2,000 (inividuals) and $3,000 (couples) set in 1989 kept up with inflationthey would be $2,856 and $4,284, respectively in 2002.
-6-
In-kind assistance from government programs like Food Stamps and public housing are not
counted as income against the individual’s overall SSI benefit. All other benefits from government
programs are taxed at 100 percent. Countable resources include resources other than the home a person
lives in, a car (depending on use or value), and limited amounts of life insurance and burial funds.10 In
cases where an eligible individual resides in a household with ineligible individuals, a portion of the other
person’s income is considered when determining the amount of the SSI payment. This process, known as
“deeming,” applies to married couples with one eligible member, parents of child applicants, and U.S.
sponsors of noncitizen applicants. The deeming rules are straightforward; if an individual or couple is
living in another person’s household and is receiving both food and shelter from the person in the
household, the federal benefit rate is reduced by one-third.
Although the federal benefit rate—and thus, the monthly income test—rises with inflation each
year, the monthly income disregards, the asset limits, and the value of allowable assets (e.g., car, household
effects) are not indexed, and thus have fallen substantially in real terms since SSI began. The real decline
in the income disregards and asset limits over time effectively has eroded the value of SSI benefits and
narrowed the population of potential recipients relative to 1974 levels. Consider first the 1972 set
disregards of $20 on all income and $65 on labor income. Valued in 2002 dollars, these disregards would
be $84 and $275 per month, respectively. Adjusting the asset limits for inflation discloses the same
pattern. Valued in 2002 dollars, the asset limits set in 1972 would be $6,345 for individuals and $9,517
for couples.11compared to the $2,000 and $3,000 limits currently in place. Thus, compared to when it was
12The term qualified alien is defined in section 431 of P.L. 104-193, as amended by P.L. 104-208and P.L. 105-33. See Parrot, Kennedy, and Scott (1998) for a complete listing of the qualifying criteria.
-7-
enacted in 1972, SSI now covers a narrower and less economically advantaged portion of the income distribution.
Citizenship and Residency Criteria. In addition to meeting the economic resource criteria,
individuals also must meet residency and citizenship requirements. To be eligible for SSI an individual
must be a resident of the United States and a U.S. citizen, a U.S. national, or a “qualified alien” in an SSI-
eligible noncitizen category.12 The current SSI-eligible noncitizen categories generally can be characterized
as covering individuals who were lawfully in the United States as of August 22, 1996, individuals who are
refugees or in refugee-like situations, and individuals who have contributed to the country either by service
in the military or through extended periods of work. These relatively restrictive allowances for noncitizens
were implemented under 1996 welfare reform (PRWORA), and were a direct response to concerns that
newly arrived noncitizens with immigration sponsors were increasingly applying for, and receiving, SSI
benefits. The SSI provisions in the 1996 welfare reform act generally excluded these individuals from
receiving SSI by mandating that the income of the noncitizen’s immigration sponsor be considered in the
means test.
Categorical Eligibility Criteria. Individuals meeting income, asset, and citizenship tests may
qualify for SSI benefits based on three categorical criteria: age, blindness, or disability. Applicants need
only meet one of the three criteria, although some applicants fit multiple categories. The categorical
program requirements for the aged and the blind are straightforward. Individuals are categorically eligible
for SSI based on age if they are age 65 or older. Individuals may receive SSI benefits for the blind if they
have 20/200 vision or less with the use of a correcting lens in their better eye, or if they have tunnel vision

13Although the measurement of these “objective standards” is relatively straightforward, thejustification for using them as standards for “inability to work” is less so. A literature exists which arguesthat categorical age is not a useful measure of ability to work. A parallel literature exists which suggeststhat functional ability rather than medical conditions are superior criteria for determining “ability to work”(Library of Congress 1998; Wunderlich, Rice, and Amado 2002).
14Mashaw and Reno (1996) argue that the appropriateness of any definition of disability dependson the purpose for which it is used. They document over 20 definitions of disability used for purposes ofentitlement to public or private income transfers, government services, or statistical analysis. In theAmericans with Disabilities Act of 1990 (ADA), disability is defined as a physical or mental impairmentthat substantially limits one or more major life activities, a record of such an impairment, or beingregarded as having such an impairment. LaPlante (1991) provides a useful discussion of alternativedefinitions that can be used to estimate this population. Burkhauser, Houtenville, and Wittenburg (2002)provide detailed analyses of different definitions of disability in national representative U.S. surveys.
15The World Health Organization (WHO) has a model of disability very similar to that of Nagi. The key to both of these definitions is the recognition that individuals move from the presence of a healthcondition to a point where it begins to impinge on activities that are socially expected of them and that thismovement is related to the environment in which individuals live. See Jette and Badley (2002) for anexcellent comparison of the Nagi and WHO models.
-8-
of 20 degrees or less. These objective standards make for relatively easy and uniform screening of aged
and blind SSI applicants at offices of the Social Security Administration across the United States.13
In contrast, the disability screening process is more complex. First, there is no simple definition of
disability.14 The most frequently applied model of disability comes from Nagi (1965, 1969a, 1969b, 1991).
In the Nagi model, disability is a dynamic process in which an individual’s pathology interacts with the
socioeconomic environment.15 The dynamic nature of the disability process is represented by the movement
through three stages: pathology, impairment, and disability. The first stage, pathology, is the presence of
a physical or mental condition that interrupts the physical or mental process of the human body. An
example is deafness. This leads to the second stage, impairment, which Nagi defines as a physiological,
anatomical, or mental loss or abnormality that limits a person’s capacity to function. For example,
deafness limits the ability to interpret sound. The final stage, disability, is an inability to perform or a
limitation in performing roles and tasks that are socially expected. For example, a person with deafness
is unable to use the telephone. Under the Nagi model, those with a pathology that causes a physical or
16This measure closely resembles what Verbrugge (1990) calls social disability, or the intersectionof an individual’s physical impairment (e.g., deafness) and the environmental challenges of the activitiesrequired by a social role, such as work.
17For example, a person with deafness who is accommodated at the workplace with a TTYmachine that permits him or her to use the telephone.
-9-
mental impairment that subsequently limits one or more life activities—such as work—but who
nevertheless work would not be considered to have a work disability.16 (This is the case whether work was
possible though changes in the work environment, access to rehabilitation, or individual adaptability.)17
The first component is the presence of a pathology—a physical or mental malfunction, or the interruption
of a normal process, or both. This leads to a second component, an impairment, which Nagi defines as a
physiological, anatomical, or mental loss or abnormality that limits a person’s capacity and level of
function. The final component of disability is defined as an inability to perform, or a limitation in
performing, socially expected roles and tasks. For men and, increasingly, for women of working age,
market work is a socially expected role. Hence, those who are unable to perform or are limited in their
ability to work are considered disabled.
The disability determination process for SSI incorporates some of the reasoning put forth in Nagi’s
disability definition. Applicants for disability benefits move through a multi-step process in which their
pathology, impairment, and level of functioning are judged. Applicants thought to be unable to engage in
any substantial work become eligible for benefits. Below we describe the process of disability
determination for both adults and children applying for SSI disability benefits.
Like the aged and blind, persons seeking disability benefits also apply at an office of the Social
Security Administration. Once the federal officials and the applicant have gathered sufficient
information to complete the application, it is submitted to a state agency for determination of disability.
State disability examiners, working with vocational and medical consultants, act as the primary
18SSDI is a social insurance program that provides payments to individuals who have paid socialsecurity taxes for the appropriate number of quarters and who are judged to be disabled under the SSAguidelines. Unlike SSI it is not means-tested. However, it does have restrictions on labor earningsconsistent with its criteria for disability eligibility. See Bound and Burkhauser (1999) for a fullerdiscussion of this program from an economic perspective.
19However, as will be shown later, in some instances the SSI program allows individuals withdisabilities to exceed the earnings limit and continue to receive SSI benefits, making it a type of partialdisability insurance. Most other western industrialized countries provide partial disability benefits to theirworking-age populations. For a discussion of disability program rules in other western industrializednations see Aarts, Burkhauser, and DeJong (1996).
20Our discussion of the adult disability determination process draws heavily on Bound andBurkhauser (1999).
-10-
gatekeepers of both SSI and Social Security Disability Insurance (SSDI).18 Disability decisions are made
by state agencies, acting under contract to the federal government. Therefore, although disability
eligibility criteria are uniform across the country, the interpretation of these criteria, and hence the
disability determination process itself, can and does systematically vary from state to state and over time.
Table 2 shows differences in mean allowance rates (initial acceptances to initial applications), by state
between 1974 and 1993. As the table indicates, mean allowance rates vary considerably across states,
ranging from lows of 28 in Louisiana and New Mexico to highs of 48 in Delaware, New Jersey, and
Rhode Island.
Disability Screening for Adults. SSA defines adult disability as the inability to engage in
substantial gainful activity by reason of a medically determinable physical or mental impairment that is
expected to result in death or last at least 12 months. Applicants must be unable to do any work that
exists in the national economy for which they are qualified by virtue of age, education, and work
experience. The United States does not award federal disability benefits for partial disability.19
As a practical matter, SSA asks the state disability determination offices to follow a five-step
procedure in their initial disability determination.20 First, the examiners check to see if applicants are
currently working and making more than the “substantial gainful activity” (SGA) amount—$780 a month

21The percentages denied in Figure 1 are based on outcomes from initial SSDI applications, thedata available from published sources. However, there is no reason to believe that the patterns for SSIwould be significantly different.
-11-
in 2002. If so, their application is denied. As can be seen in Figure 1, almost no cases are rejected in this
manner, since presumably the SSA field offices have already checked to see if applicants are working
before they send applications to the disability determination office.21 Second, the state disability
examiners determine if the applicant has a severe impairment that is expected to last 12 months or result
in death. If not, the application is denied. About 20.1 (13 + 7) percent of all applicants were denied at
this step in 2000. Third, the state disability examiners look to see if the impairment meets the medical
listings. If the impairment is listed, applicants pass the categorical screening for disability. If the
impairment is judged to be equivalent to one of the medical listings then applicants also meet the
categorical requirement for benefits. Most recipients who pass the disability screening do so at this stage
because their impairment either “meets” or “equals” one on the medical listing (22 percent of all
applicants were approved at this step in 2000).
Fourth, if a decision cannot be reached on medical factors alone, applicants are evaluated in
terms of residual functional capacity. If they are found to be able to meet the demands of “past relevant
work” their claim is denied (20 percent of all applicants were denied at this step in 2000). If individuals
are deemed unable to do past relevant work, examiners determine if the impairment prevents the
applicant from doing any other work. Here vocational factors are considered. If, for example,
applicants’ maximum sustained work capacity is limited to sedentary work and they are at least age 50 to
54, with less than a high school education and no skilled work experience, then they would be considered
disabled and pass the categorical screening. In contrast, if applicants’ previous employment experience
includes skilled work, then they would not receive benefits. At this stage, 16 percent of all applicants
were determined eligible for benefits and 22 percent were denied benefits in 2000.

22There is some evidence that the proportion of claimants who appeal and the proportion ofdecisions that get reversed rise and fall with the percentage of initial denials (Lando, Cutler, and Gamber1982).
-12-
Applicants who are denied benefits can ask for a reconsideration. Their file will then be
reviewed by a second team of examiners. If they are rejected after reconsideration, individuals may
appeal the case to an administrative law judge. It is at this stage that applicants will for the first time
come face-to-face with a gatekeeper. Individuals denied benefits at this stage may appeal the decision to
the Social Security Appeals Council and then to the District Courts. In 2001, about 33 percent of those
initially denied benefits appealed the decision. About 10 percent of those who appealed the decision
eventually were awarded benefits (SSI Annual Report, 2002).22 For the claimants who are either allowed
benefits at the initial level or who don’t appeal, the application and decision process usually takes a few
months. For those who appeal to the administrative law judge, the process can take a year or more.
Disability Screening for Children. Screening children for disability eligibility has proven to be
even more complex and contentious than adult disability screening. When the SSI program was originally
considered, Congress recognized the potential difficulties of applying the standard SSA disability definition
to children. Thus, under the original legislation, Congress wrote that a child should be considered disabled
if “he suffers from any medically determinable physical or mental impairment of comparable severity” to a
disabling impairment in an adult (SSA 1997). In practice, children originally qualified for SSI if they had
“a medically determinable physical or mental impairment which results in marked and severe functional
limitations, and which can be expected to result in death, or which has lasted or can be expected to last for
a continuous period of not less than 12 months.” Between 1974 and 1989 the child disability determination
process did not include a functional assessment or take into account the equivalent of adult vocational
factors. See Figure 2 for a comparison of the child and adult initial disability determination process.

23Following the Zebley decision a large number of previously denied cases were reassessed andawarded disability benefits. This can be seen in the caseload statistics presented later in this chapter.
-13-
This changed in 1990, when the Supreme Court decided the case of Sullivan vs. Zebley. The
Court ruled that in order to meet the standard of equal treatment, a functional limitation component parallel
to that of adults must be included in the initial disability determination process for children. In response,
SSA added two new bases for finding children eligible for benefits: (1) functional equivalence, which was
set at the medical listing level of the disability determination process; and (2) an individual functional
assessment (IFA), which was designed to be parallel with the functional and vocational assessment
provided for adults. By allowing applicants who did not meet the medical listing to be found disabled if
their impairments were severe enough to limit their ability to engage in age-appropriate activities, such as
attending school, the IFA lowered the level of severity required for children to be eligible for SSI benefits
(GAO 1994, 1995).23
In 1996, as part of welfare reform, Congress modified the definition of disability for children.
Legislators replaced the comparable severity (to adults) criteria with a definition of disability that is unique
to children. Under the new definition, a child’s impairment—or combination of impairments—are
considered disabling only if it (they) results in marked and severe functional limitations, is expected to
result in death or has lasted or can be expected to last at least 12 months (SSA 1996).” The new focus on
assessing the severity of impairments among children was reflected in changes in the evaluation process.
The legislation removed the IFA, replacing it with a criterion based on functional equivalence or
evaluations of the extent to which impairments create medical listing-level severity. The revised rules
defined medical listing-level severity for functional limitations as: (1) marked limitations in two broad
areas of functioning, such as social functioning or personal functioning; or (2) extreme limitations in one
area of functioning, such as inability to walk (SSA 1997). In practice these changes meant that although
functional limitations continued to include behavior-related limitations, they no longer covered the same

24When the new rules were applied in 1997 previously allowed cases into denials. This can be seenin the caseload statistics presented later in this chapter.
25This difference arises in part because the SSI program and the U.S. poverty thresholds assumedifferent economies of scale. The SSI program assumes that a single person needs 67 percent of the couplebenefit to be equally well off; the U.S. poverty threshold assumes that a single person needs 80 percent ofthe couple benefit to maintain an equivalent standard of living.
26We discuss states’ latitude in determining Medicaid eligibility for SSI recipients later in thissection.
27In most cases, individuals who are eligible for SSI are categorically eligible for Food Stamps. The exceptions to this general rule are SSI beneficiaries living in households where other members do notreceive and are not applying for SSI. These individuals must apply for Food Stamps at the local food
-14-
breadth of functioning included in the IFA. For example, Congress specifically removed maladaptive
behavior disorder from the functional listing criteria. Thus, the post-1996 standard represents a broader
measure of disability than originally applied to children, but a narrower standard than the one used between
1990 and 1996 (see Figure 2).24
SSI Benefits
Federal Benefit Levels. Each eligible SSI beneficiary in his/her own household with no other
countable income received a Federal cash payment of $545 per month in 2002 ($817 for jointly eligible
couples). The Federal SSI benefit is increased each January by the cost-of-living index used to adjust all
Social Security (OASDI) benefits. Although the original objective of the SSI program was to guarantee an
income at the poverty level, from the beginning, the federal minimum SSI benefit was set below the official
Bureau of the Census poverty line. Excluding state supplementation, SSI payments represent about 75
percent of the poverty threshold for an eligible individual, and about 90 percent of the threshold for an
eligible couple; these percentages have remained relatively constant over time.25
SSI recipients are required by law to apply for every government program for which they may be
eligible. In most states, recipients receive state supplemental payments and become eligible for Medicaid
and Food Stamps without making a separate application.26,27 Since 1986 SSI benefits and eligibility for

stamp office and meet the household income test to obtain food stamp eligibility.
28In 1995, only about 46,000 (1.3 percent) of the 3.5 million SSI disability recipients were in1619(b) status (Mashaw and Reno 1996).
29In making this determination, the SSA takes the average expenditures on Medicaid and SSI(including state SSI) and compares this amount to an individual’s earnings.
30The Ticket to Work/Work Incentives Improvement Act of 1999 expanded the eligible pool of vocational rehabilitation providers available to disabled SSI recipients, by allowing beneficiaries to receivevocational rehabilitation services from not-for-profit and for-profit vendors. The first tickets from thisprogram were issued in 2002.
31For a detailed description of state supplementation see Ponce (1996).
32Mandatory state supplements applied to individuals receiving benefits in December 1973.
-15-
Medicaid have been continued for those who earn above the SGA; this is known as 1619(b) status.28 In
general, the special eligibility test for Medicaid applies if the individual has earnings over the level that
offsets their SSI benefits, but is still lower than a threshold amount established in the state in which they
reside.29 Adult SSI recipients with disabilities also are eligible for federally-funded, state-administered
vocational rehabilitation.30
State Supplementation. In designing the SSI program Congress recognized that states may want to
boost benefit levels beyond the federal program. In addition, Congress wanted to ensure that those states
paying above the federal level in 1972 would continue to provide the same level of assistance as they had
prior to the federalization of SSI. As a result of these two goals, there are two types of state
supplementation for SSI: mandatory and optional.31 Under mandatory supplementation, states whose Old-
Age Assistance and Aid to the Permanently and Totally Disabled benefits were greater than the federal
minimum had to make up the difference in mandatory state supplements.32 Although nearly every state was
subject to mandatory supplementation in 1972, increases in Federal benefit levels over the years, have left
only a few SSI beneficiaries receiving mandatory payments today.

33Over 90 percent of SSI recipients live in their own households (U.S. House of Representatives1998).
34One explanation for the ongoing supplementation of SSI recipients living in institutions is thatsupplementary SSI payments provide states with a mechanism of supporting such facilities.
35Over time some states have even reduced the nominal value of supplemental payments.
-16-
In 2000, 45 states and the District of Columbia provided optional supplemental benefits (columns
1-3, Table 3). States offering supplements can follow the same rules as the federal SSI program and have
the program administered by SSA, or they can administer their own program and use a state-specific
eligibility criteria. Despite the apparent cost-advantage to federal administration, states have increasingly
opted for state administration of supplemental payments. About three-quarters of states providing optional
supplementation administer their own programs or jointly administer them with the federal government.
Only 11 states rely solely on federal administration.
Although a majority of states have optional supplementation programs, a number of factors
minimize the importance of these programs. First, only 23 states provide supplements to the vast majority
of SSI recipients living independently in their own households.33 In the remaining states with optional
programs, supplements are paid only to the minority of SSI recipients living in institutions.34 Second,
because state supplements are not annually adjusted for inflation, the real value of the median state
supplemental payment to individuals living independently declined by about 60 percent between 1975 and
1997.35
That being said, public concern over states reducing their SSI supplemental payments when
Federal benefit levels rise led Congress to mandate that States pass along SSI benefit increases resulting
from annual cost-of-living adjustments. States may meet this passalong requirement by maintaining
payment levels year-to-year—the payment method—or they may spend the same amount of money in the
36This final option is known as the “209(b) option.”
37California “cashes out” food stamps and SSI recipients in California receive a cash payment intheir State supplementary payment in lieu of food stamps.
-17-
aggregate that it spent the year before the federal benefit rose—the total expenditure method. In 2002, 40
states used the payment levels method and 10 states used the expenditures method (columns 4-5, Table 3).
Coordination with Other Programs. In addition to SSI federal and state cash payments, SSI
beneficiaries frequently gain automatic eligibility to Medicaid and Food Stamp programs. Generally, SSI
recipients are categorically eligible for Medicaid. A State may either use SSI eligibility criteria for
determining Medicaid eligibility, or it may use its own criteria as long as the criteria are no more restrictive
than the State’s January 1972 medical assistance standards.36
Forty states use SSI criteria and 11 states use eligibility criteria more restrictive than those of the SSI
program (See columns 6-7, Table 3). States may also enter into agreements with SSA to make Medicaid
eligibility determinations for them, based on the federal SSI criteria; 33 states have such contracts with
SSA (column 8, Table 3).
With the exception of California, SSI recipients in all states may be eligible for food stamps.37
SSA offices notify applicants and recipients of SSI of their potential eligibility for food stamps. Eligibility
for the Food Stamp program is determined by the Food Stamp office.
Finally, 38 states (column 9, Table 3) have agreements with SSA to be reimbursed for basic needs
assistance provided during the period during which an eligible individual’s SSI application for benefits was
pending, or an individual’s SSI benefits were suspended and subsequently reinstated.
Administration and Financing
As a federal income maintenance program, SSI is funded from general revenues and is
administered by the Social Security Administration. Although, as discussed earlier, many states
supplement federal benefit levels, over time the share of supplemental benefits paid by states has declined.
38The numbers reported reflect the average for all states. Looking across states, in January 1999,the federal share of the maximum SSI benefit ranged from 58 percent in Alaska and 74 percent inCalifornia to 100 percent in the eight jurisdictions without a supplemental program (CRS 1999).
-18-
In 1975, state SSI expenditures accounted for approximately 27 percent of total SSI payments. In 2001,
state supplemental payments amounted to about 11 percent of annual SSI expenditures (SSA 2002).38
Summary
Although the goals of the SSI disability program have not changed since its inception in 1974, its
structure has been subject to numerous legislative, administrative, and court actions. These actions
primarily have focused on making the disability criteria more target effective and on enhancing incentives
aimed at returning recipients to the workforce. For the child disability component of the program, changes
have focused on providing an appropriate vocational criteria for children that does not unduly discourage
rehabilitation and school success. Notably, there have been few changes to the means test criteria and no
adjustment for inflation in these criteria, meaning that over time, the amount of income that will disqualify
one for SSI has fallen in real terms or simply put the means-test has become more restrictive. Finally,
other legislative efforts have centered on limiting the eligibility of non-citizens. The legislative history of
SSI shows that the primary mechanisms used by policymakers to alter the coverage and the generosity of
SSI have been changes in the categorical eligibility criteria, rather than changes in the size of SSI benefits.
III. Program Statistics
Trends in Expenditures, Caseloads, and Benefits
The SSI program has grown substantially in both recipients and expenditures since it first paid
benefits in 1974. However, its growth has varied over time (Figure 3). Between 1974 and 1982, caseloads
fell by 4.5 percent and real federal expenditures declined by about 15 percent. This decline caused concern
among policymakers that too few potentially eligible recipients were enrolling (Menefee, Edwards, and
Schieber 1981). After this slow start, the number of SSI beneficiaries increased steadily until 1996,

39This growth is almost entirely due to increases in the number of disabled beneficiaries. Thenumber of working-age SSI recipients eligible due to blindness has remained relatively constant over time(Annual Statistical Supplement, SSA, various years).
40Again the growth is almost entirely explained by increases in the number of disabled children.
41As noted earlier, this increase was due both to the reassessment of previously denied cases andthe increase in applications due to the more lenient eligibility rules.
-19-
growing from roughly 3.9 million in 1982 to 6.6 million in 1996, a 70 percent increase. Federal payments
for the program rose even faster during this period with the greatest growth between 1989 and 1992.
Valued in 2001 dollars, total annual payments increased from $17.6 billion in 1982 to $32.5 billion in
1996, an increase of about 85 percent. Between 1996 and 2001 (the last year of data available) caseloads
and expenditures have risen by less than 2 percent. Despite rapid growth in the SSI program over time, as
a percentage of total federal outlays SSI expenditures have remained relatively stable at 1.9 percent since
the program began in 1974.
Trends in Characteristics of Recipients
Originally considered a program for the elderly, SSI is now dominated by adults and children with
disabilities. Figure 4 shows the age composition of SSI beneficiaries between 1974 and 2001. In 1974, the
majority of the SSI caseload was over the age of 65. The number of aged beneficiaries peaked at 2.5
million in 1975, gradually dropped to around 2 million in 1982 and remains at about that level. In contrast,
the number of blind and disabled adults (aged 18-64) on SSI has more than doubled since 1974, with the
most rapid growth occurring after 1982.39 In December 2001, 3.8 million adults 18-64 received SSI
benefits, about 2.1 million more than in 1982. The number of blind and disabled recipients who are under
age 18 also has grown substantially in recent years.40 Between 1974 and 1989 the child caseload increased
to about 185,000. However, following the Zebley decision in 1990, the number of blind and disabled
children rose rapidly, reaching 955,000 by 1996.41 Since then, child SSI rolls have declined slightly, falling
to 881,000 in 2001.

42Notably race is not included in the table. Information on the racial composition of SSIbeneficiaries in the 1998 “Green Book” showed an increase in the number of Latinos enrolled in theprogram over time. These data also showed that African Americans are disproportionately represented inamong child and adult disabled beneficiaries. Unfortunately, there are no comparable data on race after1995.
-20-
As a result of rapid growth in adult and child disabled beneficiaries, the SSI population looks
dramatically different today than it did when the program was created. In 1974, blind and disabled adults
and children comprised only 40 percent of the SSI population. In 2001, over 70 percent of SSI
beneficiaries were disabled individuals under the age of 65.
Table 4 shows that other key demographic characteristics also have changed since the programs
inception.42 The first section of the table shows the age, gender, and citizenship composition of all SSI
recipients. Since 1975, the proportion of males has increased. In 1976, more than two-thirds of SSI
recipients were female and about 64 percent were white. In 2001, about 60 percent of SSI recipients were
female. Another notable change in the composition of the SSI population has been the rapid increase in the
number of noncitizens receiving benefits. In 1982, the first year for which records on citizenship were kept,
a little over 3 percent of all SSI recipients were noncitizens. In 1994, two years before citizenship became
a requirement for new applicants, about 12 percent of all SSI beneficiaries were noncitizens. This
percentage fell slightly once the citizenship restrictions were imposed, but noncitizen beneficiaries remain a
sizeable component of the SSI population—10.4 percent in 2001.
The second section of Table 4 shows trends in the three main qualifying diagnostic
categories—physical impairments, mental retardation, and psychiatric disorders other than mental
retardation—for SSI recipients with disabilities (adults and children) In the early years of the program,
less than one-quarter of SSI beneficiaries qualified on the basis of mental impairments other than mental
retardation. Following expansions in the eligibility criteria for mental impairments in both adults and
children, the number of adults and children qualifying for SSI on the basis of a mental impairment began to

43It is possible to estimate the population with some level of disability using national data sources(see Bound and Burkhauser 1999 for examples). It is much more difficult to isolate the sub-populationwithin this broader category that would meet the medical listing or vocational criteria for SSI eligibility.
-21-
grow. As a result, in 2001, 36 percent of all SSI recipients qualified on the basis of mental impairments
other than mental retardation.
SSI Participation
An important policy concern with respect to all public assistance programs is the degree of
participation among eligible individuals. That is, of the people who meet the categorical, economic
resource, and citizenship tests, what proportion are receiving SSI benefits. It is relatively straightforward
to make such calculations for those aged 65 and older and a literature exists on this question.
Unfortunately, the difficulties of establishing and assessing disability for adults and children not only
makes if difficult for policymakers and administrators to accurately determine SSI eligibility for those who
apply, but also for researchers to calculate program participation rates that require some estimate of the
eligible disabled population that does not apply for benefits. Existing nationally representative data sources
either lack sufficient information on economic characteristics or health characteristics to generate precise
estimates of the population eligible for the disability components of SSI. As a result, there is almost no
research on SSI participation rates among the eligible population with disabilities.43
In Table 5 we provide a preliminary approximation of “take-up rates” for SSI that we believe is
useful in establishing broad trends. We use the official U.S. Bureau of the Census poverty calculations and
show the share of SSI recipients in age-based poverty populations. This method was used in the 1998
Green Book for the population aged 65 and older. On the one hand, because our estimates do not account
for citizenship, assets, and most especially disability status, they will understate program participation
among those in the poverty population who are eligible. On the other hand, since those eligible for SSI may
have household incomes above the official poverty line, our approximations may overstate program

44Unless otherwise noted the percentages reported in Table 6 are based on estimates from theSurvey of Income and Program Participation and taken from the SSI Annual Report, 2002.
-22-
participation among all eligible households. Nonetheless, the trends in Table 5 are revealing of how SSI is
being used by low income persons.
As the first column of Table 5 shows, the participation rate among the poor elderly declined from
78.5 percent in 1974 to 53.6 percent in 1982. Since then, participation rates have fluctuated from year to
year, but have remained well below the highs recorded in the early years of the program. In general, no
more than two-thirds of elderly individuals living in poverty receive SSI benefits. More complete measures
of participation suggest that take-up rates among the elderly are lower than the gross measures indicate.
Researchers consistently find the participation rate among persons eligible for SSI aged benefits at between
45 and 60 percent (Menefee, Edwards, and Schieber 1981; Warlick 1982; Coe 1985; Shields et al. 1990;
McGarry 1996).
The remaining columns in Table 5 show SSI participation rates for poor adults age 18-64 and poor
children. Consistent with the caseload growth highlighted in Figure 4, participation rates among poor
working age adults and children have risen over time. Participation rates among poor adults rose from 14.8
percent in 1974 to 20.7 percent in 1998, with the most rapid increases occurring during the 1990s.
Recipiency rates for poor children also increased rapidly during the 1990s, rising from 2.1 percent in 1989
to 6.6 percent in 1998. As column four shows, the prevalence of disability has not risen since 1980 which
suggests that the increase in SSI take-up rates among the poor is not a function of increased disability.
Multiple Program Participation among SSI Beneficiaries
A large fraction of SSI beneficiaries participate in other government programs. Table 6 shows
simultaneous program participation for SSI recipients and their households by gender and age in 1999.44 In
1999, 36.1 percent of all SSI recipients also received Old Age, Survivors, and Disability Insurance
(OASDI), either for retirement or disability. OASDI receipt was most common among men and women
-23-
age 65 and older. Medicaid receipt was nearly universal, with 89.4 percent of all SSI recipients on the
program. A substantial fraction of SSI recipients also received Medicare benefits—41.4 percent in 1999.
Looking at other means-tested programs, 42.6 percent of households with an SSI recipient also received
food stamps and about one in ten received energy or housing assistance.
Separate data from the 1998 “Green Book” produced by the U.S. House of Representatives (not
shown) indicates that over time the percentage of SSI recipients receiving OASDI and Medicare has been
declining. At the same time the percentage of SSI recipients receiving food stamps, WIC, free or
subsidized meals, and public housing has been rising. The fact that a growing share of SSI recipients
receive benefits from multiple means-tested programs suggests that the work incentives faced by the typical
beneficiary are increasingly complex. SSI beneficiaries face multiple implicit taxes in the form of reduced
benefits from SSI and any other transfer programs, plus the regular assortment of federal, state, and local
taxes, as well as the loss of medical insurance for those not meeting the 1619(b) provisions. As others have
shown, the cumulative marginal tax rates for individuals receiving multiple programs can be quite high
(Giannarelli and Steurle 1994; Keane and Moffitt 1998).
Although the empirical literature on the effects of changes in these various marginal tax rates will
be discussed later in this chapter, it is useful to lay out the tax circumstances SSI recipients potentially
face. Figure 5 (from Burkhauser and Wittenburg 1996) shows how a single male’s 1994 net income
changes with each additional dollar of his labor if he is eligible to receive the federal SSI benefit of $458
and the average cash value of Medicaid insurance for SSI disability of $540 per month. With no labor
earnings, this person would receive $998 per month in SSI benefits and Medicaid insurance.
As the figure shows, the interaction of the Earned Income Tax Credit (EITC) and federal taxes as
well as Food Stamps, which one-half of all SSI beneficiaries receive, significantly alters the marginal tax
rates faced by recipients with various amounts of labor earnings. The EITC phase-in subsidy to work
offsets social security (FICA) taxes, but because the food stamp program subtracts 24 cents in Food

-24-
Stamps for every dollar of labor earnings, the net tax on the first dollar of labor earnings is 23.85 percent.
This tax rate continues to the SSI disregard level of $85 per month. At this point the 50 cent loss in SSI
benefits per dollar of labor earnings interacts with the food stamp program taxes on work, resulting in a net
tax of 58.85 percent. When the EITC plateau begins, the net tax on labor earnings rises to 66.5 percent
and when the EITC phase-out tax begins, the net tax on labor earnings rises to 74.15 percent. When the
federal income tax standard deduction level is passed and federal income tax starts, the marginal tax rate
rises to 89.15 percent. Marginal tax rates only begin to fall after Food Stamps and EITC break-even
points are reached. The final increase in tax rates occurs just before SSI benefits phase out, when all
Medicaid benefits are lost because earned income now equals the Medicaid special eligibility plateau. The
reduction of such cumulatively high marginal tax rates via a single universal income support program was
one of the arguments made in support of President Nixon’s original FAP program.

-25-
IV. Review of Economic Issues
Although economic analysis of social programs frequently takes the goals of the program as given,
with SSI the motivation for the program is itself an important determinant of how we view the behavioral
reactions to it. In this section we first discuss the economic rationale behind a federal income floor for the
subset of the poor who are aged, blind, or disabled. Next, we review the theory related to individual
responses to the existence and structure of SSI including takeup, work, savings, and disability-reporting
behavior. Finally, we consider the equity goals of SSI and discuss attempts to evaluate program
effectiveness.
Public Income Provision for the Aged, Blind, and Disabled
As noted earlier, SSI was born out of a failed effort to provide a guaranteed income floor under all
Americans—FAP. Hence, while the motivation for providing an income floor to the subset of the adult
poor who are aged, blind, or disabled is primarily distributional, it also rests on a political compromise that
offered this entitlement only to categories of individuals not expected to work. While this compromise
allowed SSI to become law in 1972, social expectations regarding work have changed over time for the
three groups targeted by SSI—the aged, blind, and disabled. Individuals are living and working longer; the
normal retirement age for Social Security benefits has been raised; and the Americans with Disabilities Act
(ADA) has granted people with disabilities a legal right to equal access to employment.
Although work expectations have risen for the aged, it is people with disabilities who have
experienced the largest shift in public attitudes. In 1990, people with disabilities successfully argued that
unequal access to jobs—rather than an impairment—is the primary barrier to employment opportunities.
As a result, people with disabilities gained legal rights to accommodation under Title I of the ADA.
Some disability advocates even have argued that there is no such thing as a disabled worker; rather, there

45See Johnson (1997) for alternative views of the rights and responsibilities of people withdisabilities.
-26-
is only a society that does not provide the appropriate accommodations for such individuals.45In a world
of full accommodation, the disability-transfer population should be zero. Such attitudinal changes raise
basic questions about how society should treat people with disabilities. Most fundamental of these
questions being, should people with disabilities categorically be expected to work or not?
These types of cultural changes potentially shift the boundaries of the population not expected to
work and hence eligible for a categorical guaranteed income floor based on age or disability. As the
opportunities for employment and the demand for the productivity of people with disabilities and those over
age 65 increase, the clear categorical lines drawn between them and other groups with similar difficulties
finding work, such as low-skilled or less-educated younger persons, or single mothers facing welfare limits,
are increasingly blurred.
The original political compromise that made the families of disabled children eligible for SSI was
slightly different, and represented a departure from the not expected to work criteria applied to the aged and
to adults with disabilities. Some argued that SSI benefits for disabled children replaced the earnings of
parents forced to reduce their work effort in order to care for their newly disabled child. Others argued that
SSI-children benefits indirectly offset extra disability-related household expenses. In both cases, SSI-
children benefits were intended to offset lost income and partially return the family to its previous level of
economic well-being. (See NASI 1995 for a fuller discussion of these issues.)
SSI and Behavioral Change
If the aged and disabled adults are neither able or expected to work, then many of the disincentives
discussed in regard to other means-tested transfer programs are irrelevant. In such a world, cumulative
marginal tax rates could approach 100 percent with no change in work behavior and SSI could provide
relatively high income guarantees and still maintain relatively low break-even points (the income level at

-27-
which a person is no longer eligible for benefits). Moreover, to the degree that age and work disability are
clearly defined and immutable categories, differences in the guarantees, time-limits, or funding mechanisms
for SSI and other programs would have little effect on SSI allowances and caseloads. In such a world SSI
program participation is purely a function of the prevalence of health limitations in the low income
population. Below we suggest that none of these premises hold with respect to the disability component of
SSI. Thus, SSI policymakers must take behavioral changes on the part of potential SSI recipients and state
and local governments into account when establishing program eligibility criteria and considering future
program rules.
Propensity to Apply for SSI. Disability is neither a static or precise concept. Responses to the
onset of health conditions depend not only on the severity of the impairment, but also on the social
environment that people with health impairments face—including the availability of employment, the
availability of accommodation, rehabilitation and retraining, the presence of legal supports or protections,
and the accessibility and generosity of SSI and other government transfer programs. The propensity for
individuals to apply for SSI benefits depends on the probability they place on their health impairment and
vocational circumstances being sufficient to meet the SSI disability eligibility standards as well as on their
employment potential and the generosity of SSI relative to other forms of public assistance. The latter
comparison is particularly relevant in light of 1996 welfare reform (PRWORA) that restricts the access to,
and generosity of, alternative public assistance programs. If low-income adults have health conditions or
have children with health conditions, the relative generosity of SSI to other alternatives may induce
individuals to apply for benefits.
Program Participation and Work Incentives. The economics of program participation and labor
supply for individuals potentially eligible for SSI mirrors the analyses of these issues in programs such as
AFDC and TANF. Thus, to understand the work disincentives embodied in the SSI program, we turn to
the framework used for other categorical welfare programs. Moffitt (1983) provides a discussion of the
46This discussion draws from the expositions in Moffitt (1986), Hoynes and Moffitt (1995), andMoffitt’s review of the AFDC/TANF program in this volume. This discussion is made primarily in thecontext of adults with disabilities.
-28-
basic economic issues. In these models individuals make choices that depend on the income gained from
the program and the costs of participating, including the time and money costs associated with applying for
and maintaining eligibility for benefits.
To see how this works in the case of SSI, consider the conventional labor-leisure model diagramed
in Figure 6.46 Figure 6 compares the budget constraint of an SSI program with a 50 percent marginal tax
rate, (t=0.5) and one with a marginal tax rate of 100 percent (t=1.0). Segment ACDE of the figure
represents the budget constraint of those not categorically eligible for SSI. The line has a slope equal to the
hourly wage rate, w. Segment ABCDE applies to those same individuals if they are categorically eligible
and they face a marginal tax rate of 100 percent. Benefits are taxed one dollar for each dollar earned and
phased out at the break-even level (point C). That is, even though they are categorically eligible for
benefits, their labor earnings offset all SSI benefits at hours levels greater than point C. Segment ABDE
applies to those same people but now they face a marginal tax rate of 50 percent. Benefits are taxed at a
rate of 50 cents per dollar earned and the break-even hours point is D. Under this model, categorical
eligibility for SSI benefits unambiguously reduces work effort relative to not being categorically eligible.
There is an income effect associated with the guarantee (AB), and a substitution effect associated with the
marginal tax rate (BC or BD). The income and substitution effects work in the same direction, and hours
of work among participants fall. Only those whose optimal hours worked prior to program eligibility were
beyond the break-even hours point may not be affected and even then it will depend on the shape of their
indifference curve (i.e., some would be willing to accept less income by substantially reducing work and
living on program benefits).
The next question to ask is what happens if the marginal tax rate is reduced. Here the

-29-
answer is unclear; the net effect of a reduction in t, from 100 percent (BC) to 50 percent (BD), is
ambiguous. The arrows in the Figure 6 show the various responses that could occur following a reduction
in the marginal tax rate (represented by a shift from segment BC to BD). For individuals initially receiving
SSI benefits and not working (i.e., initially at point B), a reduction in the tax rate may encourage
participants to work more, represented by Arrow 1. At the same time, a reduction in t expands the range of
individuals eligible for benefits, and brings some portion of those categorically eligible but not previously
receiving SSI onto the rolls. As these individuals move onto SSI their work effort is reduced, as shown by
Arrow 2. Arrow 3 shows that some categorically eligible individuals who continue to earn too much under
the lower tax rate may be motivated to reduce their hours of work enough to become eligible for benefits,
thereby combining work and SSI benefits. Finally, it also is possible that a reduction in t will increase
payments by enough to induce previously eligible persons on earnings grounds but not on categorical
grounds (segment AC) to risk entry onto the rolls.
Taking each of these possibilities into account, the net effect of a lower marginal tax rate on work
effort is ambiguous. The only thing that is clear is that lower marginal tax rates increase caseloads. A
lower tax rate makes more categorically eligible individuals eligible for the program on income grounds
and, given positive takeup rates, unambiguously boosts the number of individuals on the rolls. Moreover,
by lowering the costs associated with staying on the rolls, lower marginal tax rates reduce exit rates from
the program, thereby increasing caseloads. Finally, lower marginal tax rates may induce those on the
margin of categorical eligibility on health grounds to apply for benefits since the gains to program
acceptance have increased.
Unlike SSI benefits for the elderly, where categorical age eligibility is easily demonstrated and
benefit receipt is automatic if one meets the means test, categorical eligibility for SSI benefits is more
difficult to demonstrate. Thus, eligibility for benefits is not certain and models of SSI application must
take this risk of non-acceptance into consideration. In general, those considering applying for SSI will

47Weathers (1999) develops a multi-period model of the SSDI application process in which theoptimal time of application following the onset of a disability is a function of the opportunity cost of lostwages versus the gain in SSDI, adjusted for the probability of acceptance. A similar model could be usedto predict the timing of SSI-disability applications.
-30-
value disability benefits with a probability of less than one. Holding the underlying health condition
constant, the probability of acceptance onto the rolls will depend on the disability screening process.
Conditional on the same impairment, tighter eligibility criteria are likely to increase the probability of
denial and reduce the expected value of applying. In contrast, looser criteria increase the probability of
acceptance and increase the expected value of applying.47 In either case, individuals facing uncertainty
surrounding acceptance, informational hurdles, or stigma associated with benefit receipt, may be induced to
participate by the increase in benefits associated with the lower marginal tax rate.
If those categorically eligible for benefits on health grounds are completely unable to perform any
substantial gainful activity under any circumstances then there is no need to lower the marginal tax rate on
SSI, since those on the program are neither expected or able to work. However, to the extent that work is
both possible and expected for people with disabilities who meet the other eligibility criteria, policy
discussions with respect to trade-offs between tax rates, guarantees, and break-even points become much
closer to those taking place for other income maintenance programs.
The same model also incorporates stigma and other fixed program costs. As in other income
maintenance programs, the presence of stigma and other program costs associated with applying for
benefits explains why some categorically eligible individuals are observed on segment ACD. As fixed
program costs and stigma decline, participation among this group will rise. What the model in Figure 6
does not show are potential program interaction effects. As discussed in Figure 5, the actual budget
constraint facing those categorically eligible for SSI benefits is more complex, with more nonlinearities due
to the cumulation of taxes from multiple programs. In like manner, multiple program eligibility will cause
complications for those interested in the behavioral effects of other transfer programs. Burkhauser and

-31-
Smeeding (1981) and Powers and Neumark (2001) show the incentives to accept actuarially reduced Social
Security benefits (OASI) at younger retirement ages are increased for those who would be eligible for both
SSI and OASI at age 65, since OASI benefits after a small disregard are taxed on a dollar for dollar basis
by SSI.
Finally, one can also use the model in Figure 6 to think about the labor-supply behavior of parents
of children with disabilities. If a child is judged eligible for SSI benefits, then an able-bodied parent faces
the same marginal tax rates, guarantees, and break-even points shown in Figure 6. Stigma, information
costs, and reduced program benefits (adjusted for the probability of acceptance) also apply. One additional
issue that affects parents of children with disabilities is how benefit receipt will influence the future well-
being of their child.
Savings Behavior. The presence of asset testing in the eligibility criteria for SSI may reduce
saving among those meeting other eligibility criteria. This point is made generally about means-tested
programs. Hubbard, Skinner, and Zeldes (1995) argue that when eligibility is tied to assets, individuals
meeting the income test have incentives to reduce their savings in order to qualify for benefits. Among
those applying for SSI benefits, the most likely group to be affected by the asset test is the elderly, who
may have accumulated savings over their lifetime.
Balancing Efficiency and Equity Concerns
Our discussion above has focused on the behavioral effects of the SSI program. This focus on the
efficiency costs of SSI induced behavioral change ignores the social benefits of SSI and may may lead
some to conclude that a socially optimal SSI program would have no behavioral impact on benefit
applications, work, or savings. This conclusion is inappropriate for two reasons. First, even if actual
disability status were perfectly observable, society would probably still want to target some level of
benefits on disadvantaged low income workers and their families even if it resulted in some efficiency
losses. Hence the more important question is not whether there are program related behavioral changes but

-32-
whether they are small relative to the social gains from redistributing income to less advantaged persons.
Analyses of the welfare implications of the SSI program should focus on this second and more important
question.
Second, in a world where the socially appropriate eligibility standard for SSI is difficult to assess,
some individuals will be denied benefits who are less capable of work than is socially acceptable. In such a
world, a more lenient eligibility criteria will involve a trade-off between the reduction of type II errors on
the one hand and the additional costs of type I errors on the other. The issue is: in the presence of
uncertainty, do the social benefits outweigh the efficiency costs arising from increasing the probability of
guaranteeing an income floor to those below some minimum level of work capacity at the cost of also
providing these funds to some who are more capable of work. In both cases, it is appropriate to assign
some value to SSI as a mechanism for providing social protection against the economic consequences of
aging and disability for disadvantaged workers. To do otherwise would be to hold too narrow a view from
a social policy perspective. See Bound, Cullen, and Schmidt 2000 for a fuller discussion of these issues.
V. Review of the Evidence
In the previous section we reviewed the potential consequences on application, work, and savings
behavior of SSI program rules and showed that if the aged or disabled adults are capable of work, the SSI
program rules could their influence behavior. We also discussed how SSI program rules could affect the
work behavior of the parents of children with disabilities. In this section we review the empirical literature
on the effects of the existence and structure of SSI on behavior. Despite the size and importance of the SSI
program, the empirical literature on its behavioral effects is relatively small. Moreover, almost without
exception, empirical studies focus on only one of the three groups SSI targets. For this reason, the
empirical evidence on the behavioral effects of SSI for each target population group will be discussed in
turn.
SSI and Adults with Disabilities

48This discussion draws from Burkhauser and Daly, 2002.
49Although numerous scholars have questioned the validity of such data, Burkhauser, Daly,Houtenville, and Nargis (2002) show that questions of this type can be used to track trends in outcomes,such as employment, for the population with disabilities.
-33-
Work Effort of Adults with Disabilities.48 Most of the research on the work effort of those with
disabilities focuses on a broader population than those receiving either SSI or SSDI. The most common
analyses relies on nationally representative survey data that include questions based about whether a health
limitation prevents individuals from working or limits their ability to work full time or to do certain jobs.49
While such research is not as targeted as one might like, it does provide a backdrop for understanding the
types of trends faced by the SSI program.
Based on these data, Figure 7 shows that over the past two decades employment rates for those
with disabilities as well as SSDI and SSI caseloads have varied greatly, fluctuating with the economy,
changes in benefit eligibility criteria, and the implementation of other public policies intended to support
people with disabilities. The figure shows employment rates of working-age men and women with self-
reported disabilities and the number of individuals receiving disability benefits for the period 1980-1999.
The employment data come from Burkhauser, Daly, Houtenville, and Nargis (2002) and reflect the
employment rates of CPS respondents who say they are limited in the amount or type of work they can
perform. Data on SSDI and SSI beneficiaries come from the Social Security Administration (2000). Also
indicated in the figure are a few key events: when disability screening was liberalized in 1984 and the
passage of the ADA in 1990.
The trends in Figure 7 highlight the major concerns of disability policymakers over the past two
decades. First, the number of disability beneficiaries has increased continuously since the eligibility
expansion and liberalization in 1984, with especially strong growth during the 1990s (application and
acceptance rates in the 1990s rivaled those experienced during the expansion period of the late 1970s).

-34-
Second, while employment rates for those with self-reported work limitations rose through the economic
expansion of the late 1980s, they have fallen almost continuously since, even during the strong expansion
of the 1990s.
So far, three major hypotheses have been proposed to explain this decline. Kaye (2001) argues
that declining employment rates among those with disabilities in the 1990s were caused by dramatic
increases in the severity of impairments. Hence, for Kaye, the recent trends are health-based and not a
reflection of changes in public policy. Other researchers have taken a more social environment-oriented
view. For example, DeLeire (2000) and Acemoglu and Angrist (2001) attribute the downturn in
employment among those with disabilities during the 1990s to the passage of the ADA. Bound and
Waidmann (2001) argue that changes in disability benefits eligibility and generosity made it easier and
more profitable for workers to leave the labor force and take benefits. Autor and Duggan (2001) suggest
that a combination of disability benefits that replaced a greater share of labor earnings and declining job
opportunities for low-skilled workers induced an increasing share of workers to choose benefits over
employment. Which one of the many changing social variables deserves the most credit is a matter for
future research, but in all likelihood the “true” cause is a combination of factors, rather than a single policy
action or identifiable event.
While researchers debate the reasons for the declining employment and rising benefit rates of men
and women with disabilities during the 1990s, policy makers are debating whether these outcomes are signs
of success or failure of U.S. disability policy. For some advocates of those with disabilities, the increasing
disability benefit rolls reflect an appropriate increase in support for a group of workers with limited labor
market opportunities. For others, the increased rolls reflect the shortcomings of a transfer-focused policy
that failed to provide the necessary supports (e.g., universal health insurance, rehabilitation, and job
services) to allow individuals to select work over benefits. For others still, the outcomes observed during
the 1990s are simply evidence of the law of unintended consequences in policy making, where policies to

-35-
promote economic well-being (in the case of benefits) and work (in the case of the ADA) actually increased
the disability benefit rolls and reduced employment.
Whichever explanation accounts for the decline in employment among those with disabilities,
research by Bound, Burkhauser, and Nichols (forthcoming) shows that one must be careful in making
general statements about the population targeted by SSI based on aggregate data on the population with
disabilities or data on the SSDI targeted population. Table 7, taken from Bound, Burkhauser, and Nichols,
uses longitudinal data from the Survey of Income and Program Participation (SIPP) linked to social
security administrative files to compare the monthly labor earnings and employment of those who apply for
SSI or SSDI three years before application, one to three months before application, and three years after
application. As Table 7 shows, unlike SSDI applicants, the vast majority of SSI applicants are not
employed three years before they apply for benefits. Only 25(28) percent of those awarded (denied) SSI
were working three years before their application and their average monthly labor earnings were only $144
($260). Moreover, both their employment and their average monthly labor earnings were a small fraction
of the employment and labor earnings of SSDI applicants three years prior to application.
The data in Table 7 suggest that the factors causing the low employment and labor earnings of SSI
applicants at the time of application and after they move onto the SSI rolls were in effect well before the
time of their application. This is not surprising since Bound, Burkhauser, and Nichols also show that they
typical SSI applicant is less likely than the typical SSDI applicant to be white, a high school graduate,
married, wealthy, or live in a high income household prior to application.
Factors Affecting SSI Participation. While application for SSI disability benefits is a function of
health, it also is influenced by program rules and benefits. These include eligibility criteria and the
generosity of benefits relative to work, the comparative generosity and availability of other means-tested
welfare and social insurance programs, macro economic conditions (national, state, and local), and
applicants’ education and job skills. During the 1990s, considerable attention was devoted to

50The 1980 law tightened Social Security Administration control over the state disabilitydetermination services. In particular, SSA previously had reserved the right to review initial determinationsbefore they were transmitted to the applicant, but during the 1970s it reviewed only 5 percent. The 1980amendments required that SSA review two-thirds of successful applications. To enforce administrativecontrol over administrative law judges, the secretary of Health and Human Services was empowered toappeal administrative law judge rulings that were favorable to the applicant.
Prior to 1980, the law provided that disability determinations be performed by state agencies underan agreement negotiated by the states and the Secretary of Health and Human Services. The 1980amendments required that disability determinations be made by state agencies according to regulations ofthe Secretary. It also required the Secretary to issue regulations specifying performance standards to befollowed in the disability determinations, and if the Secretary found that a state agency was failing to makedisability determinations consistent with regulations, then the Secretary was required to terminate the
-36-
understanding the link between these non-health factors and SSI caseload growth. The following
discussion reviews the evidence on determinants of SSI caseload growth, looking first at the relationship
between caseload dynamics and screening stringency (benefit supply), and then at factors affecting the
demand for SSI benefits, including ease of benefit access, benefit generosity relative to work and other
programs, and economic conditions.
SSA began modifying its disability determination process in the mid-1970s. Concerned that state
offices were not consistently and uniformly applying the residual functional capacity (RFC) and vocational
standards in adult disability determinations, in 1979 SSA published regulations specifying who was to be
classified as disabled, essentially tightening the eligibility criteria. SSA also tightened its policy towards
benefit terminations in continuing disability reviews (CDRs) by state Disability Determination Services
(DDS), permitting benefit termination without proof of medical improvement. This policy resulted in a
three-fold increase in the number of cessation decisions on continuing reviews by state agencies (The Lewin
Group 1999). Consistent with the tighter standards, the yearly allowance rate (initial acceptances divided
by initial applications) of adult SSI disability applications began to fall in 1976 (Table 8).
The Social Security Disability Amendments of 1980 continued the trend of tightening the disability
determination and review process. Importantly, the 1980 law changed both the frequency and nature of
medical eligibility reviews done on disability beneficiaries.50 Before 1980, the only beneficiaries targeted

state’s authority and assume federal responsibility for the determinations.
51For a fuller discussion of disability policy in this period, see Berkowitz and Burkhauser (1996).
-37-
for medical eligibility review were those who had conditions that were likely to improve over time. The
new law stipulated that all beneficiaries periodically should receive continuing disability reviews, and that
all but those deemed to have permanent disabilities should be reviewed every three years. The 1980 law
made permanent the practice of using the same standards in CDRs that were applied when initially
evaluating claimants. In addition to tightening the disability adjudication and review process, the 1980 law
established two key work incentives: (1) the 1619(b) provision; and (2) the deduction of impairment-
related work expenses (IRWEs) from earnings when determining the SGA. As noted earlier, the 1619(b)
provision authorized a three-year demonstration project, allowing for the payment of special SSI benefits
(and the retention of Medicaid coverage) for SSI recipients who exceeded the SGA level. Section 1619
became permanent in 1986.
As could be expected, the 1980 law had a discernible impact on administrative practice. As
demonstrated in Table 8, the yearly allowance rate for adult SSI disability recipients fell from a high of
52.6 percent in 1975 to 26.6 percent in 1982. The number of recipients fell from 1.75 million in 1978 to
1.66 million in 1982. This decrease occurred despite the economic recession of 1980-1982. This removal
of individuals from the rolls generated a major political response. Most of the people removed from the
rolls appealed the decision, requesting a hearing before an administrative law judge and causing a huge
backlog of cases. As a result, some state governors instructed their DDS service not to terminate anyone
from the disability rolls unless that person’s conditions had improved.51
In 1984, in response to concerns that federal disability policy had become too restrictive, the Social
Security Administration agreed to a moratorium on CDRs pending the enactment and implementation of
revised guidelines. The 1984 law had profound effects on the standards used to evaluate a person’s

52As part of more general welfare reforms in 1996, Congress removed drug and alcohol addictionas allowable conditions for SSI eligibility. In 1995, there were about 135,000 SSI recipients whosedisability was based solely on drug addiction or alcoholism. The Congressional Budget Office estimatedthat about 65 percent of these individuals would be eligible for SSI based on other sufficiently disabling
-38-
potential eligibility for SSI. When reviewing existing beneficiaries, the burden of proof was shifted back to
the SSA to show that a beneficiary’s health had improved sufficiently to allow him or her to return to work.
A moratorium was imposed on re-evaluations of the most troublesome cases—those that involved mental
impairments or pain—until more appropriate guidelines could be developed. Finally, benefits were
continued pending the outcome of an appeal.
The 1984 law substantially increased the weight given to source evidence (i.e., evidence provided
by the claimant’s own physician) by requiring that it be considered first, prior to the results of an SSA
consultative examination. SSA also was required to consider the combined effect of all impairments,
whether or not any one impairment was severe enough to qualify a person for benefits. Perhaps most
important, the SSA substantially revised its treatment of mental illness, reducing the weight given to
diagnostic or medical factors, and emphasizing the ability of an individual to function in work or work-
like settings.
Table 8 shows that the dip in the SSI adult disability population which occurred between 1978 and
1982 was reversed thereafter, and rose about 4 or 5 percent a year during the economic growth years of the
later 1980s. When the next economic downturn came in the early 1990s, conditions were ripe for a surge
in applications and in the number of people on the SSI disability rolls. The increases in the disability
transfer population in the early 1990s exceeded anything seen in SSI since the start of the program. The
annual acceptance rate for SSI adult disability benefits was almost 45 percent in 1992, the highest since
1976. Economic recovery and Congressional action with respect to SSI disability eligibility have slowed
the growth in the working-age adult SSI population, but acceptance rates remain well above those in the
1980s, suggesting that a future downturn in the economy could result in an increase in the rolls.52

conditions. For a full discussion of these reforms and their impact see U.S. House of Representatives(1998).
-39-
The legislative history underlying the disability screening process highlights how access to benefits
has changed over time. Figure 8 shows that the desire for SSI disability benefits also has fluctuated.
Fluctuations in applications have been as large as changes in the SSI disability rolls. To some extent these
fluctuations have mirrored changes in eligibility standards, contracting when eligibility standards were
tightened in the late 1970s and early 1980s, rising after the relaxation of eligibility standards in 1984, and
falling again following the tightening of standards in the mid-1990s. However, other factors including local
economic conditions, outreach efforts by both SSA and state governments to search for eligible candidates,
and the generosity of SSI relative to other programs all are likely to have contributed to the variability in
applications over time.
A number of scholars have estimated the link between local economic conditions and SSI
application rates. The fact that SSI is a national program restricts the extent to which regional variation in
benefits can be used to identify the effect of the program on applications. However, in recent work Black,
Daniel, and Sanders (2001) used regional variation in economic conditions to identify the effect of financial
incentives on the decision to apply for SSI (and SSDI) disability benefits. In particular, they examined the
impact of the coal boom during the 1970s, and the coal bust during the 1980s on the number of SSI
beneficiaries. Using panel data on 186 counties in Kentucky, Ohio, Pennsylvania, and West Virginia they
estimated an elasticity of program payments with respect to local area earnings of between -0.5 and -0.7 for
SSI recipients. While these results lend some support to the notion that labor market conditions in an area
affect the decision of individuals to apply for disability benefits, the point estimates are hard to interpret.
Black, Daniel, and Sanders interpret the estimated coefficient on the local earnings variable as reflecting the
effect of changes in the financial attractiveness of disability benefits. However, given the nature of the
specification used, it is possible that the earnings variable is picking up the effect of general economic

53As will be discussed shortly, the evidence that recessions lead to increases in the number ofapplications for SSI is strong.
-40-
conditions rather than the relative financial attractiveness of SSI.53 Furthermore, their estimates reflect the
short-run effect of changes in the local economies in Kentucky, Ohio, Pennsylvania, and West Virginia on
the number of disability beneficiaries. Given the fact that the typical SSI spell is lengthy in duration,
long-run effects likely will be substantially larger than short-run effects.
A considerable amount of government-sponsored research has attempted to explain the dramatic
growth in the SSI population in the early 1990s. A useful summary of this work can be found in Rupp and
Stapleton (1995). Much of this analysis has used the considerable variation in state-level applications and
awards to test their models. Using cross-state data from 1988-1992 Stapleton, Coleman, Dietrich, and
Livermore (1995) find convincing evidence that the recession of the early 1990s contributed to the rapid
rise in the number of applications for SSI benefits. They estimate that a 1 percentage point rise in the
unemployment rate was associated with a 2 percent rise in applications for SSI. The effects on final
awards were somewhat lower. Finally, they found that the changes in the unemployment rate had a smaller
effect on benefit awards than on applications, suggesting that recessions induce those with less severe
disabilities to apply for SSDI and SSI benefits.
Stapleton, Coleman, Dietrich, and Livermore also provide strong, if indirect, evidence that changes
in screening stringency in the 1990s played a central role in explaining program growth. Indeed, the very
fact that award rates were rising at the same time that application rates were rising would seem to suggest
an important role for changes in screening stringency. They find that changes in the unemployment rate,
together with other factors they include in their models, could explain almost all of the growth in
applications for impairments related to conditions of internal organs, but could account for much less of the
growth in applications for impairments related to musculoskeletal or mental health conditions. These
patterns suggest that regulatory changes such as the increased weight given to pain and other symptoms,

-41-
the increased reliance on source evidence, and the broadening of the standards used for those with mental
impairments all have contributed importantly to the recent surge in applications for SSI.
Whereas the 1990s recession seems to be part of the explanation for the rapid rise in applications
for SSI benefits that occurred during the first part of the 1990s, no such rise occurred during the severe
recession of the early 1980s. A reasonable interpretation of these patterns is that the tightening of
eligibility standards that occurred during the early 1980s counteracted the effects of the 1980s recession.
During the mid-1980s, when eligibility standards were relaxed again, the booming economy slowed any
immediate response. However, when the 1990s recession hit, applications grew rapidly.
Researchers studying the increases in SSI caseloads have found evidence that an important factor
explaining the growth in SSI over the 1990s has been efforts by states to shift individuals off state-funded
programs such as general assistance and onto SSI. States that cut general assistance benefits experienced
above-average growth in the application for SSI benefits (Lewin-VHI 1995a). Using monthly
administrative data from Michigan, Bound, Kossoudji, and Ricart-Moes (1998) find that the increase in the
application for SSI benefits exactly coincided with the end of general assistance in Michigan. However,
they also find that general assistance benefits typically are less generous than are SSI benefits. This finding
is surprising within the context of a simple labor supply model that ignores the relative costs of application
for these two types of benefits. The fact that many potentially eligible people did not apply for the more
generous SSI benefits suggests that applying for disability benefits may be difficult and onerous. There is
also considerable anecdotal evidence that states and third parties often act as intermediaries to facilitate the
SSI application process (Livermore, Stapleton, and Zeuschner 1998; Bound, Kossoudji, and Ricart-Moes
1998).
Brown, Hoyt, and Scott (1999) approach a similar question using county-level data on SSI and
AFDC participation rates. They find that prior to 1996 welfare reform, variation in AFDC programs
across states explains little of the variation in SSI participation. They also find that program and eligibility

-42-
variables explain more of the county-to-county variation in SSI participation than in AFDC participation,
suggesting that SSI is a more tightly targeted program than AFDC. Still, they conclude that given the
significant changes in welfare programs embodied in the transition from AFDC to TANF, SSI participation
rates likely will be affected.
Increases in the value of Medicaid benefits for individuals on SSI also may have contributed to the
recent growth in applications for both programs. Yelowitz (1998) uses cross-state variation in Medicaid
benefits to estimate the effect of changes in their value on participation in SSI. In particular, in response to
court orders, many states increased Medicaid benefits in 1991. Using these changes, Yelowitz estimates
that increases in the value of Medicaid which occurred over the late 1980s and early 1990s can explain
about 20 percent of the increase in the working-age population receiving SSI benefits.
However suggestive Yelowitz’s results are, they do not seem to be very robust. Stapleton and his
colleagues (Lewin-VHI 1995b) used Yelowitz’s methodology to look at the effect of changes in the value of
Medicaid on the application for SSI benefits and found no measurable effects. Given the expectation that
increases in the value of Medicaid initially would have a proportionately bigger effect on the number of
applications (a flow) than on the beneficiaries (a stock) this non-result is surprising. While it is hard to
imagine that eligibility for Medicaid benefits does not make SSI more attractive, finding statistical evidence
of this effect has proven to be quite challenging.
Effects of Work Incentives and Disincentives. Because the United States has few program
alternatives that offer long-term benefits to working-age persons who are not working, the relatively
generous benefits and imperfect screening mechanisms in SSI could pose significant work disincentives
for persons with disabilities who are considering applying for benefits. Additionally, the high marginal
tax rates for those on the program could discourage exit from it and entry into the labor force.
A large empirical literature has tried to estimate the magnitude of moral hazard effects. Some of
that literature has examined the net effect of SSI (and SSDI) on labor force participation rates, such as

54For example, SSDI is an insurance-based (non-means-tested) program with its benefits basedon past individual earnings history, while SSI is a flat rate means-tested welfare program. SSDI providesrecipients Medicare benefits after they are on the program two years and restricts its recipients to laborearnings up to $750 per month for a limited period, after which they face a significant program “notch”and lose all SSDI benefits. SSI provides it recipients with immediate access to Medicaid and, once onthe program, allows them more generous work options compared to SSDI.
-43-
how much higher participation rates would be were it not for these programs. However, this literature
has primarily focused on estimating the disincentive effects of SSDI program parameters, benefit
generosity, or screening stringency. For a complete review of this literature see Bound and Burkhauser
(1999). While it is tempting to look to the SSDI literature to gain some insights into how the SSI program
affects the behavior of low-income adults with disabilities, doing so is problematic. First, whereas both
programs use the same inability to perform substantial gainful activity criteria with respect to establishing
categorical eligibility, the benefit structures of the two programs are quite different.54 Second and perhaps
more important, as noted earlier, typical SSDI applicants have much different socio-economic
characteristics and work histories than typical SSI applicants.
As seen in Table 7, most of the individuals who apply for SSI were not working three years prior
to application. More importantly, the causes for their low employment rates at that time likely were more
closely associated with the problems faced by low skilled or poorly educated workers generally than with
specific effects of poor health or of the work disincentives of SSI or SSDI. Furthermore, only 19 percent
of those who were denied SSI benefits were employed three years after their application (Table 7). In
contrast, 35 percent of denied SSDI applicants were employed three years after application. These patterns
suggest that changes in program work incentives and disincentives for those on the SSI rolls are less likely
to induce them to leave the rolls and return to employment than would be the case for SSDI beneficiaries.
This seems especially likely given that far fewer SSI beneficiaries than SSDI beneficiaries worked three
years prior to application when they presumably did not have as a work limitation severe enough to qualify
for benefits.
55Section 1619 (Public Law 96-265) became law in 1986. These provisions dramatically alteredthe earnings opportunities for SSI disabled adults. Section 1619(a) allows recipients to maintain their SSI(and Medicaid) benefits even when their earnings exceed SGA. Section 1619(b) extends Medicaidcoverage to workers whose earnings make them ineligible for SSI cash payments.
56Data on recipients who work come from SSI Annual Statistical Supplement, 2002.
-44-
Although it is not clear that the SSDI research will shed much light on the work behavior of SSI
recipients, there is a large literature on the work incentives/disincentives in other welfare programs. This
empirical research consistently finds that recipients are unresponsive to changes in marginal tax rates (for
reviews of this literature see Moffitt, 1986 and Hoynes and Moffitt, 1996). This literature provides little
evidence that individuals participating in means-tested programs respond to financial incentives by working
more. Research on the extent to which individuals with disabilities have the same income and substitution
elasticities of participants in other programs would be an important step in determining whether the results
discussed are applicable to the SSI population.
Finally, the small amount of research that does exist on the work efforts of SSI recipients suggests
that, despite special allowances for SSI recipients who receive earnings (e.g., 1619(a) and (b) status), only
a small percentage of disabled adult SSI recipients work.55 In 1976 only 3.4 percent of all disabled adult
beneficiaries worked. Since that time, the percentage of disabled SSI recipients with earnings has nearly
doubled but, at 6.3 percent in 2001, remains quite low.56 A somewhat more optimistic picture comes from
work by Muller, Scott, and Bye (1996), looking at the work history of SSI recipients. They find that
among a sample of SSI beneficiaries coming onto the rolls between 1976 and 1988, approximately one-
quarter worked during the time they received benefits.
In response to the low number of SSI recipients who work, the Social Security Administration has
conducted two large-scale return-to-work demonstration projects to study the effectiveness of providing
rehabilitation and employment services to SSI beneficiaries. The first, the Transitional Employment
Training Demonstration (TETD) project, which operated between 1985 and 1987, focused on SSI

57The net effect of the transitional employment services is harder to evaluate and depends cruciallyon the extent to which the services provided by the project substitute for other services paid for by thegovernment (Thornton and Decker 1989).
-45-
beneficiaries whose primary condition was mental retardation. The second, Project Network, operated
between 1992 and 1995 and included SSDI and SSI beneficiaries with a wide range of diagnoses. The two
demonstration projects were run in a similar fashion. Eligible beneficiaries in selected cities were invited to
participate in the two projects. Volunteers were then randomly assigned to treatment and control groups.
The treatment groups were provided with rehabilitation and employment services, while the control group
was not. Using both survey and administrative data, the effectiveness of the rehabilitation and employment
services could then be studied by comparing outcomes of the experimental and control groups.
Analysis of the impact of the TETD project suggests that the employment and rehabilitation
services provided to SSI beneficiaries significantly increased earnings for participants over the six years
they were observed (earnings of the treatment group were close to 70 percent higher than the control group
(roughly $4,000 in 1996 dollars) but the program only had a small impact on average SSI payments ($870
per participant). This small reduction in SSI payments was not nearly sufficient to cover the average costs
of transitional employment services for program participants (Thornton and Decker 1989).57 However,
when the employment and earnings gains for program participants are weighed against the costs of
providing the employment services, the program may very well have produced a net social benefit. Similar
results were obtained from Project Network. Analyses of the program (Kornfeld and Rupp 2000) show
that during the first two years of operation Project NetWork produced modest net benefits to persons with
disabilities, as earnings gains among participants more than offset reductions in SSI and SSDI benefits.
However, the small gain in earnings was not nearly sufficient to offset the costs of administering Project
NetWork. Moreover, data for a third year follow up on about 70 percent of the sample show earnings
gains declined to about zero, suggesting that the increase in earnings may have been temporary.

58As will be discussed later in this chapter, the cost of applying for SSI disability benefits for theaverage applicant may be lower today than in previous periods. To the extent that welfare reform haschanged the SSI applicant pool, individuals may not be making a choice between work and benefits butrather between other welfare and SSI. Moreover, in response to both welfare reform and state financingissues, state governments may engage in more SSI outreach and lower the applicant’s cost of applying.
59The evidence we have on the extent of work activity by those who have been awarded SSIbenefits comes mostly from the analysis of Social Security Earnings data. Anecdotal evidence suggests thatsome fraction of those on SSI are actually working, but are working “off the books.” Research targeted onsuch “off the books” work by SSI beneficiaries along the lines of that done by Edin and Lein (1997) onwelfare recipients would be valuable.
-46-
Importantly, in both cases the fraction of program eligibles who volunteered for either TETD or
Project Network was small—roughly 5 percent in each experiment. This suggests that, however beneficial
it might be to those who participate, the provision of transitional employment services to those on SSI who
volunteer for services is unlikely to have much of an impact on the overall SSI population. This is hardly
surprising. As shown earlier in this chapter, only a small fraction of SSI applicants were working in the
years prior to application. In addition, beneficiaries go through a long process to establish that they have
medical conditions that prevent them from performing substantial gainful activity. At least at the time they
apply for SSI benefits, applicants would appear to have put substantial energy into becoming eligible for
program benefits—benefits that must more than compensate applicants both for any loss of income
associated with moving onto SSI as well as for the costs associated with applying for benefits.58 For the
great majority of those awarded benefits, their health is unlikely to improve over time and their labor
market opportunities are probably deteriorating. Moreover, those who return to work may be subject to
high marginal tax rates.59 Under such adverse conditions it is not surprising that voluntary returns to work
are rare.
SSI and Families of Children with Disabilities
As noted earlier, the primary justification for awarding cash benefits to poor families containing
a disabled child is that the families of disabled children face additional economic burdens associated with

-47-
their child’s poor health (see NASI 1996). These economic burdens may include lost earnings from a
parent who provides care for the disabled child and medical and nonmedical expenses related to the
child’s specific disability. However, SSI child benefits are not based on an earnings replacement or
expenditure offset formula, but, rather are means-tested against current income. It is difficult to know a
priori whether beneficiary families experience dramatic drops in labor earnings or increases in net-of-
disability-expenditures in family income. In fact, it is equally possible that recipient families have low
incomes prior to the onset of the child's disability, and that the additional burdens placed on families with
a disabled child are not the root cause of their current financial situation.
As with the adult SSI program, the child SSI program faces the problems related to moral
hazard—incentives for parents to have their children become and remain eligible for SSI. The degree to
which this potential moral hazard causes behavioral changes with respect to gaining and maintaining
eligibility depends, to some degree, on the pre-disability economic circumstances of the covered families.
If the typical family is a middle-income family that experiences a dramatic decline in their economic
well-being at the onset of their child's disability, but in all other ways has the market and social
characteristics necessary to attain middle-income status, then cash programs that only partially offset
these losses are unlikely to lead to major disincentives for labor market participation or the child's
recovery. However, if the typical family that comes onto the SSI rolls is already economically vulnerable
(e.g., family members have few market skills, one-parent family, etc.) prior to the onset of their child's
disability, eligibility for SSI is likely to have much greater economic importance. Poor families who
have a child with a disability may be able to completely replace or even increase their family income if
their child's disability results in the receipt of SSI benefits. Thus, pre-disability differences in economic
well-being alter the replacement rate of SSI among families of children with disabilities and make the
moral hazard of behavioral change much greater among pre-disability low income families than among
middle- or high-income families.

-48-
Factors Affecting SSI Participation. As is true for the adult disability determination process, the
disability determination process for children has undergone substantial revision. As noted earlier, the most
important change came in 1990 when the Supreme Court required SSA to significantly broaden the
eligibility criteria for childhood disability. The same year as the Zebley decision, SSA also released
regulations revising the procedures used to evaluate mental impairments among children. The new rules
expanded SSA’s medical listings for childhood mental impairments by adding such illnesses as attention
deficit hyperactivity disorder (ADHD) and by incorporating functional criteria in the listings. Similar to
the changes made in the adult process, SSA modified the types of evidence used to judge the damage of
mental illness; less emphasis was placed on the testimony of medical professionals and more weight was
given to the information parents, teachers, and counselors provided about the child’s condition. As with the
Individual Functional Assessment (IFA), the new mental impairment regulations focused on how
disabilities affected a child’s performance in school.
Following these changes the child SSI caseloads grew rapidly. Data from the Social Security
Administration show that between 1989 and 1996, the number of children under 18 receiving SSI more
than tripled, from 265,000 to 955,000. Applications increased from 132,000 in 1989 to 541,000 per year
in 1994, and awards more than quadrupled. The yearly allowance rate on applications rose from 39
percent in 1989 to a peak of 58.1 percent in 1992. In 1992, the number of children on SSI grew by 40
percent (GAO 1998).
In response to rapid caseload growth and a burgeoning concern that the disability determination
process was allowing too many children without serious medical problems onto the disability rolls,
Congress narrowed the criteria for childhood disability in 1996. In addition, Congress mandated SSA to
redetermine the eligibility of children on the rolls who might not meet the new eligibility criteria because
60SSA originally identified 288,000 children as potentially affected by changes in the eligibilitycriteria. In 1998, SSA scaled back their estimates; new estimates suggest that fewer than 100,000 childrenwill become ineligible for SSI (GAO 1998).
-49-
they received benefits on the basis of the former, more lenient, standards.60 In 1997, the number of SSI
recipients under age 18 fell by 7.9 percent and increased only slightly in 1998.
Economic factors also influence the decision of families to participate in SSI. Evidence suggests
that a large fraction of the children coming onto the rolls in the 1990s previously participated in the
AFDC program. Daly and Burkhauser (1998), using data from the National Longitudinal Survey of
Youth (NLSY), calculate that two-thirds of children found eligible for SSI in the early 1990s were in
families already receiving some type of welfare assistance. Other things equal, families eligible for
multiple programs are likely to select those programs that provide the highest net benefit to them.
Although additional costs are associated with SSI (e.g., more stringent application rules, greater stigma
related to receiving benefits, etc.), as the benefit difference between SSI and other programs increases,
more families will be willing to incur these costs to improve their economic situation.
Kubik (1999) tests the empirical significance of this prediction. He finds that AFDC recipient
families who successfully qualify a child for SSI benefits can increase family income substantially.
Table 9 (taken from Kubik, 1999) shows how a family’s income can change when a child moves from
AFDC to SSI. The analysis is for two states, Maryland and Connecticut, and demonstrates two points:
(1) families can significantly improve their economic well-being if someone in the family qualifies for
SSI; and (2) the generosity of SSI relative to AFDC has grown over time, implying that the incentive to
transfer to the SSI program has grown. Table 8 shows that a family of three living in Maryland in 1990
could have increased monthly family income by over $3,500 if one child transferred to the SSI rolls. By
1994, this advantage had grown to almost $4,400. Since other in-kind benefits, such as Medicaid and
Food Stamps remained constant, the family experienced a net gain in income if the child moves from
AFDC to the SSI rolls.
61To account for state-specific factors that may affect the prevalence of disability, Kubik examinesthis relationship before and after Zebley. Thus, he measures the change in the prevalence of reporteddisability and compares it to the change in the difference between SSI and AFDC benefits by state.
-50-
A small number of empirical papers have examined the responses of AFDC participants to
changes in the SSI program, including the post-Zebley broadening of the childhood disability criteria,
and increases in the relative generosity of SSI benefits during the 1990s (see Rand (1998) for a thorough
review of this literature). Garrett and Glied (2000) examine the impact of the Zebley decision on SSI and
AFDC caseloads using the Zebley ruling as a “natural experiment,” representing an exogenous increase
in the supply of SSI benefits (i.e., eligibility criteria are relaxed and more families are allowed onto the
SSI program). They exploit the state-level variation in the difference between SSI and AFDC payments
to test whether families are responsive to increases in net benefits. Their findings suggest that families
are responsive to differences in program generosity. They found that in low AFDC states, where the
difference between AFDC and SSI payments would be largest, about 53 percent of the new post-Zebley
child SSI cases switched from the AFDC program; nationally, only about 43 percent of new SSI child
cases came from the AFDC program.
Along the same lines, Kubik (1999) examines the incentives for families to identify children as
disabled when SSI benefits are more generous than AFDC benefits. Using data from the National Health
Interview Survey (NHIS) and changes in the difference in SSI and AFDC benefits, Kubik finds that
reported disabilities—particularly mental impairments—were higher in low AFDC benefit states than in
high AFDC benefit states.61 Using data from the Current Population Survey on household SSI receipt, he
also finds that relatively generous SSI benefits (relative to AFDC payments) affect SSI participation.
Kubik estimates that a 10 percent increase in SSI benefit generosity increases the probability of SSI
participation among families with low education by 0.39 percentage point—a five percent increase in SSI
participation. Overall, Kubik finds a significant and positive relationship between the marginal value of
SSI benefits and the prevalence of disability, and receipt of SSI, among children.
-51-
Effects of SSI on Work Effort of Families. SSI support for families potentially affects the labor
market effort of parents. However, there is not a large empirical literature on this relationship. Indeed, of
the literature on childhood SSI, only the Garrett and Glied (2000) and Kubik (1999) papers consider this
issue. Garrett and Glied (2000) estimate that the Zebley decision had a significant impact on the
employment of unmarried women without a high school education. Kubik (1999) finds similar results;
examining behavior after Zebley, Kubik finds that increases in SSI benefits lowered the probability that
low-education household heads work. He estimates that a 10 percent increase in SSI benefits decreases
labor force participation of low-education household heads by about 2 percent. The empirical evidence on
the effects of SSI benefit levels on parental work effort after Zebley suggest that, in addition to responding
to the particular health needs of a child, mothers also respond to the income effect present in the guarantee
as well as to the high marginal tax rates placed on their labor earnings.
SSI and the Behavior of the Aged
Factors Affecting Participation. Researchers have offered a number of hypotheses to explain the
low enrollment in SSI among the elderly, including lack of knowledge about the program and eligibility
criteria, prohibitively expensive application costs (e.g., time cost or cost of learning), and unobserved costs
of receiving benefits (e.g., welfare stigma). Early work on this topic focused primarily on the roles of
welfare stigma and program knowledge on the decision to apply. Coe (1985) reported that of the SSI
nonparticipants classified as eligible (48 percent of all eligible individuals), a significant fraction were not
aware of the program or did not think they were eligible. Coe also found that benefit levels were
positively and significantly related to participation, with each $10 in additional benefits resulting in a 2.4
percentage point increase in the probability of participation. This is consistent with the notion that
relatively high benefit levels would outweigh any noninformational barriers to participation, such as
access costs. However, Coe notes, noninformational barriers accounted for only 25 percent of the
negative effect of low benefits on participation. The primary reason lower benefit levels decreased

62Coe’s measure of other resources includes only the home ownership variable. McGarry uses amore extensive set of resource measures, including home and other asset ownership, labor earnings over theyear, and income-to-needs ratio.
-52-
participation was that eligible individuals facing low benefit levels were more likely to believe that they
were not eligible to participate. Warlick (1982) also concluded that program information and the
difficulty of the application process were the primary reasons for low participation rates among the
eligible elderly.
Recent work by McGarry (1996) draws a slightly different conclusion. McGarry extends
previous research by using detailed asset and income information from the 1984 SIPP to more accurately
classify eligibility by accounting for differences in benefit levels introduced by state supplementation,
and by explicitly controlling for measurement error in the estimation process. McGarry concludes that
the participation decision is primarily determined by the financial situation of eligible individuals. She
finds that although all persons eligible for SSI are poor, the probability of participation declines as the
number of alternative resources increases. Similar to Coe, she finds that the elasticity of the expected
benefit is about 0.5 and that, after controlling for size of the SSI payment, those with greater resources
are less likely to participate.62
McGarry departs from previous research in finding little evidence that welfare stigma or
informational program costs affect participation. However, as she notes, her results must be interpreted
with caution. The estimated model is a reduced-form version, which includes variables likely to affect
participation through more than one path. If a variable operates in opposite directions on different
factors, its importance may be obscured. Thus, while she argues that the negative coefficient on years of
schooling implies that lack of information does not deter participants, this result can just as easily be
interpreted as evidence of stigma associated with receiving benefits (e.g., more educated individuals feel
more stigma associated with receiving benefits).

63McGarry (2000) simulates the effects of changes in eligibility criteria on participation and costs. She finds that extending the income guarantee for all elderly individuals to the poverty line has the largestimpact. Modifications to SSI that increase income disregards, eliminate the asset test, or base incomeeligibility are less costly but also have less of an impact on poverty.
-53-
In general, the low SSI participation rates among the elderly remain somewhat of a mystery.
Although there is reason to believe that some individuals are uninformed about the program or their
eligibility for benefits, there is not much evidence that a large fraction of the elderly poor in need of
assistance are constrained by transactions costs. What does appear to be the case is that eligible
individuals who are close to the margin on the means test are less likely to participate in the program. As
Coe (1985) argued, this may be due to individuals misunderstanding the income disregards and other
program rules that determine eligibility. Thus, unless individuals are sufficiently below the means test
guidelines, they believe that they will be ineligible, and thus, do not apply. This interpretation is
consistent with McGarry’s simulation of responses given a change in benefit levels. McGarry examined
how raising the federal income guarantee to the U.S. poverty line impacted the participation of those
previously, and newly eligible for benefits. She finds that raising the benefit level increases the
participation rates of those previously eligible by 16.5 percentage points, from 0.534 to 0.699. In
contrast, she finds that less than 30 percent of those newly eligible under the increased income limit
participate in the program.63
Savings Behavior. Although it is well recognized that means-tested programs create incentives for
potentially eligible individuals to alter their behavior to ensure qualification, few studies have rigorously
reviewed the incentives facing elderly individuals close to the age and resource tests for SSI. Yet, it is
likely that SSI program features create disincentives for working and saving as individuals approach the
age of eligibility. Neumark and Powers (1998) focus on the relation between saving behavior and SSI
receipt among the elderly. They argue that SSI’s influence on the savings patterns of elderly individuals
should vary with the expected level of their benefits and the likelihood of receiving them. In practice,

-54-
individuals with low lifetime earnings living in high-benefit states should reduce saving more than high
lifetime earners living in low-benefit states. Neumark and Powers use state-level variation in the generosity
of supplemental SSI payments to identify the effects of SSI on the savings behavior of the elderly. They
find that SSI reduces the saving of men and women nearing the age of retirement who are likely
participants in the program.
SSI and Labor Force Participation at Older Ages. There only are a handful of papers that discuss
SSI and the labor force behavior of older workers. Duggan (1984) finds that SSI has a negative impact on
the labor force participation of men and women over 54 years of age, with especially strong effects for
men. Powers and Neumark (2001, 2002) investigate the role that SSI plays in exercising the early
retirement option in the Social Security program. While Powers and Neumark find only weak empirical
evidence that eligibility for SSI benefits positively influences early retirement decisions, these effects may
increase in coming years. The normal retirement age for receiving social security benefits is now in the
process of increasing from 65 to 67 over the next 15 years, increasing the value to those eligible of the SSI
bridge, especially for those in very poor health.

-55-
VI. Summary and Conclusions
The enactment of the Supplemental Security Income program in 1972 was the culmination of a
four-year debate over a much more overarching welfare reform—a federally-funded minimum income
guarantee for all Americans. Unlike Nixon's FAP proposal, SSI was targeted on the sub-group of low-
income individuals "not expected to work." Since then, SSI has grown dramatically, with the composition
of SSI beneficiaries shifting towards adults and children with disabilities.
How one views the increases in the SSI disability population largely is influenced by one's view of
the social purpose of SSI. For those who see SSI as an incomplete substitute for a universal guaranteed
income program like the NIT, expansions in the SSI program are seen as appropriate because they bring
the United States more into line with most Western European countries that provide such a universal
minimum social safety net for all their citizens. However, for those who are worried about the long-term
effects of a life-time on government transfers, the rise in the prevalence of disability transfer
recipients—particularly among poor children and younger adults—is of more concern.
Whatever perspective one takes, however, as the population on SSI changes and the group of those
not expected to work narrows, the structure of SSI comes into question. As we have shown, the SSI
population has dramatically shifted over time. It is now dominated by children and young adults with
disabilities. To date, despite some attempts to offset the negative work incentives in SSI—Section
1619—exits from SSI to employment, even among this younger population, have been rare. As shown
earlier in this chapter, for individuals and families receiving SSI and other transfer program benefits the
marginal tax rates can go from 50 to near 100 percent at relatively low earnings levels. While such high
tax-rates and relatively generous guarantees make sense for populations not expected to work, in a
population where work is possible, they seriously discourage work. Hence, for those with a capacity to
work, SSI, together with eligibility for other programs, can become the “poverty trap” that the original
supporters of Nixon’s single universal FAP program were trying to avoid.

-56-
Such concerns are particularly relevant in light of other government policies to protect those with
disabilities. Support for civil rights-based legislation like the ADA is based on the idea that people with
disabilities should have equal access to employment. Supporters of this type of legislation view unequal
access to jobs to be a greater impediment to employment than a health impairment. Furthermore, they ask
that social policy focus on altering workplace institutions to more fully accommodate people with
disabilities. Hence, in a world of full accommodation, they argue the disability-transfer population should
be zero. Fundamentally, the current policy debate over expanding SSI transfer rolls hinges on the role
people with disabilities should play in society. Should people with disabilities be expected to work or not?
If yes, then policies targeting people with disabilities—particularly the young—would be better focused on
education, rehabilitation, job training, and accommodation than on increasing or expanding transfers.
Likewise, for children with disabilities, investing more time, energy, and resources toward enhancing their
education and development, rather than focusing solely on supplementing the income of their households,
might be more desirable.
In general, our examination in this chapter suggests that in the absence of a universal guaranteed
income program for all Americans, the operational flexibility of the categorical eligibility criteria for SSI
has made the program sensitive to both downturns in the business cycle and to increases in the pool of
vulnerable people. Moreover, when the dividing lines separating the working-age adult and child
populations eligible for SSI from those eligible for other income-based benefits are imprecise, as with
disability, policy changes in other welfare programs likely will affect SSI caseloads.

-57-
References
Aarts, L., R.V. Burkhauser, and P.R. de Jong. 1996. Curing the Dutch Disease: an InternationalPerspective on Disability Policy Reform. Aldershot, UK: Avebury.
Acemoglu, D. and J. Angrist. 2001. “Consequences of Employment Protection? The Case of theAmericans With Disabilities Act.” Journal of Political Economy 109 (5): 915-57.
Autor, D. and M. Duggan. 2001. “The Rise in Disability and the Decline in Unemployment.” Mimeo,Department of Economics, Massachusetts Institute of Technology.
Berkowitz, E.D. and R.V. Burkhauser. 1996. “A United States Perspective on Disability Programs,” in:L.J.M. Aarts, R.V. Burkhauser, and P.R. de Jong, eds. Curing the Dutch Disease: anInternational Perspective on Disability Policy Reform. Averbury, Adershot, UK:71-92.
Black, D., K.Daniel, and S. Sanders. 2002. “The Impact of Economic Conditions on Participation inDisability Programs: Evidence from Coal Boom and Bust.” American Economic Review, March92(1): 27-50.
Bound, J. and R.V. Burkhauser. 1999. “Economic Analysis of Transfer Programs Targeted on Peoplewith Disabilities.” in the Handbook of Labor Economics, Volume 3(c), edited by O. Ashenfelterand D. Card. Amsterdam: Elsevier Science: 3417-3528.
Bound, J., R.V. Burkhauser, and A. Nichols. (forthcoming) Tracking the Household Income of SSDI andSSI Applicants. Research on Labor Economics.
Bound, J., S. Kossoudji, Ricart-Mous, G. 1998. “The Ending of General Assistance and SSI DisabilityGrowth in Michigan: A Case Study.” In Growth in Disability Benefits: Explanations and PolicyImplications, edited by K. Rupp and D. Stapleton. Kalamazoo, MI: W.E. Upjohn Institute forEmployment Research.
Bound, J., J.B. Cullen, and L. Schmidt. 2000. “The Welfare Implications of Increasing DI BenefitGenerosity.” University of Michigan, Ann Arbor: mimeo.
Bound, J. and T. Waidmann. 2002. “Accounting for Recent Declines in Employment Rates among theWorking-aged Men and Women with Disabilities.” Journal of Human Resources, 37(2), pp: 231-250.
Brown, W.H., W. Hoyt, and F.A. Scott. 1999. “Substitution Between SSI and AFDC: An Analysis UsingCounty-Level Data.” University of Kentucky Working Paper E-211-99.
Burke, V.J. and V. Burke. 1974. Nixon’s Good Deed: Welfare Reform. New York: ColumbiaUniversity Press.

-58-
Burkhauser, R.V. and M.C. Daly. 2002. “U.S. Disability Policy in a Changing Environment.” Journal ofEconomic Perspectives, Winter: 213-224.
Burkhauser, R.V. and M.C. Daly. 1996. “Employment and Economic Well-Being Following the Onsetof a Disability: The Role for Public Policy.” In Jerry Mashaw, Virginia Reno, Richard V.Burkhauser, and Monroe Berkowitz (eds.), Disability, Work, and Cash Benefits. Kalamazoo,MI: W.E. Upjohn Institute for Employment Research, pp. 59-102.
Burkhauser, R.V., M.C. Daly, and A. Houtenville, and N. Nargis. 2002. “Self-Reported Work LimitationData: What They Can and Cannot Tell Us.” Demography, Summer: 541-555.
Burkhauser, R. V. and T. A. Finnegan. 1993. “The Economics of Minimum Wage Legislation Revisited.” Cato Journal 13(1): 123-129.
Burkhauser, R. V. and T. A. Finnegan. 1989. “The Minimum Wage and the Poor: The End of aRelationship.” Journal of Policy Analysis and Management 8(1): 53-71.
Burkhauser, R.V., R.H. Haveman, and B.L. Wolfe. 1993. “How People with Disabilities Fare WhenPublic Policies Change,” Journal of Policy Analysis and Management, 12(2) (Spring): 251-269.
Burkhauser, R.V., A. Houtenville, and D. Wittenburg. forthcoming. “ A User’s Guide to CurrentStatistics on the Employment of People with Disabilities.” In D. Stapleton and R. Burkhauser,editors, What is Causing the Decline in the Employment of People with Disabilities: A PolicyMystery.
Burkhauser, R.V. and T.M. Smeeding. 1981. “The Net Impact of the Social Security System on thePoor.” Public Policy, 29(2) (Spring): 159-178.
Burkhauser, R.V. and D.C. Wittenburg. 1996. “How Current Disability Transfer Policies DiscourageWork: Analysis from the 1990 SIPP,” Journal of Vocational Rehabilitation, 7(½) (August): 9-27.
Coe, R. 1985. “Nonparticipation in the SSI Program by the Eligible Elderly.” Southern EconomicJournal. 51(3): 891-897.
Congressional Research Service. 1999. Cash and Noncash Benefits for Persons with Limited Income:Eligibility Rules, Recipient and Expenditure Data, FY 1996-FY1998. Report Code: RL30401. The Library of Congress: Washington DC.
Daly, Mary C. 1994. “The Economic Well-Being of Men with Disabilities: A Dynamic Cross-NationalView.” Unpublished Ph.D. dissertation, Syracuse University.
Daly, M.C. and R.V. Burkhauser. 1998. How Family Economic Well-Being Changes Following the Onsetof a Disability: A Dynamic Analysis. Syracuse University Manuscript.

-59-
DeLeire, T. 2000. “The Wage and Employment Effects of the Americans with Disabilities Act.” Journalof Human Resources 35(4): 693-715.
Duggan, J. 1984. “The Labor-Force Participation of Older Workers.” Industrial and Labor RelationsReview. 37(3):416-430.
Edin, K. and L. Lein. 1997. Making Ends Meet: How Single Mothers Survive Welfare and Low-WageWork. New York: Russell Sage Foundation.
Friedman, M. 1962. Capitalism and Freedom. Chicago: University of Chicago Press.
Friedman, M. 1968. “The Case for a Negative Income Tax,” edited by M. Laird, Republican Papers,Paperback ed. Garden City, NY: Anchor.
Garrett, A.B. and S. Glied. 2000. “Does State AFDC Generosity Affect Child SSI Participation?”Journal of Policy Analysis and Management. 19(2): 275-295.
Giannarelli, L. and E. Stuerle. 1994. “It’s Not What You Make, It’s What You Keep: Tax Rates Facedby AFDC Recipients.” Paper presented at the Meetings of the Association for Public PolicyAnalysis and Management, Chicago, October, 1994.
Hoynes, H. and R. Moffitt. 1996. “The Effectiveness of Financial Work Incentives in Social SecurityDisability Insurance and Supplemental Security Income: Lessons from Other Transfer Programs.”In J. Mashaw et. al. Disability, Work and Cash Benefits. Kalamazoo, MI. W.E. Upjohn Institutefor Employment Research.
Hubbard, R. Skinner, J., and Zeldes, S. 1995. “Precautionary Saving and Social Insurance.” Journal ofPolitical Economy, 103(2): 360-99.
Jette, A. and E. Badley. 2002. “Conceptual Issues in the Measurement of Work Disability.” inWunderlich, G.S., D. Rice, and N.L. Amado (eds.) The Dynamics of Disability: Measuring andMonitoring Disability for Social Security Programs. National Academy Press: Washington DC:pp 183-210.
Johnson, W.G. editor. 1997. “The Americans With Disabilities Act: Social Contract or SpecialPrivelage?” The Annals of the American Academy of Political and Social Sciences, 549(January).
Kaye, S. Forthcoming. “Employment and the Changing Disability Environment.” In D. Stapleton and R.Burkhauser, editors, What is Causing the Decline in the Employment of People with Disabilities:A Policy Mystery.
Keane, M. And R. Moffitt. 1998. “A Structural Model of Multiple Welfare Program Participation andLabor Supply.” International Economic Review. 39(3), pp. 553-589.

-60-
Kornfeld, R. and K. Rupp. 2000. “The Net Effects of the Project NetWork Return-to-Work CaseManagement Experiment on Participant Earnings, Benefit Receipt, and Other Outcomes. SocialSecurity Bulletin, 63(1): 12-33.
Kubik, J. 1999. “Incentives for the identification and treatment of children with disabilities: thesupplemental security income program.” Journal of Public Economics. 73: 187-215.
Lando, M. E., R. Cutler, and E. Gamber. 1982. 1978 Survey of Disability and Work: Data Book. Washington, DC: U.S. Government Printing Office.
Laplante, M.P. 1991. “The Demographics of Disability,” in J. West, ed., The Americans with DisabilitiesAct: From Policy to Practice. Milbank Memorial Fund: New York.
Lewin-VHI. 1999. “Policy Evaluation of the Overall Effects of Welfare Reform on SSA Programs.” FinalReport and Appendix. Washington, DC: The Office of the Assistant Secretary for Planning andEvaluation, U.S. Department of Health and Human Services and the Social SecurityAdministration
Lewin-VHI. 1995a. “Labor Market Conditions, Socioeconomic Factors and the Growth of Applicationsand Awards for SSDI and SSI Disability Benefits.” Final Report. Washington, DC: The Officeof the Assistant Secretary for Planning and Evaluation, U.S. Department of Health and HumanServices and the Social Security Administration.
Lewin-VHI. 1995b. “Longer-Term Factors Affecting SSDI and SSI Disability Applications and Awards.” Final Report. Washington, DC: The Office of the Assistant Secretary for Planning andEvaluation, U.S. Department of Health and Human Services and the Social SecurityAdministration.
Library of Congress. 1998. “Vocational Factors in the Social Security Disability Decision Process: AReview of the Literature.” Report prepared under an Interagency Agreement for the SocialSecurity Administration Office of Disability Research. The Federal Research Division Library ofCongress.
Livermore, G., D.C. Stapleton, and A. Zeuschner. 1998. “Lessons from Case Studies of Recent ProgramGrowth in Five States.” In Kalman Rupp and David C. Stapleton (eds.), Growth in DisabilityBenefits: Explanations and Policy Implications. Kalamazoo, MI: W.E. Upjohn Institute forEmployment Research.
Mashaw, J.L. and V.P. Reno. 1996. Balancing Security and Opportunity: The Challenge of DisabilityIncome Policy. Report of the Disability Policy Panel. Washington, DC: National Academy ofSocial Insurance.
McGarry, K. 1996. Factors determining participation of the elderly in SSI. Journal of Human Resources31(12), 331-358.

-61-
McGarry, K. 2000. “Guaranteed Income: SSI and the Well-Being of the Elderly. NBER Working Paper7574.
Menefee, J., B. Edwards, S. Schieber. 1981. “Analysis of Nonparticipation in the SSI Program.” SocialSecurity Bulletin, 44(6): 3-21.
Moffitt, R. 1986. “Work Incentives in Transfer Programs (Revisited) A Study of the AFDC Program.” Research in Labor Economics 8(b): 389-439.
Muller, S., C. Scott, and B. Bye. 1996. Labor-force Participation and Earnings of SSI DisabilityRecipients: A Pooled Cross-Sectional Time Series Approach to the Behavior of Individuals. Social Security Bulletin 59(1), pp. 22-42.
Nagi, S. 1965. “Some Conceptual Issues in Disability and Rehabilitation.” Pp. 100-13. In M.B.Sussman (ed.), Sociology and Rehabilitation. Washington, DC: American SociologicalAssociation.
Nagi, S. 1969a. Disability and Rehabilitation: Legal, Clinical and Self-Concepts of Measurement . Columbus: Ohio State University Press.
Nagi, S. 1969b. “Congruency in Medical and Self-Assessment of Disability,” Industrial Medicine andSurgery, 38: 27-36.
Nagi, S. 1991. “Disability Concepts Revisited: Implications to Prevention.” Pp. 309-27. In A.M. Popeand A.R. Tarlove (eds.), Disability in America: Toward a National Agenda for Prevention . Washington, DC; National Academy Press.
National Academy of Social Insurance. 1995. “Restructuring the SSI Disability Program for Children andAdolescents.” Report from the Committee on Childhood Disability to the Disability Panel of theNASI. Washington, DC: NASI.
Neumark, D. and E. Powers. 1998. “The effect of means-tested income support for the elderly on pre-retirement saving: evidence from the SSI program in the US.” Journal of Public Economics. 68(2): 181-206.
Parrott, T., L. Kennedy, and C. Scott. 1998. Noncitizens and the SSI Program. Social Security Bulletin,61(4): 3-31.
Ponce, E. 1996. “State Optional Supplementation of SSI Payments, 1974-1995.” Social Security Bulletin,59(1): 52-66.
Powers, E. and D. Neumark. 2002. “The Supplemental Security Income Program and Incentives to TakeUp Social Security Early Retirement: Empirical Evidence from Matched SIPP and Social Security
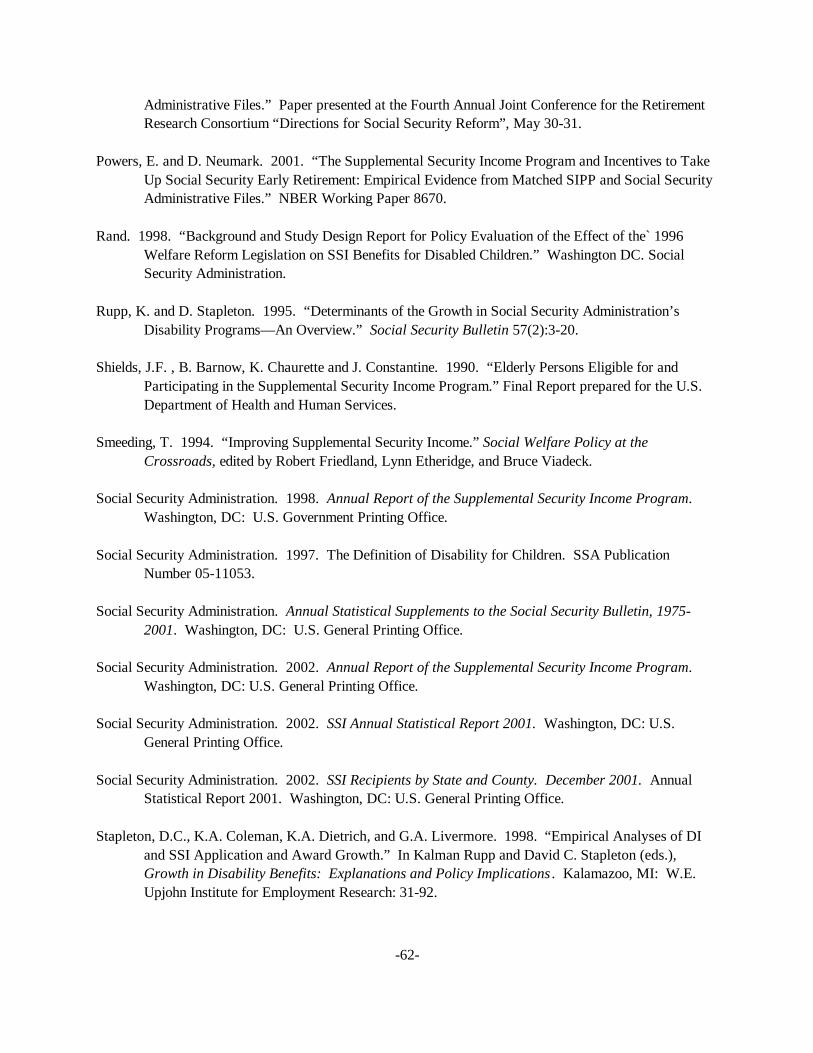
-62-
Administrative Files.” Paper presented at the Fourth Annual Joint Conference for the RetirementResearch Consortium “Directions for Social Security Reform”, May 30-31.
Powers, E. and D. Neumark. 2001. “The Supplemental Security Income Program and Incentives to TakeUp Social Security Early Retirement: Empirical Evidence from Matched SIPP and Social SecurityAdministrative Files.” NBER Working Paper 8670.
Rand. 1998. “Background and Study Design Report for Policy Evaluation of the Effect of the` 1996Welfare Reform Legislation on SSI Benefits for Disabled Children.” Washington DC. SocialSecurity Administration.
Rupp, K. and D. Stapleton. 1995. “Determinants of the Growth in Social Security Administration’sDisability Programs—An Overview.” Social Security Bulletin 57(2):3-20.
Shields, J.F. , B. Barnow, K. Chaurette and J. Constantine. 1990. “Elderly Persons Eligible for andParticipating in the Supplemental Security Income Program.” Final Report prepared for the U.S.Department of Health and Human Services.
Smeeding, T. 1994. “Improving Supplemental Security Income.” Social Welfare Policy at theCrossroads, edited by Robert Friedland, Lynn Etheridge, and Bruce Viadeck.
Social Security Administration. 1998. Annual Report of the Supplemental Security Income Program. Washington, DC: U.S. Government Printing Office.
Social Security Administration. 1997. The Definition of Disability for Children. SSA PublicationNumber 05-11053.
Social Security Administration. Annual Statistical Supplements to the Social Security Bulletin, 1975-2001. Washington, DC: U.S. General Printing Office.
Social Security Administration. 2002. Annual Report of the Supplemental Security Income Program. Washington, DC: U.S. General Printing Office.
Social Security Administration. 2002. SSI Annual Statistical Report 2001. Washington, DC: U.S.General Printing Office.
Social Security Administration. 2002. SSI Recipients by State and County. December 2001. AnnualStatistical Report 2001. Washington, DC: U.S. General Printing Office.
Stapleton, D.C., K.A. Coleman, K.A. Dietrich, and G.A. Livermore. 1998. “Empirical Analyses of DIand SSI Application and Award Growth.” In Kalman Rupp and David C. Stapleton (eds.),Growth in Disability Benefits: Explanations and Policy Implications . Kalamazoo, MI: W.E.Upjohn Institute for Employment Research: 31-92.

-63-
Stapleton, D., D. Wittenburg, M. Fishman, and G. Livermore. 2002. “Transitions from AFDC to SSIBefore Welfare Reform. Social Security Bulletin, 64(1):84-114.
Stigler, G. 1946. “The Economics of Minimum Wage Legislation,” American Economic Review36(June): 358-65.
Thornton, Craig V. and Paul T. Decker. 1989. “The Transitional Employment Training Demonstration:Analysis of Program Impacts.” Princeton, NJ: Mathematica Policy Research. Project Report,July.
Tobin, J. 1968. “Raising the Incomes of the Poor,” in K. Gordon, ed., Agenda for the Nation. Washington: Brookings Institution.
U.S. General Accounting Office, 1994. Rapid Rise in Children on SSI Disability Rolls Follows NewRegulations. GAO/HEHS-94-225.
U.S. General Accounting Office. 1995. New Functional Assessments for Children Raise EligibilityQuestions. GAO/HEHS-95-66.
U.S. General Accounting Office. 1998. SSA Needs a Uniform Standard for Assessing ChildhoodDisability. GAO/HEHS-98-123.
U.S. House of Representatives, Committee on Ways and Means. 1971. Social Security Amendments of1971 (House Report No. 92-231). Washington, DC: U.S. Government Printing Office.
U.S. House of Representatives, Committee on Ways and Means. 1998. Background Material on Data andPrograms within the Jurisdiction of the Committee on Ways and Means. Washington, DC: U.S.Government Printing Office.
Verbrugge, L.M. 1990. “Disability.” Epidemiology of Rheumatic Disease, 16:741-61.
Warlick, J. L. 1982. “Participation of the Aged in SSI.” Journal of Human Resources, 17(2): 236-260.
Weathers, R. 1999. “Essays in Applied Microeconomics.” Unpublished Ph.D. Dissertation. SyracuseUniversity, December.
Wunderlich, G.S. , D. Rice, and N. L. Amodo (eds) 2002. The Dynamics of Disability: Measuring andMonitoring Disability for Social Security Programs. National Academy Press: Washington, DC.
Yelowitz, A. 1998. “Why did the SSI-disabled program grow so much?” Disentangling the effect ofMedicaid.” Journal of Health Economics, 17(3): 321-49.

Figure 1. SSA Initial Disability DeterminationsSequential Decision Making Process and Outcomes of Decisions on Initial SSDI Applications, 2000
(1) Is the applicant engaging in substantial gainful activity?(earning more than $500 per month)
No Yes
(2) Does the applicant have a severe impairment (combinations ofimpairments) that limits basic work activities?
Is the impairment expected to last 12 months or result in death?
(3a) Does the impairment(s) meet the medical listings?
(3a) Does the impairment(s) equal the medical listings?
(Assess residual functional capacity)(4) Does the impairment(s) prevent doing past work?
(Consider applicant’s age, education and work experience)(5) Does the impairment(s) prevent any other work that exists in the national economy?
No
No
No
No
No
No
Yes
Yes
Yes
Yes
Yes
Yes
a This response includes 5 percent of claims that were denied because the applicant failed to cooperate in obtaining evidence needed for the claim. The other 8 percent were denied for “impairment not severe.”
Source: Authors calculations using SSA Office of Disability data, SSA-831 Disability Decision file.
0%
13%a
7%
19%
3%
20%
Allow Claim16%
Deny Claim22%
Allowances as part ofinitial applications
38%
Denials as part of initial applications
62%

Figure 2. Sequential Initial Disability Determination Process For Children
Adults Children: Pre-Zebley Children: Post-Zebley Children: Post 1996 Welfare Reform
1. Are you working?
Y = Deny
1. Are you working?
Y = Deny
1. Are you working?
Y = Deny
1. Are you working?
Y = Deny
2. Do you have a severe impairment?
N = Deny
2. Do you have a severe impairment?b
N = Deny
2. Do you have a severe impairment?d
N = Deny
Compare impairment tomedical listings
Compare impairment tomedical listings
Compare impairment tomedical listings
Compare impairment tomedical listings
Mental Other Mentalc Other Mentalc Other3a. Meet both diagnostic(A) and functional (B)criteria?
Y = Allow
3a. Meet criteria inmedical listings?
Y = Allow
3a. Meet criteria in medicallistings?
Y = Allow
3a. Meet bothdiagnostic (A) andfunctional (B)criteria?
Y = Allow
3a. Medicallymeet medicallistings?
Y = Allow
3a. Meet bothdiagnostic (A)and functional (B)criteria?
Y = Allow
3a. Medically meetmedical listings?
Y = Allow
3b. Equal? Meet (B) andsome of (A)?
Y = Allow
3b. Medically equalmedical listings?
Y = Allow
3b. Medically equal medicallistings? a
Y = Allow; N = Deny
3b. Equal? Meet(B) and some of(A)?
Y = Allow
3b. Medicallyequal medicallistings?
Y = Allow
3b. Equal? Meet(B) and some of(A)?
Y = Allow
3b. Medically equalmedical listings?
Y = Allow
3c. Functionally equal medical listings?
Y = Allow
3c. Functionally equal medical listings?
Y = AllowAssess residual functional capacity (RFC)
4. Can you do past work?
Y = Deny
Consider age, education and work experience Do individualized functional assessment5. Can you do any other work?
N = Allow; Y = Deny
4. Given IFA, is impairment(s) ofcomparable severity to that which woulddisable an adult?
Y = Allow; N = Deny
a Before 1990, SSA policy in SS Ruling 83-19 explicitly prohibited using an overall functional assessment to find that a claimant’s impairment equalled the medical listings. Aclaimant with multiple impairments could meet or equal the listings only if at least one impairment, alone, met or medically equalled a specific listing.b A medically determinable physical or mental impairment of comparable severity to one meeting adult definition.c The childhood mental disorders listings were modified in 1990 to include functional criteria similar to those put in the adult listings in 1985.d A medically determinable physical or mental impairment which results in marked and severe functional limitation.
Source: Created by authors using disability determination guidelines in The Annual Statistical Supplement, SSA, various years.

Figure 3. SSI Program Growth, 1974-2001
1
2
3
4
5
6
7
1974 1976 1978 1980 1982 1984 1986 1988 1990 1992 1994 1996 1998 2000
10
15
20
25
30
35
40
Recipients
Recipients (in millions)Expenditures
(Billions 2001 $)a
Expenditures
a Annual expenditures estimated from monthly amount from December of each year
Source: SSA: SSI Annual Statistical Report 2001 and SSA Annual Statistical Supplement SSA 2000
2001

Figure 4. SSI Caseloads by Age Group, 1974-2001
0
1
2
3
4
5
1974 1976 1978 1980 1982 1984 1986 1988 1990 1992 1994 1996 1998 2000
Adults 18-64
Adults 65 and older
Children under 18
Source: Annual Statistical Supplement, SSA various years.
Number (in millions)
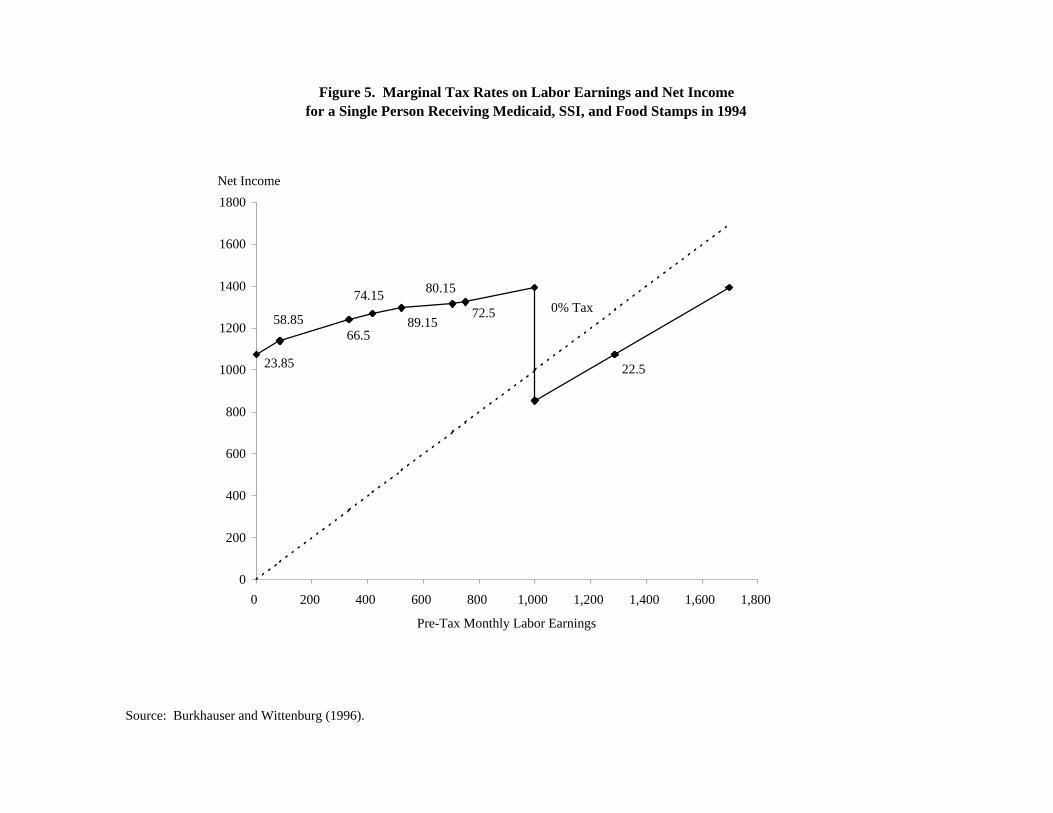
Figure 5. Marginal Tax Rates on Labor Earnings and Net Income for a Single Person Receiving Medicaid, SSI, and Food Stamps in 1994
72.5
80.15
89.15
74.15
66.558.85
23.85 22.5
0% Tax
0
200
400
600
800
1000
1200
1400
1600
1800
0 200 400 600 800 1,000 1,200 1,400 1,600 1,800
Pre-Tax Monthly Labor Earnings
Net Income
Source: Burkhauser and Wittenburg (1996).

Figure 6. Budget Constraints with Different Marginal Tax Rates
0
100
200
300
400
500
600
700
800
900
1000
1100
1200
1300
1400
1500
Hours of Work
Take Home Income
t=1
t=0.5
0
Source: Hoynes and Moffitt (1996).
A
B
C
D
E 3
1
2
(BC: Marginal Tax Rate=100 percent, BD: Marginal Tax Rate=50 percent)

Figure 7. Disability Benefit Rolls and Employment Rates among Working-Age Men and Women with Disabilities
0
1
2
3
4
5
6
1980 1981 1982 1983 1984 1985 1986 1987 1988 1989 1990 1991 1992 1993 1994 1995 1996 1997 1998 1999
Recipients (in millions)
0
5
10
15
20
25
30
35
40
45
50
Employment Rate (%)
DI Beneficiaries
SSI Beneficiaries
Employment Rate-Men
Employment Rate Women
Expansion of Disability Eligibility
LiberalizationAmericans with Disabilities Act
left scale [
[right scale

Figure 8. Applications and Awards Among Population 18-64(per 1000 in population)
0
1
2
3
4
5
6
7
8
9
10
1974 1976 1978 1980 1982 1984 1986 1988 1990 1992 1994 1996 1998 2000
per 1000 population
Source: Annual Statistical Supplement, SSA various years.
Applications
Awards
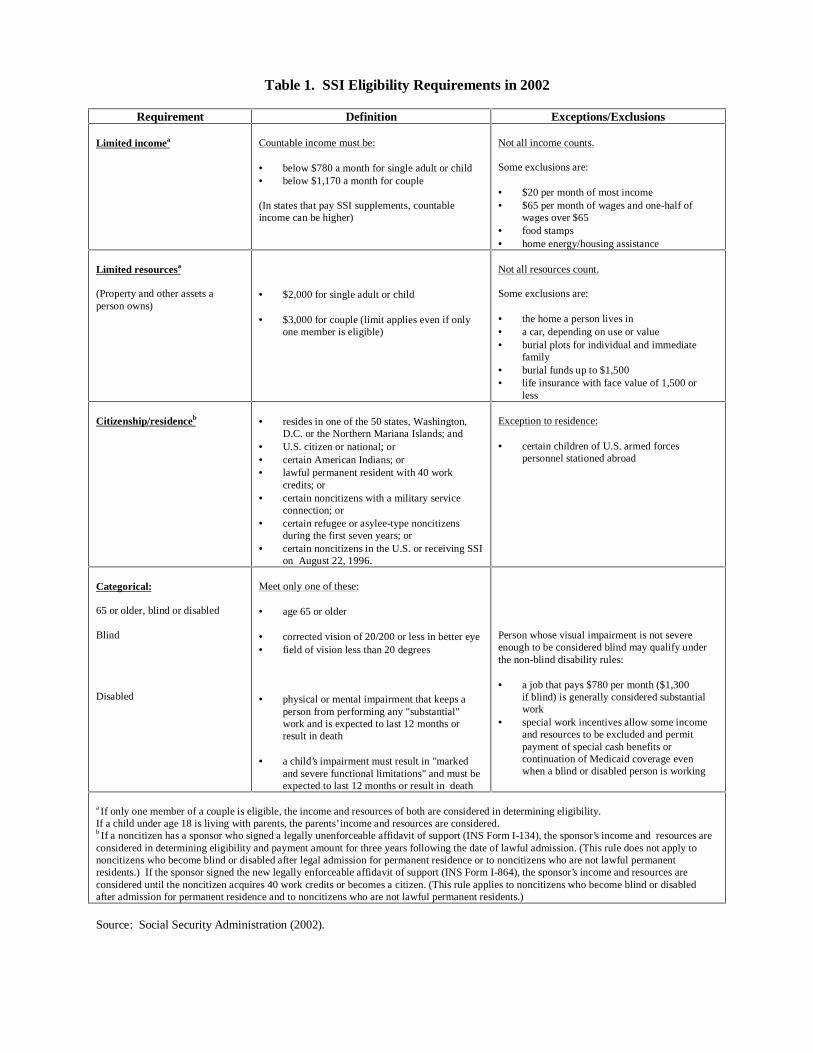
Table 1. SSI Eligibility Requirements in 2002
Requirement Definition Exceptions/Exclusions
Limited incomea Countable income must be:
• below $780 a month for single adult or child• below $1,170 a month for couple
(In states that pay SSI supplements, countableincome can be higher)
Not all income counts.
Some exclusions are:
• $20 per month of most income• $65 per month of wages and one-half of
wages over $65• food stamps• home energy/housing assistance
Limited resourcesa
(Property and other assets aperson owns)
• $2,000 for single adult or child
• $3,000 for couple (limit applies even if onlyone member is eligible)
Not all resources count.
Some exclusions are:
• the home a person lives in• a car, depending on use or value• burial plots for individual and immediate
family• burial funds up to $1,500• life insurance with face value of 1,500 or
less
Citizenship/residenceb • resides in one of the 50 states, Washington,D.C. or the Northern Mariana Islands; and
• U.S. citizen or national; or• certain American Indians; or• lawful permanent resident with 40 work
credits; or• certain noncitizens with a military service
connection; or• certain refugee or asylee-type noncitizens
during the first seven years; or• certain noncitizens in the U.S. or receiving SSI
on August 22, 1996.
Exception to residence:
• certain children of U.S. armed forcespersonnel stationed abroad
Categorical:
65 or older, blind or disabled
Blind
Disabled
Meet only one of these:
• age 65 or older
• corrected vision of 20/200 or less in better eye• field of vision less than 20 degrees
• physical or mental impairment that keeps aperson from performing any "substantial"work and is expected to last 12 months orresult in death
• a child’s impairment must result in "markedand severe functional limitations" and must beexpected to last 12 months or result in death
Person whose visual impairment is not severeenough to be considered blind may qualify underthe non-blind disability rules:
• a job that pays $780 per month ($1,300if blind) is generally considered substantialwork
• special work incentives allow some incomeand resources to be excluded and permitpayment of special cash benefits orcontinuation of Medicaid coverage evenwhen a blind or disabled person is working
a If only one member of a couple is eligible, the income and resources of both are considered in determining eligibility.If a child under age 18 is living with parents, the parents’ income and resources are considered.b If a noncitizen has a sponsor who signed a legally unenforceable affidavit of support (INS Form I-134), the sponsor’s income and resources areconsidered in determining eligibility and payment amount for three years following the date of lawful admission. (This rule does not apply tononcitizens who become blind or disabled after legal admission for permanent residence or to noncitizens who are not lawful permanentresidents.) If the sponsor signed the new legally enforceable affidavit of support (INS Form I-864), the sponsor’s income and resources areconsidered until the noncitizen acquires 40 work credits or becomes a citizen. (This rule applies to noncitizens who become blind or disabledafter admission for permanent residence and to noncitizens who are not lawful permanent residents.)
Source: Social Security Administration (2002).
Table 2. Mean Disability Allowance Rates by State, 1974-1993
State Allowance Ratesa
Current State of Residence Mean Standard Deviation
Alabama 32 4.8Arizona 41 6.0Arkansas 32 5.6California 37 7.5Colorado 40 5.8Connecticut 45 8.9Delaware 48 4.7District of Columbia 39 8.0Florida 37 6.4Georgia 33 7.2Illinois 37 5.8Indiana 40 7.3Iowa 44 8.7Kansas 41 5.2Kentucky 33 3.8Louisiana 28 8.4Maine 44 6.1Maryland 37 5.1Massachusetts 44 7.8Michigan 37 6.8Minnesota 45 7.5Mississippi 31 5.9Missouri 38 6.8Montana 37 6.5Nebraska 43 6.1Nevada 39 6.9New Hampshire 42 5.5New Jersey 48 9.4New Mexico 28 5.3New York 41 9.2North Carolina 40 6.1North Dakota 42 5.9Ohio 42 7.8Oklahoma 33 6.7Oregon 37 6.7Pennsylvania 39 7.4Rhode Island 48 4.7South Carolina 37 4.7South Dakota 46 4.5Tennessee 35 6.4Texas 34 6.2Utah 45 5.9Vermont 46 5.3Virginia 36 3.4Washington 40 8.4West Virginia 30 8.3Wisconsin 46 6.5Wyoming 39 5.1Total 39 8.2
a The mean allowance rate for a state is defined as the mean of the state’s yearly initial acceptance to initialapplication ratio for the years 1974-1993. Allowance rates are based on SSDI applications and acceptances.
Source: Burkhauser, Butler, and Weathers (1999).

Table 3. SSI State Supplementation and Coordination with Other Programs
U.S. and District ofColumbia
Optional State program—Administered by: Method of mandatory passalong Medical eligibility determination— Interim
assistancereimbursement agreement
with SSAState
Federal(SSA)
Federal& State
“Paymentlevels”
“Totalexpenditures”
Based on:SSA
determineseligibilityFederal
criteriaState
criteria
Alabama2 * * * *Alaska * * * *Arizona * * * * *Arkansas3 * * *California * * * * *Colorado * * * * *Connecticut2 * * * *Delaware * * * *DC * * * * *Florida2 * * * * *Georgia3 * * * *Hawaii * * * *Idaho * * *Illinois * * * *Indiana * * * *Iowa * * * * *Kansas3 * * *Kentucky2 * * * * *Louisiana4 * * * *Maine * * * * *Maryland4 * * * * *Massachusetts * * * * *Michigan * * * * *5
Minnesota2 * * * *Mississippi3 * * *Missouri * * * *Montana * * * * *Nebraska * * * *Nevada2 * * * *
New Hampshire * * * *5
New Jersey * * * * *New Mexico * * * * *5
New York * * * * *North Carolina * * * * *North Dakota2 * * *Ohio4 * * * *Oklahoma * * *Oregon * * * *Pennsylvania * * * * *
Rhode Island2 * * * * *5
South Carolina2 * * * *
South Dakota4 * * * *Tennessee3 * * * *
Texas6 * * * *Utah2 * * * *Vermont2 * * * * *Virginia * * * *Washington * * * * *West Virginia6 * *Wisconsin * * * * *Wyoming * * * *
Total States 29 11 5 40 10 40 11 33 381See body of text for description of the various forms of State supplementation.2State no longer has any recipients receiving mandatory minimum State supplementation.3Mandatory minimum State supplementation program is Federally-administered. No optional program.4Mandatory minimum State supplementation program is Federally administered.5State provides assistance only in initial application cases. No assistance provided during periods that SSI benefits are suspended or terminated.6State does not have a mandatory minimum State supplementation program.
Source: 2002 SSI Annual Report, SSA

Table 4. Trends in Key Characteristics of SSI Beneficiaries, 1975-2001
1975 1984 1987 1990 1992 1994 1996 2001
All SSI Recipients
Age
Less than 18 2.5 5.3 5.7 6.4 10.0 13.4 14.4 13.2
18 to 64 39.4 44.2 48.3 50.9 52.3 53.0 54.0 57.0
65 and above 58.1 50.6 46.0 42.7 37.7 33.7 31.6 29.8
Gender
Male 35.5 34.8 36.1 37.2 39.0 41.1 41.5 41.7
Female 64.2 65.1 63.9 62.8 61.0 58.9 58.5 58.2
Citizenship
Noncitizens na 4.5 6.4 9.0 10.8 11.7 11.0 10.4
Disabled SSI Recipients(Under age 65)
Qualifying Diagnosis
Physical na na 49.0 47.0 44.7 42.2 41.3 39.0
Mental Retardation na na 26.9 26.6 27.1 27.6 27.5 25.0
Psychiatric Disorder na na 24.1 26.4 28.2 30.2 31.2 36.0
na= information not available
Source: SSI Annual Statistical Report, 2001.

Table 5. SSI Participation Rates among Poor, 1974-1998by Age Group
Take-Up Ratesa Disability Prevalenceb
65 + 18-64 < 18 18-64
1974 78.5 14.8 0.7 -
1975 75.6 14.8 1.0 -
1976 72.3 15.0 1.2 -
1977 74.1 15.3 1.4 -
1978 71.3 15.4 1.7 -
1979 61.0 14.4 1.7 -
1980 57.4 12.5 1.6 20.3
1981 55.1 11.0 1.6 19.2
1982 53.6 9.7 1.4 17.4
1983 55.3 9.6 1.4 17.5
1984 61.2 10.5 1.6 19.3
1985 58.8 11.3 1.7 19.0
1986 58.0 12.6 1.9 19.2
1987 56.6 13.4 2.0 18.8
1988 57.6 13.9 2.0 18.7
1989 60.3 14.8 2.1 19.6
1990 56.3 14.9 2.3 19.7
1991 55.0 15.0 2.8 18.9
1992 53.5 15.5 3.6 19.3
1993 56.3 15.9 4.6 20.4
1994 57.9 17.5 5.5 21.4
1995 63.7 18.9 6.3 19.9
1996 61.0 19.1 6.6 20.7
1997 60.8 19.7 6.2 21.3
1998 60.0 20.7 6.6 21.3
a Take-up rates are calculated as the number of SSI recipients divided by the number in poverty in each age group. Data are fromthe Social Security Administration and the Census Bureau. b Disability prevalence is calculated as the percentage of the poverty population 18-64 years of age answering “yes” to theCurrent Population Survey question: �(Do you/Does anyone in this household) have a health problem or disability which prevent(you/them) from working or which limits the kind or amount of work (you/they) can do?� This question was not asked ofchildren.
Source: Authors’ calculations using data from the Current Population Survey.
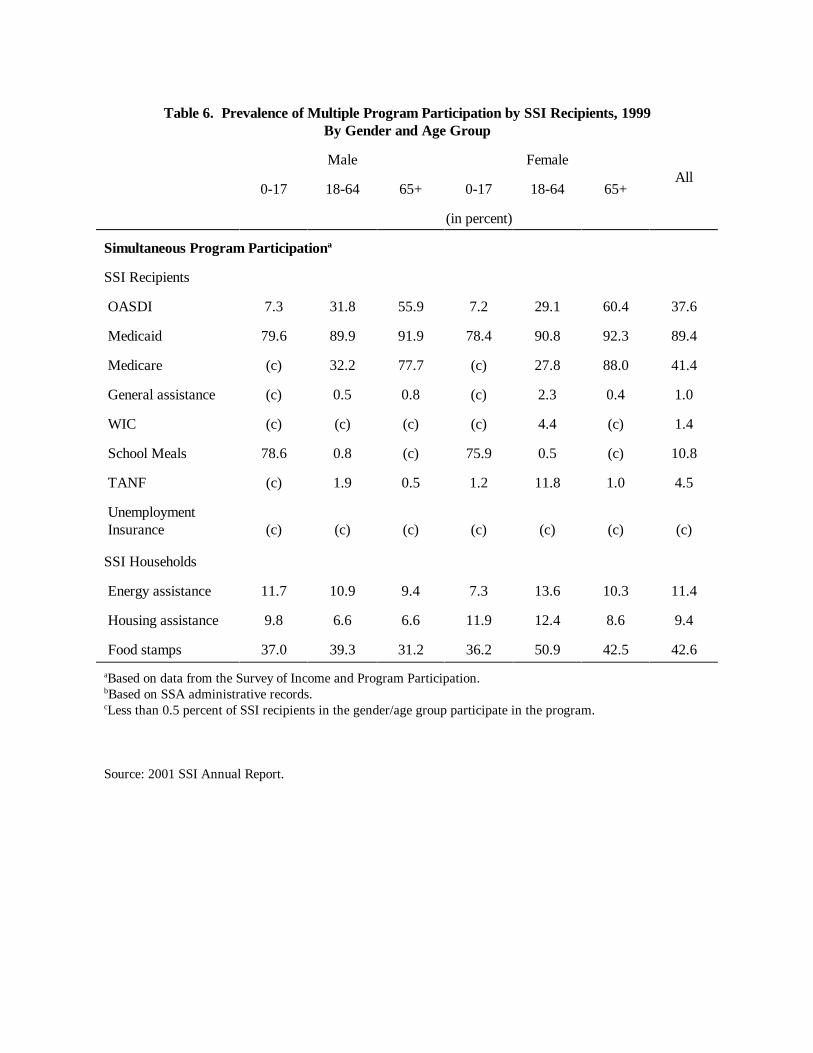
Table 6. Prevalence of Multiple Program Participation by SSI Recipients, 1999By Gender and Age Group
Male FemaleAll
0-17 18-64 65+ 0-17 18-64 65+
(in percent)
Simultaneous Program Participationa
SSI Recipients
OASDI 7.3 31.8 55.9 7.2 29.1 60.4 37.6
Medicaid 79.6 89.9 91.9 78.4 90.8 92.3 89.4
Medicare (c) 32.2 77.7 (c) 27.8 88.0 41.4
General assistance (c) 0.5 0.8 (c) 2.3 0.4 1.0
WIC (c) (c) (c) (c) 4.4 (c) 1.4
School Meals 78.6 0.8 (c) 75.9 0.5 (c) 10.8
TANF (c) 1.9 0.5 1.2 11.8 1.0 4.5
Unemployment Insurance (c) (c) (c) (c) (c) (c) (c)
SSI Households
Energy assistance 11.7 10.9 9.4 7.3 13.6 10.3 11.4
Housing assistance 9.8 6.6 6.6 11.9 12.4 8.6 9.4
Food stamps 37.0 39.3 31.2 36.2 50.9 42.5 42.6
aBased on data from the Survey of Income and Program Participation.bBased on SSA administrative records. cLess than 0.5 percent of SSI recipients in the gender/age group participate in the program.
Source: 2001 SSI Annual Report.

Table 7. Average Monthly Labor Earnings and Employment Rates and How They Changed before and after Application for SSI and SSDIa
Before Applicationb Application c After Applicationd
Population
MonthlyLabor
Earnings eEmployment
Ratef
MonthlyLabor
Earnings eEmployment
Ratef
Percent ofBefore
EarningsgMonthly Labor
Earnings eEmployment
Ratef
Percent ofBefore
Earningsg
Supplemental SecurityIncomeAwarded SSI 144 25 17 6 12 63 12 44Denied SSI 260 28 89 15 34 105 19 40Social SecurityDisability InsuranceAwarded SSDI 1,575 87 248 16 16 87 11 6Denied SSDI 1,248 81 154 17 12 434 31 35
aJanuary 1990 dollars.b36 to 38 months prior to application.c1 to 3 months after application.d37 to 39 months after application.eAverage includes zeros.fPositive labor earnings in at least one month over the period.gAverage monthly labor earnings during application period divided by average monthly labor earnings before application.hAverage monthly labor earnings after application divided by average monthly labor earnings before application.
Source: Bound, Burkhauser, and Nichols (forthcoming): 1990-1993 SIPP data merged to Social Security Administration disability determination records.

Table 8. SSI Allowance Rates and Annual Changes in Beneficiaries Adults 18-641974-2001
Allowance Rate(percentage)a
Number of Beneficiaries(thousands)
Yearly Percent Change in Beneficiaries
1974 47.8 1,503
1975 52.6 1,699 13.0
1976 47.1 1,714 0.9
1977 42.2 1,737 1.3
1978 36.4 1,747 0.6
1979 31.5 1,727 -1.1
1980 29.5 1,731 0.2
1981 29.5 1,703 -1.6
1982 26.6 1,655 -2.8
1983 32.2 1,700 2.7
1984 38.2 1,780 4.7
1985 32.0 1,879 5.6
1986 36.8 2,010 6.7
1987 36.2 2,119 5.4
1988 37.1 2,203 4.0
1989 39.5 2,302 4.5
1990 40.5 2,450 6.4
1991 39.4 2,642 7.8
1992 44.5 2,910 10.1
1993 41.1 3,148 8.2
1994 39.4 3,335 5.9
1995 42.5 3,482 4.4
1996 41.6 3,569 2.5
1997 40.8 3,562 -0.2
1998 42.9 3,646 2.4
1999 43.0 3,690 1.2
2000 39.4 3,744 1.5
2001 38.0 3,811 1.8
aAllowance rates equal initial awards divided by initial applications.
Source: Authors’ calculations from SSA data, SSI Annual Report, 2001.

Table 9. AFDC and SSI Benefit Levels for Maryland and Connecticut, 1990 and 1994a
State
AFDC benefitfor family
of three(1)
AFDC benefitfor family
of two(2)
Difference[(1)-(2)]
(3)
FederalSSI benefit
Net SSI benefit[(4)-(3)]
(5)
Maryland
1990 $4872 $3804 $1068 $4632 $3564
1994 $4392 $3432 $960 $5352 $4392
Connecticut
1990 $6660 $5424 $1236 $4632 $3396
1994 $8160 $6588 $1572 $5352 $3780
a All benefit levels are state maximums, assuming the family earns no countable income. Both Maryland andConnecticut did not provide SSI state supplements to children during this time period.
Source: Kubik (1999).