the supply and demand for licensed practical nurses and ... · registered nurses and licensed...
TRANSCRIPT

The Supply and Demand for
Registered Nurses and Licensed Practical Nurses
in Nebraska
February 6, 2006
David I. Rosenbaum, Ph.D.
4103 South Gate Blvd
Lincoln NE 68506
402-489-1218

David I. Rosenbaum, Ph.D. 402-489-1218
Economic Consulting [email protected] i
Executive Summary
Recent trends suggest that the expected demand for registered nurses (RN) and licensed
practical nurses (LPN) may exceed the supply in coming years. This report examines the
potential divergence in Nebraska.
National Center for Health Workforce Analysis (NCHWA) models are used to project
demand and supply for full-time equivalent registered nurses (FTE RN) in Nebraska from
2006 through 2020. Results show that demand will grow from a current need for about
16,000 full-time equivalent nurses to more than 20,000 over the next 15 years. However,
supply is projected to increase from about 15,000 registered nurses in 2006 to only
16,500 by 2020. Hence, a significant shortage will develop.
Analysis shows that several policies may help to reduce the RN shortage. Policies to
stem net out-migration, delay retirements, reduce career changes, promote full time
employment, and attract new RNs will all increase the supply of nurses.
The most effective long-term policies are those that continually attract people into
nursing. The advantage of such policies is that they add new nurses year after year.
Thus, while the increase in any year may be modest, the cumulative effect can be
significant. Reducing net annual out-migration and attracting more young people to
nursing as a profession will have these cumulative effects.
Policies that just affect participation among the existing pool of nurses will have more
limited long-term impacts. However, they will increase the supply of nurses in the short
term. Delaying retirements, reducing career changes and increasing the percentage of
nurses working full time as opposed to part time are examples of such policies.
The analysis also shows that no individual policy is likely to eradicate the nursing
shortage by itself. Rather, eliminating the nursing shortage will most likely require
participants developing a variety of policies to stimulate nursing supply. The most
effective solution may be one that stimulates supply among existing nurses to stem the
current shortage and simultaneously encourages more people into nursing to stem future
shortages.
The NCHWA model is used to project LPN demand as well. Unfortunately, there is no
model to project LPN supply. Alternative methods are used to estimate the supply of
LPNs between 2006 and 2020. As might be expected, there will be a shortage of LPNs
each year, growing from eight percent of demand in 2006 to almost 23 percent of demand
by 2020. It can reasonably be assumed that the same policies that will eliminate RN
shortages may reduce or eliminate the expected LPN shortages as well.
David I. Rosenbaum, Ph.D. 402-489-1218
Economic Consulting [email protected] ii
Table of Contents
Page
Executive Summary ...................................................................................... i
Table of Contents ......................................................................................... ii
List of Tables ............................................................................................... iv
I. Introduction...................................................................................................1
II. The Nursing Demand Model........................................................................1
Number of People Requiring Care ..........................................................1
FTE RNs per Capita ................................................................................3
FTE Nursing Demand .............................................................................5
Making the Model Nebraska Specific .....................................................5
Population........................................................................................5
RN Usage .........................................................................................5
Results.......................................................................................................7
III. The Nursing Supply Model ..........................................................................7
RN Population..........................................................................................8
Starting Population Pool .................................................................8
Migration .........................................................................................8
Education .........................................................................................8
Attrition ............................................................................................8
Foreign Immigration........................................................................8
New Graduates.................................................................................8
RN Participation ......................................................................................9
RN FTE Equivalents................................................................................9
FTE Nursing Supply ................................................................................9
Making the Model Nebraska Specific .....................................................9
Initial Number of Nurses..................................................................9
Initial Number of Graduates ..........................................................10
Results.....................................................................................................11
IV. Comparing RN Supply and Demand ........................................................12
V. Policies to Impact Nursing Shortages .......................................................12
Factors Influencing Demand ................................................................12
Factors Influencing Supply ...................................................................12
Migration .......................................................................................12
Education .......................................................................................13
Attrition ..........................................................................................14
New Graduates...............................................................................17
FTE Rate ........................................................................................18
Cumulative Policies .......................................................................19

David I. Rosenbaum, Ph.D. 402-489-1218
Economic Consulting [email protected] iii
VI. The LPN Demand Model ...........................................................................19
Number of People Requiring Care ........................................................19
FTE LPNs per Capita ............................................................................20
Results.....................................................................................................22
VII. LPN Supply..................................................................................................23
VIII. Comparing LPN Supply and Demand ......................................................25
IX. Recommendations .......................................................................................26

David I. Rosenbaum, Ph.D. 402-489-1218
Economic Consulting [email protected] iv
List of Tables
Table Page
1 Factors Affecting Numbers of Patients in Health Care Settings.....................2
2 RN Staffing Intensity by Health Care Setting.................................................3
3 Factors Affecting RN Staffing Intensity in Health Care Settings...................4
4 Adjusting the NDM to Reflect Nebraska FTE RNs in 2002 ..........................6
5 NDM Estimated Nebraska Demand for FTE RNs..........................................7
6 Number of Nurse Graduates from Nebraska Colleges and Universities ......10
7 NSM Estimated Nebraska Supply of FTE RNs............................................11
8 Estimated Surplus/Shortage of FTE RNs .....................................................12
9 Decreasing Emigration Rate and Increasing Immigration Rate –
Estimated Shortage of FTE RNs................................................................13
10 Attrition Rates for RNs by Age ....................................................................14
11 Smoothing Attrition Rates Among Nurses Ages 62-64 – Estimated
Shortage of FTE RNs.................................................................................15
12 Reducing Attrition Rates Among Nurses Ages 62-65 – Estimated
Shortages of FTE RNs ...............................................................................16
13 Increasing Nursing School Graduates – Estimated Shortages of
FTE RNs ....................................................................................................17
14 Increasing FTE Rates – Estimated Shortages of FTE RNs...........................18
15 Cumulative Policies – Estimated Shortages of FTE RNs.............................19
16 LPN Staffing Intensity by Health Care Setting.............................................20
17 Factors Affecting LPN Staffing Intensity in Health Care Settings...............21
18 Estimated Nebraska Demand for FTE LPNs ................................................22
19 LPN FTE Supply in Year 2002.....................................................................23
20 Estimated Nebraska Supply of FTE LPNs 2006 – 2020...............................24
21 Estimated Surplus/Shortage of FTE LPNs ...................................................25

The Supply and Demand for Registered Nurses and Licensed Practical Nurses in Nebraska
David I. Rosenbaum, Ph.D. 402-489-1218
Economic Consulting [email protected] 1
I Introduction
The analysis begins by examining nursing demand. Demand is modeled using the
National Center for Health Workforce Analysis’s Nursing Demand Model (NDM).
Demand is tied to population projections and the health care needs of individuals in
various age groups. The underlying data used in the NDM are adjusted to make them
more reflective of Nebraska’s experience. The model suggests that demand will grow
from a need for 16,000 full-time equivalent registered nurses (FTE RNs) in the year 2006
to over 20,000 by the year 2020.
Section three examines nursing supply using the National Center for Health Workforce
Analysis’s Nursing Supply Model (NSM). Supply is modeled as a function of the
changing population of nurses, their participation in the labor market, and their decisions
whether to work full or part time. The underlying data used in the NSM are also adjusted
to make them more reflective of Nebraska’s experience. The model suggests that the
supply of FTE RNs will grow from 15,300 in the year 2006 to 16,500 by the year 2020.
In section four, results from the two models are combined to look at projected nursing
shortages. The models suggest that by the year 2020, Nebraska will have a shortage of
about 3,800 FTE RNs, or about 20 percent of demand. Section five describes policies
that can be used to reduce the shortage. Policies are broken into two types: those that
increase the size of the labor pool by adding more nurses, and those that increase
participation among the existing pool of nurses.
Section six uses the NDM to project licensed practical nurses (LPN) demand between the
years 2006 and 2020. Demand grows by almost 30 percent over that period from 6,000
to 7,680 FTE LPNs. LPN supply is estimated in section seven. Nebraska survey results
are used to estimate the supply in 2002. Then, RN supply growth rates are used to
predict LPN supply between 2006 and 2020. Section eight shows that, as might be
expected, there is a shortage of LPNs each year, growing from eight percent of demand in
2006 to almost 23 percent of demand by 2020. While the data do not allow for scenario
analysis, it can reasonably be assumed that the same policies that will eliminate RN
shortages may reduce or eliminate the expected LPN shortages as well. The report ends
with a set of recommendations to address shortages in both labor markets.
II The Nursing Demand Model
The Nursing Demand Model (NDM) uses a three-step process to predict annual demand
for FTE nurses through the year 2020. In the first step it estimates the number of people
requiring care in twelve different health care settings. In the second step, the model
estimates the FTE RNs required per capita in each setting. The last step multiplies these
two figures to project FTE RN demand.
Number of People Requiring Care
U.S. Census Bureau population projections form the basis for estimating the number of
people requiring care in each health care setting. These projections are by age group, sex
and rural/urban setting. The NDM then converts population projections into numbers of

The Supply and Demand for Registered Nurses and Licensed Practical Nurses in Nebraska
David I. Rosenbaum, Ph.D. 402-489-1218
Economic Consulting [email protected] 2
people needing care in each of the twelve health care settings. Historic health care
experience is used to determine the usage of health care facilities by people of different
ages, sexes and urban/rural settings. These figures are then adjusted for trends in the
health care market environment, economic conditions, demographics and geographic
location.
The factors affecting numbers of patients in each health care setting are shown in Table 1.
A negative sign (--) indicates that all else equal, an increase in that factor will decrease
the number of people using that health care environment. For example, an increase in the
percentage of the population in HMOs will decrease the number of people making in-
patient visits to hospitals. A positive sign (+) indicates that an increase in that factor will
increase the number of people using that health care environment, all else equal. For
example, an increase in the percentage of hospital surgeries that are performed as
outpatient surgeries will increase the number of people making out-patient visits to
hospitals.
Table 1
Factors Affecting Numbers of Patients in Health Care Settings Short-Term Hospital
In-
Patient
Out-
Patient
ER
Long-
Term
Hospital
Nursing
Facility
Home
Health
Health Care Environment
HMO Usage (--) (--) (--) (+)
Percent Hospital
Surgeries as Outpatient
Surgeries
(--) (+) (+)
Economic Conditions
Population Uninsured (--) (--)
Population Medicaid
Eligible (+) (+) (+) (+) (+)
Per Capita Income (+)
Demographics
Population Non-White (+) (+)
Population Hispanic (--)
Geographic Location
Percent Urban (--) (+) (--) (--)
West-North-Central (--)
Table 1 is important because it indicates the variables that can be influenced to affect
nursing demand. Increasing Medicaid eligibility, for example, increases the population
that uses a variety of health care facilities and, therefore, the demand for nursing in a
variety of settings. HMO usage rates, on the other hand, decrease nursing demand.

The Supply and Demand for Registered Nurses and Licensed Practical Nurses in Nebraska
David I. Rosenbaum, Ph.D. 402-489-1218
Economic Consulting [email protected] 3
FTE RNs per Capita
The second step in estimating the demand for FTE RNs is to calculate the required FTE
RNs per capita in each health care setting, also referred to as staffing intensity. The nurse
staffing intensity measures are shown in Table 2, below. Typically staffing intensity is
measured either as FTE RNs required per 1,000 patient units or as FTE RNs per 10,000
in population. For nurse educators, staffing intensity is measured as a constant number of
educators per RN.
In the first seven settings shown in Table 2 (inpatient, outpatient and emergency care in a
short-term hospital; long-term hospital; nursing facility; home health; and physicians’
offices), nurse staffing intensity is determined by regressing historic staffing intensities
on factors reflecting the health care environment, economic conditions, health and acuity,
and geographic location. In the final five settings shown in Table 2 (occupational health,
schools, public health, other settings, nurse education) the ratio of FTE RNs per unit of
population is assumed to remain constant over time, based on 1996 usage patterns.
Table 2
RN Staffing Intensity by Health Care Setting
Setting RNs Short-term Hospitals
Inpatient RNs/1,000 inpatient days
Outpatient RNs/1,000 outpatient days
Emergency RNs/1,000 ER visits
Long-term/Psychiatric/Other Hospitals RNs/1,000 inpatient days
Nursing Facilities RNs/resident
Home Health RNs/1,000 Household visits
Physicians’ Office RNs/10,000 population
Occupational Health RNs/10,000 population age 18-64
Schools RNs/10,000 population age 5-17
Public Health RNs/10,000 population
All Other Settings RNs/10,000 population
Nurse Education RN educators/total RNs

The Supply and Demand for Registered Nurses and Licensed Practical Nurses in Nebraska
David I. Rosenbaum, Ph.D. 402-489-1218
Economic Consulting [email protected] 4
For the seven health care settings in the top of Table 2, the factors affecting staffing
intensity are shown in Table 3, below. A negative sign (--) indicates that an increase in
that factor will decrease staffing intensity, all else equal. For example, an increase in the
ratio of RN to LPN wages will decrease the number of FTE RNs per 1,000 in-patient
visits to hospitals. A positive sign (+) indicates that an increase in that factor will increase
the staffing intensity, all else equal. For example, an increase in the Medicare payment
per home health visit will increase the number of FTE RNs per 1,000 home health visits.
Table 3
Factors Affecting RN Staffing Intensity in Health Care Settings Short-Term Hospital
In-
Patient
Out-
Patient
ER
Long-
Term
Hospital
Nursing
Facility
Home
Health
Physician
Offices
Health care Environment
RN/LPN Wage (--) (--) (--) (--)
HMO Usage (+) (+) (+) (--)
Medicare Payment/
Home Health Visit (+)
Medicaid Nursing
Facility Daily Rate (+)
Percent Hospital
Surgeries as Outpatient
Surgeries
(+)
Economic Conditions
Population Uninsured (--) (+) (--)
Population Medicaid
Eligible (--) (--)
Per Capita Income (+)
Health/Acuity
Mean Population Age (+)
Acuity (+)
Geographic Location
Percent Urban (+) (+) (--)
Table 3 is important because it indicates the variables that can be influenced to affect
staffing intensity and, consequently, nursing demand. Increasing the percentage of
hospital surgeries that are performed on an outpatient basis, for example, increases
staffing intensity and, therefore, the demand for nursing in outpatient settings. An
increase in RN wages relative to LPN wages, on the other hand, decreases nursing
demand.
It is important to note that the NDM uses relative wages to determine nursing demand.
For example, if wages for nurses, LPNs and nursing assistants all rise by ten percent,
there would be no impact on nursing demand. However, if nurse wages rose by a greater
percentage than LPN or aide wages, nursing demand would decline in some health care
settings as relatively less expensive LPNs and aids are substituted for nurses.

The Supply and Demand for Registered Nurses and Licensed Practical Nurses in Nebraska
David I. Rosenbaum, Ph.D. 402-489-1218
Economic Consulting [email protected] 5
FTE Nursing Demand
The final step estimates FTE RN demand. The demand is calculated as the units of
health care usage in each setting multiplied by FTE RNs per unit of health care usage.
For example, if there are 2.6 million outpatient hospital visits estimated for a year and
there is one FTE RN per 1,000 visits, expected demand in that health care setting would
be 2,600 FTE RNs.
Making the Model Nebraska Specific
Most of the variables in the model reflected Nebraska’s nursing demand experience.
However, there were a few that required adjustment.
Population
The U.S. Census Bureau publishes population projections by year, age group and sex to
the year 2020. The age groups are 0-4, 5-17, 18-24, 35-44, 45-64, 65-74, 75-84, and 85+
years old. The Census projections were made in 1996 and again in 2003. The NDM
creators adjusted the 1996 Census projections so they pass through actual census
population counts for the year 2000.
The Census Bureau also publishes population estimates for the years 2000 through 2004.
The NDM projections are compared to Census population estimates for those four years.
Comparison shows that the NDM projections are, on average, about five percent too high
for men age 65-74 and about five percent too low for men age 85 and over. All other
NDM projections are consistent with Census data. The NDM projections for these two
groups are adjusted to reflect actual population experience in Nebraska.
RN Usage
The NDM predicts FTE RN usage from 1996 through 2020. In its default setting, the
model calibrates its predictions to actual nursing demand in the year 2000. Walburn and
Kelly have collected nursing demand data for Nebraska in the year 2002.1 Adjustments
are made to the NDM to calibrate to 2002 demand.
1 Walburn, Cheryl and Charlene Kelly, Nebraska RN Survey Report 2003, Nebraska Health and Human
Services, 2003.

The Supply and Demand for Registered Nurses and Licensed Practical Nurses in Nebraska
David I. Rosenbaum, Ph.D. 402-489-1218
Economic Consulting [email protected] 6
The NDM assumes a nurse is one FTE equivalent if that nurse works 30 or more hours
per week. Nurses working anything less than 30 hours are treated as one half of an FTE.
Walburn and Kelly show the number of nurses and the number of hours they work
broken into ten-hour incremental blocks. According to their survey results,
approximately 77 percent of Nebraska’s nurses surveyed worked full time for one FTE
each and the remaining 23 percent worked part time for one half of one FTE each. These
figures are shown in Table 4, below.
Table 4
Adjusting the NDM to Reflect Nebraska FTE RNs in 2002
Walburn and Kelly show that in 2002 16,855 nurses worked in nursing positions that
required an RN license. Assuming that 77 percent of the 16,855 nurses worked full time
and the other 23 percent worked part time, this implies 12,949 working full time for one
FTE and another 3,906 working part time for ½ FTE each. Adding implies that Nebraska
had 14,902 FTE RN positions in 2002.
The NDM assumes that there was a shortage of nurses to work in hospital settings in the
late 1990s and into the 2000s. It assumes that actual demand for FTE RNs in hospital
settings was seven percent higher than observed employment. Data from the Walburn
and Kelly study show that about 55 percent of nurses were employed in hospitals.
Multiplying the 14,902 FTE RNs by 55 percent and adding seven percent estimates the
demand in hospitals to be about 8,818 FTE RNs . The remaining 45 percent represents
demand in non-hospital settings, or 6,661 FTE RNs. Adding demand in both settings
indicates that Nebraska’s actual 2002 demand was about 15,479 FTE RNS.
Percent of surveyed Nebraska nurses working full time (1 FTE) 77%
Percent of surveyed Nebraska nurses working part time (1/2 FTE) 23%
Nebraska nurses working in positions requiring an RN license in 2002 16,855
Full time RNs (1 FTE each) 12,949
Part time RNs (1/2 FTE each) 3,906
Implied Nebraska FTE RNs working in positions requiring an RN license in 2002 14,902
Percent of RNs working in hospital settings 55%
Percent of RNs working in non-hospital settings 45%
FTE RNs working in hospitals 8,241
Adjustment for demand shortage 7%
FTE RN demand from hospitals 8,818
FTE RN demand from non-hospital settings 6,661
Actual Nebraska 2002 FTE RN demand 15,479
NDM Nebraska 2002 FTE RN demand 15,200
Adjustment 1.84%

The Supply and Demand for Registered Nurses and Licensed Practical Nurses in Nebraska
David I. Rosenbaum, Ph.D. 402-489-1218
Economic Consulting [email protected] 7
The NDM predicts Nebraska’s 2002 demand for FTE RNs as 15,200, an underestimate of
1.84 percent. The NDM is adjusted to account for this underestimate.
Results
Table 5 shows the NDM’s projections for FTE RN demand in Nebraska from 2006
through 2020. Projections increase from a demand of just over 16,000 FTE nurses in
2006 to just over 20,000 FTE RNs in 2020. This represents an increase in demand of
about 25 percent. This strong growth in the demand for FTE RNs is mainly a result of
the aging of Nebraska’s population and their relatively more care-intensive needs.
Table 5
NDM Estimated Nebraska Demand for FTE RNs
Year FTE RN Demand
2006 16,182
2007 16,428
2008 16,685
2009 16,909
2010 17,133
2011 17,379
2012 17,668
2013 17,947
2014 18,276
2015 18,567
2016 18,915
2017 19,225
2018 19,608
2019 19,935
2020 20,329
III The Nursing Supply Model
The Nursing Supply Model (NSM) uses a three-step process to predict the annual supply
of FTE nurses through the year 2020. In the first step, the process estimates the annual
potential RN population. The second step determines a participation rate and multiplies it
by the RN population to determine the RNs that are participating in the nursing labor
market. (Participation means that an RN is either employed or looking for employment.)
The third step develops a measure of FTE RN equivalents. The FTE RN equivalent
measure is multiplied by the number of RNs participating in the labor market to get the
FTE RN labor supply each year.
Many of the factors that influence the potential RN population, the participation rate and
the FTE equivalent rate are themselves dependent upon age and education level. Hence,
the NSM keeps track of the nursing population by age and by education level.

The Supply and Demand for Registered Nurses and Licensed Practical Nurses in Nebraska
David I. Rosenbaum, Ph.D. 402-489-1218
Economic Consulting [email protected] 8
RN Population
The NSM begins by estimating the nursing population in each year. To do this, it starts
with the population from the previous year. It then determines the net migration of
nurses in to or out of the state, changes in education, attrition, foreign immigration and
new graduates into the nursing labor pool.
Starting Population Pool
The starting population is the number of registered nurses in the state in the year 2000.
This information is disaggregated by age and education.
Migration
To determine net migration, the model uses pre-estimated probabilities of immigration
into or emigration out of each state. The probabilities depend on an RN’s age and
education level. Older or more educated nurses tend to be more stable than younger or
less educated nurses. The actual number of immigrants into or emigrants out of a state in
a particular year is the nursing population times the probability of immigration or
emigration. Net migration is measured as the number of nurses entering the state minus
the number of nurses leaving the state.
Education
The model predicts many changes in labor market supply based on education. Hence, it
has to predict changes in education among the nursing pool. It assumes that all nurses
earning a bachelor’s degree are new entrants into the market. Only nurses earning
master’s degrees or higher are assumed to be current labor market participants upgrading
their education. To predict how many nurses will earn advanced degrees, the model
starts with pre-estimated probabilities of upgrading by current education and age. It
applies those probabilities to the nursing labor pool to estimate the number of nurses that
earn advanced degrees.
Attrition
Attrition is a permanent departure from the labor market. To estimate attrition, the model
uses pre-estimated probabilities that a nurse with a specified education and age will leave
the labor market. It applies the probabilities to the nursing labor pool to estimate the
number of nurses that actually exit each year.
Foreign Immigration
The model’s statistics show that there is almost no foreign immigration into the Nebraska
RN labor market. This potential source of RN supply is insignificant.
New Graduates
The NSM assumes that every one percent change in the pool of potential applicants for
nursing schools as compared to the pool that existed in the year 2000 results in a one
percent change in the number of nursing school graduates as compared to the number of
graduates in the year 2000. The pool of potential applicants to nursing schools is the
number of women age 20 to 44. For example, if the proportion that women age 20 to 44
make up of Nebraska’s population falls by two percent in the year 2010 as compared to

The Supply and Demand for Registered Nurses and Licensed Practical Nurses in Nebraska
David I. Rosenbaum, Ph.D. 402-489-1218
Economic Consulting [email protected] 9
2000, the number of graduates from nursing programs will fall by two percent in 2010 as
compared to the number that graduated in 2000.
RN Participation
Participation measures the probability that a nurse will be either employed or looking for
work. The model uses pre-estimated national participation rates by age and education.
For example, there may be a 96 percent chance that a 30 year old with a Masters Degree
is participating in the RN labor market and only a 30 percent chance that a 64 year old
with a diploma is participating. The NSM applies the participation rates to the nursing
labor pool to estimate the number of nurses that actually participate in the labor market
each year.
RN FTE Equivalents
FTE equivalent rates estimate the proportion of nurses that work full time (for one FTE)
and the proportion that work part time (for ½ FTE). The NSM creators used national data
stratified by age and education to pre-estimate FTE RN equivalent rates. The model
multiplies the full time and part time proportions to the nursing labor pool to estimate the
supply of FTE RNs each year.
FTE Nursing Supply
The model multiplies the population of nurses by participation rates and FTE RN
equivalent rates to estimate the FTE RN supply in each year.
Making the Model Nebraska Specific
Most of the variables in the model reflected Nebraska’s nursing supply experience. Two,
however, required adjustment.
Initial Number of Nurses
Walburn and Kelly have collected nursing supply data for Nebraska in the year 2000.2
They estimate that there were 19,580 registered nurses in the state. The NSM shows
there were 18,571 registered nurses in the state in 2000. Hence, the NSM underestimates
by 5.4 percent. The year 2000 beginning nurse population is increased by 5.4 percent to
make the starting data more reflective of Nebraska.
2 Walburn, Cheryl and Charlene Kelly, Nebraska RN Survey Report 2001, Nebraska Health and Human
Services, 2001.

The Supply and Demand for Registered Nurses and Licensed Practical Nurses in Nebraska
David I. Rosenbaum, Ph.D. 402-489-1218
Economic Consulting [email protected] 10
Initial Number of Graduates
The nursing supply model uses an initial value of number of new combined Associate
and Diploma graduates, as well as Bachelors graduates. The first row of Table 6 shows
that the model assumed there were 259 Associate and Diplomas and 427 BSNs. The next
five rows show Nebraska’s actual graduation experience in the years 2000 through 2004.
The averages over that period are 294 and 487. These figures are substituted into the
model.
Table 6
Number of Nurse Graduates from Nebraska Colleges and Universities
Number of
Associate and
Diploma Degrees
Number of
Bachelor’s Degrees
Model Default 259 427
Nebraska Actuals
Year
2000 268 486
2001 260 443
2002 314 493
2003 300 463
2004 326 554
Average 294 487
The NSM uses the population of women aged 20 to 44 as the potential pool of applicants
to nursing schools. This clearly leaves men out of the market. However, the model uses
only relative changes in the population of women in this age group to predict changes in
nursing school enrollments. As long as the male population increases at the same relative
rate as the female population, there should be no inconsistency in estimating the nurse
population.

The Supply and Demand for Registered Nurses and Licensed Practical Nurses in Nebraska
David I. Rosenbaum, Ph.D. 402-489-1218
Economic Consulting [email protected] 11
Results
Table 7 shows the NSM’s projections of the FTE RN supply in Nebraska from 2006
through 2020. Projections increase from a supply of 15,293 FTE nurses in 2006 to
16,491 FTE RNs in 2020. This represents an increase in supply of about eight percent
over the 15 year period.
Table 7
NSM Estimated Nebraska Supply of FTE RNs
Year FTE RN Supply
2006 15,293
2007 15,467
2008 15,620
2009 15,780
2010 15,917
2011 16,041
2012 16,134
2013 16,224
2014 16,296
2015 16,366
2016 16,406
2017 16,441
2018 16,451
2019 16,471
2020 16,491
Slow growth in the supply of FTE RNs occurs for several reasons. The main drivers,
however, are the aging of the RN supply and limited replacement with new nurses. In the
year 2000, a relatively large percentage of nurses were ages 40 to 49. This meant that a
significant segment of the RN population was staying in Nebraska and working full time.
By 2015, this large segment of the labor market will be in the 55-64 age bracket. Most of
these nurses will either work part time or leave the labor market altogether. This will
decrease the supply of nurses. Unfortunately, demographics play against replacing these
losses with large numbers of new nurses. As Nebraska’s population ages, there will be a
smaller pool of new graduates from nursing colleges. Younger nurses also tend to be
more migratory. The model’s underlying statistics show that Nebraska faces net out-
migration rates of about 100 FTE RNs per year. The cumulative effect is to make the
supply of FTE nurses rise by smaller and smaller amounts.

The Supply and Demand for Registered Nurses and Licensed Practical Nurses in Nebraska
David I. Rosenbaum, Ph.D. 402-489-1218
Economic Consulting [email protected] 12
IV Comparing RN Supply and Demand
Table 8 shows the demand, supply and surplus/(shortage) of nurses in each year.
Shortages are shown in parentheses. The shortage grows from 889 FTE RNs in 2006 to
over 3,800 FTE RNs in 2020. In relative terms, the market goes from not filling about
six percent of demand to not meeting almost 20 percent of demand.
Table 8
Estimated Surplus/Shortage of FTE RNs
Year
FTE RN
Demand
FTE RN
Supply
Surplus/
(Shortage)
Relative
Surplus/Shortage
2006 16,182 15,293 (889) -5.5%
2007 16,428 15,467 (961) -5.8%
2008 16,685 15,620 (1,065) -6.4%
2009 16,909 15,780 (1,129) -6.7%
2010 17,133 15,917 (1,216) -7.1%
2011 17,379 16,041 (1,338) -7.7%
2012 17,668 16,134 (1,534) -8.7%
2013 17,947 16,224 (1,723) -9.6%
2014 18,276 16,296 (1,980) -10.8%
2015 18,567 16,366 (2,201) -11.9%
2016 18,915 16,406 (2,509) -13.3%
2017 19,225 16,441 (2,784) -14.5%
2018 19,608 16,451 (3,157) -16.1%
2019 19,935 16,471 (3,464) -17.4%
2020 20,329 16,491 (3,838) -18.9%
V Policies to Impact Shortages
Factors Influencing Demand
One way to reduce the shortage is to slow the rate of demand growth. The steady
increase in growth is fueled by Nebraska’s aging population and its relatively nursing
intensive health care needs. Clearly it is not possible to change the state’s demographic
trends. Instead, it may be possible to change the number of FTE nurses required to care
for an aging population.
Tables 1 and 3 in section II above suggest factors that will cut back on RN demand.
There may be other ways that technology or staffing changes can be used to reduce RN
demand.
Factors Influencing Supply
Several factors influence the supply of RNs. A number of major factors are addressed in
the following subsections.
Migration
According to the NSM, Nebraska loses about 100 RNs every year due to net out-
migration. Migration typically occurs among younger nurses. Hence policies that

The Supply and Demand for Registered Nurses and Licensed Practical Nurses in Nebraska
David I. Rosenbaum, Ph.D. 402-489-1218
Economic Consulting [email protected] 13
discourage emigration and encourage immigration would help keep a larger and younger
RN workforce.
To explore the impact that migration policies may have, emigration rates are reduced ten
percent and immigration rates are increased ten percent. Table 9 shows the results. The
three columns under the heading “Baseline Model” repeat the demand, supply and
resulting shortage figures from the initial estimation. The next two columns under the
heading “Augmented Model” show the supply effects and resulting shortage with the
change in the supply model. Reducing emigration rates and increasing immigration rates
clearly increases the supply of FTN RNs and reduces the predicted shortage.
The last column in Table 9 shows the relative reduction in the shortage. Compared to the
baseline model, reducing emigration rates and increasing immigration rates reduces the
year 2020 shortage from 3,838 to 2,512 FTE RNs, or by about 35 percent. The benefit of
a policy to stimulate net in-migration is that its effects are cumulative over time. Nurses
that are attracted into Nebraska early in their careers tend to stay in the state throughout
their careers. In addition, more nurses either remain in Nebraska or join the labor supply
each year.
Table 9
Decreasing Emigration Rate and Increasing Immigration Rate --
Estimated Shortage of FTE RNs
Baseline Model Augmented Model
Year
FTE RN
Demand
FTE RN
Supply
Surplus/
(Shortage)
FTE RN
Supply
Surplus/
(Shortage)
Reduction in
Shortage
2006 16,182 15,293 (889) 15,391 (791) 11.0%
2007 16,428 15,467 (961) 15,663 (765) 20.3%
2008 16,685 15,620 (1,065) 15,912 (773) 27.4%
2009 16,909 15,780 (1,129) 16,167 (742) 34.3%
2010 17,133 15,917 (1,216) 16,398 (735) 39.6%
2011 17,379 16,041 (1,338) 16,613 (766) 42.8%
2012 17,668 16,134 (1,534) 16,797 (871) 43.2%
2013 17,947 16,224 (1,723) 16,977 (970) 43.7%
2014 18,276 16,296 (1,980) 17,103 (1,173) 40.8%
2015 18,567 16,366 (2,201) 17,293 (1,274) 42.1%
2016 18,915 16,406 (2,509) 17,416 (1,499) 40.3%
2017 19,225 16,441 (2,784) 17,533 (1,692) 39.2%
2018 19,608 16,451 (3,157) 17,624 (1,984) 37.1%
2019 19,935 16,471 (3,464) 17,721 (2,214) 36.1%
2020 20,329 16,491 (3,838) 17,817 (2,512) 34.5%
Education
The NSM’s background research shows that nurses with advanced degrees tend to stay in
the labor market longer and are more likely to work full time than their less educated
counterparts. The NSM assumes that the number of nurses upgrading their educations is
constant at the number that upgraded in the year 2000. These numbers are increased by

The Supply and Demand for Registered Nurses and Licensed Practical Nurses in Nebraska
David I. Rosenbaum, Ph.D. 402-489-1218
Economic Consulting [email protected] 14
10 percent to examine the impact that a greater number of nurses upgrading their degrees
will have on future nursing shortages.
Results of the NSM show that upgrading education would have no impact on the
projected FTE RN shortage. This occurs for several reasons. The number of nurses that
upgrade is small. Nurses also generally upgrade at relative young ages. By the year
2020, most of the nurses with higher degrees are still in mid-career, a time when most
nurses are working full time. Hence their change in educational status has little impact
on the market as a whole.
Attrition
Attrition is the percentage of nurses that permanently leave the labor market at a given
age. While young nurses have almost no attrition, the second column of Table 10 shows
that the NSM default attrition rates for RNs 60 and older can be quite high. At ages 60
and 61, about five percent of RNs are leaving the work force each year. At ages 63 and
64, nearly seven percent of RNs are leaving the work force. Almost a quarter of nurses
ages 62 or 65 and older leave the market each year. These attrition rates imply that if
there are 100 nurses in the labor market starting at age 62, only about 50 will remain by
the time they reach 66.
Table 10
Attrition Rates for RNs by Age
Age
Nursing Supply Model
Default Percent of RNs
Leaving Work Force
First Alternative for
Percent of RNs
Leaving Workforce
Second Alternative
for Percent of RNs
Leaving Workforce
60 4.8% 4.8% 4.8%
61 4.9% 4.9% 4.9%
62 25.2% 13.4% 22.7%
63 6.9% 13.4% 6.2%
64 6.9% 13.4% 6.2%
65 23.2% 23.2% 20.9%
66 and older 25% 25% 25%
The NSM allows users to adjust attrition rates by age. The third column of Table 10
shows the first alternative measure of the percentage of RNs leaving the workforce. This
alternative smoothes the attrition rates for ages 62 through 64, yet maintains the result
that half of nurses that were in the market at age 62 would leave the market by age 66.
The Supply and Demand for Registered Nurses and Licensed Practical Nurses in Nebraska
David I. Rosenbaum, Ph.D. 402-489-1218
Economic Consulting [email protected] 15
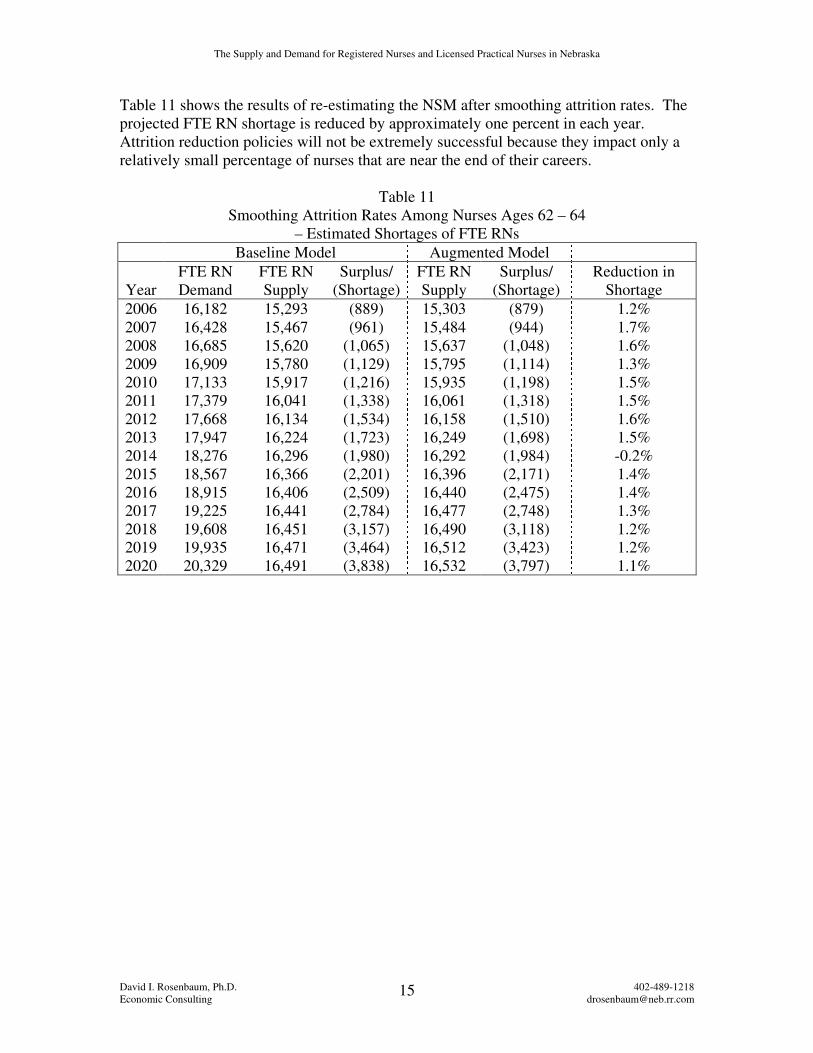
Table 11 shows the results of re-estimating the NSM after smoothing attrition rates. The
projected FTE RN shortage is reduced by approximately one percent in each year.
Attrition reduction policies will not be extremely successful because they impact only a
relatively small percentage of nurses that are near the end of their careers.
Table 11
Smoothing Attrition Rates Among Nurses Ages 62 – 64
– Estimated Shortages of FTE RNs
Baseline Model Augmented Model
Year
FTE RN
Demand
FTE RN
Supply
Surplus/
(Shortage)
FTE RN
Supply
Surplus/
(Shortage)
Reduction in
Shortage
2006 16,182 15,293 (889) 15,303 (879) 1.2%
2007 16,428 15,467 (961) 15,484 (944) 1.7%
2008 16,685 15,620 (1,065) 15,637 (1,048) 1.6%
2009 16,909 15,780 (1,129) 15,795 (1,114) 1.3%
2010 17,133 15,917 (1,216) 15,935 (1,198) 1.5%
2011 17,379 16,041 (1,338) 16,061 (1,318) 1.5%
2012 17,668 16,134 (1,534) 16,158 (1,510) 1.6%
2013 17,947 16,224 (1,723) 16,249 (1,698) 1.5%
2014 18,276 16,296 (1,980) 16,292 (1,984) -0.2%
2015 18,567 16,366 (2,201) 16,396 (2,171) 1.4%
2016 18,915 16,406 (2,509) 16,440 (2,475) 1.4%
2017 19,225 16,441 (2,784) 16,477 (2,748) 1.3%
2018 19,608 16,451 (3,157) 16,490 (3,118) 1.2%
2019 19,935 16,471 (3,464) 16,512 (3,423) 1.2%
2020 20,329 16,491 (3,838) 16,532 (3,797) 1.1%

The Supply and Demand for Registered Nurses and Licensed Practical Nurses in Nebraska
David I. Rosenbaum, Ph.D. 402-489-1218
Economic Consulting [email protected] 16
An alternative attrition assumption may be considered as well. The last column of Table
9, above, shows attrition rates if they are reduced by ten percent in each year for ages 62
through 65. The results of reducing attrition in such a manner are shown in Table 12,
below. Again, there is almost no impact on reducing the RN shortage. Reducing attrition
does not seem to be the answer.
Table 12
Reducing Attrition Rates Among Nurses Ages 62-65
– Estimated Shortages of FTE RNs
Baseline Model Augmented Model
Year
FTE RN
Demand
FTE RN
Supply
Surplus/
(Shortage)
FTE RN
Supply
Surplus/
(Shortage)
Reduction in
Shortage
2006 16,182 15,293 (889) 15,300 (882) 0.8%
2007 16,428 15,467 (961) 15,479 (949) 1.3%
2008 16,685 15,620 (1,065) 15,636 (1,049) 1.5%
2009 16,909 15,780 (1,129) 15,798 (1,111) 1.6%
2010 17,133 15,917 (1,216) 15,937 (1,196) 1.6%
2011 17,379 16,041 (1,338) 16,063 (1,316) 1.6%
2012 17,668 16,134 (1,534) 16,158 (1,510) 1.6%
2013 17,947 16,224 (1,723) 16,249 (1,698) 1.5%
2014 18,276 16,296 (1,980) 16,292 (1,984) -0.2%
2015 18,567 16,366 (2,201) 16,396 (2,171) 1.4%
2016 18,915 16,406 (2,509) 16,438 (2,477) 1.3%
2017 19,225 16,441 (2,784) 16,475 (2,750) 1.2%
2018 19,608 16,451 (3,157) 16,489 (3,119) 1.2%
2019 19,935 16,471 (3,464) 16,511 (3,424) 1.2%
2020 20,329 16,491 (3,838) 16,532 (3,797) 1.1%

The Supply and Demand for Registered Nurses and Licensed Practical Nurses in Nebraska
David I. Rosenbaum, Ph.D. 402-489-1218
Economic Consulting [email protected] 17
New Graduates
To examine the impact that increases in nursing school graduates will have on the FTE
RN supply, the number of nurses that are expected to graduate in any year is increased by
10 percent. Since it will take time to educate these new nurses, it is assumed that the
increased supply of new graduates will not start into the market until the year 2010.
The impact of increasing nursing school graduates is shown in Table 13, below. As more
new nurses join the labor market, the shortage is slowly reduced. Eventually it is reduced
by about 14 percent.
Table 13
Increasing Nursing School Graduates
– Estimated Shortages of FTE RNs
Baseline Model Augmented Model
Year
FTE RN
Demand
FTE RN
Supply
Surplus/
(Shortage)
FTE RN
Supply
Surplus/
(Shortage)
Reduction in
Shortage
2006 16,182 15,293 (889) 15,293 (889) 0.0%
2007 16,428 15,467 (961) 15,467 (961) 0.0%
2008 16,685 15,620 (1,065) 15,620 (1,065) 0.0%
2009 16,909 15,780 (1,129) 15,780 (1,129) 0.0%
2010 17,133 15,917 (1,216) 15,917 (1,216) 0.0%
2011 17,379 16,041 (1,338) 16,100 (1,279) 4.4%
2012 17,668 16,134 (1,534) 16,251 (1,417) 7.6%
2013 17,947 16,224 (1,723) 16,399 (1,548) 10.1%
2014 18,276 16,296 (1,980) 16,494 (1,782) 10.0%
2015 18,567 16,366 (2,201) 16,650 (1,917) 12.9%
2016 18,915 16,406 (2,509) 16,744 (2,171) 13.5%
2017 19,225 16,441 (2,784) 16,832 (2,393) 14.0%
2018 19,608 16,451 (3,157) 16,895 (2,713) 14.1%
2019 19,935 16,471 (3,464) 16,966 (2,969) 14.3%
2020 20,329 16,491 (3,838) 17,037 (3,292) 14.2%
The Supply and Demand for Registered Nurses and Licensed Practical Nurses in Nebraska
David I. Rosenbaum, Ph.D. 402-489-1218
Economic Consulting [email protected] 18
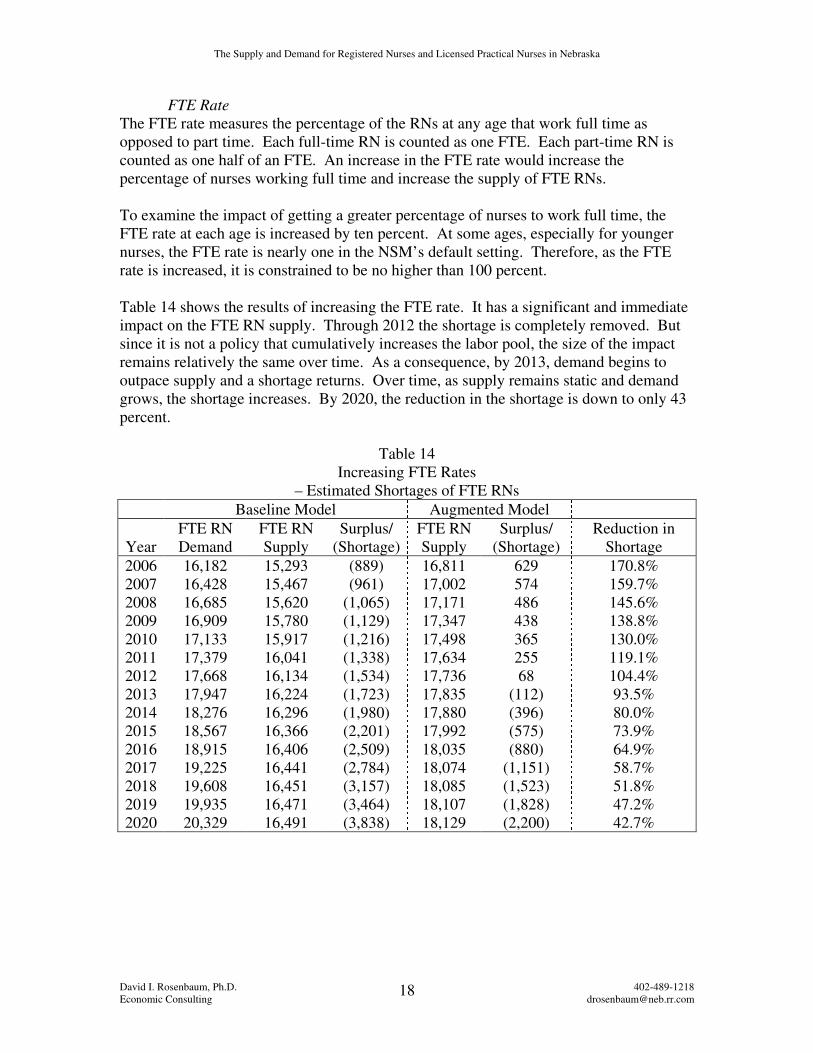
FTE Rate
The FTE rate measures the percentage of the RNs at any age that work full time as
opposed to part time. Each full-time RN is counted as one FTE. Each part-time RN is
counted as one half of an FTE. An increase in the FTE rate would increase the
percentage of nurses working full time and increase the supply of FTE RNs.
To examine the impact of getting a greater percentage of nurses to work full time, the
FTE rate at each age is increased by ten percent. At some ages, especially for younger
nurses, the FTE rate is nearly one in the NSM’s default setting. Therefore, as the FTE
rate is increased, it is constrained to be no higher than 100 percent.
Table 14 shows the results of increasing the FTE rate. It has a significant and immediate
impact on the FTE RN supply. Through 2012 the shortage is completely removed. But
since it is not a policy that cumulatively increases the labor pool, the size of the impact
remains relatively the same over time. As a consequence, by 2013, demand begins to
outpace supply and a shortage returns. Over time, as supply remains static and demand
grows, the shortage increases. By 2020, the reduction in the shortage is down to only 43
percent.
Table 14
Increasing FTE Rates
– Estimated Shortages of FTE RNs
Baseline Model Augmented Model
Year
FTE RN
Demand
FTE RN
Supply
Surplus/
(Shortage)
FTE RN
Supply
Surplus/
(Shortage)
Reduction in
Shortage
2006 16,182 15,293 (889) 16,811 629 170.8%
2007 16,428 15,467 (961) 17,002 574 159.7%
2008 16,685 15,620 (1,065) 17,171 486 145.6%
2009 16,909 15,780 (1,129) 17,347 438 138.8%
2010 17,133 15,917 (1,216) 17,498 365 130.0%
2011 17,379 16,041 (1,338) 17,634 255 119.1%
2012 17,668 16,134 (1,534) 17,736 68 104.4%
2013 17,947 16,224 (1,723) 17,835 (112) 93.5%
2014 18,276 16,296 (1,980) 17,880 (396) 80.0%
2015 18,567 16,366 (2,201) 17,992 (575) 73.9%
2016 18,915 16,406 (2,509) 18,035 (880) 64.9%
2017 19,225 16,441 (2,784) 18,074 (1,151) 58.7%
2018 19,608 16,451 (3,157) 18,085 (1,523) 51.8%
2019 19,935 16,471 (3,464) 18,107 (1,828) 47.2%
2020 20,329 16,491 (3,838) 18,129 (2,200) 42.7%

The Supply and Demand for Registered Nurses and Licensed Practical Nurses in Nebraska
David I. Rosenbaum, Ph.D. 402-489-1218
Economic Consulting [email protected] 19
Cumulative Policies
Table 15 shows the cumulative effects of instituting all of the supply enhancing policies
previously discussed. This includes reducing net out-migration, delaying retirements,
having more nurses work full time, and attracting new nurses to the market. The
cumulative effects are substantial. The shortage is eliminated through the year 2020.
Table 15
Cumulative Policies
– Estimated Shortages of FTE RNs
Baseline Model Augmented Model
Year
FTE RN
Demand
FTE RN
Supply
Surplus/
(Shortage)
FTE RN
Supply
Surplus/
(Shortage)
Reduction in
Shortage
2006 16,182 15,293 (889) 17,449 1,267 242.5%
2007 16,428 15,467 (961) 17,740 1,312 236.5%
2008 16,685 15,620 (1,065) 18,007 1,322 224.1%
2009 16,909 15,780 (1,129) 18,281 1,372 221.5%
2010 17,133 15,917 (1,216) 18,528 1,395 214.7%
2011 17,379 16,041 (1,338) 18,824 1,445 208.0%
2012 17,668 16,134 (1,534) 19,083 1,415 192.3%
2013 17,947 16,224 (1,723) 19,338 1,391 180.7%
2014 18,276 16,296 (1,980) 19,534 1,258 163.5%
2015 18,567 16,366 (2,201) 19,802 1,235 156.1%
2016 18,915 16,406 (2,509) 19,995 1,080 143.0%
2017 19,225 16,441 (2,784) 20,181 956 134.3%
2018 19,608 16,451 (3,157) 20,335 727 123.0%
2019 19,935 16,471 (3,464) 20,502 567 116.4%
2020 20,329 16,491 (3,838) 20,660 331 108.6%
VI The LPN Demand Model
The Nursing Demand Model also projects the demand for licensed practical nurses
(LPNs). It uses a three-step process to predict annual demand for FTE LPNs through the
year 2020. In the first step the model estimates the number of people requiring care in
five different health care settings. In the second step, the model estimates the FTE LPNs
required per capita in each setting. The last step multiplies these two figures to project
FTE LPN demand.
Number of People Requiring Care
The model develops the number of people requiring care in five health care settings as a
function of demographics. The settings are short-term hospitals, long-term hospitals,
nursing care, home health care and other settings. Fewer settings are used than for
predicting RN demand. However, data from Walburn and Kelly indicate that two-thirds
of LPNs were employed in either long-term care facilities, hospitals, or
public/community/home health. These employment categories match well with the five

The Supply and Demand for Registered Nurses and Licensed Practical Nurses in Nebraska
David I. Rosenbaum, Ph.D. 402-489-1218
Economic Consulting [email protected] 20
settings used in the model.3 Probably the only category missing from the demand model
that Walburn and Kelly show as significant is LPN employment in physicians’ offices.
This LPN demand is combined into the “All Other Settings” category.
As with the nursing demand model, U.S. Census Bureau population projections form the
basis for estimating the number of people requiring care in each health care setting.
These projections are by age group, sex and rural/urban setting. The model then converts
population projections into numbers of people needing care in each of the five health care
settings. Historic health care experience is used to determine the usage of health care
facilities by people of different ages, sexes and urban/rural settings. These figures are
then adjusted for trends in the health care market environment, economic conditions,
demographics and geographic location.
FTE LPNs per Capita
The second step in estimating the demand for FTE LPNs is to calculate the required FTE
LPNs per capita in each of the five health care setting. The LPN staffing intensity
measures are shown in Table 16, below. In the first four settings, LPN staffing intensity
is determined by regressing historic staffing intensities on factors reflecting the health
care environment, economic conditions, health and acuity, and geographic location. For
the category “All Other Settings” the ratio of FTE LPNs per unit of population is
assumed to remain constant over time, based on 1996 usage patterns.
Table 16
LPN Staffing Intensity by Health Care Setting
Setting LPNs Short-term Hospitals LPNs/1,000 inpatient days
Long-term/Psychiatric/Other Hospitals LPNs/1,000 inpatient days
Nursing Facilities LPNs/resident
Home Health LPNs/1,000 Household visits
All Other Settings LPNs/10,000 population
3 Walburn, Cheryl and Charlene Kelly, Nebraska LPN Survey Report 2004, Nebraska Health and Human
Services, 2004.

The Supply and Demand for Registered Nurses and Licensed Practical Nurses in Nebraska
David I. Rosenbaum, Ph.D. 402-489-1218
Economic Consulting [email protected] 21
The factors affecting LPN staffing intensities in the first four settings are shown in Table
17, below. A positive sign (+) indicates that an increase in that factor will increase
staffing intensity, all else equal. For example, an increase in the ratio of RN to LPN
wages will increase the number of FTE LPNs per 1,000 in-patient and long-term hospital
visits. A negative sign (--) indicates that an increase in that factor will decrease the
staffing intensity, all else equal. For example, an increase in the ratio of LPN to nurse’s
aide wages will decrease LPN home health visits per 1,000 households.
Table 17
Factors Affecting LPN Staffing Intensity in Health Care Settings
Short-Term
Hospital
Long-Term
Hospital
Nursing
Facility
Home
Health
Health care Environment
RN/LPN Wage (+) (+) (+)
LPN/Aide Wage (--)
Medicare Payment/
Home Health Visit (+)
Medicaid Nursing
Facility Daily Rate (+)
Percent of Hospital
Surgeries as Outpatient
Surgeries
(+)
Health/Acuity
Mean Population Age (+)
Acuity (+)
Geographic Location
Percent Urban (+)

The Supply and Demand for Registered Nurses and Licensed Practical Nurses in Nebraska
David I. Rosenbaum, Ph.D. 402-489-1218
Economic Consulting [email protected] 22
Results
The number of people requiring care in each setting is multiplied by the usage measures
to estimate overall demand for LPNs. Table 18 shows the model’s projections for FTE
LPN demand in Nebraska from 2006 through 2020. Projections increase from a demand
of just under 6,000 FTE LPNs in 2006 to 7,680 FTE LPNs in 2020. This represents an
increase in demand of about 28 percent. This strong growth in the demand for FTE LPNs
is mainly a result of the aging of Nebraska’s population and their relatively more care-
intensive needs.
Table 18
Estimated Nebraska Demand for FTE LPNs
Year FTE LPN Demand
2006 5,989
2007 6,090
2008 6,191
2009 6,289
2010 6,388
2011 6,482
2012 6,597
2013 6,715
2014 6,840
2015 6,963
2016 7,100
2017 7,233
2018 7,380
2019 7,519
2020 7,680

The Supply and Demand for Registered Nurses and Licensed Practical Nurses in Nebraska
David I. Rosenbaum, Ph.D. 402-489-1218
Economic Consulting [email protected] 23
VII LPN Supply
Unfortunately, there is no LPN supply model that can be used to predict supply in
Nebraska. Therefore, a more rudimentary process will be used to estimate the supply of
LPNs. First, data from a Nebraska LPN survey will be used to estimate the supply of
LPNs in the year 2002. Then rates of change in RN supplies will be applied to that figure
to estimate LPN supply in the years 2006 through 2020.
Walburn and Kelly have collected LPN supply data for Nebraska.4 They show that in
2002 there were 5,943 LPNs licensed in the state. This figure is shown in Table 19
below. According to Walburn and Kelly’s survey results, 98.7 percent of licensed LPNs
were either working in a position that required a license or looking for an LPN position.
Multiplying these two figures, it implies there were 5,866 licensed LPNs in Nebraska in
2002. Walburn and Kelly show the number of LPNs and the number of hours they
worked broken into ten-hour incremental blocks. According to their survey results,
approximately 80 percent of Nebraska’s LPNs surveyed worked full time for one FTE
each and the remaining 20 percent worked part time for one half of one FTE each. These
figures are shown in Table 19 as well. Assuming that 80 percent of the 5,866 LPNs
would work full time and the other 20 percent would work part time, this implies a
supply of 5,262 LPNs in the state in 2002.
Table 19
LPN FTE Supply in Year 2002
4 Walburn, Cheryl and Charlene Kelly, Nebraska RN Survey Report 2003, Nebraska Health and Human
Services, 2003.
Nebraska LPNs 5,943
Percent either Employed as LPN or Looking for LPN Position 98.7%
Nebraska LPNs Employed or Looking for Employment 5,866
Percent of surveyed Nebraska LPNs working full time (1 FTE) 79.4%
Percent of surveyed Nebraska LPNs working part time (1/2 FTE) 20.6%
Full time LPNs (1 FTE each) 4,657
Part time LPNs (1/2 FTE each) 1,208
Implied Nebraska Supply of FTE LPNs 5,262

The Supply and Demand for Registered Nurses and Licensed Practical Nurses in Nebraska
David I. Rosenbaum, Ph.D. 402-489-1218
Economic Consulting [email protected] 24
The growth rate in the supply of RNs is used to estimate the growth in LPN supply. The
first three columns of Table 20 show the year, supply of RNs and growth rate in RN
supply. Between 2002 and 2006, supply grew by about 4.6 percent, or a little over one
percent annually. Between 2006 and 2020, the annual rate of growth ranged between
1.14 and 0.06 percent. Column four of Table 20 shows the LPN supply in the year 2002.
Multiplying the year 2002 supply by the growth rates gives the implied supplies shown in
the last column of the table. Supply increases from 5,506 LPNs in 2006 to 5,937 in 2020.
Table 20
Estimated Nebraska Supply of FTE LPNs 2006-2020
RN Growth Rate LPN Implied Future
Year Supply in RN Supply Supply LPN Supply
2002 14,616 5,262
2006 15,293 4.63% 5,506
2007 15,467 1.14% 5,568
2008 15,620 0.99% 5,623
2009 15,780 1.02% 5,681
2010 15,917 0.87% 5,730
2011 16,041 0.78% 5,775
2012 16,134 0.58% 5,809
2013 16,224 0.56% 5,841
2014 16,296 0.44% 5,867
2015 16,366 0.43% 5,892
2016 16,406 0.24% 5,906
2017 16,441 0.21% 5,919
2018 16,451 0.06% 5,923
2019 16,471 0.12% 5,930
2020 16,491 0.12% 5,937

The Supply and Demand for Registered Nurses and Licensed Practical Nurses in Nebraska
David I. Rosenbaum, Ph.D. 402-489-1218
Economic Consulting [email protected] 25
IV Comparing LPN Supply and Demand
Table 21 shows the demand, supply and surplus/(shortage) of LPNs in the years 2006
through 2020. Shortages are shown in parentheses. The shortage grows from 483 FTE
LPNs in 2006 to over 1,700 FTE LPNs in 2020. In relative terms, the market goes from
not filling about eight percent of demand to not meeting 23 percent of demand.
Table 21
Estimated Surplus/Shortage of FTE LPNs
Year
FTE LPN
Demand
FTE LPN
Supply
Surplus/
(Shortage)
Relative
Surplus/Shortage
2006 5,989 5,506 (483) -8.07%
2007 6,090 5,568 (522) -8.57%
2008 6,191 5,623 (568) -9.17%
2009 6,289 5,681 (608) -9.67%
2010 6,388 5,730 (658) -10.29%
2011 6,482 5,775 (707) -10.91%
2012 6,597 5,809 (788) -11.95%
2013 6,715 5,841 (874) -13.02%
2014 6,840 5,867 (973) -14.23%
2015 6,963 5,892 (1,071) -15.38%
2016 7,100 5,906 (1,194) -16.81%
2017 7,233 5,919 (1,314) -18.17%
2018 7,380 5,923 (1,457) -19.75%
2019 7,519 5,930 (1,589) -21.14%
2020 7,680 5,937 (1,743) -22.69%
One way to reduce the shortage is to slow the rate of demand growth. The steady
increase in growth is fueled by Nebraska’s aging population and their relatively nursing
intensive health care needs. Table 17 in section VI above suggests factors that will cut
back on LPN demand. There may be other ways that technology or staffing changes can
be used to reduce RN demand.
With no LPN supply model, it would be speculative to try and predict the numerical
impacts that changes in LPN retention policies would have on shortages. However, it
seems reasonable to expect that the policies that would reduce nursing shortages would
also reduce LPN shortages. These include policies to stem net out-migration, delay
retirements, reduce career changes, promote full time employment, and attract new LPN
graduates.

The Supply and Demand for Registered Nurses and Licensed Practical Nurses in Nebraska
David I. Rosenbaum, Ph.D. 402-489-1218
Economic Consulting [email protected] 26
VII Recommendations
Several actions can be taken to prevent projected shortages in FTE RNs and LPNs over
the next 15 years. Near-term shortages can be reduced or eliminated if greater
participation can be coaxed from the existing supply of RNs and LPNs. This means
delaying retirements, keeping more RNs and LPNs in the profession and convincing a
greater percentage to work full time rather than part time.
At the same time, the stock of RNs and LPNs has to be increased. Since this will likely
be a slow building process, it should start soon to meet projected shortages into the next
decade. The stock can also be increased by reversing net out-migration trends, by getting
more applicants into schools, and by increasing graduation rates.
Care should be taken in adjusting wages in these two markets. The markets are
connected by relative wages. Increasing wages for RNs, for example, will increase the
supply of RNs and likely decrease the supply of LPNs as current and future LPNs opt
into the RN market. It will also decrease the demand for RNs and increase the demand
for LPNs. The overall impact will be to help alleviate the RN shortage but exacerbate the
shortage in the LPN market. A more reasonable policy may be to raise wages for RNs,
LPNs and Aides simultaneously so as not to disrupt relative wages across the markets.