the supply of inorganic fertilizers to smallhoder farmers
TRANSCRIPT
IFPRI Discussion Paper 01230
December 2012
The Supply of Inorganic Fertilizers to Smallholder Farmers in Tanzania
Evidence for Fertilizer Policy Development
Todd Benson
Stephen L. Kirama
Onesmo Selejio
Development Strategy and Governance Division
INTERNATIONAL FOOD POLICY RESEARCH INSTITUTE
The International Food Policy Research Institute (IFPRI) was established in 1975 to identify and analyze national and international strategies and policies for meeting the food needs of the developing world on a sustainable basis, with particular emphasis on low-income countries and on the poorer groups in those countries. IFPRI is a member of the CGIAR Consortium.
PARTNERS AND CONTRIBUTORS IFPRI gratefully acknowledges the generous unrestricted funding from Australia, Canada, China, Denmark, Finland, France, Germany, India, Ireland, Italy, Japan, the Netherlands, Norway, the Philippines, South Africa, Sweden, Switzerland, the United Kingdom, the United States, and the World Bank.
AUTHORS Todd Benson, Insternational Food Policy Research Institute Senior Research Fellow, Development Strategy and Governance Division [email protected] Stephen L. Kirama, Universityof Dar es Salaam Lecturer, Department of Economics Onesmo Selejio, University of Dar es Salaam Lecturer, Department of Economics
Notices 1. IFPRI Discussion Papers contain preliminary material and research results. They have been peer reviewed, but have not been subject to a formal external review via IFPRI’s Publications Review Committee. They are circulated in order to stimulate discussion and critical comment; any opinions expressed are those of the author(s) and do not necessarily reflect the policies or opinions of IFPRI. 2. The boundaries and names shown and the designations used on the map(s) herein do not imply official endorsement or acceptance by the International Food Policy Research Institute (IFPRI) or its partners and contributors.
Copyright 2012 International Food Policy Research Institute. All rights reserved. Sections of this material may be reproduced for personal and not-for-profit use without the express written permission of but with acknowledgment to IFPRI. To reproduce the material contained herein for profit or commercial use requires express written permission. To obtain permission, contact the Communications Division at [email protected].

iii
Contents
Abstract iv
Acknowledgments vi
1. Introduction 1
2. Overview of Fertilizer Supply and Use in Tanzania 5
3. Supply—Fertilizer Importation and Marketing in Tanzania 11
4. Survey of Traders Supplying Fertilizers 20
5. Survey of Farmers in Areas Where Fertilizer Is Used 28
6. Discussion 34
References 37

iv
Tables
2.1—Fertilizer prices, comparison of Tanzania retail price to FOB price from international suppliers, in US dollars per mt: Average August 2010–July 2011 8
4.1—Fertilizer trader scale of operations; size of largest order from supplier in 2010 21
4.2—Fertilizer trader characteristics 21
4.3—Fertilizer trader business characteristics 22
4.4—Fertilizer sales, by type 23
4.5—Location of principal fertilizer supply source, by percentage of fertilizer traders 24
4.6—Breakdown of costs of obtaining fertilizer by trader 25
4.7—Breakdown of customers for fertilizer traders 26
5.1—Household characteristics of farmers in survey sample 29
5.2—Engagement in off-farm income-generating activities and agricultural experience of household head, farmland characteristics 29
5.3—Maize, rice, and vegetables: Proportion producing crop and using fertilizer on crop (in percentages) 30
5.4—Crop management characteristics, by crop and fertilizer use on crop 30
5.5—Fertilizer use, by crop 31
5.6—Farmer access to fertilizer 32
5.7—Fertilizer purchases by farmers 32
5.8—Transport of fertilizer from dealer to farm and time from purchase to application 33
Figures
2.1—Total annual fertilizer imports for Tanzania, 2006–2010 5
2.2—Components of the average price of fertilizer delivered to several up-country centers in Tanzania, 2006, in US dollars per mt 7
Box
3.1—The Fertilizers Act of 2009: Key elements 12

v
ABSTRACT
Inorganic fertilizer is one of a handful of agricultural technologies that have immense potential for raising the productivity of poor smallholders, enabling them to increase income, accumulate assets, and set themselves economically on a pathway out of poverty. This paper presents the results of a broad study of fertilizer supply to smallholder farmers in Tanzania that was done to assess whether the taxes (explicit or implicit) that are applied at various points along the fertilizer importation and marketing chain or the absence of key public goods and services reduces the access that smallholder farmers have to fertilizer. The study involved a review of the literature of fertilizer supply, demand, and use; interviews with key participants in fertilizer importation and marketing in Tanzania; and two surveys—one with farmers and the other with input suppliers—in three farming areas where more fertilizer is used than is the norm for the country as a whole.
The broad finding is that the government of Tanzania has taken some action that has been conducive to improving farmer access to fertilizer. Although the pool of importers and wholesalers of fertilizer in Tanzania remains quite small, a competitive market exists. Efforts are being made to strengthen the retailing sector of agricultural inputs by building the commercial skills of private traders. Although Tanzania provides an expensive fertilizer subsidy for several million smallholder farmers, the design of the subsidy program, when compared to such programs in other African countries, generally does not work against the interests of private fertilizer firms. Although a few direct taxes and fees on fertilizer supply activities remain that seem difficult to justify, in general fertilizer importation and marketing activities in Tanzania are relatively unencumbered in this regard.
But there are areas where government inaction is having an adverse effect on efforts to increase use of fertilizer. The most important of these missing public goods is not specific to fertilizer but is implicated in broad efforts for increased economic growth in Tanzania—extending the transportation infrastructure; upgrading Dar es Salaam port; and enhancing access to credit for small enterprises, including farmers; among others. However, there are several fertilizer-specific initiatives that the government of Tanzania should undertake to enhance farmer uptake:
• Overcoming information constraints that smallholder farmers who might use fertilizer face. This includes information both about the proper agronomic use of fertilizer on specific crops under specific agroecological conditions and about the proper economic use of fertilizer under changing input and output market conditions so that farmers can derive reliable profits from their use of the technology.
• Regulatory reform. A considerably lighter regulatory regime than what is now under consideration would allow more fertilizer into Tanzania, resulting in lower costs for farmers. We argue that efforts to ensure the quality of fertilizers in open and competitive markets are best achieved through self-regulation processes tied to sufficient information about product quality for farmers and ample choice in suppliers, rather than through heavy regulation and costly enforcement.
• Addressing agricultural development policy inconsistencies. It is illogical that the government of Tanzania spends a substantial portion of its budget on fertilizer subsidies at the same time as it restricts the market for the maize and rice produced using that fertilizer by closing its borders to trade in staple foods in the interest of national food security. Strengthening agricultural output markets for Tanzanian farmers, both domestically and regionally, is as important to sustainably increasing uptake of fertilizer by farmers as undertaking any fertilizer-specific initiatives. The government of Tanzania must seek other mechanisms to ensure national food security than restricting output markets for its farmers.
Keywords: fertilizer supply, agricultural input policy, Tanzania

vi
ACKNOWLEDGMENTS
This research was carried out using financial support from the Alliance for a Green Revolution in Africa (AGRA) that was granted for a three-country study of inorganic fertilizer supply in Uganda, Tanzania, and Mozambique. We are particularly grateful to Dr. Augustine Langyintuo of AGRA for his support.

1
1. INTRODUCTION
Most of the poor in Tanzania, as throughout Africa south of the Sahara, are members of rural farming households. To escape poverty in a sustainable manner, households must enter into a process of savings and accumulation of productive assets whereby, based on the returns in income over time to those assets, they are able to enter a pattern of continual improvement in their welfare and move out of poverty. A key factor that enables smallholder farming households to enter into this beneficial pattern of household economic growth is enhanced agricultural productivity to increase the economic returns that they enjoy from their agricultural assets. Without improving the productivity of the assets that they possess, households are unable to save and accumulate, produce little, and are unable to invest in assets to increase their scale of household economic production. They remain in poverty, stuck in what is often termed a poverty trap (Carter and Barrett 2006).
Where insufficient plant nutrients in the farming system are limiting production, inorganic fertilizer is a technology that can be used at all scales of agricultural production—from the small vegetable plot to large plantations—to enhance production. As such, fertilizer is seen as one of a handful of agricultural technologies that have immense potential for raising the productivity of poor smallholders, enabling them to increase income, accumulate assets, and set themselves economically on a pathway out of poverty. However, poor farmers face important cash constraints within a context of limited credit availability. The poorest generally are unable to save sufficient cash from one cropping season to the next to enable them to purchase fertilizer. During the past 50 years, overcoming these constraints on access by smallholders to fertilizer has received considerable attention by policy researchers and governments through a range of interventions.
The study reported on here is in line with these efforts: The focus is on identifying where the policies of the government of Tanzania on fertilizer importation and marketing increase the farm gate cost that smallholder farmers pay for fertilizer and, thereby, inhibit their profitable use of the input. The policies of interest include any duties, taxes, fees, or other charges that are levied on the fertilizer importation and marketing chain actors, costs that they will then pass on to the end user—the smallholder farmer. However, in addition to these direct additional costs, this study considers where government has not sufficiently invested in public goods to facilitate the access of farmers to fertilizer. These inadequate or missing public goods might include insufficient and costly transport infrastructure, poor quality or missing information related to fertilizer—whether in fertilizer markets or for farmers seeking to maximize the efficiency with which they use the costly input on crops on their farm to derive maximum profits, or deficient institutions involved in promoting fertilizer use or regulating fertilizer trade.
The economics of fertilizer use by many Tanzanian smallholder farmers can be challenging. In 2008, only 9 percent of farmers in Tanzania regularly used the input on their crops (National Bureau of Statistics [NBS] et al. 2010), although this level can be expected to have gone up in recent years with the agricultural input subsidy program in place since then. This rather low prevalence of fertilizer use by smallholders is evidence that farmers find it difficult to access the correct inorganic fertilizers for their particular crops at a price that will allow them to obtain sufficient and reliable returns from their investment in the input. There are several reasons for this.
• The input is costly, being a bulky commodity produced overseas and shipped inland from Dar es Salaam principally by expensive road transport.
• Information for farmers about how they can make most efficient and profitable use of fertilizer is limited. Although there is a better understanding of yield response patterns to the application of inorganic fertilizer for the major crops grown in Tanzania than in many of its neighboring countries, what knowledge exists is not communicated in a manner that can be understood easily by farmers or by agricultural extension staff.

2
• Inadequate or costly credit markets and significant household cash constraints present added barriers to fertilizer use by smallholder farmers. The deficiencies in Tanzanian credit markets also make it difficult for fertilizer suppliers and traders to efficiently supply fertilizer at low cost.
• On the crop output side, there are substantial risks to fertilizer use. Farmers may not obtain the returns in crop yields or revenues from crop sales necessary to pay for the fertilizer used. − Rainfed, low-input agriculture is inherently risky. Although the important cropping areas
of Tanzania, particularly in the Southern Highlands, have high potential productivity with infrequent crop failure, variability in seasonal rainfall is an added source of risk in the use of fertilizer.
− Output markets are volatile. For staple foods in Tanzania, cycles of crop surpluses and deficits commonly follow crop price booms and busts, respectively. Government policies about crop marketing have proven to be inconsistent in recent years, with farmers sometimes prevented by government directive from exporting the staple foods that they produce. Uncertain crop prices make it difficult for farmers using fertilizer to be confident that they will obtain a sufficient return from the sale of the additional harvest that they obtain from the use of fertilizer to pay for the input. Many of the staple food crops grown in Tanzania are not extensively traded regionally. In consequence, local crop production conditions affecting supply principally determine the prices that farmers receive for these less widely traded crops.
• Finally, although many rural areas of Tanzania are densely populated, the country as a whole still has uncultivated arable land, even if it may not be of high production potential—about 40 percent of the total land area is put to agricultural use (World Bank 2011). It generally will be less costly for farmers in Tanzania to open new land to cultivation to produce more crops than to invest in yield-enhancing technologies, such as fertilizer, on existing land. In those areas of Tanzania, particularly in the high potential zones in the Southern Highlands, around the northern mountains, and in northwestern Tanzania, where uncultivated arable land generally is not available to bring into production, the output prices for crops that are traded in local markets nonetheless will be determined in part due to the integration of crop markets across Tanzania, by the lower costs of production in the land-surplus areas.1 The lower output prices for staple food crops that result render profitable use of fertilizer on such crops by all smallholders in Tanzania more difficult to achieve. The government of Tanzania has adopted a quite consistent interventionist approach to the use of
fertilizer by smallholder farmers. From the late 1960s to the early 1990s, the government held a monopoly on fertilizer importation and marketing. During the period of its monopoly, the government regularly provided significant subsidies on fertilizer using various mechanisms. However, in the face of high fiscal costs and inefficiencies, in 1994, the government liberalized agricultural input markets. With the liberalized market, no subsidies were offered for several years. Starting in the early 2000s, however, subsidies on transport of fertilizer were provided to dealers. Then in 2008 a more ambitious subsidy scheme at the farmer level, the National Agricultural Input Voucher Scheme (NAIVS), was introduced for maize and rice production and continues, covering about half of the districts of the country, primarily in high agricultural potential areas. A total of 1.5 million farmers in 2009/10 and 2 million in 2010/11 were to benefit from NAIVS, out of an estimated 2.5 million eligible farmers nationally.
It is within this challenging economic context of fertilizer use by smallholder farmers and the strong intervention by the government of Tanzania in fertilizer supply that this study is situated. Its focus is on private-sector procurement of fertilizer for wholesale or retail trade and how smallholder farmers then access that fertilizer offered by traders.
1 This relationship will not apply to internationally traded cash crops as their prices are determined in the international market and not in Tanzanian or regional markets.

3
Problem Statement and Design and Organization of Study The policies of the government of Tanzania on fertilizer importation and marketing, including any subsidies that they offer farmers, can either promote or inhibit the profitable use of fertilizer by smallholder farmers. Where policies are shown to increase the farm gate price for fertilizer, a close assessment should be made of the social value of such policies. This paper presents the results of a broad study in Tanzania of fertilizer supply to smallholder farmers to assess whether the taxes (explicit or implicit) that are applied at various points along the fertilizer importation and marketing chain or the absence of key public goods and services inhibits the efficiency with which those chains operate and reduces the access that smallholder farmers have to inorganic fertilizer. The evidence offered by this study is to support efforts by the Tanzanian government to streamline its engagement in fertilizer importation and marketing chains to improve the profitability of fertilizer use by smallholder farmers.
The overall objective of the study is to investigate supply-side constraints for fertilizer use by smallholder famers in Tanzania in which the government is implicated. However, this objective is met in an indirect manner by taking a broader look at how fertilizer is supplied to smallholder farmers and how they do or do not make use of it. So although the objective is to determine which policy changes might reduce fertilizer costs for farmers, the identification of these policy changes is done through a broad assessment of how the input is supplied. Inefficiencies in activities related to supply and information deficiencies will be identified, as will regulations on fertilizer supply that are poorly designed for accomplishing their intent.
The principal data collection activities in this study were as follows: • First, quite an extensive review of the literature on fertilizer supply, demand, and use in
Tanzania was undertaken. • About 20 interviews were conducted with key participants in fertilizer importation and
marketing in Tanzania, primarily in Dar es Salaam. • Finally, two surveys were conducted in three farming areas of Tanzania where more fertilizer
is used by smallholders than is the norm for the country as a whole—the Hai district in the western Kilimanjaro region, the Iringa rural district in the Iringa region, and the Songea rural district in the Ruvuma region. Maize is the principal crop receiving fertilizer in all three study areas. (See Figure 1.1 for a map of the locations of the study areas.) − A total of 31 traders based in market centers in the study areas were interviewed using a
questionnaire containing about 210 questions. Both large- and small-scale traders were interviewed.
− A questionnaire of about 230 questions was administered to a sample of 193 smallholder farmers in the farming areas of the study, primarily fertilizer users, which focused on their cropping practices and, for users, how they acquired and made use of fertilizer.
The presentation in this paper draws on these data sources in a somewhat sequential fashion. The following section provides an overview of fertilizer use in Tanzania drawing from the literature review, interviews, and available data. Following this overview, the information collected through the interviews of key participants in the fertilizer importation, distribution, and marketing chain in Tanzania is used to more closely describe how fertilizer is brought into the country and made available to farmers. The results from the trader survey are then discussed in some detail, followed by a similar discussion of the results of the farmer survey. The final section reviews some of the key policy and market issues emerging from the study.

4
Figure 1.1—Study areas for trader and farmer surveys in Tanzania
Source: Authors’ surveys.
Finally, it should be highlighted that considerable fertilizer is used in Tanzania by large-scale agricultural plantations or through the contract farming systems that some of these large-scale agricultural firms manage—tea, sugar cane, sisal, and tobacco, most notably. These firms generally import their fertilizer stocks directly or through tenders let to fertilizer importers and do not participate greatly in the fertilizer distribution and marketing chains serving smallholder farmers. However, this study does not consider this important component of fertilizer use in Tanzania, focusing rather on the supply of fertilizer to smallholder farmers.

5
2. OVERVIEW OF FERTILIZER SUPPLY AND USE IN TANZANIA
In this section of the paper, we review the amount of fertilizer available annually in Tanzania and consider the costs that farmers face in obtaining fertilizer based on the buildup of costs in delivering fertilizer to the up-country fertilizer retailers from international suppliers. Finally, since NAIVS is presently the dominant source of demand for fertilizer in Tanzania, we provide a brief overview of the scheme.
Fertilizer Quantities Except for Minjingu Rock Phosphate (MRP), currently all of the inorganic fertilizer used in the country is imported. The annual total fertilizer imports into Tanzania as recorded by the Tanzania Revenue Authority between 2006 and 2010 are graphed in Figure 2.1.2 This chart disaggregates imports of fertilizer by broad type less re-exports to other countries in the region. There has been considerable volatility in the amount of fertilizer imported into Tanzania during the past 20 years. Much of this volatility is due to the putting in place and withdrawal of subsidy programs. For example, total imports of nutrients during the period from 1992 to 2000 varied between 20,000 and 42,000 metric tons (mt). However, without any fertilizer subsidy in place, in 2001 and 2002, imports fell to about 10,000 mt. Imports rebounded and increased significantly to 160,000 in 2004 with the introduction of a new subsidy program (Chemonics International and International Center for Soil Fertility and Agricultural Development [IFDC] 2007). The increase in 2008 in fertilizer imports shown in Figure 2.1 corresponds with the introduction of NAIVS.
Figure 2.1—Total annual fertilizer imports for Tanzania, 2006–2010
Source: Tanzania Revenue Authority import-export database. Note: mt = metric tons; NPK = Nitrogen Phosphorous Potassium; DAP = Diammonium Phosphate.
2 Figure 2.1 shows fertilizer imports on the basis of fertilizer product quantities, not nutrient quantities. Based on the mix of
fertilizers reported in the trader survey, the average total N, P2O5, and K2O nutrient content of fertilizers imported to Tanzania is about 45 percent. On this basis, imports of nutrients recently have amounted to about 120,000 nutrient tons annually.
The data used in Figure 2.1 were obtained from James J. Mbunda and his team at the Modernisation & Quality Assurance Unit of the Customs and Excise Department, Tanzania Revenue Authority, in Dar es Salaam. We are grateful for their assistance.
0
50,000
100,000
150,000
200,000
250,000
300,000
2006 2007 2008 2009 2010
Annu
al fe
rtili
zer i
mpo
rts,
mt
Re-exports (all types)
NPK blends
Potassium products
Phosphorus (including DAP)
Nitrogen products

6
Nitrogen fertilizers make up the bulk of imports—61 percent of all fertilizers imported during this period. Of the specific types of fertilizer imported, urea constitutes the largest portion—during the period from 2006 to 2010, 35 percent of all fertilizer imported and 58 percent of all nitrogenous fertilizers were urea. Nitrogen Phosphorous Potassium (NPK) blends make up the second most common type of fertilizer imported, with 21 percent of fertilizer imports. Diammonium Phosphate (DAP) is the principal phosphate fertilizer, accounting for almost 90 percent of all such fertilizers and 8.5 percent of all fertilizer imports. Very little potassium fertilizer is imported into Tanzania.
Briefly considering the fertilizer produced in Tanzania, MRP is produced by the Minjingu Fertilizer Company from its mine just east of Lake Manyara in northern Tanzania.3 The phosphate deposit at Minjingu has a P2O5 content of between 22 and 25 percent, with reserves estimated at more than 9 million metric tons (van Straaten 2002). The fertilizer company beneficiates the phosphate ore mechanically to a P2O5 content of between 28 and 30 percent and granulates the product. In agronomic response, MRP has been shown to be comparable to Triple Superphosphate, particularly on relatively acid soils, and is considered to be among the highest-quality rock phosphates exploited in Africa. However, the agronomic response is not observed immediately—often the major crop response is obtained in the season following application. Consequently, farmer demand for MRP is lower than might be desired—this in spite of the cost per unit of P2O5 being 35 percent less for MRP than for the principal phosphate fertilizer used in Tanzania, DAP. In consequence, although the processing factory has an installed annual production capacity of 100,000 metric tons, in an interview for this study the general manager of the firm reported that current use is only 20 percent of capacity. In part to address the problem of lower demand for the straight MRP product due to the delayed response farmers see, the company installed blending machinery to produce an MRP blend with urea, Minjingu mazao. The additional nitrogen promotes an agronomic response that is comparable to that seen with the principal basal fertilizer used by farmers, DAP. Minjingu mazao has a nutrient content of about 10:25:0 or about half the nutrient content of DAP (18:46:0) per unit of product—two bags of Minjingu mazao are needed to substitute for one of DAP.
For application rates of fertilizer, the average of 250,000 mt of fertilizer used in recent years in Tanzania corresponds to national per-hectare (ha) application levels of about 7 kg per hectare (kg/ha) for agricultural land and 25.5 kg/ha on arable land.4 Relative to other countries in the region, these application rates are in the middle of the range—less than Kenya and Malawi but considerably more than Uganda and Mozambique. The preliminary report for the National Sample Census of Agriculture 2007/08 reports that only 7.2 percent of smallholder cropped area in the long rains of 2008 received inorganic fertilizer and 9.2 percent of smallholders who planted annual crops in the same season applied any inorganic fertilizer (NBS et al. 2010). The regions in which the greatest proportion of annual cropland received fertilizer in that season were Kilimanjaro, Ruvuma (Songea), Iringa, and Mbeya, with between 23.6 and 28.2 of annual cropland in these regions receiving fertilizer. Although this prevalence of fertilizer use will certainly have increased in recent years with the implementation of NAIVS since the last agricultural census, levels of use are still relatively low among smallholders, particularly in low
3 Nitrogen fertilizers could potentially be produced in Tanzania. Proven natural gas reserves of 6.5 billion cubic meters are
found near offshore the Indian Ocean coast of southern Tanzania. Although these are now being exploited for electricity generation, they also could form the basis for nitrogen fertilizer production. The principal requirement for the production of nitrogenous fertilizer is energy since the nitrogen is freely obtained from the atmosphere. However, the Haber-Bosch process used for nitrogen fertilizer production is a high-pressure and high-temperature process that is characterized by significant economies of scale. A nitrogen fertilizer production complex requires a start-up investment of more than $500 million. To be profitable, minimum production levels from such factories are 1,500 mt per day, far exceeding Tanzania’s national demand today (Gregory and Bumb 2006). Although technically Tanzania could be a producer of nitrogen fertilizer, it is likely that current demand both nationally and regionally is insufficient for profitable returns to be obtained from such an investment. However, with expansion of demand nationally and regionally, in time sufficient scales of production might be obtained for profitable operation. As such, the economics of the use of Tanzania’s natural gas for nitrogen fertilizer production should be regularly assessed.
4 Agricultural land is defined as land that is arable, under permanent crops, or under permanent pasture. Arable land is land under temporary crops (double-cropped areas are counted once), temporary meadows for mowing or for pasture, land under market or kitchen gardens, and land temporarily fallow (World Bank 2011).
7
potential farming systems where maize is not dominant and subsistence production is the principal objective for farmers. In spite of increasing uptake of inorganic fertilizer during the past 10 to 20 years and recent acceleration of this uptake with the NAIVS program, fertilizer use by smallholder farmers in Tanzania remains more the exception than the rule.
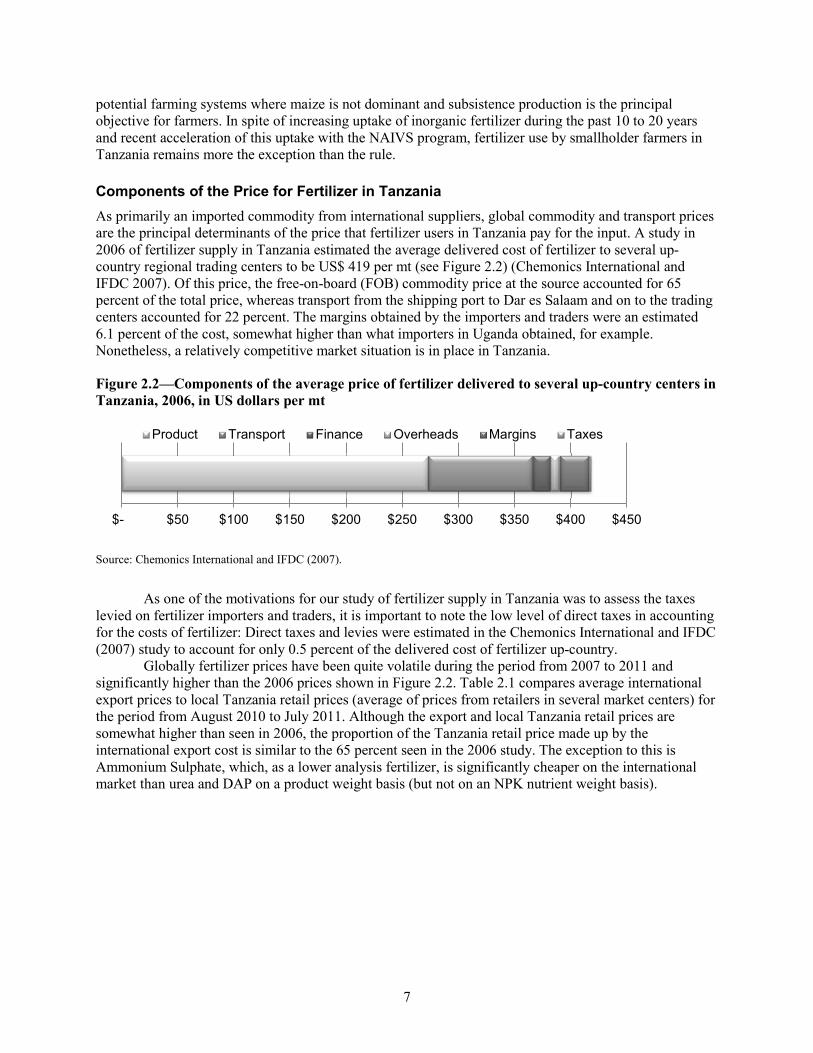
Components of the Price for Fertilizer in Tanzania As primarily an imported commodity from international suppliers, global commodity and transport prices are the principal determinants of the price that fertilizer users in Tanzania pay for the input. A study in 2006 of fertilizer supply in Tanzania estimated the average delivered cost of fertilizer to several up-country regional trading centers to be US$ 419 per mt (see Figure 2.2) (Chemonics International and IFDC 2007). Of this price, the free-on-board (FOB) commodity price at the source accounted for 65 percent of the total price, whereas transport from the shipping port to Dar es Salaam and on to the trading centers accounted for 22 percent. The margins obtained by the importers and traders were an estimated 6.1 percent of the cost, somewhat higher than what importers in Uganda obtained, for example. Nonetheless, a relatively competitive market situation is in place in Tanzania.
Figure 2.2—Components of the average price of fertilizer delivered to several up-country centers in Tanzania, 2006, in US dollars per mt
Source: Chemonics International and IFDC (2007).
As one of the motivations for our study of fertilizer supply in Tanzania was to assess the taxes levied on fertilizer importers and traders, it is important to note the low level of direct taxes in accounting for the costs of fertilizer: Direct taxes and levies were estimated in the Chemonics International and IFDC (2007) study to account for only 0.5 percent of the delivered cost of fertilizer up-country.
Globally fertilizer prices have been quite volatile during the period from 2007 to 2011 and significantly higher than the 2006 prices shown in Figure 2.2. Table 2.1 compares average international export prices to local Tanzania retail prices (average of prices from retailers in several market centers) for the period from August 2010 to July 2011. Although the export and local Tanzania retail prices are somewhat higher than seen in 2006, the proportion of the Tanzania retail price made up by the international export cost is similar to the 65 percent seen in the 2006 study. The exception to this is Ammonium Sulphate, which, as a lower analysis fertilizer, is significantly cheaper on the international market than urea and DAP on a product weight basis (but not on an NPK nutrient weight basis).
$- $50 $100 $150 $200 $250 $300 $350 $400 $450
Product Transport Finance Overheads Margins Taxes

8
Table 2.1—Fertilizer prices, comparison of Tanzania retail price to FOB price from international suppliers, in US dollars per mt: Average August 2010–July 2011
Local Retail
Price Inter-national Export Price
Export Price Component of Local Price (%)
Export Source
Urea (46:0:0) 592 381 64.3 Arab Gulf Ammonium Sulphate (21:0:0 + 24S) 424 190 44.7 Black Sea
Diammonium Phosphate (18:46:0) 872 573 65.8 Baltic Source: http://www.amitsa.org. Notes: mt = metric tons; FOB = free-on-board.
Although the focus of the research from which this paper was developed is on assessing whether there are taxes or missing public goods and services that account for some of the high price of fertilizers in Tanzania, it is clear that these elements of the price are relatively small. Tanzania is a price taker for fertilizer from international markets, so it can do little about that element of the landed cost of fertilizer in the country. However, there is more scope for action related to transport, in particular. This includes both improving port operations in Dar es Salaam, where virtually all fertilizer imported to Tanzania is off-loaded, and improving domestic transport infrastructure to reduce the costs of distribution after the fertilizer comes into the Dar es Salaam port. Smaller gains can be achieved through improving access to finance by importers, reducing the overhead charges that dealers incur and removing any indirect taxes and fees levied on fertilizer importers and dealers that work against the objectives of improving agricultural productivity and the profitability of farming for Tanzanian smallholders.
National Agricultural Input Voucher Scheme As was highlighted in the introduction, the government of Tanzania has invested considerable resources since the early 1970s to promote the use of fertilizer by smallholder farmers. The justification for these investments was and continues to be to achieve both national agricultural development and food security objectives. Government established a parastatal corporation, the Tanzania Fertilizer Company, to manage fertilizer procurement, distribution, and after building a fertilizer factory in Tanga (now defunct), production. The government, working with the Tanzania Fertilizer Company and government-managed crop-marketing institutions, implemented various fertilizer provision schemes through which fertilizer was provided to farmers at sharply subsidized prices. Consumption levels nationally increased from about 10,000 mt annually in the late 1960s to 30,000 mt in the late 1970s to 45,000 mt in the late 1980s (FAO 2011). However, these efforts were costly and generally implemented inefficiently.
As part of broader efforts to reduce the scope of government in the economy and promote private-sector investment, the Tanzanian government withdrew from its monopoly position and liberalized input markets. Several private firms quickly entered the market, importing stocks from international fertilizer manufacturers and selling from their wholesale depots in Dar es Salaam or through their own up-country depots. Some developed their own retail networks. Several of these early entrants remain important importers and wholesalers of fertilizer. Notably, the Tanzania Fertilizer Company, still government owned, has stayed in business in this competitive market environment. However, in spite of the relative success of the liberalization of fertilizer markets in Tanzania, there appears to have been a falling off in fertilizer consumption through the 1990s, although the data are not consistent.
Following the opening of input markets to the private sector, the government did not strongly intervene in fertilizer supply for several years. Starting in 2003, the government developed a program to offer subsidies to input suppliers on the transport costs that they faced, plus some subsidy on part of the fertilizer (Msolla and Masagasi 2010). As this was done to ensure that the prices farmers faced for their fertilizer were reduced, price enforcement mechanisms were established for the subsidized fertilizer. The transport subsidy program ran through 2007 but generally was found to be inefficient, with many farmers

9
not having access to the subsidized fertilizer; many dealers not having sufficient financial resources to acquire an inventory of subsidized fertilizer or, if they had fertilizer, possessing little information to guide farmers on how to make profitable and productive use of the subsidized fertilizer they offered; and delays and other bureaucratic bottlenecks occurring (World Bank 2009).
In 2007/08, a pilot of a more ambitious subsidy scheme that provided the subsidy directly to farmers in the form of vouchers for use in obtaining fertilizer and improved seed, the National Agricultural Input Voucher Scheme (NAIVS) was successfully conducted. The scaled-up program was launched in the 2008/09 long rains (first season) with about 750,000 farmers in 53 districts in high agricultural potential areas of the Southern Highlands (districts in the Iringa, Mbeya, Rukwa, Ruvuma, and Morogoro regions), the Northern Highlands (Arusha, Manyara, and Kilimanjaro), and a few districts in the Tabora and Kigoma regions (World Bank 2009). The program was designed to cover 65 districts and 2.5 million farmers in these high potential areas during a six-year time horizon. In implementation, NAIVS expanded to 74 districts in 2009/10 (World Bank 2010a) and 87 districts in 2010/11. Farmers in the project areas can receive vouchers for up to three years, after which they are expected to have generated sufficient additional productivity from their use of the fertilizer and improved seed to finance future input purchases themselves. The peak years for the program as designed should have been 2009/10, when greater than 2 million farmers were to have received vouchers, and 2010/11, with 1.8 million beneficiaries. The current program is to wind up in 2013/14.
Farmers are selected for the voucher scheme by a Village Voucher Committee using a set of criteria that include, among others, the recipient’s being a full-time farmer with a maize- or rice-cropping area of less than one hectare and the ability to manage the cofinancing required to obtain the subsidized inputs. Given the still significant cash outlay required from beneficiaries, in essence the program is targeting middle-income smallholders. Selected farmers are provided with vouchers covering half of the cost of inputs sufficient for application to 0.4 ha (one acre) of maize or rice that they redeem with local private input dealers (Msolla and Masagasi 2010). The vouchers enable farmers to acquire at a 50 percent subsidy either one 50-kg bag of DAP or two 50-kg bags of the Minjingu mazao blend of MRP for a basal dressing, one 50-kg bag of urea for top-dressing, and either 10 kg of improved maize seed (open pollinated variety or hybrid) or 16 kg of rice seed. Farmers take the vouchers to local input dealers to acquire the inputs. The input dealers then take the redeemed vouchers for reimbursement to a branch of the National Microfinance Bank, which was contracted to manage voucher redemptions.
NAIVS also seeks to strengthen agricultural input dealers in the program areas as well as the input market in Tanzania more generally. Only dealers who have received business training, technical instruction on proper input marketing and use, and training on crop output marketing through the Tanzania Agro-dealer Strengthening Program, implemented by the Tanzania Agricultural Market Development Trust (TAGMARK) and its international affiliate, the Citizens Network for Foreign Affairs (CNFA), were authorized to accept vouchers and submit them for reimbursement (World Bank 2010a). Overall, 3,000 dealers were to receive training in the NAIVS program areas during the course of the program. A certificate of having received such training was also required for agricultural input dealers to obtain loans from commercial lenders to build sufficient fertilizer and seed inventory to respond to demand from NAIVS voucher holders (World Bank 2009).
At the importation and wholesale level, the government, through the NAIVS secretariat, the Agricultural Inputs Section of the Crop Development Department of the Ministry of Agriculture, Food Security, and Cooperatives, informed the key importers of fertilizer into Tanzania of the expected demand at the district level for fertilizer under the NAIVS program for the following season so that importers would obtain the stocks required and position them accordingly in a timely fashion. The government of Tanzania has itself not engaged in any procurement or distribution of fertilizer under the NAIVS program.
For the added fertilizer demand created by the NAIVS program, at the maximum of 2 million farmer beneficiaries in a program year, 100,000 mt of urea and some combination of up to 100,000 mt of DAP or up to 200,000 mt of the Minjingu mazao MRP blend is required by the program. Although these voucher sales will displace some sales that would have taken place in the absence of the program, nonetheless the fertilizer used in Tanzania has increased substantially under the program. The increase in
10
net fertilizer imports of about 100,000 mt annually between 2007 and 2009 shown in Figure 2.1 can be attributed principally to NAIVS.
NAIVS represents a major investment on the part of the government of Tanzania and its development partners, particularly the World Bank. Total annual costs of the project are estimated at US$100 million. For the three years from 2009/10 to 2011/12, 53 percent of the cost of the project is to be covered by a credit from the World Bank, with the balance coming from the government of Tanzania directly (World Bank 2009).
In the course of this study, several concerns with NAIVS implementation were highlighted: • Retailers who present for reimbursement to the local National Microfinance Bank branch the
vouchers that they have received frequently face delays of several weeks. This slows the entire fertilizer wholesaling system, as wholesalers are unwilling to provide retailers with additional stock until any credit is paid on fertilizer provided previously.
• There is some concern about a parallel market having developed for vouchers. For many farmers, the subsidy is not large enough, so they are unable to make up the cash balance for the fertilizer. The farmers may seek to sell their vouchers to those who can obtain reimbursement for them. Although the parallel market will benefit these poor farmers economically, it will not contribute to sustainably increasing agricultural productivity in the country, which is the objective of NAIVS. However, objective evidence of the scale of any such parallel market for vouchers is not available.
• Although farmer selection for NAIVS is seen as quite transparent, some observers mentioned the possibility of political interference in the selection of stockists who could receive the vouchers.
• Finally, some reports were received of delays in program rollout resulting in delays in fertilizers’ being in place in program areas until after the proper application period at planting.

11
3. SUPPLY—FERTILIZER IMPORTATION AND MARKETING IN TANZANIA
In this section, three elements of fertilizer supply in Tanzania are considered. The first is the legislation that governs importation and trade of inorganic fertilizers in the country. It is these laws that justify the regulatory framework that the Ministry of Agriculture, Food Security, and Cooperatives is putting in place and under which fertilizer importers and traders operate. The second element considered is the operations of fertilizer importers. This information is principally derived from a series of qualitative interviews conducted with fertilizer importers and others who oversee or are affected by their operations. The final element of this section is a brief discussion of the general pattern of fertilizer retailers across Tanzania. This final subsection is relatively brief since considerably more detail on fertilizer traders is provided in the following section where the results are presented of the fertilizer trader survey conducted for this study.
Legislation The Fertilizers Act of 2009 was enacted to regulate the importation, distribution, storage, and marketing of fertilizer in Tanzania. The broad thrust of the act is to ensure that the fertilizers that farmers in Tanzania obtain for use are of the quality advertised. Although the act applies to all fertilizers, in its details it focuses on industrially produced fertilizers, which are primarily inorganic. The act was reported to have been jointly developed by the Ministry of Agriculture and the private sector dealing in fertilizer, and it had a particular focus, according to informants from the ministry, on ensuring continuing monitoring of the quality of fertilizer offered for sale in the country after it had cleared the port of importation. The principal officer at the Ministry of Agriculture concerned with drafting the act stated in an interview that more specifically, it was developed to respond to complaints received from farmers about poor quality fertilizers’ being sold. The 2009 act replaces the much more succinct but broad Fertilizers and Animal Foodstuffs Act of 1962. Box 3.1 discusses the key characteristics of the 2009 Act.
The 2009 act establishes a framework for a comprehensive set of regulations to govern how fertilizers are to be made available to Tanzanian farmers. These regulations are to be developed by the Ministry of Agriculture to define how the act is to be implemented in practice. Although draft regulations have been developed, they still have not been approved by the Minister of Agriculture. In consequence, many of the details of the regulatory regime are not yet in place—notably, the establishment of the Tanzania Fertilizer Regulatory Authority (TFRA).
The principal elements of the 2009 act are that all fertilizers manufactured, imported, or sold in Tanzania must be registered, packed, and labeled in accordance with the act. All dealers in fertilizers must be registered, with a minimum level of knowledge concerning the management and use of the products in which they deal. Finally, all premises used for activities related to fertilizers also must be registered. Importation of fertilizers into Tanzania, as well as exports of fertilizer from the country, requires a permit. Such permits will be given only to registered fertilizer dealers who seek to trade in registered products. Agricultural inspectors are to be put in place to enforce these regulations to ensure that the quality of the fertilizer is as stated on the label and that this quality is maintained along the marketing chain.
TFRA is to be responsible for the implementation of the act and the regulations that are to be developed. In the absence of the new regulations, the principal office responsible for overseeing the implementation of laws and regulations governing fertilizer quality and fertilizer commerce is the Agricultural Inputs Section of the Crop Development Department of the Ministry of Agriculture, Food Security, and Cooperatives. However, section staff noted in interviews that their principal function for regulation of the fertilizer industry is to monitor the availability, distribution, and use of fertilizer in the country. To do so, they regularly check with the principal importers and wholesalers of fertilizer to determine their stock balances and importation plans. The Agricultural Inputs Section also issues import permits for nitrate fertilizers.5 Other fertilizers do not require import permits under existing regulations. Quality monitoring is not a key aspect of section staff’s work under the current pre-TFRA arrangement.
5 This permitting process is to certify that the nitrate product being imported is specifically for agricultural purposes.

12
Rather the quality of fertilizer is established at the port on importation by the Tanzania Bureau of Standards (TBS). No provision is made for further quality checks as the fertilizer moves through the marketing chain to the farmer.
Box 3.1—The Fertilizers Act of 2009: Key elements
• “An Act to make provisions for regulation of manufacturing, importation, exportation, sale and utilization of agricultural fertilizers.”
• By the 2009 act, the Fertilizers and Animal Foodstuffs Act of 1962 was repealed. The contents of the two laws are quite different, however. The earlier act makes little distinction between fertilizers and components of animal feed and puts in place principally a truth-in-labeling set of legislation to regulate their commercialization. o The earlier act does not cater to the many administration and licensing elements related to fertilizer distribution
that are provided for in the 2009 act. o The 1962 act contains several schedules stipulating the standards expected for all fertilizers (and animal
foodstuffs) imported, manufactured, or sold in Tanzania. These standards are not part of the 2009 act but shall be specified in regulations that the minister responsible for agriculture will make on the advice of the Tanzania Fertilizer Regulatory Authority (TFRA) or its board (section 51.[2][i] and 51.[2][r]).
• Fertilizer is defined as “any substance or mixture of substances, containing one or more of nitrogen, phosphorus, potassium or other elements represented for use as a source of plant nutrients.”
• The act establishes TFRA as the regulatory body in the fertilizer industry. Its functions are to include the following: o Regulate all matters relating to fertilizer quality. Inspect fertilizer for quality assurance. Fertilizer inspectors and analysts will be appointed by the minister to serve under the direction of the TFRA
director. An inspector is permitted to enter and examine any premises or vehicles where he or she has reason to believe fertilizer activities are being undertaken, collect and have tested samples of any fertilizer obtained through inspections, collect documentation of fertilizer activities, and issue ”stop sale” notices if he or she believes the provisions of the act are being violated.
o Regulate and control the importation, production, transportation, sale, storage, and disposal of fertilizer. o Register and license all fertilizer dealers and their premises. Fertilizer is not permitted to be manufactured, stored, or sold in Tanzania except by registered and licensed
dealers working from registered premises. o Issue permits for importing and exporting fertilizer. o Maintain a register of approved fertilizers. All fertilizer imported and sold in Tanzania must be registered, packed, and labeled as prescribed by the act
or the regulations established under the act. Its quality must correspond to the composition and efficacy stated in the registration of the product.
o Regulate fertilizer prices based on directives that shall be set out in appropriate regulations. • The act establishes a board for TFRA that will do the following: o Advise the minister responsible for agriculture on all matters relating to fertilizer, including legislation. o Provide recommendations to the minister about the types of fertilizers to be used in the country. o Establish a technical committee of a number of competent persons on fertilizer matters. o Through a schedule to the act, establish the composition of the TFRA board. It includes representatives from
research institutions, the private sector, farmers, and the government, including a representative from the Tanzania Bureau of Standards.
• Financial provisions for TFRA are established and include “any moneys raised by way of fee or charges imposed under the provisions of this Act.”
• “The Minister shall … make regulations for the better carrying into effect of the provisions of this Act.” o It is these regulations that shall specify the details of the fertilizer regulatory regime for Tanzania—registration
qualification requirements and procedures; proper practices for fertilizer management, packaging, and labeling; fertilizer quality standards and testing procedures; and minimum qualifications and specific duties of inspectors and analysts, among others.
• The act was enacted by Parliament and approved by the President of Tanzania.
Source: Summarized from The Fertilizers Act of 2009 by authors.
13
Establishment of TFRA will considerably scale up oversight on the fertilizer sector in Tanzania. In addition to a national office for the authority, the head of the Agricultural Inputs Section of the Ministry of Agriculture stated that two part-time inspectors will be trained from the staff of the District Councils in each of the more than 125 districts in Tanzania. These inspectors will randomly sample fertilizer sold in the district, submitting it for laboratory analysis, and investigate any local complaints related to fertilizer quality. TFRA, working with its district-level inspectors, will manage the registers for fertilizers, for dealers and manufacturers, and for premises, and will be responsible for issuing any permits for trade in fertilizer.
In reviewing the legislation on fertilizer, at least three issues of a policy nature arise. These are the evidence base on which the new legislation was developed, a role for TBS in regulating and enforcing fertilizer quality and safety, and finally, costs related to the bureaucracy to be put in place that provide only limited public benefits.
First, there is no nationally representative, objective evidence about the degree to which adulterated fertilizers are sold in Tanzania. No rigorous assessment has been done of the prevalence of poor-quality fertilizer in the Tanzanian market. Fertilizer is a bulky, relatively low-value-to-weight product, so it is not a first-choice product for agricultural input traders to adulterate—adulteration of pesticides and seeds would, on the face of it, be more lucrative for criminal traders. Yet anecdotal reports of a high level of adulterated fertilizer were reported by respondents in the study to be the principal basis for the design of the enhanced regulatory regime on fertilizer to be put in place. As such, the basis for the Fertilizers Act of 2009 consists of unsubstantiated farmer complaints about the nonperformance of the fertilizer that they obtained. In assessing the significance of such complaints, there is no way to separate out farmers’ misuse of the fertilizer due to their possessing insufficient information about proper use or about the likely response pattern they should expect (for MRP, in particular) from poor-quality and possibly adulterated fertilizer.
The impetus for the formulation of the 2009 act is, first, anecdote and, second, a conceptual expectation that such laws are needed for the state to have instruments to regulate commerce when needed. This second motivation has some merit if the act can simply be in place, only lightly enforced, but with the more stringent aspects of it available to be called into use with egregious quality problems with fertilizer in the future. However, for the act to be implemented in a proactive manner would seem to be against the interests of fertilizer traders and farmers. Doing so would raise the cost of fertilizer either through regulation-related fees, including fees for the administrative overhead of TFRA; through the costs for traders to comply with the regulations; or by opening the door to corrupt practices as traders seek alternatives to following the regulations in the act. These costs ultimately will come out of the pockets of farmers while also resulting in some reduction in the number of farmers using fertilizer in Tanzania.
Moreover, it is important to recognize that a vibrant and competitive agricultural input market will be somewhat self-regulating of the quality of products marketed. Firms, whether wholesalers or retailers, that sell adulterated or otherwise poorly performing fertilizer are unlikely to retain their customer base in subsequent farming seasons. If the act will restrict the levels of competition by placing relatively high hurdles for firms to enter or remain in the fertilizer business in Tanzania, then the chance of adulterated product’s being sold is likely to increase.
Second, the fertilizer legislation gives just a small role to TBS, the statutory agency responsible for enforcing standards in Tanzania for public health and safety and for guarding against trade in dangerous, counterfeit, and substandard products. The bureau has established standards for about a dozen of the globally produced high-analysis fertilizers. These standards cover their physical and chemical characteristics, packaging, and required labeling (World Bank 2010b). However, the primary activity of TBS about fertilizer to date has been to establish the quality of fertilizer at the port upon importation. Although no quality checks by TBS are made further along the fertilizer distribution and marketing chain, in an interview with TBS, it was noted that it has the legal basis, the statutory responsibility, and the ability to respond to complaints or do spot checks to assess fertilizer quality between the Dar es Salaam port and the farmer’s field. TBS has market surveillance inspectors up-country who could take on this role.

14
Although convincing arguments can be made that experts in agriculture should be involved in the assessment and regulatory control of pesticides and new, nonstandardized fertilizers, this is not so for the standardized high-analysis fertilizers that have low risk to human health and security, such as those commonly used in Tanzania. TBS inspectors and laboratory analysts can be expected to be able to readily assess the quality of these fertilizers. Placing the quality assurance of high-analysis fertilizers within the responsibility of TBS, rather than the Ministry of Agriculture, would permit a much broader set of distribution and marketing channels to be used for the sale of fertilizer. However, a key complementary action to such a change in the regulatory framework would be to significantly increase the information made available to consumers about proper use of fertilizer. In sum, the Ministry of Agriculture should retain a regulatory role in the importation, sale, and use of agricultural chemicals where there is a need for specialized knowledge in ensuring public safety. However, where no such need exists, as for standard, high-analysis inorganic fertilizers, this role should devolve to the statutory agency concerned with enforcing product standards, TBS.
Finally, there are potentially significant indirect costs associated with following the regulations for the importation and marketing of fertilizer. The trader must be registered as a fertilizer dealer, which requires meeting a set of minimum qualifications. The importer must be assured that the fertilizers that he or she will be importing are registered for use in Tanzania. These regulations impose costs in time and money for the fertilizer manufacturers, importers, and traders—costs that they will recover by selling the fertilizer at a price sufficient to cover the cost of the fertilizer, plus all regulatory costs. The benefits in public health and security from imposing these sorts of regulatory costs on the importation and sale of a standardized global product such as high-analysis inorganic fertilizers are quite small. Strong consideration should be paid to streamlining this process, if not doing away with it all together, so that farmers derive the benefits of lower prices—benefits that likely exceed the value of any benefits from close regulation of fertilizer importation and marketing in Tanzania.
To summarize this discussion of the legislation, Tanzania is developing a system of control on the importation, marketing, and use of inorganic fertilizers—although the regulations are certainly better developed in their design than in their implementation due to resource constraints. However, particularly for high-analysis fertilizers that are standardized global commodities, the regulatory system as designed is excessive—both in the direct and indirect costs associated with following the regulations and in the benefits for public health, security, and welfare, which the regulations are to promote. Selective, judicious, and restrained application of existing policies and new regulations on fertilizer is needed to reduce the regulatory burden faced by importers and dealers of fertilizer in Tanzania.
Importers and Wholesalers As noted, the government of Tanzania held a monopoly on the importation and marketing of fertilizer from the late 1960s until 1994. State agencies were responsible for assessing demand, placing international orders, distributing the fertilizer obtained, and handling any subsidy or other incentive programs related to fertilizer. In addition, the government, in partnership with an international firm, built in the early 1970s and thereafter operated until the early 1990s a fertilizer factory in Tanga that made use of imported materials plus phosphate inputs from the Minjingu deposit in northern Tanzania to produce and blend fertilizer for both smallholder farmers and specialized large-scale commercial agricultural producers. This government-run system of fertilizer provision was characterized generally by inefficiencies, delays in provision of product, and high fiscal costs. As part of a broader program of structural adjustment of the public-sector role in the national economy, in 1994 the government of Tanzania opened the fertilizer market to the private sector.
Several firms based in Dar es Salaam immediately entered into the market as fertilizer importers and wholesalers, most having retail outlets up-country. Several of these remain active today, including Premium Agro-chem; Export Trading Group; Shival Tank & Company, Ltd.; DRTC; and Mohammed Enterprises. Also, the Tanzania Fertilizer Company, the government parastatal fertilizer corporation, remains in business, still wholly owned by government. In the late 1990s the international fertilizer

15
manufacturer Yara (originally Norsk Hydro) established operations in Dar es Salaam. Also, a Kenya-based fertilizer firm, Mea Ltd., has established business in the country, although at the time of the study its engagement seemed to be in a lull. The degree to which these firms specialize in fertilizer varies. Export Trading Group, DRTC, and Mohammed Enterprises are diversified agricultural businesses for which fertilizer is a small part of a broader conglomeration of agricultural production, output marketing, and transport activities. In contrast, Premium, Shival Tank, Yara, Mea, and Tanzania Fertilizer Company specialize in fertilizer.
These importers and wholesalers have formed an association, the Fertilizer Society of Tanzania. Currently there are 10 member firms. The primary function of the society is to provide a platform for jointly discussing issues related to fertilizer in Tanzania to have a common stance for further discussion with government to lead to a policy resolution. This includes advising the Ministry of Agriculture on the design and implementation of the NAIVS input voucher program.
Importing Although most of these firms have engaged in some importing of fertilizer in the past, in 2010/11 only Yara, Premium, and Export Trading were consistently importing fertilizer. The principal constraint that most of the firms face is import financing. With volatile international prices and local, usually weather-related shocks to production levels and hence demand for fertilizer, importing fertilizer is a risky business.6 Yara, as an international firm, and Export Trading, as a large regional agribusiness, are able to finance their fertilizer imports through internal resources or by accessing international commercial finance, including some special development financing mechanisms. Not having the broad corporate resources of the other two importers, the financing for Premium Agro-chem’s imports is obtained primarily from self-financing or local commercial sources. The other wholesalers obtain their stocks from these three principal importers, with one or two of the other firms occasionally importing a shipment. Yara estimates that it currently supplies about 40 percent of the fertilizer used in Tanzania, importing 120,000 mt for the Tanzania market in 2010. Premium reported importing 110,000 mt of fertilizer in 2010, and Export Trading reported supplying 90,000 mt.7
Importers obtain fertilizer for Tanzania from most large international producers of nitrogen, phosphate, and blended NPK fertilizers—western Europe, the Persian Gulf, Russia, and North America, among others. Importers reported that they generally organize their imports on the basis of a nine-month lead time. Thus, if fertilizer needs to be in farmers’ hands in southern Tanzania by early December, orders will be placed with international suppliers in February.
Virtually all of the fertilizer imported into Tanzania comes into the country through the port of Dar es Salaam. Because it is a choke point in the supply of fertilizer for the country, several studies have been done on the flow of fertilizer through the port and how port operations and the costs associated with them could be rationalized (Marine Logistics 2007, 2008). Most of these studies have been done for the Agricultural Council of Tanzania, the apex organization representing the interests of all private-sector actors engaged in agricultural production and agriculture-related businesses. The general message is that
6 The Tanzania Fertilizer Company (TFC) provides an example of the riskiness of the fertilizer business in Tanzania. The
government, in response to the sharp rise in global phosphate prices in 2008 and fearful of a reduction in food production due to reduced fertilizer use, instructed TFC, as a government-owned parastatal, both to purchase 24,000 mt of Minjingu Rock Phosphate product and to import Diammonium Phosphate (DAP) from the international market. However, international prices for phosphate fertilizers fell shortly thereafter, and TFC’s competitors brought in DAP sourced at a much lower cost. TFC had to sell its imported DAP at a loss. Moreover, as farmers prefer DAP as their source of phosphate, by early 2011 TFC had sold only 8,000 mt of its 2008 Minjingu Rock Phosphate stock. The government of Tanzania provided a guarantee for these purchases. The servicing by government of this credit is putting at considerable risk the continuing commercial viability and, indeed, the continued existence of TFC. TFC has not imported fertilizer since 2008, obtaining stocks since then from Premium and Yara.
7 Note that the total quantity reported imported in 2010 by these three firms, 320,000 mt, exceeds the total amount of fertilizer reported by the Tanzania Revenue Authority as imported into the country that year, 274,000 mt. Tanzania Revenue Authority figures are used in Figure 2.1. It is unclear what the source of this inconsistency is.
16
fertilizer-related operations in the port of Dar es Salaam can be made more efficient and less costly, with considerable investment and some restructuring of how port operations are done.
Among the technical constraints affecting the flow of fertilizer through the port that these studies note are the following:
• Economies of scale are difficult to achieve with the fertilizer volumes brought into Dar es Salaam. This is due primarily to financing constraints, but the diverse range of fertilizers demanded in the Tanzania market also results in many smaller or mixed lots of fertilizer being obtained by importers rather than large, single-product shipments. Average fertilizer orders from international suppliers are about 10,000 mt and so only make up part of the cargo in ships that are considerably larger. Moreover, shippers will charge higher costs on cargo delivered in part because they are not assured of collecting export cargo from Dar es Salaam, given the relatively low level of exports from Tanzania.
• There are insufficient berths for off-loading fertilizer in the port, so waiting times for ships to off-load can be quite significant. Importers pay shippers demurrage charges for every day that a ship is kept waiting outside the port, generally amounting to between US$1.00 and US$2.00 per mt per day on the typical fertilizer shipment size. Moreover, port regulations are that fertilizer receives lower priority for off-loading than do grain shipments.
• Most of the fertilizer imported is delivered in bulk rather than in bags or containers. This means lower delivered costs. However, the port does not have optimized bulk cargo off-loading machinery, and the fertilizer is bagged on the dockside, with bagging operations run by the Tanzania Ports Authority. Although major fertilizer ports elsewhere are able to unload more than 10,000 mt per day, in 2007 the average unloading rate for the fertilizer brought into the Dar es Salaam port was 1,560 mt per day.
• No conveyer belt systems are used to move the fertilizer—all movements are done by lorries at shipside and out of the port gates, with attendant congestion and delays. During the past several years, there has been considerable planning and some investment to
improve the handling of bulk fertilizer shipments at the port of Dar es Salaam. This has included two separate initiatives to develop fertilizer handling facilities just outside of the port—one by the private freight handling company Dar es Salaam Corridor Group and the other by the international fertilizer company Yara. The plans for the Dar es Salaam Corridor Group facility are to off-load both fertilizer and other dry bulk cargos, move them out of the port area (initially by truck, with plans for a conveyer belt system to be installed later), and bag them at their off-port facility as a commercial venture available to all importers on a fee basis. The Yara facility will be more restricted to fertilizer, with Yara’s own logistical needs taking priority. Yara’s aim is to be able to discharge its bulk shipments at a rate of 6,000 to 7,000 mt per day. If realized, these facilities should significantly improve the technical efficiency with which fertilizer is off-loaded, bagged, and sent up-country.
Importers informed us that the costs of clearing fertilizer from shipboard over the docks and out the gates of the port at Dar es Salaam amount to about US$40 per mt. These costs are not wholly rationalized and are reported to be changed quite frequently. However, no one expressed the opinion that the costs at Dar es Salaam were necessarily inconsistent with charges incurred when importing through other ports in southern and eastern Africa. The following fees were noted:
• The Tanzania Ports Authority (TPA) charges a wharfage fee of 1.6 percent of the CIF (Carriage-Insurance-Freight) value of the shipment, plus a $4.00 per mt charge on bulk shipments or a $79.00 charge per container (a container will contain 25 mt of bulk or 22 to 24 mt of bagged fertilizer).
• The TBS fee is 0.2 percent of the FOB value of the shipment. TBS is to take a sample of all fertilizer import shipments for testing of pre-import product quality and thereafter issue a certificate of inspection. This testing is somewhat redundant, as pre-shipment inspections of the product are generally done, and documentation of these inspections accompanies the

17
shipment. Moreover, TBS stated that it will not generally test products from regular international suppliers that have supplied good-quality product recently. In addition, the TBS laboratories are unable to test fertilizer quality in a timely and accurate manner. Although generally no delays in shipment off-loading occur while the sample is being tested, TBS does have the right to impose a delay.
• TPA charges US$12.50 per mt for bagging by its own crews of the fertilizer into bags supplied by the importer.
• The radiation-scanning fee is 0.4 percent of the FOB value of the shipment. No importer saw any value in this fee as no significant levels of radiation have been found in any shipment of fertilizer. Rather the fee seems to be in place as a revenue stream for the Tanzania Atomic Energy Commission.
• Since early 2011 all containers coming through the port of Dar es Salaam are required to be scanned for smuggling control. If the product is containerized (not too common for fertilizer), this costs the importer $90 per container, plus a handling fee of $69 to move the container to the scanner and back to the container yard. As there is only one scanner, this operation has exacerbated congestion in the port.
• The Surface and Marine Transport Regulatory Authority (SUMATRA) recently took over from the Tanzania Central Freight Bureau the role of regulating the charges that port-related service providers, such as clearing agents and TPA itself, offer to importers and exporters. SUMATRA also levies its own fee as the regulatory body for port activity costs. Fees for import shipments are based on the port of loading of the shipment—US$0.25 per mt for African, western European, and Persian Gulf ports and US$0.30 per mt for other ports. Most of these fees are applied to the shipping invoice that the importer pays rather than invoiced
separately. As such, there is little scope for challenging them. Tanzania imposes no import duty on inorganic fertilizer. This zero rating is in common with the
other countries of the East African Community as noted under chapter 31 of the East African Community Common External Tariff. Similarly, no value-added tax is charged on sales of fertilizer. However, a 20 percent value-added tax is levied on most of the port-related fees and charges for services detailed above as well as on the transport of the product from the port and up-country.
Overall, the business of fertilizer importation in Tanzania is competitive. However, there is considerable risk of monopolistic conditions’ emerging in fertilizer supply to Tanzania. During the interviews for this study, several of Yara’s competitors expressed concern that Yara could soon assert a monopoly position for fertilizer supply to the country. In addition to being part of an international corporation with considerable assets and financial resources, Yara also was seen by some to be receiving preferential treatment by the government of Tanzania. The company intends to invest US$20 million in a product-handling facility just outside of the port of Dar es Salaam that will reduce port congestion by moving fertilizer-bagging operations out of the port. Yara received considerable assistance from the government in obtaining a long-term lease on land for this facility—land that its competitors said the government would never have assisted them to obtain if they had proposed similar plans. Moreover, to a greater degree than its competitors, Yara is also active in international development initiatives in Tanzania that should enable it to grow its business substantially.8
Yara does not have its own distribution network up-country—its business model in Tanzania is solely importation, with some attention to product development for the national market—the Chapa Meli brand of fertilizers. In an interview, the Yara manager stated that the firm intends to supply the Tanzania
8 Of particular note, Yara is one of the lead private enterprises championing the ambitious Southern Agricultural Growth
Corridor of Tanzania initiative. The initiative seeks to promote agricultural growth clusters in the high-potential Southern Highlands of Tanzania through public-sector investments in transport, communication, and energy services, catalytic funding from Tanzania’s development partners, and private direct investment, primarily by international agribusinesses, including Yara (see http://www.africacorridors.com/sagcot/).
18
market from Dar es Salaam with both high-analysis fertilizers (which wholesalers may market under their own labels) and its blended branded fertilizers. As such, it does not compete at the wholesale level up-country. However, if the firm is successful in the coming years in its efforts to further dominate the supply of fertilizer into Tanzania, and if Export Trading and Premium Agro-chem decide in consequence to no longer import fertilizers for the smallholder farming sector, all of the wholesalers serving such farmers will be dependent on Yara for their supplies.9 With noncompetitive fertilizer importation, prices for fertilizer in Tanzania are likely to be higher than they otherwise would be.
Wholesaling Most of the 10 members of the Fertilizer Society of Tanzania primarily engage in the wholesale distribution of fertilizer up-country as their core business—Yara being the principal exception to this business model. Many of the firms, including those that claim to specialize in fertilizer, will integrate their fertilizer marketing with agricultural output trade: Those firms with lorries will ship fertilizer up-country and bring back agricultural commodities. Most of the firms have wholesale depots in the principal farming areas of the country—primarily in the Southern Highlands, but some also have depots elsewhere, notably Kilimanjaro. Fertilizer will be stocked in these depots for sale to retailers before planting. However, after harvest, the depots will then be used for bulking of stocks of commodities for shipment to Dar es Salaam and elsewhere.
Although the depots will be used for retail sales direct to farmers, a common pattern is for wholesalers to promote and maintain networks of private retail dealers from the farming area served by each of their depots. The firm would have established a good commercial working relationship with these dealers, so it would offer fertilizer to them on credit terms—generally expecting full payment within 30 or 90 days of delivery, depending on the firm involved and the strength of the relationship with the retailer. For example, Premium Agro-chem reported that it has four depots in the Southern Highlands, each with 50 to 100 stockists to whom it regularly supplies fertilizer. This model is seen with several of the other wholesalers.
Transport costs up-country are high but competitive. Not all of the fertilizer wholesalers have their own transport fleets as there is considerable competition in the road transport sector in Tanzania. In general transport of fertilizer from Dar es Salaam to the main wholesale centers in the Southern Highlands will cost US$30 to US$50 per mt. A closer assessment of transport costs done in 2007 estimated truck transport costs at US$0.117 per mt per kilometer (km), whereas rail transport costs about half that at around US$0.050 per mt per km (Marine Logistics 2007). However, the inflexibility in place of delivery and the opportunity costs associated with delays in the operations of the rail networks in Tanzania are such that most fertilizer is delivered by road.
Traders The number of retailers of fertilizer in Tanzania is not known exactly. In the course of the study, estimates were given of 3,000 retailers, but no census has been done. As such, the relative scale of operations and the diversity of inputs that these retailers provide are unclear. Moreover, respondents highlighted that the distribution of retailers across the country is patchy, with large numbers in districts with high agricultural potential where there are likely to be clear positive returns to the use of commercial agricultural inputs. In contrast, in some districts in the drier regions of central and coastal Tanzania and in the more remote areas of western Tanzania, no input retailers may be present.
One of the more significant developments in private-sector fertilizer supply in Tanzania in the past several years has been the strengthening of TAGMARK with the support of CNFA, a United States–
9 Of the two other fertilizer importers, Export Trading Group, as a diversified agricultural business, would be less likely to battle to maintain its share of the fertilizer import market in Tanzania. If it finds it cannot compete with Yara, it can suspend its fertilizer trading in Tanzania and focus on the other elements of its business while perhaps maintaining its fertilizer operations in other countries where it does such business, such as in southern Africa, importing through ports in Mozambique. The stakes are considerably higher for Premium Agro-chem for which fertilizer supply in Tanzania is its core business.

19
based nongovernmental organization (NGO) with financial support from the Alliance for a Green Revolution in Africa and the World Bank. CNFA/TAGMARK brings together agro-input dealers for policy advocacy, market development, training, and networking purposes. A major element of the work of the program is in the training of agrodealers and in assisting them in gaining access to inventory credit. Training is offered on business management, product knowledge, output marketing, and corporate governance. CNFA’s Tanzania Agrodealer Strengthening Program reports that more than 2,600 agrodealers have been certified under the CNFA/TAGMARK training scheme implemented under the program. As was noted, under the NAIVS voucher program only agrodealers who have certification of training from CNFA/TAGMARK were to be permitted to offer inputs to voucher recipients.
However, the commercial sustainability of these input dealers is not assured. A point made quite consistently in the interviews and in the literature reviews done for this study was the relatively limited knowledge that exists about the economics of fertilizer use in Tanzania. Although good yield responses in maize, in particular, are seen to nitrogen application and somewhat more erratically to phosphate, little economic research has been done to explore whether fertilizer use under smallholder crop management and marketing conditions makes economic sense for farmers. Agronomic studies have resulted in detailed fertilizer recommendations’ being formulated by district (Samki and Harrop 1984) and by agroecological zone within districts (Mowo et al. 1993). However, the economics underlying these recommendations are uncertain, calling into question how these recommendations should be used under different price ratios between fertilizer and the crops being fertilized. General fertilizer use patterns by smallholders seem simply to be to follow in a rote manner what they learned earlier—essentially, to comply with local fertilizer use traditions. In part to address this information constraint, under the same credit that the World Bank is providing for the NAIVS program, a program of strategic soil characterization and soil fertility management research is to be done that includes verification of existing fertilizer recommendations and improvement of the capacity of district agricultural extension staff to advise farmers on appropriate and profitable soil fertility management practices (World Bank 2009).
A strong element in the work of CNFA/TAGMARK and that of the Tanzania Agricultural Partnership program of the Agricultural Council of Tanzania has been establishing with agricultural input dealers demonstration plots for farmers on fertilizer use. Several of the fertilizer wholesalers have provided the inputs to establish these demonstrations. The dealer-run demonstration generally will constitute a well-managed “mother” trial from which data can be collected and analyzed, with farmers in the surrounding farming area establishing “baby” trials under on-farm conditions to assess the response to fertilizer in the crop and to undertake a semi-quantitative economic analysis of different rates of application. Tanzania Agricultural Partnership district-level programs are reported to undertake some basic gross margins analysis from the results of these trials and then work with extension officers to assist farmers with undertaking similar economic analyses of their use of fertilizer. However, no systematic assessment seems to have been developed from these analyses.
Moreover, the foundation for a strong agricultural input market in Tanzania, as elsewhere, is in strong output markets for the fertilized crops. However, the agricultural output markets in Tanzania are not yet sufficiently well developed to sustain a wholly commercial fertilizer market without state intervention. In spite of liberalization of economic activities in the agricultural sector, the government of Tanzania still intervenes regularly in the operations of food crop markets in particular. Whenever Tanzania faces a possible threat to national food security due to poor rains or the like, the government generally will close its borders to food crop exports. This was done in 2011 at the same time that the NAIVS program was absorbing significant public resources to raise production levels. The suppression of output prices that can be expected to have resulted from closing the borders to food crop trade likely rendered fertilizer use on food crops such as maize and rice insufficiently profitable in some farming areas to induce farmers to use fertilizer on a wholly commercial basis. There is a recurring policy inconsistency in Tanzanian agriculture that arises when the government tries to promote fertilizer use through massive investments at the same time as it is harming the long-term sustainability of crop output markets with sudden policy shifts in how those output markets are to operate. Moreover, with one outcome of these policy shifts being a retreat from commercial production by many smallholders and hence the use of commercial inputs such as fertilizer, the sustainability of the growing network of rural agricultural input traders in Tanzania is uncertain.

20
4. SURVEY OF TRADERS SUPPLYING FERTILIZERS
One of the principal ways in which information about fertilizer marketing in Tanzania was obtained was through semistructured interviews with key individuals involved in fertilizer trade, in both the private and the public sectors. However, a more formal survey of fertilizer traders was also undertaken to obtain a broader and more generalized understanding of their operations. In this section of the paper, we provide some findings from this survey.
Survey Design Using the results of the National Sample Census of Agriculture 2002/03 (NBS et al. 2006), three areas of the country with greater prevalence of fertilizer use by smallholder farmers on their crop plots were identified (see Figure 1.1):
1. Hai district on the western slopes of Mount Kilimanjaro 2. Iringa rural district near Iringa town 3. Songea rural district near Songea town in the Ruvuma region
These three study areas were used as the strata for both the trader and the farmer survey for this study. Farmers were interviewed in two to four wards in each of the three districts chosen for the study. Traders were interviewed in commercial centers in or near the study areas from which farmers in the area obtained their commercial inputs. These commercial centers included Moshi, the closest major town to Hai district; Iringa; and Songea; as well as smaller trading centers in the study districts.10
The survey protocol was for 15 to 20 traders to be randomly selected from a listing of agrodealers who market fertilizer in each of the study areas that was provided from a database of agrodealers that had been compiled by CNFA/TAGMARK. However, a somewhat lower number of traders—between 9 and 12—were interviewed in each area, for a total of 31 traders interviewed.11 A standardized questionnaire, only slightly modified from that used in the parallel study in Uganda, was used to interview the selected traders. This questionnaire was organized in modules on the personal characteristics of the trader, business characteristics, fertilizer inventory, fertilizer supply and supply costs, taxes and fees related to the trader’s fertilizer business, fertilizer sales, and fertilizer business issues. The trader survey was conducted in late February and early March 2011 concurrently with the farmer survey.
In the presentation of results in the tables below, the sample is disaggregated by scale of operation based on the size of the largest order of fertilizer that the trader reported obtaining from a supplier in 2010. Considerable variability was observed in the scale of operations of the fertilizer traders in the study sample. As shown in Table 4.1, if a trader reported that his or her largest order was less than 1,000 50-kg bags, the trader was classified as small scale. Although some traders sold only a handful of bags in 2010, several of the traders are large local wholesalers, selling lots of up to several hundred bags at a time. All traders in the survey sample in Songea were considered small scale by this definition, whereas close to half of those in Hai were considered large scale.
10 Samuel Mugarura managed the entry and cleaning of both the farmer and the trader survey data. Patrick Lubega and
Stephen Bayite-Kasule of the IFPRI Kampala office did additional cleaning and conducted an initial analysis of these two data sets. We are grateful for this assistance.
11 Given the small sample size and that the strata where the interviewed traders are located were purposively selected based on higher prevalence of fertilizer use in the area, the results from the trader survey should not be treated as representative. Consequently, only unweighted survey results are presented.

21
Table 4.1—Fertilizer trader scale of operations; size of largest order from supplier in 2010
Size of largest order in 2010,
50-kg bags of fertilizer Small-scale traders, (largest order
< 1000 bags), % n
Study Area Mean Median Minimum Maximum
Hai 3,088 550 10 20,000 58.3 12 Iringa 865 400 50 5,000 80.0 10
Songea 428 400 150 600 0.0 9 All 1,599 500 10 20,000 77.4 31
Source: Tanzania fertilizer trader survey.
Fertilizer Trader Characteristics Table 4.2 provides descriptive statistics about the fertilizer traders in the sample for the survey, disaggregated by scale of operation. At 29.0 percent, more of the fertilizer traders are women than might be expected. The level of education attained by the traders is relatively good, with all those in the sample having completed primary school. The majority of large-scale traders completed secondary school. Large-scale traders generally have longer experience in the fertilizer trade.
Table 4.2—Fertilizer trader characteristics
Small-scale Large-scale All Age, mean (years) 44.0 47.7 44.8
Female (%) 33.3 14.3 29.0 Completed primary school (%) 100.0 100.0 100.0
Completed secondary (%) 20.8 57.1 29.0 Fertilizer trading experience, mean (years) 8.1 15.7 9.8
n 52 18 70 Source: Tanzania fertilizer trader survey.
Table 4.3 provides descriptive statistics about the characteristics of the fertilizer businesses of the traders in the sample for the survey, disaggregated by scale of operation. The median annual sales of fertilizer by traders in the sample are 3,500 bags or 175 metric tons. Most of the small-scale traders are the sole owners of their businesses, whereas large-scale traders are more likely to have partners in the ownership of their businesses. The traders in the sample generally have more than one premise from which they trade. The start-up capital for most traders came from their own personal savings. Five traders in the sample reported using commercial loans to finance the start-up of their businesses, all of them small-scale traders.
Both small- and large-scale businesses trading in fertilizer have assets beyond their business premises and storage. Almost half of the small-scale traders have pickup trucks, and almost one-third have lorries for transport of goods. All of the large-scale traders have pickups, and most have trucks.

22
Table 4.3—Fertilizer trader business characteristics
Small-scale
Large-scale All
Annual quantity of fertilizer sold, mean, 50-kg bags 5,159 26,640 10,170
Median, 50-kg bags 3,000 20,000 3,500 Sole owner (%) 95.8 57.1 87.1
Personal savings as principal source of start-up capital (%) 50.0 85.7 58.1
Assets More than one trading premises (%) 61.1 80.0 65.2
Owns computer (%) 12.5 57.1 22.6 Owns pickup truck (%) 41.7 100.0 54.8
Owns truck of > 3 mt capacity (%) 29.2 57.1 35.5 Has warehouse or other specialized storage
space (%) 95.8 100.0 96.8
Capacity of storage space for those with storage, mean, 50-kg bags 2,250 27,930 8,240
Median, 50-kg bags 1,000 6,000 1500 Composition of value of annual sales
Fertilizer (% of total annual sales) 45.5 52.9 47.2 Seeds or other planting materials 17.7 16.4 17.4
Pesticides or other agrochemicals 14.5 9.4 13.3 Farming implements 1.7 3.7 2.2
Veterinary supplies 6.5 3.3 5.7 Agricultural services (not goods) 0.4 0.0 0.3 Nonagricultural items or services 11.8 10.0 11.4
Source: Tanzania fertilizer trader survey.
The composition of the business sales of the traders surveyed is specialized on agriculture—few of those in the sample sold many nonagricultural items. However, most fertilizer traders are not specialized in trading in fertilizer alone. Although—as should be expected given that the sample was chosen based on fertilizer trade—the largest component of their sales on average comes from fertilizer, both pesticides and seeds are important elements of their business. Only four of the traders in the sample reported obtaining 70 percent or more of their total sales from fertilizer alone.
Types and Sources of Fertilizer Sold Information about the various types of fertilizers and the quantities of those fertilizers that dealers sell is provided in Table 4.4. Urea is reported by the traders in the sample to be the most commonly sold fertilizer, followed by DAP. CAN, Ammonium Sulphate, and Minjingu Rock Phosphate are also commonly sold, if not in the quantities of urea and DAP. The principal crop on which all these fertilizers are used is maize. DAP and Minjingu are used as a basal dressing applied shortly after crop emergence and urea and the other nitrogen fertilizers as a top-dressing applied three to six weeks later when the maize plants are about knee-high, before the maize flowers. In addition to the seven fertilizer types considered in Table 4.4, four traders reported selling Triple Superphosphate (0:45:0) and one the 25:5:5 blend. Potassium fertilizers were not reported sold by any of the traders in the sample, nor did the traders report selling agricultural lime for soil amendment purposes.
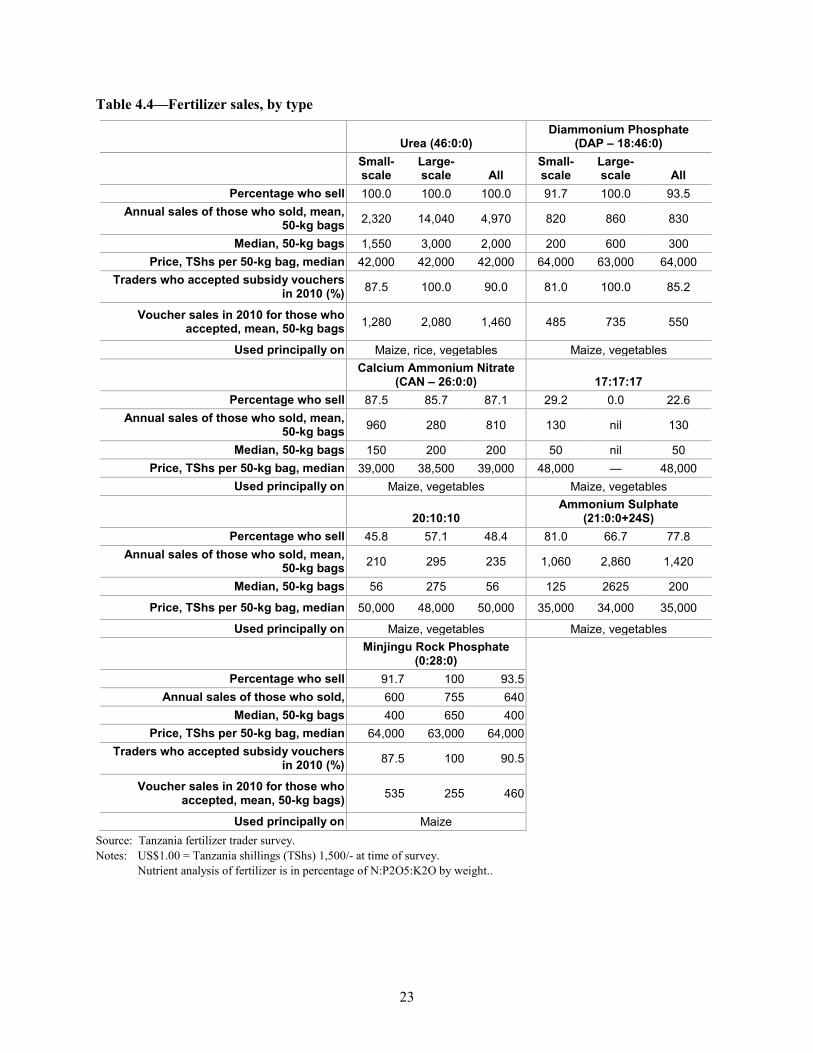
23
Table 4.4—Fertilizer sales, by type
Urea (46:0:0)
Diammonium Phosphate (DAP – 18:46:0)
Small-scale
Large-scale All
Small-scale
Large-scale All
Percentage who sell 100.0 100.0 100.0 91.7 100.0 93.5 Annual sales of those who sold, mean,
50-kg bags 2,320 14,040 4,970 820 860 830
Median, 50-kg bags 1,550 3,000 2,000 200 600 300 Price, TShs per 50-kg bag, median 42,000 42,000 42,000 64,000 63,000 64,000
Traders who accepted subsidy vouchers in 2010 (%) 87.5 100.0 90.0 81.0 100.0 85.2
Voucher sales in 2010 for those who accepted, mean, 50-kg bags 1,280 2,080 1,460 485 735 550
Used principally on Maize, rice, vegetables Maize, vegetables
Calcium Ammonium Nitrate (CAN – 26:0:0) 17:17:17
Percentage who sell 87.5 85.7 87.1 29.2 0.0 22.6 Annual sales of those who sold, mean,
50-kg bags 960 280 810 130 nil 130
Median, 50-kg bags 150 200 200 50 nil 50 Price, TShs per 50-kg bag, median 39,000 38,500 39,000 48,000 — 48,000
Used principally on Maize, vegetables Maize, vegetables
20:10:10
Ammonium Sulphate (21:0:0+24S)
Percentage who sell 45.8 57.1 48.4 81.0 66.7 77.8 Annual sales of those who sold, mean,
50-kg bags 210 295 235 1,060 2,860 1,420
Median, 50-kg bags 56 275 56 125 2625 200
Price, TShs per 50-kg bag, median 50,000 48,000 50,000 35,000 34,000 35,000
Used principally on Maize, vegetables Maize, vegetables
Minjingu Rock Phosphate (0:28:0)
Percentage who sell 91.7 100 93.5 Annual sales of those who sold, 600 755 640
Median, 50-kg bags 400 650 400 Price, TShs per 50-kg bag, median 64,000 63,000 64,000
Traders who accepted subsidy vouchers in 2010 (%) 87.5 100 90.5
Voucher sales in 2010 for those who accepted, mean, 50-kg bags) 535 255 460
Used principally on Maize Source: Tanzania fertilizer trader survey. Notes: US$1.00 = Tanzania shillings (TShs) 1,500/- at time of survey.
Nutrient analysis of fertilizer is in percentage of N:P2O5:K2O by weight..

24
The survey included questions about how the dealers obtained their supplies of fertilizer. • The traders surveyed use more than one supplier—26 percent reported using only one
supplier (25 percent of small-scale traders and 29 percent of large-scale traders), whereas 48 percent use three or more (46 percent of small-scale and half of large-scale traders).
• Small-scale traders tend to obtain several small orders from their suppliers during a season rather than single large orders—the median number of fertilizer orders in 2010 that small-scale traders reported obtaining from their principal suppliers was 3.5. However, for large-scale traders, a single order was the median number of orders such traders reported receiving from their principal suppliers in 2010.
• Generally, the traders are responsible for transport of the fertilizer ordered from the suppliers to their business premises. Overall, only 19.4 percent of traders reported that their suppliers delivered the fertilizer stocks—this was somewhat more common among small-scale traders, 20.8 percent of whom reported that the suppliers arranged delivery. Of the traders who arranged their own transport for their fertilizer stocks, two-thirds reported hiring transport, and the remainder used their own transport. This pattern was seen for both small- and large-scale traders.
• Half of the small-scale traders reported that they were able to obtain fertilizer stocks from their principal suppliers on credit, whereas only one of the seven large-scale traders in the sample reported that he or she obtained credit. The credit terms most commonly reported were a 50 percent down payment on delivery with full payment due between one and three months. Table 4.5 provides information about where the principal suppliers reported by the traders are
located. Hai traders go to Dar es Salaam; locally to Moshi (Kibo Trading Co.); or to Arusha (Balton, Ltd. and Minjingu) for their stocks. Iringa traders primarily obtain their fertilizer stocks from Dar es Salaam, with a few small traders obtaining stocks from a wholesaler (Shival Tank & Company, Ltd.) with a depot in Iringa itself. Songea traders, based in the study area most distant from the fertilizer importers in Dar es Salaam and all considered small-scale traders for this study, reported obtaining their stocks from the Songea depot of the Tanzania Fertilizer Company, with one Songea trader reporting having brought in an order from Minjingu in Arusha. The supplier in Dar es Salaam most commonly mentioned by the traders surveyed was Premium Agro-chem, Ltd., although other Dar es Salaam suppliers mentioned included Chapa Meli (Yara), Tanzania Fertilizer Company, and the Export Trading Group. Several of the Dar es Salaam suppliers also have depots in the study areas from which they supplied fertilizer to the traders.
Table 4.5—Location of principal fertilizer supply source, by percentage of fertilizer traders
Study area All Hai Iringa Songea Source of
Supply Small-scale
Large-scale All
Small-scale
Large-scale All
Small-scale
Large-scale All
Small-scale
Large-scale All
Dar es Salaam 33 71 42 29 60 42 75 100 80 — — — Moshi 12 — 10 43 — 25 — — — — — —
Arusha 12 29 16 29 40 33 — — — 11 — 11 Iringa 8 — 6 — — — 25 — 20 — — —
Songea 33 — 26 — — — — — — 89 — 89 n 24 7 31 7 5 12 8 2 10 9 0 9
Source: Tanzania fertilizer trader survey. Note: Dashes indicate that no traders obtained fertilizer from that fertilizer supply source.

25
A question was asked about whether the trader had experienced any problem with the quality of the fertilizer supplied by the principal supplier. The quality of the fertilizer that is marketed seemingly is not a major concern for most traders. Nine of the 31 traders mentioned some problems. Three traders surveyed complained that their customers did not obtain the crop yield response anticipated from the fertilizer.12 Poor packaging and expired or caked fertilizers were also mentioned.
Costs for Traders to Acquire Fertilizer One module of the survey questionnaire asked the trader to consider all of the costs he or she incurred in obtaining an order from the principal supplier of fertilizer. These costs were standardized on the basis of cost per 50-kg bag and are reported in Table 4.6.
Table 4.6—Breakdown of costs of obtaining fertilizer by trader
Small-scale
Large-scale All n
Order size, 50-kg bags, median 350 3,000 500 31 Payment to supplier, TShs/bag, median 36,000 26,000 35,250 30
Loading or off-loading from vehicle, TShs/bag, median 100 100 100 30 Transport (all), TShs/bag, median 1,000 500 1,000 29
Transport from Dar es Salaam to Hai, TShs/bag, median — — 1,500 4
Transport from Dar es Salaam to Iringa, TShs/bag, median — — 1,430 8
Transport from Moshi/Arusha, Iringa, or Songea to trader in neighboring study area, TShs/bag, median — — 580 16
Source: Tanzania fertilizer trader survey. Note: Dashes indicate insufficient data to reliably compute cost for the category of trader.
There are some fees associated with transport that may not be covered by the transporter as part of the overall costs of transport. These include road fees at roadblocks or weigh bridges. However, none of the traders surveyed reported paying such fees separately from their costs of transport. All also reported that they were able to arrange delivery from suppliers to their business premises with a single transporter.
A set of questions was asked about all other fees and taxes that a fertilizer trader might bear—import permit fees or taxes, local government taxes, income taxes on their businesses, inspection fees, and trading permit fees. Most of the traders reported not paying such taxes and fees. The exceptions were taxes to local governments and business income taxes. Of the traders, 12 reported on their annual local government tax payments. The median payment per business was TShs 125,000 annually, with the large-scale traders’ reporting slightly higher payments than the small-scale traders—a median payment of TShs 155,000 per year for the larger traders.
Information about their annual business income tax payments was provided by 23 of the traders, 18 small scale and 5 large scale. The median annual tax payment for all traders in 2010 was TShs 290,000, with the median for small-scale traders being TShs 285,000 and TShs 2,900,000 for large-scale traders.
12 In one case, this was specific to Minjingu Rock Phosphate, which is known to give a delayed response in crop
performance. One of the other cases concerned CAN, raising suspicions about the fertilizer having been adulterated.
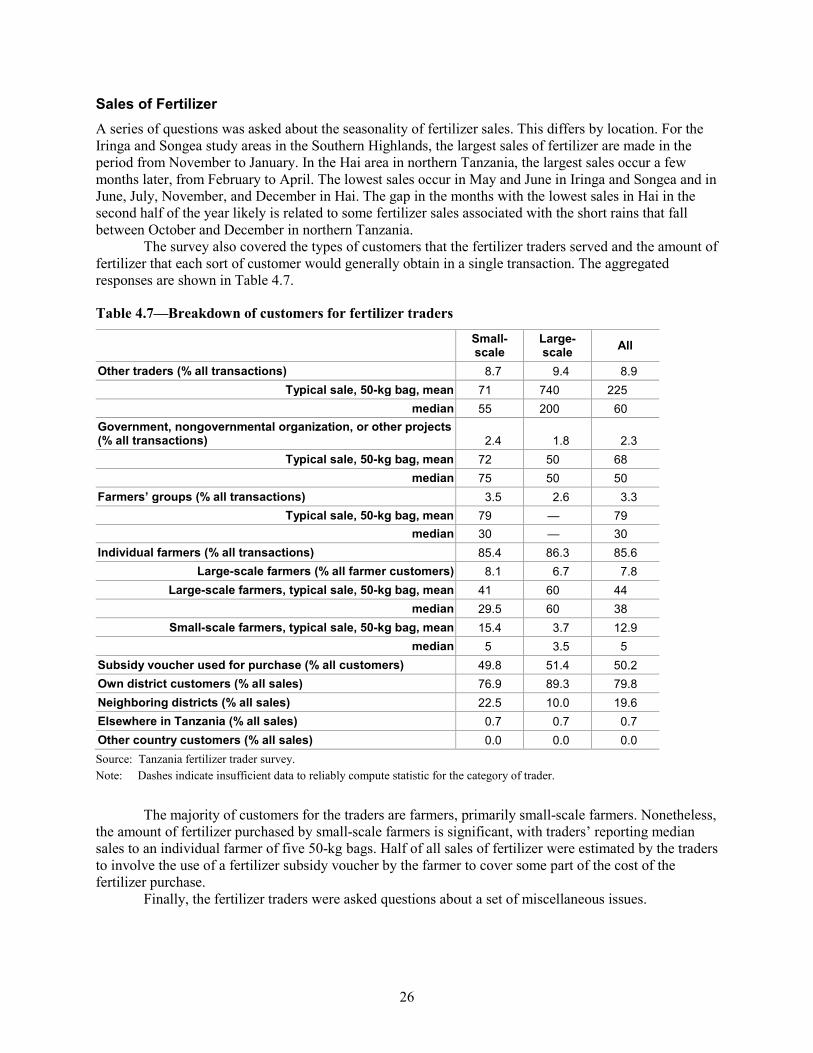
26
Sales of Fertilizer A series of questions was asked about the seasonality of fertilizer sales. This differs by location. For the Iringa and Songea study areas in the Southern Highlands, the largest sales of fertilizer are made in the period from November to January. In the Hai area in northern Tanzania, the largest sales occur a few months later, from February to April. The lowest sales occur in May and June in Iringa and Songea and in June, July, November, and December in Hai. The gap in the months with the lowest sales in Hai in the second half of the year likely is related to some fertilizer sales associated with the short rains that fall between October and December in northern Tanzania.
The survey also covered the types of customers that the fertilizer traders served and the amount of fertilizer that each sort of customer would generally obtain in a single transaction. The aggregated responses are shown in Table 4.7.
Table 4.7—Breakdown of customers for fertilizer traders
Small-scale
Large-scale All
Other traders (% all transactions) 8.7 9.4 8.9 Typical sale, 50-kg bag, mean 71 740 225
median 55 200 60 Government, nongovernmental organization, or other projects (% all transactions) 2.4 1.8 2.3
Typical sale, 50-kg bag, mean 72 50 68 median 75 50 50 Farmers’ groups (% all transactions) 3.5 2.6 3.3
Typical sale, 50-kg bag, mean 79 — 79 median 30 — 30 Individual farmers (% all transactions) 85.4 86.3 85.6
Large-scale farmers (% all farmer customers) 8.1 6.7 7.8 Large-scale farmers, typical sale, 50-kg bag, mean 41 60 44
median 29.5 60 38 Small-scale farmers, typical sale, 50-kg bag, mean 15.4 3.7 12.9
median 5 3.5 5 Subsidy voucher used for purchase (% all customers) 49.8 51.4 50.2 Own district customers (% all sales) 76.9 89.3 79.8 Neighboring districts (% all sales) 22.5 10.0 19.6 Elsewhere in Tanzania (% all sales) 0.7 0.7 0.7 Other country customers (% all sales) 0.0 0.0 0.0 Source: Tanzania fertilizer trader survey. Note: Dashes indicate insufficient data to reliably compute statistic for the category of trader.
The majority of customers for the traders are farmers, primarily small-scale farmers. Nonetheless, the amount of fertilizer purchased by small-scale farmers is significant, with traders’ reporting median sales to an individual farmer of five 50-kg bags. Half of all sales of fertilizer were estimated by the traders to involve the use of a fertilizer subsidy voucher by the farmer to cover some part of the cost of the fertilizer purchase.
Finally, the fertilizer traders were asked questions about a set of miscellaneous issues.

27
• Of the fertilizer traders in the sample, 60 percent are willing to offer credit to customers. However, most will require that the individual has proven him- or herself a good customer for at least six months. The terms of credit generally involve a 50 percent down payment with full payment made within one month, with some traders extending the payback period to three months.
• Fertilizer is generally imported and marketed in 50-kg bags. However, this quantity of fertilizer may exceed the needs of many small farmers, or the cost of this amount of fertilizer may exceed their ability to pay. Traders were asked if they sold fertilizer to customers in smaller quantities. Slightly more than half of the traders sampled do so—54.8 percent of traders. For those traders who sell fertilizer in smaller amounts, sales of less than 50 kg account for an estimated 18 percent of the fertilizer sales of small-scale traders and 28 percent of large-scale traders. However, few of these traders obtain prepacked smaller packets of fertilizer from their wholesalers—only 3 of the sampled traders stocked such small packs. More traders break 50-kg bags of fertilizer and either repack the fertilizer themselves into smaller standard-weight packets (4 of the sampled traders) or simply sell it loose by weight (10 traders).
• Of the fertilizer traders in the sample, 77 percent reported that they were members of TAGMARK, the national agro-input dealers’ association. These members were asked to state the most important benefits for their fertilizer businesses that they obtained in joining the association. Training on the proper use of fertilizers was the benefit most commonly reported, followed by training on business management. All except one current member planned to renew their memberships.13
• Of traders in the sample, 74 percent reported obtaining commercial credit for their businesses. The principal reasons were to either expand or improve the business premises or to purchase larger stock. All felt that the decision to obtain the loan was an appropriate business decision.
• Traders were asked how they obtain up-to-date information about fertilizer prices. A total of 43 percent stated that they simply contact their principal suppliers, and an equal number reported that they consult with fellow fertilizer traders to determine current prices.
• All of the surveyed traders will offer advice to farmers on the proper use of fertilizer. However, the means by which traders themselves obtain this information is quite varied, and the quality of the information that they obtain is difficult to judge. Of traders, 42 percent stated that TAGMARK was their most important source of information, whereas 29 percent reported principally relying on information provided by their fertilizer suppliers. Only a few traders noted the government agricultural extension service as being informative on this topic.
• Finally, the dealers were asked a set of subjective questions about their expectations during the next three years about the number of fertilizer suppliers in the market, the number of customers, and the relative size of their own fertilizer businesses. The traders in the sample are generally optimistic: 70 percent expect that there will be more suppliers in the market, although 20 percent expect a contraction in suppliers; 87 percent expect significantly more customers for their fertilizer; and all but one of the traders in the survey sample expect that their fertilizer business will grow during the next three years. When asked why they were optimistic about the prospects for their own businesses, the most common reason offered by those with opinions was that they are seeing increased efforts to sensitize farmers to the benefits of using fertilizers, and they expect increased fertilizer demand will follow.
13 Some of the traders in Hai and Songea also reported being members of local agrodealer associations—the Hai Agro-
dealers Association and the Songea Agro-dealers Association, respectively. The principal benefits noted for these associations by trader members were that they offered a platform for interaction with local government agencies.

28
5. SURVEY OF FARMERS IN AREAS WHERE FERTILIZER IS USED
The second source of primary information about fertilizer supply in Tanzania for this study was obtained through a survey of a sample of farmers—the actors at the end of fertilizer importation and marketing chains in Tanzania. In this section of the paper, we provide select findings from this farmer survey.
The three study areas from which the sample of farmers was chosen were the same as those used for the survey of fertilizer traders. Several wards were selected in each area based on their having been identified by fertilizer traders and agricultural experts in the study areas as having greater use of fertilizer than the norm for the area:
1. Hai district—Machame Kaskazini and Masama Magharibi wards 2. Iringa rural district—Limuli and Mgama wards 3. Songea rural district—Kilagano, Litisha, Mahanje, and Mkongotema wards
Four farming communities were randomly selected in these wards in each study area. Lists of farmers were drawn up in each community from which 16 sample farmers were chosen.
The study had been designed so that roughly equal numbers of fertilizer user and nonusers would feature in the survey sample in each community. However, this element of the survey design was not successfully implemented. Virtually all of the sample farmers use some fertilizer—only 10 of the 193 farmers in the sample reported not using any fertilizer in 2010.14 Given the low sample size for the nonusers, few comparisons between fertilizer users and nonusers can be made from the survey results.
Characteristics of Farmers General characteristics of the farming households in the sample are presented in Table 5.1. Table 5.2 shows differences in off-farm sources of income for the heads of farming households in the sample and descriptive statistics about the agricultural experience and aspects of the land farmed by farmers in the study sample. Few differences are seen between the characteristics of fertilizer users and nonusers. Differences are more commonly seen between the farmers in the different study areas.
14 The reason for this error is due to both inattention on the part of the survey enumeration team to ensuring that significant
nonusers were sampled and the effect of the input subsidy voucher program that increased the prevalence of fertilizer use among smallholder farmers in the study areas.

29
Table 5.1—Household characteristics of farmers in survey sample
Study Area All Non-users
Fertilizer users Hai Iringa
Rural Songea Rural
Fertilizer use (%) 94.8 — — 95.3 90.5 98.5 Demographic
Female-headed (%) 33.7 30.0 33.9 35.9 28.6 36.4 Household head age, years, mean 44.9 44.2 44.9 53.6 42.3 39.1
Household size, mean 5.4 5.9 5.4 4.8 6.0 5.4 Full-time household farm workers, mean 1.9 1.6 2.0 1.8 2.1 2.0
Educational attainment of household head Any education (%) 93.8 100.0 93.4 93.8 93.7 93.9
Finished primary school (%) 83.4 80.0 83.6 78.1 84.1 87.9 Finished secondary school (%) 2.1 10.0 1.6 4.7 1.6 0.0
Household assets House with cement mortared walls (%) 27.5 20.0 27.9 65.6 9.5 7.6
Owns bicycle (%) 58.1 60.0 58.0 16.1 74.6 81.8 Owns motorcycle (%) 12.0 10.0 12.2 4.8 12.7 18.2
Owns motor vehicle (%) 5.8 10.0 5.5 11.3 0.0 6.1 Owns any livestock (%) 92.2 90.0 92.3 96.9 87.3 92.4 Cattle, herd size, mean 2.2 7.3 1.9 2.3 2.9 1.3 Goats, herd size, mean 1.7 1.8 0.3 1.0 0.9 3.1
Poultry, flock size, mean 13.6 6.4 13.6 14.2 9.5 16.8 n 193 10 183 64 63 66
Source: Tanzania farmer survey.
Table 5.2—Engagement in off-farm income-generating activities and agricultural experience of household head, farmland characteristics
All Non-users
Fertilizer users Hai Iringa
Rural Songea Rural
Engage in off-farm work (%) 40.9 50.0 40.4 31.3 49.2 42.4 Of those, engaged in unskilled work (%) 21.5 20.0 21.6 5.0 41.9 10.7
Skilled work (%) 34.2 40.0 33.8 65.0 9.7 39.3 Trade (%) 44.3 40.0 44.6 30.0 48.4 50.0
Months per year engage in off-farm work, mean 7.8 8.2 7.8 8.1 6.5 8.9 Work days per month in off-farm work when
engaged, mean 20.3 18.6 20.3 21.0 19.5 20.6
Off-farm work income for those engaged, monthly TShs ’000s, mean 130.3 84.0 133.5 177.7 88.2 142.3
TShs ’000s, median 77.5 60.0 80.0 92.5 50.0 77.5 Farming experience Mean, years 21.9 22.6 21.8 27.3 20.1 18.4 Median, years 20 22 20 23 20 16 Farm area Mean, ha 2.61 2.95 2.60 1.36 1.91 4.50 Median, ha 1.62 1.21 1.62 1.11 1.62 3.04
Acquired most of land by purchase or rent (%) 16.9 10.0 16.9 14.0 19.0 16.7 Characterizes soil quality of farm as poor (%) 91.6 90.0 91.7 90.6 90.5 93.8
n 193 10 183 64 63 66 Source: Tanzania farmer survey.

30
Fertilizer Use on Crops The farmer survey for this study focused on three crops on which fertilizer is sometimes used in the study areas—maize, rice, and vegetables. Table 5.3 shows which proportion of the sample of farmers produces each crop, and of those farmers, which proportion uses fertilizer on the crop. Maize is the principal crop grown by all sample farmers and the main one that receives fertilizer. Indeed, when considering the use of fertilizer by smallholder farmers in Tanzania on food crops, one is principally examining fertilizer use on maize. Far fewer famers in the sample grew rice than was anticipated—only in Songea and only by a dozen farmers in the sample. Vegetables are produced by farmers in all three study zones, but only about 30 percent of vegetable producers use fertilizer.
Table 5.3—Maize, rice, and vegetables—Proportion producing crop and using fertilizer on crop (in percentages)
All Hai Iringa Rural
Songea Rural
Maize 99.5 100.0 98.4 100.0 Of whom use fertilizer 94.8 95.3 90.3 98.5
Rice 6.2 — — 18.2 Of whom use fertilizer 50.0 — — 50.0
Vegetables 58.5 57.8 63.5 54.5 Of whom use fertilizer 31.0 10.8 45.0 36.1
n 193 64 63 66 Source: Tanzania farmer survey. Note: Dashes indicate crop not produced by sample farmers in study area.
Table 5.4 contrasts the crop management of farmers according to whether they use fertilizer on the crop in question. In general, farmers who use fertilizer on a crop will have a larger area planted to that crop, are more likely to use commercial improved seed, and are more likely to have hired labor from off-farm to perform some of the crop operations during the course of the growing season or at harvest. Pesticide use varies by crop—fertilizer users are less likely to use it on maize but more likely to use it on vegetables. However, fertilizer users appear to be less likely to use available organic resources (mulch or manure, in particular) for soil fertility management on their maize and vegetable plots.
Table 5.4—Crop management characteristics, by crop and fertilizer use on crop
Crop Maize Rice Vegetables
Fertilizer Use Non-user User All Non-
user User All Non-user User All
Area under crop, ha, mean 0.83 1.54 1.50 0.38 0.74 0.58 0.07 0.28 0.14 Median 0.81 0.81 0.81 0.20 0.40 0.40 0.03 0.10 0.10
Commercial seed (%) 30.0 78.0 75.5 — — — 55.1 80.0 62.8 Organic materials used for soil
fertility management (%) 80.0 20.4 23.6 — — — 96.1 57.1 84.1
Commercial pesticide use (%) 50.0 45.6 45.8 — — — 26.9 68.6 39.8 Off-farm labor hired for some crop
operations (%) 30.0 74.0 71.7 33.3 50.0 41.7 2.6 40.0 14.2
n 10 182 192 6 6 12 78 35 113 Source: Tanzania farmer survey. Note: Dashes indicate input not used on crop by sample farmers in study area.

31
Some information about fertilizer use by sample farmers is presented in Table 5.5.15 Farmers use quite high amounts of fertilizer for maize. Sample farmers who used fertilizer were asked to estimate what their yields would have been had they not used fertilizer in 2010. Maize yields were estimated to increase by a factor of four and rice by two.
Table 5.5—Fertilizer use, by crop
Maize Rice Vegetables
Principal fertilizers applied Urea, DAP Urea,
Ammonium Sulphate
CAN, DAP
Fertilizer application rate, kg/ha, median 220 124 247 Fertilized crop yield, kg per ha, median 2,471 1,980 —
Estimated unfertilized crop yield, kg per ha, median 618 990 — Estimated fertilizer use efficiency, kg additional crop
harvested per kg fertilizer applied, median 6.9 3.2 —
Price obtained for fertilized crop in 2010, TShs per kg, median 300 275 —
Source: Tanzania farmer survey. Notes: Dashes indicate statistics could not be computed for crop grown by sample farmers.
CAN = Calcium Ammonium Nitrate; DAP = Diammonium Phosphate.
The most common vegetables to which sample farmers applied fertilizer were tomatoes, cabbage, and green leafy vegetables. Overall, maize and vegetables were the principal crops to which fertilizer was applied in the study areas. A handful of sample farmers reported applying fertilizer to crops in addition to rice in Songea. However, the only other fertilized crops mentioned by more than one or two farmers were Irish potato, primarily in Iringa, and bean and pea, primarily in Songea.
Access to Fertilizer Some characteristics of how the farmers in the study sample who use fertilizer obtain the input are presented in Table 5.6. Most farmers purchase fertilizer only once in the course of a year. Iringa-area farmers reported that they made their fertilizer purchases quite early, well before the rains come. Purchases in Songea and Hai correspond with the onset of main rains in those districts. Two to eight bags of fertilizer are the most common amounts noted as being obtained in the principal purchase of fertilizer made by sample farmers in 2010.
15 As considerable variance was seen in the data, only medians are presented here. Since several vegetables were grown with
fertilizer, aggregate statistics could not be computed.
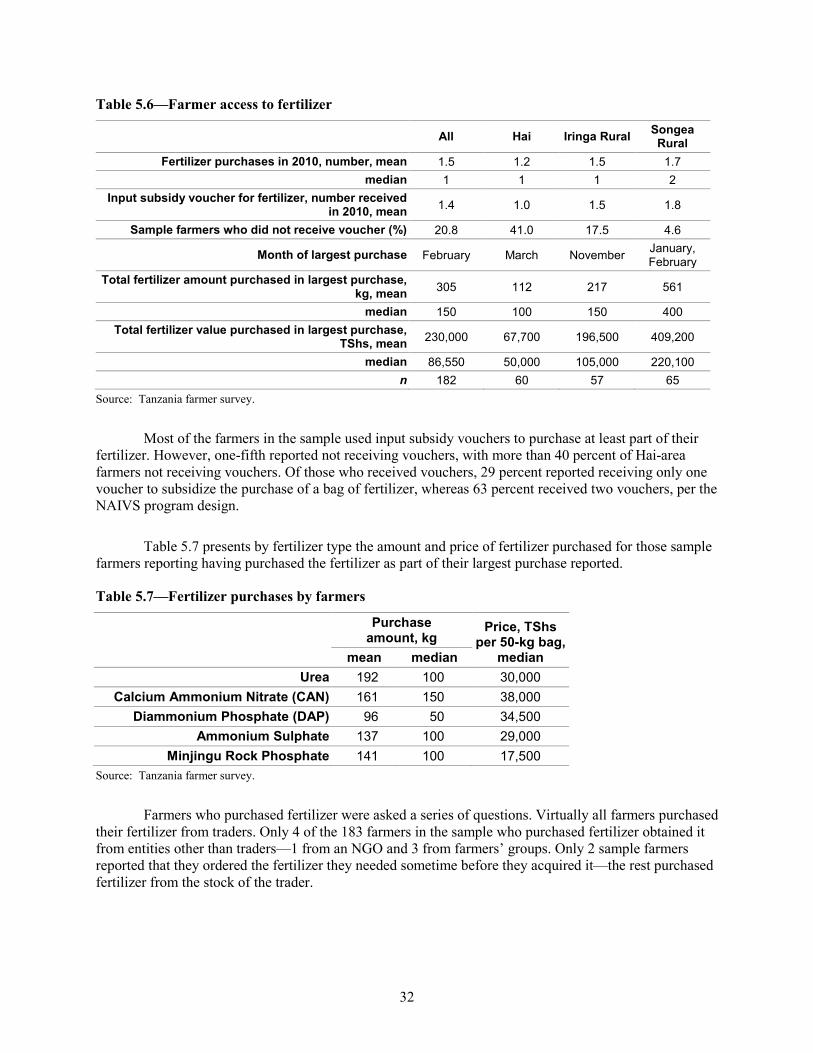
32
Table 5.6—Farmer access to fertilizer
All Hai Iringa Rural Songea Rural
Fertilizer purchases in 2010, number, mean 1.5 1.2 1.5 1.7 median 1 1 1 2
Input subsidy voucher for fertilizer, number received in 2010, mean 1.4 1.0 1.5 1.8
Sample farmers who did not receive voucher (%) 20.8 41.0 17.5 4.6
Month of largest purchase February March November January, February
Total fertilizer amount purchased in largest purchase, kg, mean 305 112 217 561
median 150 100 150 400 Total fertilizer value purchased in largest purchase,
TShs, mean 230,000 67,700 196,500 409,200
median 86,550 50,000 105,000 220,100 n 182 60 57 65
Source: Tanzania farmer survey.
Most of the farmers in the sample used input subsidy vouchers to purchase at least part of their fertilizer. However, one-fifth reported not receiving vouchers, with more than 40 percent of Hai-area farmers not receiving vouchers. Of those who received vouchers, 29 percent reported receiving only one voucher to subsidize the purchase of a bag of fertilizer, whereas 63 percent received two vouchers, per the NAIVS program design.
Table 5.7 presents by fertilizer type the amount and price of fertilizer purchased for those sample farmers reporting having purchased the fertilizer as part of their largest purchase reported.
Table 5.7—Fertilizer purchases by farmers
Purchase amount, kg
Price, TShs per 50-kg bag,
median mean median Urea 192 100 30,000
Calcium Ammonium Nitrate (CAN) 161 150 38,000 Diammonium Phosphate (DAP) 96 50 34,500
Ammonium Sulphate 137 100 29,000 Minjingu Rock Phosphate 141 100 17,500
Source: Tanzania farmer survey.
Farmers who purchased fertilizer were asked a series of questions. Virtually all farmers purchased their fertilizer from traders. Only 4 of the 183 farmers in the sample who purchased fertilizer obtained it from entities other than traders—1 from an NGO and 3 from farmers’ groups. Only 2 sample farmers reported that they ordered the fertilizer they needed sometime before they acquired it—the rest purchased fertilizer from the stock of the trader.

33
Only 5 sample farmers were able to purchase fertilizer on credit from traders. Of farmers who purchased fertilizer, 18 percent reported that they obtained credit from entities other than traders to purchase their fertilizer. Of the 34 farmers in the sample reporting having done so, 11 obtained personal loans from family, 2 received personal loans from non–family members, 3 obtained commercial loans, 16 reported obtaining loans from Savings and Credit Cooperatives, and 2 reported obtaining loans from NGOs.
Table 5.8 provides some indication of the proximity of sample farmers to fertilizer dealers. In general, the sample farmers can find fertilizer for sale quite close to their farms—certainly much closer than is likely so for most farmers in Tanzania. Recall that the sample was purposively chosen to focus on fertilizer use and is not representative of all smallholder farmers in Tanzania. About 40 percent of the sample farmers who purchased fertilizer paid for transport of the fertilizer from the dealers to their farms. The other farmers carried it themselves on foot or on their own bicycles or motorcycles. Those who paid for transport generally used public transport. The median cost of transporting the fertilizer per kilogram per kilometer for those sample farmers who paid for transport was TShs 4.00. However, the mean cost was considerably higher than this in Hai and Iringa, indicating that some farmers faced quite substantial costs in transporting their fertilizer to their farms.
Table 5.8—Transport of fertilizer from dealer to farm and time from purchase to application
All Hai Iringa Rural
Songea Rural
Distance to fertilizer supplier from farm, kilometer, mean 4.8 7.9 2.6 3.7
Median 1.0 4.8 1.0 0.5 Fertilizer transport cost from supplier to
farm, TShs per kg per kilometer, mean 10.07 6.58 21.94 9.31
Median 4.00 2.72 7.50 10.00 Time from fertilizer purchase to
application, days, mean 9.0 7.1 11.0 9.0
Median 3 1 2 5 n 183 61 57 65
Source: Tanzania farmer survey.
Most farmers obtain their fertilizer just before they apply it. The median time period between purchase and application across the sample of farmers who purchased fertilizer was three days. However, about 20 percent of farmers reported purchasing their fertilizer two weeks to one month in advance of application, with a handful purchasing their fertilizer two or three months in advance. This is particularly so for sample farmers in Iringa.
Farmers were asked the sources that they use to learn how best to use fertilizer on their crops. The government extension service was the most commonly mentioned source of such information, followed by farmers’ own experience and training and experience received through farmers’ group participation. However, only 40 percent of sample farmers reported participating in any activities of the government extension services, even though more than 40 percent reported obtaining information about fertilizer use from the extension service. Nonetheless, if the information about fertilizer use offered by the extension service is appropriate, there is scope for expanding farmers’ knowledge base about fertilizer use through improving the quality and intensity of their contacts with the extension service.
34
6. DISCUSSION
The overall objective of this study was to investigate supply-side constraints to fertilizer use by smallholder famers in Tanzania that are due in part either to government actions or to government inaction. The government actions that could constrain the supply of fertilizer include policies, regulations, or taxes that result in higher prices for fertilizer for smallholder farmers. Government inaction that could have a similar result is primarily in the area of missing investments in public goods that, were they in place, would reduce the costs or risks to farmers of using fertilizer.
The broad finding of this study is that the government of Tanzania has taken actions in the past that generally have been conducive to improving farmers’ access to fertilizer. The liberalization of agricultural input markets has increased private-sector participation in these markets. Although the pool of importers and wholesalers of fertilizer in Tanzania remains quite small, all indications are that a competitive market exists. Efforts are being made with the support of Tanzania’s development partners to strengthen the retailing sector of agricultural inputs by building the commercial skills of private traders. Although many observers might question in principle the high level of intervention by the government in agricultural input markets in Tanzania by its providing expensive fertilizer subsidies for several million smallholder farmers, the design of NAIVS, when compared to most of the other fertilizer subsidy programs for smallholders in other African countries, generally does not work against the interests of private firms engaged in the provision of fertilizer. Although a few direct taxes and fees on fertilizer supply activities remain that seem difficult to justify, in general fertilizer importation and marketing activities in Tanzania are relatively unencumbered in this way. Progress can certainly be seen in the development of a wholly private-sector-led agricultural input market in Tanzania serving the needs of its smallholder farmers.
However, this study also pointed to several areas where government inaction is having an adverse effect on efforts to increase agricultural productivity in Tanzania through the increased use of inorganic fertilizer. The most important of these missing public goods are not specific to increasing smallholder adoption of inorganic fertilizer but are implicated in broad efforts for increased economic growth in Tanzania. Among these broader general initiatives that the government must lead is improving transportation links within the country to reduce transport costs for both input and output markets both regionally and locally. This includes continuing public investments to increase the efficiency of operations at the Dar es Salaam port and restructuring some of its operations, including allowing the private sector to take on some roles now reserved for the port authority. Other areas that the government of Tanzania must continue to address include expanding and strengthening agricultural credit supply for farmers and input retailers as well as for large-scale fertilizer importers and wholesalers; improving the flow of information to farmers and traders about market prices, which they need to make sound commercial decisions; and improving the flow of information about profitable and sustainable agricultural production techniques so that farmers can exploit any market opportunities that they identify.
Nonetheless, as was noted in this paper, there are several fertilizer-specific initiatives that the government should address to maintain a pattern of increased use of fertilizer in Tanzania by smallholders and higher levels of crop productivity nationally.
Overcoming Information Constraints There are two areas where a lack of information about fertilizer use results in either higher costs or inefficient use of inorganic fertilizer for smallholder farmers in Tanzania. First, farmers generally have limited scientific information about the proper agronomic use of fertilizer on their crops within the particular agroecological conditions under which they farm. Farmers and traders surveyed for this study reported that farmers’ use of fertilizer was done in a quite uninformed manner. Farmers continued to use the same fertilizers that they had used in the past on their crops, with little consideration of whether those fertilizers were the best choice for overcoming any crop nutrient deficiencies in the soil on which they planted. For increased agricultural production in Tanzania through the use of modern production
35
technologies, compilations of all knowledge on the proper application of these technologies, including for inorganic fertilizer, is needed. Farmers and those who advise them need to know for the particular agroecological zone in which they farm what nutrient deficiencies may be limiting nutrient crop yields and how those nutrient limitations can best be addressed using fertilizers as part of a comprehensive soil fertility management approach.
The area-specific fertilizer recommendations by district (Samki and Harrop 1984) and agroecological zone (Mowo et al. 1993) for Tanzania are a valuable foundation from which to develop updated and widely disseminated guidance on appropriate and profitable fertilizer use for farmers. It is not apparent that the agricultural advisory services currently offered to farmers draw any guidance from these important syntheses of past research. However, those recommendations must be revisited and revised to incorporate all new information that has come to light since they were produced. Consideration should also be given to the fertilizer formulations that are put on the market in Tanzania—are they providing the proper plant nutrients needed at the lowest cost? Thereafter, an extensive program of demonstrations of the application on maize of different fertilizer packages side by side should be mounted in all of the higher-potential farming areas of the country where fertilizer is likely to make good sense for farmers to employ.
Fertilizer recommendations are developed primarily from an economic analysis of crop yield response to fertilizer and not solely from consideration of the agronomic response observed in fertilizer trials and demonstrations. As such, the second important information gap for fertilizer use in Tanzania has to do with the economics of fertilizer use on maize and the other crops grown by smallholder farmers on which fertilizer might profitably be used. Few farmers have access to this sort of information or know how they might determine themselves whether fertilizer use will be profitable on their own farms. In its simplest form, such an analysis takes into account the full cost of fertilizer, the likely yield response the farmer will obtain from the use of fertilizer, and the returns that the farmer can expect to receive from the sale of her or his fertilized crop in local output markets. A regular and ongoing program of agronomic and economic research is required to compile, validate, and disseminate a consistent and robust set of crop- and area-specific fertilizer recommendations. These recommendations need to be adaptable for changing market price conditions both for fertilizer and for the crops on which the fertilizer is used. Data obtained from the fertilizer package demonstrations noted in the previous paragraph will provide a useful database by which to validate the fertilizer recommendation and reassess them as input and output prices change. Such recommendations also should be able to be modified appropriately for use by resource-constrained farmers who need to choose which elements of a recommended fertilizer application package they should prioritize in their farming practices.
Regulatory Reform In the discussion in the body of this paper about the legislation now being put in place to regulate the importation and marketing of inorganic fertilizer, we suggested that at least for the standard, high-analysis fertilizers that are most commonly used in Tanzania, the fertilizer regulations being proposed, if comprehensively implemented, would be a poor fit for the public benefits sought through the regulations. A considerably lighter regulatory regime would allow more high-analysis fertilizer onto the Tanzania market in more places, resulting in lower costs for Tanzanian farmers. The Ministry of Agriculture should be judicious in its implementation of this legislation. In doing so, the ministry must balance, with attention to the aggregate public interest, the need for continuing development of input markets against fraudulent behavior in these markets. We would argue that the greater part of efforts to ensure the quality of fertilizers in open and competitive markets is achieved through self-regulation processes tied to sufficient information about product quality to inform farmers and through ample choice of suppliers.

36
On this issue, TBS must be given considerably greater responsibility for both analytical and policing functions related to the marketing of inorganic fertilizer. Arguments for duplication of functions across TBS and the Ministry of Agriculture for inorganic fertilizer, in particular, are weak. It is well within the expertise of TBS to provide oversight on the quality of high-analysis fertilizers imported and traded in Tanzania.
Policy Inconsistencies Possibly as a reflection of the particular path of political and economic evolution that Tanzania has taken during the past 50 years, there are some stark inconsistencies in the development vision that the government of Tanzania is seeking to realize. In the context of fertilizer, the actions of the government and its development partners to promote the use of commercial inputs for higher agricultural productivity are regularly subverted by government action in agricultural output markets that curtail the returns that farmers using commercial inputs might obtain from their investments. It is illogical that the government of Tanzania spends a substantial portion of its budget for agriculture on fertilizer subsidies at the same time that it restricts the market for the maize and rice produced using that fertilizer by closing its borders to trade in staple foods in the interest of national food security. The design of NAIVS is that after three years of receiving subsidized inputs, farmers will have experimented sufficiently with the technologies, increased their incomes, and accumulated assets and savings to enable them to use fertilizer and improved seeds wholly on a commercial basis. This will not be possible in the absence of remunerative and reliable output markets for their fertilized crops. For the purposes of moving smallholder farmers in Tanzania to a sustainable higher level of agricultural production, the government of Tanzania must seek other mechanisms to ensure national food security than restricting the output markets for its farmers.
To conclude, Tanzania still has the land available to meet the food and other agriculture-supplied needs of its growing population by expanding the amount of arable land put into production. However, there is clearly a need for intensification of agricultural production in several areas, particularly in the high agricultural potential zones of the country, where the population density has risen to levels that make it difficult for sufficient production to come off of existing cropland using traditional production methods. The government of Tanzania must continue to pay attention to how it can enable smallholder farmers to profitably and appropriately make use of inorganic fertilizer, improved seed and planting materials, and other improved agricultural technologies for higher agricultural production by smallholders. Paying attention to supply-side factors related to the use of inorganic fertilizer is an important element of such efforts. Important steps have been taken during the past 15 to 20 years toward building a sustainable, private-sector-led agricultural input market in the country. However, the achievement of this ambition is not ensured. It is hoped that some of the insights offered through this study may prompt decisions that will propel and strengthen these efforts.
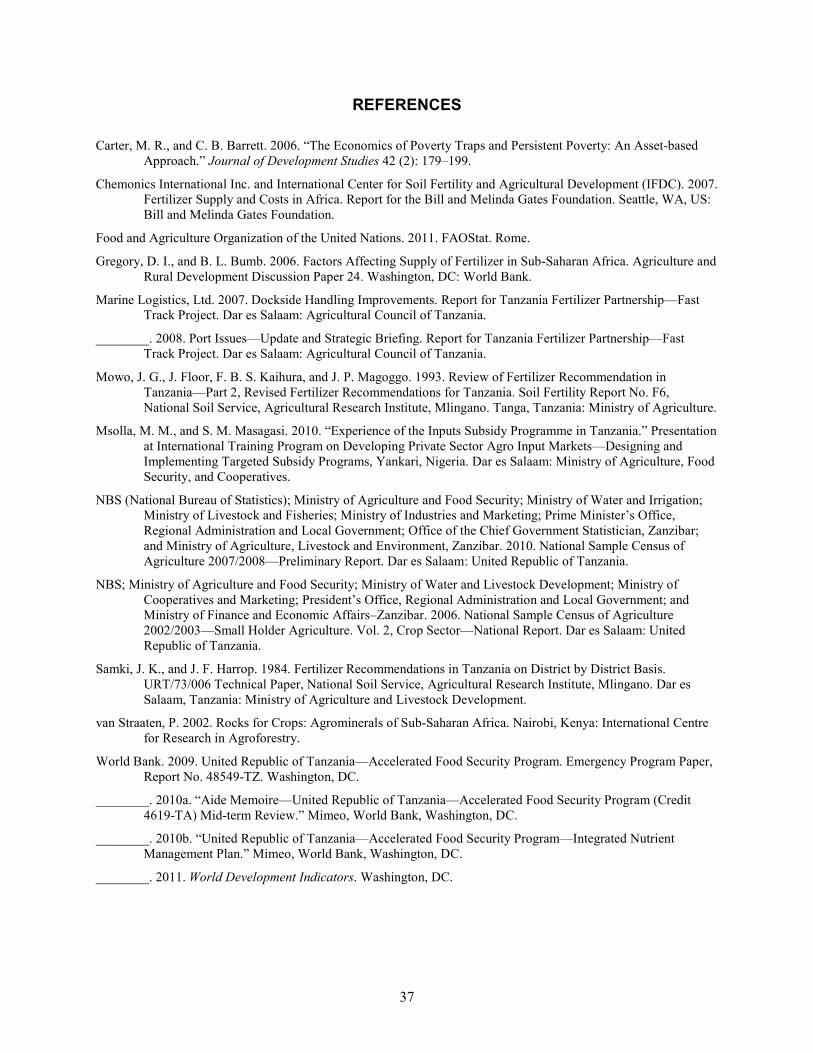
37
REFERENCES
Carter, M. R., and C. B. Barrett. 2006. “The Economics of Poverty Traps and Persistent Poverty: An Asset-based Approach.” Journal of Development Studies 42 (2): 179–199.
Chemonics International Inc. and International Center for Soil Fertility and Agricultural Development (IFDC). 2007. Fertilizer Supply and Costs in Africa. Report for the Bill and Melinda Gates Foundation. Seattle, WA, US: Bill and Melinda Gates Foundation.
Food and Agriculture Organization of the United Nations. 2011. FAOStat. Rome.
Gregory, D. I., and B. L. Bumb. 2006. Factors Affecting Supply of Fertilizer in Sub-Saharan Africa. Agriculture and Rural Development Discussion Paper 24. Washington, DC: World Bank.
Marine Logistics, Ltd. 2007. Dockside Handling Improvements. Report for Tanzania Fertilizer Partnership—Fast Track Project. Dar es Salaam: Agricultural Council of Tanzania.
________. 2008. Port Issues—Update and Strategic Briefing. Report for Tanzania Fertilizer Partnership—Fast Track Project. Dar es Salaam: Agricultural Council of Tanzania.
Mowo, J. G., J. Floor, F. B. S. Kaihura, and J. P. Magoggo. 1993. Review of Fertilizer Recommendation in Tanzania—Part 2, Revised Fertilizer Recommendations for Tanzania. Soil Fertility Report No. F6, National Soil Service, Agricultural Research Institute, Mlingano. Tanga, Tanzania: Ministry of Agriculture.
Msolla, M. M., and S. M. Masagasi. 2010. “Experience of the Inputs Subsidy Programme in Tanzania.” Presentation at International Training Program on Developing Private Sector Agro Input Markets—Designing and Implementing Targeted Subsidy Programs, Yankari, Nigeria. Dar es Salaam: Ministry of Agriculture, Food Security, and Cooperatives.
NBS (National Bureau of Statistics); Ministry of Agriculture and Food Security; Ministry of Water and Irrigation; Ministry of Livestock and Fisheries; Ministry of Industries and Marketing; Prime Minister’s Office, Regional Administration and Local Government; Office of the Chief Government Statistician, Zanzibar; and Ministry of Agriculture, Livestock and Environment, Zanzibar. 2010. National Sample Census of Agriculture 2007/2008—Preliminary Report. Dar es Salaam: United Republic of Tanzania.
NBS; Ministry of Agriculture and Food Security; Ministry of Water and Livestock Development; Ministry of Cooperatives and Marketing; President’s Office, Regional Administration and Local Government; and Ministry of Finance and Economic Affairs–Zanzibar. 2006. National Sample Census of Agriculture 2002/2003—Small Holder Agriculture. Vol. 2, Crop Sector—National Report. Dar es Salaam: United Republic of Tanzania.
Samki, J. K., and J. F. Harrop. 1984. Fertilizer Recommendations in Tanzania on District by District Basis. URT/73/006 Technical Paper, National Soil Service, Agricultural Research Institute, Mlingano. Dar es Salaam, Tanzania: Ministry of Agriculture and Livestock Development.
van Straaten, P. 2002. Rocks for Crops: Agrominerals of Sub-Saharan Africa. Nairobi, Kenya: International Centre for Research in Agroforestry.
World Bank. 2009. United Republic of Tanzania—Accelerated Food Security Program. Emergency Program Paper, Report No. 48549-TZ. Washington, DC.
________. 2010a. “Aide Memoire—United Republic of Tanzania—Accelerated Food Security Program (Credit 4619-TA) Mid-term Review.” Mimeo, World Bank, Washington, DC.
________. 2010b. “United Republic of Tanzania—Accelerated Food Security Program—Integrated Nutrient Management Plan.” Mimeo, World Bank, Washington, DC.
________. 2011. World Development Indicators. Washington, DC.


RECENT IFPRI DISCUSSION PAPERS
For earlier discussion papers, please go to www.ifpri.org/pubs/pubs.htm#dp. All discussion papers can be downloaded free of charge.
1229. The supply of inorganic fertilizers to smallholder farmers in Mozambique: Evidence for fertilizer policy development. Todd Benson, Benedito Cunguara, and Tewodaj Mogues, 2012.
1228. The supply of inorganic fertilizers to smallholder farmers in Uganda: Evidence for fertilizer policy development. Todd Benson, Patrick Lubega, Stephen Bayite-Kasule, Tewodaj Mogues, and Julian Nyachwo, 2012.
1227. Taxation policy and gender employment in the Middle East and north Africa region: A Comparative analysis of Algeria, Egypt, Morocco, and Tunisia. Ismaël Fofana, Erwin Corong, Rim Chatti, Sami Bibi, and Omar Bouazouni, 2012.
1226. Policy reform toward gender equality in Ethiopia: Little by little the egg begins to walk. Neha Kumar and Agnes R. Quisumbing, 2012.
1225. Improving the Measurement of food security. Derek Headey and Olivier Ecker, 2012.
1224. Improved performance of agriculture in Africa south of the Sahara: Taking off or bouncing back. Alejandro Nin-Pratt, Michael Johnson, and Bingxin Yu, 2012.
1223. Review of input and output policies for cereals production in Pakistan. Abdul Salam, 2012.
1222. Supply and demand for cereals in Pakistan, 2010–2030. Hina Nazli, Syed Hamza Haider, and Asjad Tariq, 2012.
1221. The road to specialization in agricultural production: Evidence from Rural China. Yu Qin and Xiaobo Zhang, 2012.
1220. Change and diversity in smallholder rice–fish systems: Recent evidence from Bangladesh. Madan M. Dey, David J. Spielman, A.B.M. Mahfuzul Haque, Md. Saidur Rahman, and Rowena A. Valmonte-Santos, 2012.
1219. Is MERCOSUR’s external agenda pro-poor?: An assessment of the European Union-MERCOSUR free-trade agreement on poverty in Uruguay applying MIRAGE. Carmen Estrades, 2012.
1218. Heterogeneous pro-poor targeting in India’s Mahatma Gandhi national rural employment guarantee scheme. Yanyan Liu and Christopher B. Barrett, 2012.
1217. The impacts of public investment in and for agriculture: Synthesis of the existing evidence. Tewodaj Mogues, Bingxin Yu, Shenggen Fan, and Linden McBride, 2012.
1216. What determines public expenditure allocations?: A review of theories, and implications for agricultural public investment. Tewodaj Mogues, 2012.
1215. Nonlinear dynamics of livestock assets: Evidence from Ethiopia. Bjorn Van Campenhout and Stefan Dercon, 2012.
1214. An overview of Chinese agricultural and rural engagement in Tanzania. Deborah Bräutigam and Xiaoyang Tang, 2012.
1213. The partially liberalized cocoa sector in Ghana: Producer price determination, quality control, and service provision. Shashidhara Kolavalli, Marcella Vigneri, Haruna Maamah, and John Poku, 2012.
1212. Structural change in Argentina, 1935-60: The role of import substitution and factor endowments. Dario Debowicz and Paul Segal, 2012.
1211. Traceability in a supply chain with repeated moral hazard. Alexander E. Saak, 2012.
1210. Managing transition in Yemen: An assessment of the costs of conflict and development scenarios for the future. Clemens Breisinger, Olivier Ecker, Perrihan Al Riffai, Wilfried Engelke, and Abdulmajeed Al-Bataly, 2012.
1209. Bangladesh rice trade and price stabilization: Implications of the 2007/08 experience for public stocks. Paul A. Dorosh and Shahidur Rashid, 2012.
1208. Analyzing intersectoral convergence to improve child undernutrition in India: Development and application of a framework to examine policies in agriculture, health, and nutrition. Rajani Ved and Purnima Menon, 2012.
1207. Branding and agricultural value chains in developing countries: Insights from Bihar, India. Bart Minten, K.M. Singh, and Rajib Sutradhar, 2012.
1206. Costly posturing: Relative status, ceremonies, and early child development in China. Xi Chen and Xiaobo Zhang, 2012.

INTERNATIONAL FOOD POLICY RESEARCH INSTITUTE
www.ifpri.org
IFPRI HEADQUARTERS 2033 K Street, NW Washington, DC 20006-1002 USA Tel.: +1-202-862-5600 Fax: +1-202-467-4439 Email: [email protected]
IFPRI ADDIS ABABA P. O. Box 5689 Addis Ababa, Ethiopia Tel.: + 251 (0) 11-617-2500 Fax: + 251 (0) 11-646-2927 Email: [email protected]