the swedish food retail market - diva portal
TRANSCRIPT

The Swedish Food Retail Market
-An econometric analysis of the competition on local food retail markets-
Malin Blank & Anna Maria Persson

Avdelning, Institution Division, Department Ekonomiska institutionen 581 83 LINKÖPING
Datum Date 2004-08-30
Språk Language
Rapporttyp Report category
ISBN
Svenska/Swedish X Engelska/English
Licentiatavhandling Examensarbete
ISRN Nationalekonomi 2004/9
C-uppsats X D-uppsats
Serietitel och serienummer Title of series, numbering
ISSN
Övrig rapport ____
URL för elektronisk version http://www.ep.liu.se/exjobb/eki/2004/nek/009/
Title
The Swedish food retail market - An econometric analysis of the competition on local food retail markets.
Author Malin Blank & Anna Maria Persson
Abstract The Swedish food retail market contains of three major actors, ICA, KF and Axfood, all in all dominating 75 percent of the total market shares. The scant number of retailing actors indicates that the Swedish food retail market is a highly concentrated oligopoly, which as a fact has given rise to definite discussions and argumentations concerning the market situation. But is the food retail market imperfect and how do we reach a workable competition? Economic theory does not provide any clear answer on these questions, but is rather divided into two fundamentally different approaches to define competition: the static and the dynamic perspective on competition. In an attempt to examine the competition on local Swedish retail markets, the purpose of this study is to carry out an econometric model estimating the situation. The model serves to explain the variation of ICA’s achievements measured in terms of turnovers obtained in the company. The explanatory variables composing the model are divided into three separate groupings: degree of market concentration, store-specific factors and region-specific factors. Furthermore, in order to find out which one of the competitive explanations best fits the reality, the regression results are interpreted from a static and a dynamic perspective of competition. In part, we also aim to compare the results with the outline of the Swedish competition law. We found that the level of concentration obtained in our material is high and is steadily increasing. We also found that stores do not, in any great extent, use price, service and quality as competitive methods. Thus, to gain competitive advantage, market actors must find other ways to carry out strategic market activities. The region-specific variables had either none or very little influence on ICA’s turnover. According to these findings, neither the static nor the dynamic perspective of competition is solely able to produce an accurate method for reaching a state of a workable competition. Instead, a combination of the static and the dynamic ideas may be regarded as the most advantageous way to generate suitable conditions for competition to be efficient. Therefore, in order to promote workable competition, the Swedish competition law must consist of a balance between the static and the dynamic view of competition.
Keyword Grocery retail, concentration, competitive tools, dynamic perspective of competition, static perspective of competition, the Swedish competition law.

Språk Language
Rapporttyp Report category
ISBN
Svenska/Swedish X Engelska/English
Licentiatavhandling Examensarbete
ISRN Nationalekonomi 2004/9
C-uppsats X D-uppsats
Serietitel och serienummer Title of series, numbering
ISSN
Övrig rapport ____
URL för elektronisk version http://www.ep.liu.se/exjobb/eki/2004/nek/009/
Titel
Den Svenska dagligvarumarknaden - En ekonometrisk analys om konkurrensen på lokala dagligvarumarknader.
Författare
Malin Blank & Anna Maria Persson
Sammanfattning Den svenska dagligvarumarknaden består idag till största del av tre aktörer, ICA, KF och Axfood. Tillsammans innehar de 75 procent av marknadens andelar. På grund av få aktörer kan den svenska dagligvarumarknaden ses som en hög koncentrerad oligopolmarknad. Detta har givit upphov upp till diskussioner om huruvida denna marknadsstruktur hämmar konkurrensen. Skulle marknaden vara imperfekt hur ska då en effektiv konkurrens uppnås? Ekonomisk konkurrensteori ger inget entydigt svar på denna fråga utan är istället uppdelad i två fundamentalt skilda synsätt gällande konkurrens: det statiska och det dynamiska konkurrensperspektivet. Med hjälp av en ekonometrisk modell vill vi med denna uppsats undersöka konkurrensen på lokala svenska dagligvarumarknader. Modellen är tänkt att förklara fluktuationen i ICAs omsättning vilket här ska ses som ett mått på ICAs prestationer. Modellens förklaringsvariabler är indelade i tre grupper: graden av marknadskoncentration, butiksspecifika faktorer och regionspecifika faktorer. Vidare kommer vi att analysera regressionsresultaten både från ett statiskt och dynamiskt perspektiv för att kunna se vilket av perspektiven som bäst stämmer överens med verkligheten på den svenska dagligvarumarknaden. Slutligen vill vi också väldigt kort jämföra resultaten med den svenska konkurrenslagen. Vår undersökning visar på att marknadskoncentrationen är väldigt hög och fortsätter att öka. Regressionsresultaten pekar också på att butiker inte i så stor utsträckning använder sig av pris, service och kvalité som konkurrensverktyg. Butiker använder sig istället av andra konkurrensmedel för att nå marknadsdominans. De regionspecifika faktorerna hade ingen eller väldigt liten påverkan på ICAs omsättning. Genom dessa analytiska resultat kan vi ses att varken det statiska eller det dynamiska perspektivet ger en bra förklaring hur effektiv konkurrens på lokala svenska dagligvarumarknader bör uppnås. Istället vill vi lyfta fram att en kombination av dessa synsätt kan skapa goda förutsättningar för att nå fram till en effektiv konkurrens. Detta innebär också att den svenska konkurrenslagen kan uppfattas som hämmande och bör därför utvecklas så att det finns en balans mellan dessa två perspektiv.
Nyckelord Dagligvaruhandel, koncentration, konkurrensverktyg, dynamisk konkurrensteori, statisk konkurrensteori, Svenska konkurrenslagen.
Avdelning, Institution Division, Department Ekonomiska institutionen 581 83 LINKÖPING
Datum Date 2004-08-30

Acknowledgement The planning and process of completing this report has lasted for half a year. This has been a most instructive time, involving hard work and educative challenges. However, the realisation of this report would not have been possible without the help and support of a number of people. We would therefore like to take the possibility to express our gratitude towards these people. First of all we would like to thank Handelns Utredningsinstitut, HUI, for providing us with a great data material necessary for carrying out this study. Moreover, we would like to send a special thanks to Nils Bohlin at HUI, for supporting us with useful comments concerning our subject. Second, we would also like to express our deepest gratefulness to Inger Asp and Jan Lindvall at EKI, Linköping University, for their useful advice, encouragement and guiding, fundamentally contributing to the result of this study. Last, but not at least, we would like to take the possibility to send a grateful thought to our families for always supporting us in what we do. Malin Blank and Anna Maria Persson Linköping, September 2004.

TABLE OF CONTENTS CHAPTER 1– INTRODUCTION............................................................................................................... 7
1.1. BACKGROUND ..................................................................................................................................... 7 1.2. PURPOSE.............................................................................................................................................. 9 1.3. LIMITATION ......................................................................................................................................... 9 1.4. DISPOSITION ........................................................................................................................................ 9
CHAPTER 2 – THEORETICAL APPROACH .......................................................................................11 2.1. ECONOMIC THEORIES OF COMPETITION..............................................................................................11
2.1.1. Competition from a dynamic perspective...................................................................................11 2.1.2. Competition from a static perspective........................................................................................13
2.2. MEASURE OF MARKET CONCENTRATION ...........................................................................................14 2.2.1. Herfindahl Index ........................................................................................................................14
2.3. THE SWEDISH COMPETITION LAW FROM AN ECONOMIC PERSPECTIVE................................................15 2.3.1. Prohibition against engagement of firms in anti-competitive co-operation...............................16 2.3.2. Prohibition against abuse of a dominant market position .........................................................16
CHAPTER 3 – THE SWEDISH FOOD RETAIL MARKET .................................................................18 3.1. MARKET STRUCTURE..........................................................................................................................18
3.1.1. Structural reformation of the market .........................................................................................18 3.2. ACTORS ON THE MARKET....................................................................................................................20
CHAPTER 4 - EMPIRICAL APPROACH...............................................................................................23 4.1. THE ECONOMETRIC MODEL................................................................................................................23
4.1.1. The sample .................................................................................................................................23 4.1.2. Variables and data .....................................................................................................................24
4.1.2.1. ICA’s turnover ................................................................................................................................... 26 4.1.2.2. Degree of market concentration ......................................................................................................... 26 4.1.2.3. Store- specific variables ..................................................................................................................... 27 4.1.2.4. Region-specific variables ................................................................................................................... 28
CHAPTER 5 - RESULT .............................................................................................................................29 5.1. DESCRIPTIVE ......................................................................................................................................29 5.2. REGRESSION .......................................................................................................................................31
5.2.1. ICA’s share of total turnover .....................................................................................................31 5.2.1.1. Model 1 .............................................................................................................................................. 33 5.2.1.2. Model 2 .............................................................................................................................................. 34
5.3.1. ICA’s turnovers per capita.........................................................................................................35 5.3.1.1. Model 1 .............................................................................................................................................. 37 5.3.1.2. Model 2 .............................................................................................................................................. 38
CHAPTER 6 – ANALYSIS ........................................................................................................................39 6.1. DEGREE OF MARKET CONCENTRATION ...............................................................................................39
6.1.1. Concentration of Stores .............................................................................................................40 6.1.2. Concentration of Chains ............................................................................................................41
6.2. STORE- SPECIFIC FACTORS..................................................................................................................42 6.2.1. General characteristics of the market........................................................................................42 6.2.1. Hypermarkets .............................................................................................................................43 6.2.2. Discount stores...........................................................................................................................44 6.2.3. Service stores .............................................................................................................................45 6.2.4. Sales area per capita..................................................................................................................46

6.2.5. Other modes of competition .......................................................................................................47 6.3. REGION-SPECIFIC FACTORS.................................................................................................................48
6.3.1. Share of families with children ..................................................................................................48 6.3.2. Purchasing power ......................................................................................................................49 6.3.3. Mobility of population................................................................................................................50 6.3.4. Type of municipalities and regional location.............................................................................50
CHAPTER 7 – REMARKS ........................................................................................................................52 7.1. CONCLUDING REMARKS .....................................................................................................................52
7.1.1. Overall conclusions....................................................................................................................52 7.1.2. Static or dynamic perspective of competition?...........................................................................53
7.2. POLICY RECOMMENDATIONS..............................................................................................................55 7.3. SUGGESTIONS FOR FURTHER STUDIES .................................................................................................56
LITERATURE.............................................................................................................................................57 APPENDIX 1 ...............................................................................................................................................59 APPENDIX 2 ...............................................................................................................................................62 APPENDIX 3 ...............................................................................................................................................68 Table of figure Figure 1: Positioning map of store types within the Swedish Food Retail Market ___________________ 19 Table 1: Structural changes _____________________________________________________________ 20 Table 2: The Swedish Food Retail Market__________________________________________________ 22 Table 3: The econometric model _________________________________________________________ 26 Table 4: General______________________________________________________________________ 29 Table 5: ICA and Competitors ___________________________________________________________ 30 Table 6: Regression Result, ICA´s share of total turnover _____________________________________ 32 Table 7: Regression Result, ICA´s turnover per capita ________________________________________ 36

The Swedish Food Retail Market Chapter 1– Introduction
7
Chapter 1– Introduction
1.1. Background
“In economics ‘modern problems’, methods and results cannot be fully understood without some knowledge of how economist have come to
reason as they do” Joseph Schumpeter
Food retailing in Sweden is mainly performed through the affiliation of store chains. For years, three major groupings - ICA, KF and AxFood - have dominated the Swedish market, altogether controlling 75 percent of total market share. ICA is considered the largest actor and solely dominates about 38 percent of total market shares.1 However, due to an increasing internationalisation of the market, the Swedish food retail market is currently experiencing some structural changes. Separate European food retail markets are merging into one common market, meaning that foreign actors are being established on the Swedish market. Mainly, the foreign establishments show themselves as discount stores such as German Lidl and Danish Netto. The number of discount stores in Sweden is therefore increasing, further stimulating the structural change of the persistence of stores, which are now becoming fewer but bigger. Despite, these changes to the market ICA, KF and AxFood remain more or less unaffected, in the sense that they still dominate the market. The scant number of retailing actors indicates that the Swedish food retail market is a highly concentrated oligopoly, which as a fact has given rise to definite discussions and arguments concerning the market situation. The market lacks competition, which, among other things, continuously hinders potential firms from entering the market and pushes food prices to a higher level. Food prices in Sweden are actually proven to lie between 11 to 18 percent above European standard prices.2 So, what does this imply? Is the Swedish food retail market imperfect? If that is the case, how do we reach a more competitive state or, even better, a state of workable competition? For centuries, the meaning and definition of competition has been disputed among the representatives of economic theory, without reaching a satisfactory end. Instead, argumentation has lead to the development of two essentially different perspectives on the concept: the static perspective (neo-classical theory) and the dynamic perspective, 3 dividing the theories of competition into two main fields giving the concept of competition a very vague and ambiguous definition.4 In spite of this, the notion is regarded as one of a pervasive character often associated with attributes such as efficiency, price reductions,
1 Konkurrensverkets rapportserie 2004:2, ”Konsumenterna, matpriserna och konkurrensen”, Ekonomi-print AB, p.11. 2 Konkurrensverket rapportserie 2001:4, “ Kan Kommunerna pressa matpriserna?”, AB Dangårdsgrafiska, Ödeshög, p.5. 3 McNulty, P.J., (1968), “Economic theory and the meaning of competition”, The quarterly Journal of Economics, Vol 82, No 4, p. 643. 4McNulty, P.J., (1968), p.639.

The Swedish Food Retail Market Chapter 1– Introduction
8
improved products and service quality, all in all persuading most people to believe that competition is something desirable.5 The main core of the static philosophy consists of price theory and theories of market equilibrium, simultaneously leading to a structural and static view of competition. According to this view, markets must be well defined and consist of homogeneous products as well as a large number of sellers and buyers in order to obtain a workable competition.6 In fact, predecessors of the static vision advocate a low degree of market concentration that both maintains price competition and restrains collusion and the abuse of a dominant position.7 In contrast to the static view, advocators of the dynamic perspective describe competition as a process that operates on unspecific and non-defined markets. Thus, to obtain a workable competition both prohibitions against cartels and surveillance of abuse by firms in dominant positions are rejected, since this may negatively affect the dynamic competitive process.8 In this case highly concentrated markets may be the result of the imagination of a few firms. Hence, by offering products or services that differ from the competitors, these firms may have gained a competitive advantage, suggesting that product differentiation could be seen as a competitive instrument.9 The fact that competition has been perceived in these two quite different ways is a source of confusion when to determine how to best reach a workable competition. The Swedish Competition Law is particularly permeated by the static description of competition. Thus Swedish law prohibits firms from engaging in anti-competitive cooperation and mistreated conducts by firms with dominant position. As the static perspective prescribes, these prohibitions will promote a low degree of concentration, serving to minimise prices and create allocative advantage for consumers. However, is this really the optimal way to reach a workable competition on the Swedish food retail market? What if competition is considered a subject of several dimensions created through other determinants than just prices? If this is true should we then focus less on concentration and the determination of price when investigating in how to reach a workable competition on the Swedish food retail market? Further dimension of competition would leave room for competitive tools such as increased service, accessibility, quality or degree of experience. These kinds of strategic market activities may not only be satisfactory competitive instruments but may also serve to initiate an added value for consumers. This follows the dynamic perspective of competition, searching to compose attractive alternatives on the market that may not be attainable as long as competition bears only upon price minimising actions. Despite the importance of verifying the methods to reach a workable competition, it would be interesting to investigate the probable existence of other factors affecting the conditions 5 McNulty, P.J., (1968), p.640. 6 Van den Bergh, R. J.,Camesasca, P.D., (2001), “European Competition law and economics.” In: A comparative perspective, Hart, Oxford, p.10. 7 Stigler, G.J., (1957), “Perfect competition, Historically contemplated”, The journal of Political Economy, Vol 65, No 1, p.12. 8 Van den Bergh, R. J.,Camesasca, P.D., (2001), p. 30. 9 Hayek, F.A., (1978), “New Studies in Philosophy, Politics, Economics and the History of Ideas”, The Camelot Press Ltd, Southampton, p. 179

The Swedish Food Retail Market Chapter 1– Introduction
9
for competition. Is there for instance any possibility that exogenous determined region specific factors effect the competition on local food retail market? What is the correlation between competition and environmental factors such as mobility of population or purchasing power, type of municipality for example? Taking both regional aspects and strategic markets activities into account, it may be asked if competition on the Swedish food retail market is properly regarded as non-workable on grounds of high market concentration. If this is so does ICA, as the largest actor, benefits from such a market structure?
1.2. Purpose The main purpose of this thesis is, through an econometric analysis, to examine the competition of local Swedish retail markets by investigating plausible explanatory variables affecting ICA’s turnover. The explanatory variables, creating the model, take the form of three separate groupings: the degree of market concentration, store-specific factors and region-specific factors. Each of these is assumed to compose competitive determinants on markets. Moreover, the results are to be interpreted from static and dynamic perspectives of competition, in an attempt to find out which one of the competitive explanations best fits the reality. In part, we also aim to compare the results with the outline of the Swedish competition law.
1.3. Limitation The theories of competition as well as the Swedish food retail market are two very vast areas, impossible to fully cover within the limits of this investigation. We therefore aim to only study the field of horizontal competition, thereby excluding vertical competition, even though the latter may have been of great interest for our study. We also aim to study retail sale and not whole sales trade.
1.4. Disposition Chapter 2: In order to better comprehend the following chapters and the discussion in the analyses we describe the general features of the dynamic and the static perspective. This follows by a section on how to measure market concentration. The chapter ends with a presentation of the Swedish Competition Law from an economic perspective. Chapter 3: Description of the Swedish food retail market is given in this chapter. The chapter starts with an overview of the structural reformation on the market and ends with a section about the actors on the market. Chapter 4: Here we present our econometric model which constitutes the foundation for this research. The first section describes the methods for sampling the observations following by a section explaining the data and determination of the variables. Chapter 5: The Chapter contains the main core of this thesis, the results. First we present statistical descriptive concerning our material, second we describe the regression results. To make it easier to follow the presentation of the results we start with the results derived from

The Swedish Food Retail Market Chapter 1– Introduction
10
ICA’s share of total turnover following by the results based on the dependent variable ICA’s turnover per capita. Chapter 6: In this chapter we analyse the results with the information given in chapter two and three. Since the explanatory variables are divided into separate groupings we analyse each group separately, starting with the degree of market concentration following by store specific factors and region specific factors. Chapter 7: The last chapter sums up the conclusions of the analyses and also presents some policy recommendations concerning the road towards a workable competition.
The Swedish Food Retail Market Chapter 2– Theoretical Approach
11
Chapter 2 – Theoretical Approach
2.1. Economic Theories of Competition
“Only through the principle of competitions has political economy any pretension to the character of a science.”
John Stuart Mill All economic theories promote competition when markets are imperfect. The most significant reasons may be denoted as the endeavour to obtain productive efficiency as well as efficient allocation of resources. Theories as well as empirical surveys affirm that competition, as a rule, promotes productivity and allocation of resources, in the sense that there is no possible rearrangement of resources among firms. Competition also reduces the divergences between competitive prices and marginal production costs;10 implying that the value that a consumer places on a product is exactly equal to the marginal production cost of the product. In other words, empirical surveys show that competition increases consumers’ welfare and creates strong motivation to bring efficiency within production and distribution.11 So, what kind of guidance does economic theory of competition give to promotion or obtainment of a workable competition? This is difficult to answer despite the fact that economic theory of competition has played an important role in both competition policy and competition law during the last centuries.12 Even though the word competition is commonly used in antitrust cases and in political debate there is no other concept within economic theory that is more vague and ambiguous. There exists no consensus on how to define competition. The concept has over the last centuries developed into two fundamentally different perspectives, a static perspective (neo-classical theory) and a dynamic perspective, where the former describes competition as a market structure and the latter sees competition as a process. These ideas will be further discussed in the two following sections.
2.1.1. Competition from a dynamic perspective The dynamic perspective represents the behavioural perspective of competition, describing it as a process rather than a structure. Even though Smith declared that dynamic changes were fundamental for economic activity, Schumpeter was the first theorist to develop a more detailed version of the dynamic view of competition. Schumpeter asserted that competition did not depend on static determinants such as price. Instead, competition was enhanced
10 Horn, H., Lang, H., Lundgren, S.,(1994), “Competition, long run contracts and internal inefficiencies in firms”, European Economic Review, No. 38. p.1. 11 Konkurrensverket, (2002), ”Vårda och Skapa konkurrens – Vad krävs för ökad Konsumentnytta?”, Konkurrensverkets rapport 2002:2, p. 20. 12 Van den Bergh, R. J.,Camesasca, P.D., (2001), p.1.

The Swedish Food Retail Market Chapter 2– Theoretical Approach
12
through creation of new commodities, technology, sources of supply or types of organisations. Those kinds of competitive innovations, he argued, would strike the rivals not at the margin of profits or the output, but at their foundations and their very lives.13 Schumpeter stressed that pioneer firms often had the ability to introduce new products and methods of production, thereby constituting sources for new, alternative markets. Thus, pioneer firms represented an important part of a dynamic process. Although this process initially gave the pioneer firms a temporary monopoly position, it was not considered something bad. Instead, the monopoly position would inspire other firms to imitate their work, which in turn would stimulate the development of the market and hence economic progress.14 In other words, firms that really have market power, and not just the prospect of it, were the actual driving force in this process.15 Schumpeter also disputed that a monopoly had greater capacity to finance research and development. A market with great numbers of firms would not dare to finance this sort of research because of the associated costs and risks.16 Disciples of the Austrian school advanced the dynamic vision of competition. Von Hayek and von Mises did not believe in any kind of stationary market equilibrium but emphasised the tendency towards equilibrium. However, this process cannot be seen as something axiomatic; it all depends on entrepreneurial activity.17 Market activity should therefore be described in terms of discovery processes, where the entrepreneurs compete for consumers’ purchase by discovering new methods for production and marketing. Von Hayek contended that it is through this process that entrepreneurs learn about markets and strategic competitive activities; if firms already knew how the market works, there would be no need of any kind of competition. Furthermore, he stressed that it is of great relevance to use other competitive tools than just prices. This implies that competition is not about offering homogeneous products or services. Rather, it is an effort that through differentiation of products to reach a monopoly position. Product differentiation may therefore be seen as a competitive instrument, 18 assuming that consumers choose among all kinds of products and consider other factors than just prices.19 Referring to this, von Mises emphasised that on a market all products compete with each other, implying that monopolists that increase their prices too much or refuse to supply those for customer satisfying products, will run the risk that consumers will turn to other vendible products.20 Representatives from the Austrian school highly recommend free competition as the optimal market form. All kinds of interventions, determined by competitive legislation, are perceived as erroneous. They reject both prohibitions against cartels and the surveillance of abuse by firms in a dominant position, since these negatively affect the dynamic competitive process. The degree of market concentration is in this case not an indication of a non-workable competition. 13 Schumpeter, J.A., (1950), “Capitalism, Socialism and Democracy”, 3 Ed, Harper & Row, US, p.83 14 Van den Bergh. R. J and Camesasca. P.D., (2001), p.27. 15Vickers, J., (1995), “Concept of Competition”, Oxford Economics Papers New Series, Vol 4, No 1, p. 16. 16 Schumpeter. J, (1950), p. 106. 17 Hayek, F.A., (1978), p. 179. 18 Ibid., p. 179. 19 Besanko. D, Dranove .D, Shanely. M, Schaefer. S, (2004), “Economics of Strategy”, Lehigh Press, US, p. 214 20 Von Mises, L., (1966), “Human Action: A Treatise on Economics”, Fox & Wilkes, US, p. 278.

The Swedish Food Retail Market Chapter 2– Theoretical Approach
13
2.1.2. Competition from a static perspective The static perspective of competition derives from neo-classical theories in economics. This perspective rests its assessment of competition on price theories and market equilibrium, which has led to the emergence of the distinct idea of competition as a market structure. Cournot became the first to play an important role in static competition theory.21 Cournot started by analysing the profit-maximising problem of producers, deciding how much to supply to a market of homogenous goods, where the quantities supplied by rivals are taken as given. Through this reasoning it could be shown that an accurate measure of firms on competitive markets would lead to the reduction of prices.22 Cournot stated that the equilibrium price level converges in proportion to the cost level as the number of firms increase on the market. In other words, the excess of price over marginal cost approaches zero when the number of producers increases.23 In order to reach a satisfying degree of competition a great number of firms are required, implying that the number of firms acting on a market is a measure of competition. Cournot’s theory of competition is the foundation of the concept of perfect competition, which was further developed by neo-classical economists, like Jevons, Edgeworth, Clark and Knight. They added new conditions and made refinements of the concept of perfect competition, which evolves from their presumptions of a “perfect market”. In order to reach a perfect competition an infinite number of small profit-maximising firms that all produce and sell homogeneous products are required. Moreover, the market should consist of no cartels or barriers to entry and there should be no externalities or scales of production which can affect the market.24 Furthermore, a perfect market also requires a great number of utility-maximising consumers, all having perfect information about prices, qualities of goods and services, enabling them to fully compare products among different producers. Hence, if any firm charged overprice, customers would immediately seek to buy equivalent products from a competitive producer, asserting that firms continuously have to adjust their prices in order to keep their customers. Through this process an equilibrium price is established on the market, reflecting the marginal cost of production. Price equal to marginal cost therefore signifies an efficient allocative equilibrium and has become a hallmark for a well competitive market. 25 Another reasoning concerning the convergence of price and cost is that this relationship would be assumed to hold even though no firm had any information about the true level of marginal cost.26 Cournot stated that firms with low marginal costs would supply more than high-cost firms, which even might get shut out of production.27 Demsetz developed a similar argument, stating that competition can play an important role in selecting more efficient
21 Stigler, G.J., (1957), p.5. 22 Vickers, (1995), p. 5. 23 Stigler,(1957), p.5. 24 Ibid., p. 640. 25 Van den Bergh. R. J and Camesasca. P.D., (2001), p.10. 26 Vickers, (1995), p. 5. 27Ibid., p. 6.

The Swedish Food Retail Market Chapter 2– Theoretical Approach
14
firms from less efficient ones when costs differ among them. In that way competition is clearly promoting productive efficiency.28 Altogether, the neo-classic logic suggests that in a perfect market a competitive actor will ever be able to beat opposing firms, referring to a static situation, where competition has reached its limit. However, in such situations the degree of competition may be considered declining, since price theories do not observe the process for attaining market equilibrium.
2.2. Measure of Market Concentration Concentration depends on the number of firms acting on the market and the distribution of output among them29. From a static perspective high market concentration moderates the competitiveness on the market. It is therefore of great importance to be able to measure the degree of concentration. To make it easier to compare concentration among different domestic or international markets, precise tools of measurements are required in determining market concentration. Moreover, these measures can be used by the legal system in order to prevent further concentration on markets. Different methods have been developed in order to measure the degree of market concentration. Many of these methods require detailed information about the market actors. Lerner index or price cost margin entail information about cost structures. However, gathering this kind of information would be a time-consuming mission. We therefore choose the method of measuring market concentration when considering our data. Hence, since our data contains useable information for calculating Herfindahl index, we choose this method. Herfindahl Index will be further explained below.
2.2.1. Herfindahl Index Herfindahl index30 measures concentration and is widely used in discussions of antitrust cases31. The index equals the sum of the squared shares of all firms on a market and is formally defined as follows:
∑1
2N
iiSH
=
=
where Si denotes the market share of firm i.
28 Vickers, (1995), p. 13. 29 Shy.O, (1995), “Industrial Organization Theory and Applications”, The MIT Press, London, p.171. 30Herfindahl index is sometimes referred to as the Herfindahl – Hirschman index, denoted as HHI. 31Utton, M.A, (1995), “Horizontal mergers and market dominance”, in: Market Dominance and antitrust, Aldershot, Edwards Elgar,London, p.180.

The Swedish Food Retail Market Chapter 2– Theoretical Approach
15
To determine whether a market is concentrated the Herfindahl Index gives following guidance:
H > 1800: Market concentrated is high H < 1000: Market concentration is low 1000 < H < 1800: Market concentration is moderate
The Index varies from 0 to 10 000, implying a monopoly at the value of 10 000 and perfect competition at the other extreme value of zero.32 Although the Herfindahl Index is a useful tool it is important to be aware of its negative aspects. As has been described above, competition is often seen from a static perspective. This implies that the Herfindahl index can give a countervailing effect on whether the market is workable or not. For example, the index does not give any indication on whether it is the same firm that possess the dominant position on the market from one observation to another. From a static perspective, this means that it is feasible to conclude that the competition on the market is inefficient even though it turns out that the holder of the dominant position has changed between the observations. From a dynamic perspective this development rather represents a signal for well workable competition.33 Further disadvantages of the Herfindahl index may be its unfamiliarity and counter-intuitive construction. Lawyers and also businessmen are more comfortable with market share and the possible implications of increases in shares.34
2.3. The Swedish Competition Law from an economic perspective In June 1993 Sweden adopted a new competition law strongly influenced from the Competition Act of the EC treaty. Implementation of same pattern aims at giving the Swedish Competition Law a greater stability and predictability, since Swedish companies are offering same competitive regular system, operating either on domestic or European market.35
“The purpose of this Act is to eliminate and counteract obstacles to effective competition in the field of production of and trade in goods,
services and other products.” Article 1, Swedish Competition Law
The purpose of the law is to advance competition. The law shall serve as a tool to promote mobility in markets, reach “fair” prices through competition and generate an efficient 32 Shy.O, (1995), p.171. 33Bergström. F, (2003), ”Konkurrens och Dynamik i Detaljhandeln”, Handels Utrednings Institutet, Stockholm, p. 8 34 Utton, M. A., (1995), p. 181. 35 Bernitz., U,(1996), ”Den Svenska Konkurrenslagen”, Nordstedts Juridiska AB , Stockholm, p. 21.

The Swedish Food Retail Market Chapter 2– Theoretical Approach
16
allocation of resources. To reach a workable competition, the Swedish Competition Law contains of two general paragraphs: prohibition against engagement of firms in anti-competitive co-operation and prohibition against abuse of a dominant market position, which are the parts of the Law to be addressed within the limits of this thesis. All in all, the view of competition presented by the Swedish Competition Law is analogous to the static perspective, asserting that the static perspective of competition permeates our Swedish competition law.
2.3.1. Prohibition against engagement of firms in anti-competitive co-operation The first paragraph is based on the idea that firms that produce homogenous products on a market will not be given any incentive to co-operate in order to increase prices. As the static perspective prescribes, a well- functioning market is constituted by a great number of firms, sufficient enough to exert downward pressure on prices. The law therefore forbids binding agreements, both written and oral ones, which could restrain the competitiveness on the market. 36
2.3.2. Prohibition against abuse of a dominant market position When considering the second paragraph, it is important to emphasise that it is not prohibited for market actors to actually be dominant, meaning that firms are allowed to have strong economic positions that make it possible to act in an unconstrained way and thereby prevent workable competition. This implies that the legislation has no legitimacy to force firms or combines with dominant positions to break up their businesses. Hence, the Swedish Competition Law shall only take legal proceedings when firms abuse their dominant position, through e.g. price pressing actions. Such actions may be performed by dominating actors in order to force their competitors out of business or use of exclusive agreements that tie up suppliers and distribution networks (lock in effects), thereby creating market hinders; so called foreclosure of the market. 37 In determining whether firms or combines have a dominant position it is vital to have a clear understanding of their market share. When deciding market share, the competition authority needs to be able to define the relevant market. This involves an identification of the relevant product and geographic market in which the firms operate.38 Once again we can see the link between the static perspective and the Swedish Competition Law, since the static perspective imposes that the market must be well defined in order to reach a workable competition. According to the European Court of Justice a market share of between 65 to 80 percent or more is often considered a hint of a dominant position. It is feasible that firms acquiring 50 percent of total market share have a dominant position.39 Firms with market share less than 30 percent, on the other hand, are generally not reckoned as market dominators. Despite the 36 Bergström. F, (2003), p.9. 37 Bernitz, U, (1996), p.57. 38 Van den Bergh, R.J., Camesasca, P.D., (2000), “Achilles Uncovered – Revisiting the European Commission’s 1997 Market Definition Notice, Antitrust Bulletin, No 45, p.2. 39Bernitz, U, (1996), p.27.

The Swedish Food Retail Market Chapter 2– Theoretical Approach
17
importance of market share it is also essential to scrutinise factors like a firm’s financial strength, barriers to entry on the market, patents, and advantages in technology and knowledge orientation.40
40 http://www.kkv.se/eng/competition/dominant_position.shtm

The Swedish Food Retail Market Chapter 3 – The Swedish Food Retail Market
18
Chapter 3 – The Swedish Food Retail Market
3.1. Market structure The food retail market submits to food grocery trade, which is the denomination of food grocery sales and other kinds of everyday commodities. Groceries and everyday commodities mainly refer to food, chemical goods, tobacco, paper articles, magazines and flowers41. Furthermore, food grocery trade is divided into two main areas: wholesale trade and retail sale, where the former directs the selling of transportable goods to other than private households and private persons. The latter, on the other hand, concerns the selling of transportable goods to private households and private persons, where the characteristics of the goods do not change during the sale.42 As has been stated above, we only discuss retail sale within the limits of this thesis.
3.1.1. Structural reformation of the market Generally, consumers’ purchasing habits of groceries and daily commodities do not differ from one year to another. The significant change rather concerns localisation and type of store when purchasing these products. During the 1970’s and the first part of the 1980’s, retail stores did not differ much concerning size, type of stores, marketing and pricing. This is, among other things, explained by price regulations and a strictly applied local monopoly. However, lately the food retail market has experienced a structural reformation, resulting in fewer stores; in which shape and store arrangement differ in comparison to earlier structures.43 Since the 1990’s retail stores is commonly divided into more specific categories, primarily hypermarkets, traditional retail stores, traffic and service stores, grocery stores and discount stores. Each category represents its own trading concept, with respect to size, product mix, prices, service and geographic positions. Variations among these variables are of great relevance for customer expectations and choice of store, meaning that retailers’ choice of store type is fundamental when competing for customers.44 This process may be better understood with a positioning map such as that in figure 1. In order to see the difference among the store types in more detail, figure 1 is followed by a brief description of each category.
41 Konkurrensverket rapportserie 2001:4, “ Kan Kommunerna pressa matpriserna?”, AB Dangårdsgrafiska, Ödeshög, p.8. 42 Konkurrensverket rapportserie 2002:6, ” Dagligvaruhandeln – struktur, ägarform och relation till leverantörer”, AB Dangårdsgrafiska, Ödeshög, p. 12. 43 Ibid.,p.13. 44 Ibid., p.13.

The Swedish Food Retail Market Chapter 3 – The Swedish Food Retail Market
19
High prices
Low prices
Varied product mix
Limited product mix
Figure 1: Positioning map of store types within the Swedish Food Retail Market.
Source: Konkurrensverkets Rapportserie 2002:6, p.14, own working.
Hypermarkets Hypermarkets are department stores with a sales area of no less than 2500 square meters. Self-service dominates and there is a complete full range of product mixes. Furthermore, stores are given an external geographic position with at least 300 parking spaces.
Traditional Retail stores Retail stores are traditional stores for retail sales, with fairly varied product mixes. Very often (manual) counters for specific goods, such as cheese, fish, cured meats and provisions, are provided. Services are on a very high level, which is reflected by higher prices than the average.
Traffic and service stores/Grocery stores Traffic and service stores as well as grocery stores are given a very limited product mix at high prices. However, high prices are due to high services and the stores aim to increase their availability for customers by extending opening hours.
Discount stores There is no exact definition of discount stores, besides that they are characterised as stores with lower price ranges than the average and with limited product mixes. Low prices are maintained through lower service, frugal store decorations and exposure of goods.
Discount store
Hypermarket
Traffic and Service stores
Grocery’s store
Traditional Retail store

The Swedish Food Retail Market Chapter 3 – The Swedish Food Retail Market
20
Beside the specific division of stores, the structural reformation has also resulted in a diminishing number of stores. Between 1993 and 2004, the number of stores decreased by approximately 30 percent. However, although the number of stores has diminished, the average size of total sales area within the market has increased. Between 1993 and 2004 this was represented by an annual increase of four percent, resulting in an average store size of 565 square meters in 2004. In total this enlargement amounts to about 160 000 square meters. That yields a total growth of 6%. This development reflects a general increase in hypermarkets and a decrease in corner stores. Discount stores have also, over the past few years, increased rapidly.45 See table 1 for a brief overview. Table 1: Structural changes 1993 2004 Number of stores1 6678 4719 Sales area, (1000 m2)
2608 2665
Average sales area, (m2)
391 565
Market share2 (%) -Hypermarket 7 14 -Discount store 3 12 - Service store 5 5
Source: Konkurrensverket rapportserie 2004:2, p.13, own working. 1. Not included is traffic store, seasons store and other grocery stores. 2. Based on turnovers.
3.2. Actors on the market There are three major groupings - ICA AB, Kooperativa Förbundet (KF) and Axfood AB - dominating the Swedish food retail market, together covering about 75 percent of national market share46. Besides the major groupings there are also a number of independent chains that make up a significant share of sales at region levels, but not at the national level, where they in contrast are considered to be small. Bergendahlsgruppen, for instance, is an independent chain established in the southwest of Sweden. It is sometimes recognised as the fourth grouping on the Swedish market but holds only around three percent of total market share. ICA was founded in the 20th century. Today the company is regarded as the biggest actor on the market, holding about 38 percent47 of total market shares. ICA is a co-operative of independent stores who presently are allowed to cooperate on purchasing, marketing and 45 Konkurrensverkets rapportserie 2004:2, ”Konsumenterna, matpriserna och konkurrensen”, Ekonomi-print AB, p.13. 46Konkurrensverkets rapportserie 2004:2, p. 11. 47Ibid., p. 11.
The Swedish Food Retail Market Chapter 3 – The Swedish Food Retail Market
21
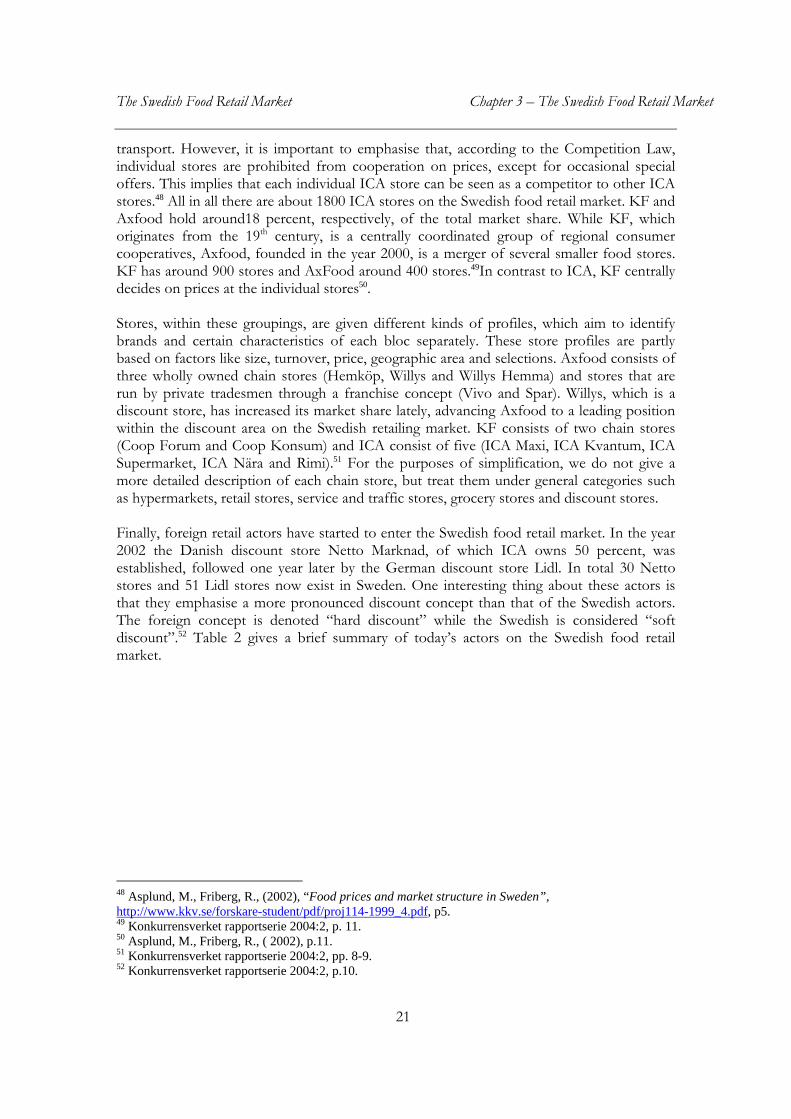
transport. However, it is important to emphasise that, according to the Competition Law, individual stores are prohibited from cooperation on prices, except for occasional special offers. This implies that each individual ICA store can be seen as a competitor to other ICA stores.48 All in all there are about 1800 ICA stores on the Swedish food retail market. KF and Axfood hold around18 percent, respectively, of the total market share. While KF, which originates from the 19th century, is a centrally coordinated group of regional consumer cooperatives, Axfood, founded in the year 2000, is a merger of several smaller food stores. KF has around 900 stores and AxFood around 400 stores.49In contrast to ICA, KF centrally decides on prices at the individual stores50. Stores, within these groupings, are given different kinds of profiles, which aim to identify brands and certain characteristics of each bloc separately. These store profiles are partly based on factors like size, turnover, price, geographic area and selections. Axfood consists of three wholly owned chain stores (Hemköp, Willys and Willys Hemma) and stores that are run by private tradesmen through a franchise concept (Vivo and Spar). Willys, which is a discount store, has increased its market share lately, advancing Axfood to a leading position within the discount area on the Swedish retailing market. KF consists of two chain stores (Coop Forum and Coop Konsum) and ICA consist of five (ICA Maxi, ICA Kvantum, ICA Supermarket, ICA Nära and Rimi).51 For the purposes of simplification, we do not give a more detailed description of each chain store, but treat them under general categories such as hypermarkets, retail stores, service and traffic stores, grocery stores and discount stores. Finally, foreign retail actors have started to enter the Swedish food retail market. In the year 2002 the Danish discount store Netto Marknad, of which ICA owns 50 percent, was established, followed one year later by the German discount store Lidl. In total 30 Netto stores and 51 Lidl stores now exist in Sweden. One interesting thing about these actors is that they emphasise a more pronounced discount concept than that of the Swedish actors. The foreign concept is denoted “hard discount” while the Swedish is considered “soft discount”.52 Table 2 gives a brief summary of today’s actors on the Swedish food retail market.
48 Asplund, M., Friberg, R., (2002), “Food prices and market structure in Sweden”, http://www.kkv.se/forskare-student/pdf/proj114-1999_4.pdf, p5. 49 Konkurrensverket rapportserie 2004:2, p. 11. 50 Asplund, M., Friberg, R., ( 2002), p.11. 51 Konkurrensverket rapportserie 2004:2, pp. 8-9. 52 Konkurrensverket rapportserie 2004:2, p.10.

The Swedish Food Retail Market Chapter 3 – The Swedish Food Retail Market
22
Table 2: The Swedish Food Retail Market
Chain
Year of
establishment
Turnover Billion SEK
2003
Market share
( %)
Number of Stores
2003
ICA 1917 76 38 1800 KF 19th century 37 18 900 Axfood 2000 37 18 400 Bergendahls 1920’s 6 3 34 Netto 2002 -1 0,6 30 Lidl 2003 - 1,0 51 Others - 43 22 -
Source: Konkurrensverket rapportserie 2004:2, p.11. With our own revision. 1. Information missing.

The Swedish Food Retail Market Chapter 4 – Empirical Approach
23
Chapter 4 - Empirical Approach
4.1. The Econometric Model
“Applied econometrics cannot be done mechanically; it needs understanding, intuition and skill.”
Keith Cuthbertson, Stephen G. Hall, Mark. P. Taylor The main purpose of this thesis is to examine competition on local Swedish retail markets by investigating plausible explanatory variables affecting ICA’s turnover. In order to fulfil this purpose we construct an econometric model, constituting the foundation for this research. We present the model in this section, starting with the methods for sampling the observations. This is followed by a description of the data and determination of the variables.
4.1.1. The sample Our research concerns competition within local markets for retailing, where “local markets” are interpreted as separate municipalities. All in all there are 290 municipalities in Sweden, which are divided into the following groupings with the number amount of municipalities in each group given in parentheses:
Cities (3) Suburb municipalities (36) Bigger cities (26) Medium-sized cities (40) Industrial municipalities (53) Rural municipalities (30) Thinly populated municipalities (29) Other bigger municipalities (31) Other smaller municipalities (42)
As the labels show, the divisions are based on certain characteristics describing type and general features of the municipalities.53 In order to keep our study manageable, but still representative, we decide not to include cities and suburb municipalities. This is due to the fact that these two groups differ from the rest when considering the supply of stores and the competitive environment. These types of municipality may therefore constitute a risk factor for misleading results. From the remaining groups we chose to study a limited number of municipalities amounting to 50 of the total number. Moreover, with the intention of ensuring a representative and truthful sample, the sample is carefully chosen through strictly objective statistical methods. 53 www.scb.se

The Swedish Food Retail Market Chapter 4 – Empirical Approach
24
Since the number of municipalities varies among the groupings, it is of great relevance that the number of municipalities within each group is proportional chosen with respect to the remaining groups. We therefore select our sample through the methods of stratified sampling meaning that the total sample size is divided in a manner that determines the share of elements from each stratum (sub-group) that is to be selected.54 In this case the strata naturally take the shape of the municipality groupings. Mathematically, a stratified sampling is calculated through the following formula:
where W i is equal to the number of elements selected in stratum i, ( i=1,2,….L, with L representing the total sum of strata ) and N i refers to the number of elements in stratum i, ( i=1,2,….L ). Finally, N is the total population.55 The result after using this method is the following distribution of samples among the subgroups:
Bigger cities (5) Medium-sized cities (9) Industrial municipalities (10) Rural municipalities (6) Thinly populated municipalities (5) Other bigger municipalities (6) Other smaller municipalities (9)
When the number of municipalities within each stratum is known, the process remains of selecting the municipalities. In order not to intervene in this process, we use the method of systematic sampling selection, which implies that each element in the stratum is randomly chosen with equal probability. The following formula will determine which element will be selected:
where N is equal to the total amount of the population and n is the number of elements in each stratum.56 The formula gives each r:th element which will be included in the sample.
4.1.2. Variables and data Before exploring the variables composing the model, we wish to make some comments about our data. Our primary data derives from the DELFI database57. The material contains 54 Dahmström, k., (2000),”Från Datainsamling till rapport- att göra en statisk undersökning, 3 Ed, Studentlitteratur, Lund, p.216. 55 Dahmström, K., (2000), p.216. 56 Dahmström, K., (2000), p.229. 57 DELFI database is a Swedish privately company that, among other things, offers statistics in a variety of fields.
W i =Ni/N,
r = N/n,

The Swedish Food Retail Market Chapter 4 – Empirical Approach
25
all retailing stores in Sweden, roughly 6200 stores in 2001 and 2002. The material supplies store specific information likes chain affiliation, turnover, sales area, and store type, etc, giving us the opportunity to manipulate the data and adapt it to our model. Furthermore, the data ranges from 1998 to 2002, enabling us to compare the results over time. However, due to weakly defined variables in the material for 1998, 1999 and 2000 we can not carry out any regression for these years. Thus, regressions are only performed for 2001 and 2002. Moreover, in order to avoid problems connected to panel data, we have chosen to compare the results obtained from the regressions of each year separately. This method gives us a result directly comparable to that of panel data. Our secondary data are mainly collected from the National Statistics Office of Sweden (SCB). Moreover, some of the secondary data is produced by our own calculations. Before discussing each variable separately we present a general view of the model. The dependent variable is composed of ICA’s turnover, which we, moreover, estimate in two different ways: (i) ICA’s share of total turnover per local market and (ii) ICA’s turnover per capita on the local market, implying that our analysis somehow rests on two models. The explanatory variables are all the same and in order to treat the condition of theoretical anchoring58 the regressors are separated into three main groupings: degree of market concentration, store-specific factors and region-specific factors. The first two of these groupings rest upon theoretical approaches concerning competition and are therefore assumed to compose competitive determinants on the markets. The last grouping constitutes proxies for exogenous factors that may affect ICA’s achievements on the market. In order to eliminate all sources of specification bias we developed various models for determining the variables within the limits of these groupings. Finally, we used the model that produced the best results, testing for specification bias. This model is the main core for our regression but also a starting point from which we exclude variables into new sub-models in order to obtain a better understanding of the effects of the explanatory variables. All in all, the model takes the following mathematical form: Y= ß1 + ß2 X1 + ß3 X2 + ß4 X3 + u where X1 represents the variables measuring the degree of market concentration, X2 store-specific factors and X3 region-specific factors. Structured in this manner we clearly see that the function is linear. We present in table 3 an outline of the model.
58 See Gujarati for further information. Gujarati, D.N., (1995), “Basic Econometrics”, 4 Ed, McGraw-Hill Book Co, Singapore, p.507.

The Swedish Food Retail Market Chapter 4 – Empirical Approach
26
Table 3: The econometric model
4.1.2.1. ICA’s turnover The dependent variable in our model represents ICA’s achievements on local markets. As a measure of ICA’s achievements we use ICA’s turnover, which is estimated in two ways. First we calculate ICA’s turnover as a share of total turnover per municipality. Second, we measure ICA’s turnover per capita per municipality. By using two estimations for ICA’s achievements, we wish to avoid possible correlation between the dependent variable and the explanatory variables Herfindahl index store and Herfindahl index chain.
4.1.2.2. Degree of market concentration As has been stated in chapter two, the degree of market concentration is widely discussed in economic theories of competition. From a static perspective, which permeates the Swedish Competition Law, high market concentration moderates competitiveness on the market. In contrast to this perspective, the dynamic perspective views high market concentration as
ICA's turnover (Y)
Degree of market concentration
(X1)
Store-specific factors (X2)
Region-specific factors (X3)
ICA’s share of total turnover per municipality ICA’s share per capita per municipality.
Herfindahl index store Herfindahl index Chain
Competitive store types on the market. Dummy for competitors’ discount stores. Dummy for competitors’ service stores. Dummy for competitors’ hypermarkets. ICA’s store types on the market. Dummy for ICA’s discount stores. Dummy for ICA’s service stores. Dummy for ICA’s hypermarkets. Sales area per capita per municipality.
Mobility of population. Share of families with children per municipality. Purchasing power. Type of municipality. Dummy for bigger cities. Dummy for medium size cities and other bigger municipalities. Dummy for thinly populated municipalities, rural municipalities and other smaller municipalities. Type of region Dummy for Norrland Dummy for Svealand
The Swedish Food Retail Market Chapter 4 – Empirical Approach
27
something that does not suffocate the competitiveness on the market but rather constitutes a part of the competitive process. To understand whether concentration has any influence on ICA’s turnover or not, we use Herfindahl indices. In order to investigate the configuration of the market we develop two indices. Under the hypothesis that each store operates independently we measure the concentration of stores, labelled Herfindahl Index store, where market shares are calculated from each store turnover on each separate market (municipality). Through this measure of concentration we hope to obtain some indications of the influencing power that the degree of concentration imposes on the competitive situation. Moreover, we measure the concentration of chains on the local markets, thereby controlling for meaning and success of chain branding on the market. This measure is named Herfindahl Index chain and is calculated from compounded turnover of each separate chain on local markets.
4.1.2.3. Store- specific variables Apart from market concentration, different perspectives stress opposing opinions when it comes to methods for reaching a workable competition. The dynamic perspective stresses the importance of using other competitive tools than just prices, which is the main competitive method according to the static perspective. We use store-specific variables, which bear upon factors such as price, service and quality, to measure the competitive tools used by the retailing actors on the market. Since it would be an enormous task to obtain concrete information about these factors, we use store types as proxies for these factors. We assume that the choice of store type is analogous with the strategic choice of competitive tools among the chain affiliations in order to gain competitive advantage. As has been described in chapter three, there are several types of stores. However, within the limits of this model we only concentrate on five types: traditional retail stores, hypermarkets, discount stores, service stores and traffic stores. Since these types fundamentally differ considering the level of price, service and quality we assume them to delineate these factors in the most preferable concrete way59. Dummy variables denote the existence or non-existence of each store type, where hypermarkets serve as a proxy for quality of goods, discount stores for price and service stores for service in terms extending opening hours. Traditional retail stores, representing a varied mix of all factors, serve as the norm. Since all of our municipalities have traffic stores we exclude this store type dummy variable from the model. The dummy variables are further divided into two fields, registering the possession of different store types among ICA60 as well as its competitors. ICA’s competitors imply all other actors on the food retail market. Thereby we hope to see the impact of the competitive tools used by both ICA and its competitors on ICA’s turnovers. Furthermore, aiming to keep the model within manageable limits we treat the competitors of ICA as a homogenous group, not taking separate chain affiliation into
59 It is important to emphasise that there is no clear definition of how to define a hypermarket, service store and discount store. Hence, although based on the common definitions described in chapter 3, the definitions above is entirely our own and based on the common characteristics of each store type. 60 ICA had discount stores in 2001 but not in 2002, in order to make the outline of the model the same for both year we excluded ICA’s discount stores in 2001

The Swedish Food Retail Market Chapter 4 – Empirical Approach
28
account. Sales area per capita per municipality is also an interesting variable since this gives an indication of the supply of stores available for consumers on each local market.
4.1.2.4. Region-specific variables Apart from market concentration and strategic competitive methods, the competitive situation may also be affected by environmental conditions, not controllable for market actors. In an attempt to investigate the power of such exogenous factors we internalise several region specific variables, describing the surroundings and regional characteristics of the local markets. It is clear that the variation among that kind of variables are enormous, which is why we have tried to make these variables as general as possible. Of course this implies problems of multicollinarity and autocorrelation. However, we have tried to overcome these problems by carefully examine different tests of specification errors. As stated above, there are different types of municipalities in Sweden. Since the samples are divided with respect to municipality it may be possible that different types of municipalities affect ICA’s turnover differently. To capture this we added municipality dummy variables to our model. With the intention of making a greater distinction between the municipality types, we divided municipalities with common features into groupings. The common features are determined from the definitions of SCB. While using industrial municipalities, which are the most common type, as a norm, the model contains three dummy variables in total: one dummy for bigger cities, another for medium size cities and other bigger municipalities, and yet another for thinly populated municipalities, rural municipalities and other smaller municipalities. Another way of testing the impact of a region characteristic may be to consider the location of the municipality. While assuming a difference, concerning the density of population and distance between stores, among municipalities in northern Sweden (Norrland), middle Sweden (Svealand) and southern Sweden (Götaland), we also added dummy variables for this kind of division in the model. Since the majority of the samples originate from the south of Sweden, we use these municipalities as a norm, thereafter creating dummy variables for municipalities in northern Sweden and middle Sweden, respectively. In order to capture the impact of demographic as well as economic features we also introduce variables measuring mobility of population and share of families with children in each municipality. Moreover, we impose a measure of purchasing power within the markets. This measure represents a percentage of average tax capacity per municipality.

The Swedish Food Retail Market Chapter 5 – Result
29
Chapter 5 - Result
5.1. Descriptive Before exploring the regression results, we wish to present statistical descriptive concerning our material. We examine turnovers, sales area and division of store types among the market actors in our study. This is briefly summarised Tables 4 and 5, where table 4 state general statistics. Table 4: General
2001 2002
Number of store
946 896
Total turnover
21 734 002.2
22 014 998.8
Average sales area, (m2)
420.78
429.39
Number of store types1 - Traditional Retail store
476 (50%)
452 (50%)
- Hypermarket
19 (2%)
24 (2.7%)
-Discount store
44 (4.7%)
32 (3,6%)
- Service store 170 (17.9%)
164 (18.2%)
- Traffic store 242 (25.4%)
230 (25.5%)
1. Numbers given in parentheses is the percentage amount of market share of each store type.

The Swedish Food Retail Market Chapter 5 – Result
30
Table 5: ICA and Competitors
ICA Competitors 2001 2002 2001 2002 Number of stores
320
(34%) 308
(34%) 626
(66%) 588
(66%) Total turnover 10 829 251
(50%) 11 217 249
(51%) 10 904 750
(50%) 10 797 749
(49%) Average sales area, (m2)
69.1
570.26
341.17
352.38
Number of store types1
-Traditional retail store 269
(84 %) 265
(86.1%) 201
(32%) 180
(31%) -Hypermarket
6 (1.9%)
6 (1.9%)
13 (2.1%)
18 (3.1%)
-Discount store
11 (3,4 %) -
33 (5.6%)
32 (5.2%)
-Service store
12 (3.8%)
11 (3.6%)
158 (25.2%)
153 (26%)
-Traffic store
22 (6.9%)
26 (8.4%)
220 (35.1%)
204 (34.7%)
1. Numbers given in parentheses is the percentage amount of market share of each store type. As anticipated from table 4 the number of stores investigated in each sample year has decreased from an amount of 951 in 2001 to 902 in 2002, while the average sales area has been increasing. When comparing these results with particular actors on the market, we find that the number of ICA store has decreased from an amount of 320 stores to 308 between the years, still maintaining their market shares compounded on the possession of stores. The accumulated achievements of the competitors also constitute a decline in the number of stores from 626 in 2001 to 588 in 2002. Considering the average of total turnover we see that the general market turnovers have increased with six percent between the years. ICA, on the other hand, has increased its average turnover by 2578.23 millions SEK, which represents a seven percentage increase. Corresponding value of the competitors is an increase of 943, 79 million SEK, constituting a five percent increase. As been stated in chapter four, we measure Herfindahl index store and Herfindahl index chain in terms of turnovers. According to our result the average concentration of stores on the market was 2081.14 in 2001 and 2108.84 in 2002. Herfindahl index chain measured an average of 4017.41 in 2001 and 4138.24 in 2002.61 When it comes to the division of store types we see that the number of traditional discount stores is decreasing, which, moreover, is reflected by the statistics from ICA and the competitors. Still, traditional retailing stores constitute the dominating store concept on the market. The number of service stores and traffic stores are also decreasing, although increasing their relative market shares. The decreases are mainly reflected by the changes of 61 For a more detailed statically description of the variables included in the regression see Appendix 1.

The Swedish Food Retail Market Chapter 5 – Result
31
the competitor’s activities. The overall number of discount stores have also declined. However, this result is a consequence of the fact that ICA relinquished their discount stores in 2002. Despite fewer number of discounts stores, the relative market share of the store type has increased. Concerning the hypermarkets, it is anticipated from the tables 5 that the numbers as well as the relative market share are increasing. The competitors bear the responsibility for this increase.
5.2. Regression As stated in chapter four we aim to explore ICA´s achievements through two different estimations of ICA’s turnover: ICA’s share of total turnover on local markets and ICA’s turnover per capita on local markets. To explain the variation in the dependent variables we run two main regressions, derived from our standard model presented in chapter four. The standard model is referred to as Model 1. Moreover, to examine the effects that ICA’s competitors have on ICA’s turnover, we removed ICA’s store type dummy variables from the model. Remaining variables then compose Model 2. Furthermore, in order to investigate each explanatory group’s impacts on the dependent variables we run independent regressions on each of the groupings. When it comes to model specification bias, all models are tested for autocorrelation, heteroscedasticity and correlation. While obtaining good results, we conclude the models to be correctly specified. 62 Finally, we run standard regressions, solely obtaining OLS-estimators. The results are presented in the following, starting with ICA’s share of total turnover as the dependent variable. The last section presents the results of the models based on the dependent variable ICA’s turnover per capita.
5.2.1. ICA’s share of total turnover The results from the regressions on Model 1 and Model 2 are listed in table 4, which separates the results revealed from each of the sample years. Altogether, the regression indicates a low number of significant variables irrespective of model and year. However, a more detailed exploration of this is given below, where we make some comments on each of the models.
62 For more information see appendix 2 and 3.

The Swedish Food Retail Market Chapter 5 – Result
32
Table 6: Regression Result, ICA´s share of total turnover Model 1 Model 2 B(1) Beta(2) B Beta
Variable3 2001 2002 2001 2002 2001 2002 2001 2002Herfindahl Index Store -.00007***
(.000) 4 -.00005***
(.000) -.424
-.351
.00007***
(.000) -.00006***
(.000) -.414
-.356
Herfindahl Index Chain .000**** (.000)
.000**** (.000)
.851
.929
.000**** (.000)
.000**** (.000)
.889
.961
Dummy C_hypermarket
-.065* (.053)
-.006 (.055)
-.184
-.017
-.032 (.049)
-.005 (.039)
-.091
-.016
Dummy C_discount store
-.008 (.036)
.015 (.039)
-.024
.051
-.006 (.036)
.023 (.037)
-.019
.079
Dummy C_ service store
.042 (.039)
.002 (.043)
.124
.007
.026 (.038)
-.005 (.037)
.078
-.016
Dummy ICA’s hypermarket
.071 (.071)
.055 (.060)
.135
.109
Dummy ICA’s service store
-.071* (.046)
-.006 (.048)
-.171
-.020
Sales area per capita -.012 (.020)
-.016 (.017)
-.065
-.955
-.015 (.020)
-.017 (.016)
-.081
-.104
Purchasing power -.004* (.003)
-.007*** (.003)
-.164
-.341
-.004* (.003)
-.007*** (.003)
-.186
-.341
Mobility of population .000016 (.000)
.000016 (.000)
.024
.022
.00003 (.000)
-.000691 (.000)
.046
.009
Share of families with children
-1,064* (.701)
-1.204** (.641)
-.173
-.211
-1.234** (.660)
-1.468*** (.563)
-.200
-.257
Dummy bigger cities -.033 (.094)
-.077 (.007)
-.064
-.163
-.081 (.091)
-.066 (.073)
-.158
-.140
Dummy medium size cities and other bigger municipalities
-.060 (.054)
-.077* (.048)
-.177
-.249
-.047 (.052)
-.061* (.044)
-.139
-.195
Dummy thinly populated municipalities, rural municipalities and other smaller municipalities
-.106*** (.047)
-.129*** (.042)
-.338 -.443 -.106*** (.047)
-.123*** (.040)
-.336 -.422
Dummy Norrland region
-.025 (.047)
-.042 (,045)
-.065
-.118
-.032 (.047)
-.060* (.041)
-.083
-.169
Dummy Svealand region
-.009 (.038)
-,002 (.037)
-.029
-.005
-.021 (.036)
-.013 (.033)
-.066
-.043
Constant .851*** (.332)
1.183**** (.320)
-
-
.934*** (.333)
1.252**** (.307)
-
-
Adjusted R square .623 .670 - - .725 .679 - -
1. B is an unstandardised coefficient. 2. Beta is a standardised coefficient. 3. Variables with **** are significant at the one-percent level, with *** at the five-percent level, ** at the ten-percent level and * at the 25 percent level. 4. Standard errors in the parenthesis.

The Swedish Food Retail Market Chapter 5 – Result
33
5.2.1.1. Model 1 At a first glance on table 6 we notice that the variables that measure the degree of concentration have a dominating effect on the dependent variables in both of the models. Overall, the adjusted R-square of the regressions is roughly 0.6 for both years. In regressions only estimation the variables measuring the degree of market concentration, store-specific factors and region-specific factors, the adjusted R-squares are 0.606, 0.115 and –0.062 respectively in 2001. Corresponding numbers for 2002 are 0.595, 0.175 and –0.047. This strongly confirms that the degrees of market concentration explain most of the variations in ICA’s share of total turnover on local markets. The F-values obtained from the regressions corroborate this reasoning from another view. The regression results from Model 1 and Model 2 reveal significant F-values, allowing us to reject the null hypothesis that the true slopes of the coefficients are zero.
Market concentration As table 6 indicates, the coefficient of Herfindahl index store is negative and significant at the five-percent level for both sample years. This implies that higher store concentration affects ICA’s share of total turnover negatively. On the other hand, the estimated coefficients of Herfindahl index chain demonstrate a different outcome. The coefficient is equal to zero and significant at a one-percent level, suggesting a neutral relationship between chain concentration and ICA’s share of total turnover. Hence, as the market concentration of chain increases, ICA’s turnover remains unaffected. It is also notable that the estimated beta coefficient of Herfindahl index chain is the variable that makes the strongest contribution to explaining the dependent variable. Nonetheless, caution should be taken when interpreting this result. Despite the high level of significance, both the dependent variable and the Herfindahl indices are estimated on ICA’s turnover, which may impose an evident correlation among the variables.
Store-specific factors For the store-specific variables we find that none of the OLS-estimators contribute with any significant explanatory effects to ICA’s share of total turnovers. However, Goldberger emphasizes that within the field of economics, statistical significance should not be confused with economic significance. This means that in cases where it would be practical to increase the level of significance, one should feel free to do so.63 Hence, if we allow a 25-percent level of significance in the regression results of 2001, we see that the estimator on ICA’s service store is negative. This implies that ICA’s service stores exert downward pressure on the company’s share of total turnover. Finally, the 25-percent level of significance also implies that competitors’ possession of hypermarkets have a negative impact on the dependent variable.
Region-specific factors Studying the results concerning the region-specific variables we find a great distinction between the years. However, the estimated coefficient on thinly populated municipalities, rural municipalities and other smaller municipalities is negative and significant at the five-percent level for sample year 2001 as well as 2002. This denotes that when ICA is situated in
63 Gujarati, (1995) pp. 138-139.

The Swedish Food Retail Market Chapter 5 – Result
34
these types of municipalities it has a negative impact on ICA’s share of total turnover of about ten percent. If we admit a 25-percent level of significance, the dummy variable for medium size cities and other bigger municipalities in 2002 presents a negative coefficient suggesting that these types of municipalities also are negatively correlated with ICA’s share of total turnover. However, none of the region dummy variables seems to be significant in the model. As anticipated from the table, the coefficient of purchasing power variable in 2002 is negative and significant at the level of 5 percent. In the year 2001 the corresponding coefficient is still negative but significant at a 25-percent level. If this result is reliable it insinuates that as the purchasing power increases with one percentage ICA’s share of total turnover decreases with about seven percent. The share of families with children also shows some relatively significant values. The estimated coefficient for 2002 and 2001 is highly negative and significant at a ten and 25-percent level, respectively. This suggests that more families with children negatively effects ICA’s turnover.
5.2.1.2. Model 2 As explained above, the purpose of excluding ICA’s store type dummy variables is to capture possible effects of competitors’ strategies. In table 4 we see that the adjusted R-square of this model is 0.614 for 2001 and 0.679 for 2002. When running an F-test we obtain a significant value, indicating the overall significance of the model.
Market concentration As predicted from table 6, the estimated coefficients of Herfindahl Index store reveal the same result as in Model 1. No matter the year, the coefficients are negative and significant. A similar result from that in Model 1 also holds for Herfindahl Index Chain for both years. As the Beta values indicate, Herfindahl index chain is still the variable with the strongest explanatory power in the model. The OLS point estimators of Herfindahl chain still produce a significant zero value.
Store-specific factors Although excluding the dummy variables for ICA’s store types, neither different store types by the competitors or the sales area per capita seems to have any impact on ICA’s share of total turnover.
Region-specific factors Referring to the region-specific variables we see that the coefficient of the dummy variables for thinly populated municipalities, rural municipalities and other smaller municipalities in both years is negative and significant at a five-percent level. Hence, as in Model 1, the regression results also suggest a negative correlation between these types of municipality and ICA’s share of total turnovers. If we allow a 25 percent level of significance, the dummy variable for medium size cities and other bigger municipalities in year 2002 also has a negative impact on ICA’s total turnover.

The Swedish Food Retail Market Chapter 5 – Result
35
The variable measuring share of families with children is still negative at a ten percent and at a five percent level of significance in the years 2001 and 2002. As in Model 1, this indicates that families with children exert downward pressure on ICA’s share of total turnover. Finally, we see that the coefficient related to the purchasing power within the municipalities still has negative impact on ICA’s share of total turnover. However, in the year 2002 the variable is significant at a five percent level, while in 2001 it only has a significance level of 25 percent.
5.3.1. ICA’s turnovers per capita Also when exploring the outcome from the regressions with ICA’s turnover per capita as the dependent variable we find a low number of significant variables. This is shown in table 7, which presents the regression results in Model 1 and Model 2. As in the previous case we separate the results from each of the sample years.

The Swedish Food Retail Market Chapter 5 – Result
36
Table 7: Regression Result, ICA’s turnover per capita
1. B is an unstandardised coefficient. 2. Beta is a standardised coefficient. 3. Variables starting with **** are significant at the 1 percent level, with *** at the 5 percent level, ** at the 10 percent level and * at the 25 percent level. 4. Standard errors in the parenthesis.
Model 1 Model 2 B(1) Beta(2) B Beta
Variable3 2001 2002 2001 2002 2001 2002 2001 2002Herfindahl Index Store -1.294***
(.443)4 -1.483***
(.549) -.352
-.342
-1.239***
(.470) -1.447***
(.523) -.337
-.333
Herfindahl Index Chain 2,714****
(.388) 3.551****
(.497) .820
.907
2.890****
(.386) 3.582****
(.474) .873
.915
Dummy C_hypermarket -924.64
(1059.4) -418.3
(1441.7) -.127
.050
68.3
(1040.5) 615.42
(1000.2) .009
.074
Dummy C_discount store
408.612 (713.8)
1451.8* (1018.2)
.062
.193
458.2 (756.6)
1530.7* (969.1)
.070
.203
Dummy C_ service store
1103.5* (.039)
718.7 (1099.5)
.159
.086
638.8 (801.6)
630.3 (981.6)
.092
.076
Dummy ICA’s hypermarket
3 050.4* (1414.6)
270.34 (824.3)
.190
.036
Dummy ICA’s service store
-2228.2*** (914.6)
160.39 (1330.6)
-.257
.019
Sales area per capita -887.1*** (406.9)
-1368.7*** (477.3)
-.232
-.320
-981.9*** (429´.1)
-1342.6*** (432.2)
-.257
-.314
Purchasing power -61.28 (56.5)
-209.6*** (68.7)
-.127
-.376
-77.4* (59.5)
-210.7*** (66.4)
-.161
-.378
Mobility of population 1.096 (1.866)
-.434 (2.32)
.077
-.023
1.518 (1.843)
-.337 (2.24)
.106
-.018
Share of families with children
-33276*** (14034)
-41916.9*** (15435.4)
-.262
-.287
-3800.6*** (13888.4)
-41235.4*** (14881)
-.299
-.282
Dummy bigger cities -834.3 (1890.1)
-229.5 (1279.1)
-.079
-.019
-2312.6* (1911.7)
-140.6 (1117.4)
-.218
-.011
Dummy medium size cities, and other bigger municipalities
-722.1 (1087.9)
-72.2 (950)
-.104
-.009
-369.2 (1086.2)
-62.7 (920.1)
-.053
-.008
Dummy thinly populated municipalities, rural municipalities and other smaller municipalities
-989.4 (934.5)
-833 (1054.8)
-.152 -.112 -977.4 (993.4)
-863.2 (994.1)
-.151 -.116
Dummy Norrland region
-610.34 (947.3)
-2056.6** (1113)
-.077
-.225
-808.7 (984.7)
-1985.34** (1046.4)
-.102
-.217
Dummy Svealand region
270.5 (761.54)
339.3 (908.2)
.041
.045
-73.6 (763.6)
329.9 (876.3)
-.011
.044
Constant 18800.0*** (6645.1)
32142.1**** (8382.4)
-
-
21258.9*** (6937.4)
31867.2**** (8109,9)
- -
Adjusted R square .760 .756 - - .725 .657 - -
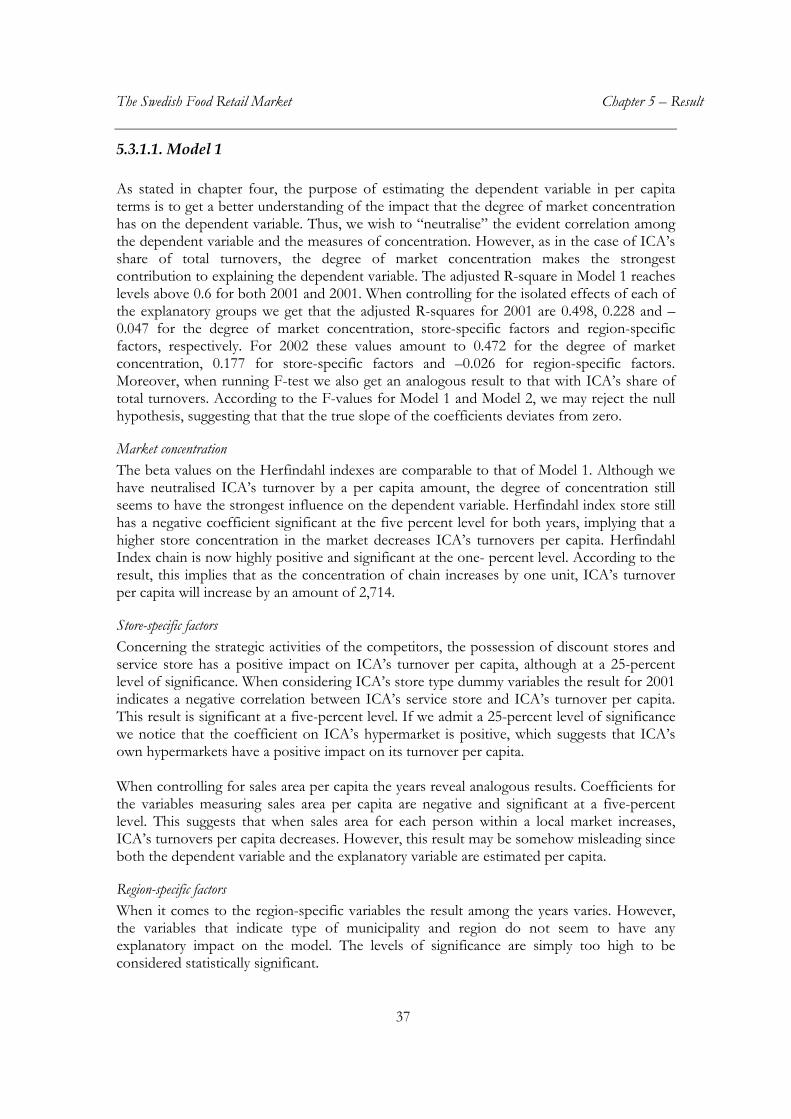
The Swedish Food Retail Market Chapter 5 – Result
37
5.3.1.1. Model 1 As stated in chapter four, the purpose of estimating the dependent variable in per capita terms is to get a better understanding of the impact that the degree of market concentration has on the dependent variable. Thus, we wish to “neutralise” the evident correlation among the dependent variable and the measures of concentration. However, as in the case of ICA’s share of total turnovers, the degree of market concentration makes the strongest contribution to explaining the dependent variable. The adjusted R-square in Model 1 reaches levels above 0.6 for both 2001 and 2001. When controlling for the isolated effects of each of the explanatory groups we get that the adjusted R-squares for 2001 are 0.498, 0.228 and –0.047 for the degree of market concentration, store-specific factors and region-specific factors, respectively. For 2002 these values amount to 0.472 for the degree of market concentration, 0.177 for store-specific factors and –0.026 for region-specific factors. Moreover, when running F-test we also get an analogous result to that with ICA’s share of total turnovers. According to the F-values for Model 1 and Model 2, we may reject the null hypothesis, suggesting that that the true slope of the coefficients deviates from zero.
Market concentration The beta values on the Herfindahl indexes are comparable to that of Model 1. Although we have neutralised ICA’s turnover by a per capita amount, the degree of concentration still seems to have the strongest influence on the dependent variable. Herfindahl index store still has a negative coefficient significant at the five percent level for both years, implying that a higher store concentration in the market decreases ICA’s turnovers per capita. Herfindahl Index chain is now highly positive and significant at the one- percent level. According to the result, this implies that as the concentration of chain increases by one unit, ICA’s turnover per capita will increase by an amount of 2,714.
Store-specific factors Concerning the strategic activities of the competitors, the possession of discount stores and service store has a positive impact on ICA’s turnover per capita, although at a 25-percent level of significance. When considering ICA’s store type dummy variables the result for 2001 indicates a negative correlation between ICA’s service store and ICA’s turnover per capita. This result is significant at a five-percent level. If we admit a 25-percent level of significance we notice that the coefficient on ICA’s hypermarket is positive, which suggests that ICA’s own hypermarkets have a positive impact on its turnover per capita. When controlling for sales area per capita the years reveal analogous results. Coefficients for the variables measuring sales area per capita are negative and significant at a five-percent level. This suggests that when sales area for each person within a local market increases, ICA’s turnovers per capita decreases. However, this result may be somehow misleading since both the dependent variable and the explanatory variable are estimated per capita.
Region-specific factors When it comes to the region-specific variables the result among the years varies. However, the variables that indicate type of municipality and region do not seem to have any explanatory impact on the model. The levels of significance are simply too high to be considered statistically significant.

The Swedish Food Retail Market Chapter 5 – Result
38
Purchasing power reveals an opposing result among the years. While the outcome from the 2002 sample shows a negative coefficient at the level of five percent significance, the corresponding outcome of 2001 shows no statistically significant result. Thus, the result of 2002 implies that ICA’s turnovers per capita decrease as purchasing power augments. The coefficient of the share of families with children is strongly negative and statistically significant at a five percent level.
5.3.1.2. Model 2 When applying Model 2 the dependent variable of ICA’s turnover per capita gets an adjusted R-square of 0.598 for 2001 and 0.657 for 2002. The F-values obtained for respective years are significant, allowing us to state the overall significance of the model.
Degree of market concentration The variables for market concentration follow the same theme as in the previous cases. The point estimator on Herfindahl index store is negative, while the corresponding value for Herfindahl index chain is positive. Thus, the results, holding for both years, still confirm the statement that variables measuring market concentration are dominant contributors to the model.
Store-specific factors The OLS-estimators on the dummy variables that indicate the store types of the competitors do not provide any significant values. As in Model 1, the sales area per capita is negatively correlated with ICA’s turnover per capita. Yet as been explained above, the correlation may be involuntary, as both variables are estimated per capita.
Region-specific factors Considering the region-specific factors the results are slightly different between the two years. Types of municipality and region variables, in 2001, do not produce any significant results, while the regression for 2002 reveals that the dummy variable for municipalities in northern Sweden imposes a negative impact on ICA’s turnover per capita. The point estimator on purchasing power is significant and negatively correlated with the dependent variable, which confirms what we previously have stated. As purchasing power increases, ICA’s turnovers per capita decrease. The share of families with children seems to impose a contribution to the dependent variable. Both years yield OLS-estimators that are negative at the significance level of five percent.

The Swedish Food Retail Market Chapter 6 – Analysis
39
Chapter 6 – Analysis
6.1. Degree of market concentration In order to examine whether the degree of market concentration had any impact on the competition on local food retail markets in Sweden we used Herfindahl indices as explanatory variables for concentration in the regression models. As anticipated from the result, the degree of concentration is increasing. Between 2001 and 2002 the mean value of market concentration of stores increased from a level of 2081.14 to 2108.84, reflecting the decreasing numbers of stores within the period. In addition, the concentration of chains has also risen to higher levels. In 2001 the mean value of chain concentration on the market was 4017.41 and steadily increased to a level of 4138.24 in 2002. When comparing this augmentation to the division of market shares, the results obtained within this thesis do not reveal any signs of change among the market actors. As stated in table 5, both ICA and its competitors possessed about 50% of total market shares in 2001 and 2002. However, the market share of the latter group, which compounds all competitors, makes us unable to compile any clear statements concerning the division and change of market shares among the competitors. Hence, the index does not give any indication on whether the competitive firms hold the same amount of market shares from 2001 to 2002. This implies that the Herfindahl index can give a countervailing effect on whether the market is workable or not. The result should therefore be considered as an indication of the real situation. As stated in chapter 2 the theoretical definition of market concentration is that a market is considered highly concentrated when the level of concentration exceeds 1800. Hence, if applying the theory to our result, it is clear that local food retail markets in Sweden are highly concentrated. This holds for the concentration of stores as well as the concentration of chains, although the latter appears to be more concentrated than the former. Altogether, these results confirm the structural reformation that permeates the market. As the number of stores becomes fewer no additional actors enter the market, indicating that the three major groupings, ICA, KF and Axfood still dominate. Taking the guidelines of the Swedish Competition Law into account, ICA could be considered to have a dominant market position since ICA has about 50% of the market share. So, how do these outcomes affect ICA’s achievements? As anticipated from chapter 5 the variables that measure the degree of market concentration strongly contribute to the determination of the variation in ICA’s turnover, whether estimated in terms of capita or not. It is important to keep in mind that the correlation between dependent and independent variables in this case may be evident, since all are different measures of turnover. As stated above, we try to overcome the most critical correlation by compounding ICA’s turnover as a per capita amount in one of the regressions.

The Swedish Food Retail Market Chapter 6 – Analysis
40
6.1.1. Concentration of Stores When examining the regression results, we find that the concentration of stores (Herfindahl store) constitutes a negative impact on ICA’s turnover. This suggests that if the achievements of each individual ICA store are separately measured, ICA loses in terms of turnover. A logical explanation may be that local markets, where the number of retailing actors is low, generate a reduction in ICA’s turnover in comparison to other markets where there are many retailing actors. Markets with few retailing actors are located in the countryside and characterised as thinly populated municipalities, rural or other small municipalities. The cause and effect relationship between ICA’s turnover and a high concentration of stores may therefore be evident since the number of customers on these markets is fewer and therefore yields lower turnover. The significant and negative coefficient, related to the dummy variable indicating these municipalities, might serve to confirm this logic. On the other hand, all types of municipalities, although not statistically significant, reveal negative coefficients. However, this is to be discussed in section 6.3.4. In an attempt to search for other explanations for this negative correlation, a second possibility is that when store concentration rises, the main decreases in stores derive from a reduction of ICA’s stores. This argument complies with the structural reformation of the market that, as mentioned above, has resulted in a shrinking number of stores. Thus, considering the decrease in ICA’s stores between 2001 and 2002 it is reasonable to think that ICA’s turnover diminishes when the number of stores within the grouping does so. If this is true, it may likewise constitute an explanation for the increase of the estimated coefficient on Herfindahl stores between years. A third explanation is that when smaller local stores like corner stores or stores located in thinly populated municipalities close down, consumers must turn to other stores that are located further away. Thus, if consumers have to travel in order to do their grocery shopping it is possible that they seek out the closest hypermarket in order to get a full range of product mixes. Since ICA has fewer hypermarkets then its competitors, consumers may be more likely to end up at a competitive hypermarket. Yet, a decrease of stores is not an ICA-specific phenomenon, but rather holds for the food retail market in general. Taking this into account, one can see the result from another point of view. As stated in chapter 2, advocates of the static view stress that in order to reach a perfect competitive situation, a perfect market must contain an infinite numbers of small profit-maximising firms, producing and selling homogenous products. When the number of stores decreases, that is, when concentration gets more intense, the competitive situation on the market may be considered deteriorating. If ICA, even as a market leader, loses in such circumstances it is feasible to think that competition and a large number of stores are necessary for holding up. In other words, competition may be needed for ICA to modernise and strategically develop the company. This is of course a somehow sharpened analysis, but if it is true, the fact that higher concentration of stores negatively affects ICA’s turnover may serve to support the static view of competition.

The Swedish Food Retail Market Chapter 6 – Analysis
41
6.1.2. Concentration of Chains Although single and privately owned ICA stores compete with one another, a more accurate way to describe the reality may be to consider the fact that individual ICA stores are commonly known through the ICA brand. Hence, even though acting separately, single ICA stores are an integral part of the ICA group, which within our sample is regarded as having a market-dominating position. As we have seen, the regression results reveal that the concentration of chains (Herfindahl chain) has a positive impact on the dependent variables, meaning that consumers tend to do their grocery shopping at ICA. In other words, by considering the achievements of all single ICA-stores as the accumulated achievements of one actor ICA’s turnover increases, which may be considered as an obvious relationship. A plausible explanation for the positive relationship between ICA’s turnover and concentration of chains is that the increase in concentration is due to ICA’s strengthening market position. This, according to the static perspective, is a sign of a weak competition. Moreover, ICA’s strong market position may explain the increase in the average turnover of the grouping between 2001 and 2002, despite a negative impact from higher store concentration. If we incorporate this into the fact that the Swedish food retail market is highly concentrated in terms of chains, we not only detect that the number of market actors is significantly limited but also that the market leader actor, ICA, gains from the situation. Hence, competition on the local markets may not be considered as workable according to a static perspective. But is it, without any restraints, possible to say that ICA’s dominant market position and thereby the high market concentration, is only due to a very weak competition? Advocates of the static perspective would doubtless draw this conclusion. Advocates of the dynamic perspective, on the other hand, would strongly disagree with this statement. As we have learned, the dynamic perspective promotes high market concentration in order to support market actors’ incentives to engage in innovative activities. Since we have not included any aspects relating to the innovations permeating the food retail market, our result does not enable us to draw any exact conclusion in this matter. Nonetheless, an approximation of innovative activities may be hard to obtain and should possibly be complemented with some kind of qualitative study. However, it is feasible, although highly speculative, to think that an innovative variable can explain that ICA’s strong market position is due to its innovative power, which, according to the dynamic perspective is considered good. Strong market power promotes, for instance, greater capacity to finance research and development. But what does innovation on the food retail market denote? Which are the actual measures for innovation on such a market? The Swedish food retail market may be described as a relatively transparent market in terms of marketing. The supply of products does not vary significantly among different chains. The purchase of milk, bread and meat in an ICA-store may be analogous to same purchase in a competitive store in terms of quality and price. The possibilities for differentiation and development of products may therefore be considered limited, if not including the current development of chain-specific brands. Yet, when it comes to pure promotion it is feasible to think of the possibilities for innovations as more open. Advertising, direct marketing and sales promotions such as coupons, prize packs, demonstrations and happenings may be ways to gain good will of the customers. Other
The Swedish Food Retail Market Chapter 6 – Analysis
42
possible measures would be to lock in customers through memberships, for example the ICA club–card. All in all, these are methods, through which market actors search to transform the homogenous product to heterogeneous product, in order to increase the added value of the consumers. A further example of this is ICA’s private bank (ICA-banken) which was introduced on the market in 2002. There are also a span for innovation when considering the marketing channels and methods for distributing the products, including types, location and modes of stores. However, while assuming the transparency of the market competitive market actors are able to copy the innovative actions of one another. Hence, if ICA, due to its leading position on the market, is able to introduce an innovative method of marketing, what is the possibility of competitors imitating this work? And if the possibility exists, how does this affect the incentives for further innovation? We are not able to answer the latter question, but when analysing the matter from a market perspective is easy to see the advantages stated by the dynamic view of competition. As Schumpeter emphasised, the process of competitors imitating the work of a market leader actually stimulates the development of the market and consequently economic progress. If the analysis is correct and if ICA does strongly contribute in innovative actions, ICA may be viewed to be the driving force for the development of the Swedish food retail market. Such an outcome raises the question of the general accuracy of the current competition law in Sweden. If a dominant position is required for innovative actions, is the Swedish Competition Law then depressing such actions? This is of course tricky to answer. The law is intended not to break up already existing firms but to hamper stores from reaching a dominant position. The law therefore makes it difficult for new firms to reach a dominant position as well as compete through innovation. From a dynamic perspective the law may therefore be seen as an obstacle to reaching workable competition.
6.2. Store- Specific factors In order to see the effects of strategic competitive actions, we let different store types serve as proxies for competitive instruments such as price, service and quality. These were factors that we regarded as the most important competitive tools, while taking the characteristics of store types into account. The regression results obtained from the two models in both years demonstrated that the explanatory variables had very little or no impact on both of the dependent variables. In the following analysis we start by making some comments about the general features of the food retail market.
6.2.1. General characteristics of the market We find the food retail market to be more or less homogenous. It consists of different but still relatively equal store types that sell nearly homogenous products. Thus, the actual features of milk, bread and meat in an ICA-store may be analogous to those of a competitive store. This complies with the perfect market criterion of homogeneity, settled by the static view of competition.

The Swedish Food Retail Market Chapter 6 – Analysis
43
As we have learned, the static perspective of competition argues that a perfect market also must contain an infinite number of small profit-maximising firms and a great number of utility-maximising consumers. Furthermore, consumers must have perfect information concerning prices and qualities of products and services, enabling them to fully compare products among different producers. When considering the features of homogeneity on the Swedish food retail market it is assumable that consumers have good knowledge about quality and price. Hence, the latter criterion may therefore be considered fairly fulfilled. However, when referring to the requirement of an infinite number of firms, we know from the discussion in section 6.1. that the Swedish food retail market is concentrated, implying a limited number of actors. We also know that ICA indeed has a dominant position on the market. Overall, by viewing the food retail market from a more general point of view we can see that it complies with the static perspective concerning homogeneity and consumer information. But as we examine the competition on the food retail market in more depth we see that it also differs from the static perspective. This will be discussed in the following sections.
6.2.1. Hypermarkets Neither of the variables indicating the possession of hypermarkets by ICA and its competitors reveals any statistically significant levels lower than 25 percent. When admitting a 25 percent level of significance we find that ICA’s hypermarkets are positively correlated to ICA’s turnover per capita in 2001. Studying the beta coefficient we see that the variable does not bring about any notable degree of explanation to the model. This becomes even more apparent when studying the variable for 2002 as well as the analogous results for the regressions on ICA’s share of total turnovers. A simple explanation for this may be that the number of hypermarkets held by ICA is few within the limits of our sample. As anticipated from table 5, we find that the actual number of ICA hypermarkets is six, constituting 1.6 percent of the total number of ICA stores for both years. This implies that ICA’s hypermarkets are not commonly figuring in our study, thereby limiting their possibilities to make a representative contribution to ICA’s turnovers. However, the direction of correlation between ICA’s hypermarkets and ICA’s turnovers is positive, which is not surprising since hypermarkets often generate a larger turnover then for example service stores. However, what is more interesting is that a positive impact on ICA’s turnovers implies that hypermarkets may be considered to be accepted by consumers, meaning that people tend to put some value in the general features characterising hypermarkets. If we adapt to the definition of hypermarkets used in our regression models, where hypermarkets constitute approximations for quality, it is possible to suggest that consumers actually value quality when buying food. Moreover, the location of hypermarkets, accessibility in terms of parking spaces and the supply of discount offers may also promote the advantages of hypermarkets. When considering the correlation between competitors’ hypermarkets and ICA’s turnover a negative relationship is revealed, although not statistically significant to lower than 25 percent. If we view the beta coefficients on the dummy variables indicating the competitors’ hypermarkets, we find that the variables do not exert any considerable degree of explanation on the model. However, as in the case of ICA’s hypermarkets, this may also be explained in terms of a low number of competitive hypermarkets appearing in our sample. As revealed in

The Swedish Food Retail Market Chapter 6 – Analysis
44
table 5, we see that the number of competitive hypermarkets amounted to 13 and 18 for 2001 and 2002, constituting 2.1 and 3.1 percent of total competitive stores, respectively. Although competitors’ hypermarkets constitute low impacts on the overall regression result, we, as in the previous case, are permitted to view the direction of the relationship between them and ICA’s turnovers. Since the relationship is negative, the interpretation is simply that ICA’s turnover decreases as competitors hold hypermarkets. However, the result does not reveal the source of this negative impact. Do customers choose competitive hypermarkets before ICA’s hypermarkets or does the non-existence of ICA hypermarkets on particular local markets “force” customers to turn to competitive hypermarkets? Referring to ICA’s market dominance a rational explanation would be the latter alternative, since it is assumable that local markets where turnovers are low contain competitive hypermarkets but no ICA -hypermarkets. Another explanation might be that consumers do not care whether they do their grocery shopping in a competitive hypermarket or in an ICA–hypermarket. Consumer might perhaps only be interesting on doing their grocery shopping at the closes hypermarket. This implies that if the level of quality in ICA’s as well as the competitor’s hypermarkets are comparable, consumers do not choose hypermarkets after quality. If this is the case this may indicate that retail actors do not use quality as a competitive instrument when competing for consumers.
6.2.2. Discount stores As anticipated from the result, none of the variables indicating the existence of competitors’ discount stores are statistically significant, if not allowing a 25 percent level of significance. If we admit a 25 percent level of significance we detect that competitors’ discount stores have a positive impact on ICA’s turnover per capita for both models in 2002. These directions of impact hold if we ignore the low levels of significance and only focus on the direction of correlation. Hence, if ICA’s turnover increases when competitive stores are present; this implies that consumers tend to shop in ICA stores instead of competitive discount stores. According to the static vision, price is the most important competitive instrument. Only when the stated conditions for a perfect market are accomplished an efficient price competition can be attained. Of course, within the limits of our thesis, we are not able to make any clear statements concerning the price on the market. However, by involving discount stores we hoped to capture some of the price variances on the market. Although the analysis, due to the statistical insignificance of the result, only serves to point out fragments of reality, the core of the result seriously questions the actual importance of price as a strategic competitive tool. The direction of correlation between competitive discount stores and ICA’s turnover clearly suggests that the choice of stores, when purchasing daily commodities, does not only depend on the level of price. It is possible that consumers take other factors such as location or variety of products into consideration when carrying out their food purchase. If the analysis were sufficient, it complies with a dynamic vision of competition, advocating that competition must originate from other competitive components than just prices. If consumers put an essential value in service and quality this may, to some extent, explain the high prices on the food retailing market. Of course, before stating such a conclusion it is important to investigate the correlation between prices and high concentration on the

The Swedish Food Retail Market Chapter 6 – Analysis
45
market. Since prices are not included in our models we do not have any clear opportunity to study this. However, if we use discount stores as a proxy for low prices and the variable for service stores as a proxy for high prices we may at least procure an approximation of the situation. If we study the correlation matrix given in appendix 2, we find that the correlation between the concentration of chain and the dummy variable for competitors’ discount stores is negative but at a low level for both years. The corresponding values for service stores are slightly positive both when referring to ICA’s service stores and the competitors’ holding of service stores, irrespective of the year. This implies that though low prices are not correlated to the concentration of chains, high prices may be. Yet, since the levels of correlation are so low, the correspondence is doubtful. If we extend this analysis even further, several explanations may be used to understand the suggested pattern of food purchases. First, it is feasible to think that the distinction between discount stores and hypermarkets is not completely clarified for customers, insinuating an important difference between the consumers’ definition of different store concepts to that of the retailing actors. A possible reason for this is that discount stores in Sweden are merely so-called soft discount stores, in which the level of prices does not differ substantially from that of the general price level of the market. Hence, consumers may think of retailing stores as hypermarkets, denoting that the effects of retail stores transmit to the field of hypermarkets. If we apply this reasoning to the result it is possible that consumers lean on the ICA concept when economising on their food purchases. Thus, since most people appear to choose ICA, the stores of ICA would be a natural choice also when searching for lower prices. If this is true, it would be interesting to seize the effects from the establishment of hard discount stores that are currently permeating the market. A second explanation stems from the assumption that consumers are slow moving when adapting to structural changes in the market, resulting in a general scepticism towards discount stores. Even though the existence of discount stores has been rapidly developing during the past few years, it can be assumed that consumers think of “traditional” stores as more secure then novelties permeating the market. Moreover, it is feasible that consumers put value in being faithful to the stores to which they have always gone. All in all, this suggests that consumers do not pay that much attention to price when choosing stores, which obscures the possibilities for retailing actors to capture such factors in their strategic business activities.
6.2.3. Service stores If we turn to our proxy for service, the dummy variables indicating ICA’s possession of service stores, we find a notable negative correlation with ICA’s turnover per capita in 2001. Viewing the corresponding beta coefficient we see that the contribution of the variable is relatively important in the model. The negative correlation between ICA’s service stores and turnover also holds for ICA’s share of total turnover, although the correlation is neither as negative nor as significant as the former. The interpretation of this result is that ICA’s turnover decreases as it holds service stores on local markets. Hence, instead of doing their grocery shopping in ICA’s service stores, people in general turn to other kinds of stores.

The Swedish Food Retail Market Chapter 6 – Analysis
46
A possible explanation for the stated relationship between ICA’s turnover and ICA’s service stores proceeds from the fact that the aim of service stores is to increase their availability for customers by extending opening hours resulting in higher prices. However, remaining retailing stores also appear to extend their opening hours, thereby offering a wider range of products comparable to that of the service stores at longer opening hours. The unique competitive advantage for service stores thereby diminishes. In other words, instead of doing the grocery shopping in stores with a limited product mix to higher prices in late hours, consumers economise on their purchase buy turning to other stores. When viewing parallel results for the competitive service stores, we detect a positive relationship between the existence of competitive service stores and ICA’s turnovers per capita in 2001. However, the relationship is significant at a 25 percent level. If admitting an even higher level of statistical significance, the relation holds for almost the majority of the remaining regression. If we, as in the former cases, ignore the statistical insignificance and use the result as a direction of the reality, the reading of the result is that as competitors hold service stores, consumers rather tend to shop in ICA’s stores. This relationship somehow confirms the discussion above, concerning extended opening hours for the overall market. If the analysis is correct and the overall market does extend the opening hours, this further demonstrates that the market as whole is converging when it comes to the means of strategic competition. If the aspect of opening hours does not apparently differ among store types, it is meaningless to compete with that measure. Instead, extended opening hours become an evident feature on the market, establishing a generally accepted service that consumers come to demand instead of appreciate.
6.2.4. Sales area per capita The variable measuring sales area per capita reveals a negative impact on ICA’s turnover. The relationship is statistically significant indicating the statistical reliability of the result, as do the high values of the beta coefficients on the variable. Hence, the immediate interpretation of this result is that as the sales area per capita increases, ICA’s turnover decreases. There are at least two justifications for this correlation. Either ICA does not constitute the source for the increasing sales area thereby suffering tightening competition, or the increases in the sales areas are due to ICA’s activities but unsuccessfully anchored by the consumers. Since the composition of the sales areas per person is not clear, we are not able to determine the source of the augmentation. Hence, it is not clear that it is the competitors that actually increase their sales areas. However, when comparing the differences in the average sales areas between 2001 and 2002 we are able to make some truthful assumptions. While the competitors had increased their sales area by 11.21 square meters on average, ICA only came up with a 1.16 square meter increase, indicating that the increase in sales area per person may be due to competitive action.

The Swedish Food Retail Market Chapter 6 – Analysis
47
6.2.5. Other modes of competition If we were to scrutinise the theory denoting that stores do not compete through prices, quality or service more profoundly, we would run separate regressions on different dependent variables that were based upon each store types. By doing so we may have been able to detect the kind of impact that each store type has on the others more clearly. However, if still relying on our results, neither price nor quality and service significantly contribute to explain ICA’s turnover. As we have seen the logic for this result may be several and above all proceed from the low number of samples within our study. Yet it is possible that the marginal differences in prices, services and qualities between stores are so small that competing with these determinants is no longer efficient. The general standard of prices, quality and service homogenises the market, inducing consumers to expect the given standard instead of valuing it. But if stores do not exclusively compete for customers through price, service or quality we might of course wonder what kind of competitive instruments stores are using. By following the dynamic vision, stating that high concentration may elevate the incentive to engage in innovative activities, differentiation on the food retail market may be performed through other methods. As was discussed in section 6.1 such methods may be carried out through pure promotion such as advertising, direct marketing, sales promotions as coupons and prize pack and structural memberships such as the ICA bank. Other manners may be careful adaptation to regular development of consumers’ shopping habits. One way is to be an interesting option for consumers. This may be carried out by augmenting the positive “shopping experience” related to the purchase of groceries. There are several ways to realise such a strategy. Nice interior decorations in the stores, happenings such as demonstrations or chefs cooking in the stores, babysitting, or games for children are a few examples. The location of stores in big shopping centres with large parking spaces is another way to increase the shopping experience. In this way consumers are able to combine their food purchase with other shopping. Before ending the discussion of store specific factors, we wish to make some comments concerning the Swedish Competition Law and our analytic result. As we have stated above prices do not seem to be a commonly used competitive instrument on local retailing markets. This disagrees with the static perspective, describing prices as the most important competitive tool. The law on the other hand promote price competition by setting up different kinds of prohibitions. Does this mean that the law hampers the competition on the Swedish food retail market? It is hard to tell whether the law hamper the competition or not but instead of giving room for other interpretations on how to reach a workable competition, the law promote price competition that, according to our analysis, does not exist on the Swedish food retail market. This may indicate some inefficient features of the law.

The Swedish Food Retail Market Chapter 6 – Analysis
48
6.3. Region-specific factors As explained in chapter four, we aim to supplement the analysis of the competitive situation on the Swedish food retail market by using demographic variables that are not controllable for the market actors. Since we focus on local markets we chose variables that we assume differ among the regions. According to the regression result the impact of those variables varies between the years whether studying the dependent variable for ICA’s share of total turnover or ICA’s turnover per capita. In this section we explore the results more carefully, trying to find explanations and connections to the overall food retail market. Since the region-specific variables are based on our own assumptions concerning their prospective explanatory effects on ICA’s turnover there is no economic theoretical reasoning connected to our analysis. Yet, where suitable we aim to relate the outcome with the strategic competitive actions among the market actors.
6.3.1. Share of families with children As we have seen, the regression results reveal a negative relationship between the share of families with children and the dependent variable, no matter if the dependent variable is measured as ICA’s share of total turnover or ICA’s turnover per capita. It is important to state that the regression results on ICA’s turnover per capital produce a slightly more significant outcome than the result for ICA’s share of total turnover. However, this relationship is given, since the share of families with children is naturally correlated with the per capita amount, implying that as the share of families increases so does the amount of population. If we return to the regression results the basic interpretation is that as the share of families with children increases ICA’s turnovers decrease. A possible explanation for this negative relationship is that families with children aim to economise on food purchases by shopping in discount stores instead of traditional retail stores. Yet, the correlation between the competitor’s discount stores and ICA’s turnover is not negative throughout the two models. This requires us to verify this analysis. If competitors’ discount stores had exerted downward pressure on ICA’s turnover, it may have been possible to interpret this as a consequence of a lack of discount stores within ICA, thereby “forcing” customers, such as families with children, to shop in competitors’ discount stores. Before completely relying upon this analysis, it is important to know that ICA does indeed involve discount stores within their different concepts. During 2001 Rimi constituted the discount concept of ICA, but was withdrawn from the market in 2001. Instead the grouping initiated the establishment of the Danish discount store Netto in 2002. However, since Netto has not been visible within the limits of our material, we decided not to include any ICA discount stores at all in our regression in order to place the models for 2001 and 2002 on equal footing. Hence, Rimi was not included in 2001. Yet, we do not wish to regard our result as entirely misleading. The non-existence of ICA discount stores in the material for 2002 and the small number for 2001 makes the current result comparable to that where ICA’s discount stores for 2001 would have been included. Nevertheless, it is possible that

The Swedish Food Retail Market Chapter 6 – Analysis
49
the regression result on the variable of the share of families with children as well as that for the existence of competitive discount stores are somehow indefinite.
6.3.2. Purchasing power Also when it comes to the purchasing power we have detected a negative relationship between the explanatory variable and ICA’s turnover. Basically this means that ICA’s turnover decreases when people get more money. The relationship holds both for ICA’s share of total turnover and per capita, although the latter produces a lower level of significance. An explanation for this result may be that daily commodities refer to so-called staple commodities that people need to buy no matter the level of income. Thus, instead of spending the surplus on regular daily commodities, it is possible that people allow themselves some kind of “luxury” either beyond or connected to the regular consumption of daily commodities. When connecting “luxury” to food consumption, consumers may search for some kind of event surrounding the occasion of consumption, such as having dinner in a restaurant or buying take-away food. Another suggestion is that they buy food in specialised grocery stores instead of traditional retail stores, hypermarkets or discount stores, thereby searching to extend the level of quality and service of the purchase. “Luxury” beyond the regular consumption may show itself in visiting the theatre or buying other commodities, thus spending the surplus on other areas of consumption than food. If the analysis is correct, this insinuates that the competitive situation expands, including the service sector as a source of competition to the retail market. This would comply with the development on other markets. All in all, this may be an overall consequence of the modern lifestyle. As time and lifestyles change the regular shopping habits also change. For this reason, markets in general adapt to this by supplying goods and services that are suitable for new consumers’ purchasing habits. Although the integration among markets may be a general and up-to-date development, the effects of ICA’s turnover and an increasing purchasing power as well as the share of families with children give rise to some reflections. Given the result it is feasible to conclude that ICA focuses on the segment making up the average consumers. Average consumers in this case are referred to as middle-class income earners in Sweden. In order to satisfy the average consumer, ICA positions itself within the fields that are regarded as more suitable for these customers. Such fields may take the form of traditional retailing stores, which, furthermore, is confirmed by the dominating number of retailing stores that ICA possess. ICA thereby ignores the demands of customers situated in the end points, delineated by high-income earners and low-income earners. Within the limits of our analysis, families with children are to represent low-income earners who search to economise on their purchases. If this is correct, the situation combined with ICA’s dominating market position does not comply with the dynamic perspective of competition and our analysis concerning market innovations. Hence, ICA may be described as centralising and attaining a steady state, where the development of stores and the supply of stores is not enhancing. Thus, ICA seems to ensure its domination of the market by concentrating on reaching the average customers and not searching for new positioning alternatives and market development.

The Swedish Food Retail Market Chapter 6 – Analysis
50
Before leaving the subject of purchasing power, we wish to emphasise the probability that purchasing power is related to regional locations, meaning that bigger cities may be considered places where the number of high-income persons is high. However, nothing in our material confirms this theory. It is possible, though, that the connection would have been detected if we had included cities and suburb municipalities in our regressions.
6.3.3. Mobility of population By including the mobility of population variable we expected to detect a difference between the estimated impact of municipalities, with high or low mobility, on ICA’s turnover. Our presumption was that lower mobility of population might give rise to more loyal customers, turning to the stores where they regularly shop, thereby implying a positive relationship between ICA’s turnover and municipalities with low mobility. Moreover, such a result may have served to strengthen the theory suggesting that ICA gains competitive advantage due to its lengthy existence on the market. Higher mobility of population, on the other hand, may instead indicate more flexible consumers that do not put any notable value in the choice of store when purchasing groceries, since they are continuously moving from place to place. Furthermore, we assumed that the mobility of population also would involve average age of the population within municipalities. While supposing that students and young people constituted a mobile part of the population, high mobility would approximate a low average age while low mobility referred to a high age. As we have seen, the regression results did not reveal any statistically significant result, though, signifying that the mobility of population has no effect on the ICA’s turnover at all. Searching for a logical explanation for this is not straightforward. One suggestion may be that market actors do not perform their competition on terms of loyalty, but do rather adjust their competitive strategies to all inhabitants of a market. When interpreting the mobility of population as an indication of average age it is also feasible to think that market activities are also not regulated in agreement with the age of consumers.
6.3.4. Type of municipalities and regional location A general feature in this section has been that the region-specific variables had either none or very little influence on ICA’s turnover. This pattern holds also for the variables indicating the type of municipalities, except for the variable for thinly populated municipalities, rural municipalities and other small municipalities. This variable is negative and statistically significant at the five-percent level regardless of models and year. As mentioned in section 6.1., one rational explanation for this relationship may be that the number of people living in these types of municipalities is few, which naturally results in a lower turnover. Moreover, a small number of people indicate a small market, which is why the number of stores on these markets is few. Another suggestion is that the generally shrinking number of stores on the market first affects these kinds of municipalities and thereby also ICA’s turnover. When stores close down, consumers have to do their grocery shopping in other cities that may not be part of the local market.

The Swedish Food Retail Market Chapter 6 – Analysis
51
Considering the regional location of local markets, we find that the variable indicating medium size cities and other bigger municipalities is negative related to ICA’s share of total turnover in 2002. If performing a bold analysis this insinuates that not even these kinds of municipalities make up a sufficiently large market to successfully establish hypermarkets or larger traditional retail stores that generally generate higher turnovers. When considering the regional location of local markets, we find that the variable indicating municipalities located in Norrland produces some statistically significant estimators in 2002, both when studying ICA’s share of total turnover and ICA’s turnover per capita. These estimators are negatively related to ICA’ s turnover, implying that municipalities located in Norrland engender a negative turnover for ICA. This relationship may be explained through the same reasoning as in the case of thinly populated municipalities, rural municipalities and other small municipalities. Since these kinds of municipalities are regularly situated in Norrland, this result simply confirms the discussion above.

The Swedish Food Retail Market Chapter 7 – Remarks
52
Chapter 7 – Remarks
7.1. Concluding Remarks The Swedish food retail market is presently regarded as a subject of debate when considering its competitive situation. There are three major actors dominating the market - ICA, KF and Axfood - together dominating with 75 percent of total market shares. The scant number of retailing actors indicates that the Swedish food retail market is a highly concentrated oligopoly. But how does a market reach a workable competition? Economic theory does not provide any clear answer to that question, but is rather divided into two fundamentally different approaches when defining competition: the static and the dynamic view on competition. Hence, although the concept of competition is regarded as pervasive in economic life, identified through attributes such as efficiency, price reductions and improved products, the definition is vague and ambiguous. While the static perspective is based upon price theory and market equilibrium, simultaneously leading to a structural and static view on competition, the dynamic perspective sees competition as a process that operates on unspecific and non-defined markets. In an attempt to examine the competition on local Swedish retail markets, the purpose of this study was to carry out an econometric model estimating the situation. The model serves to explain the variation of ICA’s achievements measured in terms of turnovers obtained in the company. The explanatory variables composing the model are divided into separate groupings: degree of market concentration, store-specific factors and region-specific factors, where the variables for market concentration and store-specific factors originate from theories on competition both from a static and a dynamic view. Furthermore, in order to find out which one of the competitive explanations best fits the reality, the regression results are interpreted from a static and a dynamic perspective of competition. We have now come to the conclusion of our findings.
7.1.1. Overall conclusions The concentration on the Swedish food retail market is high. The level of concentration obtained in our material significantly stretches above the 1800 limit, which, according to theoretical definition of market concentration is the highest level for markets not to be defined as concentrated. Moreover, the level of concentration is increasing. Between 2001 and 2002 the mean value of market concentration of stores increased from a level of 2081.14 to 2108.84. A comparable result was revealed for the concentration of chains, which extended from a level of 4017.41 in 2001 to 4138.24 in 2002. Thus, all in all the outcome of concentration confirms the structural reformation permeating the market. As the number of stores decreases no additional actors enter the market, indicating that the three major groupings, ICA, KF and Axfood, still dominate. While the food retail market consists of a limited number of actors, the supply of goods may be considered homogenous among the market actors. Products on the food retail market are

The Swedish Food Retail Market Chapter 7 – Remarks
53
numerous, including a wide range of groceries, but do not vary notably among chain affiliations when it comes to modes and level of quality of products. This complies with the static view of competition, stating that for a market to be perfect products must be homogenous. Due to the homogenous character of groceries, the possibilities for differentiation and development of products are limited. Thus, in order to gain competitive advantage, market actors must find other ways to carry out strategic market activities. Such ways are in some part reflected by the division of store concepts among the market actors that do all represent particular ideas of trading and marketing. These ideas proceed from notions of size, product mix and geographic position. The region-specific variables had either no or very little influence on ICA’s turnover. The variable for thinly populated municipalities, rural municipalities and other small municipalities affects ICA’s turnover negatively. One rational explanation for this relationship may be that the number of people living in these types of municipalities is few, which naturally results in a lower turnover. The purchasing power variable showed that high-income earners do not do their grocery shopping at ICA, or at least do not increase their grocery shopping. Thus instead of spending the income surplus on regular daily commodities, it is possible that people allow themselves some kind of “luxury” either beyond or connected to the regular consumption of daily commodities. The variable share of families with children did also show that families do not do their grocery shopping at ICA. One possible explanation is that families aim to economise on food purchases by shopping in discount stores instead of traditional retail stores. Taking these results under consideration, ICA appears to focus on the segment made up of average consumers. If this is correct, ICA seems to ensure its domination of the market by concentration on reaching the average consumers and not searching for new positioning alternatives and market development.
7.1.2. Static or dynamic perspective of competition? According to our findings, neither of the perspectives in economic theory of competition is solely able to produce an accurate method for reaching a state of a workable competition. Instead, a combination of the static and the dynamic ideas may be regarded as the most advantageous way to generate suitable conditions for competition to be efficient. The results obtained in this study reveal different logic for this. When considering market concentration of stores, we detect a negative relationship with ICA’s turnover. As we have seen there are several suggestions for explaining this relationship. The obvious rationale is that local markets, with a limited number of retailing actors as well as consumers, generate a reduction in ICA’s turnover in comparison to other local markets, since fewer consumers yield lower turnovers. This connection is given and exogenously determined, impossible for market actors to influence. However, another explanation for the relationship is that a large number of stores is a necessary condition for market actors to keep modernising and developing the strategic market activities. Such a condition would follow the static vision of competition. On the other hand, viewing the correlation between the high concentration of chains and ICA’s turnover we have seen that as concentration gets higher ICA’s turnover increases.

The Swedish Food Retail Market Chapter 7 – Remarks
54
Given the market-dominating position of ICA this relationship is apparent: as ICA strengthens its market position, turnover automatically increases. According to the static perspective, this is a sign of a weak competition. In line with the static vision, efficient price competition occurs when the number of firms acting on the market is sufficiently high; only then prices converge to an equilibrium level equal to that of marginal costs. As stated, the limits of this thesis restrain us from drawing any strong conclusions when it comes to the price matter. However, considering our general observations of the influencing power of discount stores we may state that price is not the unique factor when purchasing groceries. The existence of discount stores has a positive impact on ICA’s turnover, which may, of course, be interpreted in several ways. Yet, the majority of interpretation complies with the dynamic vision of competition. That is, consumers take other factors than prices into consideration when doing their grocery shopping. If we keep that in mind, we move on to determine the actual impact that the competitive tools of service and quality have on ICA’s turnover. These conclusions are also based on the variables within the range of store-specific factors and originate from the indications of reality revealed in the regression result. The impact of service was estimated through the existence of service stores, characterised by stores with a highly priced, limited product mix and extended opening hours. The correlation between ICA’s turnover and the approximation of service was negative, suggesting that instead of doing their grocery shopping in ICA’s service stores people in general turn to other kinds of stores. Service in this sense may therefore not constitute a competitive tool with any significant strength. To approximate the impact of quality we let hypermarkets represent a decent level of general quality. As hypermarkets are positively related to ICA’s turnover it is feasible to conclude that quality actually does seem to make a difference in a competitive sense. However, before settling on this conclusion it is important to emphasise that this connection is evident, since the size of hypermarkets should indicate a positive influence on ICA’s turnover. Hence, we are only able to state the importance of quality in somewhat weak terms. Yet, the food retail market may be regarded as a transparent market, where the methods for reaching competitive convenience in terms of service and quality may be relatively visible both for customers and competitors. This may constitute a source of uniform development of the market, meaning that as a competitive firm enhances the level of quality and service, remaining market actors can not afford not to adjust to the same levels. The marginal differences in prices, services and qualities between stores may therefore be so small that competing with these determinants is no longer efficient. Extended opening hours for retailing stores in general is one example, as is weak breakthrough of discount stores. When further considering the example of discount stores, it is actually feasible to think that the price reductions in these stores are too modest in comparison to the relaxation of service and quality for consumers to put any value in it. It would therefore be interesting to examine what impact hard discount stores would have on the Swedish food retail market. The marginal inefficiency revealed by competitive strategies of prices, services and qualities between stores does not signify that stores do not use these modes as competitive tools, but rather that they are not exclusively used in order to attract the customers. Instead, it is feasible to imagine a combination of these tools and other methods. By following the dynamic vision, stating the importance of differentiation and innovative activities, we detect a number of sources for other such methods of strategic marketing. Thus, differentiation

The Swedish Food Retail Market Chapter 7 – Remarks
55
may also be obtained through the process of innovative progress procuring the good will of the consumer. Pure promotion such as advertising, direct marketing, sales promotions such as coupons and price pack and structural memberships would be one method. Adjusting for regularly development of consumers’ shopping habits may be another. An additional mode may be to constitute an interesting option for consumers. This may be carried out by increasing the positive “shopping experience” related to the purchase of groceries. Hence, through these methods the market actors seek to transform the homogeneity connected to the groceries to heterogeneity. Retailing products thereby becomes something more than just milk, bread and meat and increases the added value for the customers while making their food purchases. Now, still following the dynamic perspective of competition, in order to obtain incentives to become involved in innovative activities such as suggested above, a dominating market position is required. This is due to the fact that market-dominating firms have greater capacity to finance research and development. A market with a great number of firms would not dare to finance this sort of research because of the associated costs and risks. High concentration is therefore essential for market innovations to emerge to further stimulate the market and hence economic progress. From this point of view, ICA’s domination of the food retail market may be considered something positive. As a strong market actor ICA may lead the market progress, inspiring other firms to imitate their work and enhancing the development even further. However, a negative outcome of such a development is that the number of innovative suggestions becomes limited, hindering the power of consumers to come forth. This, once again, emphasises the benefits of the static vision.
7.2. Policy Recommendations The Swedish Competition Law is strongly permeated by the static perspective of competition, aiming to promote mobility in markets, reach “fair” prices and generate an efficient allocation of resources. To reach a workable competition the law proceeds from two general paragraphs: prohibition against engagement of firms in antic-competitive co-operations and prohibition against abuse of a dominant market position, testifying to the importance of low concentration on the market through the existence of a high number of firms. Hence, the law does not obviously leave any room for competition interpreted in terms of innovations and differentiation, as advocated by the dynamic view. As stated, our findings may serve as support for combining the dynamic and static perspective on competition in order to reach a workable competition. As the static vision yields pure competitive conditions in respect to several actors, the dynamic vision emphasises the importance of innovations and market development. These are both meaningful elements for increasing consumers’ value. However, if applying this concluding remark to the Swedish Competition Law, it is feasible to think that the law may promote inefficient conditions for competition. The law is intended not to break up already existing firms but to hamper stores from reaching a dominant position. But when outlawing dominant positions the incentives to engage in innovative development may diminish. This

The Swedish Food Retail Market Chapter 7 – Remarks
56
may therefore to some extent hinder the markets’ development. The law does also promote price competition, which, according to our analyses, does not exist on the Swedish food retail market. Competition, as we have seen, is no longer just about price competition. It also involves a whole range of activities to attract consumers. While the market conditions develop, it is thus suggestible that the law stated adapts to these developments.
7.3. Suggestions for further studies The realising of this study has been a journey of instructive wisdom and educative challenges in several ways. As the result advances new aspects and ideas for investigations gets visible as do prospect for new ways to view the matter of the subject. We would like to complete this report by stating some examples for further econometric studies concerning the competition on the Swedish Food Retail Market. As mentioned in our analysis, the dynamic perspective of competition put a lot of focus on the innovative activities of the market actors. Since we have not included any variables indicating such activities on the food retail market, we have aimed to relate this dynamic approach to our results by making assumptions concerning the market characteristics and market innovations. Obviously a more accurate way would be to actually study the modes of innovations on the market. However, it is assumable that this matter is hard to statistically quantify and a qualitative methodological approach may therefor be sufficient to supplement our results. Another continuation of the present report would be to extend the time span of the investigation. Because of limited time we only included two years in our study (2001 and 2002). However, it would be very interesting to increase the span of years in order to capture the competitive development from the years before structural reformation of the market until present time. Moreover, when involving present data it would be interesting to study the competitive effects obtained from the introduction of hard discount stores on the Swedish food retail market. As already stated, we have chosen not to include cities and suburb municipalities in our study, since these are types of municipalities of particular characterised. Instead we limited our study by only including types of municipality with comparable features. Still, the competitive situation on the food retail market within cities and suburbs is important to comprehend and it would have been very interesting to involve these types of municipalities in a comparative study to that of the results obtained within this report. This would of course improve the possibilities to apprehend the impact that types of municipality have on the market actor’s achievements. Another providing effect would be the opportunity to seize the impact of purchasing power in an even more accurate way, while assuming that cities are areas with a great number of high income takers. It is also possible that such a study would increase the trustfulness of the result, since results, no matter the direction, arise from market situation fundamentally different from one another.

The Swedish Food Retail Market Literature
57
Literature Books: Bernitz., U,(1996), ”Den Svenska Konkurrenslagen”, Nordstedts Juridiska AB , Stockholm. Besanko, D., Dranove, D., Shanely. M., Schaefer. S., (2004), “Economics of Strategy”, Lehigh Press, US. Dahmström, k., (2000),”Från Datainsamling till rapport- att göra en statisk undersökning, 3 Ed, Studentlitteratur, Lund, Gujarati, D.N., (1995), “Basic Econometrics”, 4 Ed, McGraw-Hill Book Co, Singapore. Hayek, F.A., (1978), “New Studies in Philosophy, Politics, Economics and the History of Ideas”, The Camelot Press Ltd, Southampton. Schumpeter, J.A., (1950), “Capitalism, Socialism and Democracy”, 3 Ed, Harper & Row, US. Shy.O, (1995), “Industrial Organization Theory and Applications”, The MIT Press, London. Utton, M.A, (1995), “Horizontal mergers and market dominance”, in: Market Dominance and antitrust, Aldershot, Edwards Elgar, London. Van den Bergh, R. J.,Camesasca, P.D., (2001), “European Competition law and economics.” In: A comparative perspective, Hart, Oxford. Von Mises, L., (1966), “Human Action: A Treatise on Economics”, Fox & Wilkes, US. Articles: Horn, H., Lang, H., Lundgren, S.,(1994), “Competition, long run contracts and internal inefficiencies in firms”, European Economic Review, Vol 38. McNulty, P.J., (1968), “Economic theory and the meaning of competition”, The quarterly Journal of Economics, Vol 82, No 4 Stigler, G.J., (1957), “Perfect competition, Historically contemplated”, The journal of Political Economy, Vol 65, No 1 Van den Bergh, R.J., Camesasca, P.D., (2000), “Achilles Uncovered – Revisiting the European Commission’s 1997 Market Definition Notice”, Antitrust Bulletin, No 45. Vickers, J., (1995), “Concept of Competition”, Oxford Economics Papers New Series, Vol 4, No 1.

The Swedish Food Retail Market Literature
58
Reports: Bergström. F, (2003), ”Konkurrens och Dynamik i Detaljhandeln”, Handels Utrednings Institutet, Stockholm. Konkurrensverket rapportserie 2001:4, “ Kan Kommunerna pressa matpriserna?”, AB Dangårdsgrafiska, Ödeshög. Konkurrensverkets rapportserie 2002:2, ”Vårda och Skapa konkurrens – Vad krävs för ökad Konsumentnytta?”, AB Dangårdsgrafiska, Ödeshög. Konkurrensverket rapportserie 2002:6, ” Dagligvaruhandeln – struktur, ägarform och relation till leverantörer”, AB Dangårdsgrafiska, Ödeshög Konkurrensverkets rapportserie 2004:2, ”Konsumenterna, matpriserna och konkurrensen”, Ekonomi-print AB, Stockholm. Web addresses: http://www.kkv.se/eng/competition/dominant_position.shtm (2004-05-30) Asplund, M., riberg, R., (2002), “Food prices and market structure in Sweden”, http://www.kkv.se/forskare-student/pdf/proj114-1999_4.pdf www.scb.se (2004-06-05)

The Swedish Food Retail Market
59
Appendix 1
Descriptive Statistic Model 1 2001 Mean Std. Deviation N ICA’s share of total turnover .4770 .15591 50 Herfindahl Index Store 2081.14 873.720 50 Herfindahl index Chain 4017.41 970.479 50 Dummy C_hypermarket .26 .443 50 Dummy C_discount store .38 .490 50 Dummy C_ service store .70 .463 50 Dummy ICA’s hypermarket .11 .298 50 Dummy ICA’s service store .16 .370 50 Sales area per capita 2.969 .8418 50 Purchasing power 90.5800 6.666728 50 Mobility of population -28.543 224.45532 50 Share of families with children .2972 .02532 50 Dummy bigger cities .10 .303 50 Dummy medium size cities and other bigger municipalities .30 .463 50 Dummy thinly populated municipalities, rural municipalities and other smaller municipalities .40 .495 50 Dummy Norrland region .20 .404 50 Dummy Svealand region .38 .490 50
Dependent variable: ICA’s share of total turnover

The Swedish Food Retail Market
60
2002 Mean Std. Deviation N ICA’s share of total turnover .4946 .14409 50 Herfindahl Index Store 2108.84 850.854 50 Herfindahl index Chain 4138.24 943.375 50 Dummy C_hypermarket .26 .443 50 Dummy C_discount store .38 .490 50 Dummy C_ service store .74 .443 50 Dummy ICA’s hypermarket .10 .286 50 Dummy ICA’s service store .26 .443 50 Sales area per capita 2.990 .8629 50 Purchasing power 89.6600 6.62281 50 Mobility of population 18.8200 193.63933 50 Share of families with children .2950 .02525 50 Dummy bigger cities .10 .303 50 Dummy medium size cities and other bigger municipalities .30 .463 50 Dummy thinly populated municipalities, rural municipalities and other smaller municipalities .40 .495 50 Dummy Norrland region .20 .404 50 Dummy Svealand region .38 .490 50
Dependent variable: ICA’s share of total turnover 2001 Mean Std. Deviation N ICA’s turnover per capita 8740.90 3213.958 50 Herfindahl Index Store 2081.14 873.720 50 Herfindahl index Chain 4017.41 970.479 50 Dummy C_hypermarket .26 .443 50 Dummy C_discount store .38 .490 50 Dummy C_ service store .70 .463 50 Dummy ICA’s hypermarket .11 .298 50 Dummy ICA’s service store .16 .370 50 Sales area per capita 2.969 .8418 50 Purchasing power 90.5800 6.66728 50 Mobility of population -28.5430 224.45532 50 Share of families with children .2972 .02532 50 Dummy bigger cities .10 .303 50 Dummy medium size cities and other bigger municipalities .30 .463 50 Dummy thinly populated municipalities, rural municipalities and other smaller municipalities .40 .495 50 Dummy Norrland region .20 .404 50 Dummy Svealand region .38 .490 50
Dependent variable: ICA’s turnover per capita

The Swedish Food Retail Market
61
2002 Mean Std. Deviation N ICA’s turnover per capita 9117.38 3692.272 50 Herfindahl Index Store 2108.84 850.854 50 Herfindahl index Chain 4138.24 943.375 50 Dummy C_hypermarket .26 .443 50 Dummy C_discount store .38 .490 50 Dummy C_ service store .74 .443 50 Dummy ICA’s hypermarket .38 .490 50 Dummy ICA’s service store .26 .443 50 Sales area per capita 2.990 .8629 50 Purchasing power 89.6600 6.62281 50 Mobility of population 18.8200 193.63933 50 Share of families with children .2950 .02525 50 Dummy bigger cities .11 .298 50 Dummy medium size cities and other bigger municipalities .30 .463 50 Dummy thinly populated municipalities, rural municipalities and other smaller municipalities .40 .495 50 Dummy Norrland region .20 .404 50 Dummy Svealand region .38 .490 50
Dependent variable: ICA’s turnover per capita

The Swedish Food Retail Market
62
Appendix 2
Model Summary Model 1 2001
R R square Adjusted R squareStd. Error of the
Estimated Durbin-Watson .864 .746 .623 .09572 1.989
Dependent variable: ICA’s share of total turnover 2002
R R square Adjusted R squareStd. Error of the
Estimated Durbin-Watson .882 .778 .670 .08279 2.091
Dependent variable: ICA’s share of total turnover Model 2 2001
R R square Adjusted R squareStd. Error of the
Estimated Durbin-Watson .851 .725 .614 .09681 2.056
Dependent variable: ICA’s share of total turnover 2002
R R square Adjusted R squareStd. Error of the
Estimated Durbin-Watson 878 .771 .679 .08158 2.108
Dependent variable: ICA’s share of total turnover Model 1 2001
R R square Adjusted R squareStd. Error of the
Estimated Durbin-Watson .872 .760 .644 1916.781 1.905
Dependent variable: ICA’s turnover per capita 2002
R R square Adjusted R squareStd. Error of the
Estimated Durbin-Watson .869 .756 .638 2222.918 1.413
Dependent variable: ICA’s turnover per capita

The Swedish Food Retail Market
63
Model 2 2001
R R square Adjusted R squareStd. Error of the
Estimated Durbin-Watson .844 .713 .598 2037.789 1.926
Dependent variable: ICA’s turnover per capita 2002
R R square Adjusted R squareStd. Error of the
Estimated Durbin-Watson .869 .755 .657 2162.133 1.401
Dependent variable ICA’s turnover per capita
Collinearity statistics Model 1 2001
Collinearitya
Tolerance VIF
Herfindahl Index store .447 2.247 Herfindahl Index Chain .435 2.202 Dummy C_ hypermarket .235 4.350 Dummy C_ discount store .391 2.561 Dummy C_ service store .391 2.560 Dummy ICA’s hypermarket .480 2.100 Dummy ICA’s service store .315 3.178 Sales area per capita .637 1.547 Purchasing power .488 2.054 Mobility of population .426 2.360 Share of families with children .535 1.883 Dummy bigger cities .257 3.956 Dummy medium size cities and other bigger municipalities .287 3.519 Dummy thinly populated municipalities, rural municipalities and other smaller municipalities .323 3.135 Dummy Norrland region .420 2.408 Dummy Svealand region .428 2.341
Dependent variable ICA’s share of total turnover

The Swedish Food Retail Market
64
2002 Collinearitya
Tolerance VIF Herfindahl Index store .445 2.247 Herfindahl Index Chain .434 2.303 Dummy C_ hypermarket .235 4.249 Dummy C_ discount store .391 2.561 Dummy C_ service store .391 2.560 Dummy ICA’s hypermarket .479 2.089 Dummy ICA’s service store .315 3.176 Sales area per capita .647 1.545 Purchasing power .488 2.051 Mobility of population .426 2.346 Share of families with children .535 1.871 Dummy bigger cities .254 3.930 Dummy medium size cities and other bigger municipalities .284 3.519 Dummy thinly populated municipalities, rural municipalities and other smaller municipalities .319 3.135 Dummy Norrland region .416 2.404 Dummy Svealand region .427 2.341
Dependent variable ICA’s share of total turnover. Model 2 2001 Collinearitya
Tolerance VIF Herfindahl Index store .503 1.989 Herfindahl Index Chain .604 1.657 Dummy C_ hypermarket .399 2.508 Dummy C_ discount store .616 1.624 Dummy C_ service store .615 1.625 Dummy ICA’s hypermarket Dummy ICA’s service store Sales area per capita .649 1.540 Purchasing power .538 1.859 Mobility of population .495 2.019 Share of families with children .685 1.459 Dummy bigger cities .253 3.960 Dummy medium size cities and other bigger municipalities .335 2.984 Dummy thinly populated municipalities, rural municipalities and other smaller municipalities .351 2.852 Dummy Norrland region .535 1.868 Dummy Svealand region .605 1.654
Dependent variable ICA’s share of total turnover.

The Swedish Food Retail Market
65
2002 Collinearitya
Tolerance VIF Herfindahl Index store .446 2.242 Herfindahl Index Chain .475 2.105 Dummy C_ hypermarket .454 2.204 Dummy C_ discount store .424 2.361 Dummy C_ service store .499 2.002 Dummy ICA’s hypermarket Dummy ICA’s service store Sales area per capita .675 1.481 Purchasing power .494 2.025 Mobility of population .432 2.317 Share of families with children .672 1.489 Dummy bigger cities .276 3.627 Dummy medium size cities and other bigger municipalities .327 3.054 Dummy thinly populated municipalities, rural municipalities and other smaller municipalities .345 2.895 Dummy Norrland region .505 1.979 Dummy Svealand region .526 1.901
Dependent variable ICA’s share of total turnover. Model 1 2001 Collinearityb
Tolerance VIF Herfindahl Index store .501 1.994 Herfindahl Index Chain .528 1.896 Dummy C_ hypermarket .340 2.939 Dummy C_ discount store .612 1.634 Dummy C_ service store .566 1.766 Dummy ICA’s hypermarket .423 2.364 Dummy ICA’s service store .654 1.530 Sales area per capita .642 1.559 Purchasing power .529 1.890 Mobility of population .428 2.336 Share of families with children .594 1.684 Dummy bigger cities .229 4.376 Dummy medium size cities and other bigger municipalities .296 3.383 Dummy thinly populated municipalities, rural municipalities and other smaller municipalities .351 2.852 Dummy Norrland region .512 1.954 Dummy Svealand region .538 1.859
Dependent variable ICA’s turnover per capita

The Swedish Food Retail Market
66
2002 Collinearityb
Tolerance VIF Herfindahl Index store .463 2.161 Herfindahl Index Chain .459 2.176 Dummy C_ hypermarket .247 4.047 Dummy C_ discount store .405 2.472 Dummy C_ service store .425 2.354 Dummy ICA’s hypermarket .617 1.620 Dummy ICA’s service store .290 3.447 Sales area per capita .594 1.682 Purchasing power .486 2.056 Mobility of population .498 2.009 Share of families with children .664 1.507 Dummy bigger cities .696 1.437 Dummy medium size cities and other bigger municipalities .521 1.918 Dummy thinly populated municipalities, rural municipalities and other smaller municipalities .370 2.702 Dummy Norrland region .499 2.006 Dummy Svealand region .508 1.967
Dependent variable ICA’s turnover per capita Model 2 2001 Collinearityb
Tolerance VIF Herfindahl Index store .503 1.989 Herfindahl Index Chain .604 1.657 Dummy C_ hypermarket .399 .2.508 Dummy C_ discount store .616 1.624 Dummy C_ service store .615 1.625 Dummy ICA’s hypermarket Dummy ICA’s service store Sales area per capita .649 1.540 Purchasing power .538 1.859 Mobility of population .495 2.019 Share of families with children .685 1.459 Dummy bigger cities .253 3.960 Dummy medium size cities and other bigger municipalities .335 2.984 Dummy thinly populated municipalities, rural municipalities and other smaller municipalities .351 2.852 Dummy Norrland region .535 1.868 Dummy Svealand region .605 1.654
Dependent variable ICA’s turnover per capita
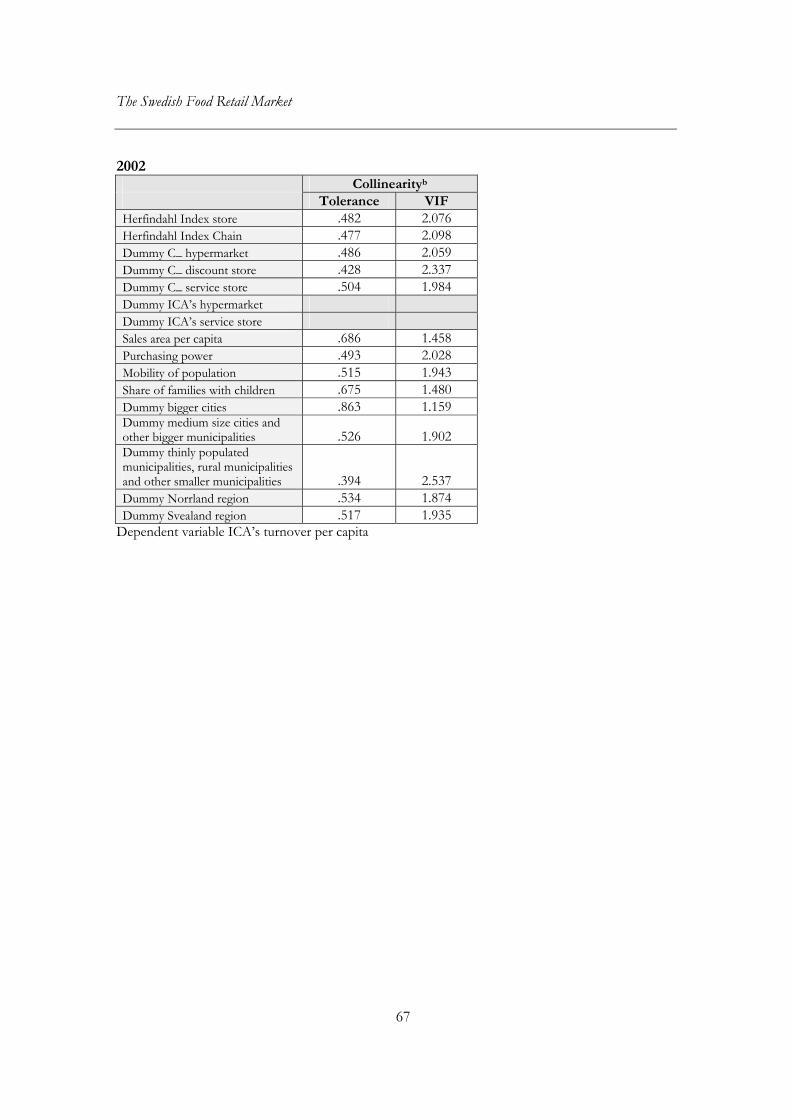
The Swedish Food Retail Market
67
2002 Collinearityb
Tolerance VIF Herfindahl Index store .482 2.076 Herfindahl Index Chain .477 2.098 Dummy C_ hypermarket .486 2.059 Dummy C_ discount store .428 2.337 Dummy C_ service store .504 1.984 Dummy ICA’s hypermarket Dummy ICA’s service store Sales area per capita .686 1.458 Purchasing power .493 2.028 Mobility of population .515 1.943 Share of families with children .675 1.480 Dummy bigger cities .863 1.159 Dummy medium size cities and other bigger municipalities .526 1.902 Dummy thinly populated municipalities, rural municipalities and other smaller municipalities .394 2.537 Dummy Norrland region .534 1.874 Dummy Svealand region .517 1.935
Dependent variable ICA’s turnover per capita

The Swedish Food Retail Market
68
Appendix 3
Correlation Matrix, 2001 (1) Herfindahl Index Store Herfindahl Index Chain Dummy
C_hypermarket Dummy C_discount
Dummy C_servicestore
Dummy ICA's hypermarket
Herfindahl Index Store
1 0,273 -0,560 -0,181 -0,335 -0,156
Herfindahl Index Chain
0,273 1 -0,222 -0,132 0,062 0,216
Dummy C_hypermarket
-0,560 -0,222 1 0,100 0,338 0,249
Dummy C_discount store
-0,181 -0,132 0,100 1 0,243 0,184
Dummy C_servicestore
-0,335 0,062 0,388 0,243 1 0,134
Dummy ICA's hypermarket
-0,156 0,216 0,249 0,184 0,134 1
Dummy ICA's servicestore
-0,191 0,063 0,114 0,220 0,167 0,332
Sales area per capita
-0,034 0,026 0,121 0,208 -0,072 0,132
Purchasing power
-0,253 -0,022 0,459 0,019 0,110 0,192
Mobility of popuplation
-0,209 0,130 0,217 0,183 0,129 0,398
Share of families with children 0,188 0,378 -0,298 -0,060 -0,056 -0,100 Dummy bigger cities
-0,434 -0,030 0,562 0,288 0,218 0,105
Dummy medium seize cities and bigger municipalities
-0,301 -0,117 0,209 0,207 0,333 0,407
Dummy thinly populated, rural and other small municipalities
0,248 0,146 -0,391 -0,135 -0,178 -0,297

The Swedish Food Retail Market
69
Dummy Norrland Region
-0,209 0,003 0,160 0,124 0,000 -0,182
Dummy Svealand Region
0,019 -0,286 0,006 -0,273 -0,117 -0,144
Correlation Matrix, 2001, (2)
Dummy ICA's service
store Sales area per capita Purchasing power Mobility of
population Share of families with children
Herfindahl Index Store
-0,191 -0,034 -0,253 -0,209 0,188
Herfindahl Index Chain
0,063 0,026 -0,022 0,130 0,378
Dummy C_hypermarket
0,114
0,121 0,459 0,217 -0,298
Dummy C_discount store
0,220
0,208 0,019 0,183 -0,060
Dummy C_servicestore
0,167 -0,072 0,110 0,129 -0,056
Dummy ICA's hypermarket
0,332 0,132 0,192 0,398 -0,100
Dummy ICA's servicestore
1 0,199 0,210 0,332 -0,104
Sales area per capita
0,199 1 0,206 -0,015 0,062
Purchasing power
0,210 0,206 1 0,040 -0,207
Mobility of popuplation
0,332 -0,015 0,040 1 0,044
Share of families with children -0,104 0,062 -0,207 0,044 1 Dummy bigger cities
0,400 0,181 0,294 0,483 -0,255
Dummy medium seize cities and bigger municipalities
0,071 0,212 0,260 -0,037 0,003

The Swedish Food Retail Market
70
Dummy thinly populated, rural and other small municipalities
-0,245 -0,399 -0,585 -0,125 0,189
Dummy Norrland Region
-0,082 -0,172 0,024 -0,292 -0,124
Dummy Svealand Region
-0,004 0,086 0,168 0,007 -0,258
Correlation Matrix, 2001, (3)
Dummy Bigger cities
Dummy medium seize cities and bigger municipalities
Dummy thinly populated, rural and other small municipalities
Dummy Norrland Region
Dummy Svealand Region
Herfindahl Index Store
-0,434 -0,301 0,248 -0,209 0,019
Herfindahl Index Chain
-0,030 -0,117 0,146 -0,003 -0,286
Dummy C_hypermarket
0,562
0,209 -0,391 0,160 0,006
Dummy C_discount store
0,288
0,207 -0,135 0,124 -0,273
Dummy C_servicestore
0,218 0,333 -0,178 0,000 -0,117
Dummy ICA's hypermarket
0,105 0,407 -0,297 -0,182 0,144
Dummy ICA's servicestore
0,400 0,071 -0,245 -0,082 -0,004
Sales area per capita
0,181 0,212 -0,399 -0,172 0,086
Purchasing power
0,294 0,260 -0,585 0,024 0,168
Mobility of popuplation
0,483 -0,037 -0,125 -0,292 0,007

The Swedish Food Retail Market
71
Share of families with children -0,255 0,003 0,189 -0,124 -0,258 Dummy bigger cities
1 -0,218 -0,272 0,167 -0,124
Dummy medium seize cities and bigger municipalities
-0,218 1 -0,535 -0,109 0,117
Dummy thinly populated, rural and other small municipalities
-0,272 -0,535 1 0,204 -0,219
Dummy Norrland Region
0,167 -0,109 0,204 1 -0,391
Dummy Svealand Region
-0,124 0,117 -0,219 -0,391 1
Correlation Matrix, 2002 (1) Herfindahl Index Store Herfindahl Index Chain Dummy
C_hypermarket Dummy C_discount
Dummy C_servicestore
Dummy ICA's hypermarket
Herfindahl Index Store 1 0,245 -0,525 -0,127 -0,345 -0,093 Herfindahl Index Chain 0,245 1 -0,2 -0,288 0,121 0,137 Dummy C_hypermarket
-0,525 -0,2 1 0,287 0,351 0,237
Dummy C_discount store
-0,127 -0,288 0,287 1 0,37 0,318
Dummy C_servicestore
-0,345 0,121 0,351 0,37 1 0,215
Dummy ICA's hypermarket
-0,093 0,137 0,237 0,318 0,215 1
Dummy ICA's servicestore
-0,304 -0,145 0,688 0,194 0,040 0,076
Sales area per capita
-0,027 0,033 0,134 0,323 0,164 0,156
Purchasing power
-0,027 -0,32 0,469 0,204 -0,052 0,247
Mobility of popuplation
-0,344 0,288 0,395 0,336 0,165 0,25

The Swedish Food Retail Market
72
Share of families with children 0,14 0,562 -0,283 -0,074 -0,119 -0,241 Dummy bigger cities
0,013 -0,05 0,209 0,288 0,198 0,114
Dummy medium seize cities and bigger municipalities
0,04 0,113 -0,391 0,297 0,388 0,4
Dummy thinly populated, rural and other small municipalities
-0,142 -0,016 0,16 -0,303 -0,168 -0,296
Dummy Norrland Region
-0,202 -0,337 0,006 0,021 0,068 -0,181
Dummy Svealand Region
-0,023 0,013 0,134 -0,188 -0,194 -0,166
Correlation Matrix, 2002, (2) Dummy ICA's service
store Sales area per capita Purchasing power Mobility of
population Share of families with children
Herfindahl Index Store
-0,304 -0,027 -0,254 -0,344 -0,442
Herfindahl Index Chain
-0,145 0,013 0,033 -0,032 -0,087
Dummy C_hypermarket
0,688
0,134 0,469 0,395 0,562
Dummy C_discount store
0,194
0,323 0,204 0,336 0,288
Dummy C_servicestore
0,040 -0,052 0,164 0,165 0,198
Dummy ICA's hypermarket
0,076 0,156 0,247 0,250 0,114
Dummy ICA's servicestore
1 0,068 0,434 0,185 0,258
Sales area per capita 0,068 1 0,257 0,117 -0,015

The Swedish Food Retail Market
73
Purchasing power
0,434 0,257 1 0,205 -0,303
Mobility of popuplation
0,185 0,117 0,205 1 0,118
Share of families with children -0,192 -0,015 -0,303 -0,188 1 Dummy bigger cities
0,258 0,218 0,312 0,556 -0,227
Dummy medium seize cities and bigger municipalities
0,209 0,191 0,280 0,058 -0,079
Dummy thinly populated, rural and other small municipalities
-0,391 -0,395 -0,605 -0,249 -0,245
Dummy Norrland Region
0,274 -0,116 -0,005 -0,269 -0,120
Dummy Svealand Region
-0,088 0,027 0,160 -0,006 -0,305
Correlation Matrix, 2002, (3)
Dummy Bigger cities
Dummy medium seize cities and bigger municipalities
Dummy thinly populated, rural and other small municipalities
Dummy Norrland Region
Dummy Svealand Region
Herfindahl Index Store
-0,442 -0,268 0,207 -0,208 -0,008
Herfindahl Index Chain
-0,087 -0,050 0,113 -0,016 -0,337
Dummy C_hypermarket
0,562
0,209 -0,391 0,160 0,006
Dummy C_discount store
0,288
0,297 -0,303 0,021 -0,188
Dummy C_servicestore
0,198 0,388 -0,168 0,068 -0,194

The Swedish Food Retail Market
74
Dummy ICA's hypermarket
0,114 0,400 -0,296 -0,181 0,166
Dummy ICA's servicestore
0,258 0,209 -0,391 0,274 -0,088
Sales area per capita
0,218 0,191 -0,395 -0,116 0,027
Purchasing power
0,312 0,280 -0,605 -0,005 0,160
Mobility of popuplation
0,556 0,058 -0,249 -0,269 -0,006
Share of families with children -0,227 -0,079 0,245 -0,120 -0,305 Dummy bigger cities
1 -0,218 -0,272 0,167 -0,124
Dummy medium seize cities and bigger municipalities
0,218 1 -0,535 -0,109 0,117
Dummy thinly populated, rural and other small municipalities
-0,272 -0,535 1 0,204 -0,219
Dummy Norrland Region
0,167 -0,109 0,240 1 -0,391
Dummy Svealand Region
-0,124 0,117 -0,219 -0,391 1