the synthesis and characterization of water-reducible
TRANSCRIPT

Scholars' Mine Scholars' Mine
Doctoral Dissertations Student Theses and Dissertations
Fall 2015
The synthesis and characterization of water-reducible nanoscale The synthesis and characterization of water-reducible nanoscale
colloidal unimolecular polymer (CUP) particles colloidal unimolecular polymer (CUP) particles
Cynthia J. Riddles
Follow this and additional works at: https://scholarsmine.mst.edu/doctoral_dissertations
Part of the Nanoscience and Nanotechnology Commons, and the Polymer Chemistry Commons
Department: Chemistry Department: Chemistry
Recommended Citation Recommended Citation Riddles, Cynthia J., "The synthesis and characterization of water-reducible nanoscale colloidal unimolecular polymer (CUP) particles" (2015). Doctoral Dissertations. 2457. https://scholarsmine.mst.edu/doctoral_dissertations/2457
This thesis is brought to you by Scholars' Mine, a service of the Missouri S&T Library and Learning Resources. This work is protected by U. S. Copyright Law. Unauthorized use including reproduction for redistribution requires the permission of the copyright holder. For more information, please contact [email protected].
THE SYNTHESIS AND CHARACTARIZATION OF WATER-REDUCIBLE
NANOSCALE COLLOIDAL UNIMOLECULAR POLYMER (CUP) PARTICLES
by
CYNTHIA JEANNETTE RIDDLES
A DISSERTATION
Presented to the Faculty of the Graduate School of the
MISSOURI UNIVERSITY OF SCIENCE AND TECHNOLOGY
In Partial Fulfillment of the Requirements for the Degree
DOCTOR OF PHILOSOPHY
in
CHEMISTRY
2015
Approved Michael Van De Mark
Thomas Schuman Jeffrey Winiarz Klaus Woelk
Melanie Mormile

2015
Cynthia Jeannette Riddles
All Rights Reserved
iii
PUBLICATION DISSERTATION OPTION
This dissertation has been prepared in the form of two manuscripts for
publication, and a third section that is research not published. Papers included are
prepared as per the requirements of the journal in which they are published or are
submitted. This dissertation contains the following two manuscripts for publication:
PAPER I
Pages 4-49 have been published in Polymer 55 (2014) 48-57
PAPER II
Pages 50-78 Submitted to Particle and Particle Characterization

iv
ABSTRACT
The coatings industry has adapted to more stringent guidelines in paint
formulations. Current VOC (volatile organic compound) limits placed by the federal
government have pushed the industry toward the development of paint formulations
which have very little to no VOC’s. The development of Colloidal Unimolecular Polymer
(CUP) particles is a step in the direction of providing a resin system which exists in zero
VOC aqueous dispersion.
The CUP particles are a part of the polymer field of Single Chain Nano Particles
(SCNP) and ranged in diameters of 3-9 nm. The research presented in this dissertation
describes the synthesis and design of these particles along with the various means of
instrumentation used to gain insight into the structure and nature of these particles when
suspended in aqueous medium.

v
ACKNOWLEDGMENTS
I would like to thank my advisor, Dr. Van De Mark for giving me the opportunity
to pursue a doctorate degree, both financially and academically, and who has patiently
pushed me to think on my own as my research progressed. Without the funding as a
research assistant, pursuing a higher education would not have been possible being a
single parent.
I would also like to thank the University for their support as a teacher’s assistant,
the last few semesters in grad school. Again, without funding this opportunity would not
have existed.
I would like to thank the members of my committee for their time in reviewing
this dissertation and for all the feedback they have given.
I would like to thank two teachers that had an impact on my early life; Mr.
Stephen Shepperd and Mr. David Lieb. One inspired a love for reading and the other my
love for chemistry.
Finally, my thanks and gratitude to my family, especially my two children who
endured grad school with me.

vi
TABLE OF CONTENTS
Page
PUBLICATION DISSERTATION OPTION .................................................................. iii
ABSTRACT ...................................................................................................................... iv
ACKNOWLEDGMENTS ...................................................................................................v
LIST OF ILLUSTRATIONS…………………………………………………………...…x
LIST OF TABLES……………………………………………………………………….xii
NOMENCLATURE ........................................................................................................ xiii
SECTION
1. INTRODUCTION…………………………………………………………………...1
PAPER
I. SELF ASSEMBLY OF WATER INSOLUBLE POLYMERS INTO COLLOIDAL UNIMOLECULAR POLYMER (CUP) PARTICLES OF 3-9 NANOMETERS……...4
ABSTRACT ....................................................................................................................5
1. INTRODUCTION .......................................................................................................6
2. EXPERIMENTAL……………………………………………..………...………...13
2.1 Materials ..........................................................................................................13
2.2 Polymerization ……………………………………………...……..…….......13
2.3 Instrumental Techniques……………………………………………...……...14
2.4 Water Reduction Method………………………………………………….…15
3. RESULTS AND DISCUSSION......................................................................….....16
3.1 Polymerization of MMA and MAA…………………………..….…………..16
3.2 Formation of CUP Particles……………….………...…….……….…….......18

vii
3.3 Particle Size Analysis……………………….…………………...………......21
3.4 Role of the Solvent………………………………………………………..…24
3.5 Conformation of CUP Particles……………………………….......…............30
3.6 Unimolecular Collapse…………………………………….…...……....……32
4. CONCLUSIONS…………………………………….…...……....………………...40
ACKNOWLEDGEMENTS…………………………………………………….…….41
REFERENCES….….……………………………………………………….….……42
APPENDIX…...………………………………………………………….…………...44
II. USE OF 19F-NMR T2 RELAXATION TO PROBE THE TG AND CORE ENVIRONMENT OF CUP PARTICLES IN AQUEOUS MEDIA ………….…….50
ABSTRACT ..................................................................................................................51
Introduction ...................................................................................................................51
Results and Discussion………...…...………………………………………….….......58
Polymerization .......................................................................................................58
Water Reduction to Form CUP...…………………………………..………….…59
19F NMR Relaxation Experiments…………………………………………….…62
Conclusions…………………………………………………………………………...65
Experimental Section…………...…………………………………………………….66
Materials…………………………………………………………………………66
Polymerization…………………………………………………………………..67
Water Reduction Method………………………………………………………..68
Instrumental Technique…………………..……………………………………...68
19 F NMR of Poly(methyl methacrylate-ran-buyl acrylate-ran-acrylic
acid -ran-trifluoroethyl methacrylate…….…..….………..….……….....68

viii
1H NMR of Poly (methyl methacrylate-ran-butyl acrylate-ran-acrylic
acid ran-trifluoroethyl methacrylate)……………...……………………..69
13C NMR Poly (methyl methacrylate-ran-butyl acrylate- ran- acrylic
acid- ran-trifluoroethylmethacrylate)……………..…………....………...69
Gel Permeation Chromatography………….…..………….…………...……..…70
Particle Size Analysis……….………………....……………………...………...70
Glass Transition Temperature………………………………....……………..…71
Acknowledgements……….………...……………………………………………..….72
References…...……….…………………………………………………………….…72
APPENDIX……………………………….…………………………………………..74
SECTION
2. COUNTER ION AFFECT OF GROUP 1 HYDROXIDE5………………………80
2.1 INTRODUCTION………………………………………….…………….….80
2.2 EXPERIMENTAL…………………………………………..…………….…82
2.2.1 Materials……………………..………………………..……………82
2.2.2 Polymerization……………...….…..................................................82
2.2.3 Gel PermeationChromatography…..................................................82
2.2.4 Acid Number………………………………………….………...…83
2.2.5 Water Reduction…...………………………………………….…..83
2.3. RESULTS AND DISCUSSION……………………………......................83
2.3.1 Water Reduction………………………………..…………………83
2.3.2 Particle Size Measurements……………………….………….…...83
2.3.3 Conclusions…….……………………………………….……….. 86
ix
3. CONCLUSIONS………………………………………………………….………88
REFERENCES………..………..………………………………………….……...…91
VITA………………………..…………………………………….………………….92
x
LIST OF ILLUSTRATIONS
Figure Page
PAPER I
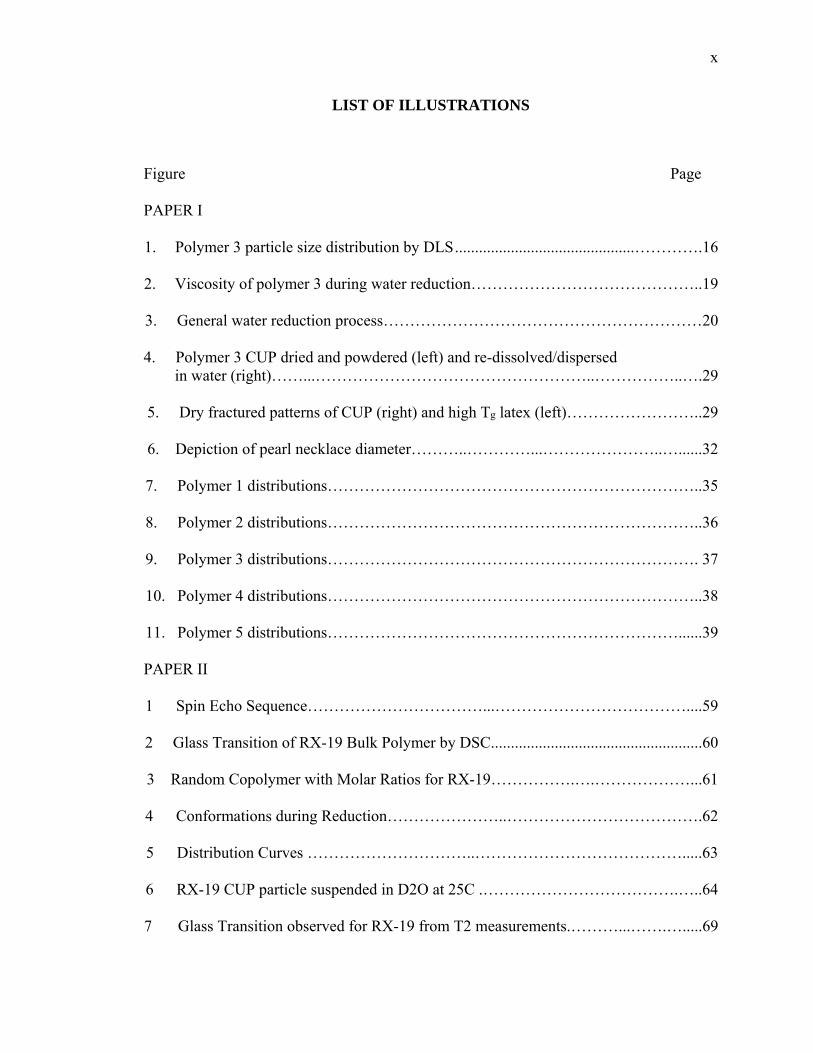
1. Polymer 3 particle size distribution by DLS .............................................………….16
2. Viscosity of polymer 3 during water reduction……………………………………..19
3. General water reduction process……………………………………………………20
4. Polymer 3 CUP dried and powdered (left) and re-dissolved/dispersed in water (right)……...……………………………………………..……………..….29
5. Dry fractured patterns of CUP (right) and high Tg latex (left)……………………..29
6. Depiction of pearl necklace diameter………..…………...…………………..…......32
7. Polymer 1 distributions……………………………………………………………..35
8. Polymer 2 distributions……………………………………………………………..36
9. Polymer 3 distributions……………………………………………………………. 37
10. Polymer 4 distributions……………………………………………………………..38
11. Polymer 5 distributions…………………………………………………………......39
PAPER II
1 Spin Echo Sequence……………………………...………………………………....59
2 Glass Transition of RX-19 Bulk Polymer by DSC.....................................................60
3 Random Copolymer with Molar Ratios for RX-19…………….….………………...61
4 Conformations during Reduction…………………..……………………………….62
5 Distribution Curves …………………………..………………………………….....63
6 RX-19 CUP particle suspended in D2O at 25C .……………………………….…..64
7 Glass Transition observed for RX-19 from T2 measurements.………...…….….....69

xi
8 The chemical structure of polymer PIBMA ………………………….…………….72
SECTION
1. Calcium present at 20ppm……………………….……………………………...….81
2. Particle Size Reduced With LiOH ………………………………………..…..…....84
3. Particle Size Reduced With NaOH...………………….…………………..…….….85
4. Particle Size Reduced With KOH ………………………………….…….…...……86
5. Re-dissolved CUP with Li…………….……………………………..….…….....…87
6. Re-dissolved CUP with Na…….. …………………………………….……...…….87
7. Re-dissolved CUP with K.…….. ……………………………...……..…………….88
8. Particle Size Re-dissolved LiOH. ……………………………...……..……......…..89
9. Particle Size Re-dissolved NaOH……………………………...…….….…….……90
10. Particle Size Re-dissolved KOH…………………..………….………..…….…..…91

xii
LIST OF TABLES
Table Page
PAPER I
1. Thiol Ratio, Percent Yield, and Acid Number ............................................................15
2. Molecular Weight, Polydispersity and Mark-Houwink Data ....................................15
3. Hansen Parameters ......................................................................................................27
4. Volume Fraction Hansen Parameters for Solvent Blend ............................................27
5. Concentration Requirements .......................................................................................34
PAPER II
1 Yield and Acid Number ..............................................................................................67
2 Molecular weight, polydispersity and Mark Houwink data .......................................70
xiii
NOMENCLATURE
Symbol Description
CUP(s) colloidal unimolecular polymer(s)
VOC volatile organic compound(s)
THF tetrahydrofuran
SLS static light scattering
DLS dynamic light scattering
AA acrylic acid
MAA methacrylic acid
BA butyl acrylate
BMA butyl methacrylate
TFEMA trifluoroethyl methacrylate
DMAEMA (dimethylamino)ethyl methacrylate
KHP potassium hydrogen phthalate
AIBN 2,2′-azobis(2-methylpropionitrile)
MEK methyl ethyl ketone
19FNMR 19 fluorine nuclear magnetic resonance spectroscopy
NaOH sodium hydroxide
KOH potassium hydroxide
LiOH lithium hydroxide
TMS tetramethylsilane
1H/13CNMR Proton/Carbon-13 Nuclear Magnetic Resonance Spectroscopy
GPC gel permeation chromatography

xiv
Tg glass transition temperature
T1 longitudinal relaxation
T2 transverse relaxtion
CPMG Carr-Purcell-Meiboom-Gill sequence
Mn number average molecular weight
ASTM American Standards for Testing of Materials
nm nanometer(s)
Rg radius of gyration
SCNP(s) single chain nano particle(s)
SEC size exclusion chromatography
TDA triple detector array
AN acid number
CP-TOSS cross polarization pulse sequence for total spin sideband suppression

INTRODUCTION
Water reducible resin technology has been used in the coatings industry since the
1950’s. This technology is based on the nature of polymer chains to prefer to be
entangled with each other than exist in a poor solvent condition. This idea has led to the
discovery of a water reduction process which would result in single polymer chains
collapsed into spheroidal particles on a nanoscale level. These were given the name
Colloidal Unimolecular Polymer (CUP) particles. The CUPs are suspended in a VOC
free aqueous media unlike the water reduced resins in coatings which contain water
miscible co-solvents. The ability of the CUPs to exist in water without VOC’s makes
them a potentially beneficial resin technology.
The first part of this dissertation focused on the water reduction process. What
factors influenced the reduction process, and what type of polymer design was necessary.
Five polymers were synthesized with varying molecular weights. These were dissolved
in THF, neutralized by ammonium hydroxide and water was added until a critical point
was reached, and the polymer chains collapsed into CUP particles. Polymers were
synthesized with varying molecular weights which were determined by SLS. The
distribution curves from the SLS data were then used along with the density of the bulk
polymer, and the equation of a sphere formula to determine the diameters that the
particles would be. The polymers were then water reduced and particle size
measurements were taken by DLS. The data from both SLS and the DLS were plotted
together and showed a match to each other indicating that the particles collapse into

2
spheroid particles and that the diameters are able to be controlled by varying the
molecular weight of the polymers.
The second part of this dissertation focused on determining if the CUP particles
behaved similar to the bulk dry polymer. In order to accurately predict the particle size,
calculations are made that use the density of the bulk polymer along with the equation of
a sphere to give a particle diameter, therefore the density of the CUPs would have to be
the same as that of the bulk.
The polymer used in the second publication was synthesized with the addition of
trifluoroethyl methacrylate, a fluorine containing monomer for the purpose of 19FNMR
experiments. The polymer was water reduced, and it was hypothesized that the fluorine
atoms would reside in the interior of the CUP particle after collapse due to the
hydrophobic nature of the fluorine.
The Tg of the polymer was measured by DSC. This temperature was then used a
guideline to measure T2 relaxation through the glass transition. It was theorized that if
the density of the CUP was the same as the bulk, a noticeable change in the T2 relaxation
time would be observed as the solution was heated up near the Tg . This increase in the
relaxation time would be the result of the polymer chains increase in motion. The results
of the 19FNMR experiment were compared to an experiment made on the same polymer
but in the dry bulk form. Both experiments showed an onset of a Tg occurring before the
Tg measured by the DSC. The results were very close to each other, even though one
experiment was using the dry bulk polymer, and the other used the CUPs suspended in
aqueous media.

3
All polymers in this this dissertation were synthesized by free radical
polymerization resulting in random copolymerization of acrylate and methacrylate
monomers, some with acrylic acid and others with methacrylic acid. The ratio of non-
ionizable monomers to acid monomers ranged from approximately 8:1 to 9:1 and
followed the design of surfactant molecules found in the coatings industry having 16-22
carbon atoms making up the hydrophobic portion of the chain.
Other ratios of monomers above and below that chosen were investigated and
found to water-reduce into CUP particles without difficulties; however, larger ratios of
MMA, and larger numbers of acid monomers did not reduce well. The hydrophobicity of
the monomers used determined the number of acid groups needed. For more
hydrophobic monomers, such as n-butyl methacrylate or n-butyl acrylate, a ratio of 5:1 or
6:1 reduced well.
The final part of this dissertation was the investigation of using Group 1 metal
hydroxides as the neutralizing agent. The use of ammonium hydroxide to neutralize the
acid groups of the polymers led to successful CUP solutions. The drawback to
ammonium hydroxide is that ammonia is released and if the CUPs are allowed to dry,
then re-dissolve, the pH is non alkaline. A polymer was synthesized using MMA and
MAA in a 9:1 ratio and three Group 1 hydroxides were used as the neutralizing agent.
All were water reduced and the particle size was measured. They were then re-dissolved
and measured again. These experiments are given in the Appendix.

4
PAPER
I. SELF ASSEMBLY OF WATER INSOLUBLE POLYMERS INTO
COLLOIDAL UNIMOLECULAR POLYMER (CUP) PARTICLES OF 3-9
NANOMETERS
Cynthia J. Riddles, Wei Zhao, Hua-Jung Hu, Minghang Chen and Michael R. Van
De Mark*
Missouri S&T Coatings Institute & Department of Chemistry,
Missouri University of Science & Technology, Rolla, MO-65409, USA.
(Published as an Article in the journal Polymer, 2014)
A. GRAPHICAL ToC

5
ABSTRACT
Colloidal Unimolecular Polymer, CUP, particles were synthesized and characterized
as a potential new and useful spheroidal polymer conformation for a variety of
applications. Also known as single chain nano particles, these nano materials are gaining
in popularity. The route to CUP particle formation is an innovative approach utilizing a
small number of hydrophilic groups along a hydrophobic polymer backbone which
transitions from a random coil conformation in organic solvent to a hard sphere in water
through a slow gradient with subsequent solvent removal. The CUP particles have
diameters which are proportional to their molecular weights and range typically from 3
nm to over 9 nm. These CUP particles were stable in water and free of solvent or
surfactants. The sodium or potassium salts of CUP particles are spheroidal and are able
to be dried then re-dissolved in water with no aggregation, unlike the original polymer.
The diameters of the CUP particles correlate with the absolute number average molecular
weight (Mn) and distributions from the GPC. Molecular weights from 28K to 122K are
reported here and are based on an acrylic copolymer having a molar ratio of 9:1
MMA:MAA.
Key Words: CUP, Colloid, Unimolecular, Polymer, Particle, Single Chain Nano Particle,
Anionic

6
1. INTRODUCTION
The formation of Colloidal Unimolecular Polymers (CUPs) particles[1, 2] based
upon the collapse of a single polymer chain from a good, low boiling, organic solvent
through the action of a poor solvent such as water, should be possible based upon the
simple Flory-Huggins theory. When the organic solvent is removed and the poor solvent
remaining is water the resultant particle should be stable if it contains a sufficient number
of stabilizing groups such as ionic or hydrophilic groups, analogous to that of a micelle.
These CUP particles should follow a size distribution tracking that of the molecular
weight distribution of the polymer.
The conformational behavior of polymer chains upon exposure to changes in the
regional environment has been the focus of many studies. For uncharged polymer chains,
Flory described the conformation of polymers in terms of a theta condition, either a theta
solvent, or a theta temperature.[3] At the theta condition, he proposed that the polymer
behaved as an ideal chain, and polymer/polymer interactions were balanced with
polymer/solvent interactions, and the radius of gyration Rg was equal to the random walk
configuration. A shift in either direction would cause the radius Rg to deviate from
ideality due to either swelling in good solvent (greater than theta), or collapsing in poor
solvent (less than theta). More complex conformational changes have been observed for
charged polymers (polyelectrolytes) in solution.[4-7]
Several researchers have observed conformational changes in anionic or cationic
homopolymers to show that a coil to globule transition occurred when there was a change
in solvent dielectric.[4] A coil to an expanded chain conformation was observed by de
Melo due to a change in pH.[5] Kirwan observed transitions from an extended chain, to a

7
pearl necklace conformation and then to a globule conformation, also by a change in the
pH.[6] Kulkarni studied conformational changes that occurred in proteins when the pH
was changed.[7] The functional shape a protein takes on by folding has been shown to be
dependent on the sequence of the amino acids, and when the pH was shifted, a
denaturing, or unfolding of the protein occurred.
The conformational behavior of polyelectrolytes has also led to the synthesis of
polymers that had the ability to form single chain nano particles. These particles can
mimic micelles and collapse inwardly due to a change in the regional environment, [8,9]
or collapse by intramolecular self-crosslinking.[10-15] Li[8] investigated the use of
multi-chain polymeric micelles as potential drug delivery systems. The hydrophobic
blocks consisted of the anti-cancer drug paclitaxel, grafted onto blocks of polyether ester.
These polymers were placed in an aqueous environment and upon adjusting the pH, the
hydrophilic polyether ester portions of the chains oriented into the water phase, and left
the hydrophobic paclitaxel oriented to the interior domain. These macromolecular
polymeric micelles had an average diameter of 50 to 120 nanometers. The paclitaxel was
able to be released into the cell through hydrolysis of the ester bonds that linked the drug
to the hydrophilic exterior.
The micelle behavior of a single polyelectrolyte chain was observed by
Morishima[9] when the chain collapsed, or ‘self-assembled’ in a poor solvent. Random
copolymers were synthesized which consisted of roughly a 50/50 monomer ratio of
hydrophilic monomer and hydrophobic monomer. At very low polymer/solvent
concentration, the chains collapsed into unimolecular micelles of a diameter of
approximately 5.5 nm. Both Li and Morishima[8,9] observed micelle-like behavior due

8
to polymer-solvent interactions, however, collapse of a single polymer chain can be made
through intramolecular self crosslinking of the polymer chain. These single chain nano
particles, or SCNP’s had the ability to be tailored to specific sizes and shapes depending
on the polymer chain functionality.
One focus of these nano particles has been on the synthesis of polymer chains
containing reactive pendant groups which will self crosslink along the polymer chain
leaving collapsed polymer particles.[10-15] Polymeric nano particles synthesized by Zhu
et al[10], began with the living radical polymerization of methyl methacrylate with
varying amounts of TMS protected enediyne containing methacrylate. Trimethylsilyl
(TMS) was used as a protecting group during the polymerization to prevent unwanted
Bergaman cyclization during the purification process. After purification, the polymer was
then de-protected and treated in ultra dilute hot ether to induce Bergman cyclization. The
resulting polymer particles were believed to be particles due to the significant drop of
apparent molecular weights by GPC, and when analyzed by DSC, no measureable Tg
was found which is indicative of a tight collapsed particle instead of a linear polymer
chain.
Another example of nano particle synthesis was shown by Mercerreyes’ et
al.[11]who used linear copolymers which contained pendant acryloyl or methacryloyl
groups as reactive precursors. Aliphatic polyester were obtained through ring opening
(ROP) copolymerization of 4-acryloyloxy caprolactone with either ԑ-caprolactone or
L,L- lactide rings, and also polystyrene copolymers derived by modification of
poly(styrene-co-hydroxyethyl methacrylate) copolymers. These reactive precursors were
radically polymerized in ultra-dilute conditions to give single chain nano particles

9
ranging in diameter of 3.8 to 13.1 nanometers. If polymerized in concentrate conditions,
a 3-dimensional polymer network rather than particles was formed. The authors used
Size Exclusion Chromatography (SEC) to show that the hydrodynamic volumes of the
particles were significantly smaller than those of the linear polymer precursors, and DLS
to measure the particle diameter.
The research of Altintas[12] et al took advantage of Diels Alder reactions by
incorporating dienes precursors and dienophiles along the polymer backbone. The chains
were then subjected to a UV-A fluorescent lamp at 320 nanometers causing
intramolecular Diels Alder reactions to occur. These SCNP’s were successfully created
at concentrations of 0.017 mg/mL and the diameters were dependent on the molecular
weight of the polymer precursors. The authors measured a change in the hydrodynamic
diameter from the DLS instrument and also used AFM (atomic force microscopy) to
show the polymer chains before and after crosslinking.
Hosonos[13] synthesized ABA triblock copolymers that when treated by heat the
B block moieties folded into secondary structures. In a second step, the polymer was
subjected to UV causing the A block moieties to orthogonally dimerize leaving a 3D
structure. These structures can be tuned to resemble DNA structures to better aid in
research. As with other SCNP synthesis, these particles were able to be achieved in
dilute conditions at approximately 0.5 mg/mL.
Another example of SCNP synthetic methods is shown in the work by Murray
and Fulton.[14] In this research the authors synthesized functional groups along the
polymer chain, and then used a crosslinking agent to link the polymer chains
intramolecularly. The authors then went another step and modified the chains with
10
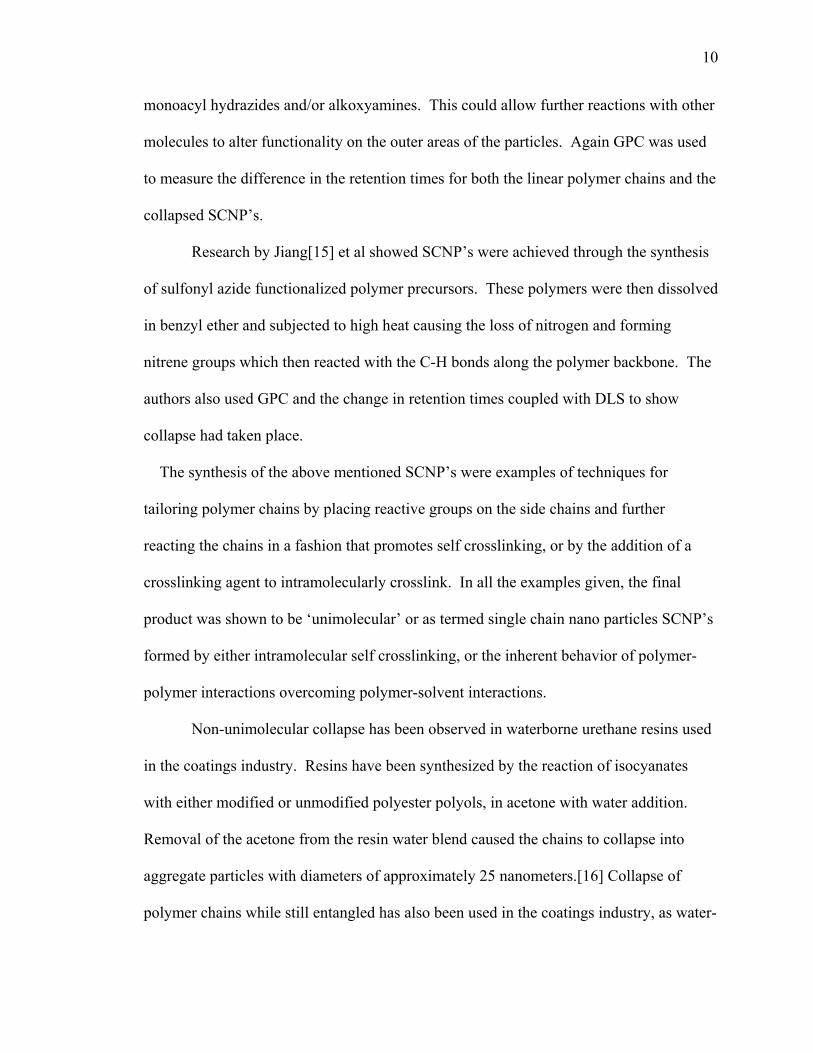
monoacyl hydrazides and/or alkoxyamines. This could allow further reactions with other
molecules to alter functionality on the outer areas of the particles. Again GPC was used
to measure the difference in the retention times for both the linear polymer chains and the
collapsed SCNP’s.
Research by Jiang[15] et al showed SCNP’s were achieved through the synthesis
of sulfonyl azide functionalized polymer precursors. These polymers were then dissolved
in benzyl ether and subjected to high heat causing the loss of nitrogen and forming
nitrene groups which then reacted with the C-H bonds along the polymer backbone. The
authors also used GPC and the change in retention times coupled with DLS to show
collapse had taken place.
The synthesis of the above mentioned SCNP’s were examples of techniques for
tailoring polymer chains by placing reactive groups on the side chains and further
reacting the chains in a fashion that promotes self crosslinking, or by the addition of a
crosslinking agent to intramolecularly crosslink. In all the examples given, the final
product was shown to be ‘unimolecular’ or as termed single chain nano particles SCNP’s
formed by either intramolecular self crosslinking, or the inherent behavior of polymer-
polymer interactions overcoming polymer-solvent interactions.
Non-unimolecular collapse has been observed in waterborne urethane resins used
in the coatings industry. Resins have been synthesized by the reaction of isocyanates
with either modified or unmodified polyester polyols, in acetone with water addition.
Removal of the acetone from the resin water blend caused the chains to collapse into
aggregate particles with diameters of approximately 25 nanometers.[16] Collapse of
polymer chains while still entangled has also been used in the coatings industry, as water-

11
reducible resins.[17] Water-reducible resins were dissolved in high boiling water
miscible solvents, the resins contained ionizable carboxylic acid groups that were
neutralized with amines. Water was then added to the coating, until the solvent blend
became a less-than theta solvent condition, which caused the chains to collapse.
Our CUP particles although similar in concept to Morishima[9] are also unique
due to the process of dissolving the polymer first in a water miscible organic solvent,
adding water, then evaporation of the organic solvent from our solutions, leaving the
CUP particles suspended in aqueous media, thereby achieving a VOC (volatile organic
compound) free solution. This is especially important due to the fact that in and of
themselves, the particles are not water soluble, however after the water reduction process
are suspended in water and are stable long term.
At this time, GPC has been used in our research only to obtain absolute Mn
molecular weights of the starting polymer chains. Most research of SCNP’s showed that
the collapse of these particles takes place in the solvent that the polymer is dissolved in.
This allows the authors to use a change in retention times in GPC to show a decrease in
the size, as shown by an increase in retention times. This coupled with DLS
measurement of the diameters in the solvent allowed proof of the collapse of the polymer
chains to SCNP’s. Our CUP particles are first dissolved in a water miscible solvent and
are random coils. After the acid groups are neutralized, water is added and the polymer
chains collapse. The solvent is then stripped off leaving particles suspended in water. At
this point they are spheroidal in shape. Two separate light scattering techniques, GPC
SLS and DLS, show that the collapse of the polymer chains has taken place.

12
Static light scattering (SLS) was used for absolute molecular weight, and dynamic
light scattering (DLS) was used to measure the diameter of the CUP particles. The SLS
data was used to calculate the theoretical diameter each polymer chain should collapse to,
and this was compared to the experimental particle size data from the DLS instrument.
The term Colloidal Unimolecular Polymer has been introduced to describe these solid
spherical single chain particles suspended in the continuous VOC free aqueous phase.
The design of polymers capable of unimolecular collapse into spheroid-like
particles was complex and many factors were considered. The most basic requirement
was the balance between the hydrophobic and hydrophilic groups on the polymer chain.
An over-abundance of hydrophilicity caused the polymers to remain water soluble,
whereas a lack of sufficient amount of hydrophilicity caused the polymers to be so
hydrophobic that precipitation occurred in the presence of any amount of water. Both
extremes prevented unimolecular collapse. The hydrophobicity of the monomer,
flexibility and the location of both hydrophobic and hydrophilic groups on the monomer
had to be considered. Another requirement for successful CUP formation was that the
polymer chain had to have enough flexibility to accommodate the changing
conformation, while allowing association of like groups along the chain to take place.
The use of charged groups enhances the hydrophilic nature while offering the added
benefit of ionic forces.

13
2. EXPERIMENTAL
2.1 Materials
Methyl methacrylate (MMA), methacrylic acid (MAA), 2,2′-azobis(2-
methylpropionitrile) (AIBN), and 1-dodecanethiol were purchased from Aldrich. MMA
was purified by washing with a 10% (w/w) solution of sodium bicarbonate, followed by
rinsing with de-ionized water, and brine. The product was dried over sodium sulfate and
filtered. Copper (I) bromide was added to the MMA as an inhibitor, and simple
distillation under nitrogen was carried out. MAA was purified by distillation with copper
(I) bromide under reduced pressure. AIBN was re-crystallized from methanol, and 1-
dodecanethiol was used as received.
2.2 Polymerization
All polymers were synthesized by the same method of free radical polymerization
in methyl ethyl ketone (MEK) and are listed in Table 1, differing only in the molar ratio
of dodecanethiol to monomers, to produce a range of molecular weights. To a 2000 ml
three-neck flask was added 750 grams of MEK and a magnetic stirring bar. The
monomers were then added; 225.25 g (2.25 mole) of MMA, and 21.50 g (0.25 mole) of
MAA, giving a molar ratio of 9:1 MMA/MAA. Dodecanethiol in the amount of 2.15 g
(10.62mmole) was added a 1:235 ratio, and finally AIBN 0.30 g (1.83mmole). The flask
was fitted with a nitrogen line, condenser, and a gas outlet adapter connected to an oil
bubbler to allow a positive flow of nitrogen throughout the polymerization. The flask
was heated slowly to reflux and allowed to react for 24 hours. The polymer solution was

14
then cooled to room temperature, and precipitated in cold deionized water under high
shear, then dried under reduced pressure.
2.3 Instrumental Techniques
The 1HNMR was carried out using a Varian 400 MHz FT/NMR spectrometer
using 5 mm o.d. tube. Sample concentrations were approximately 20% (w/v) in CDCl3.
All spectra were consistent with proposed polymer structure of PMMA/MAA. Absolute
number average molecular weights (Mn) were measured by gel permeation
chromatography (GPC) on a Viscotek GPCmax from Malvern instruments coupled with a
triple detector array TDA305 (static light scattering, differential refractometer and
intrinsic viscosity). Particle sizes were measured by dynamic light scattering on a
Nanotrac 250 particle size analyzer from Microtrac with a laser diode of 780 nm
wavelength, and 180° measuring angle. Acid numbers (AN) for all polymers were
measured by titration method ASTM D 974 and are shown in Table 1; the method was
modified by using potassium hydrogen phthalate (KHP) in place of hydrochloric acid,
tetrahydrofuran (THF) to dissolve the samples and phenolphthalein in place of methyl
orange. Viscosity measurements were done by Ubbelohde viscometer method ASTM D
446-07. Additional viscosity measurements, when needed, were made with an LV DVIII
rheometer with spindle CP-40 from Brookfield Engineering.

15
Table 1. Thiol Ratio, Percent Yield, and Acid Number Percent Theoretical /Measured AN
Polymer Thiol Ratio Yield mg KOH/g polymer
1 1:235 82.3 56.8/59.1
2 1:500 86.9 56.8/57.7
3 1:600 88.1 56.8/58.0
4 1:763 84.2 56.8/59.7
5 1:878 81.0 56.8/59.7
Table 2. Molecular Weight, Polydispersity and Mark-Houwink Data
Polymer Mn (kg/mol) Polydispersity Mark Houwink Data
LogK a
1 28 1.24 -4.42 0.76 2 36 1.24 -4.12 0.67 3 58 1.28 -4.42 0.76 4 106 1.59 -4.64 0.71 5 122 1.47 -5.04 0.76
2.4 Water-Reduction Method
Lower molecular weight polymers 1-3 were dissolved in THF (20% w/w) and
polymers 4, and 5 were (10% w/w) and stirred overnight. Ammonium hydroxide was
added to neutralize the acid groups, to an approximate pH of 8.5 ± 0.2. De-ionized water
at pH 8, 2.25 times the weight of THF used, was added by a peristaltic pump in the rate
of 1.24g/minute. After the water was added, the THF was stripped off in-vacuo. The
clear solutions were then filtered with a 0.45 micron filter to remove any extraneous trace
contaminants, and particle sizes were measured. The typical loss on filtering was less

16
than 0.05% of the solids. Fig. 1 illustrates a typical distribution graph from the DLS
instrument.
Fig. 1. Polymer 3 particle size distribution by DLS
3. RESULTS AND DISCUSSION
3.1 Polymerization of MMA and MAA
Reactivity ratios of both MMA and MAA have been reported in the literature in
acetone[18]. These values were: r1 = rMMA = 0.32 and r2 = rMA = 0.63, which gave r1 r2 =
0.20, and showed relatively random copolymerization occurred. Drastic deviations from
the reactivity ratios being in MEK rather than acetone were not expected and random
copolymerization of MMA and MAA in MEK were predicted.

17
The synthetic approach of the polymers in this research more closely resemble the
behavior of micelles, the 9:1 molar ratio of MMA/MAA was based on typical surfactants
having approximately 16-22 carbon atoms comprising the hydrophobic portion of the
chain to one hydrophilic group.[19] Other ratios of monomers above and below that
chosen were investigated and found to water-reduce into CUP particles without
difficulties; however, larger MMA values, above 12 produced more coagulum. If the
MAA fraction increases, the polymer may produce other conformations or become water
soluble when reduced. The hydrophobicity of the monomers used determined the
number of acid groups needed. For more hydrophobic monomers, such as n-butyl
methacrylate or n-butyl acrylate, a ratio of 5:1 or 6:1 reduced well. Due to the random
nature of the polymerization mechanism, it was not possible to place one MAA monomer
at every 10th position. The combination of controlling the monomer ratio and the random
placement of the acid groups was sufficient to produce the CUP particles.
The synthetic routes to produce SCNP’s involve the synthesis of the polymeric
precursors and many require controlled radical polymerization techniques such as ring
opening polymerization (ROP)[10], reversible addition-fragmentation chain transfer
(RAFT)[11], nitroxide-mediated radical polymerization (NMP)[12], atom transfer radical
polymerization (ATRP)[13]. This first step of the synthesis then typically requires a
second step to further react the pendant reactive moieties in a manner that promotes self
crosslinking. The polymer only required radical polymerization techniques.
18
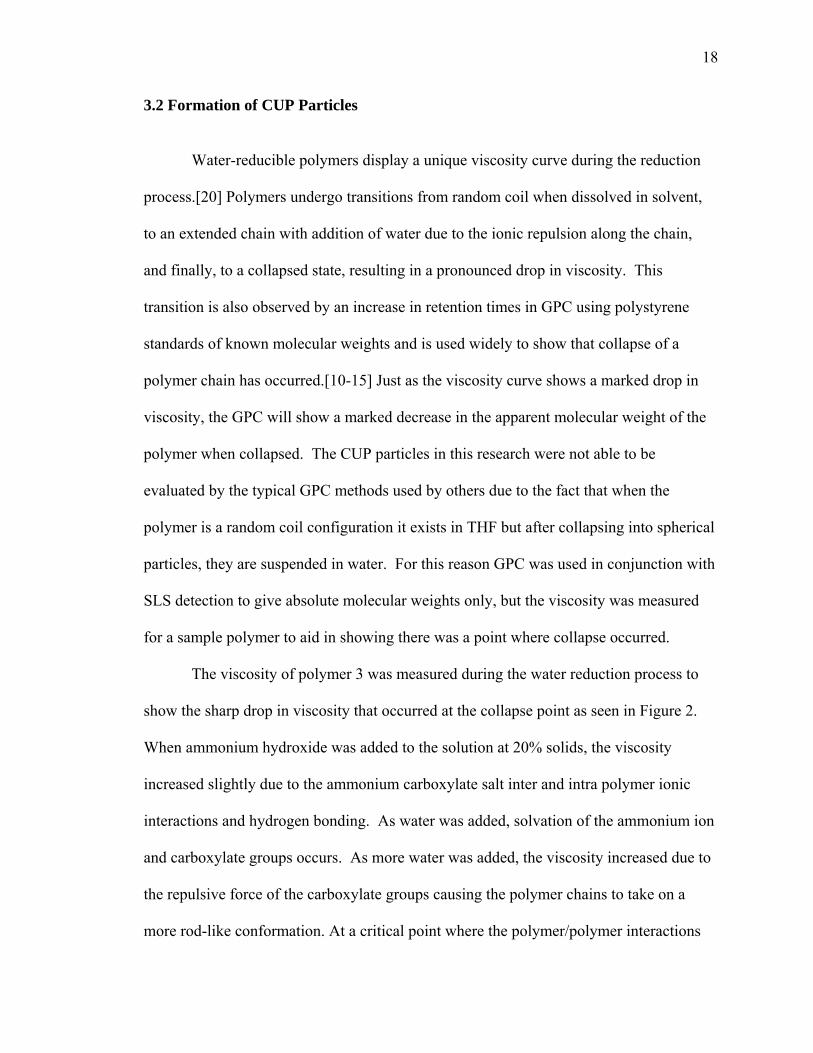
3.2 Formation of CUP Particles
Water-reducible polymers display a unique viscosity curve during the reduction
process.[20] Polymers undergo transitions from random coil when dissolved in solvent,
to an extended chain with addition of water due to the ionic repulsion along the chain,
and finally, to a collapsed state, resulting in a pronounced drop in viscosity. This
transition is also observed by an increase in retention times in GPC using polystyrene
standards of known molecular weights and is used widely to show that collapse of a
polymer chain has occurred.[10-15] Just as the viscosity curve shows a marked drop in
viscosity, the GPC will show a marked decrease in the apparent molecular weight of the
polymer when collapsed. The CUP particles in this research were not able to be
evaluated by the typical GPC methods used by others due to the fact that when the
polymer is a random coil configuration it exists in THF but after collapsing into spherical
particles, they are suspended in water. For this reason GPC was used in conjunction with
SLS detection to give absolute molecular weights only, but the viscosity was measured
for a sample polymer to aid in showing there was a point where collapse occurred.
The viscosity of polymer 3 was measured during the water reduction process to
show the sharp drop in viscosity that occurred at the collapse point as seen in Figure 2.
When ammonium hydroxide was added to the solution at 20% solids, the viscosity
increased slightly due to the ammonium carboxylate salt inter and intra polymer ionic
interactions and hydrogen bonding. As water was added, solvation of the ammonium ion
and carboxylate groups occurs. As more water was added, the viscosity increased due to
the repulsive force of the carboxylate groups causing the polymer chains to take on a
more rod-like conformation. At a critical point where the polymer/polymer interactions

19
overcame the polymer/solvent interactions, the polymer collapsed into spheroid particles
as was evidenced by the dramatic drop in viscosity.
Fig. 2. Viscosity of polymer 3 during water reduction
Pictorially, this dramatic drop in viscosity is shown in Figure 3, with III going to IV. The
hollow spheres represent the hydrophobic polymer backbone and the solid spheres
represent the ionizable carboxylic acid groups I. When base, in this case, ammonium
hydroxide was added to the solution, the acid groups form salts II, likely as intimate ion
pairs. As water was added the ammonium carboxylate salt ions become solvated and
separate III. These carboxylate groups then repelled each other due to the increasing
dielectric caused by the added water and the chain extended toward linearity which
increased the viscosity. At a critical point, collapse of the polymer occurs with the

20
carboxylate groups oriented into the water phase, organizing to produce maximum
separation of charge and the hydrophobic polymer chain collapsed into a spheroidal CUP
particle IV. The removal of the THF yields the final CUP particles free of solvent, V.
Fig. 3. General water reduction process. I. Random coil configuration in THF. II Random coil intimate ion pair. III. Extended coil solvent separated ion pair. IV. Collapsed coil. V. Hard sphere.
The water reduction process was analogous to that of micelle formation. As water
was added to the polymer/THF solution, the solvent organized around the hydrophobic
backbone of the MMA units, similar to that of surfactant molecules prior to formation of
the micelle. The collapse of the chains into CUP particles was in part driven by the
release of the organized water to the bulk increasing the entropy. The same occurs during
micelle formation, which at first glance seems to be disfavored due to the loss of entropy
caused by multiple surfactant molecules organizing into a single micelle. The entropy

21
loss is due to molecular organization from the surfactant molecules, but overshadowed by
the gain in entropy when the organized water surrounding the surfactant molecules is
released to the bulk.[21,22] The CUP particles approximate a sphere like shape due to the
carboxylate group’s repulsive nature to each other. These CUP particles are small
enough that Brownian motion keeps the particles suspended and thus are
thermodynamically stable unlike the larger latex particles, which settle with time.
Samples of the CUP particle suspensions have been retained for over three years with no
change in particle size and no aggregation or settling.
3.3 Particle Size Analysis
An important tool for measuring the diameter of collapsed polymer particles in
solution is dynamic light scattering DLS. This method has been used in conjunction with
the GPC and is widely accepted as evidence of polymers existing in a collapsed particle
state. [10, 12, 14, 15] The DLS instrument first measures the diffusion coefficient of the
particles in the media, and then calculates the particle size by the Stokes-Einstein
equation:
D (1)
Where k is the Boltzmann constant, T is the absolute temperature of the solution, η is
the viscosity of the solvent and r is the radius of the particle. In this research, the particle
size of the CUP’s was measured using the Nanotrac 250 dynamic light scattering
instrument. Unlike most SCNP’s, our CUP particles are charged, and therefore the light
scattering method chosen needed some justification. First, the particle size was about 3-9
nm, very small compared with the working wavelength of the laser signal (780nm),

22
therefore the signal of scattered light from the surface of particles was relatively low. In
order to increase the signal of the scattered light, the volume fraction needed to be
increased to around 10% instead of infinite dilution. Since the particle was very small,
there will be no issue of multiple scattering. However, high concentration can cause
another issue: the charged particles will have strong electronic repulsion that makes
equation 1 no longer valid. One of the frequently used methods has been to correct
equation 1 with reduced osmotic pressure )T. Since measuring the osmotic pressure of
colloid dispersion is very time-consuming, it is not a convenient method. Therefore,
another method was employed.
The relationship between the viscosity and the diffusion coefficient has been
extensively studied from the classical Stokes-Einstein model which is valid for a dilute
system. When higher concentrations are involved, the relationship is more complicated.
A generalized Stokes-Einstein relation (GSE) has been derived by many researches.[23]
At various volume fractionsϕ, the relationship between zero-limiting shear
viscosityη ϕ of the solution and the long-time self-diffusion coefficient D ϕ can be
represented by
(2)
Or
D ϕ (3)
equation 2 or 3 which have agreed well with experiments in solid PMMA[24],
micelles[25], and silica[26]. In the case of charge stabilized silica[27], the approximation
23
was good in the dilute range (volume fraction is less than 0.1). For higher volume
fractions, the hydrodynamic interaction between charged particles is far larger than
Brownian motion from solvent molecules; the GSE is no longer valid. When the
Microtrac Nanotrac 250 was used to measure the particle size of CUPs, according to the
instruction of the manufacture, the viscosity of solvent was entered as an important
parameter to calculate the particle size. This procedure works well for dilute suspension
with big particles. However, the volume fraction of CUP required was approximately
0.08 to obtain a high enough scattered light intensity, far away from infinite dilution.
Therefore the diffusion coefficient measured by the instrument was no longer D0, or the
self-diffusion coefficient, but D ϕ , the collective diffusion coefficient. In other words,
equation 3 instead of equation 1 should be used to calculate the particle size. This
validates the need for the viscosity of solution to be entered in order to calculate particle
size rather than the viscosity of the pure solvent.
Prior to measuring the particle size, the loading index of CUP solution in
Nanotrac 250 was measured to make sure the concentration was high enough to get a
valid light scattering signal intensity. Then the shearing viscosities of the sample solution
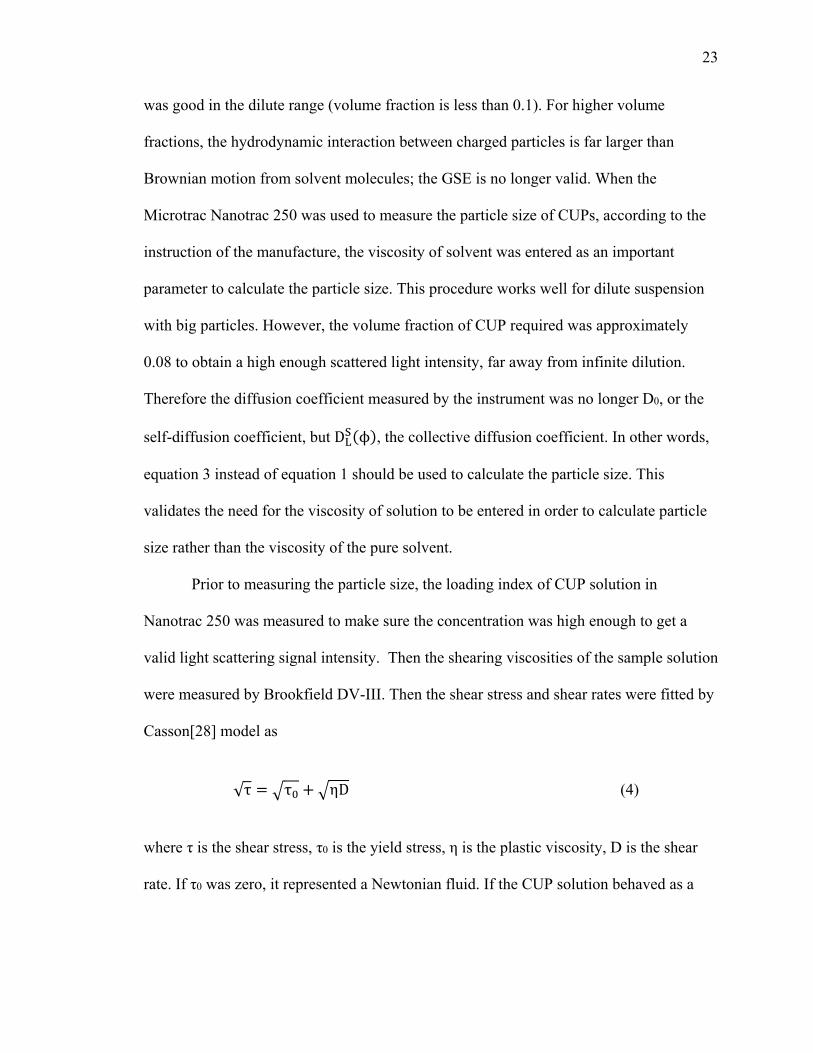
were measured by Brookfield DV-III. Then the shear stress and shear rates were fitted by
Casson[28] model as
√τ τ ηD (4)
where τ is the shear stress, τ0 is the yield stress, η is the plastic viscosity, D is the shear
rate. If τ0 was zero, it represented a Newtonian fluid. If the CUP solution behaved as a

24
Newtonian fluid, then the plastic viscosity was treated as its viscosity at the temperature.
If not, the shear stress and shear rate were fitted with a power law model as
τ kD (5)
where k is consistency index with units of centipoise, and n is the flow index. The more n
deviates from 1, the more shear-thinning, n<1 or shear-thickening, n>1 will the fluid be.
The viscosity used to enter into the DLS software was the value of the consistency index,
which was also the viscosity of the fluid at a shear rate of 1 Hz.
3.4 Role of the Solvent
The purity of the water was a critical variable for the reduction process. The
presence of polyvalent ions such as calcium can result in aggregation of the resin causing
the solution to be opaque due to light scattering. There are two possible reasons for this
observation. The first one is interchain bridging. The polymer chains before collapsing
are extended and bear negative charges. When bivalent cations, i.e. calcium ions, interact
with the carboxylate groups on the chains it can cause multiple chains to aggregate and
fall out of solution. The second possible reason is that the calcium salt of carboxylic acids
do not readily dissociate so that the polymer chain loses its ability to be stabilized and
precipitates from solution. As little as a few parts per million of calcium can cause the
water reduction to produce larger particles.
The experimental protocol for the reduction was very important. The water was
added dropwise by a peristaltic pump through a submerged tube slowly to avoid a large
regional solvent compositional change. If the water was allowed to be added too quickly

25
or dropwise on the surface of the polymer/THF solution, coagulum formed. The stirring
rate was also maintained at a modest rate to avoid large regional solvent compositional
change. Any stoppage in the stirrer will result in the formation of coagulum and usually
a hazy solution. If performed correctly the solution remains clear with no opacity. It
should be noted that these acrylic copolymers and their ammonium salts are all water
insoluble if not in the form of a cup particle.
THF was selected as the dissolution solvent due to its excellent solvency for
acrylics, its miscibility with water, and low boiling point which allow it to be easily
stripped off without loss of significant amounts of water. For polymer 5 the viscosity of
a 10% solution in THF was measured by a Brookfield DVIII rheometer. As the amount
of added water was increased, the viscosity was again measured to determine the critical
collapse point. At a volume ratio of approximately 60% water to 40% THF the polymer
collapsed. The important point regarding this was that only when the ratio reaches or
exceeds this solvent composition that the polymer will collapse. At this point the
polymer chain undergoes a radical transformation from an extended coil to a collapsed
sphere shape and the viscosity will sharply decrease.
One complication, which was found to affect the ability of the chains to collapse
in a unimolecular fashion, was the concentration of the polymer chains at the collapse
point. If the chains were at a high concentration, they collapsed while entangled,
resulting in diameters which were larger than expected. If the concentration was low the
individual polymer chain was able to collapse on itself. This concentration dependence
was also seen in other researcher’s work.

26
Mercerreyes[10] predicted that at certain concentrations above what he termed
Ceq only intermolecular collapses took place, and below that value, intramolecular
collapse occurred and at intermediate concentrations both took place. Successful collapse
in a unimolecular fashion was found to occur at concentrations below 10-5 M and is
approximately 1mg/mL for a polymer having a molecular weight of 100K. Altintas[12]
investigated concentrations of 0.133, 0.067, 0.033 and 0.0117 mg/mL. Of these, 0.017
mg/mL produced unimolecular collapse proven by a clean SEC trace and found no
bimodal distributions. Murray[14] found ~0.1 mM concentrations were optimal, for a
polymer of 100K this would be 10 mg/mL. Jiang[15] found that for their SCNP’s, the
range of 1-10 mg/mL was successful. For our CUP particles, the concentration initially
begins above 100 mg/ml for polymers above 40K and 200 mg/mL for polymers below
40K. The polymers collapsed when the ratio of THF/water reached a 60/40% (w/w)
which would be a concentration of 60 mg/mL and 120 mg/mL respectively at the collapse
point. The solvent was then stripped off leaving the CUP particles in roughly a 100
mg/ml polymer in water solution. The final solution can be concentrated through water
evaporation after reduction to form CUPs without altering the particle size or distribution.
For water-reducible resins typically used in coatings, the collapsed state may be
composed of multiple chains due to the high concentration of polymer chains present at
the collapse point. The water reduction process used in this research was conceptually
similar to this process; however, two important differences should be noted. First, this
research was focused on unimolecular collapse through low concentration at the
reduction point, and secondly, the solvent was stripped off leaving the particles
suspended in water, organic solvent free.

27
At the solvent ratio where Polymer 5 collapsed, the Hansen solubility parameters
were calculated and compared with two solvents, ethanol and methanol, where δt is the
total Hansen solubility parameter, δd , δp , δh are the parameters for the dispersive, polar
and hydrogen bonding contributions, and φ1 and φ2 are the volume fractions for each
solvent.
(6)
(7)
(8)
(9)
Table 3 lists the values for the four solvents taken from Handbook of Solubility
Parameters[29]. Table 4 gives the volume fraction parameters calculated for the solvent
blend at the collapse point.
Table 3. Hansen Parameters[29] Solvent δd δp δh δt
THF 16.8 5.7 8 19.4
Water 15.6 16 42.3 47.8
Methanol 15.1 12.3 22.3 29.6
Ethanol 15.8 8.8 19.4 26.5
Table 4. Volume Fraction Hansen Parameters for Solvent Blend Solvent/Fraction δd δp δh δt THF/0.42 7.1 2.4 3.4 Water/0.58 9.0 9.3 24.5 Blend Total 16.1 11.7 27.9 34.3

28
The solubility parameters for the solvent blend for polymer 5 at the collapse point
were found to be closer to methanol than ethanol, which was consistent with the polymer
being insoluble in methanol, and soluble in ethanol when heated.
It should be noted that in this system, the collapse occurred while adding the
water but if a higher THF concentration were used, the critical point would not have been
reached with this amount of water, the collapse would have occurred while the THF was
being stripped off. Collapse only occurs when the amount of water exceeds the critical
water to THF ratio. The polymer concentration, when collapse occurs, was dependent
upon the amount of THF used and added water to reach the collapse point.
The reduction of polymer 3 with ammonium hydroxide resulted in a clear solution
and when dried was a brittle crumbling material which powdered easily. When placed
back in pH 8.5 water, the powder partially returned to solution with some aggregation.
The small amount of aggregation was likely caused by loss of ammonium from the salt
rendering the area less hydrophilic causing aggregation sites. However, when the same
polymer was reduced with sodium or potassium hydroxide as the base, the dried polymer
was able to completely return to the fully dispersed state with an identical particle size
distribution as before drying. This indicates that the CUP salts are stable when dried and
can be easily re-dispersed. It should be noted that polymers that have a Tg lower than
ambient cannot be reconstituted due to irreversible entanglement when dried. Figure 4
shows the reduced sodium salt of polymer 3 as a dried powder, and the reconstituted
dispersion of CUPs.
29
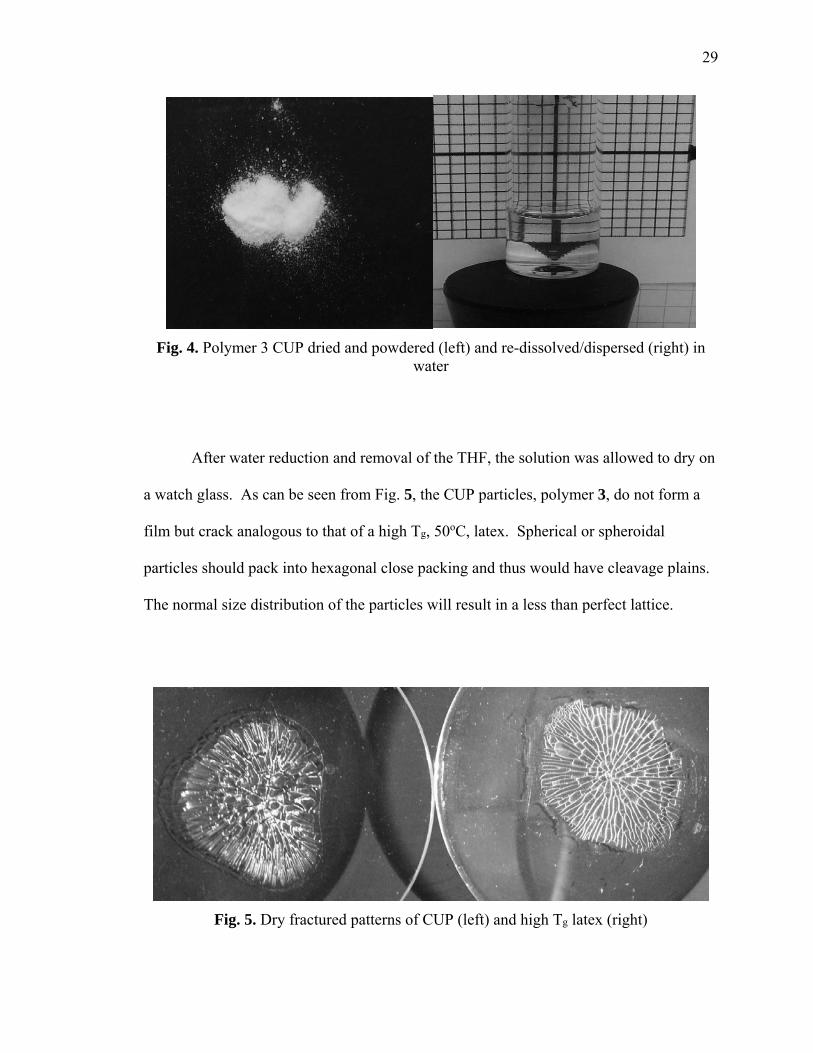
Fig. 4. Polymer 3 CUP dried and powdered (left) and re-dissolved/dispersed (right) in water
After water reduction and removal of the THF, the solution was allowed to dry on
a watch glass. As can be seen from Fig. 5, the CUP particles, polymer 3, do not form a
film but crack analogous to that of a high Tg, 50oC, latex. Spherical or spheroidal
particles should pack into hexagonal close packing and thus would have cleavage plains.
The normal size distribution of the particles will result in a less than perfect lattice.
Fig. 5. Dry fractured patterns of CUP (left) and high Tg latex (right)
30
3.5 Conformation of the CUP Particles
A polymer containing many ionic groups can theoretically form many
conformations depending on the charge density along the chain. A widely accepted
theoretical model was based on an electrostatic blob and the scaling theory first
developed by de Gennes and Pfuety and reviewed by Dobryinin.[30] The scaling theory
assumes a polyelectrolyte in a poor solvent takes on a pearl necklace shape, with the
‘pearls’ being electrostatic blobs. For a neutral polymer in a poor solvent such as water,
the polymer collapses into a spheroid globule. When charges are present, the globule
becomes an elongated electrostatic blob, and then forms the pearl necklace shape,
depending on the fraction of charges in the blob, the dielectric of the solvent, and the
temperature. A theoretical model has been developed in which a polyelectrolyte
undergoes several conformations from an electrostatic blob, to a dumbbell and to a
necklace of three pearls.[31] In this model, a dilute solution of a polyelectrolyte of
uniform charge was considered, having a degree of polymerization N, monomer size b,
and fraction of charged monomers f in a poor solvent having a dielectric of ε. The
following predictions are made for a polyelectrolyte of N=200 monomers at three
different charge densities (f):
f = 0.000 spherical globule,
f = 0.125 dumbbell shape,
f = 0.150 pearl necklace with three beads.

31
When the polymer is uncharged, collapse into a spherical globule will be
observed. When an electrostatic blob contains a fraction of charged monomers equal to
0.125, the electrostatic blob separates into a dumbbell shape, and at a fraction of 0.150 a
necklace of three pearls will exist. The CUP particles presented here were on the lower
edge of the theoretical model. Pearl necklace conformations were not observed, and
could be due to the low charge fraction, the chains were 9:1 MMA: MAA, meaning 10%
of the polymer chain would be ionizable. If the acid groups were neutralized 100% by
the ammonium hydroxide, the resulting charge fraction would be 0.10. The actual formal
charge may be even lower than 0.1 due to charge condensation on the surface of the
particle. Aseyev observed a coil to globule transition rather than a dumbbell or pearl
necklace conformation for a polycation polyelectrolyte and measured the viscosity and
both the hydrodynamic radius and radius of gyration as acetone was added to water.[4]
The authors found that when the mass fraction (γ) of acetone was below 0.80 the
viscosity of the solution displayed typical polyelectrolyte behavior, but when γ > 0.80
collapse of the polycation into a globular state occurred.
The CUPs in this research were not of the pearl necklace conformation and was
evidenced by the measured particle diameters being very close to the calculated
diameters. The pearl necklace conformation would cause an increase in the diameter of
the particles, due to the length of the ‘necklaces’ as depicted in Fig. 6, D1 > D2 .

32
Fig. 6. Depiction of pearl necklace diameter
3.6 Unimolecular Collapse
To determine if the particles were in fact unimolecular upon reduction, it was
necessary to compare the distribution curves obtained by GPC SLS to the distribution of
diameters obtained from the DLS instrument. This was important because our particles
collapse in a blend of water and water miscible solvent system eliminating confirmation
by GPC and the change in the apparent molecular weights as discussed above. We
predicted that each distribution of polymer chains should collapse into a distribution of
particles with diameters that could be calculated based on the molecular weight fractions
of the polymers. It was assumed that the density of the polymer chains were equal to the
bulk density of the polymer ρp, 1.2 g/ml. The volume which 1.0 gram of polymer
occupies, Vgram was calculated below:
Vgram = .
(10)

33
next, the number of particles, P at each weight fraction was determined by using
Avogadro’s number NA, and the number average molecular weight:
∗ / (11)
(12)
This volume was used in the equation of a sphere to get the diameter of each particle at
each molecular weight.
The diameter of the CUP particles was measured by dynamic light scattering,
which measured the Brownian motion of the particles in water by Doppler shifted laser
light. Information pertaining to the refractive index of the particles and the carrier
solvent and the viscosity of the carrier solvent, ηsolv, had to be used when setting up the
measurement. Another important consideration was the concentration of the sample in
solution. Before a measurement could be taken, the loading index had been checked by
the instrument, this determined if there was sufficient scattering intensity. As the particle
size got smaller, for example, from 100 nm to 25 nm, to 6 nm, the concentration of
particles in solution had to be increased due to the scattering intensity decreasing, as
shown in Table 5.
A comparison was made from commercially available resins to the concentration
requirements and was found to be accurate until the particle size fell below 20
nanometers. The CUP particles in this research ranged in diameters of 5-9 nanometers,
and it was found that concentrations of approximately 8-10 % solids by weight were

34
required to obtain an acceptable loading index and as previously discussed the viscosity
of the solution was used instead of that of the solvent.
Table 5. Concentration Requirements[32] Size (nm) Concentration(ppm)
220 0.2
100 2
50 16
25 150
12 1200
6 10,000
The five polymers were analyzed by GPC and by DLS. The GPC fractions at
different molecular weights were converted to particle sizes. These calculated diameters,
which assume the density to be the same as the bulk, as does the DLS, were plotted
alongside the DLS data in Figures 7-11. The particle size determined from the molecular
weight produced both average size and distribution which were in very good agreement
with that of DLS. It should be noted that the resolution of the DLS was less than that of
the GPC.

35
Fig. 7. Polymer 1 distributions

36
Fig. 8. Polymer 2 distributions

37
Fig. 9. Polymer 3 distributions

38
Fig. 10. Polymer 4 distributions

39
Fig. 11. Polymer 5 distributions
The calculated particle sizes from the GPC results were found to be in good
agreement with the diameters measured by DLS. The major difference between the two
diameters occurs at the higher particle sizes, which could be a small amount of
aggregation or instrumental sensitivity to the higher scattering strength of the larger
particles which may over estimate the amount. When the collapse of the polymer chains
occurred, it was possible that more than one chain may be entangled, this would not be
unexpected. It was not practical to expect 100 % of the polymer chains to be at an exact
distance from each other to allow unimolecular collapse; this can be seen by the slight
tailing of the measured diameters at higher sizes.
40
Another factor which influenced the diameter of the measured CUPs was the
presence of THF. If the THF was not completely stripped off, it may migrate into the
interior of the CUP particle, thus swelling the polymer, giving a diameter which is larger
than expected; however, in this research NMR was used to verify complete removal of
the THF, less than 0.01%.
4. CONCLUSIONS
A water-reduction process was designed and tested on five polymers of varying
molecular weight. All polymers were water-reduced by the method outlined in this
research resulting in CUP particles. Correlation between DLS and the absolute Mn
distributions obtained from GPC show that the diameter of the CUP particles can be
tailored by control of the molecular weight of the polymer. Proof of unimolecular
collapse can be seen graphically in that the curves are a close match to each other,
meaning that the vast majority of particles did indeed collapse into CUP particles.
The method of water reduction in this research allows the CUP particles to exist
in an aqueous medium without the need of a co-solvent, which has been typical of water-
reduced resin systems in the coatings industry. By synthesizing various molecular
weights, the size of the CUPs can be controlled, allowing the ability to tailor the particles
to specific size requirements. Since all that was required was hydrophilic groups and a
hydrophobic backbone of the correct ratio, the scope of this type of particle was very
broad from coatings to analytical applications. Unlike water soluble resins, these “water
insoluble” particles allow applications where no organic solvent can be tolerated.

41
ACKNOWLEDGEMENTS
The authors would like to acknowledge Missouri S&T Coatings Institute for the
financial aid and resources and to thank our fellow researchers: Jigar Mistry, Sagar Gade,
Ameya Natu, Robert Hull and Catherine Hancock for their help and support.

42
REFERENCES
1. Riddles CJ, Zhao W, Hu H-j, and Van-De-Mark M. Polymer Preprints 2011;52:232-233.
2. Chen M and Van-De-Mark MR. Polym. Prepr. (Am. Chem. Soc., Div. Polym. Chem.) 2011;52:336-337.
3. Flory PJ. The Journal of Chemical Physics 1945;13(11):453-465.
4. Aseyev VO, Tenhu H, and Klenin SI. Macromolecules 1998;31(22):7717-7722.
5. Seixas de Melo J, Costa T, Miguel MdG, Lindman B, and Schillén K. The Journal of Physical Chemistry B 2003;107(46):12605-12621.
6. Kirwan LJ, Papastavrou G, Borkovec M, and Behrens SH. Nano Letters 2003;4(1):149-152.
7. Kulkarni P, Rajagopalan K, Yeater D, and Getzenberg RH. Journal of Cellular Biochemistry 2011;112(7):1949-1952.
8. Li G, Liu J, Pang Y, Wang R, Mao L, Yan D, Zhu X, and Sun J. Biomacromolecules 2011;12(6):2016-2026.
9. Morishima Y, Nomura S, Ikeda T, Seki M, and Kamachi M. Macromolecules 1995;28(8):2874-2881.
10. Zhu B, Ma J, Li Z, Hou J, Cheng X, Qian G, Liu P and Hu A. J. Mat. Chem. 2011;21:2679-2683.
11. Mecerreyes M, Lee V, Hawker C, Hedrick J, Wursch A, Volksen W, Magbitang T, Huang E, and Miller R, Adv. Mater 2001;13:204-208.
12. Altintas O, Willenbacher J, Wuest K, Oehlenschlaeger K, Krolla-Lidenstein P, Gliemann H, and Barner-Kowollik C. Macromolecules 2013;46(20):8092-8101.
13. Hosono N, Gillissen M, Li Y, Sheiko S, Palmans A, and Meijer E. J. Am. Chem. Soc. 2013;135:501−510.
14. Murray B, and Fulton D. Macromolecules 2011;44:7242–7252.
15. Jiang X, Pu H, Wang P. Polymer 2011;52:3597-3602.
16 Rosthauser JW, Nachtkamp K. Water-borne Polyurethanes. Stamford, CT: Technomic Publ., 1987.

43
17. Saravari O, Phapant P, and Pimpan V. Journal of Applied Polymer Science 2005;96(4):1170-1175.
18. Georgiev GS, Dakova IG, and Valova NL. Colloid and Polymer Science 1994;272(8):938-945.
19. Myers D. Surfactant Science and Technology, 3rd ed. New Jersey: John Wiley and Sons, 2006.
20. Hill LW and Wicks Jr ZW. Progress in Organic Coatings 1980;8(2):161-182.
21. Zhao M and Zheng L. Physical Chemistry Chemical Physics 2011;13(4):1332-1337.
22. Rusdi M. Jurnal Matematika & Sains 2009;14(2):57-61.
23. Segrè PN, Meeker SP, Pusey PN, and Poon WCK. Physical Review Letters 1995;75(5):958-961.
24. Horn FM, Richtering W, Bergenholtz J, Willenbacher N, and Wagner NJ. Journal of Colloid and Interface Science 2000;225(1):166-178.
25. Chatenay D, Urbach W, Messager R, and Langevin D. The Journal of Chemical Physics 1987;86(4):2343-2351.
26. Blaaderen AV, Peetermans J, Maret G, and Dhont JKG. The Journal of Chemical Physics 1992;96(6):4591-4603.
27. Imhof A, Blaaderen AV, Maret G, Mellema J, and Dhont JKG. The Journal of Chemical Physics 1994;100(3):2170- 2181.
28. Casson N. Rheology of Disperse Systems. New York: Symposium Publications Division, Pergamon Press, 1959.
29. Barton AFM. CRC handbook of solubility parameters and other cohesion parameters, Second Edition ed.: Boca Raton, Fla. : CRC Press, 1983.
30. Dobrynin AV and Rubinstein M. Progress in Polymer Science 2005;30(11):1049-1118.
31. Dobrynin AV, Rubinstein M, and Obukhov SP. Macromolecules 1996;29(8):2974-2979.
32. Microtrac Nanotrac 250 particle size analyzer manual

44
APPENDIX
Figures 12-16 GPC Data for Polymers 1-5
Fig. 12. Polymer 1 GPC Data

45
Fig. 13. Polymer 2 GPC Data

46
Fig. 14. Polymer 3 GPC Data
47
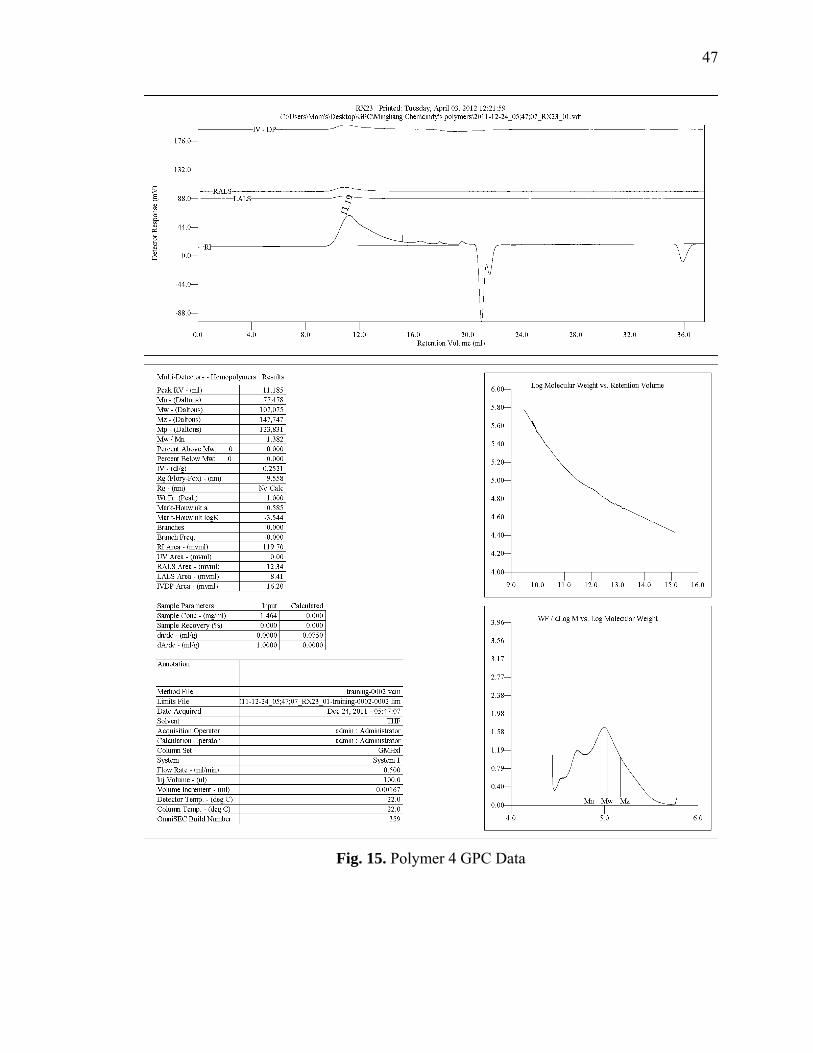
Fig. 15. Polymer 4 GPC Data

48
Fig. 16. Polymer 5 GPC Data

49
Figures 17-18 Submerged and un-submerged water addition during reduction.
Fig. 17. Submerged water addition
Fig. 18. Un-submerged water addition

50
II. Use of 19F-NMR T2 Relaxation to Probe the Tg and Core
Environment of CUP Particles in Aqueous Media
CynthiaRiddles,YousefDawib,LingyuChiandMichaelR.VanDeMark,
Department of Chemistry, Missouri S&T Coatings Institute,
Missouri University of Science & Technology,
Rolla, MO 65409

51
ABSTRACT
The interior of Colloidal Unimolecular Polymer (CUP) particles was investigated by
using trifluoroethyl methacrylate (TFEMA) as the NMR probe. 19F -NMR T2 relaxation
experiments were utilized as a function of temperature to evaluate the mobility of the
trifluoroethyl group. The CUP particles were spheroidal and of 4.6 nm in diameter
suspended in water. These particles exhibited a change in the slope of the T2 rates versus
temperature at 56 oC at a point similar to the Tg determined by solid state CP-MASS-
TOSS and also the onset of the Tg by DSC. These results indicate that the CF3 of the
TFEMA group was in the solid interior of the CUP particle and behaves like the bulk
polymer even though they are in aqueous suspension.
Introduction
Colloidal Unimolecular Polymer, CUP, particles are a new spheroidal single chain
macromolecule suspended in water. CUP particles have been shown to be useful as an
additive to make latex paint freeze thaw stable [1], as an acid catalyst [2], and as a resin
technology. The particles can be crosslinked and are VOC free and are nanoscale unlike
latex.[3,4] The synthesis of the CUPs and the water reduction process by which they were
formed, has been described in earlier papers.[5,6] Also known as single chain nano
particles, the CUPs were formed by a general water reduction process that was
performed after the neutralization of ionizable groups along the polymer chains and then
slowly subjected to an increasingly poor solvent environment. At a volume ratio of
approximately 60% water to 40% THF the polymer-polymer interactions overcame the

52
polymer-solvent interactions and the polymer chains collapsed into spheroidal particles.
The hydrophobic portions of the chains made up the interior domain of the CUP particles,
and the hydrophilic groups oriented to the outside in the water phase, similar to the
behavior of micelles. Once collapsed, the organic solvent was stripped off resulting in the
CUP particle being suspended in VOC-free water. The diameter of the particles was
dependent on the molecular weight of the polymer chains, unlike micelles whose
diameters are approximately twice the length of the surfactant used. [7]
One of the most important benefits of these CUP particles is the fact that they are
VOC and surfactant free. CUPs are suspended in a VOC-free aqueous media. These
“water insoluble” particles allow applications where no organic solvent can be tolerated.
The diameter of the CUP particle was easily controlled by the molecular weight
of the polymer and calculated by using data obtained through GPC and the density of the
bulk polymer. The volume which 1.0 g of polymer occupies, Vg was calculated below:
.
(1)
Next, the number of particles, P, at each weight fraction was determined by using
Avogadro’s number NA, and the number average molecular weight:
∗ / (2)
/ (3)
This volume was used in the equation of a sphere to get the diameter of each particle at
each molecular weight fraction. Other synthetic polymerization methods such as living
53
radical polymerization would allow a narrower molecular weight distribution, and in turn
result in a narrower distribution of diameters.
The ability to tailor the collapsed particles to specific diameters was one
advantage of these nanoparticles. In order to accurately predict the CUP diameters by
equations 1-3, the density of the bulk dry polymer was used. Since CUP particles were
suspended in aqueous media a determination was needed as to whether the CUPs had the
same density even in suspension, as that of the bulk polymer, a dry solid. If both
densities are the same, then the Tg of both would also be the same, if different, then the
CUPs contain free volume possibly due to trapped water in the interior, or arising from
the carboxylate groups being in the interior, and not in the aqueous phase.
Previous work by Mistry [3,4] showed that upon collapse, carboxylate groups of the
polymer chains were oriented into the water phase of the CUP particles. The polymers
were water reduced and solvent was stripped to produce colloidal unimolecular polymers
(CUPs). These particles were typically 3–9 nm in diameter and were also dependent on
the molecular weight of the polymers. Ratio of acid groups to monomers was 1:8 and 1:7
similar in the balance of hydrophobic and hydrophilic groups as the polymers used in this
research. The CUP solution was then formulated into clear coatings and crosslinked with
melamine3 and aziridine4 as the crosslinker. These were then cured thermally and
compared to commercial latex films. In both instances these crosslinked acrylic CUPs
had a distinct advantage of having near-zero volatile organic content, better availability
of surface functional groups, and improved water resistance than the commercial latex
films. The ability of these particles to be highly crosslinked showed the ability of

54
carboxylate groups at the surface of the CUPs, but another method was needed to
investigate the dynamics of the interior domain.
NMR T2 relaxation methods have been used to measure changes in the mobility
of specific nuclei during experiments.[8-11] These experiments included the formation of
micelles and different conformation of polyelectrolytes which tumbled at different rates.
The research group of de Graff [8], focused on AB and BAB block copolymers
which were polyethylene glycol (PEG) as A blocks and poly(N-isopropylacrylamide)
(PNIPAM) as B blocks in an aqueous environment. Relaxation measurements of both
spin-lattice (T1 ) and spin-spin (T2 ) were used to determine that both star and flower-like
micelles were formed by the block copolymers. By measuring with DLS it was found
that the radius of the tri-block micelles were smaller than those of the di-block 27 vs 35
nm. The relaxation rates measured for both the star and flower types of micelles, below
the cloud point, have little change in both the T1 and T2 relaxation times. Above the cloud
point there was a small difference in the T1 relaxation and a very noticeable difference in
T2 . This difference was an indication that the motion of the micelles had changed. The
T2 signal from the PEG A blocks showed splits into a fast and slow component showing
that the two different motions from the PEG A blocks were occurring. The T2fast
component was higher in the tri-block micelle. The authors state that this was the result
of the difference in the hydrodynamic radius of the two different micelles formed and
relate this to the Stokes-Einstein-DeBye relationship:
1/ (4)

55
If the value of is smaller, as it was for the tri-block micelles (27 nm versus 35nm for
the di-block), the rotational diffusion D was larger. This caused the smaller micelles to
have a shorter rotational correlation time which in turn translates into a longer T2 time.
The T2slow for the tri-block micelle was shorter than the T2slow for the di-block. The
authors explain this as the relaxation of the distal portions of the PEG groups i.e. they are
more flexible leading to fast internal motion. This difference was due to the structure of
the flower micelle with the loops rather than the star micelles. The PEG loops have in
themselves two spin-spin relaxation time constants, one where the mobility is limited
(more internal) and another for the distal (away from the center) portions.
Weiss et al [9] also looked at the relaxation rates of micelles formed by using
double thermo responsive di-block copolymers. The two polymers P1 and P2 had the
same blocks poly ( N -ethyl acrylamide) and ( N -propyl acrylamide), however the length
of the blocks was varied. For Polymer 1 (PNEAM 94-b-PNPAM 34, P1), and Polymer 2
(PNEAM 133-b -PNPAM 133, P2). These were end capped with trimethylsilyl (TMS)
giving a singlet for the TMS. The micelles formed the hydrophilic portion from PNEAM
blocks and the hydrophobic core PNPAM. The signal from the TMS moiety on the
PNPAM groups broadened to the point that the authors focused solely on the TMS
groups on the initial RAFT end of the PNEAM block (TMSR ) and the second on the
terminal end (TMSZ ). The authors also found the T2 measurements showed a fast and a
slow component at all temperatures studied, while all T1 values consisted of just one
component. From this information, it was hypothesized that both star and flower micelles
were present in the transition from the lower critical solution temperature and past the
cloud point. Signal broadening occurred due to the TMSR groups forming both star and

56
flower shape micelle as they were close to the core, and also remaining signals from
TMSZ which show the end group was in the mobile phase like a star shape micelle.
NMR relaxation has also been used to show evidence of the formation of micelle
aggregates in aqueous solutions. [10] Evertsson et al studied both T1 and T2 relaxation
times in three systems. The systems were composed of ethyl(hydroxyethyl)cellulose
EHEC, sodium dodecyl sulfate SDS, polyethylene oxide PEO and water in mixtures of
EHEC/SDS/water, SDS/water and PEO/SDS/water. In these experiments the 1H NMR
relaxation of the methyl protons of the SDS were measured as the concentration of the
SDS was slowly increased. For the three systems there was a significant drop in the T1
times at concentrations that are in agreement with literature values of the critical micelle
concentration (CMC) of SDS. The range of time difference was similar in all systems
measured. The relaxation time continued to drop slowly as the concentration of SDS was
increased.
When measuring the T2 values of the same systems, a drop in the T2 time was also
seen at the CMC onset of aggregation. The range of time was not similar for all systems
like it was for the T1 measurements. For the EHEC/SDS/water system a more drastic
drop in the relaxation times from 0.65 to 0.1 second was observed, where the
PEO/SDS/water and the SDS/water were similar. The authors noted that this was likely
due to the rigid backbone of the EHEC and a denser mixed polymer micelle. For both
relaxation methods, the drop in relaxation times was a clear indication of the formation of
aggregates and the slowing of the tumbling of the methyl groups.
Partly fluorinated polyelectrolytes were synthesized by Nurmi et al [11] as possible
19F MRI-detectable nanoparticles. In this paper the authors discussed the problems with

57
the highly hydrophobic nature of the fluorine atoms which causes aggregation in water
and results in a loss of mobility thereby decreasing the signal intensity. For MRI imaging
this is a large problem to overcome, and led the authors to synthesize the fluorine
containing monomers with charged water soluble monomers. The polymers were
statistical and block copolymers of trifluoroethyl methacrylate (TFEMA) and 2-
(dimethylamino) ethyl methacrylate (DMAEMA).
The polymer composition, polymer charge density, solution ionic strength and
solution pH were varied while both T1 and T2 relaxation measurements were taken. By
varying these properties, the polymer conformations ranged from extended coil to
extended coil intermediate and collapsed globule. The conformations were measured
using dynamic light scattering (DLS). The more extended chain conformation resulted in
higher T1 and T2 times and the collapsed globule the shorter times. The T1 values ranged
from ~310 ms collapsed globule to ~ 520 ms extended coil. The T2 relaxation time
ranged from ~10 ms for the collapsed globule to ~ 150 ms for the extended coil. The
large difference in the T2 relaxation times was similar to what Evertsson’s group reported,
and was due to the change in mobility causing the most significant variance. In all cases,
a decrease in the T2 relaxation time was attributed to the nuclei becoming more restricted
in mobility.
In this research 2, 2, 2-trifluoroethyl methacrylate (TFEMA) was incorporated as
a random copolymer with methyl methacrylate (MMA), butyl acrylate (BA) and acrylic
acid (AA). Tagging this polymer with the TFEMA allowed 19FNMR T2 relaxation
measurements to be made on the reduced CUP particles. Increasing the temperature of
the CUP solution should show a slow increase in the T2 relaxation times, up until the Tg is
58
reached. At this point, a noticeable increase should be seen as the segmental motion of
the polymer is increased allowing the fluorine nuclei to increase mobility. If no
noticeable increase is seen this would indicate that the fluorine nuclei were freely
spinning even at lower temperatures meaning they resided in the aqueous phase with the
carboxylate groups or water plasticizes the CUP interior.
The ability to tailor the size of the CUPs and the placement of specific groups in
the interior, or exterior gives more versatility to these particles. The potential use of the
CUPs may include drug delivery systems, crosslinking resin technology and possible
surfaces for catalysts.
Results And Discussion
Polymerization
The 2,2,2-trifluoroethyl methacrylate (TFEMA ), methyl methacrylate (MMA),
butyl acrylate (BA) and acrylic acid (AA) were radically copolymerized to produce the
19F tagged polymer. The TFEMA monomer was randomly incorporated along the
polymer chain in the molar ratio shown in Figure 1. The ionizable groups on the chain
were the acrylic acid monomer. Since CUP formation does not require specific
placement of groups along the backbone, use of a random copolymer configuration
allows easier synthetic routes than other single chain nanoparticles (SCN) which require
more specific polymerization techniques or many synthetic steps.[12-14]

59
Figure 1. Random Copolymer with Molar Ratios for RX-19
The ratio of non-ionizable monomers to the acrylic acid monomer was
approximately a 9:1 ratio which was similar to typical ionic surfactants having
approximately 16-22 carbon atoms comprising the hydrophobic portion of the chain to
one ionizable group.[15] The ratio of hydrophobic/hydrophilic groups may be adjusted;
however, if the number of acid groups is too high the chains will be water soluble, and
collapse will not occur, and if too low there will not be enough hydrophilic groups to
stabilize the particles. In the latter case, the particles may aggregate or simply
precipitate. [16]
Water Reduction to Form CUP
The water reduction process is depicted in Figure 2. The polymer chains were
dissolved in THF existing in a random coil configuration I. Addition of NH4OH
neutralized the acid groups II. As water was added to the polymer and THF mixture, the

60
chains took on a more rigid rod conformation causing the solution viscosity to be at a
maximum III. At the point that polymer chains collapsed into spherical particles, a drop
in viscosity was seen IV. The same phenomenon has been observed in water reducible
resins in the coatings industry.[17] The THF was then stripped off leaving CUP particles V
suspended in a VOC-free aqueous medium.
Figure 2. Conformations during Reduction I Random coil configuration in THF. II. Random coil intimate ion pair. III. Rigid rod formation. IV. Collapsed coil. V. Hard sphere.

61
In order to show that the polymer chains were in fact unimolecular and spherical
after collapse, the distribution curves from the GPC and DLS experiments were graphed.
The GPC gave absolute number average molecular weights at points along the
distribution curve. From these values, a theoretical diameter was determined by the
volume of a sphere equation and polymer density, and then plotted against the DLS
values, the two are shown in Figure 3. The two distribution curves were a very close
match, and show the dependence of the diameter to be directly related to the molecular
weight of the polymer and are not aggregated.
Figure 3.RX-19 Distribution Curves

62
19FNMR Relaxation Experiments
The 19FNMR spectrum for the collapsed CUP particle at 25°C in D2O is shown in
Figure 4. The single peak at approximately -75 ppm arising from the three fluorine
nuclei of the TFEMA was in agreement with the literature value, also -75 ppm .[18]
Figure 4. RX-19 CUP particle suspended in D2O at 25C
The T2 relaxation experiments were performed at temperatures ranging from 25⁰C to
70⁰C. This temperature range was selected to be below and above the Tg determined by
DSC. The T2 relaxation times were plotted at each temperature and are shown in Figure
5. A distinct deviation from linearity was seen as the temperature approached the Tg.
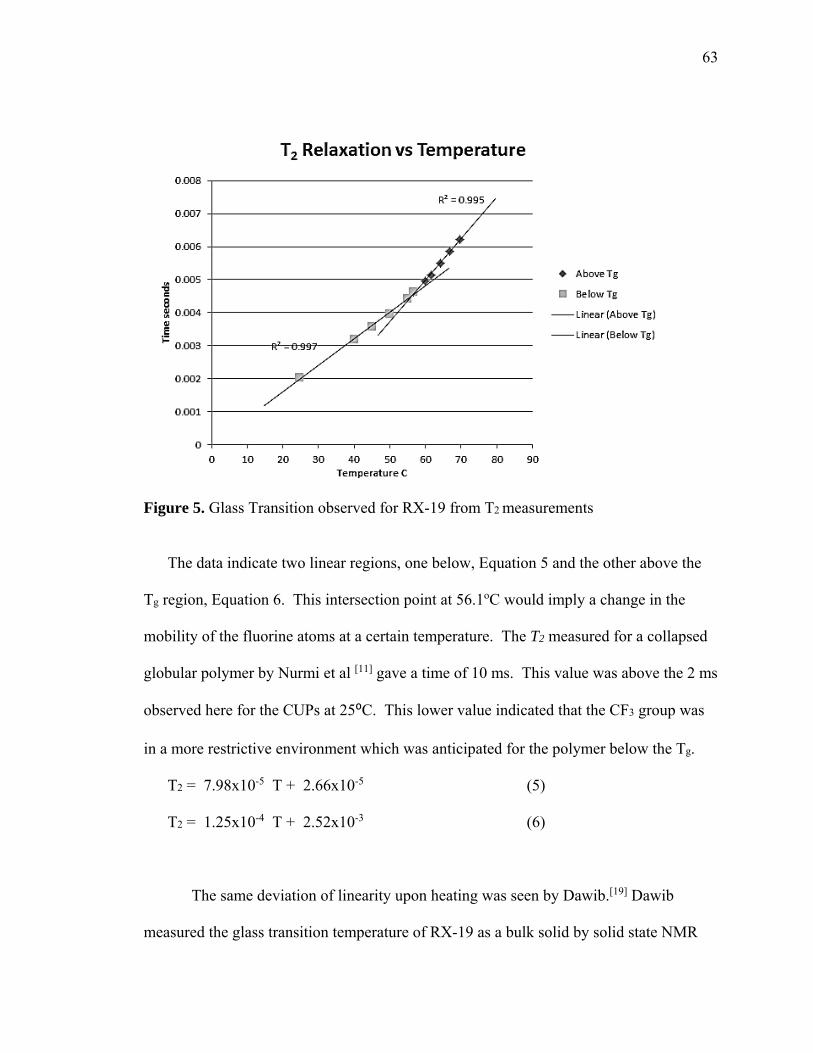
63
Figure 5. Glass Transition observed for RX-19 from T2 measurements
The data indicate two linear regions, one below, Equation 5 and the other above the
Tg region, Equation 6. This intersection point at 56.1oC would imply a change in the
mobility of the fluorine atoms at a certain temperature. The T2 measured for a collapsed
globular polymer by Nurmi et al [11] gave a time of 10 ms. This value was above the 2 ms
observed here for the CUPs at 25⁰C. This lower value indicated that the CF3 group was
in a more restrictive environment which was anticipated for the polymer below the Tg.
T2 = 7.98x10⁻⁵ T + 2.66x10⁻⁵ (5)
T2 = 1.25x10⁻⁴ T + 2.52x10⁻³ (6)
The same deviation of linearity upon heating was seen by Dawib.[19] Dawib
measured the glass transition temperature of RX-19 as a bulk solid by solid state NMR

64
using 13C CP-TOSS NMR peak intensity as a function of temperature. Solid state NMR
has been used to measure the glass transition temperature of polymers.[20-22] The glass
transition temperature is typically seen at the onset of peak broadening in the NMR
spectrum. As the temperature is raised, segmental relaxation begins to occur causing a
broadening of the peaks of the nuclei being measured. In the work of Dawib, two solid
bulk polymers were used, poly isobutyl methacrylate (PIBMA), Figure 6 and the RX-
19 polymer, Figure 1.
Figure 6. The chemical structure of polymer PIBMA
Both polymers contain methylene carbons and methyl carbons bonded to quaternary
carbons along the polymer backbone. Other similar pendant groups were carbonyl
carbons, (OCH2), methylene and methyl carbons (CH2 and CH3).
The 13C CP-TOSS NMR experiment was carried out at varying temperatures and
peak intensity vs temperature were plotted for each carbon. The graphs showed
analogous linear regions as seen in the current research. The intersection of the two
linear segments was determined to be the onset temperature of molecular motion. For
both polymers the carbons along the backbone and the pendant carbons showed two
different onset temperatures.

65
The pendant carbon groups were less restricted than the carbons found along the
rigid backbone of the polymer chains. As the temperature increased, the pendant groups
gained segmental motion before the backbone carbons resulting in a deviation from
linearity at a lower temperature.
Dawib evaluated the curves obtained from the MDSC thermogram and noted
where the first detectable deviation from the extrapolated baseline occurred. Both the
MDSC and CP-TOSS results showed that the side chain movement occurred at 57 oC for
the RX-19 bulk polymer. The thermogram obtained by DSC in this research was also
evaluated in the same method, and showed deviation from the extrapolated baseline
occurred between 55 and 59 oC, and from solution NMR relaxation 56.1⁰C. Both
correspond to the first onset of the Tg observed in DSC at approximately 57°C and
confirmed by two different NMR experimental methods. Had the fluorine atoms been in
the water phase (on outside of particles) no change in the T2 slope would have been
expected. It should be noted that the onset of deviation in the DSC is not well defined
and is therefore less reliable than the NMR methods at detecting initial motion.
Since DSC, CP-TOSS on the bulk material both agree with the 19F NMR of the
CUP system, the interior appears to be analogous to that of the bulk material. This
implies that the interior is not being plasticized significantly by water and the general
model of it being a hard sphere is correct.
Conclusions
A random copolymer containing fluorine atoms was synthesized and water
reduced to form CUP particles which were subsequently investigated by 19FNMR T2

66
relaxation measurements in solution. The relaxation times as a function of temperature
were found to have two linear regions, one above and the other below the onset of the Tg
measured by DSC. The intersection of the two linear curves gave an onset Tg of 56.1⁰C
which was in agreement with the extrapolated data from the DSC thermogram for the dry
bulk polymer which was 57⁰C.
The same RX-19 polymer was investigated by Dawib who measured the Tg of the
bulk dry polymer by MDSC, and 13C CP-TOSS NMR. The onset Tg for RX-19 from the
MDSC was found to be 57⁰C and 57⁰C by NMR.
The similarity of the Tg of the CUP to that of the bulk polymer was
confirmation that the density and the Tg of RX-19 were the same even though one was
the dry bulk polymer and the other, CUP particles suspended in aqueous media.
Experimental Section
Materials
Methyl methacrylate (MMA), butyl acrylate (BA), acrylic acid (AA), 2, 2, 2-
trifluoroethyl methacrylate (TFEMA), 2, 2′-azobis (2-methylpropionitrile) (AIBN), and
1-dodecanethiol were purchased from Aldrich. MMA, BA and TFEMA were purified by
washing with a 10% (w/w) solution of sodium bicarbonate, followed by rinsing with de-
ionized water, and brine. The products were dried over sodium sulfate and filtered.
Copper (I) bromide was added to all monomers as an inhibitor, and simple distillation
under nitrogen was carried out for MMA and TFEMA. Distillation under reduced
pressure was used for AA and BA. The initiator AIBN was re-crystallized from
methanol, and 1-dodecanethiol was used as received.

67
Polymerization
Polymerization was by free radical mechanism and carried out in methyl ethyl
ketone (MEK), with 1-dodecanethiol as the chain transfer agent, 2-2'-Azoisobutyronitrile
(AIBN) as the initiator. To a three-neck flask was added 750 grams of MEK and a
magnetic stirring bar. The monomers were then added; MMA 75.68 g (0.76 moles) BA
37.90 g (0.30 mole), AA 8.72 g (0.12 moles) and TFEMA 6.50 g (0.04 moles).
Dodecanethiol in the amount of 0.81 g (4 mmole) was added and then AIBN 0.14 g (0.8
mmole). The flask was fitted with a nitrogen line, condenser, and a gas outlet adapter
connected to an oil bubbler to allow a positive flow of nitrogen throughout the
polymerization. The flask was heated slowly to reflux and allowed to react for 24 hours.
The polymer solution was then cooled to room temperature, and precipitated in cold de-
ionized water under high shear, then dried under reduced pressure.
The acid number (AN) of the polymer was measured by the titration method
given in the ASTM D 974; the method was modified by using potassium hydrogen
phthalate (KHP) in place of hydrochloric acid, tetrahydrofuran (THF) in place of ethanol
to dissolve the samples and phenolphthalein in place of methyl orange. The percent
yield and acid number are listed in Table 1.
Table 1: Yield and Acid Number Polymer Isolated Measured AN Calculated AN
Yield mg KOH/g polymer
RX 19 75% 60 53
68
Water Reduction Method
The dried polymer was first dissolved in THF (20% w/w) and allowed to stir
overnight. Ammonium hydroxide was added to neutralize the acid groups based upon the
acid number. De-ionized water at pH of 8.5 ± 0.2, 2.25 times the weight of THF, was
added by a peristaltic pump at the rate of 1.24g/minute. After the water was added, the
THF was stripped off in-vacuo. The clear solutions were then filtered with a 0.45 micron
filter to remove any extraneous trace contaminants. The typical loss on filtering was less
than 0.05% of the solids (w/w).
Instrumental Techniques
19FNMR of poly (methyl methacrylate-ran-butyl acrylate-ran-acrylic acid-ran-
trifluoroethyl methacrylate).
The 19FNMR relaxation experiments were carried out using a Varian 400 MHz
FT/NMR spectrometer using 5 mm o.d. tube. The dried fluorine tagged polymer was
water reduced by the described method. The experiment solutions were made by mixing
350 micro liters of a 10% (w/w) CUP solution with 400 micro liters of D2O. For each
temperature measured, a new solution was made.
The T2 relaxation experiments were carried out by the Carr-Purcell-Meiboom-Gill
sequence (CPMG) shown in Figure 7. The CPMG used an initial 90⁰ pulse and when the
spin coherences decayed after a time τ, a 180⁰ pulse was applied to give a spin echo. The
180⁰ pulse was then repeated at various delay times to give a train of echoes. Each echo
was then Fourier transformed, and the integration values were plotted against the delay
times to give the T2 value at each temperature.

69
Figure 7. Spin Echo Sequence
1HNMR of poly (methyl methacrylate-ran-butyl acrylate-ran-acrylic acid-ran-
trifluoroethyl methacrylate)
1H NMR (400 MHz, CDCl3): δ 0.85 (3H), 0.95 (2H), 1.03 (2H), 2.00 (3H), 2.16,
(3H), 3.59 (3H), 4.35 (2H). Other peaks appearing in the range of 1.15-1.82 were
consistent with the polymer backbone methylene.
13CNMR poly (methyl methacrylate-ran-butyl acrylate-ran-acrylic acid-ran-trifluoroethyl
methacrylate).
13CNMR (400 MHz, CDCl3 ) δ 176-178 ppm were attributed to the C=O carbons
of the following polymers PTFEMA, PBA, PMMA and PAA δ 76.9 OCH3 from PMMA,
77.2 OCH2 from PBA, 77.6 OCH2 PTFEMA 64.8 CF3 from PTFEMA. At 51.9 CH2,
30.52 CH2, 13.84 CH3 butyl group of PBA. Other peaks appearing in the range of δ 15-
30 were consistent with the polymer backbone methylene and pendant methyl groups.
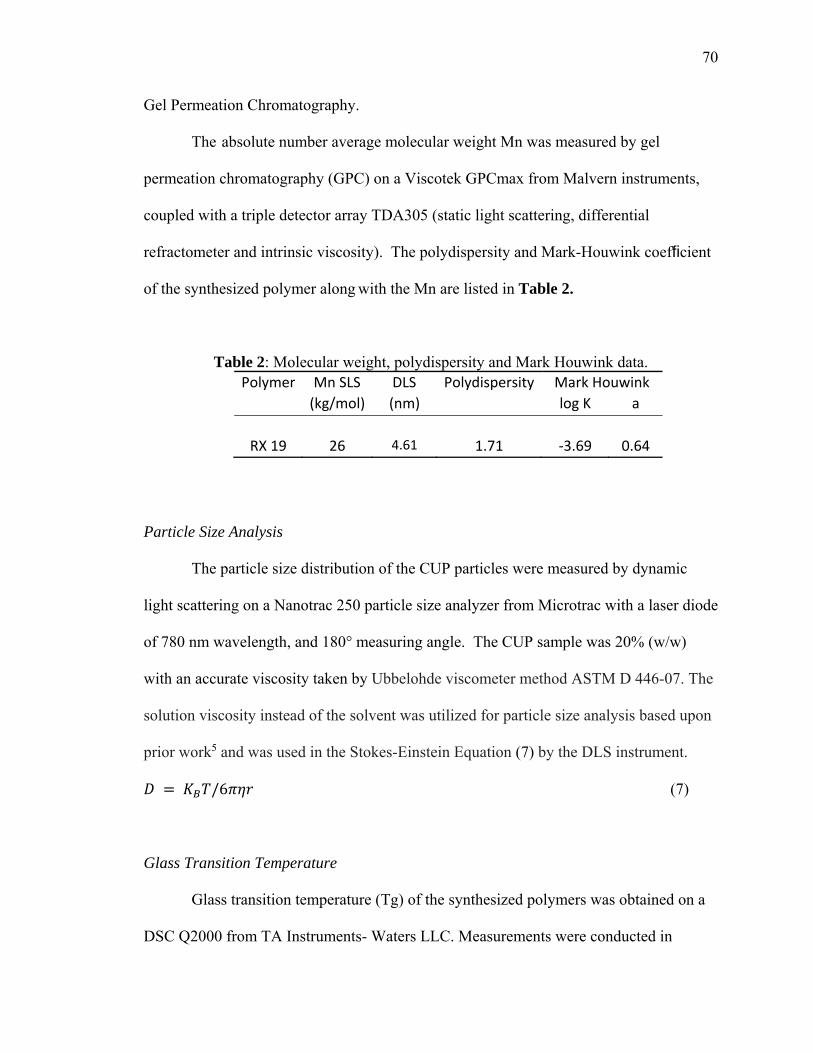
70
Gel Permeation Chromatography.
The absolute number average molecular weight Mn was measured by gel
permeation chromatography (GPC) on a Viscotek GPCmax from Malvern instruments,
coupled with a triple detector array TDA305 (static light scattering, differential
refractometer and intrinsic viscosity). The polydispersity and Mark-Houwink coefficient
of the synthesized polymer along with the Mn are listed in Table 2.
Table 2: Molecular weight, polydispersity and Mark Houwink data. Polymer Mn SLS DLS Polydispersity Mark Houwink
(kg/mol) (nm) log K a
RX 19 26 4.61 1.71 ‐3.69 0.64
Particle Size Analysis
The particle size distribution of the CUP particles were measured by dynamic
light scattering on a Nanotrac 250 particle size analyzer from Microtrac with a laser diode
of 780 nm wavelength, and 180° measuring angle. The CUP sample was 20% (w/w)
with an accurate viscosity taken by Ubbelohde viscometer method ASTM D 446-07. The
solution viscosity instead of the solvent was utilized for particle size analysis based upon
prior work5 and was used in the Stokes-Einstein Equation (7) by the DLS instrument.
/6 (7)
Glass Transition Temperature
Glass transition temperature (Tg) of the synthesized polymers was obtained on a
DSC Q2000 from TA Instruments- Waters LLC. Measurements were conducted in

71
accordance with ASTM standard E1356-08. The modulated DSC (MDSC) method was
applied by heating samples of mass 5-20 mg in premium aluminum hermetic pans DSC#
84010 & 84011from DSC Consumables, Inc. at a heating rate of 2 °C /min over the
temperature range of 0°C to 100°C. The modulated amplitude was ±1°C with a period of
60 s. The temperature of first deviation was the point of first detectable deviation from
the extrapolated baseline prior to the transition and the midpoint temperature was the
point on the thermal curve corresponding to 1⁄2 the heat flow difference between the
extrapolated onset and extrapolated end. The synthesized polymer RX-19 revealed a Tg
value, 68°C, and the first deviation temperature occurred approximately at 57°C+/- 2°C.
The DSC thermogram is shown in Figure 8.
Figure 8. Glass Transition of RX-19 Bulk Polymer by DSC

72
Acknowledgments
The authors would like to acknowledge Missouri S&T Coatings Institute for the
financial support and Jigar Mistry, Sagar Gade, Ameya Natu, and Catherine Hancock for
their assistance. We would also like to thank Dr. Rex E. Gerald II for his help with the
NMR experiments. Also, thank you to Jerry Powers from Chromaflo Technologies for
assisting with DSC measurements.
References
[1] S. Gade, M. Van De Mark, Abstracts, 49th Midwest Regional Meeting of the
American Chemical Society, Columbia, MO, United States, November 12-15, , 2014 ,
MWRM-96.
[2] A.M. Natu, M. Van De Mark, Progress in Organic Coatings, 2015. 81, 35-46.
[3] J. Mistry, A. Natu, M. Van De Mark, Journal of Applied Polymer Science, 2014,
131, 40916.
[4] J. Mistry, M. Van De Mark, Journal of Coatings Technology and Research,
2013,10,453-463.
[5] C. Riddles, W. Zhao, H. Hua-Jung, M. Chen, M. Van De Mark, Polymer, 2014, 55,
48-57.
[6] M. Chen, C. Riddles, M. Van De Mark, Langmuir, 2013, 29, 14034−14043.
[7] D. Myers, In Surfactant Science and Technology, John Wiley and Sons, New
Jersey, 2006.
[8] A. de Graff, W. Kristel, W. Boere, J. Kemmink, R. Fokkink, C. Van Nostrum,
D.T. Rijkers, J. van der Gucht, H. Wienk, M. Baldus, E. Mastrobattista, T. Vermonden,
W. Hennink, Langmuir, 2011, 27. 9843–9848.
[9] J. Weiss, H. Wienk, R. Boelens, R. Laschewsky, Macromol. Chem. Phys. 2014,
215, 915−919.
[10] H. Evertsson, S. Nilsson, C.Welch, L. Sundelof, Langmuir. 1998, 14. 6403-6408.
[11] L. Nurmi, H. Peng, J. Seppala, D. Haddleton, I. Blakey, A. Whittaker, Polymer
Chemistry. 2010, 1. 1039-1047.

73
[12] M. Mecerreyes , V. Lee, C. Hawker, J. Hedrick, A.Wursch, W.Volksen, et al, Adv
Mater 2001. 13, 204-208.
[13] O. Altintas, J. Willenbacher, K. Wuest, K. Oehlenschlaeger, P. Krolla-Lidenstein,
H. Gliemann, et al, Macromolecules 2013. 46 (20). 8092-8101.
[14] B. Murray, D. Fulton, Macromolecules, 2011, 44, 7242-7252.
[15] M. Zhao, L. Zheng, Physical Chemistry Chemical Physics, 2011, 13(4), 1332-
1337.
[16] M.R. Van De Mark, A.M. Natu, S.V. Gade, M. Chen, C. Hancock, C. Riddles,
Journal of Coatings Technology and Research, 2014, 11(2), 111-122.
[17] L. Hill, Z.Wicks, Progress in Organic Coatings, 1980; 8(2), 161-182.
[18] J.T. Gerig, Progress in Nuclear Magnetic Spectroscopy. Part 4, 26, 1994, 293-370.
[19] Y. Dawib, R. Gerald, C. Riddles, M. Van De Mark, M. Submission Pending.
[20] K. McGrath, K. Ngai, C. Roland, Macromolecules 1995, 28, 2825-2830.
[21] W. Hu, Y. Su, L. Zhou, A. Pang, R. Cai, X. Ma, S. Li, Molecules 2014, 19, 1353-
1366.
[22] X. Gao, L. Wang, H. Luo, Q. Zou, N. Feng, J. Feng, Macromolecules, 2010, 43,
5713–5722
APPENDIX
Figure 1 RX-19 1HNMR
Figure 2 RX-19 13CNMR
Figure 3 RX-19 CUP suspended in D2O
Figure 4 RX-19 GPC data
Figure 5 RX-19 particle size data

74
FIGURE 1 RX-19 1HNMR

75
FIGURE 2 RX-19 13CNMR

76
FIGURE 3 RX-19 CUP suspended in D2O

77
FIGURE 4 RX-19 GPC data

78
FIGURE 5 RX-19 particle size data

79
SECTION
2. COUNTER ION AFFECT OF GROUP 1 HYDROXIDES
2.1. INTRODUCTION
One drawback of the CUP particles being ionized with NH4OH was that if the
CUPs were allowed to dry, they would not be able to be re-dissolved due to evaporation
of the ammonium ion. Ideally, if the CUPs were to be marketed for the coatings industry,
being in powder form would be beneficial. This would allow the customer to have the
ability of controlling concentration of CUP solution, and smaller storage needs. Another
benefit is the lack of a need for fungicide and biocide used until the CUPs are re-
dissolved. For this reason, investigation into alternative bases for the ionization process
was necessary.
During initial water reduction trials by others in this research group, it was
discovered that de-ionized water must be used rather that tap water. When tap water was
used, a coagulum formed and prevented successful collapse of the CUPs. To determine if
calcium was the problem, a water reduction was done using water with a small amount of
CaOH2 (20ppm). The CUP solution was cloudy and coagulum was present as shown in
Figure 1.
The backbone of the polymer chains consist of COO- and calcium is bivalent thus
allowing two polymer chains to become connected to calcium cations. This same
problem would be seen using magnesium or any other multi-valent species during the
reduction process.

80
.
Figure 1. Calcium present at 20ppm
To prevent any coagulum from occurring Group 1 mono valent metals were
selected. The metal hydroxides of lithium, sodium and potassium were selected to ensure
the CUP solutions retained purity. The hydroxides were dissolved in de-ionized water
and the Molarity was measured for each. These bases were then used to neutralize the
polymer RX24 and were then water reduced according to the method described in the
publications in this dissertation.
Particle size was measured for all three CUP solutions, and then the solutions
were roto allowed to dry then crushed into a powder. The powders were re-dissolved de-
ionized water and then particle size was measured again. The particle size of the re-
dissolved CUPs was compared to the original CUP solutions.

81
2.2. EXPERIMENTAL
2.2.1 Materials. Methyl methacrylate (MMA), methacrylic acid (MAA), 2,2′-
azobis(2-methylpropionitrile) (AIBN), and 1-dodecanethiol were purchased from
Aldrich. MMA was purified by washing with a 10% (w/w) solution of sodium
bicarbonate, followed by rinsing with de-ionized water, and brine. The product was
dried over sodium sulfate and filtered. Copper (I) bromide was added to the MMA as an
inhibitor, and simple distillation under nitrogen was carried out. MAA was purified by
distillation with copper (I) bromide under reduced pressure. AIBN was re-crystallized
from methanol, and 1-dodecanethiol was used as received. Deionized water was used for
all experiments.
2.2.2 Polymerization. Polymerization was by free radical mechanism and carried
out in methyl ethyl ketone (MEK), with 1-dodecanethiol as the chain transfer agent, 2-2'-
Azoisobutyronitrile (AIBN) as the initiator. The reaction was carried out under nitrogen
at the reflux temperature if MEK for 36 hours. The solution was then cooled and
precipitated in cold de-ionized water under shear. The polymer was then dried reduced
pressure.
2.2.3 Gel Permeation Chromatography. The absolute molecular weight of the
copolymers was measured using gel permeation chromatography by using a Viscotek
model 305 instrument manufactured by Malvern Corp. The flow rate of THF was 0.5
mL/min, and the injection volume was 100 μL. The GPC was equipped with refractive
index detector, low and right angle light scattering detector, and intrinsic viscosity
detector, thus yielding absolute molecular weight.

82
2.2.4 Acid Number. Acid number (AN) was measured by the titration method
found in ASTM D 974; modified by using potassium hydrogen phthalate (KHP) in place
of hydrochloric acid, and phenolphthalein in place of methyl orange. The titration was
performed in tetrahydrofuran as the solvent.
2.2.5 Water Reduction. Polymers were dissolved in THF (10% w/w) and stirred
overnight. Sodium hydroxide was added to neutralize the acid groups according to the
acid number. To the solution was added an equal amount of water (pH = 8.5−9 adjusted
by GROUP1OH) to THF via a peristaltic pump at a rate of 1.24g/min, and the pH of
solution was maintained between 8.5 and 9. THF was then stripped in vacuo. Solutions
were then filtered through 0.45 μm Millipore membrane to remove any foreign materials
which were typically measured to be less than 0.05% by weight.
2.3.RESULTS AND DISCUSSION
2.3.1 Water Reduction. To ensure complete ionization of the polymer
chains, a pH of 8.5 is needed. Deionized water was boiled for one hour to remove any
dissolved CO2 , then solutions were made beginning with a 1M solution of LiOH, NaOH,
and KOH. The Molarity was determined by titration method standardized with KHP.
Further dilutions were then made to achieve 0.1 Molar solutions.
These solutions were then used during the water reduction process. The pH was
monitored during the reduction process, to ensure the solutions remained alkaline during
the process.
2.3.2 Particle Size Measurements. After the water reduction process, all solutions
were then filtered with a 0.45 micron filter to remove any extraneous trace contaminants.
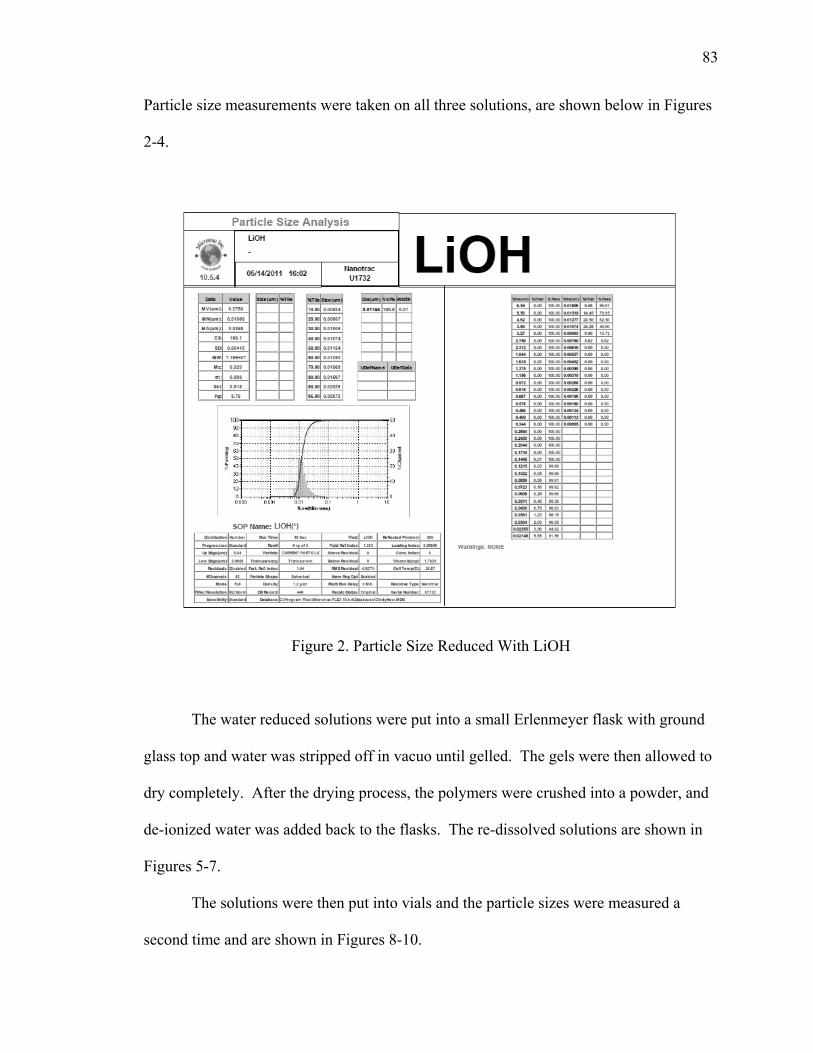
83
Particle size measurements were taken on all three solutions, are shown below in Figures
2-4.
Figure 2. Particle Size Reduced With LiOH
The water reduced solutions were put into a small Erlenmeyer flask with ground
glass top and water was stripped off in vacuo until gelled. The gels were then allowed to
dry completely. After the drying process, the polymers were crushed into a powder, and
de-ionized water was added back to the flasks. The re-dissolved solutions are shown in
Figures 5-7.
The solutions were then put into vials and the particle sizes were measured a
second time and are shown in Figures 8-10.

84
Figure 3. Particle Size Reduced With NaOH
Of the three different counter ions, the CUP containing potassium counter ion
showed a better ability to be dried and re-dissolved. The sample showed more clarity than
the sodium and lithium.
The lithium showed the presence of coagulum and during the water reduction
process required addition base to be added due to a drift in the pH.
Lithium is the smallest cation of the group of bases used, and is therefore more ‘hard’
than the other two. The Li+-OH bond is held tighter. For KOH the K+ atom is larger than
the other two, and ionizes more readily. The CUP that was neutralized with LiOH also

85
was the most unstable during the water reduction process requiring multiple additions of
LiOH to the solution to maintain alkalinity.
Figure 4. Particle Size Reduced With KOH
2.3.3 Conclusions. The ability of the CUPs to be dried and re-dissolved while
maintaining their integrity was an important discovery. If the CUPs were to be scaled up
in a production environment, being in a powder form would be ideal. The dried CUPs
are more lightweight and take up less volume than the suspended form. Another
consideration is the inherent nature of water to allow organisms to grow.

86
Figure 5. Re-dissolved CUP with Li
Figure 6. Re-dissolved CUP with Na

87
3. CONCLUSIONS
The CUP particles described in this research are an important new technology for
the coatings industry, and polymer science. The polymers are synthesized by free radical
mechanism and the diameters of the collapsed particles can be controlled by the
molecular weight.
In the coatings industry, waterborne resins, colorant dispersions and additives
typically have a biocide package added to them. Biocides are heavily regulated and the
levels vary from region to region globally.
Figure 7. Re-dissolved CUP with K
Two very significant discoveries were made, first that the density of the
bulk dry polymer was the same as that of the CUPs suspended in aqueous media. This
was shown through DSC and NMR on both the dry polymer and the CUP solutions.
Secondly, evidence of the behavior of the CUPs to be similar to micelles was found. The

88
ability of the CUPs to be crosslinked with nucleophilic species showed that the reactive
carboxylate groups were oriented in the water phase, and through 19FNMR relaxation it
was shown that the hydrophobic groups resided in the particle interior.
Figure 8. Particle Size Re-dissolved LiOH
These findings will allow more diversity in synthesizing CUPs for more specific
purposes. The carboxylate groups give more functionality to the surface allowing further
reactions to occur, or a hydrophobic moiety can be safely kept in the interior of the
particle.

89
On a commercial scale, the CUPs could be synthesized and sold as powders,
while still maintaining a low particle size when dissolved. The benefit of powdered
CUPs vs in solution is that the powder is more lightweight and easier to store. The
solutions only have a finite time before organisms begin grow in the water requiring
biocides to be added.
Figure 9. Particle Size Re-dissolved NaOH

90
Figure 10. Particle Size Re-dissolved KOH
REFERENCE
1. Pearson, R. J. Chem. Educ. 45 (9), 1968, pgs. 581-587.
91
VITA
Cynthia Jeannette Riddles was born May 17, 1965 in Toledo Ohio. Cynthia
began her college education as a single parent of two children in 1999 and obtained her
Bachelor’s degree in Chemistry in May of 2005 from Southwest Baptist University in
Bolivar, Missouri. She was the recipient of the Raymond A. Reed and Margaret H. Houk
Scholarships. Cynthia began her PhD studies at Missouri University of Science and
Technology in the fall of 2005. During the course of her work she received the
Outstanding Graduate Teaching award. Cynthia finished her PhD in December, 2015,
although she left the university and was employed as a Product Development Specialist
in the R&D department at Chromaflo Technologies in Ashtabula Ohio.