the systems engineering tool box - burge hughes … systems engineering tool box ... as the diagram...
TRANSCRIPT
© Stuart Burge 2011 – Draft Version for comment 1
The Systems Engineering Tool Box
Dr Stuart Burge
“Give us the tools and we will finish the job”
Winston Churchill
Context Diagram (CD)
What is it and what does it do?
A Context Diagram is a component of Functional Modelling that
stands on its own as a valuable tool. It allows a team or an individual
to produce a high-level model of an existing or planned system that
defines the boundary of the system of interest and its interactions with
the critical elements in its environment. A Context Diagram is a
single picture that has the system of interest at the center, with no
details of its interior structure or function, surrounded by those
elements in its environment with which it interacts.
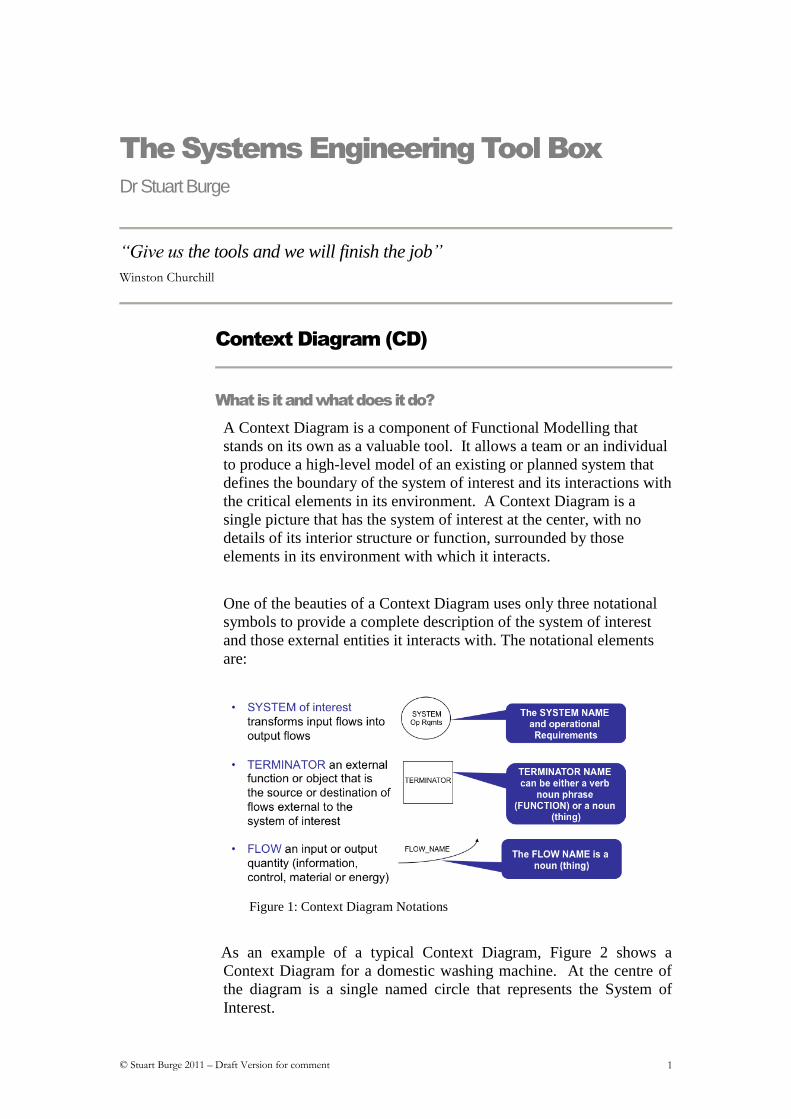
One of the beauties of a Context Diagram uses only three notational
symbols to provide a complete description of the system of interest
and those external entities it interacts with. The notational elements
are:
Figure 1: Context Diagram Notations
As an example of a typical Context Diagram, Figure 2 shows a
Context Diagram for a domestic washing machine. At the centre of
the diagram is a single named circle that represents the System of
Interest.

© Stuart Burge 2011 – Draft Version for comment 2
Figure 2: Context Diagram for a Domestic water-based Washing Machine
The squares outside the circle are the external entities that the system
interacts with. These squares are called “terminators” and can be:
physical objects like the user, organizations like the Support
System
functions like Supply Services
conceptual entities like local environment.
Labelled arrows, called “flows”, capture interactions between the
system and the terminators. A Context Diagram is a simple “birds-
eye” or “helicopter” view of a System of Interest.
Similar outcomes to constructing a Context Diagram can be achieved
using either an Input-Output Diagram or a Use Case Diagram (see
appendix A – but read below first)
Why do it?
There are many reasons for constructing a Context Diagram. A Context
Diagram can:
help define and agree the scope or boundary of the system of
interest

© Stuart Burge 2011 – Draft Version for comment 3
provide a simple high-level picture of the system of interest. All
systems operate in an environment; failure to pay attention to that
environment will lead to failure.
Help identify the elements in the environment of the system of
interest that it interacts with
Identify and define the external interfaces the System of Interest
logically has to have with the outside world. Most system issues or
problems occur at these interfaces and a Context Diagram
emphasises them and encourages their clear definition
When used within a team context, allows the whole team to share
information and agree at a common understanding
Where and when to use it?
Context Diagrams can be used throughout a systems life cycle, but they
are particularly useful in:
understanding and engineering requirements for a new system.
analysing and existing system
They are, in general, relatively simple to construct and can help scope the
project by defining the boundary of the system. In essence the centre circle
defines the scope the system to be designed or analysed. The external
elements are taken to be out of scope. It therefore provides a simple
understandable pictorial representation that can be used to obtain and
document agreement about the scope of a project or problem.
The flows on a Context Diagram also provide prompts when engineering
requirements. Each flow on the context diagram has to be “consumed” or
“generated” by the system of interest. By questioning how this is to be
achieved will help uncover the system’s functional requirements.
Who does it?
An individual or a team can construct a Context Diagram. Whether it is
team or individually based depends on the problem being tackled and the
phase of system development.
How to do it?
Constructing a Context Diagram is a relatively simple process. It starts
with a single circle in the centre of a piece of paper, flip chart or, better
still, white board. The circle should be labeled with the system name. It is
also best practice to also write the Operational Requirements1 of the
1 The Operational Requirements of a system state is major purpose (what it fundamentally does) together with the key overarching constraints that define the context. For more information see tools description for the Holistic Requirements Model.

© Stuart Burge 2011 – Draft Version for comment 4
system in the circle to remind the team (or individual) of the system’s
purpose and context.
It is important when starting to construct a Context Diagram that the team
understand the context of the problem, particularly that related to the life-
cycle phase. For any System of Interest it is often possible to construct a
variety of Context Diagrams. Figure 2, for example, shows the washing
machine, installed and washing clothes – its day-to-day job. It is also be
possible to construct a whole life cycle view. The fact we can view any
system from different perspectives is important to recognize when
constructing a Context Diagram. It is essential that the perspective is
defined clearly and everybody in the team is clear what view is being
taken. Some projects may demand that we capture several perspectives. In
such instances, it is recommended to start with the day-to-day operation of
the System of Interest and then consider the other views later.
Figure 3 shows an example of this first step for the day-to-day operation of
a works Cafeteria.
Figure 3: The starting point for drawing a Context Diagram: the System of Interest as a
bubble with its Operational Requirements
The next steps are concerned with identifying and documenting the
terminators that the System of Interest interacts with and identifying and
documenting the interactions between the terminators and System of
Interest. There are two approaches here:
1. One-terminator at a time
In this approach each terminator is considered one at a time. For
example Figure 4 shows Figure 3 with the addition of the
Cafeteria Customer terminator.
Figure 4: Addition of the Cafeteria Customer
© Stuart Burge 2011 – Draft Version for comment 5
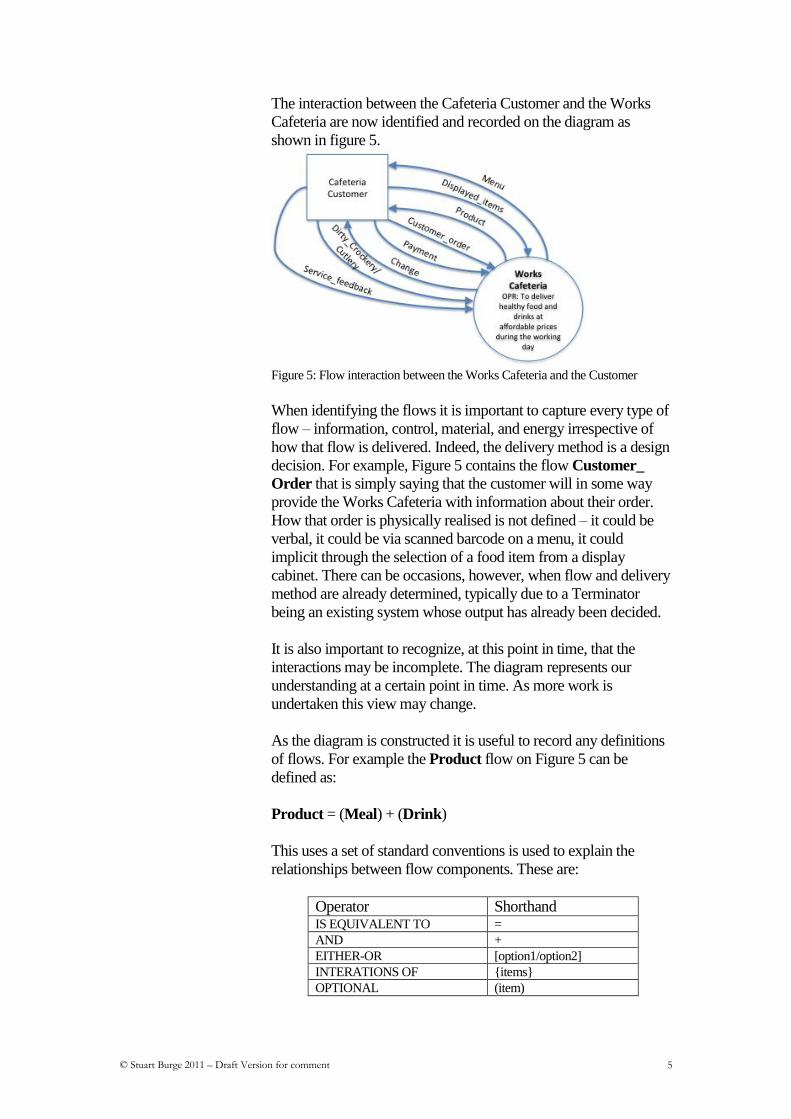
The interaction between the Cafeteria Customer and the Works
Cafeteria are now identified and recorded on the diagram as
shown in figure 5.
Figure 5: Flow interaction between the Works Cafeteria and the Customer
When identifying the flows it is important to capture every type of
flow – information, control, material, and energy irrespective of
how that flow is delivered. Indeed, the delivery method is a design
decision. For example, Figure 5 contains the flow Customer_
Order that is simply saying that the customer will in some way
provide the Works Cafeteria with information about their order.
How that order is physically realised is not defined – it could be
verbal, it could be via scanned barcode on a menu, it could
implicit through the selection of a food item from a display
cabinet. There can be occasions, however, when flow and delivery
method are already determined, typically due to a Terminator
being an existing system whose output has already been decided.
It is also important to recognize, at this point in time, that the
interactions may be incomplete. The diagram represents our
understanding at a certain point in time. As more work is
undertaken this view may change.
As the diagram is constructed it is useful to record any definitions
of flows. For example the Product flow on Figure 5 can be
defined as:
Product = (Meal) + (Drink)
This uses a set of standard conventions is used to explain the
relationships between flow components. These are:
Operator Shorthand IS EQUIVALENT TO =
AND +
EITHER-OR [option1/option2]
INTERATIONS OF {items}
OPTIONAL (item)

© Stuart Burge 2011 – Draft Version for comment 6
Hence the definition of Product above means, the flow called
Product is equivalent to optionally Meal and Optionally Drink.
This is a modelling choice in that it was decided to combine meals
and drinks as a single flow called Product with the intent of
simplifying the model. An equally valid model would have been
to have two separate flows labeled Drink and Meal. As a general
rule, it is always best to simplify where possible, but this does
need a dose of pragmatism in that situations can be over-
simplified.
The next step is to consider another terminator, as shown in figure
6, and its interactions with the System of Interest.
Figure 6: Consideration of the next Terminator
2. All Terminators at once
An alternative approach to “one terminator at a time” is to start by
determining all possible terminators first as shown in Figure 7.

© Stuart Burge 2011 – Draft Version for comment 7
Figure 7: Identify all Possible Terminators first.
Having identified the potential Terminators, each can be
considered in turn to identify the potential flow interactions with
the system of interest. The end result could look like Figure 8.
Figure 8: Context Diagram for the Works Cafeteria
Figure 8 has some interesting features that are a consequence of
modelling decisions. Firstly, notice that the flow Orders is split
and goes to both the Suppliers and Company Systems
Terminators. This is perfectly acceptable as long as it is clear that
the flow is split. The second feature is the flows between
Terminators. Purists would argue that this is not acceptable, but if
aids understanding it is!
Tips for Constructing Context Diagrams
© Stuart Burge 2011 – Draft Version for comment 8
Do consider using white-boards for the early drafting work. The
initial diagram will require several iterations and a white provides
a convenient medium. Furthermore, it is useful if team members
can “sketch” out their ideas to show other team members. If white
boards are not available, flip charts are an alternative, but are less
easy to modify. Software tools are available to capture the
outcome, but, in general they are less useful for constructing
diagrams using a team.
Consider the operational view of the system first. It is possible to
create many different models of any one system (usually based on
phases of the life-cycle of the system). This may well be necessary
at some point, but when initiating a modelling exercise it is best
practice to start with the operational view, i.e. the system has been
designed and installed and consideration is aimed at its day-today
operation.
The initial drafting of a CONTEXT DIAGRAM should consider
every possible or potential flow. This often results in a very
“busy” diagram and there is a tendency to either ignore flows
because they are considered not important. It is preferable to
capture all these flows and rationalise and simplify the diagram
later. Indeed, having captured all the flows the diagram can be
simplified by collecting similar flow together and creating a
collective-name that can be detailed in the Flow Dictionary.
Constructing a Context Diagram may require several “build-
review” iterations. It is unlikely that a fully populated
Context Diagram can be drawn ab initio. Moreover, a fully
populated diagram can only be confidently drawn after
investigation of the lower levels of detail using Function
Flow Diagrams to “find’ all the flows. These 'found' flows
can then be migrated and shown on the top level replacing the
flow labels you started the analysis exercise with.
What Goes Wrong: The limitations of Context Diagrams
A Context Diagram is a very simple but powerful tool for exploring the
environment and boundary of a proposed system or analysing an existing
one. Like ALL modelling methods it has limitations. The following
outline these limitations and where possible propose approaches to
minimise their effect.
Context Diagrams are abstract models that focus on the system’s
functionality. The resulting model is not a physically related
model and may appear to not to reflect current thinking or
practice. Teams, particularly inexperienced teams, try to construct
a set of diagrams that reflect the likely physical manifestation of

© Stuart Burge 2011 – Draft Version for comment 9
the system. This can lead to inconsistencies and difficulty in
capturing all the flows.
Context Diagrams do not readily lend themselves to the
simultaneous capture of multiple modes of operation. Many
systems have several different modes of operation (often due to
dealing with different scenarios). In consequence the result is an
abstract model that is difficult to read or multiple context diagrams
that individually are ephemeral. A good example of this is a
prognostic based support system. The concept of such systems is
that they monitor the operation of the supported system in order
collect and analyse data to predict failures before they occur. This
allows for the supported system to undergo planned preventative
maintenance. Since the maintenance action is planned the actual
supported system downtime can be minimised resulting in a
higher system availability. Such support systems, however, will
never be able to predict all failures and from time to time un-
planned failures will occur. These events by their very random
nature require significant effort and time to return the supported
system back to full operation. Any support system based on this
concept will therefore have manage:
o On-going system monitoring and prognosis of incipient
failures
o Planned maintenance of incipient failures
o Unplanned repairs
These situations effectively represent different modes of operation
since the supported system is in different states – fully working
being monitored, working but awaiting failure and not working. A
Context Diagram of the support system could be drawn for each
state of the supported system. The result would be three partial
Context Diagrams. The alternative is a single but abstract Context
Diagram as shown in Figure 9.

© Stuart Burge 2011 – Draft Version for comment 10
Figure 9: Context Diagram for a Prognostic Support System
In this Context Diagram the Supported System appears both as a terminator,
labelled WORKING SYSTEM and as flows with WORKING_SYSTEM and
FAILED_OR_ABOUT_TO_FAIL_SYSTEM between the support system and
the USER terminator. When the supported system is working it has been
modelled as a terminator interchanging health information and data. However,
when the supported ceases to work (because it has failed or is about to fail) it is
modelled as an input flow to the Support System that will have some internal
functionality to restore the supported system to is full working state. Indeed the
use of the word state is appropriate here since this Context Diagram is capturing
two states that the supported system can be in – working and not working (or
nearly not working). This does make this model hard to read unless it is made
clear in some way that the two states have been deliberately included.
Success Criteria
The following list represents a set of criteria that have been found to be
useful when constructing a Context Diagram.
Team size between 5 and 8
Team constitution covers system life cycle and potential
technology
Use an experience independent facilitator
Plan for a one to two hour session
Draft out Context Diagram on a large whyte board or equivalent.
Be wary of constructing the diagrams directly in software! People
should be encouraged to draw out their understanding – if they are
intimidated by not being able to drive the software they will agree
too readily with a team member view rather than explore their
view.

© Stuart Burge 2011 – Draft Version for comment 11
Show the draft Context Diagram to other interested parties for
verification and validation
© Stuart Burge 2011 – Draft Version for comment 12
Appendix A: Context Diagrams, Use Case Diagrams and
Input-Output Diagrams
When determining the scope of a System of Interest and the
interactions it will have with its environment there are several tools
that can be used:
o Context Diagram
o Use Case Diagram
o Input-Output Diagram
Each of these diagrams provides a simple “birds-eye” view of the System
of Interest; yet individually provide slightly different perspectives. Each
has strengths but also weaknesses and the purpose of this appendix is to
provide a quick overview of these together with an indication where each
tend to be used.
For comparison purposes the example of the Works Cafeteria described
above is used. This is predominantly a service-based system. Other
dominant system types are hardware-based and software-based.
Context Diagram
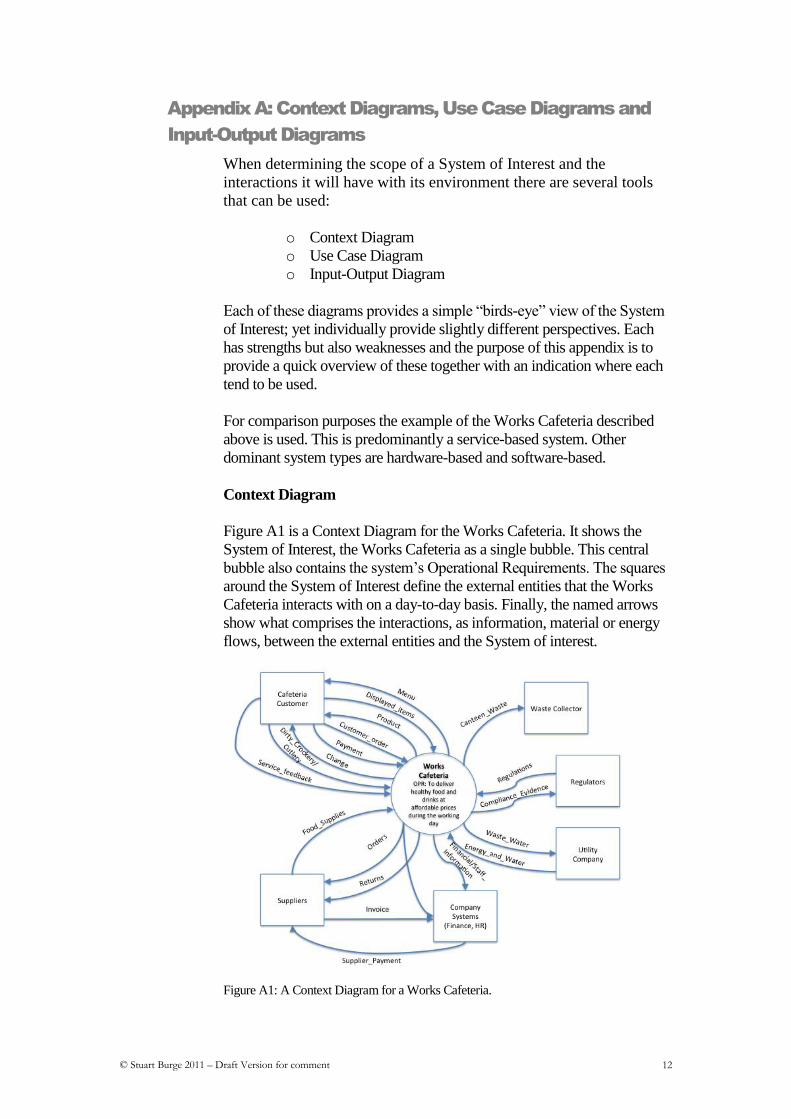
Figure A1 is a Context Diagram for the Works Cafeteria. It shows the
System of Interest, the Works Cafeteria as a single bubble. This central
bubble also contains the system’s Operational Requirements. The squares
around the System of Interest define the external entities that the Works
Cafeteria interacts with on a day-to-day basis. Finally, the named arrows
show what comprises the interactions, as information, material or energy
flows, between the external entities and the System of interest.
Figure A1: A Context Diagram for a Works Cafeteria.

© Stuart Burge 2011 – Draft Version for comment 13
The strengths of a Context Diagram include:
Easy to comprehend
Clear indication of system boundary
Definition of external entities with which the System of Interest
interacts
Identification and documentation of external system interfaces
The weaknesses of a Context Diagram include
No indication of the internal functionality
No timing or order system interaction with its external entities
Limitations in capturing moded systems
Use Case Diagram
Figure A2 shows an equivalent Use Case Diagram for the Works Cafeteria.
Figure A2: A Use Case Diagram for the Works Cafeteria
In a Use Case Diagram, the “box” represents the boundary of the System
of Interest. The “stick men” outside the box are called “actors” and
represent the external entities that the System of Interest interacts with in
some way – these actors will make some “use” of the System of Interest.
The named “bubbles” inside the box are the high-level functions that
capture the various uses the actors have for the system. Accordingly, the
names inside the bubbles must start with a verb. To indicate that an actor
will make use of a particular system function a line is drawn between the

© Stuart Burge 2011 – Draft Version for comment 14
actor and the function. Some people put arrows on the lines, however, care
must be taken in the interpretation of these since they do NOT represent
flows or interfaces as such. It is also usual, if appropriate, to include lines
between functions. This can be particularly useful when following up the
Use Case Diagram with Sequence Diagrams to uncover the lower-level
system functionality.
Figure A2 has been drawn as an equivalent to the Context Diagram given
in figure A1. There is, however, an important difference between Context
Diagrams and Use Case Diagrams that is NOT shown in these two
figures. While Context Diagrams, because of the flows, struggle to show
multiple modes simultaneously, Use Case Diagrams can. This can lead to
a more compact representation – it can also be a source of confusion by
over populating the diagram. Figure A3 shows the extension to figure A2
to capture modes of operation other than the day-to-day running of the
works cafeteria by presenting a “through life” view.
Figure A3: Through Life Use Case Diagram for Works Cafeteria
© Stuart Burge 2011 – Draft Version for comment 15
The strengths of a Use Case Diagram include:
Easy to comprehend
Clear indication of system boundary
Definition of external entities with which the System of Interest
interacts
Identification and documentation of high-level internal system
functionality
Captures moded systems
The weaknesses of a Use Case Diagram include
No clear definition of the system interfaces – but does suggest their
existence
Shows only limited internal connectivity between system functions
No timing or order system interaction with its external entities
Limitations in capturing moded systems
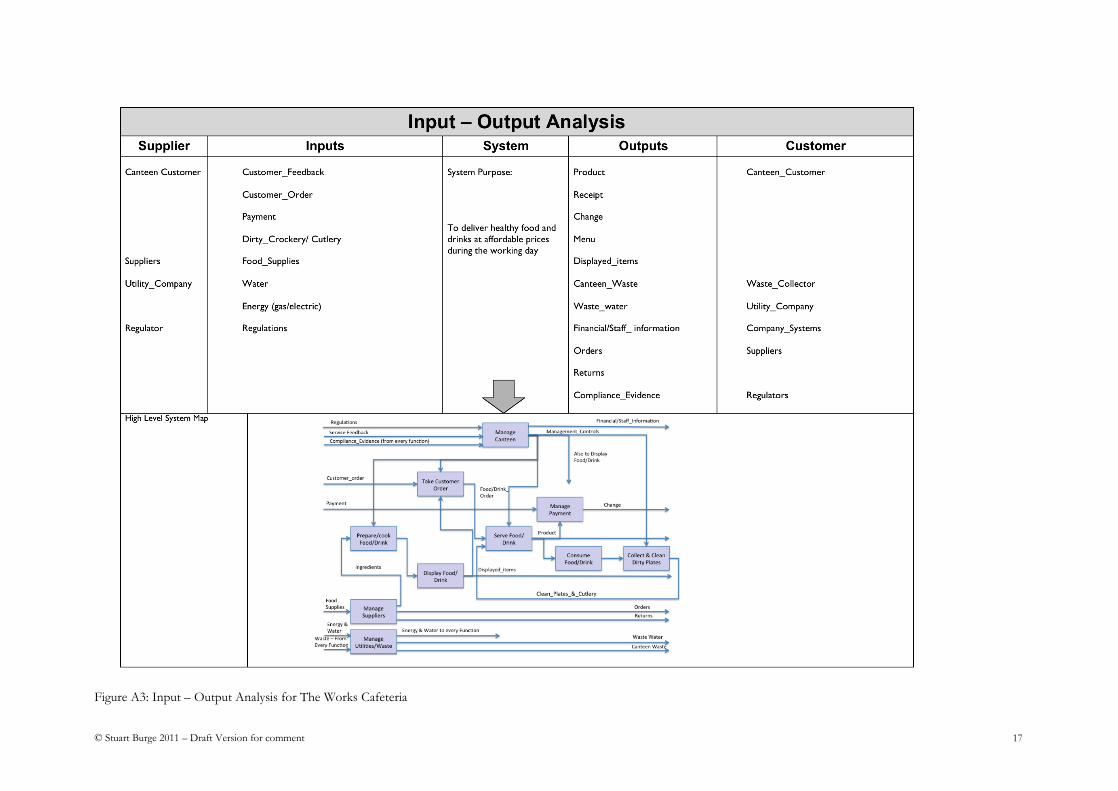
Input-Output Diagram
Figure A3 shows an equivalent Input-Output Diagram for the Works
Cafeteria. The top “half” of the diagram comprises 5 columns that
respectively contain the:
Supplier: the external entities that provides a particular system
input
Inputs: the inputs to the System of Interest
System: the name and Operational Requirements for the System
of Interest
Output: the outputs from the System of Interest
Customer: the external entities that receive the system outputs
The lower half of the Input-Output Diagram contains a high-level system
map. This diagram shows how the basic functionality has to cooperate in
order the transform the system inputs into the system outputs. The system
map has a time order with time increasing from left to right.
The strengths of an Input-output Diagram include:
Clear indication of system boundary
Definition of external entities with which the System of Interest
interacts
Identification and documentation of external system interfaces
Identification and documentation of high-level internal system
functionality
Connectivity between system functions
Information about the sequencing of the internal functionality

© Stuart Burge 2011 – Draft Version for comment 16
The weaknesses of an Input-Output Diagram include
More difficult to easily comprehend
Limitations in capturing moded systems
General Remarks
Of all the three tools, the Input-Output Diagram is the most
comprehensive. It is for this very reason the more difficult to comprehend.
As the Work Cafeteria example has demonstrated all three can provide
similar information and perform similar tasks. In general, however, we
find that:
Context Diagrams: used in hardware and software intensive
systems
Use Case Diagrams: used in software intensive system
Input-Output Diagrams: used in process intensive systems
If time and resource is available, the very best option is to construct all
three since they each provide a slightly different perspective on a system.
Indeed, in constructing the Works canteen example each tool provided
something the other did not! The final diagrams presented herein are the
result of several iterations.
© Stuart Burge 2011 – Draft Version for comment 17
Figure A3: Input – Output Analysis for The Works Cafeteria