the target population for military recruitment: youth
TRANSCRIPT

FOR OFFICIAL USE ONLY
The Target Population for Military Recruitment: Youth Eligible to Enlist Without a Waiver
September 2016 Defense Advisory Committee on Women in the Services
FOR OFFICIAL USE ONLY
2
Eligibility Standards
Why? The Department establishes standards designed to ensure that individuals under consideration
for enlistment, appointment, or induction are able to perform military duties successfully, and to select those who are the most trainable and adaptable to Service life.
What is considered? Standards considered are: age, aptitude, citizenship, dependents, education, medical,
character/conduct, physical fitness, drug use, and other conditions
Are these standards reviewed on regular basis? Societal norms, medical findings, internal and external analyses of performance, and other
studies help inform the Department in the establishment of these standards. Each area is reviewed by subject matter experts on a regular basis.
What is the “recruitable population”?
DoD policy establishes a minimum baseline from which eligibility is derived. The Services have the latitude to be more restrictive as well as allow waivers for most standards they choose. These Service policies more aptly define the “recruitable population” and the type of youth that each Service seeks.

FOR OFFICIAL USE ONLY
3
Estimating Eligibility: Qualified Military Available (QMA)
What is it? DoD’s official metric estimating the number of youth who are eligible and available for enlisted
military service without a waiver. The basic ingredient of this metric is the size of the population aged 17–24 reduced by the
number who are disqualified for one or more criteria within seven overarching categories: 1) Medical/Physical, 2) Overweight, 3) Mental Health, 4) Drugs, 5) Conduct, 6) Dependents, 7) Aptitude.
When was the metric last examined?
The 2013 QMA Study revised and updated previous QMA estimations by using more recent data to estimate the prevalence of disqualifying conditions and by accounting for the correlations of disqualifying conditions that account for overlap among multiple disqualifiers.
What criteria and rationale were used?
After reviewing the particular guidelines established by DoD Instructions 1304.26, QUALIFICATION STANDARDS FOR ENLISTMENT, APPOINTMENT, AND INDUCTION and 6130.03, MEDICAL STANDARDS FOR APPOINTMENT, ENLISTMENT, OR INDUCTION IN THE MILITARY SERVICES, which govern military entrance eligibility criteria, disqualifying conditions were grouped into seven broad disqualification categories.

FOR OFFICIAL USE ONLY
4
Estimating Eligibility: Qualified Military Available (QMA)
What data sources were used? National Health and Nutrition Examination Survey (NHANES) National Survey on Drug Use and Health (NSDUH) Joint Advertising, Market Research & Studies Youth Poll surveys (JAMRS – YP) Military Entrance Processing Command (MEPCOM) Production Applicants Armed Forces
Qualification Test (AFQT) Score Database Woods & Poole Economics’ Population Estimates 1997 Profile of American Youth (PAY97)
What are the key results?
29% of youth would meet all the core eligibility requirements 17% would qualify and be available for enlisted active duty service 13% would qualify, be available, and score above the 30th percentile on the AFQT
The AFQT score is a composite made of math and verbal tests from the Armed Services Vocational Aptitude Battery (ASVAB)
Scores are normed against a nationally representative sample of 18-23 year olds and reported as percentile scores

FOR OFFICIAL USE ONLY
5
Note: Percentages may not sum due to rounding.
Source: DoD Qualified Military Available (QMA) Study 2013
Qualified Military Available (QMA): 2013 Estimates
Note: Youth ages 17–24
Qualified HSDG I-IIIA 2% Qualified College
Grad I-IV 4% (IV =.3%)
Qualified Non-HSDG I-IIIA & HSDG IIIB
5%
Qualified Non-HSDG IIIB-IV & HSDG IV
6% (IV =3.4%)
Qualified College Enrolled I-IV
12%
Medical DQ Only (Includes Overweight
& Mental Health) 28%
Drugs DQ Only 8% Conduct DQ Only 1%
Dependents DQ Only 2% Aptitude DQ Only
2%
Medical & Drugs 3%
Drugs & Overweight 2%
Med, Drugs & MH 2% Drugs & Conduct 1%
Other Overlapping DQ 23%
Disqualified for Multiple Reasons
31%
(IV = 2%)
QMA: 17%
(5.8 million)
QMA I-IIIB: 13%
(4.4 million)
29% are eligible
to serve (9.6 million)

FOR OFFICIAL USE ONLY
6
Source: DoD Qualified Military Available (QMA) Study 2013. Note: Youth ages 17–24. Percentages may not sum due to rounding.
QMA Disqualification Categories: Unique and Combined Impact
12% of youth are ineligible as a result of dependents. Two percent are ineligible only because of dependents.
only, 8% only, 8%
only, 1% only, 2%
only, 10%
only, 2% only, 2%
+ others, 22% + others, 22%
+ others, 9% + others, 10%
+ others, 21%
+ others, 14%
+ others, 8%
0%
5%
10%
15%
20%
25%
30%
35%
40%
Medical/Physical Drugs Conduct Dependents Overweight Mental Health Aptitude
30% 30%
15%
31%
12% 10% 9%

FOR OFFICIAL USE ONLY
only, 7% only, 10%
only, 2% only, 1%
only, 10%
only, 1% only, 2%
+ others, 21%
+ others, 25%
+ others, 12%
+ others, 8%
+ others, 21%
+ others, 10% + others, 8%
0%
5%
10%
15%
20%
25%
30%
35%
40% Males Only
28%
35%
14%
9%
30%
11% 10%
Medical/Physical Drugs Conduct Dependents Overweight Mental Health Aptitude
QMA Disqualification Categories: Unique and Combined Impact
Source: DoD Qualified Military Available (QMA) Study 2013. Note: Youth ages 17–24. Percentages may not sum due to rounding.
7

FOR OFFICIAL USE ONLY
QMA Disqualification Categories: Unique and Combined Impact
only, 9% only, 6%
only, 1% only, 3%
only, 10%
only, 3% only, 1%
+ others, 24%
+ others, 20%
+ others, 6%
+ others, 12%
+ others, 21%
+ others, 17%
+ others, 7%
0%
5%
10%
15%
20%
25%
30%
35%
40%Females Only
33%
26%
6%
14%
31%
20%
8%
Medical/Physical Drugs Conduct Dependents Overweight Mental Health Aptitude
Source: DoD Qualified Military Available (QMA) Study 2013. Note: Youth ages 17–24. Percentages may not sum due to rounding.
8
FOR OFFICIAL USE ONLY
9
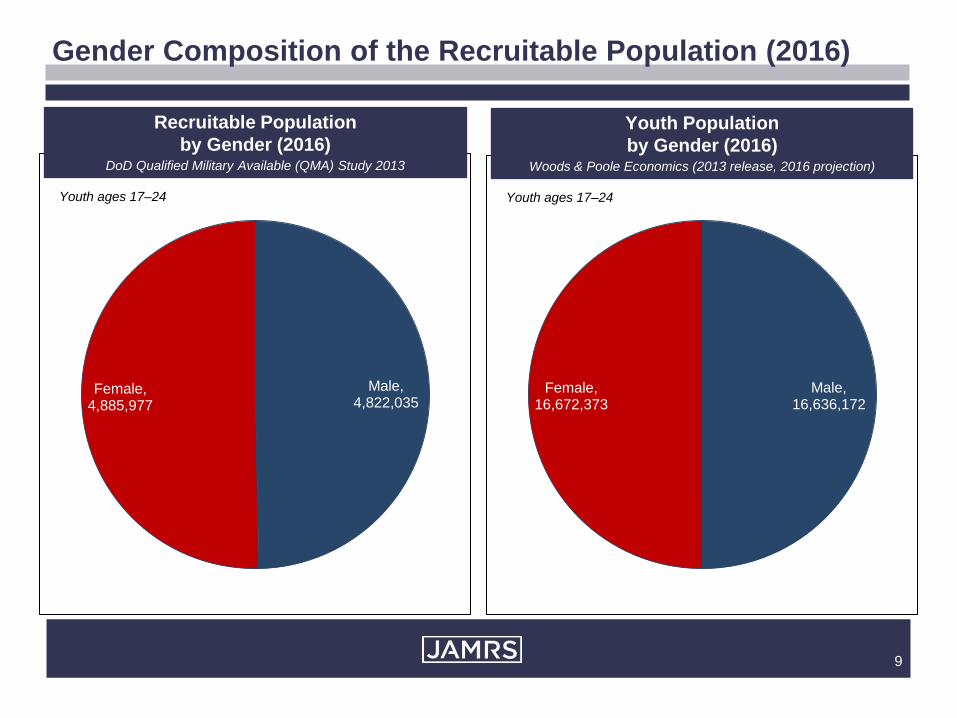
Gender Composition of the Recruitable Population (2016)
Recruitable Population by Gender (2016)
DoD Qualified Military Available (QMA) Study 2013
Youth ages 17–24
Youth Population by Gender (2016)
Woods & Poole Economics (2013 release, 2016 projection)
Youth ages 17–24
Male, 4,822,035
Female, 4,885,977
Male, 16,636,172
Female, 16,672,373

FOR OFFICIAL USE ONLY
10
Projected Recruitable Market
Source: DoD Qualified Military Available (QMA) Study 2013. Woods & Poole Economics (2013), 2010–2030 projections. Note: Youth ages 17–24
23.73 23.88 23.60 23.80 25.31 26.28
4.84 4.78 4.82 4.91 5.24 5.45
4.87 4.78 4.89 5.01 5.35
5.57
-
5
10
15
20
25
30
35
40
2010 2013 2016 2020 2026 2030
Yout
h (in
mill
ions
)
Ineligible Eligible (M) Eligible (F)
29% 29% 29% 29% 29%
30%

FOR OFFICIAL USE ONLY
11
Source: DoD Youth Poll
Eligible Youth: Academic Quality and Career Goals
High Academic Quality (As and Bs in High School)
Youth Ages 17 to 24; Spring 2016
What is the highest level of education you would eventually like to complete?
Youth Ages 17 to 24; Spring 2016 % Responding Probably/Definitely
3% 4% 7% 30%
52%
3% 2% 7% 25%
62%
High schooldiploma
Vocational ortrade school
Associatedegree
Bachelor'sdegree
Master's,doctoral, orprofessional
degree
Male Female
42% 48%
54%
20% 30% 27% 27%
13% 25%
15%
55% 44%
34% 34% 25% 25% 24%
39%
7% 5%
Doctor Smallbusiness
owner
Scientist/engineer Teacher Manager Lawyer Actor/entertainer Nurse Military Officer Enlistedmember
of Miltary
MaleFemale
If you were completely free to choose, how much would you like to have each of these jobs/positions when you are 35 years old?
Youth Ages 17 to 24; Spring 2015: % Responding a lot/Very much Top 8 + Military Jobs
79% 62%
Male Female

FOR OFFICIAL USE ONLY
Appendix
12

FOR OFFICIAL USE ONLY
13
Eligible Female Youth Market: Barriers to Service
Military Self-Efficacy Youth Poll (Fall 2015)
How likely is it that joining the Military would allow you to have an attractive lifestyle?
Youth Poll (Fall 2015)
Reasons Not to Join Youth Poll (Fall 2015)
55%
43%
46%
69%
56%
58%
Possibility of injury/death
Leaving family andfriends
Possibility of PTSD
Female Male
Eligible Youth Ages 17 to 24 % 5-7 Extremely Likely
Eligible Youth Ages 17 to 24
Eligible Youth Ages 17 to 24 How confident are you that you could do each of the following activities % Probably/Definitely Yes
29% 36%
Male Female
Complete Boot Camp Leave Family/Friends Fight in a War
71% 41%
54% 33%
36% 8%
Male Female

FOR OFFICIAL USE ONLY
12% 10% 14%
11%
16%
20%
15% 17%
15% 14%
10% 8%
10% 11%
14%
9%
17%
13% 12% 12% 14% 13% 14% 13%
12%
13%
12%
17%
14%
11%
11% 13%
13%
5%
9%
5% 5% 6%
9% 7%
6% 6% 5% 5% 4% 3%
5%
9% 6% 6% 6% 5% 5%
3%
6% 6% 4%
6% 6% 5% 5% 6% 5% 5% 6% 5%
21% 19%
29%
23% 27% 25%
23% 25% 25%
27%
18% 17%
15%
19% 20% 20%
17%
18%
23% 22% 22% 22%
26%
23% 25%
28%
24% 26%
24% 23% 23%
26%
21%
8% 10%
8% 11% 10% 11% 12%
8% 11% 11%
7% 6% 7%
9%
11% 12%
10% 10% 9% 10%
8%
11% 11% 11%
13%
11%
14%
13% 12% 11%
14% 13%
11%
0%
5%
10%
15%
20%
25%
30%
35%
Male High-Academic-Quality Female High-Academic-Quality
FPP9: How likely is it that you will be serving in the Military in the next few years? Response options: Definitely, Probably, Probably Not, Definitely Not
14 Source: Department of Defense Youth Poll
Significant change from previous poll
General Military Propensity By Academic Quality and Gender
% Definitely/Probably
Note: Youth ages 16–21. Estimates are charted to precise values. Labels are rounded to the nearest whole percent.
One year earlier