the thermodynamic landscape of carbon redox biochemistry · the thermodynamic landscape of carbon...
TRANSCRIPT

The thermodynamic landscape of carbon redox biochemistry
Adrian Jinich1, Benjamin Sanchez-Lengeling1, Haniu Ren1, Joshua E. Goldford 2, Elad Noor3,
Jacob N. Sanders 4, Daniel Segrè2,5, Alán Aspuru-Guzik 1, 6, *
1 Department of Chemistry and Chemical Biology, Harvard University, Cambridge MA, 02138
2 Bioinformatics Program and Biological Design Center, Boston University, Boston, MA 02215
3 Institute of Molecular Systems Biology, ETH Zurich, Auguste-Piccard-Hof 1, 8093 Zürich,
Switzerland
4 Department of Chemistry and Biochemistry, University of California, Los Angeles, CA, 90095
5 Department of Biology, Department of Biomedical Engineering, Department of Physics,
Boston University, Boston, MA 02215
6 Senior Fellow, Canadian Institute for Advanced Research, Toronto, Ontario M5G 1Z8, Canada
* Corresponding Author: Prof. Alán Aspuru-Guzik, Department of Chemistry and Chemical
Biology, Harvard University, 12 Oxford Street, Cambridge, MA 02138. Phone: +1 (617) 384
8188. Email: [email protected]
1
.CC-BY-NC-ND 4.0 International licensepeer-reviewed) is the author/funder. It is made available under aThe copyright holder for this preprint (which was not. http://dx.doi.org/10.1101/245811doi: bioRxiv preprint first posted online Jan. 10, 2018;

Abstract
Redox biochemistry plays a key role in the transduction of chemical energy in all living systems.
Observed redox reactions in metabolic networks represent only a minuscule fraction of the space
of all possible redox reactions. Here we ask what distinguishes observed, natural redox
biochemistry from the space of all possible redox reactions between natural and non-natural
compounds. We generate the set of all possible biochemical redox reactions involving linear
chain molecules with a fixed numbers of carbon atoms. Using cheminformatics and quantum
chemistry tools we analyze the physicochemical and thermodynamic properties of natural and
non-natural compounds and reactions. We find that among all compounds, aldose sugars are the
ones with the highest possible number of connections (reductions and oxidations) to other
molecules. Natural metabolites are significantly enriched in carboxylic acid functional groups
and depleted in carbonyls, and have significantly higher solubilities than non-natural compounds.
Upon constructing a thermodynamic landscape for the full set of reactions as a function of pH
and of steady-state redox cofactor potential, we find that, over this whole range of conditions,
natural metabolites have significantly lower energies than the non-natural compounds. For the
set of 4-carbon compounds, we generate a Pourbaix phase diagram to determine which
metabolites are local energetic minima in the landscape as a function of pH and redox potential.
Our results suggest that, across a set of conditions, succinate and butyrate are local minima and
would thus tend to accumulate at equilibrium. Our work suggests that metabolic compounds
could have been selected for thermodynamic stability, and yields insight into thermodynamic and
design principles governing nature’s metabolic redox reactions.
2
.CC-BY-NC-ND 4.0 International licensepeer-reviewed) is the author/funder. It is made available under aThe copyright holder for this preprint (which was not. http://dx.doi.org/10.1101/245811doi: bioRxiv preprint first posted online Jan. 10, 2018;

Introduction
Redox reaction networks are at the center of energy exchange in biochemical processes. The two
main biogeochemical carbon-based transformations - respiration and photosynthesis - are at heart
oxidative and reductive electron transport processes. In addition to these central respiratory and
photosynthetic electron-transport chains, a very large fraction of catalogued enzymatic reactions
(~40%) are oxidoreductive in nature 1,2.
Thermodynamic and other physicochemical properties impose constraints on the
evolution of metabolism in general and redox biochemistry in particular. A classic case of this is
the expansion of metabolic pathways during the Great Oxygenation Event 3. The rise in
atmospheric oxygen levels resulted in a standard redox potential of ~1.1 eV available from
oxidizing the universal redox cofactor NAD(P)H with molecular oxygen. For instance, as Bloch
and Woodward pointed out, cholesterol biosynthesis - with six of its steps requiring molecular
oxygen - emerged only after the increase in available oxygen 4. Other physicochemical properties
such as hydrophobicity and charge at physiological pH also act as constraints that shape the
evolution of metabolite concentrations 5.
Previous work has uncovered thermodynamic principles and constraints governing
carbon redox biochemistry 6,7. This line of work has focused on the three main types of redox
reactions that change the oxidation state of carbon: reductions of carboxylic acids (-COO) to
carbonyls (-C=O); reduction of carbonyls to alcohols (C-O), and reduction of alcohols to
hydrocarbons (C-C). A first principle is the “rich-get-richer” principle: the more reduced a
carbon functional group is, the higher its redox potential. Thus, alcohol reduction is more
favorable than carbonyl reduction, which in turn is more favorable than carboxylic acid
3
.CC-BY-NC-ND 4.0 International licensepeer-reviewed) is the author/funder. It is made available under aThe copyright holder for this preprint (which was not. http://dx.doi.org/10.1101/245811doi: bioRxiv preprint first posted online Jan. 10, 2018;
reduction. This explains the set of reactions where ATP is invested in carbon fixation pathways,
with all ATP used to drive reductions of carboxylic acid functional groups. Another principle
involves the optimally tuned redox potential of NAD(P). With a value ranging from -370 to -250
mV, it is well matched to reversibly reduce/oxidize the vast of majority of central metabolic
redox half-reactions. In addition, its standard potential is lower than that of the average carbonyl
compound, thus effectively reducing the steady-state concentrations of damage-causing
carbonyls in the cell.
In this work our goal is to contribute to the understanding of thermodynamic and
physicochemical principles governing carbon redox biochemistry. We focus on a question that to
our knowledge has not been systematically or quantitatively addressed in the literature: What
distinguishes the set of observed, natural carbon redox reactions from the null space of all
possible redox reactions? In order to address this, we use a three-pronged approach involving
cheminformatics, quantum chemistry, and pathway thermodynamic modelling techniques. We
generate the networks of all possible redox reactions involving n-carbon linear-chain molecules
and partition these into natural and non-natural reactions and compounds. We find that natural
compounds are significantly enriched for carboxylic acid functional groups and depleted for
carbonyls. Using cheminformatics, we estimate and compare physicochemical properties of
natural and non-natural compounds in the networks. Natural compounds have significantly
higher solubility and lower lipophilicity (as measured by their octanol-water partition
coefficients). Next, using a calibrated quantum chemistry approach, we estimate the transformed
standard reduction potentials (Eo’) of all reactions in the networks. We find that, across a range of
pH and steady state redox cofactor potentials, E(cofactor), thermodynamics favors the
4
.CC-BY-NC-ND 4.0 International licensepeer-reviewed) is the author/funder. It is made available under aThe copyright holder for this preprint (which was not. http://dx.doi.org/10.1101/245811doi: bioRxiv preprint first posted online Jan. 10, 2018;
accumulation of natural metabolites over non-natural compounds, with some interesting
exceptions. We generate a pH/E(cofactor) phase diagram (a Pourbaix diagram 8) to highlight the
molecules with minimal energy as a function of phase space parameters. Our work provides
concrete evidence for the argument that thermodynamic stability guides the natural selection of
metabolic compounds, and yields insight into thermodynamic and design principles governing
nature’s metabolic redox reactions.
Results
In the full linear chain n-carbon molecule redox networks, aldose sugars have the maximal
number of connections.
We generate and study the properties of redox networks of linear chain molecules with
n-carbon atoms (Figure 1), focusing the majority of the analysis on the 4-carbon network. For a
given molecule in a redox network, each of its n carbon atom can be in one of four different
oxidation states: carboxylic acid, carbonyl (ketone or aldehyde), alcohol, and hydrocarbon
(Figure 1a). Molecules in the network are connected by three different types of reduction (or the
reverse oxidation) reactions that change the oxidation state of a single carbon atom: reduction of
a carboxylic acid to a carbonyl; reduction of a carbonyl (either an aldehyde or a ketone) to an
alcohol; and reduction of an alcohol to a hydrocarbon. In order to make the network model
tractable to analysis, we decrease its complexity by not including carbon-carbon bond cleavage
or formation reactions (e.g. carboxylations or decarboxylations), keto-enol tautomerizations,
double-bond formation, intramolecular redox reactions, or different stereoisomers for a fixed
5
.CC-BY-NC-ND 4.0 International licensepeer-reviewed) is the author/funder. It is made available under aThe copyright holder for this preprint (which was not. http://dx.doi.org/10.1101/245811doi: bioRxiv preprint first posted online Jan. 10, 2018;

molecular oxidation state. In what follows, we focus the results and analysis on the properties of
the 4-carbon linear chain molecule redox network.
The 4-carbon network consists of 78 molecules connected by 204 reactions. The
molecules span 11 different molecular oxidation states, from fully oxidized 2,3-dioxosuccinic
acid (a dicarboxylic acid and di-carbonyl) to the fully reduced alkane, butane (Figure 1a). 84
reactions reduce carbonyls to alcohols and the same number reduce alcohols to hydrocarbons.
Since carboxylic acids are restricted to the carbon atoms at the edge of a molecule, only 36
reactions reduce carboxylic acids to aldehydes (Figure 1c).
The number of reactions that connect a single molecule to its oxidized or reduced
products - the degree of a molecule - ranges from 2 to 8 (Figure 1b). Only a single molecule in
the network, the aldose sugar erythrose (and its stereoisomers, e.g threose), has the maximal
degree value of 2n=8, where n is the number of carbon atoms. This holds true for networks with
different number of carbon atoms: only the corresponding aldose sugars in the 2, 3, 5, and 6
carbon networks have the maximum value in the degree distribution (2n). This can be explained
by the fact that aldose sugars satisfy the two constraints required to have a maximal number of
connections in an n-carbon linear chain redox network: 1) Each atom must be in an intermediate
oxidation state that can be both oxidized and reduced. Therefore all “inner” carbon in the
molecule atoms must be in the alcohol oxidation state, while carbon atoms in the edge can be
either in the carbonyl (aldehyde) or alcohol oxidation state; 2) The molecule must not be
symmetric under a 180 degree rotation along its center; thus the two edge atoms must be in
different oxidation states. This leads to the aldose sugar oxidation state configuration.
6
.CC-BY-NC-ND 4.0 International licensepeer-reviewed) is the author/funder. It is made available under aThe copyright holder for this preprint (which was not. http://dx.doi.org/10.1101/245811doi: bioRxiv preprint first posted online Jan. 10, 2018;
Natural compounds are significantly enriched for carboxylic acids, depleted for carbonyls,
and have higher solubilities.
We then asked: what distinguishes molecules in the 4-carbon redox network that are
found in cellular metabolism from the set of non-natural compounds? To explore this question,
we divided the 78 molecules in the network into natural and non-natural categories by
identifying compounds that match metabolites in the KEGG database1,2. We find that 30
molecules in the network match natural compounds while 48 are non-natural (Methods, Figure
2a). Compounds that appear in KEGG with the same oxidation state as a network molecule but
with substituted functional groups were considered a match (see Methods for further details). For
example, the natural metabolites oxaloacetate and aspartate, which have the same oxidation state
at each carbon atom but differ by the substitution of an alcohol into an amine, are both
considered a match to the corresponding molecule in our network. Similarly, we consider
metabolites with phosphate groups instead of alcohols, and those with activated carboxylic acids
(with thioesters or phosphate groups) as matches to network molecules.
We next analyzed the enrichment or depletion of functional groups (oxidation states) in
the natural and nonnatural sets. To do this, we compared the observed number of times that each
functional group appears in the natural metabolites, in comparison to what would be expected by
chance (Methods). Natural metabolites are significantly enriched in carboxylic acids (p<0.001)
while being significantly depleted for ketones (p<0.001) (Figure 2b). After properly normalizing
for the observed single functional group statistics (Methods) we computed the expected of
2-carbon and 3-carbon atom functional group patterns (Figure S1), and find that only the 2-gram
pattern [alcohol-hydrocarbon] is depleted in the natural set, albeit not significantly (p=0.05). All
7
.CC-BY-NC-ND 4.0 International licensepeer-reviewed) is the author/funder. It is made available under aThe copyright holder for this preprint (which was not. http://dx.doi.org/10.1101/245811doi: bioRxiv preprint first posted online Jan. 10, 2018;

other 2-mer patterns, including the low observed number of nearest neighbor dicarbonyls, can be
explained by the single carbon atom functional group statistics.
We also explored whether the observed enrichments and depletions for carboxylic acids
and carbonyls result in different physicochemical properties of the natural and nonnatural sets.
To explore this, we used cheminformatic tools to estimate the values of solubility (logS) and
lipophilicity (as measured by the octanol-water partition coefficient, logP) at pH=7 (Methods).
The enrichment of natural metabolites for carboxylic acid functional groups results in natural
metabolites having significantly higher solubilities at pH = 7 (p<0.005) (Figure 2c). We also find
that the natural metabolites have a significantly lower predicted octanol-water partition
coefficient at pH=7 (p<0.01) (Figure S2).
The thermodynamic landscape of carbon redox biochemistry
We apply a calibrated quantum chemistry strategy to predict the thermodynamics of all
redox reactions in the networks. Briefly (see Methods section for further details), we use density
functional theory (DFT) with a double-hybrid functional9,10 to compute the electronic energy of
several geometry-optimized conformations of the fully protonated state of every compound in
the network. We estimate the standard redox potential Eo (for the fully protonated species) as the
difference in electronic energies of the products and substrates, ΔEelectronic. Using cheminformatic
pKa estimates (Marvin 17.7.0, 2017, ChemAxon) and the Alberty Legendre transform 11,12, we
convert the standard redox potentials to a transformed standard redox potentials E’o(pH), which
is a function of pH. Finally, in order to correct for systematic errors in the quantum chemistry
8
.CC-BY-NC-ND 4.0 International licensepeer-reviewed) is the author/funder. It is made available under aThe copyright holder for this preprint (which was not. http://dx.doi.org/10.1101/245811doi: bioRxiv preprint first posted online Jan. 10, 2018;
model and cheminformatic pKa’s, we calibrate the transformed standard redox potentials
E’o(pH) against a dataset of available experimental data using linear regression.
Our approach achieves significantly better accuracy than the group contribution method
(GCM), the most commonly used approach to estimate thermodynamics of biochemical reactions
(Figure 3) 13–16. The improvement in accuracy depends on the redox reaction category, and is
most apparent for the set of carbonyl to alcohol reductions. By considering only the difference in
group energies, GCM effectively ignores the molecular environment surrounding the
reduced/oxidized carbon atom and its influence on thermodynamics. Thus GCM collapses the
redox potentials of all carbonyl reductions to two values, corresponding to average linear-chain
aldehyde and ketone standard reduction potentials (Figure 3a).
Having estimated the potentials of all reactions, we study the thermodynamic landscape
of the network. We assume that each redox reaction in the network is coupled to a redox cofactor
with a fixed, steady-state, potential, E(cofactor). For instance, such a cofactor potential could
correspond to the potential set by a steady state ratio of NAD/NADH inside the cell 18 or to that
set by a certain concentration of molecular hydrogen in the context of an alkaline hydrothermal
vent 19. With this cofactor potential value, we convert the standard redox potentials of each
reaction into standard Gibbs reaction energies. (Figure 3a, Methods). This allows us to study the
thermodynamic properties of the network across a wide range of cofactor potentials and pH
values.
We find that across a range of cofactor potentials, natural metabolites have on average
significantly lower relative Gibbs energies than the non natural compounds (Figure 4, Figure 5a,
Figure S3). An important exception to the relatively lower energies of the natural compounds is
9
.CC-BY-NC-ND 4.0 International licensepeer-reviewed) is the author/funder. It is made available under aThe copyright holder for this preprint (which was not. http://dx.doi.org/10.1101/245811doi: bioRxiv preprint first posted online Jan. 10, 2018;
the aldose sugar erythrose, the ketose sugar erythrulose, and the sugar alcohol threitol (and all
corresponding stereoisomers), which have a high relative Gibbs energy across a large range of
cofactor potentials.
The thermodynamic landscape reveals that a few metabolites are local energetic minima
of the network as a function of pH and E(cofactor). A molecule is a local minima at a value of
pH and E(cofactor) if its Gibbs energy is lower than all of its neighbors with whom it’s
connected through a reductive or oxidative transformation. Figure 5b shows a Pourbaix phase
diagram representation 8 of these local minima. In a Pourbaix diagram, the lowest energy phase
or state of an electrochemical system is displayed as a function of pH and potential.
At the lower left corner of the diagram, in the region corresponding to more acidic pH
and lower cofactor potentials, the fully reduced 4-carbon alkane butane is the only local (and the
global) minimum in the thermodynamic landscape. This illustrates the fact that more negative
values of the cofactor potential and more acidic pH drive the redox network to an overall reduced
state.
Notably, succinate and the 4-carbon short-chain fatty acid (SCFT) butyrate - two natural
compounds - emerge as additional local minima at relatively more oxidative regions of the phase
diagram (the region containing the values E(cofactor) ~ -300 mV and pH = 7). Both of these
natural compounds chemically consist of “inner” carbon atoms that are in the hydrocarbon
oxidation state, and “edge” carbon atoms in either the fully reduced hydrocarbon or the fully
oxidized carboxylic acid state. Thus, at cofactor potentials around -550 mV and 0 mV,
thermodynamics drives carbon atoms to either the most oxidized (carboxylic acid for edge atoms
or carbonyl for inner atoms) or the most reduced (hydrocarbon) oxidation state (Figure 5c).
10
.CC-BY-NC-ND 4.0 International licensepeer-reviewed) is the author/funder. It is made available under aThe copyright holder for this preprint (which was not. http://dx.doi.org/10.1101/245811doi: bioRxiv preprint first posted online Jan. 10, 2018;
Further increases in either pH or the cofactor potential (Figure 5b) result in the
emergence of additional compounds, both natural and non-natural, as local minima in the energy
landscape. In regions of phase space with increasing values of pH and E(cofactor), the natural
metabolites oxaloacetate, acetoacetate, and alpha-ketobutyrate emerge as local energetic minima.
Finally, in the region of alkaline pH (pH~8) and high cofactor potential (E(cofactor) ~ -50 mV),
the fully oxidized four carbon compound 2,3-dioxosuccinic acid becomes the sole local (global)
minimum in the energy landscape.
Discussion
We generated the set of all possible redox reactions involving linear chain n-carbon
compounds. Analyzing the structure of the resulting redox networks, we found that aldose sugars
- glyceraldehyde (n=3), erythrose (n=4), ribose (n=5), and glucose (n=6), and their
corresponding stereoisomers - are unique in that they have the highest possible number of
oxidative and reductive connections (2n) to neighboring compounds. Thus our analysis reveals
an aspect of the redox network topology that makes these sugar molecules unique. Whether this
maximal number of connections played a role in the emergence of aldose sugars as key players
in metabolism remains to be explored.
Comparing the properties of natural and non natural compounds in the network, we find
that the natural set is significantly enriched for carboxylic acids. This enrichment correlates with
a significantly higher value of solubility (logS) at pH=7. Other benefits of carboxylates for
cellular metabolism potentially include decreasing the permeability across cell membranes,
11
.CC-BY-NC-ND 4.0 International licensepeer-reviewed) is the author/funder. It is made available under aThe copyright holder for this preprint (which was not. http://dx.doi.org/10.1101/245811doi: bioRxiv preprint first posted online Jan. 10, 2018;

which is captured by our predicted octanol-water partition coefficients, logD(pH=7), as well as
potentially enhancing enzyme recognition.
We also find that natural compounds are significantly depleted for carbonyl functional
groups. Carbonyls are significantly more reactive than carboxylic acids or alcohols, and can
cause oxidative damage, spontaneously cross-link proteins, inactivate enzymes and mutagenize
DNA 20. Only one natural compound in the 4-carbon network - diacetyl, which is part of the
diacetyl/acetoin biosynthetic pathway in Lactococcus lactis bacteria 21 - contains a dicarbonyl.
Selection against such dicarbonyls can again be explained by their very high reactivity as well as
potential selectivity problems in the context of enzyme recognition stemming from having two
identical active sites next to each other.
We used a calibrated quantum chemistry approach to predict the transformed standard
redox potentials of all reactions in the network as a function of pH. Importantly, the quantum
chemistry strategy results in significantly better accuracy than the commonly used alternative
biochemical thermodynamics prediction tool, the group contribution method 13,14. In trying to
predict the redox potentials of the type considered here, GCM collapses a wide range of values
into one or two energies. In addition, the fact that the networks studied here contain numerous
non-natural compounds implies that the reactant or component contribution methods 15,16, which
make use of experimentally derived Gibbs formation energies of natural compounds to increase
prediction accuracy, are of no use for many of our reactions.
The quantum chemical thermodynamic data shows that, across a range of pH and
cofactor potential values, natural compounds have on average relatively lower Gibbs energies
12
.CC-BY-NC-ND 4.0 International licensepeer-reviewed) is the author/funder. It is made available under aThe copyright holder for this preprint (which was not. http://dx.doi.org/10.1101/245811doi: bioRxiv preprint first posted online Jan. 10, 2018;

that the set of non-natural molecules. Although our reaction networks is a toy model of redox
biochemistry - albeit a complex one - our analysis provides quantitative evidence that molecules
observed in nature’s metabolic toolbox are on average thermodynamically favored over the
non-natural compounds. Thus our analysis supports the reasonable yet “highly speculative” 22
argument put forward by Bloch that in the context of the origins of life “the thermodynamically
most stable compounds had the best chance to accumulate and survive.”
The resulting thermodynamic landscapes also reveals which compounds - both natural
and non-natural - are energetic local minima as a function of pH and steady state cofactor
potential E(cofactor). We observe that at a relatively reductive range of pH and E(cofactor)
values (e.g. pH = 7, -500 mV < E(cofactor) < -100 mV), the natural metabolites succinate and
butyrate (the 4-carbon fatty acid), are local minima. Regarding the short-chain fatty acid (SCFA)
butyrate (as well as equivalent fatty acids with higher number of carbon atoms), it is tempting to
offer this as evidence that, under redox potentials existing in prominent origins-of-life scenarios
19,23 thermodynamics naturally leads to the accumulation of SCFAs. It is also of significant
interest to note that SCFAs are a prominent bacterial fermentation product of dietary fibers by
gut microbiota 24.
The fact that succinate - a key component of the TCA cycle - is a thermodynamic local
minimum implies that it accumulates at these values of pH and cofactor potential. This is
consistent with the behavior of the TCA cycle under anaerobic conditions 25–27. In such
conditions, the cycle operates as a complete or incomplete fork, with a portion running in the
reductive TCA modality (oxaloacetate sequentially reduced to malate, fumarate, and succinate),
and leading to the accumulation succinate. In contrast, in oxidative conditions, the
13
.CC-BY-NC-ND 4.0 International licensepeer-reviewed) is the author/funder. It is made available under aThe copyright holder for this preprint (which was not. http://dx.doi.org/10.1101/245811doi: bioRxiv preprint first posted online Jan. 10, 2018;

thermodynamic driving force is in the direction of succinate oxidation and oxaloacetate
formation. These two different thermodynamic regimes are captured in our Pourbaix phase
diagram representation, where oxaloacetate appears as a local minimum in oxidative pH,
E(cofactor) regions of phase space.
We also note that succinate, in combination with glycine, is the starting building block
for all porphyrins in one of the two known porphyrin biosynthetic pathways 28. In addition,
acetoacetate appears at as a local minimum at slightly more oxidative conditions. Acetoacetate is
the precursor for the immense set of isoprenoid compounds 29. Thus it is tempting to speculate
that thermodynamics would naturally lead to the accumulation of these important precursor
building-block metabolites.
Our analysis demonstrates that certain compounds that are not part of the KEGG database
(i.e. non-natural) are also local energetic minima at certain pH and cofactor potential values.
Notably, at reductive cofactor potential/pH values, the fully reduced alkane butane is the global
minimum in the energy landscape. Alkane biosynthesis can occur in bacteria 30,31. However, such
pathways involve the reduction of fatty acids to fatty aldehydes, followed by the decarbonylation
of the terminal carbon, resulting in alkanes with one carbon shorter than the original fatty acid.
Alternatively, enzymes referred to as fatty acid acyl-CoA reductases (FARs) can reduce the fatty
aldehydes to fatty alcohols 32,33, and alkanes are known to be a component of the surface waxes
of the alga K. flaccidum 34.
In future work, the network model could be expanded to include other types of
biochemical transformations, such as keto-enol tautomerizations, double-bond formation,
intramolecular redox reactions, or a detailed accounting of the different stereoisomers that
14
.CC-BY-NC-ND 4.0 International licensepeer-reviewed) is the author/funder. It is made available under aThe copyright holder for this preprint (which was not. http://dx.doi.org/10.1101/245811doi: bioRxiv preprint first posted online Jan. 10, 2018;
correspond to a given molecular oxidation state. It would be particularly interesting to include
carboxylation and decarboxylation reactions (both reductive/oxidative and
non-reductive/non-oxidative), which would effectively connect the different n-carbon redox
networks to each other. These would result in more realistic redox networks but in a more
complex analysis. Having said so, we believe that the results presented in this paper will provide
a general guidance for more general models of the redox reaction networks.
Acknowledgements
We thank Arren Bar-Even for fruitful discussions and feedback, and Ron Milo, Manuel
Razo-Mejia, and members of the Aspuru-Guzik lab for comments on the manuscript. The
authors thank Harvard Research Computing for their support on using the Odyssey cluster.
A.A.-G. and A.J. acknowledge support from SEAS^NVIDIA, Massively Parallel Programming
and Computing (332986). J.E.G and D.S. were partially supported by grants from NASA, NSF
and the Human Frontiers Science Program.
Materials and methods :
Generation of full redox networks using RDKit
To generate the reactions, we used the RDKit cheminformatics software to design
SMILES (simplified molecular-input line-entry system)35 reaction templates (reaction strings),
which, when applied to a compound, will reduce it according to the functional groups detected.
Reaction strings were created for the three redox categories of interest: reduction of carboxylic
acids to aldehydes, reduction of ketones to alcohols, and reduction of alcohols to hydrocarbon.
15
.CC-BY-NC-ND 4.0 International licensepeer-reviewed) is the author/funder. It is made available under aThe copyright holder for this preprint (which was not. http://dx.doi.org/10.1101/245811doi: bioRxiv preprint first posted online Jan. 10, 2018;
These templates are designed to be generic enough that they can be applied to any compound
with the target functional group, but also with enough specificity to only generate a reaction
belonging to the correct redox category.
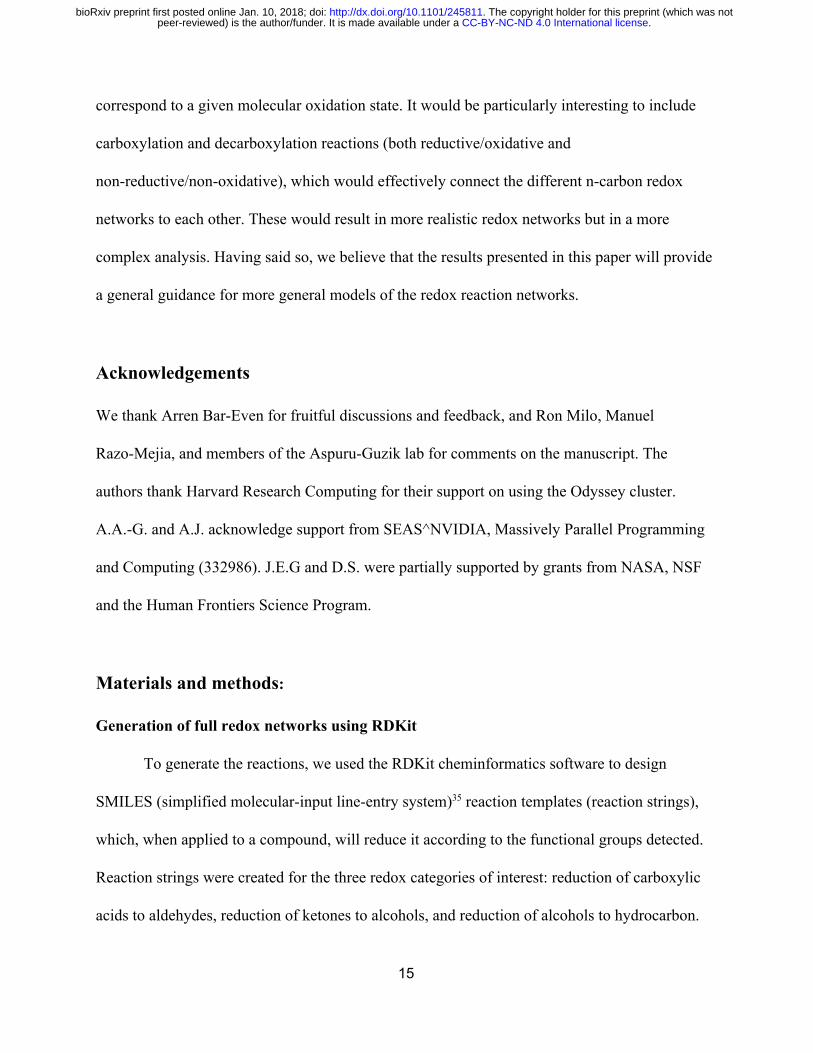
As an illustrative example, we consider the reduction of pyruvate. Pyruvate contains two
types of functional groups that can be reduced: a carboxylic acid and a ketone. The carboxylic
acid can be reduced to an aldehyde, or the ketone can be reduced to a hydroxyl. To accomplish
this we applied the appropriate SMILES reaction strings. The SMILES reaction string used for
the ketone reduction of pyruvate to lactate is shown below. This reaction string can be visualized
as a generic reduction of a ketone to a hydroxyl. The ReactionFromSmarts function in RDkit is
used to generate a reaction object from the reaction string.
The molecular transformation encoded by the SMILES reaction string. The substrate and
compound of each reaction are represented as strings and concatenated into a reaction string as
follows: [#6:1][CX3:2](=O)[#6:3]>>[#6:1][CX4H1:2]([#6:3])[OX2H1]
This reaction object can be applied to any compound with a ketone functional group in
order to reduce it to a hydroxyl. For cases in which the compound contains multiple target
functional groups (e.g. dicarbonyls), every possible product will be generated. To generate the
16
.CC-BY-NC-ND 4.0 International licensepeer-reviewed) is the author/funder. It is made available under aThe copyright holder for this preprint (which was not. http://dx.doi.org/10.1101/245811doi: bioRxiv preprint first posted online Jan. 10, 2018;
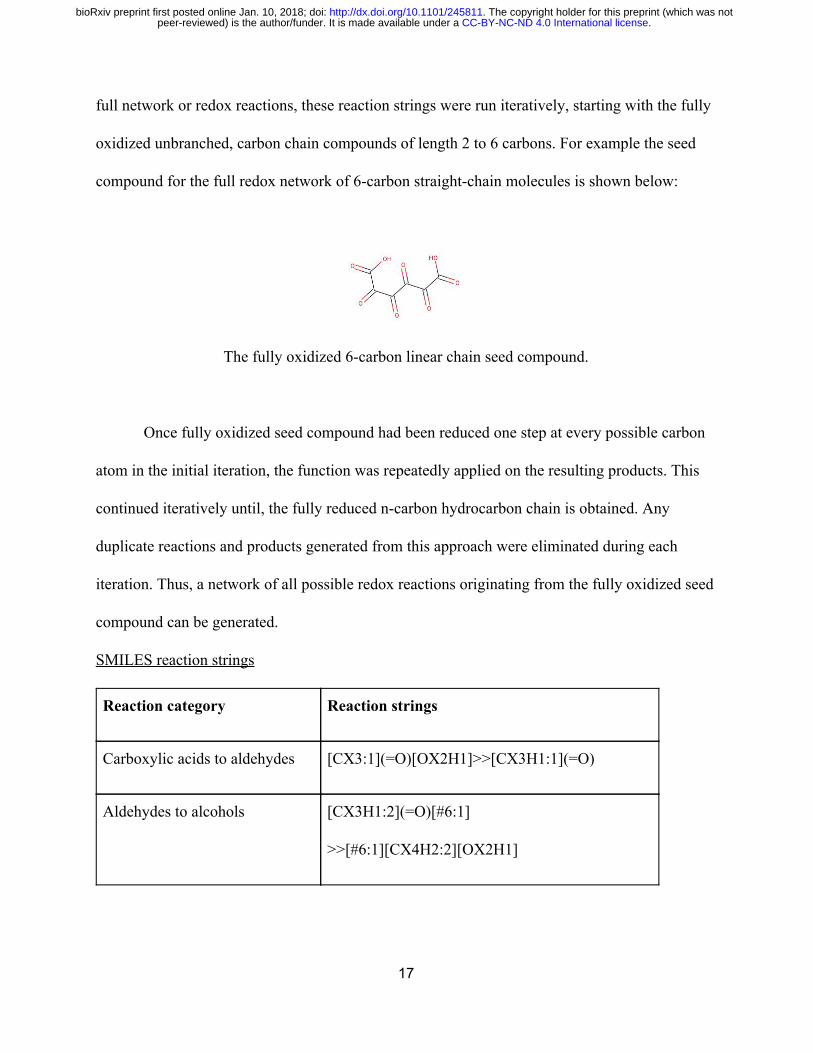
full network or redox reactions, these reaction strings were run iteratively, starting with the fully
oxidized unbranched, carbon chain compounds of length 2 to 6 carbons. For example the seed
compound for the full redox network of 6-carbon straight-chain molecules is shown below:
The fully oxidized 6-carbon linear chain seed compound.
Once fully oxidized seed compound had been reduced one step at every possible carbon
atom in the initial iteration, the function was repeatedly applied on the resulting products. This
continued iteratively until, the fully reduced n-carbon hydrocarbon chain is obtained. Any
duplicate reactions and products generated from this approach were eliminated during each
iteration. Thus, a network of all possible redox reactions originating from the fully oxidized seed
compound can be generated.
SMILES reaction strings
Reaction category Reaction strings
Carboxylic acids to aldehydes [CX3:1](=O)[OX2H1]>>[CX3H1:1](=O)
Aldehydes to alcohols [CX3H1:2](=O)[#6:1]
>>[#6:1][CX4H2:2][OX2H1]
17
.CC-BY-NC-ND 4.0 International licensepeer-reviewed) is the author/funder. It is made available under aThe copyright holder for this preprint (which was not. http://dx.doi.org/10.1101/245811doi: bioRxiv preprint first posted online Jan. 10, 2018;

Ketones to alcohols [#6:1][CX3:2](=O)[#6:3]>>[#6:1][CX4H1:2]([#6:
3])[OX2H1]
Alcohols to hydrocarbons
(middle)
[CX4H2:2][OX2H1]>>[CX4H3:2]
Alcohols to hydrocarbons (edge) [#6:1][#6H1:2]([#6:3])[OX2H1]>>[#6:1][#6H1:2]
[#6:3]
Computing the network degree distributions
The degree of a compound in the redox network is defined as the number of redox
reactions - oxidations and reductions - that connect it to molecules with higher or lower
oxidation state. We used the network analysis library NetworkX36 in Python to compute the
degree distribution of compounds in the full redox networks.
Comparison against KEGG database
In order to classify compounds in the full redox networks as natural or non-natural, we
looked for matches in the KEGG database of metabolic compounds. We did this in several steps.
In order to match natural compounds against the n-carbon network, we filtered out
metabolites in KEGG containing n-carbon atoms. Then, using the RDKit toolbox, we matched
molecules in the networks against KEGG metabolites using their canonicalized smiles string
representation 37. In order to additionally capture KEGG compounds that have alcohol functional
groups substituted by amine or a phosphate functional groups, we visually inspected all
18
.CC-BY-NC-ND 4.0 International licensepeer-reviewed) is the author/funder. It is made available under aThe copyright holder for this preprint (which was not. http://dx.doi.org/10.1101/245811doi: bioRxiv preprint first posted online Jan. 10, 2018;

remaining n-carbon molecules in KEGG. Finally, to capture compounds with carboxylic acids
activated by Coenzyme A, we generated a list of all KEGG compounds with n-carbon atoms plus
a covalently attached Co-A molecule. Manual search of this list led to the final set of natural
metabolites matching compounds in our full redox networks.
Computing the null distribution for the expected number of n-gram (single, pair and
triplet) functional group patterns
Borrowing terminology from natural language processing, we call the set of all possible
sequences of one, two, and three carbon functional groups the set of oxidation state n-grams. The
goal is to count the number of times that each n-gram appears in the set of natural (or non
natural) compounds (where N is the total number of natural compounds), and compare that
against properly generated random sets of compounds (the null distribution).
The analytical null distribution for single functional group patterns (1-grams):
We first note that a given n-gram can appear more than once in a single molecule. For
example, the metabolite succinate has the functional group sequence {carboxylic acid,
hydrocarbon, hydrocarbon, carboxylic acid}. Thus it contains two instances of the {carboxylic
acid, hydrocarbon} 2-gram. In general, a 4-carbon linear-chain compound can have up to 4
instances of a 1-gram, up to 3 instances of a 2-gram, and up to 2 instances of a 3-gram.
Let be the number of molecules in the full redox network with k instances of(k; )n g
1-gram g. For example, is the total number of compounds in the network with a(1; ydroxyl)n h
single hydroxyl functional group. Assume a set of N molecules are randomly sampled without
19
.CC-BY-NC-ND 4.0 International licensepeer-reviewed) is the author/funder. It is made available under aThe copyright holder for this preprint (which was not. http://dx.doi.org/10.1101/245811doi: bioRxiv preprint first posted online Jan. 10, 2018;

replacement from the network. Let be the total number of instances of the 1-gram in this(g)m g
random set. These instances can come from different sampling configurations of molecules,(g)m
each with instances of the 1-gram . We call be the number of molecules in thek g (k; )m g
random sample with instances of the 1-gram .k g
To give a concrete example, assume a random set of size molecules contains 160N = 3
instances of the n-gram g; thus . One of the very many sampling configuration that(g) 6m = 1
can lead to this value of is sampling 17 molecules with zero instances of , 10 molecules(g)m g
with 1 instance of , and 3 molecule with two instances of . Thusg g
(0; ) 7, m(1; ) 0, m(2; )m g = 1 g = 1 g = 3
The total number of instances of the 1-gram in the sample is given by:g
(g) 0 (0; ) (1; ) (2; ) (3; ) 16m = · m g + 1 · m g + 2 · m g + 3 · m g =
Note that the following constraint is satisfied:
(0; ) (1; ) (2; ) (3; ) 0 m g + m g + m g + m g = 3
In order to compute the probability of having instances of the 1-gram , we need(g)m g
to account for all such possible sampling configurations that add up to . The number of(g)m
ways of sampling molecules with instances of is given by . In general,(k; )m g k g ( )n(k;g)m(k;g)
given a sample size and value of for n-gram , the number of all possible samplingN (g)m g
configurations that lead to that value of m(g) is given by:
(m(g), N ) ( )P = ∑
constraints∏
k n(k;g)
m(k;g)
Where the summation is over terms that satisfy the following two constraints:
(g) (0; ) 1 (1; ) (2; ) (3; )m = 0 · m g + · m g + 2 · m g + 3 · m g
20
.CC-BY-NC-ND 4.0 International licensepeer-reviewed) is the author/funder. It is made available under aThe copyright holder for this preprint (which was not. http://dx.doi.org/10.1101/245811doi: bioRxiv preprint first posted online Jan. 10, 2018;
(0; ) (1; ) (2; ) (3; ) N = m g + m g + m g + m g
Normalizing each value of over the sum of all values leads to the probability of(m(g), N )P
observing instances of the 1-gram g in a sample of size , . We numerically(g)m N (m(g), )p N
obtain the value of for and g = {carboxylic acid, carbonyl, hydroxyl,(k; )n g 0, 1, 2, 3, 4k =
and hydrocarbon}. We then numerically compute the value of by obtaining all(m(g), N )P
sampling configurations that satisfy the constraints. We take to be equal to the number naturalN
compounds in the full redox network.
The empirical null distributions for functional group pair and triplet patterns (2- and
3-grams)
Obtaining the proper null distribution for oxidation state pair and triplet patterns (2-grams
and 3-grams) requires accounting for (or normalizing) for the observed single functional group
statistics (1-grams). For example, the 2-gram pattern [carbonyl-carbonyl] seems to appear
infrequently in the natural set of metabolites. Is this due to selection against this specific 2-gram
pattern, or is it simply due to the general depletion of carbonyls (the 1-gram pattern) in the
natural compounds?
In order to address this, one needs to generate random sets of compounds that controlN
for or conserve the 1-gram statistics of the natural set of compounds. We numerically generate
random molecules that conserve 1-gram statistics. In the case of 4-carbon linear chain molecules,
we randomly choose the identity of the functional group at positions by sampling1, , , )n = ( 2 3 4
from a discrete distribution
g / (4N )pg = N
21
.CC-BY-NC-ND 4.0 International licensepeer-reviewed) is the author/funder. It is made available under aThe copyright holder for this preprint (which was not. http://dx.doi.org/10.1101/245811doi: bioRxiv preprint first posted online Jan. 10, 2018;

Where is the number of instances of 1-gram in the natural set, and is the number ofgN g N
molecules in the natural set. Importantly, in order to avoid sampling carboxylic acids in the inner
carbon atoms of a molecule (positions ), we obtain separate functional group and 3n = 2
distributions for the inner and the outer carbon atom positions.
Cheminformatic prediction of solubility (logS)
We used the cheminformatics software ChemAxon (Marvin 17.7.0, 2017, ChemAxon) to
predict the pH-dependent solubility, logS(pH), of natural and non-natural compounds in the full
redox networks. Specifically, we use the calculator plugin cxcalc logs. The cxcalc solubility
calculator is based on a parametrized fragment-based model (the atom-contribution approach) fit
to sets of experimental logS data 38,39.
Predicting standard redox potentials with calibrated quantum chemistry approach
Our method relies on computing the electronic structure and energy of the fully
protonated species of each metabolite. We obtain the smiles string for the fully protonated
species and generate initial geometric conformation (with up to 10 initial conformers per
metabolite) using ChemAxon (Marvin 17.7.0, 2017, ChemAxon).
All quantum chemistry calculations were performed using the Orca quantum chemistry
software 40 version 3.0.3. We first perform a geometry optimization using density functional
theory with the B3LYP functional 41, with Orca’s DefBas-2 basis set, COSMO implicit solvation
42, and D3 dispersion correction 43. We then perform an additional electronic single point energy
(SPE) using the double-hybrid functional B2PLYP 9,10 (with the DefBas-5 Orca basis set,
22
.CC-BY-NC-ND 4.0 International licensepeer-reviewed) is the author/funder. It is made available under aThe copyright holder for this preprint (which was not. http://dx.doi.org/10.1101/245811doi: bioRxiv preprint first posted online Jan. 10, 2018;

COSMO implicit solvation 42, and D3 dispersion correction 43). We note that the model chemistry
selected - the combination of DFT functional, basis set, implicit solvent model, and dispersion
correction for both the geometry optimization and the single point energy - was done based on a
combinatorial exploration of different options.
We Boltzmann average the electronic energies of compounds, and obtain the difference
in electronic energies of products and substrates for all redox reactions in the full redox
networks. Every redox reaction (in the direction of reduction) was balanced by a hydrogen
molecule H2 in the substrate side of the equation. Reductions of carboxylic acids to aldehydes
and reductions of alcohols to hydrocarbons were balanced with a water molecule H2O in the
product side of the equation.
The difference in product and substrate electronic energies is an estimate of the chemical
redox potential for the fully protonated species, Eo(fully protonated species). In order to convert
this chemical potential to the biochemical potential at pH = 7, Eo’(pH=7), we use pKa estimates
from Chemaxon (cxcalc, pKa) and the Alberty Legendre transform.
Our approach relies on several approximations, such as ignoring vibrational enthalpy and
entropy contributions to the formation Gibbs energy of compounds. In order to correct for
systematic in the quantum chemistry methodology and the empirical pKa estimates used, we
calibrate predictions against available experimental data using linear regression.
Predicting standard redox potentials with the group contribution method
The group contribution method relies on a fragment-based decomposition of compounds
into group, each of which is assigned a group energy based on available experimental data 13–16.
23
.CC-BY-NC-ND 4.0 International licensepeer-reviewed) is the author/funder. It is made available under aThe copyright holder for this preprint (which was not. http://dx.doi.org/10.1101/245811doi: bioRxiv preprint first posted online Jan. 10, 2018;
Reaction energy estimates are obtained by taking the difference of the group energy vectors of
products and substrates. We used the group contribution method as implemented by Noor et al. 16
to estimate the redox potentials of the set of linear-chain carbon redox reactions with
experimental values.
Determining statistical significance
For all tests of statistical significance (i.e. differences in solubilities, n-gram counts,
octanol-water partition coefficients, Gibbs energies of natural vs. non-natural compounds) we
performed Welch’s unequal variance t-test, which is an adaptation of Student’s t-test that does
not assume equal variance.
References
1. Kanehisa, M. & Goto, S. KEGG: kyoto encyclopedia of genes and genomes. Nucleic Acids
Res. 28, 27–30 (2000).
2. Kanehisa, M. et al. KEGG for linking genomes to life and the environment. Nucleic Acids
Res. 36, D480–4 (2008).
3. Raymond, J. & Segrè, D. The effect of oxygen on biochemical networks and the evolution
of complex life. Science 311, 1764–1767 (2006).
4. Woodward, R. B. & Bloch, K. THE CYCLIZATION OF SQUALENE IN
CHOLESTEROL SYNTHESIS. J. Am. Chem. Soc. 75, 2023–2024 (1953).
5. Bar-Even, A., Noor, E., Flamholz, A., Buescher, J. M. & Milo, R. Hydrophobicity and
charge shape cellular metabolite concentrations. PLoS Comput. Biol. 7, e1002166 (2011).
24
.CC-BY-NC-ND 4.0 International licensepeer-reviewed) is the author/funder. It is made available under aThe copyright holder for this preprint (which was not. http://dx.doi.org/10.1101/245811doi: bioRxiv preprint first posted online Jan. 10, 2018;
6. Weber, A. L. Chemical constraints governing the origin of metabolism: the thermodynamic
landscape of carbon group transformations under mild aqueous conditions. Orig. Life Evol.
Biosph. 32, 333–357 (2002).
7. Bar-Even, A., Flamholz, A., Noor, E. & Milo, R. Thermodynamic constraints shape the
structure of carbon fixation pathways. Biochim. Biophys. Acta 1817, 1646–1659 (2012).
8. Pourbaix, M. Atlas of Electrochemical Equilibria in Aqueous Solutions. (National
Association of Corrosion Engineers, 1966).
9. Schwabe, T. & Grimme, S. Towards chemical accuracy for the thermodynamics of large
molecules: new hybrid density functionals including non-local correlation effects. Phys.
Chem. Chem. Phys. 8, 4398–4401 (2006).
10. Grimme, S. Semiempirical hybrid density functional with perturbative second-order
correlation. J. Chem. Phys. 124, 034108 (2006).
11. Alberty, R. A. et al. Recommendations for terminology and databases for biochemical
thermodynamics. Biophys. Chem. 155, 89–103 (2011).
12. Alberty, R. A. Thermodynamics of Biochemical Reactions . (John Wiley & Sons, 2005).
13. Jankowski, M. D., Henry, C. S., Broadbelt, L. J. & Hatzimanikatis, V. Group contribution
method for thermodynamic analysis of complex metabolic networks. Biophys. J. 95,
1487–1499 (2008).
14. Noor, E. et al. An integrated open framework for thermodynamics of reactions that
combines accuracy and coverage. Bioinformatics 28, 2037–2044 (2012).
15. Flamholz, A., Noor, E., Bar-Even, A. & Milo, R. eQuilibrator--the biochemical
thermodynamics calculator. Nucleic Acids Res. 40, D770–5 (2012).
25
.CC-BY-NC-ND 4.0 International licensepeer-reviewed) is the author/funder. It is made available under aThe copyright holder for this preprint (which was not. http://dx.doi.org/10.1101/245811doi: bioRxiv preprint first posted online Jan. 10, 2018;

16. Noor, E., Haraldsdóttir, H. S., Milo, R. & Fleming, R. M. T. Consistent estimation of Gibbs
energy using component contributions. PLoS Comput. Biol. 9, e1003098 (2013).
17. Goldberg, R. N., Tewari, Y. B. & Bhat, T. N. Thermodynamics of enzyme-catalyzed
reactions--a database for quantitative biochemistry. Bioinformatics 20, 2874–2877 (2004).
18. Alberty, R. A. Thermodynamics and kinetics of the glyoxylate cycle. Biochemistry 45,
15838–15843 (2006).
19. Martin, W. & Russell, M. J. On the origin of biochemistry at an alkaline hydrothermal vent.
Philos. Trans. R. Soc. Lond. B Biol. Sci. 362, 1887–1925 (2007).
20. Miyata, T., Izuhara, Y., Sakai, H. & Kurokawa, K. Carbonyl stress: increased carbonyl
modification of tissue and cellular proteins in uremia. Perit. Dial. Int. 19 Suppl 2, S58–61
(1999).
21. García-Quintáns, N., Repizo, G., Martín, M., Magni, C. & López, P. Activation of the
diacetyl/acetoin pathway in Lactococcus lactis subsp. lactis bv. diacetylactis CRL264 by
acidic growth. Appl. Environ. Microbiol. 74, 1988–1996 (2008).
22. Bloch, K. Blondes in Venetian Paintings, the Nine-Banded Armadillo, and Other Essays in
Biochemistry. (Yale University Press, 1997).
23. Martin, W., Baross, J., Kelley, D. & Russell, M. J. Hydrothermal vents and the origin of
life. Nat. Rev. Microbiol. 6, 805–814 (2008).
24. Smith, P. M. et al. The microbial metabolites, short-chain fatty acids, regulate colonic Treg
cell homeostasis. Science 341, 569–573 (2013).
25. Watanabe, S. et al. Fumarate reductase activity maintains an energized membrane in
anaerobic Mycobacterium tuberculosis. PLoS Pathog. 7, e1002287 (2011).
26
.CC-BY-NC-ND 4.0 International licensepeer-reviewed) is the author/funder. It is made available under aThe copyright holder for this preprint (which was not. http://dx.doi.org/10.1101/245811doi: bioRxiv preprint first posted online Jan. 10, 2018;

26. Chen, X., Alonso, A. P., Allen, D. K., Reed, J. L. & Shachar-Hill, Y. Synergy between
(13)C-metabolic flux analysis and flux balance analysis for understanding metabolic
adaptation to anaerobiosis in E. coli. Metab. Eng. 13, 38–48 (2011).
27. Hartman, T. et al. Succinate dehydrogenase is the regulator of respiration in Mycobacterium
tuberculosis. PLoS Pathog. 10, e1004510 (2014).
28. Shemin, D. & Russell, C. S. δ-AMINOLEVULINIC ACID, ITS ROLE IN THE
BIOSYNTHESIS OF PORPHYRINS AND PURINES1. J. Am. Chem. Soc. 75, 4873–4874
(1953).
29. Zhou, D. & White, R. H. Early steps of isoprenoid biosynthesis in Escherichia coli.
Biochem. J 273 ( Pt 3), 627–634 (1991).
30. Choi, Y. J. & Lee, S. Y. Microbial production of short-chain alkanes. Nature 502, 571–574
(2013).
31. Harger, M. et al. Expanding the product profile of a microbial alkane biosynthetic pathway.
ACS Synth. Biol. 2, 59–62 (2013).
32. Zheng, Y.-N. et al. Optimization of fatty alcohol biosynthesis pathway for selectively
enhanced production of C12/14 and C16/18 fatty alcohols in engineered Escherichia coli.
Microb. Cell Fact. 11, 65 (2012).
33. Fillet, S. et al. Fatty alcohols production by oleaginous yeast. J. Ind. Microbiol. Biotechnol.
42, 1463–1472 (2015).
34. Kondo, S. et al. Primitive Extracellular Lipid Components on the Surface of the
Charophytic Alga Klebsormidium flaccidum and Their Possible Biosynthetic Pathways as
Deduced from the Genome Sequence. Front. Plant Sci. 7, 952 (2016).
27
.CC-BY-NC-ND 4.0 International licensepeer-reviewed) is the author/funder. It is made available under aThe copyright holder for this preprint (which was not. http://dx.doi.org/10.1101/245811doi: bioRxiv preprint first posted online Jan. 10, 2018;
35. Weininger, D. SMILES, a chemical language and information system. 1. Introduction to
methodology and encoding rules. J. Chem. Inf. Comput. Sci. 28, 31–36 (1988).
36. Aric A. Hagberg. Proceedings of the Python in Science Conference (SciPy): Exploring
Network Structure, Dynamics, and Function using NetworkX. Available at:
http://conference.scipy.org/proceedings/SciPy2008/paper_2/. (Accessed: 19th November
2017)
37. O’Boyle, N. M. Towards a Universal SMILES representation - A standard method to
generate canonical SMILES based on the InChI. J. Cheminform. 4, 22 (2012).
38. Hou, T. J., Xia, K., Zhang, W. & Xu, X. J. ADME evaluation in drug discovery. 4.
Prediction of aqueous solubility based on atom contribution approach. J. Chem. Inf.
Comput. Sci. 44, 266–275 (2004).
39. Shoghi, E., Fuguet, E., Bosch, E. & Ràfols, C. Solubility-pH profiles of some acidic, basic
and amphoteric drugs. Eur. J. Pharm. Sci. 48, 291–300 (2013).
40. Neese, F. The ORCA program system. WIREs Comput Mol Sci 2, 73–78 (2012).
41. Becke, A. D. Density-functional thermochemistry. III. The role of exact exchange. J. Chem.
Phys. 98, 5648–5652 (1993).
42. Klamt, A. & Schüürmann, G. COSMO: a new approach to dielectric screening in solvents
with explicit expressions for the screening energy and its gradient. J. Chem. Soc. Perkin
Trans. 2 0, 799–805 (1993).
43. Grimme, S., Antony, J., Ehrlich, S. & Krieg, H. A consistent and accurate ab initio
parametrization of density functional dispersion correction (DFT-D) for the 94 elements
H-Pu. J. Chem. Phys. 132, 154104 (2010).
28
.CC-BY-NC-ND 4.0 International licensepeer-reviewed) is the author/funder. It is made available under aThe copyright holder for this preprint (which was not. http://dx.doi.org/10.1101/245811doi: bioRxiv preprint first posted online Jan. 10, 2018;

Figure Legends
Figure 1. The structure of linear chain n-carbon full redox networks. a) The network of all
possible 4-carbon linear-chain molecules obtained from the three different two-electron redox
reactions considered: reduction of carboxylic acid to carbonyl, reduction of carbonyl to alcohol,
and reduction of alcohol to hydrocarbon (and corresponding oxidations). Compounds within
each column have the same molecular oxidation state. Carbon atoms are represented as colored
circles, with color corresponding to oxidation state. b) The degree distributions for the 4-, 5-, and
6-carbon linear chain molecules. Aldose sugars are the only compound with the maximal number
of possible reductions and oxidations c) Number of reactions of each of the three redox
categories considered in the 4-, 5-, and 6-carbon redox networks.
Figure 2. Functional group enrichment and depletion, and physicochemical properties of
natural compounds in the 4-carbon linear chain redox network . a) Molecules that match
natural metabolites in the KEGG database. Compounds that only match KEGG metabolites with
one or more alcohol groups substituted by an amine or phosphate are marked in black and red
squares, respectively. b) Enrichment and depletion of functional groups in the natural
compounds. Gray squares correspond to the analytically-derived null distributions for randomly
sampled sets of molecules from the network. See Figure 4.3 for statistical analysis of 2-mer and
3-mer functional group patterns. c) Comparison of predicted aqueous solubility log(S) at pH=7
29
.CC-BY-NC-ND 4.0 International licensepeer-reviewed) is the author/funder. It is made available under aThe copyright holder for this preprint (which was not. http://dx.doi.org/10.1101/245811doi: bioRxiv preprint first posted online Jan. 10, 2018;
for natural and non-natural compounds in the 4-carbon linear-chain redox network. Natural
compounds have significantly higher solubilities than the non-natural set (p < 0.005).
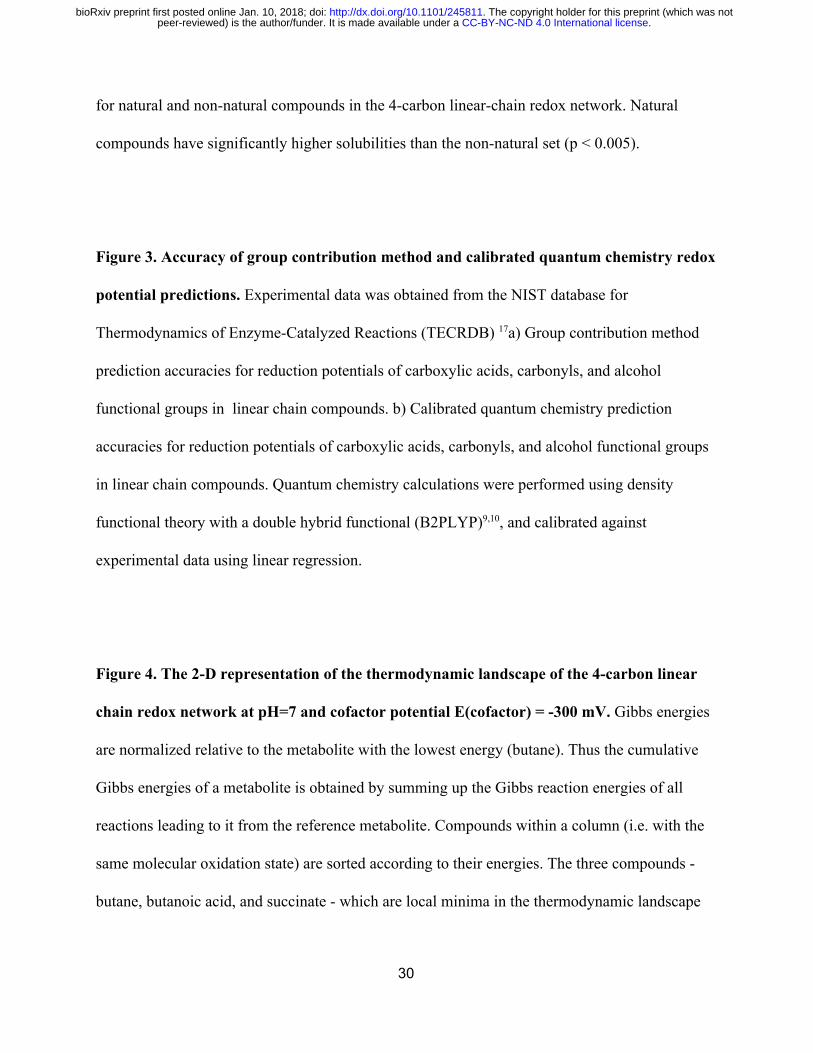
Figure 3. Accuracy of group contribution method and calibrated quantum chemistry redox
potential predictions. Experimental data was obtained from the NIST database for
Thermodynamics of Enzyme-Catalyzed Reactions (TECRDB) 17a) Group contribution method
prediction accuracies for reduction potentials of carboxylic acids, carbonyls, and alcohol
functional groups in linear chain compounds. b) Calibrated quantum chemistry prediction
accuracies for reduction potentials of carboxylic acids, carbonyls, and alcohol functional groups
in linear chain compounds. Quantum chemistry calculations were performed using density
functional theory with a double hybrid functional (B2PLYP)9,10, and calibrated against
experimental data using linear regression.
Figure 4. The 2-D representation of the thermodynamic landscape of the 4-carbon linear
chain redox network at pH=7 and cofactor potential E(cofactor) = -300 mV. Gibbs energies
are normalized relative to the metabolite with the lowest energy (butane). Thus the cumulative
Gibbs energies of a metabolite is obtained by summing up the Gibbs reaction energies of all
reactions leading to it from the reference metabolite. Compounds within a column (i.e. with the
same molecular oxidation state) are sorted according to their energies. The three compounds -
butane, butanoic acid, and succinate - which are local minima in the thermodynamic landscape
30
.CC-BY-NC-ND 4.0 International licensepeer-reviewed) is the author/funder. It is made available under aThe copyright holder for this preprint (which was not. http://dx.doi.org/10.1101/245811doi: bioRxiv preprint first posted online Jan. 10, 2018;

are shown. These local minima have lower energy than any of their neighboring molecules
which are accessible by either a reduction or an oxidation.
Figure 5. The thermodynamic landscape of the 4-carbon linear chain redox network in
pH-E(cofactor) phase space. a) Relative Gibbs energies of natural and non-natural metabolites
for a range of pH and E(cofactor) values. At each value of pH and E(cofactor), Gibbs energies
are normalized relative to the compound with the lowest energy. b) The Pourbaix phase diagram
of the 4-carbon linear chain redox network. Local minima in the energy landscape at each region
of the pH, E(cofactor) phase space are shown. For instance, at low pH and E(cofactor) values,
only butane is a local (global) minimum, while at high pH and E(cofactor) values, only the fully
oxidized 4-carbon molecule is a local (global) minimum. Some non-natural metabolites which
are also local minima in the yellow and green regions are not shown. c) The top panel shows the
standard redox potentials of the three reducible functional groups at pH=7. The bottom panel
shows a schematic representation of the relative functional group Gibbs energies at regions
corresponding to different cofactor potential values.
31
.CC-BY-NC-ND 4.0 International licensepeer-reviewed) is the author/funder. It is made available under aThe copyright holder for this preprint (which was not. http://dx.doi.org/10.1101/245811doi: bioRxiv preprint first posted online Jan. 10, 2018;

Figure 1
32
.CC-BY-NC-ND 4.0 International licensepeer-reviewed) is the author/funder. It is made available under aThe copyright holder for this preprint (which was not. http://dx.doi.org/10.1101/245811doi: bioRxiv preprint first posted online Jan. 10, 2018;
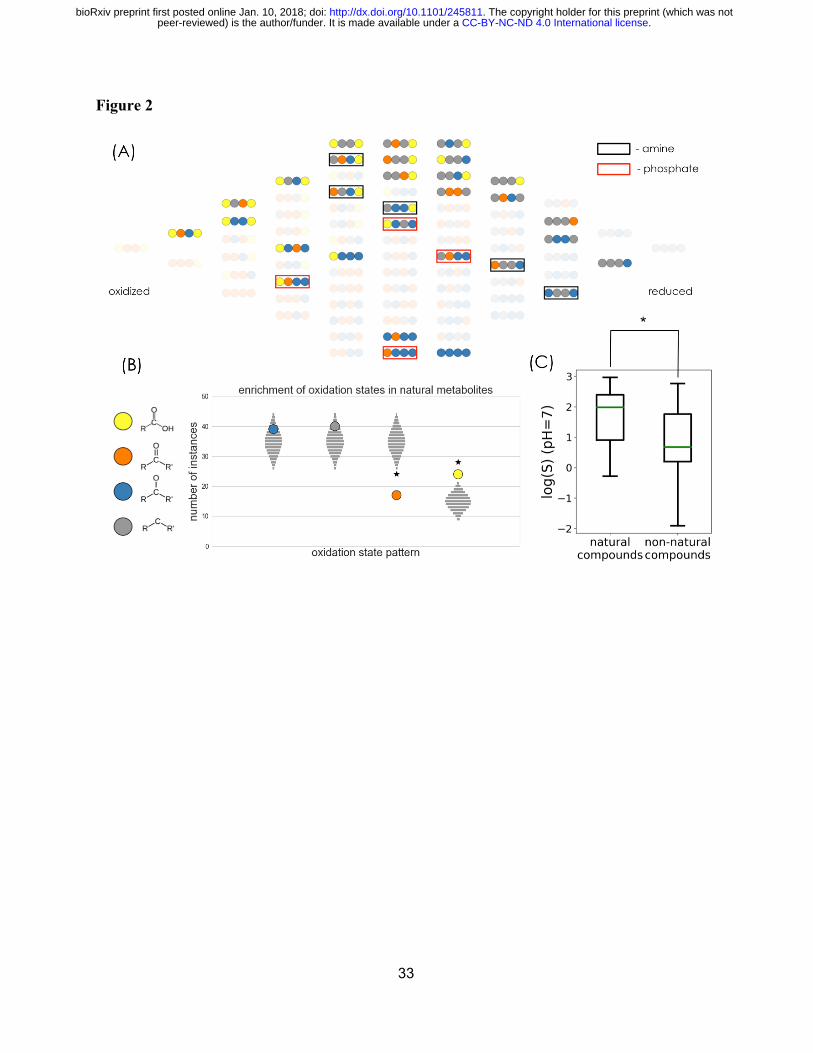
Figure 2
33
.CC-BY-NC-ND 4.0 International licensepeer-reviewed) is the author/funder. It is made available under aThe copyright holder for this preprint (which was not. http://dx.doi.org/10.1101/245811doi: bioRxiv preprint first posted online Jan. 10, 2018;

Figure 3
34
.CC-BY-NC-ND 4.0 International licensepeer-reviewed) is the author/funder. It is made available under aThe copyright holder for this preprint (which was not. http://dx.doi.org/10.1101/245811doi: bioRxiv preprint first posted online Jan. 10, 2018;
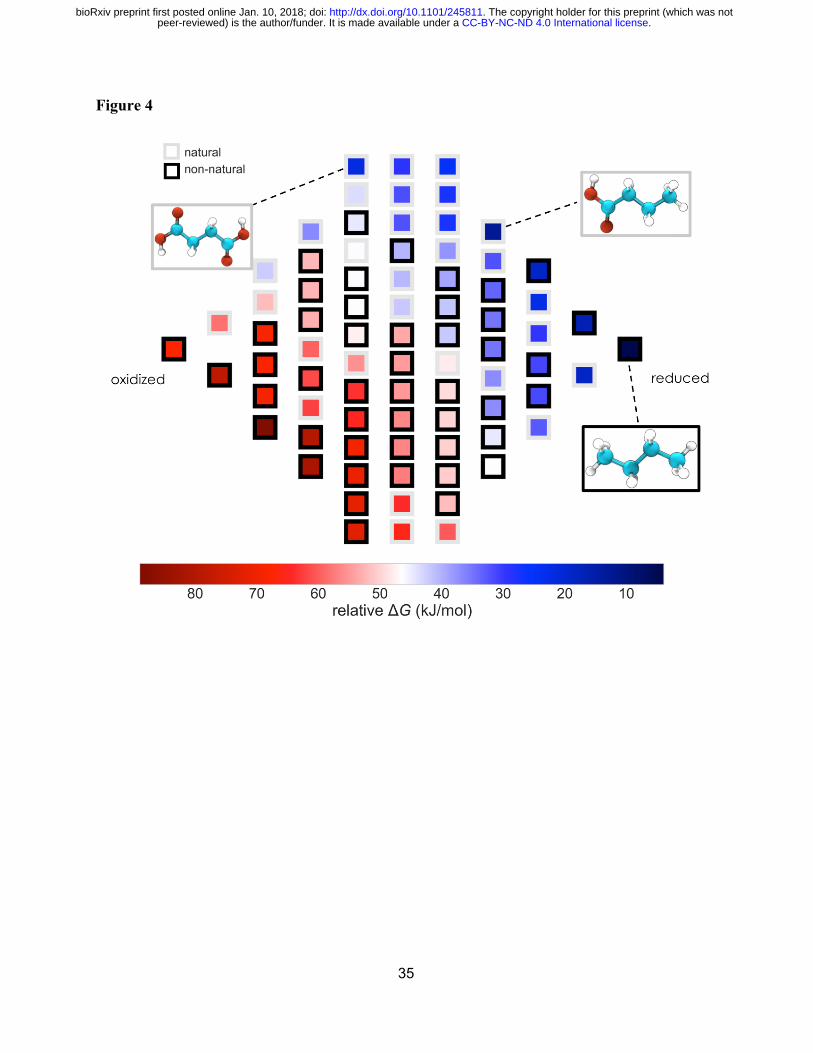
Figure 4
35
.CC-BY-NC-ND 4.0 International licensepeer-reviewed) is the author/funder. It is made available under aThe copyright holder for this preprint (which was not. http://dx.doi.org/10.1101/245811doi: bioRxiv preprint first posted online Jan. 10, 2018;
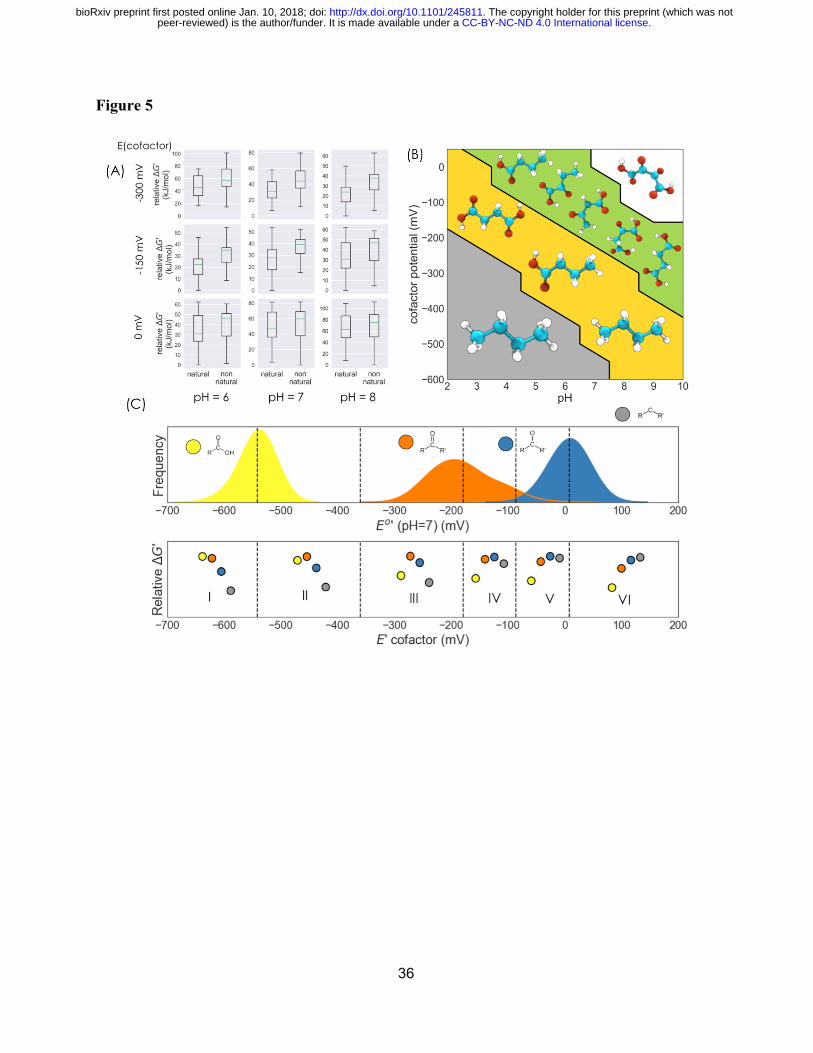
Figure 5
36
.CC-BY-NC-ND 4.0 International licensepeer-reviewed) is the author/funder. It is made available under aThe copyright holder for this preprint (which was not. http://dx.doi.org/10.1101/245811doi: bioRxiv preprint first posted online Jan. 10, 2018;