the three chiefs - td wealth locator...private mortgages: commercial mortgages provide predictable...
TRANSCRIPT

Monthly Perspectives // Autumn 2019
15 minutes
The three chiefs
Beata CaranciSVP and Chief Economist
TD Economics
Brad SimpsonChief Wealth Strategist and Head of PAIR
TD Wealth
Ted WelterChief Investment Officer of Alternatives
TD Asset Management
2
The new standard
These are interesting times for the global economy and financial markets. Many of the indicators that we’ve been using to guide our decision-making don’t seem to be as reliable as they once were. We’re in a world where aggressive stimulus doesn’t lead to heightened inflation. Where historically low unemployment doesn’t foster confidence in the economy. And where bad economic news doesn’t necessarily hinder the markets, so long as it bolsters the argument for a rate cut.
It feels a bit as though the laws of physics have shifted and we’re all disoriented and trying to figure out how to navigate in this new world. So given all that, we thought it was a good time to tie all these pieces together — the economic view, the strategic view, and how innovative investment products can play a role in this environment.
PAIR: We have with us today Chief Economist Beata Caranci, Chief Wealth Strategist Brad Simpson, and Chief Investment Officer of Alternatives Ted Welter. Beata, Ted, Brad, thanks so much for taking the time to talk about this.
Beata, perhaps we can start with you. We’ve been in a low-interest-rate environment for so long now that it’s starting to feel like the new normal. Can you give us a sense of just how unconventional the current monetary environment is?
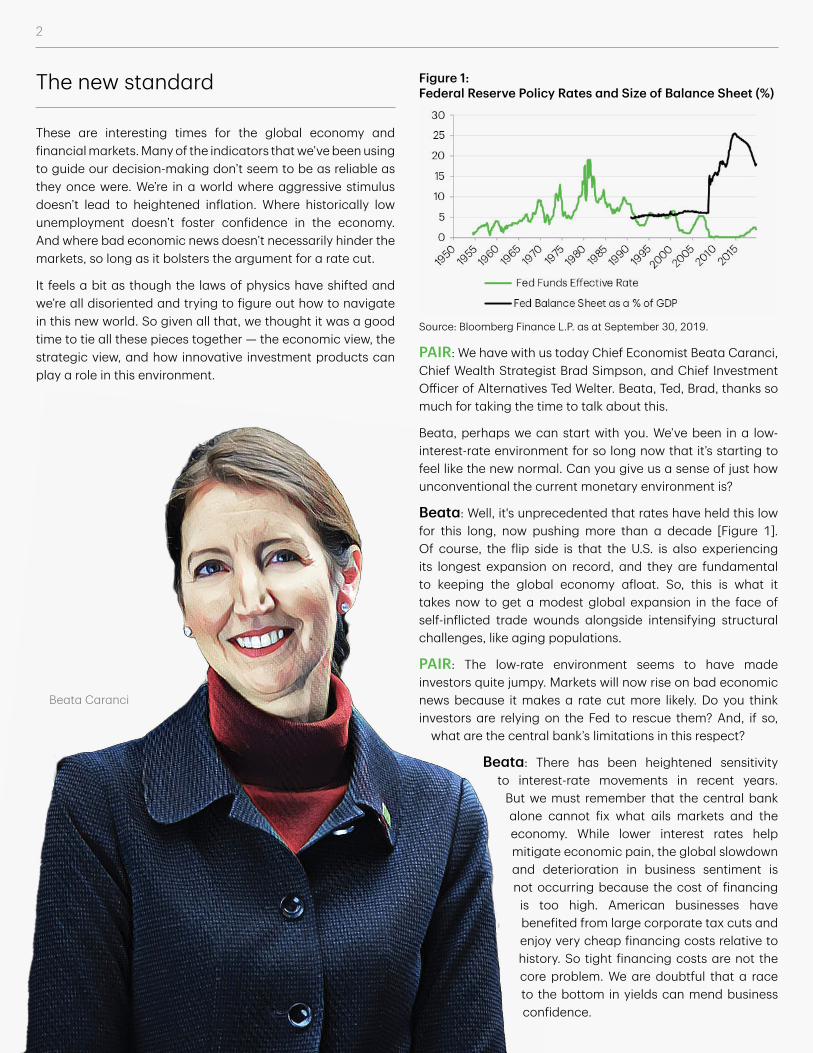
Beata: Well, it's unprecedented that rates have held this low for this long, now pushing more than a decade [Figure 1]. Of course, the flip side is that the U.S. is also experiencing its longest expansion on record, and they are fundamental to keeping the global economy afloat. So, this is what it takes now to get a modest global expansion in the face of self-inflicted trade wounds alongside intensifying structural challenges, like aging populations.
PAIR: The low-rate environment seems to have made investors quite jumpy. Markets will now rise on bad economic news because it makes a rate cut more likely. Do you think investors are relying on the Fed to rescue them? And, if so,
what are the central bank’s limitations in this respect?
Beata: There has been heightened sensitivity to interest-rate movements in recent years.
But we must remember that the central bank alone cannot fix what ails markets and the economy. While lower interest rates help mitigate economic pain, the global slowdown and deterioration in business sentiment is not occurring because the cost of financing
is too high. American businesses have benefited from large corporate tax cuts and enjoy very cheap financing costs relative to history. So tight financing costs are not the core problem. We are doubtful that a race to the bottom in yields can mend business confidence.
Figure 1: Federal Reserve Policy Rates and Size of Balance Sheet (%)
Source: Bloomberg Finance L.P. as at September 30, 2019.
2
Beata Caranci

3
1990-1999 2000-2009 2010-20182019-2028
Midpoint Range
Cash 90-Day T-Bill 6.4% 3.1% 0.8% 2.0% 1.5%-2.5%
Canada 10-Year Government Bond Index 10.1% 6.7% 3.7% 2.5% 2.0%-3.0%
ICE BofAML Canada Corporate Index* 10.6% 6.9% 4.5% 3.5% 3.0%-4.0%
S&P/TSX Composite Index 10.6% 5.6% 5.3% 5.5% 4.0%-7.0%
S&P 500 (US$) 18.2% -0.9% 11.7% 5.5% 4.0%-7.0%
S&P 500 (C$) 20.8% -4.1% 15.1% 5.5% 4.0%-7.0%
MSCI EAFE (US$) 7.0% 1.2% 3.8% 5.5% 4.0%-7.0%
MSCI EAFE (C$) 9.4% -2.0% 6.8% 5.5% 4.0%-7.0%
Income 10.7% 4.9% 4.9% 3.4% 2.6%-4.2%
Balanced 11.3% 3.8% 5.8% 4.0% 3.0%-5.0%
Growth 12.1% 2.2% 7.1% 4.9% 3.6%-6.2%
Source: Bank of Canada, Bloomberg, ICE Bank of America Merrill Lynch, Standard & Poor’s, Toronto Stock Exchange, TD Economics.Asterisks (*): Denotes that data from January 1990-June 1992 was forecasted.
Even consumers are not responding to interest rates like they once did. Our analysis shows that for every 100-basis-point move in mortgage rates, the sensitivity of demand for home purchases is roughly one-quarter of what existed prior to the Great Recession. So lower rates will offer only a modest fillip of growth to housing, provided confidence holds in the market.
PAIR: Brad, I know you’ve often referred to the markets’ relationship with stimulus as a kind of addiction, and you’ve also suggested we’re in the midst of a once-in-a-generation shift for the markets. Over the long term, how will today’s stimulus affect future returns?
Brad: This has been the longest economic expansion in American history, and I think it’s safe to say that monetary policy has been one of the key drivers for financial assets. Stimulus has lifted markets to unprecedented levels, and while central banks tried to normalize rates last year, they were forced to backpedal. Once the Fed does start to normalize rates, though, I would say there’s ample risk on the downside, especially for fixed income. Actually, Beata’s team at TD Economics put out a report earlier this year on long-run market returns that encapsulates this point nicely.
For Canadians investing in the S&P 500, we’ve seen equity returns upwards of 15% between 2010 and 2018. Monetary stimulus had a lot to do with that, and it may have front-loaded returns into this decade while compromising future returns. TD Economics is only forecasting equity returns around 5.5% until 2028 [Figure 2]. Even for traditional balanced portfolios—the so-called stock and bond investments—the forecast isn’t looking so great. These investors have experienced an average return of 5.8% for the past decade or so, but the forecast suggests that returns of 4% for the next decade may be more realistic.
Forecast suggests that returns of 4% for the next decade may be more realistic
We are amidst a generational shift where we can no longer count on ever lower interest rates to drive returns and dampen volatility. This is where the first principle of our philosophy, Risk Priority Management, kicks in: Innovate and look forward, which essentially posits that the key to investment success is the willingness and ability to adapt.
Innovate and look forwardA critical component to investment success is the relentless pursuit of being prepared for what comes next. Grand distortions caused by unorthodox monetary policy in recent years may mean that the era of simply gathering data and using it to calibrate future allocations is over. We believe investors are better served by directing their efforts to what they can control: building a robust portfolio that can weather the inevitable volatility and unknown elements of financial markets.
Risk Priority Management I Principle 1
Figure 2: Long-Term Financial Asset Returns (C$)

4
PAIR: Do you think modern portfolio theory is equipped to deal with this shift? And if not, how must portfolio managers rethink their strategy?
Brad: In some ways, modern portfolio theory is equipped to deal with this shift. Portfolio theory encourages investors to diversify. Over the past decade, we’ve seen record growth in many major risk assets, particularly in the United States, where equities have rallied to record levels. Tech stocks have boomed. Fixed income has soared on the back of record low, and even negative, interest rates. The problem is that, against this backdrop, investors and portfolio managers have thrown risk management and diversification to the wayside.
In other ways, modern portfolio theory has proven itself inadequate. Modern theory, for instance, is predicated on the axiom that greater risk leads to higher returns. But we’re now in a world where the outlook for risk assets has become so depressed and interest rates have gotten so low that cash has become a viable substitute. If this situation persists, investors will have no incentive to hold risk assets. This phenomenon would also have major consequences for the real economy as it undercuts the incentive for business to invest in equipment and fixed capital.
On the flip side, modern portfolio theory is also more relevant now because we are in a market environment where risk and diversification will likely be more significant going forward. Portfolio managers in recent years have not been rewarded for diversification and risk management. But now that risk management is back in favour, investors will be able to distinguish between strong portfolios that apply robust risk management and those that were simply riding on the coattails of the 10-year bull market. So another way to put it is that portfolio managers who are truly active should now be able to prove their mettle.
PAIR: Ted, I guess this is where the idea of alternative investments come in. First off, for the benefit of readers who may not understand the asset category, can you fill us in?
Ted: Of course. Well, historically, you had an income component, which was very reliable and created the foundation of your portfolio return. And then you had equity investments, which had more volatility, and typically they had an income component or dividend and then capital appreciation. And together that gave you a diversified return that hopefully met your investment objectives. But what we started to find out over time is that the ebbs and flows and the volatility of those asset classes could create some challenges.
PAIR: You’re talking about correlated volatility, the old investment truism about how, in times of stress, all correlations go to one.
Ted: That’s right. So what’s come out of that is these private investments in direct assets called “alternatives.” What we’re doing is, we’re providing a thesis of returns that are based
Figure 3: Rolling Period Correlations vs S&P 500
Source: Bloomberg Finance L.P. as at September 30, 2019.
Alternative investments includeThe New Standard includes …
Real Assets: Diversified by region, property type and risk strategy, the real asset category invests in office, retail, industrial and multi-unit residential properties, in addition to property improvement and development activities.
Private Mortgages: Commercial mortgages provide predictable and stable income and principal repayment. This stability derives from the quality of the underlying real estate, the strength, both financial and managerial, of the borrower, and the strength and continuity of rent paid by tenants.
Infrastructure: These asset types (roads, transport terminals, energy facilities, etc.) are subjected to thorough due diligence, including in-depth financial analysis and scenario testing. Risk assessment and careful deal structuring help ensure clients’ interests are protected.
-80%
-60%
-40%-20%
0%
20%40%
60%
80%100%
120%
2002 2004 2006 2008 2010 2012 2014 2016 2018
Global Aggregate
US Agg BondCanada Universe Bond
US Corp Bond
US High Yield
MSCI EAFE
TSX Composite
MSCI EM
Global Infrastructure
Global Real Estate

5
on income and growth. And in the context of TD Greystone, we look at mortgages, real estate and infrastructure—asset classes that are built foundationally on contracted income streams, which provide stability and growth.
In terms of real estate, by way of example, we’re creating homes for companies that are contracting to long-term leases with inflation-adjusted rents, with operating expenses and taxes that are charged to the tenants directly. What we’re building is a diversified income stream that has some growth, and that income stream has a risk-adjusted premium over the “risk-free rate,” or in our world we talk about the risk-adjusted return to fixed income.
PAIR: Okay, but going back to that truism about correlations, wouldn’t that also apply to alternative assets? If the point is to find uncorrelated assets to create diversification, how does the alternative asset category achieve this?
Ted: Alternatives achieve this by investing in different drivers of diversification: by property type, by geography, and then by risk profile. If you look at Vancouver, by way of example, we’ve got an ocean, we have mountains. But what people don’t consider as much is, we’ve got the green belt, the agricultural areas that actually restrict the amount of development and commercial expansion that can happen. So in an area like Vancouver, you’re seeing tremendous vertical densification, and that requires a serious commitment to urbanization and transit as a functional way to operate in that environment.
Then you look at areas like Toronto—massive city with an expansive footprint, but it also has a significant greenbelt
5
that’s governing the expansion and densification of the city. So again, urbanization and transit are critical to the functionality of these cities. So how do we choose and navigate what we invest in? We look for the different diversifiers that are available in the economy and the opportunities that are there.
PAIR: Brad, this sounds like the risk-factor diversification you’ve been talking about. Can you explain how risk-factor diversification differs from simple asset-class diversification, and how alternative investments play into that?
Figure 4: Mitigating outside and inside risks
Risk Factor AllocationOur ApproachRisk Allocation
Fixed Income Risk Illiquidity RiskCurrency RiskAlphaEquity Risk
Source: Portfolio Advice & Investment Research
Brad: When most investors and investment managers think about diversification, they tend to think of it from an asset-class perspective, like 60% equity, 40% bonds. But in the standard 60/40 portfolio, more than 90% of the investors’ risk is coming from equities and less than 10% from bonds. So when you look it from a risk perspective, it’s leaving investors overexposed to equity risk.
The good news is that equity risk is not the only dependable source of return. Long-term performance is also derived
from a number of other risks including equity, fixed income, alpha, currency and illiquidity risk. [Figure 4].
Risk-allocated portfolios look to take advantage of these different risk factors in the pursuit of returns
and for the purposes of risk management. In contrast, traditional asset-allocation portfolios almost exclusively use fixed allocations to bonds to control risk.
Ted Welter

6
True diversification True diversification is the acknowledgement that no singular asset class, risk factor or investor behaviour that can achieve consistent returns.
Asset ClassWe employ a greater spectrum of asset classes including: equity, fixed income, absolute return and private capital.
Risk FactorsAkin to DNA, investment portfolios are composed of numerous risk factors. Equity, alpha, currency, fixed income and illiquidity are the most important and provide a new way to think about portfolio diversification.
BehaviourHow investors make decisions is a key determinant of long-term performance. We are rational, but sometimes we rationalize. We are overconfident with things that are familiar and overcautious with things that are not. We call these behaviours, and many others, “blind spots” and we use discovery tools to help investors make better decisions by better understanding themselves.
Our diversification strategy
The new standard in strategy and implementation
Asset Class
Behaviour Risk Factors
6
Brad SImpson
PAIR: It requires quite a shift in thinking, doesn’t it? People think they know what diversification means, but then you show them other ways to do it.
Brad: It requires a completely new doctrine to guide our investment strategy, a whole new philosophy. At TD Wealth, that philosophy is called Risk Priority Management, or RPM, which incorporates broader asset allocation on the surface and risk-factor diversification below the surface to manage risk while pursuing returns. We believe that this blend of traditional and contemporary thinking is a better way to build and manage portfolios today and going forward.
Practitioners who use risk factors to make decisions about allocation tend to employ a greater spectrum of strategies and mandates, including private capital strategies, both in terms of equity and income, real asset strategies and fixed-income absolute-return strategies. This multi-factor approach is designed to help investors better understand the key sources of long-term returns across asset classes. It also provides investors with a new way to think about portfolio diversification, allowing them to focus not only on diversification across asset classes but also on diversification across the underlying sources of return.

7
0.9% 1.6% 2.4% 3.2%
11.4%
17.7%
0.0%
4.0%
8.0%
12.0%
16.0%
20.0%
Bonds Portfolio with AbsoluteReturn and Real Asset
Strategies
Absolute ReturnStrategies
Real Assets S&P/TSX S&P 500
5.8%6.6%
8.3% 8.9% 9.3%10.1%
0%2%
4%6%8%
10%12%
S&P/TSX Bonds Real Assets Portfolio with AbsoluteReturn and Real Asset
Strategies
Absolute ReturnStrategies
S&P 500
Real assets are an important part of RPM because they provide portfolio diversification in the form of low volatility and attractive risk-adjusted returns. When you compare their performance to other asset classes in terms of return, risk-adjusted return, volatility and correlation to the S&P/TSX, it’s excellent [Figure 5].
Our final consideration in RPM involves something called the Pain Index, which measures the depth, duration and frequency of losses of an investment. The lower the value, the better: a value of 0.0% indicates that an investment has never lost money. In research that we’ve conducted, real assets had the second best score on our Pain Index after Canadian bonds.
This in itself is a big positive, but it is only half the story. One of the key principles of RPM is to innovate and look forward. With interest rates at all-time lows, the future Pain Index scores for Canadian bonds are likely to be very different. This contrasts significantly with real assets, where performance, based on supply and demand, could be considerable as we are moving into an era around the world where governments have a need to renew essential infrastructure. In 2016, McKinsey Global Institute estimated that there would be US$42 trillion spent on infrastructure—projects like ports, airports, rail, water,
telecom, roads and power—over the next 15 years. These past positive return attributes, combined with future prospects, are a big reason why this asset has become so important.
PAIR: Is there any indication that a strategy employing alternatives might actually work? Are there performance forecasts for alternatives compared to other asset classes?
Ted: We have a graph that compares the expected returns and range of outcomes for a variety of asset classes [Figure 6]. These are assumptions, of course, but on the right, we show the alternative asset classes, and on the left are the public indices. Under private real estate debt, for example, you can see a couple of things there: one, the expected return is significantly higher than investment-grade Canadian bonds; but more importantly, the expected range of outcomes does not have a negative return associated with it. Why? Because what these mortgages are based on is a piece of dirt, a building, and an aggregation of covenants and tenants with balance sheets that we’ve investigated. The possibility of that defaulting into negative is extremely hard for us to see. So aggregating these private mortgage assets is a compelling fixed-income additive solution for clients to consider.
Figure 5
HFRI: HFRI Fund Weighted Composite Index (Hedge Fund Index) Portfolio with HFRI consists of a 20% allocation to the S&P/TSX Composite Index TR, 20% S&P 500 TR Index, 40% FTSE TMX Canada Universe TR Index, and 20% HFRI Fund Weighted Composite Index. Bonds consist of an allocation to the FTSE TMX Canada Universe Bond Index. Stocks consist of 50% S&P/TSX Composite Index TR and 50% S&P 500 TR Index. Portfolio without HFRI consists of a 30% allocation to the S&P/TSX Composite Index TR, 30% S&P 500 TR Index and 40% FTSE TMX Canada Universe TR Index. Portfolio with Real Assets consists of a 20% allocation to the S&P/TSX Composite Index TR, 20% S&P 500 TR Index, 40% FTSE TMX Canada Universe TR Index, and 20% Morningstar US Real Asset TR Index. Portfolio with HFRI & Real Assets consists of a 20% allocation to the S&P/TSX Composite Index TR, 20% S&P 500 TR Index, 35% FTSE TMX Canada Universe TR Index, 15% HFRI Fund Weighted Composite Index and 10% Morningstar US Real Asset TR Index. Prior to June, 2000, the Dow Jones US Real Estate Index has been used as a proxy for the Morningstar US Real Asset TR Index. Source: Bloomberg Finance L.P., Morningstar, PIMCO
Annualized Return from 1992 to September 2019
Pain Index from 1992 to September 2019

8
PAIR: So it seems these types of diversification strategies are meant to be defensive. But how defensive do we really need to be? Beata, in your latest U.S. Leading Economic Index, six of eight indicators flashed yellow. Is that cause for concern? Is a U.S. recession over the next year or two inevitable?
Beata: Not inevitable, but what that index tells us is that the growth cushion under the economy just got flatter. Any policy missteps now carry far more risk. Business sentiment and investment are bearing the weight, and we are closely watching for contagion to the broader U.S. and Canadian economies, particularly for any bleed-through to the household sector [Figure 7]. So far, this pattern seems different than what we’ve seen ahead of prior economic downturns, where specific sectors move deep into red territory based on prior excesses.
The Federal Reserve is reading the data and risks the same way, prompting some backstop with 75 basis points
Source: TD Greystone Asset Management. As at Sep. 30, 2018. No assurance that expected range of outcomes will be achieved.
Canadian Long Bonds
High Yield Global Equities
Canadian Equities
Private Real Estate Debt
Canadian Real Estate
Global Real Estate
Global Infrastructure
Canadian Universe Bonds
2.7
6.9
3.25.5 4.4
6.4 5.75.58.0
25%
-15%
-5%
5%
15%
Figure 6: Asset class expected returns (expected range of outcomes)
in rate cuts already. These actions will hopefully provide the necessary support for the economy.
PAIR: You suggested in a paper recently that recessionary indicators like the yield curve inversion may not be as reliable as they once were. Why is that? What’s making these indicators less reliable?
Beata: Yield inversion is unquestionably a good signal that a recession is down the road. But its history is not perfect, and these days the signal may be obscured by unconventional central bank policies. Any recession probability model that contains the yield curve as an explanatory variable will show high odds of a recession when there's a sustained inversion, typically within the 50% to 60% range. But when you switch the focus of recession probability models to those that monitor economic indicators, it causes the recession odds to fall measurably, to within the 20% to 30% range.
Standard Deviations from Normal
1997 1999 2001 2003 2005 2007 2009 2011 2013 2015 2017 2019
TDE Leading Index*
+ 0.4 Standard Deviation
- 0.4 Standard Deviation
- 1.0 Standard Deviation
2
-5
-4
-2
0
1
-1
-3
* Index is comprised of eight leading economic indicators. Readings of 0 are consistent with historical average (1997-present) points in the businesscycle. Readings of -0.4 are typically associated with a "warning" signal, whereas readings of -1.0 are consistent with a recessionary environment. Source: TD Economics
Figure 7: TD Economics Leading Index Indicator Flashing Yellow

9
PAIR: Beyond the monetary policy, there’s also fiscal policy and geopolitical strife and trade turmoil. How much of this global slowdown is attributable to the U.S.-China trade war?
Beata: It’s hard to put a number to it, but the lengthy disruption to trade flows has certainly undermined global growth prospects. Last year, we were predicting global growth of 3.6%. Today, that forecast has been whittled down to 2.9%, the weakest pace in a decade.
The recently announced “Phase One” deal doesn't necessarily remove business and trade uncertainty. The business environment requires assurances on whether past tariffs will be unwound and permanently resolved. Neither seems to be the case with this Phase One trade deal. Also, does this further embolden the U.S. to pivot to Europe? We think the answer is, yes. Can the downcycle in manufacturing that is in motion be quickly halted? Probably not. But beggars can’t be choosy. Some limited progress offers some relief to what had become a one-way trade, even if it seems to fall short on offering broader business transparency on market access, cost structures and the general global outlook
We've been perpetual optimists that the U.S. consumer has strong underpinnings and present a key upside risk to our forecast. Third-quarter spending was up 3%, which came on the heels of an even stronger second quarter. However, if the full force of the tariffs comes to bear on production and market sentiment, our optimism will wane.
PAIR: Brad, you sit on the Wealth Asset Allocation Committee, and I know one of the themes revolves around how long this U.S.-China trade war can be expected to last. Do you think investors are underestimating the significance and duration of the trade war?
Brad: Investors don’t seem to be pricing in a high likelihood of a protracted trade war. Risk assets, and especially U.S. equities, continue to trade near record highs, despite the fear of recession implied by low rates and inverted yield curves. The impact of the trade war has been muted so far, and we’ve had some positive developments in the narrative, with the announcement of a preliminary deal between the U.S. and China, but let’s not get ahead of ourselves here—the U.S. and China haven’t agreed on very much. For all intents and purposes, they’ve agreed to head back to their corners and stop throwing punches at one another while they to try to tackle the difficult issues. So while the immediate U.S.-China trade risks have diminished, and the break between rounds will likely be extended to the December tariff hikes, most of the tough stuff has not been resolved and is not likely to be resolved before the 2020 election. A bigger worry may be whether this trade war is just a precursor to future uncertainty and conflicts between the U.S. and China as the influence of the latter grows at the expense of the former.
PAIR: And there’s still the growing threat of a trade war with the European Union, which as I understand is an even larger trading partner. Beata, what’s the risk of the U.S. engaging in two fronts in this trade war?
0
100
200
300
400
500
600
700
800
900
EU China Canada Mexico Japan
U.S. Exports Imports into the U.S.
Source: Census Bureau, TD Economics
Figure 8: Europe is next, a bigger trading partner than China, US$ Billions in merchandise trade (2018)
Beata: The EU-U.S. trade relationship is larger than that with China [Figure 8]. So, even if a deal emerges in short order with China, the global strain will persist on Europe and other regions. For instance, India also recently came under retaliatory fire from the U.S., and other Asian markets, like Vietnam, have been warned. These are just the actions on countries known at this time. Few businesses and market participants would have anticipated the broad tariff threat placed, and subsequently removed, on Mexico earlier this year in an attempt to address border security issues.
There's also more to come from the U.S. administration on a ruling on auto imports in November under their Section 232 investigation. Japan has struck a trade deal that grants them mercy until April of next year on that decision, but Europe remains in the crosshairs. A collision of U.S. trade conflicts across two continents could be more than business sentiment is able to bear.
Hindsight now shows that the renegotiation of NAFTA was one of the lower trade-hurdles to jump over because there was at least a pre-existing trade pact to build on. The China-U.S. trade war lacks that advantage. As does a potential EU-U.S. trade deal.
PAIR: Ted, how does the current macro environment inform your strategy for alternatives?
Ted: I would say, you know, when you look at the headline numbers in a negative-yield environment, when we look at the global situation, when we look at Trump, all those dynamics, are

10
we going to see the return expectations for these alternatives to come down? Perhaps. And I’m not afraid of that, if that’s the reality of what’s appropriate on a risk-adjusted basis.
What I would say is, as we conduct ourselves in the market, we have to be incredibly cognizant of the risk we’re taking on when we’re buying a less liquid, more physical asset. So what is our growth assumption? Have we measured it correctly? If all this fiscal stimulus fails to provide the outcome that’s expected, and we do see a recessionary environment, how have we assessed the value of those covenants and income streams on the downside?
So it’s a massive open-ended question, and I think I would say, we challenge ourselves from a bottom-up perspective on every asset we consider introducing into the portfolio. Is it worthy on an absolute basis? On a risk-adjusted basis? On an economic basis? On a geopolitical basis? All those things have to be considered to determine whether a particular asset is worthy to come in to the portfolio. And we assess that all the time.
PAIR: And what would you say is the No. 1 risk for alternatives in this volatile and uncertain climate?
Ted: What’s the biggest risk? The risk is when we lead the cycle, when we’re too aggressive, when we overbuild. I started my career as a property manager, and I was in leasing and development, and I had, I think, the good fortune of experiencing the oversupply of the Toronto office market in the late ’80s, early ’90s, and what we found was that the vacancy that was introduced to the market that created fundamental risk and depreciation of asset values is because we overbuilt the market, we oversupplied.
But today the data available to assess risk is much better. So, by way of example, in construction, the assessment and the underwriting and the expected returns are measured much more carefully. Less leverage is being used, so there’s less immediate pressure on the outcomes and more patience to do the right thing when you’re taking on more risk. So I think that there’s more prudence and discipline than
there was 20 or 30 years ago. I think it’s a more complicated world, but I think we’re better equipped with data.
When you look at the sea of investment opportunities, and the different roles that all these ships play as they navigate through storms and currents, we like to think of ourselves in the alternative asset space as almost a supertanker. We’re large, we’re physical, and we’re built with a very strong engine. That engine is income. This is what provides us with the reliability and predictability to navigate through very difficult uncharted waters, particularly now when you look at the broader economy.
PAIR: Brad, I’ll let you have the final word. How should advisors and their clients be repositioning themselves in this fraught environment?
Brad: Advisors and their clients should prioritize risk, diversification, and capital preservation as much as possible in this environment. In addition, we have to consider the behavioural aspects of investment. A lot of our discussion today was around change, and many of us are hardwired against change. Our advice is to embrace change and build resilient portfolios that are diversified across broad risk factors, not just stocks and bonds, and can help withstand stress events. That way, investors are not overexposed to any one or two risk factors that could potentially wipe out their portfolios in a market downturn.
This multi-factor approach is designed to help investors better understand the key sources of long-term return across asset classes. It also provides investors with a new way to think about portfolio diversification, allowing them to focus not only on diversification across asset classes, but also on diversification across the underlying sources of risk and return.
As Ted suggested, the use of private capital, especially in the form of mortgages, real estate and infrastructure, are a key
component of this. Absolute-return strategies are also an important part of the mix. We’ve used the word “alternative” numerous times
today because it is a popular term for a host of different ways to be able to grow and protect capital. But the term is perhaps a misnomer. At TD Wealth, we like to call our approach to these investments “The New Standard.”
10

11
(%) (%) (%) (%) (%) (%) (%) (%) (%)
Canadian Indices ($CA) Return Index 1 Month 3 Months YTD 1 Yr 3 Yrs 5 Yrs Since 1/1/2012
10 Yrs 20 Yrs
S&P/TSX Composite (TR) 58,605 1.69 2.48 19.11 7.06 7.36 5.31 7.56 6.97 7.12
S&P/TSX Composite (PR) 16,659 1.32 1.69 16.31 3.64 4.20 2.17 4.37 3.87 4.46
S&P/TSX 60 (TR) 2,844 1.96 2.69 19.02 8.39 8.44 6.14 8.31 7.03 7.21
S&P/TSX SmallCap (TR) 924 -2.77 -1.22 9.07 -6.62 -1.84 0.10 1.60 3.73 -
U.S. Indices ($US) Return Index 1 Month 3 Months YTD 1 Yr 3 Yrs 5 Yrs Since 1/1/2012
10 Yrs 20 Yrs
S&P 500 (TR) 6,009 1.87 1.70 20.55 4.25 13.39 10.84 14.11 13.24 6.33
S&P 500 (PR) 2,977 1.72 1.19 18.74 2.15 11.14 8.58 11.75 10.91 4.30
Dow Jones Industrial (PR) 26,917 1.95 1.19 15.39 1.73 13.71 9.57 10.72 10.73 4.90
NASDAQ Composite (PR) 7,999 0.46 -0.09 20.56 -0.58 14.62 12.23 15.57 14.19 5.49
Russell 2000 (TR) 7,675 2.08 -2.40 14.18 -8.89 8.23 8.19 11.27 11.19 7.99
U.S. Indices ($CA) Return Index 1 Month 3 Months YTD 1 Yr 3 Yrs 5 Yrs Since 1/1/2012
10 Yrs 20 Yrs
S&P 500 (TR) 7,957 1.48 2.91 17.02 6.66 13.76 14.60 18.07 15.66 5.78
S&P 500 (PR) 3,942 1.33 2.40 15.27 4.51 11.50 12.27 15.63 13.28 3.76
Dow Jones Industrial (PR) 35,647 1.55 2.40 12.01 4.08 14.07 13.29 14.57 13.10 4.36
NASDAQ Composite (PR) 10,594 0.07 1.10 17.03 1.71 14.99 16.03 19.58 16.63 4.94
Russell 2000 (TR) 10,164 1.69 -1.24 10.83 -6.79 8.58 11.86 15.13 13.57 7.43
MSCI Indices ($US) Total Return Index 1 Month 3 Months YTD 1 Yr 3 Yrs 5 Yrs Since 1/1/2012
10 Yrs 20 Yrs
World 9,182 2.18 0.66 18.15 2.42 10.82 7.79 11.05 9.62 5.43
EAFE (Europe, Australasia, Far East) 7,989 2.92 -1.00 13.35 -0.82 7.01 3.77 7.34 5.39 4.17
EM (Emerging Markets) 2,297 1.94 -4.11 6.23 -1.63 6.37 2.71 4.06 3.73 7.64
MSCI Indices ($CA) Total Return Index 1 Month 3 Months YTD 1 Yr 3 Yrs 5 Yrs Since 1/1/2012
10 Yrs 20 Yrs
World 12,160 1.78 1.86 14.69 4.78 11.18 11.45 14.90 11.96 4.88
EAFE (Europe, Australasia, Far East) 10,580 2.52 0.18 10.03 1.47 7.35 7.29 11.07 7.64 3.63
EM (Emerging Markets) 3,042 1.55 -2.96 3.12 0.63 6.71 6.19 7.67 5.94 7.08
Currency Level 1 Month 3 Months YTD 1 Yr 3 Yrs 5 Yrs Since 1/1/2012
10 Yrs 20 Yrs
Canadian Dollar ($US/$CA) 75.51 0.39 -1.18 3.02 -2.25 -0.32 -3.28 - -2.09 0.52
Regional Indices (Native Currency) Price Return Index 1 Month 3 Months YTD 1 Yr 3 Yrs 5 Yrs Since
1/1/201210 Yrs 20 Yrs
London FTSE 100 (UK) 7,408 2.79 -0.23 10.11 -1.36 2.40 2.27 4.73 3.74 0.01
Hang Seng (Hong Kong) 26,092 1.43 -8.58 0.95 -6.10 3.85 2.61 8.06 2.22 3.65
Nikkei 225 (Japan) 21,756 5.08 2.26 8.70 -9.80 9.77 6.11 18.17 7.94 1.06
Benchmark Bond Yields 3 Month 5 Yr 10 Yr 30 Yr
Government of Canada Yields 1.66 1.40 1.36 1.53
U.S. Treasury Yields 1.81 1.54 1.66 2.11
Canadian Bond Indices ($CA) Total Return Index 1 Month 3 Months YTD 1 Yr 3 Yrs 5 Yrs Since 1/1/2012 10 Yrs
FTSE TMX Canada Universe Bond Index 1,133 -0.84 1.19 7.79 9.69 2.66 3.91 3.58 4.38
FTSE TMX Canadian Short Term Bond Index (1-5 Yrs) 731 -0.38 0.27 2.95 4.36 1.47 1.89 1.98 2.40
FTSE TMX Canadian Mid Term Bond Index (5-10 Yrs) 1,220 -1.05 0.94 6.91 9.50 2.14 3.77 3.75 4.72
FTSE TMX Long Term Bond Index (10+ Yrs) 1,964 -1.26 2.52 14.92 17.07 4.49 6.67 5.57 7.15
Sources: TD Securities Inc., Bloomberg Finance L.P. TR: total return, PR: price return, as of September 30, 2019.
Market performance

The information contained herein has been provided by TD Wealth and is for information purposes only. The information has been drawn from sources believed to be reliable. Graphs and charts are used for illustrative purposes only and do not reflect future values or future performance of any investment. The information does not provide financial, legal, tax or investment advice. Particular investment, tax, or trading strategies should be evaluated relative to each individual’s objectives and risk tolerance.
Certain statements in this document may contain forward-looking statements (“FLS”) that are predictive in nature and may include words such as “expects”, “anticipates”, “intends”, “believes”, “estimates” and similar forward- looking expressions or negative versions thereof. FLS are based on current expectations and projections about future general economic, political and relevant market factors, such as interest and foreign exchange rates, equity and capital markets, the general business environment, assuming no changes to tax or other laws or government tregulation or catastrophic events. Expectations and projections about future events are inherently subject to risks and uncertainties, which may be unforeseeable. Such expectations and projections may be incorrect in the future. FLS are not guarantees of future performance. Actual events could differ materially from those expressed or implied in any FLS. A number of important factors including those factors set out above can contribute to these digressions. You should avoid placing any reliance on FLS.
TD Wealth represents the products and services offered by TD Waterhouse Canada Inc., TD Waterhouse Private Investment Counsel Inc., TD Wealth Private Banking (offered by The Toronto-Dominion Bank) and TD Wealth Private Trust (offered by The Canada Trust Company).
Source: London Stock Exchange Group plc and its group undertakings (collectively, the “LSE Group”). © LSE Group 2019. FTSE Russell is a trading name of certain of the LSE Group companies. “FTSE®”, “Russell®”, and “FTSE Russell®” are trademarks of the relevant LSE Group companies and are used by any other LSE Group company under license. “TMX®” is a trade mark of TSX, Inc. and used by the LSE Group under license. All rights in the FTSE Russell indexes or data vest in the relevant LSE Group company which owns the index or the data. Neither LSE Group nor its licensors accept any liability for any errors or omissions in the indexes or data and no party may rely on any indexes or data contained in this communication. No further distribution of data from the LSE Group is permitted without the relevant LSE Group company’s express written consent. The LSE Group does not promote, sponsor or endorse the content of this communication.
Bloomberg and Bloomberg.com are trademarks and service marks of Bloomberg Finance L.P., a Delaware limited partnership, or its subsidiaries. All rights reserved.
All trademarks are the property of their respective owners.
® The TD logo and other trade-marks are the property of The Toronto-Dominion Bank.