the tools of geography - wikispacesthetoolsofgeograp… · the tools of geography ... horizontal...
TRANSCRIPT

. I
The Tools of Geography
1.1 Introduction
In the early 1800s, the United States was just starting to expand acrossNorth America. No American had ever crossed the land that lay west ofthe Mississippi River. This vast area was mostly a huge blank space onthe map.
To find out about this land, Meriwether Lewis and William Clark leda team of explorers on a journey to the Pacific Ocean. Lewis and Clarkmapped mountains and rivers as they crossed them. They collected sam-ples of wildlife and plants. They also learned about the Native Americansof the West and how they lived.
In many ways, today's geographers are explorers like Lewis andClark. They study the natural features of the land, the sea, and even thesky. They try to understand the way people interact with the world aroundthem. For example, they look at where people choose to live and why.They study the way people use Earth's resources, such as forests, water,and minerals. They explore the advantages that come with living in citiesor in the country. Often they use maps as a basic tool for recording infor-mation and making new discoveries.
In this chapter, you will learn how to use different kinds of maps.You will see how maps can show information about people and places onEarth. You will use these tools throughout your own study of geography.
CHAPTER
1
Graphic Organizer
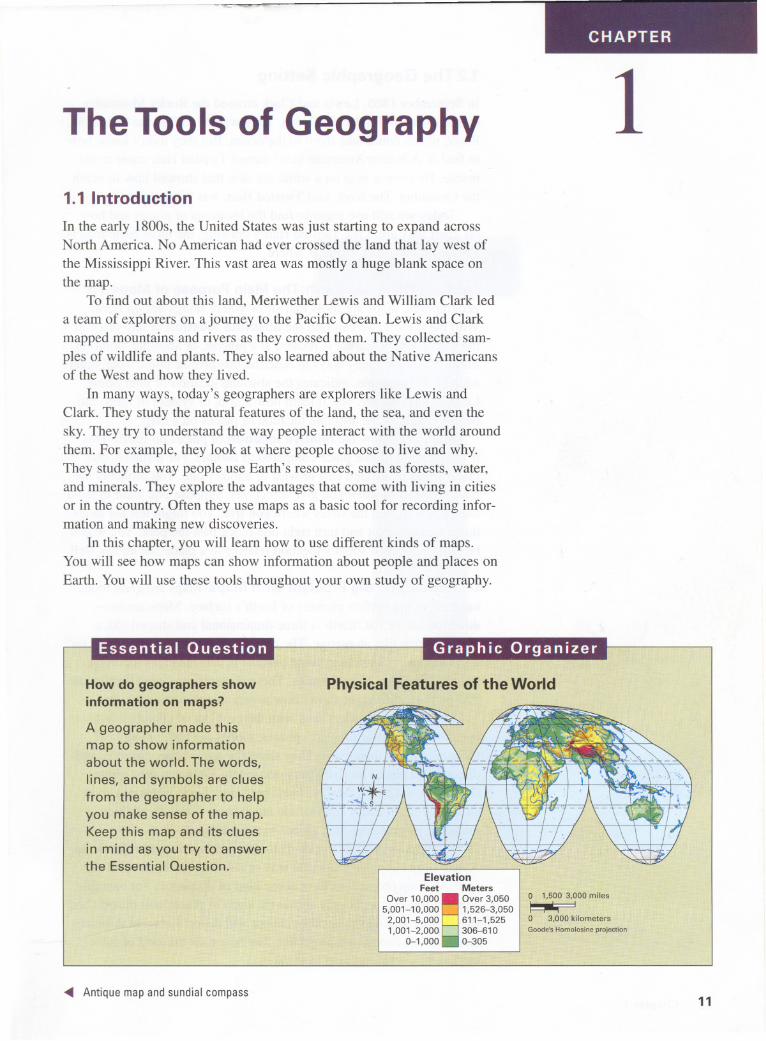
Physical Features of the WorldHow do geographers showinformation on maps?
A geographer made thismap to show informationabout the world. The words,lines, and symbol§ areclue§from the geographer to helpyou make sense of the map.Keep this map and its cluesinmindas you try-to aQ§werthe Essential Question.
ElevationFeet Meters
Over 10,000
8Over 3,050
5,001-10,000 :1 1,526-3,0502,001-5,000 611-1,5251,001-2,000 . 306-610
0-1,000 0-305
Antique map and sundial compass
0 1,500 3,000 miles
J--~ I0 3,000 kil"metersGoode's Homolosineprojection
11
1.2The Geographic Setting
In September 1805, Lewis and Clark crossed the Rocky Mountainson their way to the Pacific Ocean. They wanted to find the ColumbiaRiver, which could take them to the ocean. But they didn't know howto find it. A Native American chief named Twisted Hair came to the
rescue. He drew a map on a white elk skin that showed how to reachthe Columbia. The river, said Twisted Hair, was "five sleeps" away.
Today we still use maps to find the locations of places and howfar apart they are. Like Twisted Hair's drawing, the most basic map isa diagram that shows what is where.
LocatingThings on Earth:The Main Purpose of Maps Forgeographers, maps are tools that show where things are on Earth.Withthesetools,we can find theabsolute locationof anyplace inthe world. Every feature is located at a precise, or absolute, point onEarth. There are many ways to describe this precise point. Your streetaddress, for example, indicates the absolute location of your home.Later in this chapter, you'll learn how a grid, or system of lines, canbe used to show the absolute location of places on a map.
Maps also show the relative location of places on Earth. Thisis the location of one place compared to another. For instance, oneplace might be located east or west of another one. You probably userelative location when you give directions. Suppose you want to tell afriend how to find the street where you live. You might tell her to godown a main street and turn right one block past the park. You wouldbe telling her your street's location relative to a place she knows well.
Distortion:The Big Problem with Maps Maps are great tools,but they're not perfect pictures of Earth's surface. Maps are two-dimensional, or flat. Earth is three-dimensional and shaped like a
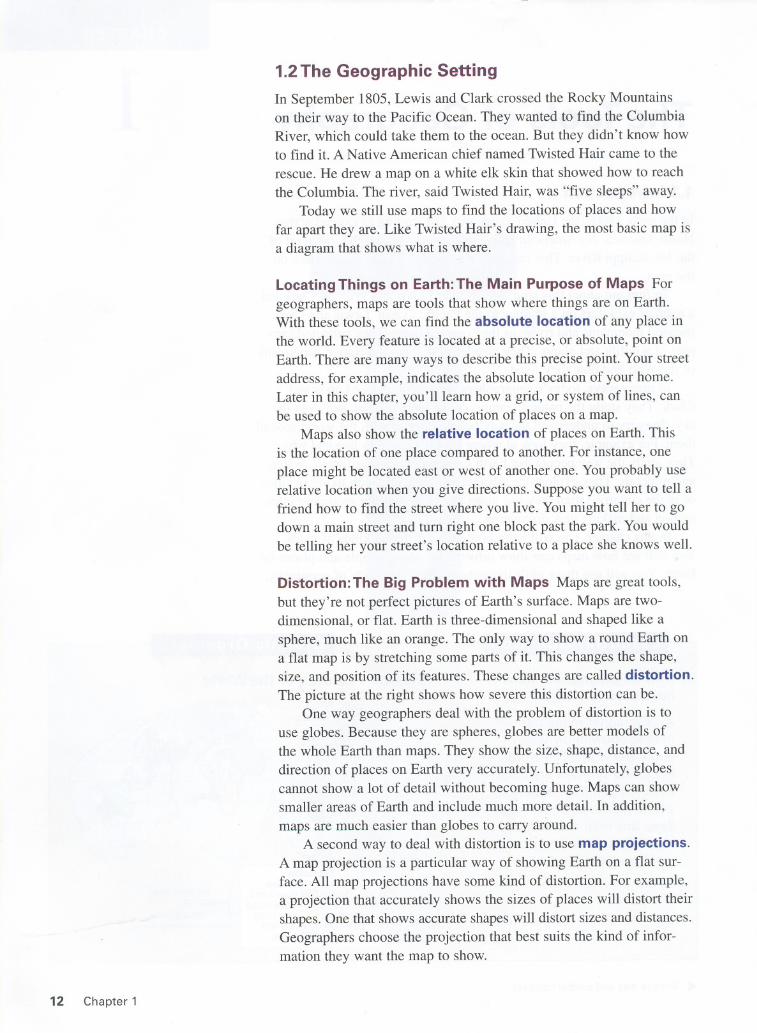
sphere, nmch like an orange. The only way to show a round Earth ona flat map is by stretching some parts of it. This changes the shape,size,andpositionof its features.Thesechangesare calleddistortion.Thepictureat the right showshow severethis distortioncan be.
One way geographers deal with the problem of distortion is touse globes. Because they are spheres, globes are better models ofthe whole Earth than maps. They show the size, shape, distance, anddirection of places on Earth very accurately. Unfortunately, globescannot show a lot of detail without becoming huge. Maps can showsmaller areas of Earth and include much more detail. In addition,
maps are much easier than globes to carry around.A second way to deal with distortion is to use map projections.
A map projection is a particular way of showing Earth on a flat sur-face. All map projections have some kind of distortion. For example,a projection that accurately shows the sizes of places will distort theirshapes. One that shows accurate shapes will distort sizes and distances.Geographers choose the projection that best suits the kind of infor-mation they want the map to show.
12 Chapter 1
"--'-~ <
~ Geotermsabsolute location the precise point where a place is locatedon Earth
distortion a change in the shape, size, or position of a placewhen it is shown on a map
map projection a way of representing the spherical Earthon a flat surface
relative location where a place is located in relation toanother place
"
Flattening a Sphere Distorts Features
A person's head is shaped almost like a sphere. If you try to flatten a head,its features stretch and change shape. As a result, the person becomesalmost unrecognizable. In a similar way, flat maps can distort informationabout Earth'sfeatures.
The Tools of Geography 13
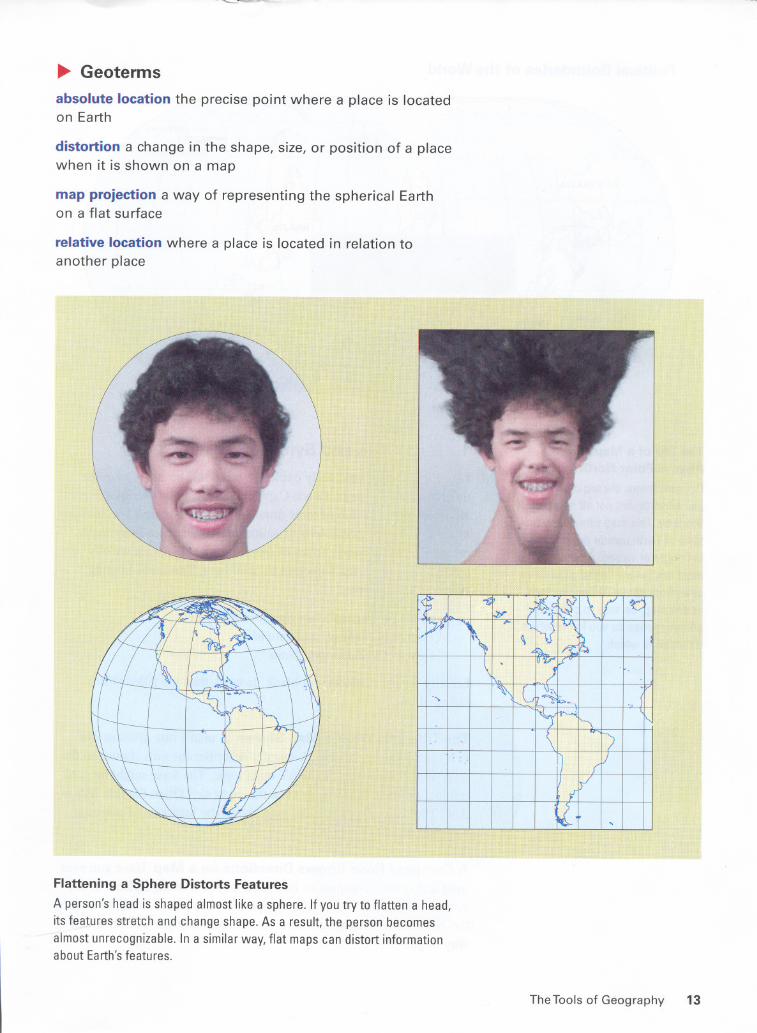
Political Boundaries of the World
The Top of a Map Doesn'tAlways Point North
On most maps, the top of the map
points north, but not all maps workthis way. This map turns our usualview of Earth upside down. The map
isn't right or wrong. After all, Earthdoes not have a "right" side up asseen from space. When you lookat any map, be sure to check the
compass rose so you know whichdirection is which.
14 Chapter 1
1.3 Map Titles and Symbols
Like Lewis and Clark, early explorers often had no maps to guidethem on their journeys. Lewis Carroll, the English author of Alice inWonderland,made fun of their situation in a poem called The Huntingof the Snark. The poem tells of sailors in search of an imaginarycreature called a snark. To assist them, the ship's captain unrollsa large map of the sea without a trace of land. The snark-huntingsailors, Carroll wrote,
were much pleased when they found it to be
A map they could all understand....
"A perfect and absolute blank!"
Luckily for us, maps are not blank. Instead, they are filled withinformation.
The Title TellsWhat a Map Shows A map's title givesus ourfirst clue about its content. It usually describes the area shown on themap. It also identifies the map's main topic. The topic might be goldmining, politics, farming, or even the night sky. Often the title lists adate. The date tells us that the map shows the locations of places ata certain time.
A Compass Rose Shows Directions on a Map Have you everused a magnetic compass to find your way in a strange place? If so,you know that the needle of a compass always points north, or towardthe North Pole. Knowing where north is can help you decide whichway to go.

Mapmakers use a diagram called a compassrose to show directions on a map. On early maps,these diagrams often looked like a flower. Forthis reason, sailors called this direction-findingtool a compass rose.
A simple compass rose has two short linesthat cross at right angles. The points at the endsof the lines are labeled north, south, east, andwest. These four directions are called cardinal
directions. A more complicated compass rosehas lines between the cardinal points. These linesshow the intermediate directions. They arenortheast, southeast, southwest, and northwest.
A Legend Identifies Symbols on a MapA compass rose is one of many symbols used toshow information on a map. Some symbols usecolor to show features. Blue lines, for example,are symbols showing rivers. Lakes and oceansare often colored blue as well. Other symbolsuse shapes to show information. A bold star isa common symbol for the capital of a state orcountry. Tiny airplanes are often used to showthe location of airports.
The symbols used on a map are usuallyidentified in a box known as the map legend,or sometimes the map key. The map legendlists each symbol and explains what it showson the map.
Marshall Gold DiscoveryState Historic Park
A Grid Organizes Space on a Map Mapmakers often use asystem of imaginary lines to divide up space on their maps. Thissystem of lines is called a map grid. You can see an example ofa grid on the map above. To form this grid, the mapmaker drewhorizontal lines and vertical lines that meet at 90-degree angles.(Remember that horizontal lines go straight across. Vertical linesgo up and down.)
Geographers make map grids useful by giving each line a label.For instance, on some maps horizontal lines have letters, and vertical
lines have numbers. Once the grid is labeled, the location of any placeon the map can be indicated by a letter and number such as A9 or C3.The letter and number indicate where a horizontal and vertical line
meet. Find this point, and you will have found the place you arelooking for close by.
One very useful type of grid is the system of latitude and longi-tude. This global grid allows you to locate any place on Earth with asimple number code. You'll learn more about the global grid in thenext section.
Using a Map's Title, CompassRose, Legend, and Grid
You can use this map to tour a historic
site. The map title tells which site youwill be exploring. The compass rose
shows which way north is on the map.The map legend tells you what the
symbols on the map mean. Once youknow what you want to visit, the mapgrid will help you locate it on the map.
The Tools of Geography 15
32° North, 4° West
Any place on Earth, no matter howlonely, has an exact address on theglobal grid. This lonely spot lies32° north of the equator and 4° west
of the prime meridian.
16 Chapter 1
1.4The Global Grid: Longitude and Latitude
In early November of 2003, a hiker set up camp high in the AdirondackMountains of New York. Heavy snow trapped him there with no wayto hike out. Luckily, he had a Personal Locator Beacon. He pressed abutton to call for help. A helicopter soon flew him to safety.
How did the rescuers find the stranded hiker? His locator beacon
showed his location on the global grid. Geographers use this sameglobal grid to show the absolute location of every place on Earth.
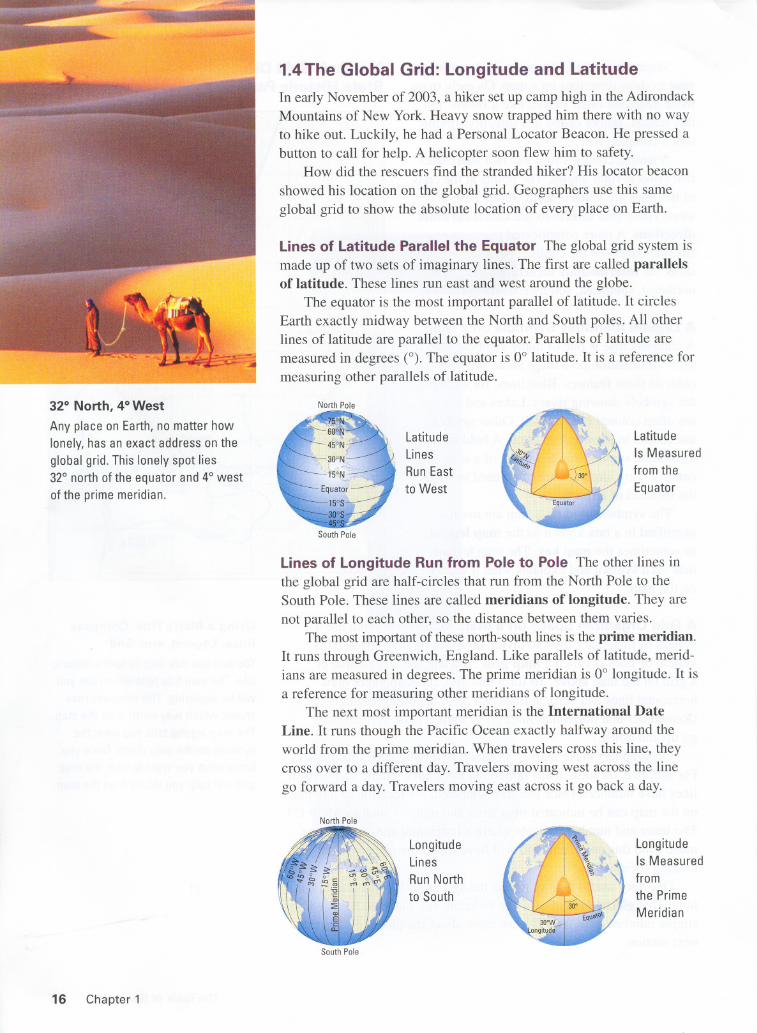
Linesof LatitudeParallelthe EquatorThe global grid system ismade up of two sets of imaginary lines. The first are called parallelsof latitude. These lines run east and west around the globe.
The equator is the most important parallel of latitude. It circlesEarth exactly midway between the North and South poles. All otherlines of latitude are parallel to the equator. Parallels of latitude aremeasured in degrees (0).The equator is 00 latitude. It is a reference formeasuring other parallels of latitude.
North Pole
LatitudeIs Measuredfrom the
Equator
LatitudeLines
Run Eastto West
SouthPole
lines of Longitude Run from Pole to Pole The other lines inthe global grid are half-circles that run from the North Pole to theSouth Pole. These lines are called meridians of longitude. They are
not parallel to each other, so the distance between them varies.The most important of these north-south lines is the prime meridian.
It runs through Greenwich, England. Like parallels of latitude, merid-ians are measured in degrees. The prime meridian is 00 longitude. It isa reference for measuring other meridians of longitude.
The next most important meridian is the International DateLine. It runs though the Pacific Ocean exactly halfway around the
world from the prime meridian. When travelers cross this line, theycross over to a different day. Travelers moving west across the line
go forward a day. Travelers moving east across it go back a day.
North Pole
LongitudeIs Measuredfromthe PrimeMeridian
LongitudeLinesRun Northto South
SouthPole
Cities Around the World
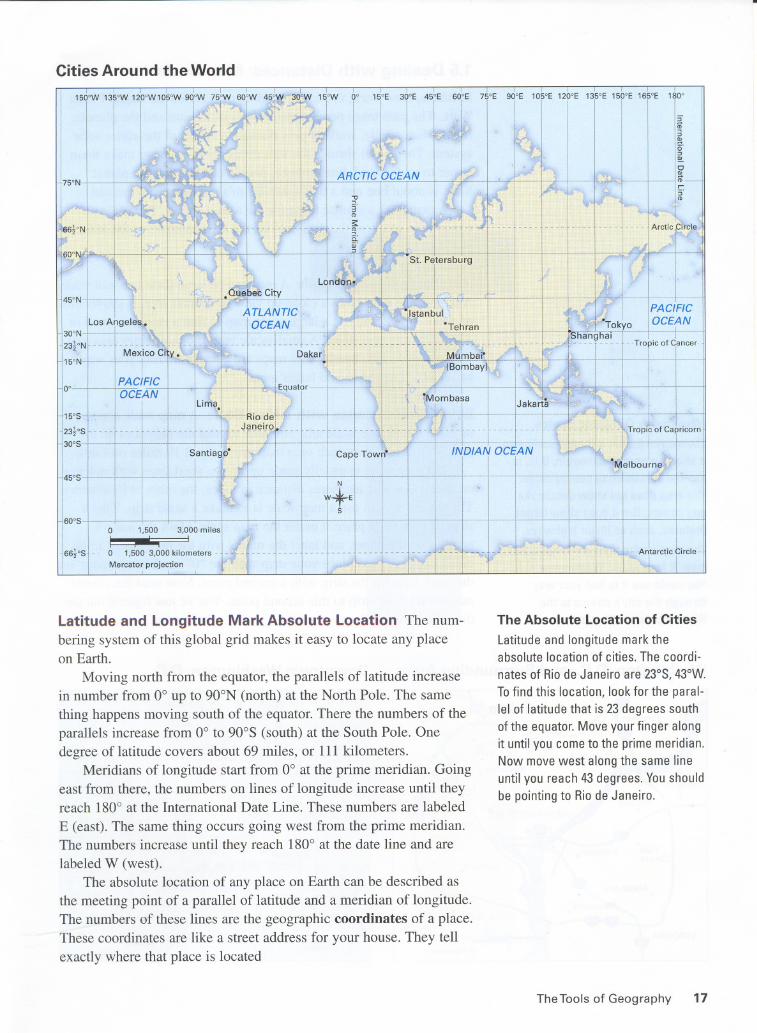
Latitude and Longitude Mark Absolute Location The num-beringsystemof this globalgrid makesit easyto locateanyplaceon Earth.
Moving north from the equator, the parallels of latitude increasein numberfrom 0° up to 900N(north)at theNorth Pole.The samething happens moving south of the equator. There the numbers of theparallels increase from 0° to 900S (south) at the South Pole. Onedegree of latitude covers about 69 miles, or III kilometers.
Meridians of longitude start from 0° at the prime meridian. Goingeast from there, the numbers on lines of longitude increase until theyreach 180° at the International Date Line. These numbers are labeled
E (east). The same thing occurs going west from the prime meridian.The numbers increase until they reach 180° at the date line and arelabeled W (west).
The absolute location of any place on Earth can be described asthe meeting point of a parallel of latitude and a meridian of longitude.The numbers of these lines are the geographic coordinates of a place.These coordinates are like a street address for your house. They tellexactly where that place is located
The Absolute Location of Cities
latitude and longitude mark theabsolute location of cities. The coordi-
nates of Rio de Janeiro are 23°S,43°W.Tofind this location, look for the paral-lel of latitude that is 23 degrees southof the equator. Move your finger alongit until you come to the prime meridian.Now move west along the same lineuntil you reach 43 degrees. You should
be pointing to Rio de Janeiro.
The Tools of Geography 17
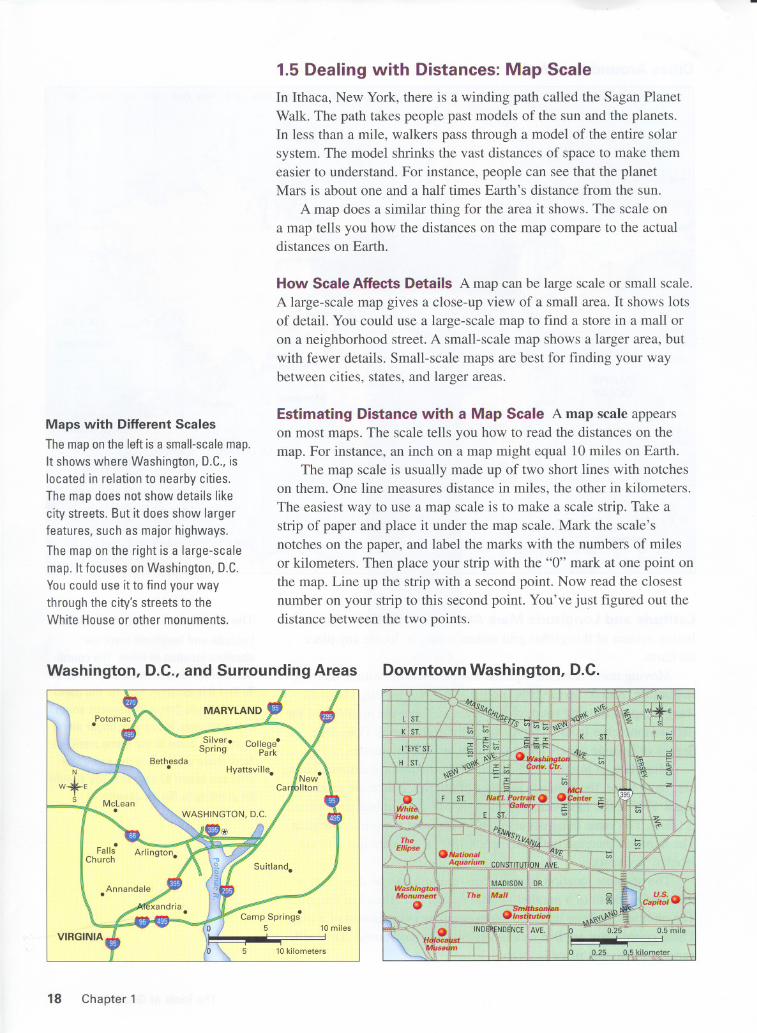
Maps with Different Scales
The maponthe left is a small-scalemap.
It shows where Washington, D.C.,islocated in relation to nearby cities.The map does not show details like
city streets. But it does show largerfeatures, such as major highways.
The map on the right is a large-scalemap. It focuses on Washington, D.C.You could use it to find your way
through the city's streets to theWhite Houseor other monuments.
1.5 Dealing with Distances: Map ScaleIn Ithaca,NewYork, there is a winding path called the Sagan PlanetWalk. The path takes people past models of the sun and the planets.In less than a mile, walkers pass through a model of the entire solarsystem. The model shrinks the vast distances of space to make themeasier to understand. For instance, people can see that the planetMars is about one and a half times Earth's distance from the sun.
A map does a similar thing for the area it shows. The scale ona map tells you how the distances on the map compare to the actualdistances on Earth.
How ScaleAffects Details A map can be large scale or small scale.A large-scale map gives a close-up view of a small area. It shows lotsof detail. You could use a large-scale map to find a store in a mall or
on a neighborhood street. A small-scale map shows a larger area, butwith fewer details. Small-scale maps are best for finding your way
between cities, states, and larger areas.
Estimating Distance with a Map Scale A map scale appearson most maps. The scale tells you how to read the distances on themap. For instance, an inch on a map might equal 10 miles on Earth.
The map scale is usually made up of two short lines with notcheson them. One line measures distance in miles, the other in kilometers.
The easiest way to use a map scale is to make a scale strip. Take astrip of paper and place it under the map scale. Mark the scale'snotches on the paper, and label the marks with the numbers of milesor kilometers. Then place your strip with the "0" mark at one point onthe map. Line up the strip with a second point. Now read the closestnumber on your strip to this second point. You've just figured out thedistance between the two points.
Washington, D.C., and Surrounding Areas
18 Chapter 1
10 miles
5 10 kilometers
Downtown Washington, D.C.
1.6 Hemispheres, Continents, and Oceans"One of my favorite things to do when I have time off is to justwatch the world go by," said astronaut Ed Lu about his time in space.In 2003, Lu watched Earth go by from the International SpaceStation. "It isn't exactly seeing the Earth like a big blue marble,"he explained. "It's more like having your face up against a big bluebeach ball." On the "beach ball," he saw Earth's wide continents andblue oceans.
Few of us will ever see Earth from an astronaut's point of view.But we can use maps and globes to get a view of our planet's naturalwonders. Geographers make these features easier to understand bydividing Earth into different areas.
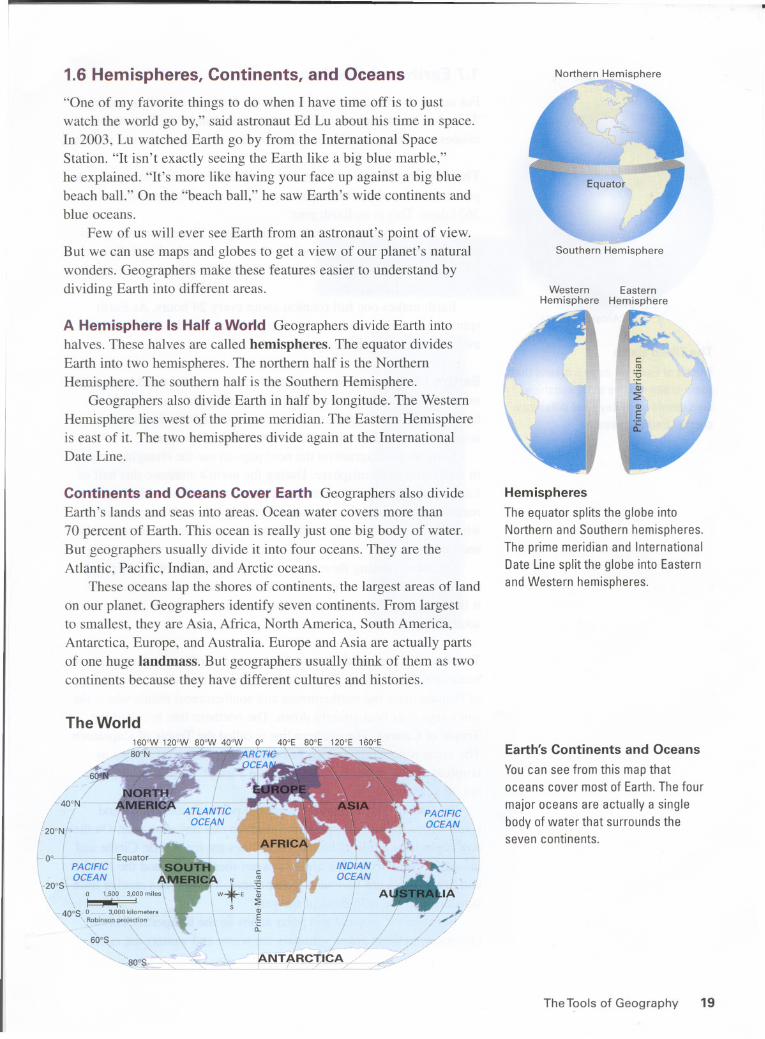
A Hemisphere Is Half a World Geographers divide Earth intohalves. These halves are called hemispheres. The equator dividesEarth into two hemispheres. The northern half is the NorthernHemisphere. The southern half is the Southern Hemisphere.
Geographers also divide Earth in half by longitude. The WesternHemisphere lies west of the prime meridian. The Eastern Hemisphereis east of it. The two hemispheres divide again at the InternationalDate Line.
Continentsand OceansCoverEarth Geographers also divideEarth's lands and seas into areas. Ocean water covers more than
70 percent of Earth. This ocean is really just one big body of water.But geographers usually divide it into four oceans. They are theAtlantic, Pacific, Indian, and Arctic oceans.
These oceans lap the shores of continents, the largest areas of landon our planet. Geographers identify seven continents. From largestto smallest, they are Asia, Africa, North America, South America,Antarctica, Europe, and Australia. Europe and Asia are actually partsof one huge landmass. But geographers usually think of them as twocontinents because they have different cultures and histories.
The World
600S
~ ~o \ i i, / / /~ ,..',,' ". \J.L u-";-' ,ft- ;T /." /'--~800S.. .. - " "'. ,~..}4.NT~RCTJCA / / . .~/'"",,""=---' ~ "' L ~ L / / /
Northern Hemisphere
-Southern Hemisphere
WesternHemisphere
EasternHemisphere
f~I.!!!
"C
:ij3
,I~.5!t
Hemispheres
The equator splits the globe intoNorthern and Southern hemispheres.
The prime meridian and InternationalDate Line split the globe into Easternand Western hemispheres.
Earth's Continents and Oceans
You can see from this map thatoceans cover most of Earth. The four
major oceans are actually a singlebody of water that surrounds theseven continents.
The Tools of Geography 19
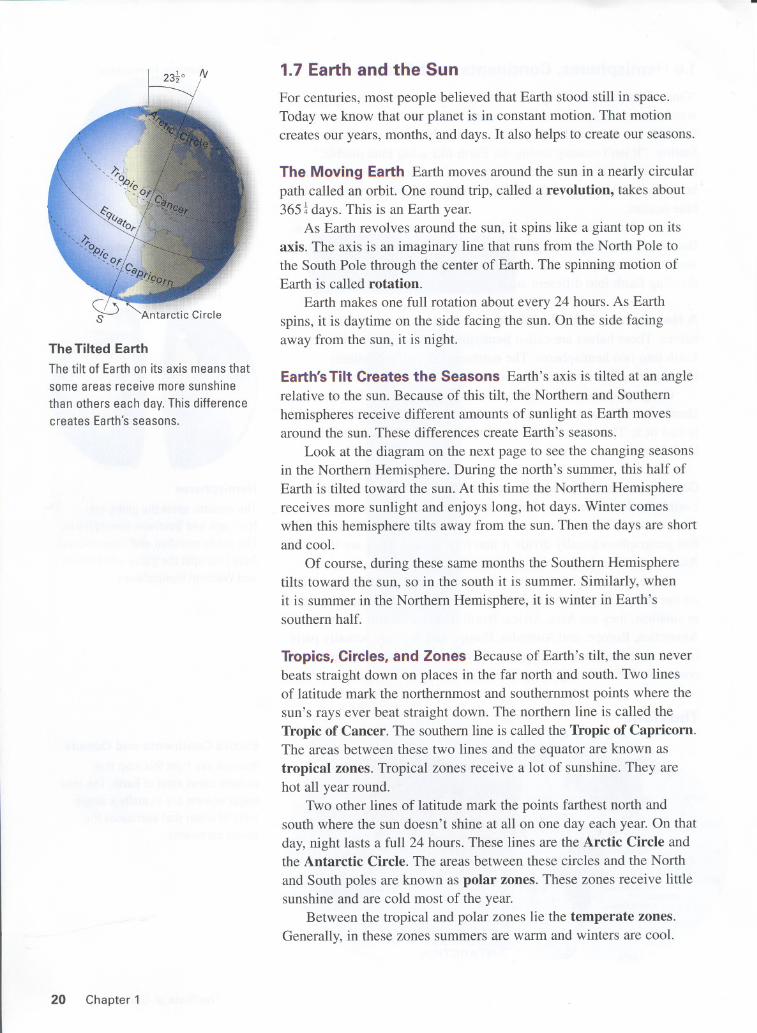
The Tilted Earth
The tilt of Earth on its axis means that
some areas receive more sunshine
than others each day.This differencecreates Earth's seasons.
20 Chapter 1
1.7 Earth and the Sun
For centuries, most people believed that Earth stood still in space.Today we know that our planet is in constant motion. That motioncreates our years, months, and days. It also helps to create our seasons.
The Moving Earth Earth moves around the sun in a nearly circularpath called an orbit. One round trip, called a revolution, takes about365~days. This is an Earth year.
As Earth revolves around the sun, it spins like a giant top on itsaxis. The axis is an imaginary line that runs from the North Pole tothe South Pole through the center of Earth. The spinning motion ofEarth is called rotation.
Earth makes one full rotation about every 24 hours. As Earthspins, it is daytime on the side facing the sun. On the side facingaway from the sun, it is night.
Earth's Tilt Creates the Seasons Earth's axis is tilted at an anglerelative to the sun. Because of this tilt, the Northern and Southern
hemispheres receive different amounts of sunlight as Earth movesaround the sun. These differences create Earth's seasons.
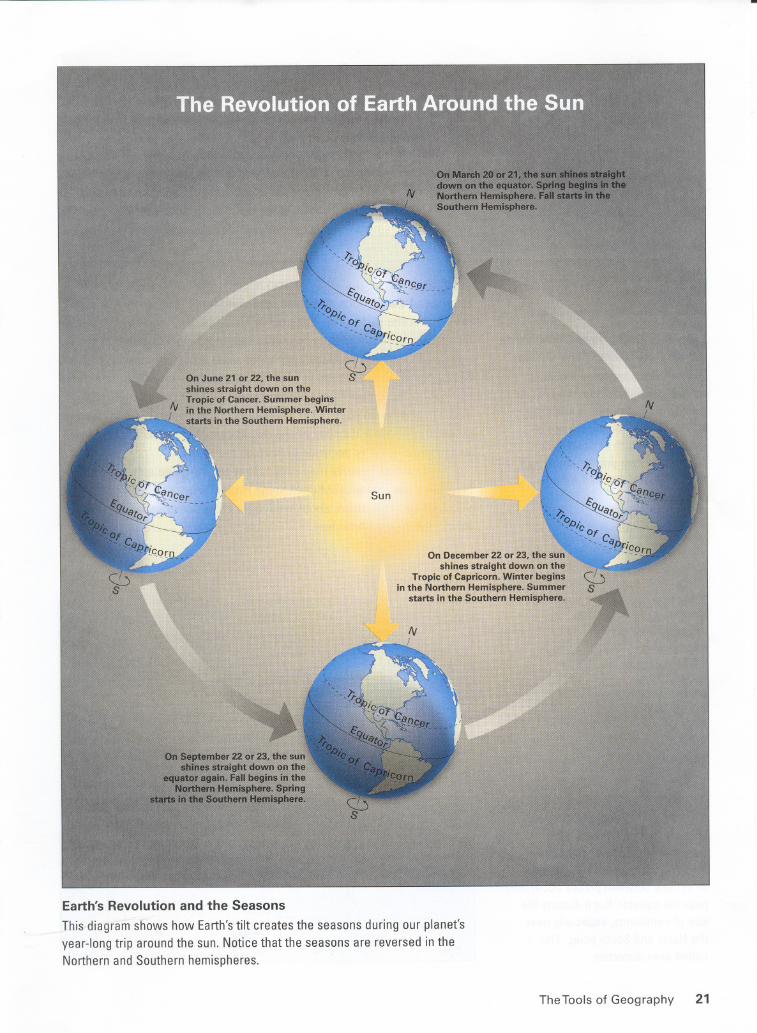
Look at the diagram on the next page to see the changing seasonsin the Northern Hemisphere. During the north's summer, this half ofEarth is tilted toward the sun. At this time the Northern Hemispherereceives more sunlight and enjoys long, hot days. Winter comeswhen this hemisphere tilts away from the sun. Then the days are shortand cool.
Of course, during these same months the Southern Hemispheretilts toward the sun, so in the south it is summer. Similarly, whenit is summer in the Northern Hemisphere, it is winter in Earth'ssouthern half.
Tropics, Circles, and Zones Because of Earth's tilt, the sun neverbeats straight down on places in the far north and south. Two linesof latitude mark the northernmost and southernmost points where thesun's rays ever beat straight down. The northern line is called theTropic of Cancer. The southern line is called the Tropic of Capricorn.The areas between these two lines and the equator are known astropical zones. Tropical zones receive a lot of sunshine. They arehot all year round.
Two other lines of latitude mark the points farthest north andsouth where the sun doesn't shine at all on one day each year. On thatday, night lasts a full 24 hours. These lines are the Arctic Circle andthe Antarctic Circle. The areas between these circles and the North
and South poles are known as polar zones. These zones receive littlesunshine and are cold most of the year.
Between the tropical and polar zones lie the temperate zones.Generally, in these zones summers are warm and winters are cool.
-
Earth's Revolution and the Seasons
This diagram shows how Earth'stilt creates the seasons during our planet'syear-long trip around the sun. Notice that the seasons are reversed in theNorthern and Southern hemispheres.
The Tools of Geography 21

The World
0 1,000 2,000 miles
~I0 2,000 kilometersLambert Azimuthal Equal-Areaprojection
lambert Projections Show Polar
Areas that Other Maps Distort
A lambert projection is a circularmap. It shows size accurately at itscenter, but not distance or shape.
It is good for showing the areasaround the North or South pole.Most other map projections distortthe shape and size of the Arcticand Antarctica.
Mercator Projections ShowDirection but Distort Size
Gerardus Mercator designed hismap projection in 1569.It showsdirections between places accuratelynear the equator. But it distorts thesize of continents, especially near
the North and South poles. This iscalled area distortion.
22 Chapter 1
-
1.8 Showing a Round World on a Flat Map
In this chapter, you have learned how geographers show informationon maps. A map's title, legend, and symbols can help you understandwhat a map shows.
You learned how geographersdescribe where a place is in termsof its absolute location. The global grid allows mapmakers to indicatethe exact location of any place on Earth using lines of latitude and
longitude. Map scales are useful for describing the relative location of
two places. Using a scale, you can estimate about how far two placesare from each other.
All Flat Maps Have Distortion Geographers use maps to showfeatures of Earth, such as oceans and continents. But every flat mapinvolves some distortion. The size or shape of landmasses may be dis-torted. The distances between places may not be accurately shown.
To deal with distortions, mapmakers use different map projections.Many projections are named after the mapmakers who designed them.For example, Arthur Robinson designed the Robinson projection.The world map on page 19 is a Robinson projection. It is a popularprojection because it balances the distortions of size and shape. In thisway it givesa fairly accuratepictureof the world.
You can see several map projections on this page and the next.Note how each projection does some things better than others. Asyou look at them, think about what type of information each mapprojection might show best.
The World
I "i0 1,500 3,000 miles
~I0 3,000 kilometersMercator projection
The World
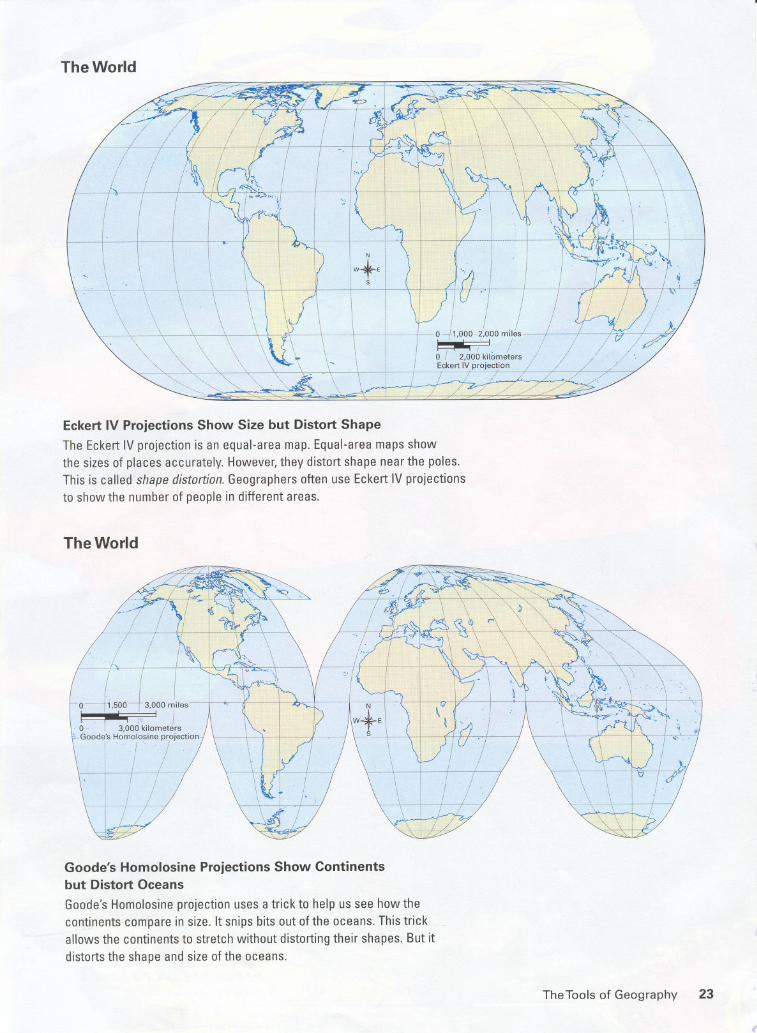
Eckert IV ProjectionsShow Size but Distort Shape
TheEckertIVprojectionis anequal-areamap.Equal-areamapsshowthe sizesof placesaccurately.However,theydistortshapenearthe poles.Thisis calledshapedistortion.GeographersoftenuseEckertIVprojectionsto showthe numberof peoplein differentareas.
The World
Goode's Homolosine Projections Show Continentsbut Distort Oceans
Goode's Homolosine projection uses a trick to help us see how thecontinents compare in size. It snips bits out of the oceans. This trickallows the continents to stretch without distorting their shapes. But it
distorts the shape and size of the oceans.
The Tools of Geography 23
t'