the total economic impact of ibm’s netezza data warehouse appliance with advanced analytics
TRANSCRIPT

A Forrester Total Economic Impact™ Study Prepared For IBM
The Total Economic Impact Of IBM’s Netezza Data Warehouse Appliance With Advanced Analytics
Single Company Analysis
Project Director: Jon Erickson
Contributor: Sebastian Selhorst
August 2011

Forrester Consulting
The Total Economic Impact Of IBM’s Netezza Data Warehouse Appliance With Advanced Analytics
Page 1
TABLE OF CONTENTS
Executive Summary ............................................................................................................................................................................................ 2
IBM Netezza Data Warehouse Appliances Provide Competitive Differentiation Through Faster Analytics While
Reducing Capital And Operational Costs .............................................................................................................................................. 2
Factors Affecting Benefits And Costs ...................................................................................................................................................... 4
Disclosures ...................................................................................................................................................................................................... 5
TEI Framework And Methodology ............................................................................................................................................................... 6
Analysis .................................................................................................................................................................................................................. 7
Interview Highlights ..................................................................................................................................................................................... 7
Costs .................................................................................................................................................................................................................. 9
Benefits .......................................................................................................................................................................................................... 10
Flexibility ...................................................................................................................................................................................................... 16
Risk ................................................................................................................................................................................................................. 17
Financial Summary .......................................................................................................................................................................................... 19
IBM Netezza Data Warehouse Appliance With Advanced Analytics: Overview ......................................................................... 20
Appendix A: Total Economic Impact™ Overview .................................................................................................................................. 21
Appendix B: Glossary ..................................................................................................................................................................................... 22
Appendix C: Related Forrester Research .................................................................................................................................................. 22
Appendix D: Endnotes ................................................................................................................................................................................... 23
© 2011, Forrester Research, Inc. All rights reserved. Unauthorized reproduction is strictly prohibited. Information is based on best available resources.
Opinions reflect judgment at the time and are subject to change. Forrester®, Technographics®, Forrester Wave, RoleView, TechRadar, and Total
Economic Impact are trademarks of Forrester Research, Inc. All other trademarks are the property of their respective companies. For additional
information, go to www.forrester.com.
About Forrester Consulting
Forrester Consulting provides independent and objective research-based consulting to help leaders succeed in their organizations. Ranging in
scope from a short strategy session to custom projects, Forrester’s Consulting services connect you directly with research analysts who apply
expert insight to your specific business challenges. For more information, visit www.forrester.com/consulting.
Forrester Consulting
The Total Economic Impact Of IBM’s Netezza Data Warehouse Appliance With Advanced Analytics
Page 2
Executive Summary
Companies around the world adopt data warehousing (DW) appliances in support of business processes to speed
information worker queries, reduce the cost of IT analytics infrastructures, and shorten time-to-value in business
intelligence (BI) and other decision-support initiatives. However, some IT executives push back at the need for DW
appliances, unsure whether this approach offers significant enough benefits at a low enough cost to justify moving away
from traditional “roll your own” DW implementations.
In June 2011, IBM commissioned Forrester Consulting to examine the total economic impact and potential return on
investment (ROI) enterprises may realize by deploying its Netezza data warehouse appliance with advanced analytics.
The purpose of this study is to provide readers with a framework to evaluate the potential financial impact of the IBM
Netezza appliance on their organizations.
IBM Netezza Analytics is an extensible, embedded, advanced analytics software platform delivered with every IBM
Netezza appliance. It simplifies the development, deployment, and use of advanced analytics while delivering high
performance and scalability. For a more detailed overview about the IBM Netezza solution, please refer to page 24.
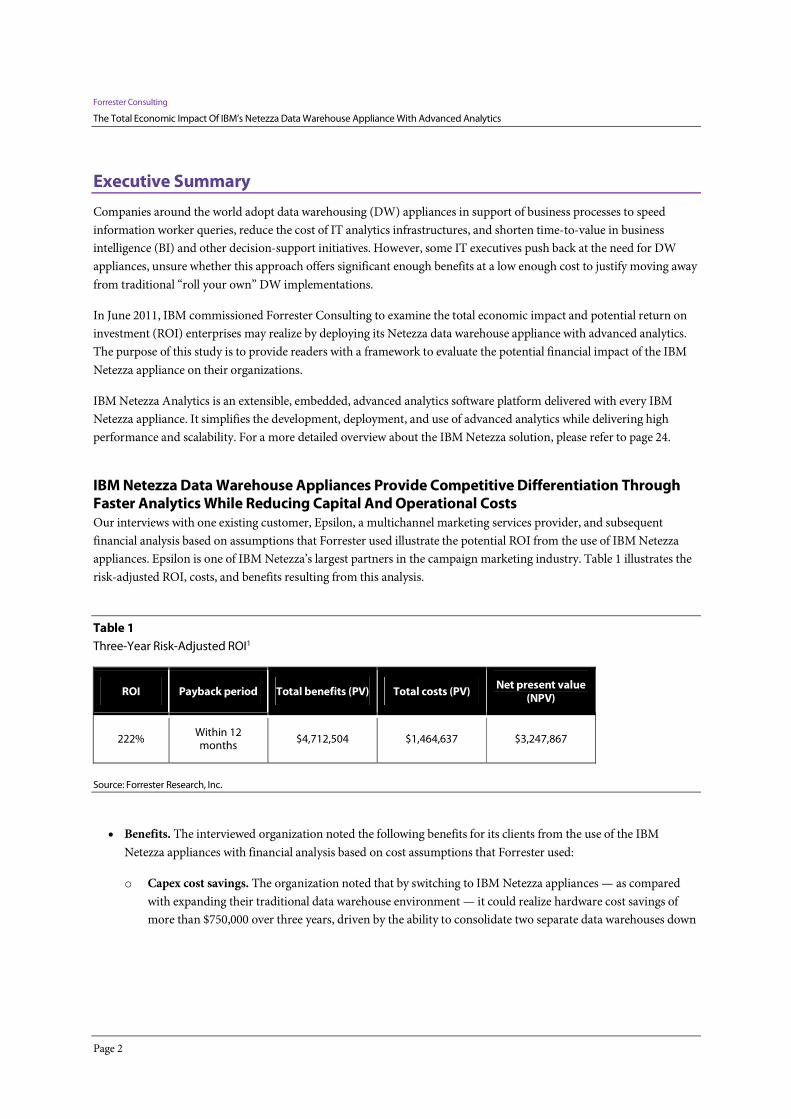
IBM Netezza Data Warehouse Appliances Provide Competitive Differentiation Through Faster Analytics While Reducing Capital And Operational Costs Our interviews with one existing customer, Epsilon, a multichannel marketing services provider, and subsequent
financial analysis based on assumptions that Forrester used illustrate the potential ROI from the use of IBM Netezza
appliances. Epsilon is one of IBM Netezza’s largest partners in the campaign marketing industry. Table 1 illustrates the
risk-adjusted ROI, costs, and benefits resulting from this analysis.
Table 1
Three-Year Risk-Adjusted ROI1
ROI Payback period Total benefits (PV) Total costs (PV) Net present value
(NPV)
222% Within 12 months
$4,712,504 $1,464,637 $3,247,867
Source: Forrester Research, Inc.
• Benefits. The interviewed organization noted the following benefits for its clients from the use of the IBM
Netezza appliances with financial analysis based on cost assumptions that Forrester used:
o Capex cost savings. The organization noted that by switching to IBM Netezza appliances — as compared
with expanding their traditional data warehouse environment — it could realize hardware cost savings of
more than $750,000 over three years, driven by the ability to consolidate two separate data warehouses down
Forrester Consulting
The Total Economic Impact Of IBM’s Netezza Data Warehouse Appliance With Advanced Analytics
Page 3
to a single data warehouse and an IBM Netezza appliance. This benefit has a three-year, risk-adjusted present
value (PV) of nearly $600,000.
o Opex cost savings. The organization noted that by switching to IBM Netezza appliances, it could also realize
operational cost savings through consolidation of its existing data warehouse environment due to post-
consolidation/migration to DW appliance, fewer database administrators (DBAs), which is due to fewer DW
instances and fewer DBAs per instance. This benefit has a three-year, risk-adjusted PV of just under $1.5
million.
o Revenue lift. The purchase of IBM Netezza appliances also enables the organization to provide added value
to its clients through a strategic shift from large episodic campaigns to frequent, microtargeted campaigns
through triggered campaigns. As a result, the organization was able to produce a greater number of
campaigns resulting in higher overall conversion. This benefit has a three-year, risk-adjusted PV of $2.54
million.
o Productivity gains. The organization noted that IBM Netezza appliances provided end users with the ability
to sift through massive data sets in less time and with greater granularity. This has the impact of making the
end user marketing staff more productive, shifting resources away from time-consuming data quality control
to focusing on campaign strategy and analytics. This resulted in a total three-year, risk-adjusted savings of
more than $175,000.
• Costs. The organization we interviewed experienced the following costs:
o Hardware and maintenance costs. The hardware and maintenance costs have a three-year, risk-adjusted PV
of about $1.5 million.
o Planning and implementation costs. The internal labor costs for planning and implementation have a
three-year, risk-adjusted PV of about $30,000.
o Administration costs. The internal labor costs for administration have a three-year, risk-adjusted PV of
about $550,000.
o Training costs. Initial training costs have a three-year, risk-adjusted PV of about $5,000.
Figure 1 summarizes the yearly and cumulated cash flow, and Figure 2 shows the breakdown of the benefit and cost
categories for the organization.

Forrester Consulting
The Total Economic Impact Of IBM’s Netezza Data Warehouse Appliance With Advanced Analytics
Page 4
Figure 1
Three-Year, Risk-Adjusted Cash Flow
Source: Forrester Research, Inc.
Figure 2
Three-Year, Risk-Adjusted Costs And Benefits
Source: Forrester Research, Inc.
Factors Affecting Benefits And Costs Table 1 illustrates the projected risk-adjusted financial results based on cost and benefit assumptions that Forrester
used. The risk-adjusted values take into account any potential uncertainty or variance that exists in estimating the costs
and benefits, which produces more conservative estimates. The following factors may affect the financial results that an
organization may experience:
($2,000,000)
($1,000,000)
$0
$1,000,000
$2,000,000
$3,000,000
$4,000,000
Initial Year 1 Year 2 Year 3
Costs Benefits Cumulated Total
12.2%
28.3%
1.7%
53.9%
1.8%2.0%
Total Benefits (present value, risk-adjusted)
Lower hardware and
maintenance costs
Reduced ongoing administration
cost
Reduced startup and
implementation cost
Improved time to implement -
Revenue lift
Improved BI/Analytics
productivity
Improved campign management
productivity
72.1%
1.5%
26.2%
0.2%
Total Costs (present value, risk-adjusted)
Hardware
Planning and Implementation
Administration
Training and support

Forrester Consulting
The Total Economic Impact Of IBM’s Netezza Data Warehouse Appliance With Advanced Analytics
Page 5
• Legacy DW environment. The level of operational and capital cost savings will depend on the organization’s
legacy environment and the alternatives compared with investing in IBM Netezza appliances. In this case, the
organization migrated two separate data warehouses down to a single data warehouse instance with an IBM
Netezza appliance resulting in operational and capital cost savings.
• Business opportunities. The level of top-line impact will vary in large part on how the data impacts external
initiatives. In the case of the interviewed organization, there was a clear link between the processing of advanced
analytics and the ability to roll out external marketing campaigns.
• Productivity. The level of productivity increases will depend on the ability of end users individually and in teams
to analyze, evaluate, and take more effective action on intelligence delivered and processed through the IBM
Netezza appliance.
Disclosures The reader should be aware of the following:
• The study is commissioned by IBM and delivered by the Forrester Consulting group.
• Forrester makes no assumptions as to the potential ROI that other organizations will receive. Forrester strongly
advises that readers should use their own estimates within the framework provided in the report to determine the
appropriateness of an investment in IBM’s Netezza data warehouse appliances with advanced analytics.
• IBM reviewed and provided feedback to Forrester, but Forrester maintains editorial control over the study and its
findings and does not accept changes to the study that contradict Forrester’s findings or obscure the meaning of
the study.
• The customer names for the interviews were provided by IBM.
Forrester Consulting
The Total Economic Impact Of IBM’s Netezza Data Warehouse Appliance With Advanced Analytics
Page 6
TEI Framework And Methodology
Introduction
From the background information provided in the interviews, Forrester has constructed a Total Economic Impact™
(TEI) analysis for those organizations considering deployment of IBM’s Netezza data warehouse appliance with
advanced analytics. The objective of the framework is to identify the cost, benefit, flexibility, and risk factors that affect
the investment decision.
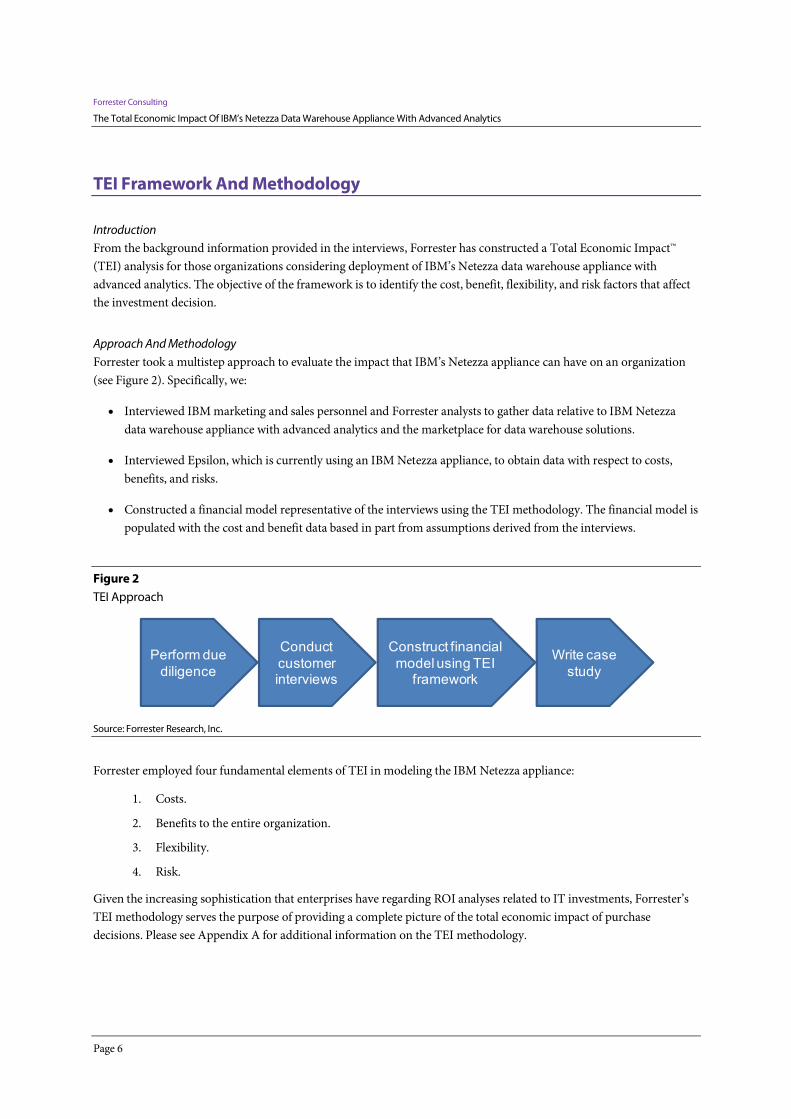
Approach And Methodology
Forrester took a multistep approach to evaluate the impact that IBM’s Netezza appliance can have on an organization
(see Figure 2). Specifically, we:
• Interviewed IBM marketing and sales personnel and Forrester analysts to gather data relative to IBM Netezza
data warehouse appliance with advanced analytics and the marketplace for data warehouse solutions.
• Interviewed Epsilon, which is currently using an IBM Netezza appliance, to obtain data with respect to costs,
benefits, and risks.
• Constructed a financial model representative of the interviews using the TEI methodology. The financial model is
populated with the cost and benefit data based in part from assumptions derived from the interviews.
Figure 2
TEI Approach
Source: Forrester Research, Inc.
Forrester employed four fundamental elements of TEI in modeling the IBM Netezza appliance:
1. Costs.
2. Benefits to the entire organization.
3. Flexibility.
4. Risk.
Given the increasing sophistication that enterprises have regarding ROI analyses related to IT investments, Forrester’s
TEI methodology serves the purpose of providing a complete picture of the total economic impact of purchase
decisions. Please see Appendix A for additional information on the TEI methodology.
Construct financial
model using TEI framework
Write case
study
Perform due
diligence
Conduct
customer interviews

Forrester Consulting
The Total Economic Impact Of IBM’s Netezza Data Warehouse Appliance With Advanced Analytics
Page 7
Analysis
Interview Highlights A single organization, Epsilon, was interviewed for this study. Epsilon is a marketing services firm based in the US with
offices throughout the globe. Epsilon provides a broad array of data-driven, multichannel marketing solutions that
leverage consumer insight to help brands deepen their relationships with customers. Services include strategic
consulting, acquisition and customer database technologies, loyalty management, proprietary data, predictive
modeling, and a full range of direct and digital agency services, including creative, interactive web design, email
deployment, search engine optimization, and direct mail production. In addition, Epsilon is the world’s largest
permission-based email marketer and IBM Netezza’s top marketing services partner.
The interviews uncovered several salient points that were used as the basis for the analysis:
• Epsilon is the world’s largest global permission-based email provider with clients across multiple industries.
Epsilon has deployed IBM Netezza appliances as the data warehouse platform supporting many of its largest
clients since 2003.
• Over three years ago, one of Epsilon’s top clients made the decision and needed to integrate its campaign data
warehouse into a single product. Epsilon proposed to the client that it consolidate two separate data warehouse
instances into a single data warehouse with an IBM Netezza appliance for advanced analytics.
• The case for moving to an IBM Netezza appliance involved a combination of operational and capital cost savings
through consolidation as well as the ability to improve the time to process advanced analytics for individual
campaigns. The individual campaigns were specifically performing credit scoring analytics across a targeted
sample of the US population.
• The cost associated with the investment in an IBM Netezza appliance included the cost of the appliance, annual
maintenance, planning, implementation, and training, as well as ongoing cost of administration.
• Epsilon noted that due to the increased performance, the organization could change the way campaigns were
created and delivered. The IBM Netezza appliance allowed for not only results to be delivered faster but it also
gave the organization deeper granularity within massive data sets. Campaigns could leverage a comprehensive
view of the individual across massive data assets: company customer data, credit bureau, demographic/compiled
data, partner data, and transactional data. This resulted in more effective campaigns and higher productivity of
campaign staff.
Framework Assumptions
Table 2 provides the model assumptions that Forrester used in this analysis.
Forrester Consulting
The Total Economic Impact Of IBM’s Netezza Data Warehouse Appliance With Advanced Analytics
Page 8
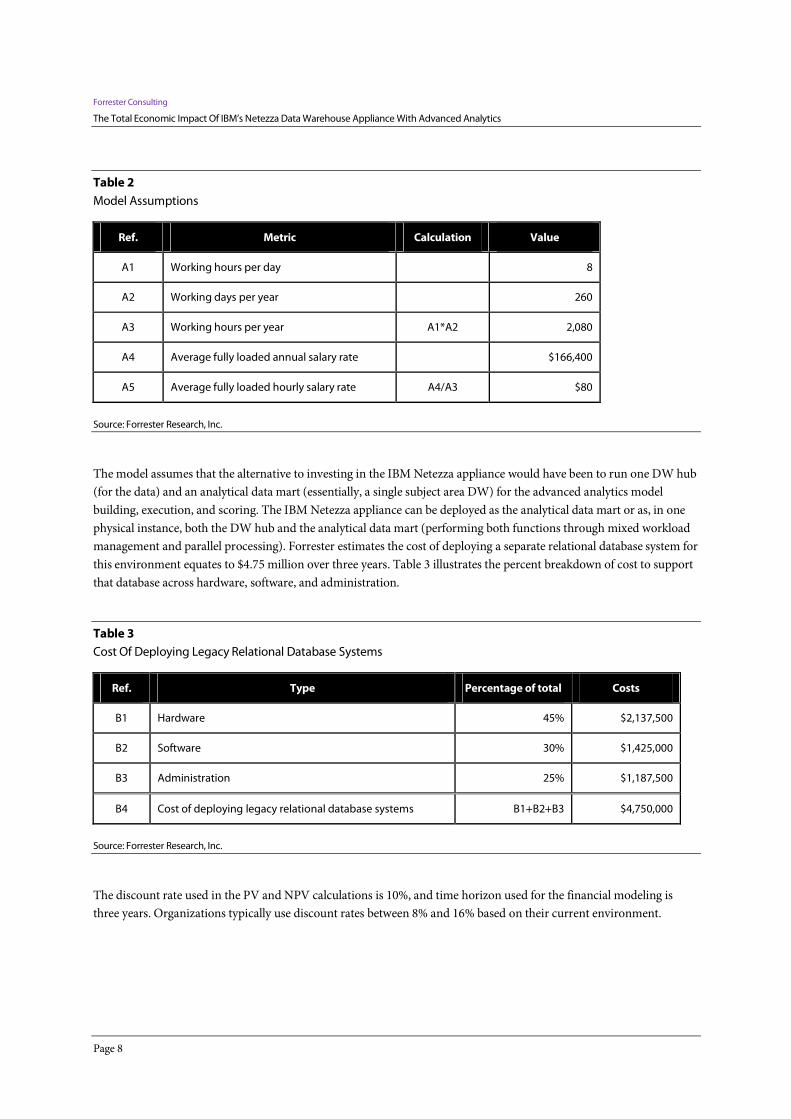
Table 2
Model Assumptions
Ref. Metric Calculation Value
A1 Working hours per day 8
A2 Working days per year 260
A3 Working hours per year A1*A2 2,080
A4 Average fully loaded annual salary rate $166,400
A5 Average fully loaded hourly salary rate A4/A3 $80
Source: Forrester Research, Inc.
The model assumes that the alternative to investing in the IBM Netezza appliance would have been to run one DW hub
(for the data) and an analytical data mart (essentially, a single subject area DW) for the advanced analytics model
building, execution, and scoring. The IBM Netezza appliance can be deployed as the analytical data mart or as, in one
physical instance, both the DW hub and the analytical data mart (performing both functions through mixed workload
management and parallel processing). Forrester estimates the cost of deploying a separate relational database system for
this environment equates to $4.75 million over three years. Table 3 illustrates the percent breakdown of cost to support
that database across hardware, software, and administration.
Table 3
Cost Of Deploying Legacy Relational Database Systems
Ref. Type Percentage of total Costs
B1 Hardware 45% $2,137,500
B2 Software 30% $1,425,000
B3 Administration 25% $1,187,500
B4 Cost of deploying legacy relational database systems B1+B2+B3 $4,750,000
Source: Forrester Research, Inc.
The discount rate used in the PV and NPV calculations is 10%, and time horizon used for the financial modeling is
three years. Organizations typically use discount rates between 8% and 16% based on their current environment.

Forrester Consulting
The Total Economic Impact Of IBM’s Netezza Data Warehouse Appliance With Advanced Analytics
Page 9
Readers are urged to consult with their respective company’s finance department to determine the most appropriate
discount rate to use within their own organizations.
Costs This section describes and lists the projected incremental costs for deploying and using the IBM Netezza appliances
over a three-year period. Estimates are based on initial estimates a will vary on an implementation-by-implementation
basis.
Technology Costs
The composite organization had to invest in an IBM Netezza appliance. This appliance is deployed next to the existing
data warehouse environment. The initial investment of $640,000 includes the hardware costs, related software licenses,
and maintenance fees for the first year. For the following years, the composite organization pays an annual
maintenance fee of 18% of upfront cost, equating to an annual spend of $115,000.
Please note that we used IBM list prices in this analysis. Readers should ask for a quote to determine what hardware,
software, and maintenance costs would be applicable for their particular environments.
Internal Implementation Costs
The internal labor costs for planning, implementation, and project management are indicated in row C2 of Table 4
below. For the interviewed organization, we assumed three people working for about 120 hours each at a fully burdened
hourly cost of $80.
Training Fees
In this analysis, we assume that two people from the storage team attend a training course. The total training cost of
$4,800 is indicated in row C4 in Table 4 below.
Administrative Costs
Ongoing administrative costs include the labor necessary to support and manage the IBM Netezza appliance on a daily
basis. For the purpose of this analysis, the organization will allocate one and one quarter staff time to support and
manage the new appliances. Assuming a fully burdened cost of $80 per hour, we can calculate that the total yearly cost
of administration and support equates to $208,000.
Total Costs
Table 4 summarizes the incremental costs incurred by the reference organization for deploying and using the IBM
Netezza appliances over a three-year period.

Forrester Consulting
The Total Economic Impact Of IBM’s Netezza Data Warehouse Appliance With Advanced Analytics
Page 10
Table 4
Total Costs (Non-Risk-Adjusted)
Ref. Costs Initial Year 1 Year 2 Year 3 Total
C1 Technology costs $640,000 $0 $115,200 $115,200 $870,400
C2 Planning and implementation costs $28,800 $0 $0 $0 $28,800
C3 Administration costs $0 $208,000 $208,000 $208,000 $624,000
C4 Training costs $0 $4,800 $0 $0 $4,800
Ct Total costs (non-risk-adjusted) $668,800 $212,800 $323,200 $323,200 $1,528,000
Source: Forrester Research, Inc.
Benefits This section illustrates the representative benefits from investing in the IBM Netezza appliances as a result of
discussions with Epsilon. The benefits described to Forrester included reduced capital and operational costs, improved
campaign impact, as well as improved end user productivity through faster data analysis.
IT Capital Cost Savings
As noted in Table 3, Epsilon was faced with the choice of either deploying two data warehouse platforms or deploying a
single data warehouse in conjunction with the IBM Netezza appliance. This section illustrates the capital cost savings on
not having to deploy one of the two data warehouses. Forrester assumes the cost of hardware for the alternative
approach equates to roughly $2.1 million dollars (see B1). Deploying the IBM Netezza platform results in an upfront
capital cost reduction of 40% of the total alternative spend realized in the first year of analysis. With upfront capital cost
savings, annual maintenance savings for the alternative platform is also included as a result of not having to deploy the
second data warehouse. The annual savings in Year 2 and Year 3 equate to $171,000 per year.

Forrester Consulting
The Total Economic Impact Of IBM’s Netezza Data Warehouse Appliance With Advanced Analytics
Page 11
Table 5
IT Capital Cost Savings (Non-Risk-Adjusted)
Ref. Costs Value/
calculation Year 1 Year 2 Year 3 Total
D1 System cost — hardware $2,137,500 (see
B1)
D2 Percent reduction 40%
D3 Maintenance as a percent of hardware 20%
D4 Benefit realization
50% 100% 100%
Dt Total savings — hardware and maintenance
Year 1: D1*D2*D4
Year 2 and Year 3: D1*D2*D3*D4
$427,500 $171,000 $171,000 $769,500
Source: Forrester Research, Inc.
IT Operational Cost Savings
In addition to the capital cost savings from not having to deploy multiple data warehouses to run the advanced analytics
processing, Epsilon also noted the potential operational cost savings from the IBM Netezza appliance investment. This
included the reduced administrative costs of not only having to manage multiple relational databases but also the cost
avoidance of not having to deploy the second data warehouse.
IT Operational Cost Savings — Reduced Administration Costs
Reduced administration costs represent a piece of the overall cost savings for Epsilon. For this analysis, Forrester
assumes a reduction of 60% in the cost of administration by deploying the IBM Netezza appliances in conjunction with
a single data warehouse. This is a result of primarily reduced complexity within the environment and reduced hours
devoted to changes and updates of two separate data warehouses.
Forrester Consulting
The Total Economic Impact Of IBM’s Netezza Data Warehouse Appliance With Advanced Analytics
Page 12
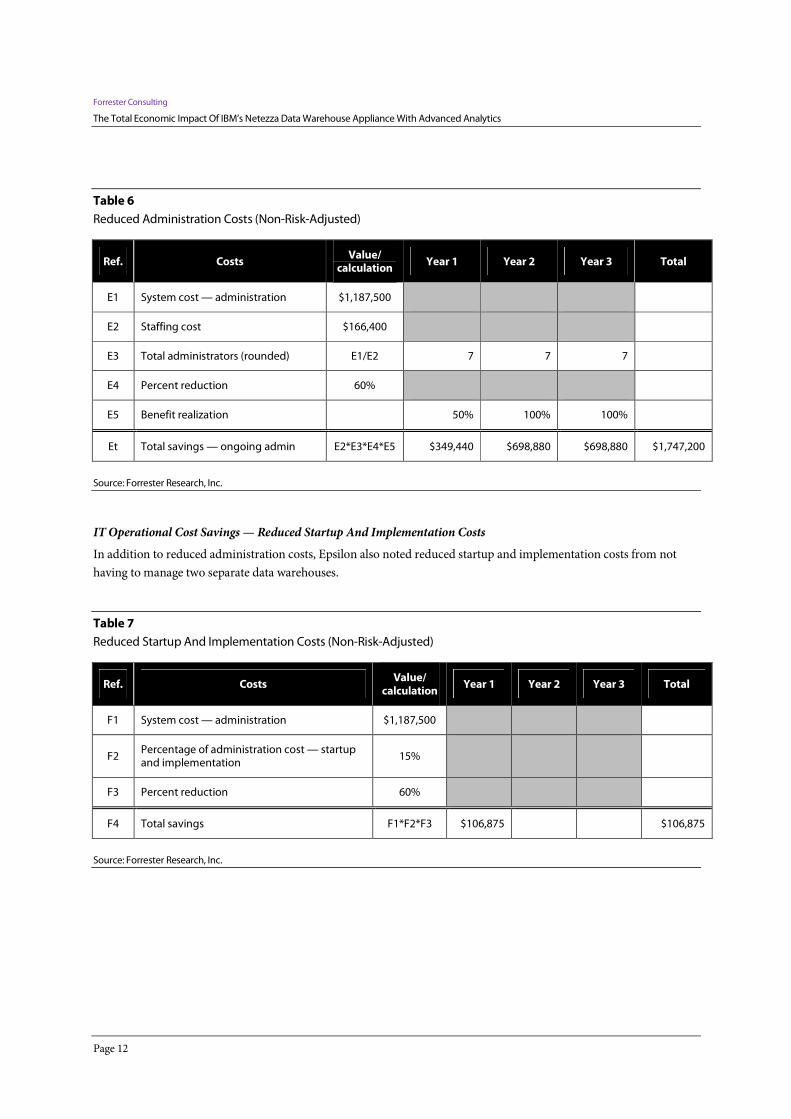
Table 6
Reduced Administration Costs (Non-Risk-Adjusted)
Ref. Costs Value/
calculation Year 1 Year 2 Year 3 Total
E1 System cost — administration $1,187,500
E2 Staffing cost $166,400
E3 Total administrators (rounded) E1/E2 7 7 7
E4 Percent reduction 60%
E5 Benefit realization
50% 100% 100%
Et Total savings — ongoing admin E2*E3*E4*E5 $349,440 $698,880 $698,880 $1,747,200
Source: Forrester Research, Inc.
IT Operational Cost Savings — Reduced Startup And Implementation Costs
In addition to reduced administration costs, Epsilon also noted reduced startup and implementation costs from not
having to manage two separate data warehouses.
Table 7
Reduced Startup And Implementation Costs (Non-Risk-Adjusted)
Ref. Costs Value/
calculation Year 1 Year 2 Year 3 Total
F1 System cost — administration $1,187,500
F2 Percentage of administration cost — startup and implementation
15%
F3 Percent reduction 60%
F4 Total savings F1*F2*F3 $106,875
$106,875
Source: Forrester Research, Inc.

Forrester Consulting
The Total Economic Impact Of IBM’s Netezza Data Warehouse Appliance With Advanced Analytics
Page 13
Revenue Lift
In addition to the operational and capital cost savings, another key benefit for Epsilon was the ability to process
advanced analytics in less time for their customer. A critical component of the value proposition for Epsilon was being
able to deliver credit scoring analytics to their customer, ultimately providing their customer with ability to deliver
targeted campaigns ahead of their competitors. Prior to the migration, the credit scoring process was time-consuming,
often taking up to two days to process the data. In addition, there was no way to provide a comprehensive view of the
individual across massive data assets: company customer data, credit bureau, demographic/compiled data, partner data,
and transactional data without the need for time-consuming data preparation. The customer noted that data was pulled
from the database, scored and analyzed on a third-party application, and then an analytic model had to be loaded back
into the database. After the credit scoring process was complete, the end user BI and campaign group would be
responsible for identifying the target audience based on changing external factors.
The result in moving to an IBM Netezza data warehouse appliance was the ability to go much deeper in granularity
across individual data sets. Company customer data, credit bureau, demographic/compiled data, partner data, and
transactional data could be analyzed in-database allowing for greater segmentation and targeting of campaigns. The
result is an increase in campaign effectiveness ultimately leading to higher conversion for each campaign.
To calculate this benefit, Forrester conservatively assumes one primary campaign using credit scoring data will be
impacted by improved time of delivery of data. Each campaign has a target reach on average of roughly 3 million
potential customers. These customers are also being solicited by competing companies and as a result, receiving a
campaign promotion immediately after a market change increases the likelihood of conversion and competitive
advantage. For the client organization, it meant taking a two-month process and condensing it to two days. The result
to the campaign is a 1% increase in conversion as a result of pushing out a campaign ahead of its competitors.
Assuming a converted customer’s average yearly account balance is $500, and the net margin on that outstanding
balance is 10%, the total impact equates to roughly $750,000 in the first year and $1.5 million in Years 2 and 3.
Forrester Consulting
The Total Economic Impact Of IBM’s Netezza Data Warehouse Appliance With Advanced Analytics
Page 14
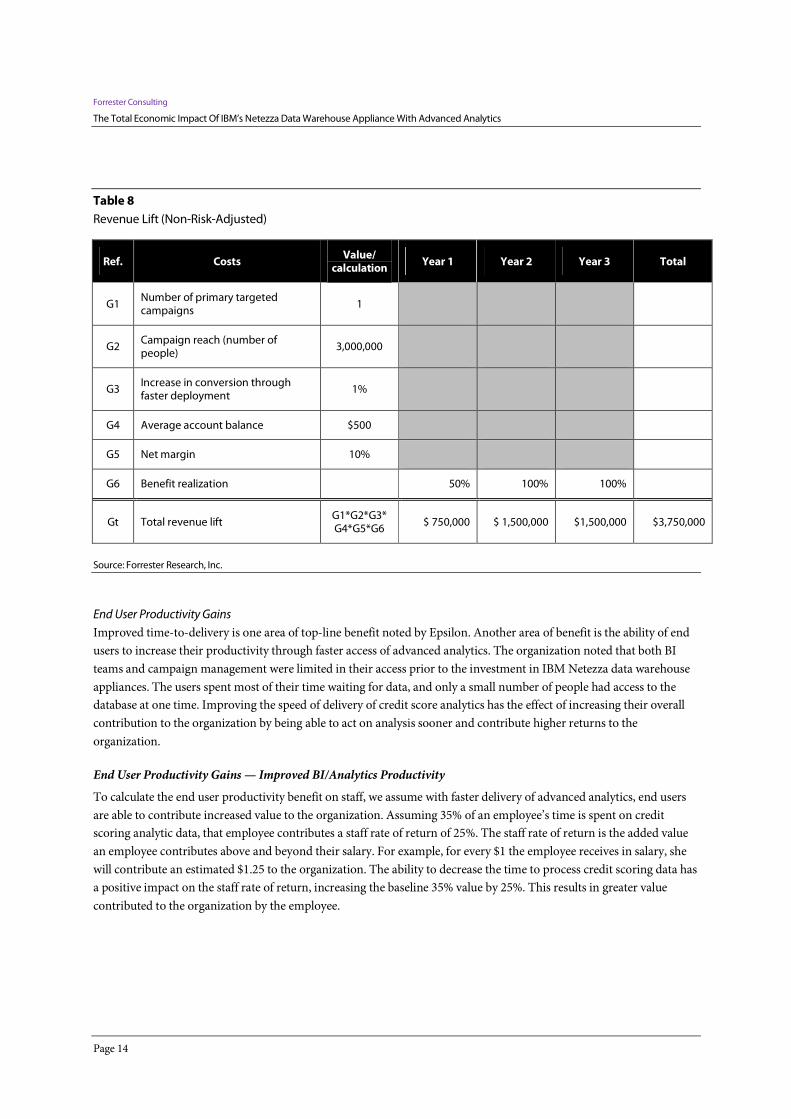
Table 8
Revenue Lift (Non-Risk-Adjusted)
Ref. Costs Value/
calculation Year 1 Year 2 Year 3 Total
G1 Number of primary targeted campaigns
1
G2 Campaign reach (number of people)
3,000,000
G3 Increase in conversion through faster deployment
1%
G4 Average account balance $500
G5 Net margin 10%
G6 Benefit realization
50% 100% 100%
Gt Total revenue lift G1*G2*G3* G4*G5*G6
$ 750,000 $ 1,500,000 $1,500,000 $3,750,000
Source: Forrester Research, Inc.
End User Productivity Gains
Improved time-to-delivery is one area of top-line benefit noted by Epsilon. Another area of benefit is the ability of end
users to increase their productivity through faster access of advanced analytics. The organization noted that both BI
teams and campaign management were limited in their access prior to the investment in IBM Netezza data warehouse
appliances. The users spent most of their time waiting for data, and only a small number of people had access to the
database at one time. Improving the speed of delivery of credit score analytics has the effect of increasing their overall
contribution to the organization by being able to act on analysis sooner and contribute higher returns to the
organization.
End User Productivity Gains — Improved BI/Analytics Productivity
To calculate the end user productivity benefit on staff, we assume with faster delivery of advanced analytics, end users
are able to contribute increased value to the organization. Assuming 35% of an employee’s time is spent on credit
scoring analytic data, that employee contributes a staff rate of return of 25%. The staff rate of return is the added value
an employee contributes above and beyond their salary. For example, for every $1 the employee receives in salary, she
will contribute an estimated $1.25 to the organization. The ability to decrease the time to process credit scoring data has
a positive impact on the staff rate of return, increasing the baseline 35% value by 25%. This results in greater value
contributed to the organization by the employee.

Forrester Consulting
The Total Economic Impact Of IBM’s Netezza Data Warehouse Appliance With Advanced Analytics
Page 15
Table 9
Improved BI/Analytics Productivity (Non-Risk-Adjusted)
Ref. Costs Value/
calculation Year 1 Year 2 Year 3 Total
H1 Number of staff 15
H2 Hourly cost per staff $80
H3 Percent of time spent on credit scoring analytics
35%
H4 Staff rate of return 25%
H5 Improvement in rate of return 20%
H6 Benefit realization
50% 100% 100%
H7 Improved BI/analytics productivity H1*H2*H3*H4*H5*H6*
2080 $21,840 $43,680 $43,680 $109,200
Source: Forrester Research, Inc.
End User Productivity Gains — Improved Campaign Management Productivity
The impact of reduced processing time also improves the campaign management staff. The impact is measured in the
same way as BI staff; however, we assume a greater share of staff time is impacted by reduced processing time, 50% as
compared with 35% in the case of BI staff.
Table 10
Improved Campaign Management Productivity (Non-Risk-Adjusted)
Ref. Costs Value/
calculation Year 1 Year 2 Year 3 Total
I1 Number of staff 12
I2 Hourly cost per staff 80
I3 Percent of time spent on campaigns 50%
I4 Staff rate of return 25%
I5 Improvement in rate of return 20%

Forrester Consulting
The Total Economic Impact Of IBM’s Netezza Data Warehouse Appliance With Advanced Analytics
Page 16
Ref. Costs Value/
calculation Year 1 Year 2 Year 3 Total
I6 Benefit realization
50% 100% 100%
I7 Improved campaign management productivity
I1*I2*I3*I4*I5* I6
$24,960 $49,920 $49,920 $124,800
Source: Forrester Research, Inc.
Total Benefits
Table 11 illustrates the total quantified benefits as a result of the investment in IBM Netezza data warehouse appliances.
Table 11
Total Benefits (Non-Risk-Adjusted)
Ref Metric Year 1 Year 2 Year 3 Total
J1 Lower hardware and maintenance costs $427,500 $171,000 $171,000 $769,500
J2 Reduced ongoing administration cost $349,440 $698,880 $698,880 $1,747,200
J3 Reduced startup and implementation cost $106,875 - - $106,875
J4 Revenue lift $750,000 $1,500,000 $1,500,000 $3,750,000
J5 Improved BI/analytics productivity $21,840 $43,680 $43,680 $109,200
J6 Improved campaign management productivity $24,960 $49,920 $49,920 $124,800
J7 Total benefits (non-risk-adjusted) $1,680,615 $2,463,480 $2,463,480 $6,607,575
Source: Forrester Research, Inc.
Flexibility Flexibility, as defined by TEI, represents an investment in additional capacity or capability that could be turned into
business benefit for some future additional investment. This provides an organization with the “right” or the ability to
engage in future initiatives but not the obligation to do so. There are multiple scenarios in which a customer might
choose to implement IBM Netezza data warehouse appliances for advanced analytics and later realize additional uses
and business opportunities. Flexibility would also be quantified when evaluated as part of a specific project (described
in more detail in Appendix A).
While Forrester believes organizations can take advantage of these flexibility options, quantification (using the financial
industry standard Black-Scholes or the binomial option pricing models) of the additional value associated with these
Forrester Consulting
The Total Economic Impact Of IBM’s Netezza Data Warehouse Appliance With Advanced Analytics
Page 17
options for this customer would require scenario development and forward-looking analysis, which is not available at
this time.
Risk Forrester defines two types of risk associated with this analysis: implementation risk and impact risk. “Implementation
risk” is the risk that a proposed investment in IBM Netezza data warehouse appliance may deviate from the original or
expected requirements, resulting in higher costs than anticipated. “Impact risk” refers to the risk that the business or
technology needs of the organization may not be met by the investment in IBM Netezza appliance, resulting in lower
overall total benefits. The greater the uncertainty, the wider the potential range of outcomes for cost and benefit
estimates.
Quantitatively capturing investment and impact risk by directly adjusting the financial estimates results in more
meaningful and accurate estimates and a more accurate projection of the ROI. In general, risks affect costs by raising
the original estimates, and they affect benefits by reducing the original estimates. The risk-adjusted numbers should be
taken as “realistic” expectations, as they represent the expected values considering risk.
The following implementation risks that affect costs are identified as part of this analysis:
• Planning, installation, and testing could demand more time than originally anticipated due to the organization’s
prior experience with appliance-based technology.
• Acquisition costs could be higher than originally anticipated for both based on the level of discount price received
from IBM.
The following impact risks that affect benefits are identified as part of the analysis:
• The amount of operational and capital cost savings could be lower than anticipated due to the scope and type of
alternatives considered.
• The end user and campaign impact could be lower than anticipated due to lower adoption and use of advanced
analytics.
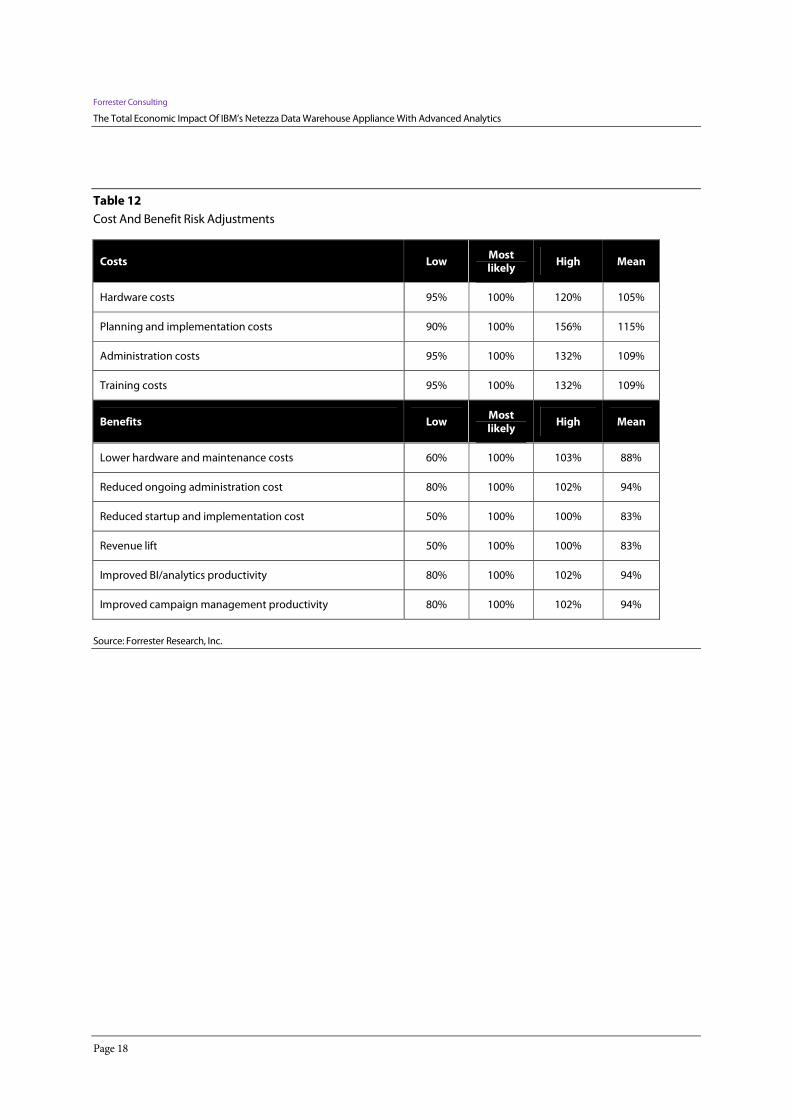
Table 12 shows the values used to adjust for risk and uncertainty in the cost and benefit estimates. The TEI model uses a
triangular distribution method to calculate risk-adjusted values. To construct the distribution, it is necessary to first
estimate the low, most likely, and high values that could occur within the current environment. The risk-adjusted value
is the mean of the distribution of those points. Readers are urged to apply their own risk ranges based on their own
degree of confidence in the cost and benefit estimates.
Forrester Consulting
The Total Economic Impact Of IBM’s Netezza Data Warehouse Appliance With Advanced Analytics
Page 18
Table 12
Cost And Benefit Risk Adjustments
Costs Low Most likely
High Mean
Hardware costs 95% 100% 120% 105%
Planning and implementation costs 90% 100% 156% 115%
Administration costs 95% 100% 132% 109%
Training costs 95% 100% 132% 109%
Benefits Low Most likely
High Mean
Lower hardware and maintenance costs 60% 100% 103% 88%
Reduced ongoing administration cost 80% 100% 102% 94%
Reduced startup and implementation cost 50% 100% 100% 83%
Revenue lift 50% 100% 100% 83%
Improved BI/analytics productivity 80% 100% 102% 94%
Improved campaign management productivity 80% 100% 102% 94%
Source: Forrester Research, Inc.
Forrester Consulting
The Total Economic Impact Of IBM’s Netezza Data Warehouse Appliance With Advanced Analytics
Page 19
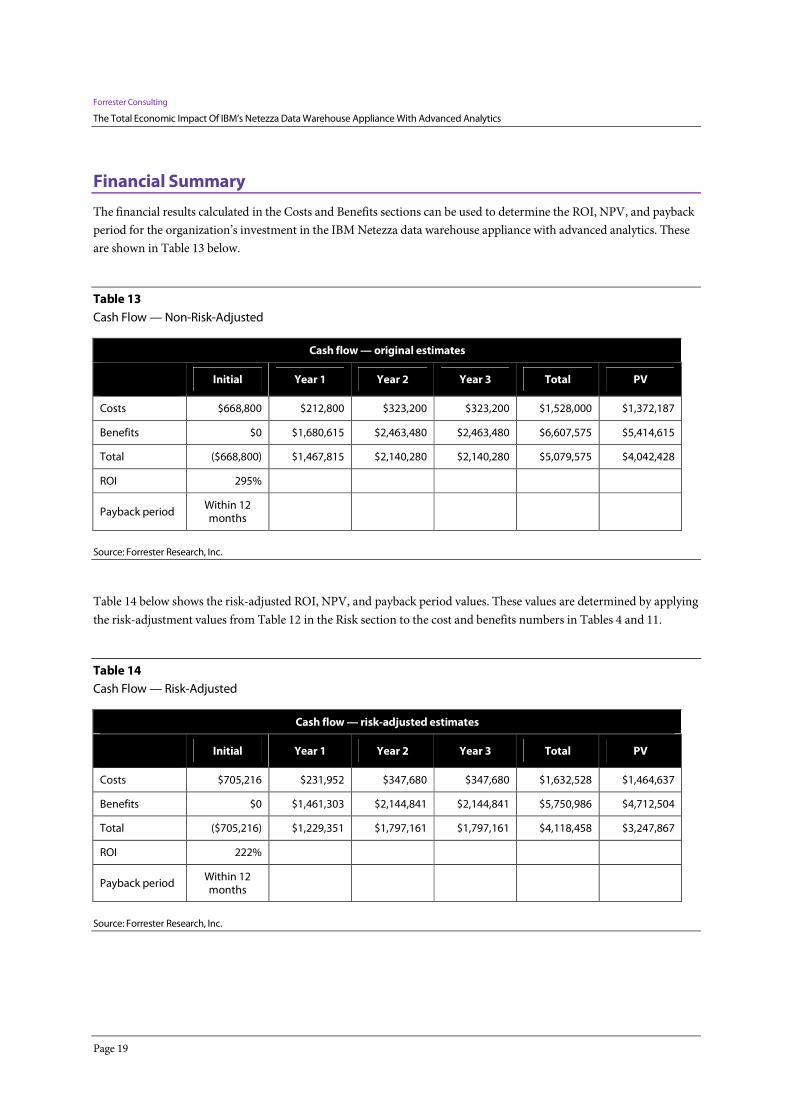
Financial Summary
The financial results calculated in the Costs and Benefits sections can be used to determine the ROI, NPV, and payback
period for the organization’s investment in the IBM Netezza data warehouse appliance with advanced analytics. These
are shown in Table 13 below.
Table 13
Cash Flow — Non-Risk-Adjusted
Cash flow — original estimates
Initial Year 1 Year 2 Year 3 Total PV
Costs $668,800 $212,800 $323,200 $323,200 $1,528,000 $1,372,187
Benefits $0 $1,680,615 $2,463,480 $2,463,480 $6,607,575 $5,414,615
Total ($668,800) $1,467,815 $2,140,280 $2,140,280 $5,079,575 $4,042,428
ROI 295%
Payback period Within 12 months
Source: Forrester Research, Inc.
Table 14 below shows the risk-adjusted ROI, NPV, and payback period values. These values are determined by applying
the risk-adjustment values from Table 12 in the Risk section to the cost and benefits numbers in Tables 4 and 11.
Table 14
Cash Flow — Risk-Adjusted
Cash flow — risk-adjusted estimates
Initial Year 1 Year 2 Year 3 Total PV
Costs $705,216 $231,952 $347,680 $347,680 $1,632,528 $1,464,637
Benefits $0 $1,461,303 $2,144,841 $2,144,841 $5,750,986 $4,712,504
Total ($705,216) $1,229,351 $1,797,161 $1,797,161 $4,118,458 $3,247,867
ROI 222%
Payback period Within 12 months
Source: Forrester Research, Inc.
Forrester Consulting
The Total Economic Impact Of IBM’s Netezza Data Warehouse Appliance With Advanced Analytics
Page 20
IBM Netezza Data Warehouse Appliance With Advanced Analytics: Overview
According to IBM, every IBM Netezza data warehouse appliance is delivered with IBM Netezza Analytics, an
embedded software platform for advanced analytics. It provides the technology infrastructure to support enterprise
deployments of parallel, in-database analytics. Support for a variety of popular tools and languages as well as a built-in
library of parallelized analytic functions make it simple to move analytic modeling and scoring inside the data
warehouse appliance. IBM Netezza Analytics is fully integrated into the IBM Netezza data warehouse asymmetric
massively parallel processing (AMPP) architecture enabling data exploration, model building, model diagnostics, and
scoring with unprecedented speed. IBM Netezza data warehouse appliance with advanced analytics can process massive
data to solve complex problems orders of magnitude faster than typical solutions. The open and flexible advanced
analytics platform enables the development and deployment of analytics to drive game-changing results. With IBM
Netezza Analytics, parallelized analytics for data preparation, data mining, predictive modeling, and optimization can
exploit the IBM Netezza appliance’s AMPP architecture to achieve high throughput of advanced analytics on huge data.
IBM Netezza Analytics can be extended by creating your own powerful, advanced analytics and embed them into the
appliance. Analytic applications, visualization tools, and business intelligence tools can harness the parallelized
advanced analytics via a variety of programming methods such as SQL, Java, MapReduce, Python, R, C, C++, and
Fortran to deliver powerful, insightful analytics.
The IBM Netezza Analytics platform can be used for:
1. Building and deploying advanced analytic applications.
2. Leveraging parallel analytics via visualization or business intelligence tools.
3. Performing ad hoc analysis especially on huge data or computational intensive problems.
Visualization and business intelligence tools leverage the analytics in the IBM Netezza Analytics platform via SQL for
targeted inquiries.
The IBM Netezza appliance implements parallel processing as close to the source of data as possible, and it allows
customers to benefit from an open and flexible appliance ready to handle increasing volumes of data. A balanced
architecture is key to achieving the best possible price/performance for advanced analytics, and every component of the
IBM Netezza appliance architecture is carefully selected and optimized to service data as fast as the physics of the disk
allows.
By combining a fast data warehouse with high-performance embedded analytics into a single platform, IBM has
reduced the need for data movement and enabled advanced analytics on large data sets.
Forrester Consulting
The Total Economic Impact Of IBM’s Netezza Data Warehouse Appliance With Advanced Analytics
Page 21
Appendix A: Total Economic Impact™ Overview
Total Economic Impact is a methodology developed by Forrester Research that enhances a company’s technology
decision-making processes and assists vendors in communicating the value proposition of their products and services
to clients. The TEI methodology helps companies demonstrate, justify, and realize the tangible value of IT initiatives to
both senior management and other key business stakeholders.
The TEI methodology consists of four components to evaluate investment value: benefits, costs, risks, and flexibility.
Benefits
Benefits represent the value delivered to the user organization — IT and/or business units — by the proposed product
or project. Often product or project justification exercises focus just on IT cost and cost reduction, leaving little room to
analyze the effect of the technology on the entire organization. The TEI methodology and the resulting financial model
place equal weight on the measure of benefits and the measure of costs, allowing for a full examination of the effect of
the technology on the entire organization. Calculation of benefit estimates involves a clear dialogue with the user
organization to understand the specific value that is created. In addition, Forrester also requires that there be a clear line
of accountability established between the measurement and justification of benefit estimates after the project has been
completed. This ensures that benefit estimates tie back directly to the bottom line.
Costs
Costs represent the investment necessary to capture the value, or benefits, of the proposed project. IT or the business
units may incur costs in the form of fully burdened labor, subcontractors, or materials. Costs consider all the
investments and expenses necessary to deliver the proposed value. In addition, the cost category within TEI captures
any incremental costs over the existing environment for ongoing costs associated with the solution. All costs must be
tied to the benefits that are created.
Risk
Risk measures the uncertainty of benefit and cost estimates contained within the investment. Uncertainty is measured
in two ways: 1) the likelihood that the cost and benefit estimates will meet the original projections, and 2) the likelihood
that the estimates will be measured and tracked over time. TEI applies a probability density function known as
“triangular distribution” to the values entered. At minimum, three values are calculated to estimate the underlying
range around each cost and benefit.
Flexibility
Within the TEI methodology, direct benefits represent one part of the investment value. While direct benefits can
typically be the primary way to justify a project, Forrester believes that organizations should be able to measure the
strategic value of an investment. Flexibility represents the value that can be obtained for some future additional
investment building on top of the initial investment already made. For instance, an investment in an enterprise wide
upgrade of an office productivity suite can potentially increase standardization (to increase efficiency) and reduce
licensing costs. However, an embedded collaboration feature may translate to greater worker productivity if activated.
The collaboration can only be used with additional investment in training at some future point in time. However,
having the ability to capture that benefit has a present value that can be estimated. The flexibility component of TEI
captures that value.

Forrester Consulting
The Total Economic Impact Of IBM’s Netezza Data Warehouse Appliance With Advanced Analytics
Page 22
Appendix B: Glossary
Discount rate: The interest rate used in cash flow analysis to take into account the time value of money. Although the
Federal Reserve Bank sets a discount rate, companies often set a discount rate based on their business and investment
environment. Forrester assumes a yearly discount rate of 10% for this analysis. Organizations typically use discount
rates between 8% and 16% based on their current environment. Readers are urged to consult their respective
organization to determine the most appropriate discount rate to use in their own environment.
Net present value (NPV): The present or current value of (discounted) future net cash flows given an interest rate (the
discount rate). A positive project NPV normally indicates that the investment should be made, unless other projects
have higher NPVs.
Present value (PV): The present or current value of (discounted) cost and benefit estimates given at an interest rate
(the discount rate). The PV of costs and benefits feed into the total net present value of cash flows.
Payback period: The breakeven point for an investment. The point in time at which net benefits (benefits minus costs)
equal initial investment or cost.
Return on investment (ROI): A measure of a project’s expected return in percentage terms. ROI is calculated by
dividing net benefits (benefits minus costs) by costs.
A Note On Cash Flow Tables
The following is a note on the cash flow tables used in this study (see the example table below). The initial investment
column contains costs incurred at “time 0” or at the beginning of Year 1. Those costs are not discounted. All other cash
flows in Years 1 through 3 are discounted using the discount rate (shown in Framework Assumptions section) at the
end of the year. Present value (PV) calculations are calculated for each total cost and benefit estimate. Net present value
(NPV) calculations are not calculated until the summary tables and are the sum of the initial investment and the
discounted cash flows in each year.
Table [Example]
Example Table
Ref. Category Calculation Initial cost Year 1 Year 2 Year 3 Total
Source: Forrester Research, Inc.
Appendix C: Related Forrester Research
“The ROI Of Data Warehousing Appliances: Benefits, Costs, And Risks,” Forrester Research, Inc., November 10, 2010

Forrester Consulting
The Total Economic Impact Of IBM’s Netezza Data Warehouse Appliance With Advanced Analytics
Page 23
Appendix D: Endnotes
1 Forrester risk-adjusts the summary financial metrics to take into account the potential uncertainty of the cost and
benefit estimates. For more information on Risk, please see page24.