the total economic impact™ of servicenow now platform · study commissioned by servicenow april...
TRANSCRIPT

A Forrester Total Economic Impact™
Study Commissioned By ServiceNow
April 2017
The Total Economic Impact™ Of Developing Business Applications On The Now Platform™
Cost Savings And Business Benefits Enabled By ServiceNow

Table Of Contents Executive Summary 1
Key Findings 2
TEI Framework And Methodology 4
The Now Platform Customer Journey 5
Interviewed Organizations 5
Key Challenges 6
Solution Requirements 7
Key Results 7
Composite Organization 8
Financial Summary 9
Flexibility 10
Analysis Summary 10
Financial Analysis 11
Time-to-Value Gains On End User Productivity 11
Shifting From Outsourced To Internal Dev Resources 13
Decreased Dependency On Specialized Developers 14
Legacy Solution EOL/Sun-Setting Savings 15
Unquantified Benefits 17
Now Platform License Costs 19
Training And Implementation 20
ServiceNow Now Platform: Overview 21
Appendix A: Total Economic Impact 23
Appendix B: Detailed Cost Structure Tables 24
Appendix C: Supplemental Material 25
Appendix D: Endnotes 25
Project Director:
Henry Huang
April 2017
ABOUT FORRESTER CONSULTING
Forrester Consulting provides independent and objective research-based
consulting to help leaders succeed in their organizations. Ranging in scope from a
short strategy session to custom projects, Forrester’s Consulting services connect
you directly with research analysts who apply expert insight to your specific
business challenges. For more information, visit forrester.com/consulting.
© 2017, Forrester Research, Inc. All rights reserved. Unauthorized reproduction
is strictly prohibited. Information is based on best available resources.
Opinions reflect judgment at the time and are subject to change. Forrester®,
Technographics®, Forrester Wave, RoleView, TechRadar, and Total Economic
Impact are trademarks of Forrester Research, Inc. All other trademarks are the
property of their respective companies. For additional information, go to
forrester.com

1 | The Total Economic Impact™ Of ServiceNow Now Platform
Executive Summary
ServiceNow provides a cloud-based low-code development platform that
helps its customers accelerate application and digitalized process
development for the purpose of generating greater business outcomes.
ServiceNow commissioned Forrester Consulting to conduct a Total
Economic Impact™ (TEI) study and examine the potential return on
investment (ROI) enterprises may realize by deploying the Now
Platform™. The purpose of this study is to provide readers with a
framework to evaluate the potential financial impact of the Now Platform
on their organizations.
To better understand the benefits, costs, and risks associated with this
investment, Forrester interviewed several customers and conducted a
global survey of customers with years of experience using the Now
Platform, ServiceNow’s platform-as-a-service (PaaS). Forrester found that
faster application delivery was a key element for organizations that desired
to improve business velocity and agility, which is consistent with our
existing findings for organizations that have strategized around digital
transformation.
Prior to using the Now Platform, the customers navigated the application
development and delivery process at a slow pace, as it often required
native-level language development. Scaling was also difficult, as it
required the addition of specialized and hard-to-retain developers fluent in
native-level code. In an era where IT and the associated pieces were
consolidating and limited by budget, business resources to effectively
compete were severely limited. Productivity enhancements in the form of
modernized applications and business processes were at the mercy of dev
teams that were logjammed with requests from their business
counterparts.
The customers interviewed and surveyed realized the limitations of their
previous software development capabilities, where efforts were
marginalized by extensive hard-coded applications in native languages
that required extensive coding, testing, and debugging. In finding and
implementing ServiceNow’s Now Platform, organizations realized
improved efficiencies in utilizing prebuilt APIs, reusable code, and
accelerated low-code development. Likewise, business users also
benefited from faster development capabilities, functionality, and process
delivery — leading to efficiencies throughout their organizations.
ROI 264%
Benefits PV $24.7 million
NPV $17.9 million
Payback 6 months

2 | The Total Economic Impact™ Of ServiceNow Now Platform
Key Findings
Quantified benefits. The following risk-adjusted quantified benefits are
representative of those experienced by the companies interviewed and
surveyed:
› Development efforts were accelerated by 290%, allowing benefit
delivery nearly six months sooner. Organizations had reported that
development efforts were often a combination of both simple and
complex development projects. Development with the Now Platform was
accelerated, delivering projects at four times the speed of existing
development efforts for simple projects. On projects that are more
complex, meaning those that require multiple APIs or serve multiple lines
of business (LOBs), those application development efforts are
accelerated by 1.8x. The cumulative 2.9x improvement in delivery speed
brought about delivery of applications in one third of the time, producing
end user productivity months earlier. Total time-to-value productivity
gains by end users amounted to over $20 million over three years.
› Development efforts were shifted from outsourced efforts to
internal resources, due to the newfound ease of development.
Following the implementation and ramp-up of developers on the Now
Platform, organizations were able to bring a larger percentage of
development projects in house, rather than outsourcing them. The
primary driver enabling this shifting of project allocation was from the
ease of development on the Now Platform. In our composite
organization analysis, the organization saved a total of $2.2 million over
three years by internalizing development efforts.
› Low-code development enabled the use of more junior-level
developers while reallocating more senior developers to value-add
complex projects requiring native code. With less native coding
required and the liberal abundance of reusable code and APIs, the
composite organization was able to leverage more junior-level
developers to deliver projects, especially the projects more simplistic in
nature. A savings of $716,000 was realized over three years with this
reallocation of resources.
› Existing on-premises solutions were retired, providing savings in
solution-related costs of usage and upkeep. Following the
introduction of the cloud-based Now Platform, the organization retired
multiple legacy solutions that included hardware and the ongoing
maintenance, support, and provisioning of virtual instances. In total,
these retired legacy solutions saved the composite $648,000 per year,
or $1.6 million in risk-adjusted present value figures.
Unquantified benefits. The interviewed organizations experienced the
following benefits, which are not quantified for this study:
› Organizations that accelerated their development efforts of apps
and digital business processes improved their Net Promoter Score
(NPS) by 29% and Customer Satisfaction Score (CSAT) by 25%.i
Organizations interviewed and surveyed revealed that, on average, they
had realized a substantial gain in customer satisfaction as a result of
their app development and process improvements. While the effect of
the improved customer experience scores has not been translated into
quantified bottom-line results in this study, Forrester’s existing research
has indicated a high correlation between a better customer experience
and greater revenue growth.ii
Benefits And Costs Time-to-value gains on end user productivity:
$20,122,307
Cost reduction in shifting outsourced development projects to internal resources:
$2,209,767
Now Platform license costs:
$4,623,291

3 | The Total Economic Impact™ Of ServiceNow Now Platform
› Employee experience also improved with the addition of apps and
processes developed on the Now Platform. A common theme across
all interviewed organizations was the improved employee satisfaction
and experience of becoming empowered with applications built with the
Now Platform. Employees across the enterprise, including those who are
not business users, were enabled to access resources such as HR and
knowledgebases. While this benefit category has not been quantified, it
is plausible that better employee experiences and higher satisfaction
can lead to improved retention and related cost savings
Costs. The interviewed organizations experienced the following risk-
adjusted costs:
› Now Platform license costs. The licensing costs of the Now Platform
are based upon the number of users using applications and processes
built on the Now Platform. With an increasing user base over three
years, the licensing costs amounted to $4.6 million.
› Implementation and training costs associated with ramping up.
These include costs of professional services for implementation and
initial vendor training. Additionally, the costs of internal training for
developers and, separately, end users for application usage, totaled $2.2
million over three years.
Forrester’s interviews with three existing customers and 135 customer
respondents yielded a subsequent financial analysis finding that a
composite organization based on these organizations experienced
benefits of over $24.7 million over three years versus costs of roughly $6.8
million, adding up to a net present value (NPV) of $17,882,936 and an ROI
of 264%.
Total benefits PV, $24.7M
Total costs PV, $6.8M
Initial Year 1 Year 2 Year 3
Financial Summary
$20.1M
$2.2M$716.2K $1.6M
Time-to-ValueGains on End-
userProductivity
Shifting FromOutsourced toInternal DevResources
DecreasedDependency on
SpecializedDevelopers
LegacySolution EOL /
SunsettingSavings
Benefits (Three-Year)

4 | The Total Economic Impact™ Of ServiceNow Now Platform
TEI Framework And Methodology
From the information provided in the interviews, Forrester has constructed
a Total Economic Impact™ (TEI) framework for those organizations
considering implementing the ServiceNow Now Platform.
The objective of the framework is to identify the cost, benefit, flexibility, and
risk factors that affect the investment decision. Forrester took a multistep
approach to evaluate the impact that ServiceNow’s Now Platform can have
on an organization:
DUE DILIGENCE
Interviewed ServiceNow stakeholders and Forrester analysts to gather data relative to the Now Platform.
CUSTOMER INTERVIEWS
Interviewed three organizations using the Now Platform to obtain data with respect to costs, benefits, and risks. Data points and metrics were additionally acquired from a global survey to Now Platform customers.
COMPOSITE ORGANIZATION
Designed a composite organization based on characteristics of the interviewed organizations.
FINANCIAL MODEL FRAMEWORK
Constructed a financial model representative of the interviews using the TEI methodology and risk-adjusted the financial model based on issues and concerns of the interviewed organizations.
CASE STUDY
Employed four fundamental elements of TEI in modeling the ServiceNow Now Platform’s impact: benefits, costs, flexibility, and risks. Given the increasing sophistication that enterprises have regarding ROI analyses related to IT investments, Forrester’s TEI methodology serves to provide a complete picture of the total economic impact of purchase decisions. Please see Appendix A for additional information on the TEI methodology.
The TEI methodology
helps companies
demonstrate, justify,
and realize the
tangible value of IT
initiatives to both
senior management
and other key
business
stakeholders.
DISCLOSURES
Readers should be aware of the following:
This study is commissioned by ServiceNow and delivered by Forrester
Consulting. It is not meant to be used as a competitive analysis.
Forrester makes no assumptions as to the potential ROI that other
organizations will receive. Forrester strongly advises that readers use their own
estimates within the framework provided in the report to determine the
appropriateness of an investment in the ServiceNow Now Platform.
ServiceNow reviewed and provided feedback to Forrester, but Forrester
maintains editorial control over the study and its findings and does not accept
changes to the study that contradict Forrester’s findings or obscure the
meaning of the study.
ServiceNow provided the customer names for the interviews but did not
participate in the interviews.

5 | The Total Economic Impact™ Of ServiceNow Now Platform
The Now Platform Customer Journey
BEFORE AND AFTER THE NOW PLATFORM INVESTMENT
Interviewed Organizations
For this study, Forrester conducted in depth interviews with three
ServiceNow Now Platform customers. Interviewed customers include the
following:
In addition, Forrester fielded a global survey to current ServiceNow Now
Platform customers, asking them of their experience and how multiple
financially impactful levers were moved with their use of the Now Platform
PaaS solution. The 135 survey respondents represented managers,
directors, and leaders in business and IT, covering a wide assortment of
verticals. While some topline results varied among these organizations,
this study specifically showcases universal benefits that are applicable to
organizations of all industry segments.
Process-oriented manufacturing,
19%
Retail & eCommerce,
9%
Financial services & insurance,
18%Infrastructure, 13%
Business & consumer
services, 14%
Government & healthcare, 27%
135 global survey respondents
INDUSTRY REGION PRIMARY USE CASE USER DEMOGRAPHICS
Automotive services Global organization headquartered in the US
Field inventory management, HR, business support management
14,000 office workers and over 10,000 field employees who rely on Now Platform apps/processes
Financial services North America HR applications, complaint management, various LOB applications
Over 40,000 employees, most of whom are business users on Now Platform apps
Industrial aviation Global organization headquartered in the US
Ticketing management, flight scheduling, SOX compliance management
5,000 employees, with field and office employees alike using Now Platform apps
“Having produced over 1,780
new functionalities and
improvements in 2016 with
[the Now] Platform compared
with just 200 in the years past,
I’d definitely say that we’ve
delivered to improve end user
productivity.”
Director, automotive services
organization

6 | The Total Economic Impact™ Of ServiceNow Now Platform
Key Challenges
Interviews and survey respondents identified several common themes in
their challenges prior to implementing the Now Platform. The recurring
theme was that there was no quick way to scale IT and development
operations to be able to support business-level initiatives, which held back
the overall digital transformation movement. More specifically, the
organizations identified the following challenges:
› The organizations had significant backlogs of applications and
business processes to be modernized, which they could not
reasonably deliver with existing internal resources. Organizations
noted that expanding their development staff was a difficult task.
Finding talented resources to build native-level code required senior
developers, who not only bear high costs but are also a scarcity in the
current market. Resorting to external development partners was one
solution, but major scope creep and budget overruns were
commonplace, as outsourced development did not always align with
specific LOB needs. Ultimately, the pace of development was a
bottleneck, preventing organizations from doing more, working faster,
and producing improved bottom-line results.
› The organizations had messy application stacks, some of which
were obtained in mergers and acquisitions, resulting in extensive
maintenance and support measures. Organizations desired to
simplify, consolidate, and then develop for consistency across the
enterprise. To rip and replace existing disparate apps found in different
business units required a huge undertaking to produce custom APIs
that would enable new apps. These organizations quickly identified the
need for a collaborative PaaS solution that enabled reusable code and
APIs so that delivery of a new consolidated set of applications could be
deployed for overall enterprise alignment.
› Aging on-premises systems such as Lotus Notes were no longer
meeting the requirements of business users and were costly to
maintain. The need to service, manage, and support these solutions
was expensive. With a move to a cloud-based PaaS, organizations
had hoped to continue their journey for digital transformation while
reducing operational costs. Operators previously working to manage
this infrastructure can then be re-tasked to value-add functions. Many
organizations had indicated that IT should and can be a value creation
partner, rather than merely a cost center.
17%
19%
24%
25%
43%
44%
Execute digital transformation strategy more quickly
Reduce legacy infrastructure footprint
Consolidate disparate custom-built application stack
Improve time-to-delivery of apps, forms, or business processes
Improve our business agility and scalability
Improve our IT / developer efficiency
Top Surveyed Motivations For Adoption Of The Now Platform
“Having a robust development
platform with ServiceNow
provides a way for applications
to be developed quickly while
using less senior developers.
What’s more, there is the
added bonus of needing far
less coordination across IT
groups like the infrastructure
group or DBAs.”
Leader in digital transformation
“ServiceNow is a real
enterprise platform where we
can develop nearly anything
cheaper and faster than
traditional methods.”
Leader in IT

7 | The Total Economic Impact™ Of ServiceNow Now Platform
Solution Requirements
The interviewed organizations searched for a solution that could:
› Provide an out-of-the-box low-code development platform with low
capex costs.
› Better manage opex and reduce infrastructure management; therefore,
a cloud-based solution was preferred.
› Contain application sprawl and delivery consistency through all
company apps.
› Consolidate/retire existing platforms used for centralized business
application development, ticketing, and custom HR applications.
› Improve IT efficiency in resolving issues on a consolidated platform.
› Have low-code/reusable code capability for an accelerated software
delivery life cycle (SDLC).
› Easily scale with existing development and IT resources.
Key Results
The interviews revealed that key results from the Now Platform
investment. We found that the platform:
› Established a more efficient development group. Our analysis
suggests that simple applications and digital business process
development can be accelerated by as much 400%, from soup to nuts.
Said one IT manager, “ServiceNow has reduced our application
delivery time by as much as 80%, giving our business stakeholders
value that much sooner.” For IT managers and directors, their teams
for once are no longer the bottleneck to business value realization.
› Met the needs of business stakeholders and their various LOBs.
Prior to the Now Platform, prioritization for new development efforts
was nearly a moot point, as the existing backlogs were months out, if
not years. Business leaders became disenfranchised when their needs
were not met. Shortly after the implementation of the Now Platform,
business needs were immediately tackled and resolved by
development teams, often within one or two months.
› Improved the efficiency of business users. Business users who had
paper-based and antiquated legacy processes were slow to get
acclimated to their workflows. Application functionality and usability
were missing, too. Newly developed business processes and apps
freed up an average of 33 minutes per day following the Now Platform
implementation.
› Contained application sprawl and related effort to maintain the
disparate application stacks. Due to various acquisitions that
interviewed organizations had made, consolidating the IT program and
managing these disparate applications had become a time-consuming
and costly affair, especially when hardware and support calls were
considered. Redeveloping a consistent set of apps that integrated
company data heavily reduced the labor required to maintain business
continuity.
“Our growth led to a need in
new systems of engagement
for team members to work
effectively. But how could we
do this with an already
stretched-thin IT group? That’s
when we introduced [the Now]
Platform, and we’re now better
equipped to respond to and
address business needs as a
result.”
Director, automotive services
organization
75% of surveyed organizations received value by being able to leverage junior-level developers rather than specialized senior developers.
Surveyed organizations stated a 39% reduction in time to maintain and provision infrastructure with the Now Platform.

8 | The Total Economic Impact™ Of ServiceNow Now Platform
Composite Organization
Based on the interviews and survey, Forrester constructed a TEI
framework, a composite company, and an associated ROI analysis that
illustrates the areas financially affected. The composite organization is
representative of the aggregate data collected through interviews and
surveys. This data set is used to present the aggregate financial analysis
in the next section. The composite organization that Forrester
synthesized from the customer interviews has the following
characteristics:
Description of composite. The composite organization is a multibillion-
dollar global company with over 18,000 employees spread across the
world. Internally, it has 10 dedicated developers who previously
specialized in native code development. With acquisitions and
consolidations occurring at a regular pace, the organization also relied
heavily on external development partners to quicken the pace of its
digital transformation initiative.
During the evaluation period for low-code development platforms, the
organization determined that it had 14,000 users who could potentially
benefit from new or redone applications and processes. There was no
plan at the time to develop external-facing applications, as the existing
pipeline for overdue internal projects was already beyond what the
organization could conceivably address within the span of a year. Road-
mapped applications were determined to be a mixture of both complex
and simple projects.
Deployment characteristics. Having made the decision to deploy the
Now Platform after an extensive selection process and business case
analysis, the organization centralized its developer resources and
managed from a single point online. Collaboration continued, and a
consistent theme was rolled out through all new enterprise applications
— first to 4,000 business users, and then to an additional 4,000 users
yearly
34%
35%
38%
54%
57%
Quicker time-to-value realization in bringing apps or businessprocesses to production
Avoided costs from retiring legacy hardware or software
Reduction in labor to administer development platforms(software or hardware)
Increased customer satisfaction as a result of new apps and/orbusiness processes
Increased employee productivity as a result of new apps and/orbusiness processes
Top High-Level Benefits Indicated By Survey Respondents
Key assumptions
-$3 billion annual revenue
-18,000 total FTEs
-14,000 business users
-10 dedicated developers
-Apps developed are both
internal and external
facing
-Apps projects are a blend
of simple and complex
projects
9 | The Total Economic Impact™ Of ServiceNow Now Platform
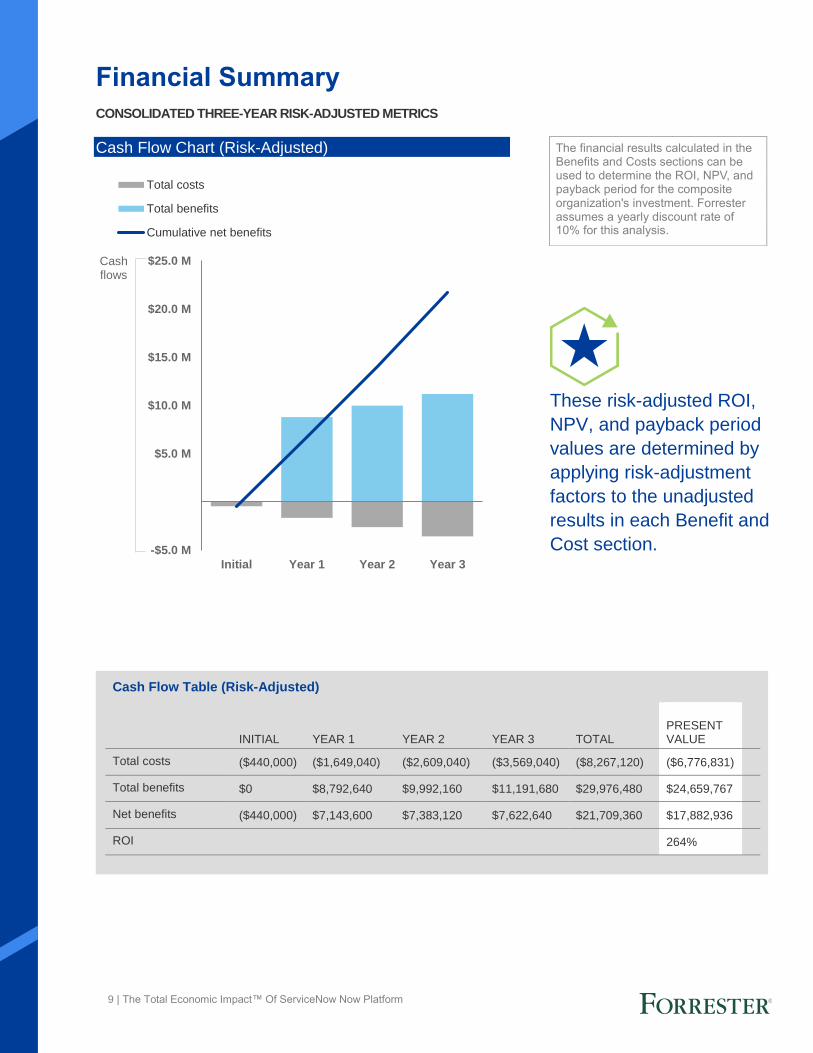
Financial Summary
CONSOLIDATED THREE-YEAR RISK-ADJUSTED METRICS
Cash Flow Chart (Risk-Adjusted)
-$5.0 M
$5.0 M
$10.0 M
$15.0 M
$20.0 M
$25.0 M
Initial Year 1 Year 2 Year 3
Cashflows
Total costs
Total benefits
Cumulative net benefits
The financial results calculated in the Benefits and Costs sections can be used to determine the ROI, NPV, and payback period for the composite organization's investment. Forrester assumes a yearly discount rate of 10% for this analysis.
These risk-adjusted ROI,
NPV, and payback period
values are determined by
applying risk-adjustment
factors to the unadjusted
results in each Benefit and
Cost section.
Cash Flow Table (Risk-Adjusted)
INITIAL YEAR 1 YEAR 2 YEAR 3 TOTAL PRESENT VALUE
Total costs ($440,000) ($1,649,040) ($2,609,040) ($3,569,040) ($8,267,120) ($6,776,831)
Total benefits $0 $8,792,640 $9,992,160 $11,191,680 $29,976,480 $24,659,767
Net benefits ($440,000) $7,143,600 $7,383,120 $7,622,640 $21,709,360 $17,882,936
ROI 264%

10 | The Total Economic Impact™ Of ServiceNow Now Platform
Flexibility
The value of flexibility is unique to each customer, and the measure of its
value varies from organization to organization. There are multiple
scenarios in which a customer might choose to implement Now Platform
and later realize additional uses and business opportunities, including:
› An acceleration of effort for external, consumer-facing
applications. These apps are the evolutionary next step for
organizations committed to producing bottom-line results. Not only
are there gains for internal users, but respondents indicated they
are also building applications for external-facing consumers. Given
the current imperatives that most organizations face to serve their
customers at the next level, external applications can gain a
significant acceleration in deployment times with the low-code
capabilities of the Now Platform.
› Easy integration with additional ServiceNow ecosystem
products. Organizations that simplify and rationalize their
application and data stack can reap gains in the speed of
application and data delivery to their internal- and external-facing
users. Systems of engagement can be more easily connected to the
central ServiceNow CMDB database and knowledgebases that
improve user experience and visibility, through a tighter-knit integration
between a common stack.
Flexibility can be quantified when evaluated as part of a specific project
by taking into consideration the factors listed above (described in more
detail in Appendix A).
Analysis Summary
The holistic analysis of those customers interviewed and surveyed
imparts that these organizations have attained value in multiple areas of
the organization, from reduced costs to increased productivity and
business-level outputs. On a higher level, the implementation of the Now
Platform positions organizations to be strategy enablers. Business
processes and applications are delivered quicker, by a margin of 290%
for applications of mixed complexity, as calculated for the composite
organization. Business users and external consumers of services are
empowered to do more with higher levels of engagement with
modernized application tools in an accelerated timeframe. As
organizational strategies continue to evolve, one imperative remains a
constant — and that is the need to continually better serve not only
external customers but also internal users. The Now Platform is a
solution that can help to achieve this imperative.
Flexibility, as defined by TEI, represents an investment in additional capacity or capability that could be turned into business benefit for a future additional investment. This provides an organization with the "right" or the ability to engage in future initiatives but not the obligation to do so.

11 | The Total Economic Impact™ Of ServiceNow Now Platform
Financial Analysis
QUANTIFIED BENEFIT AND COST DATA AS APPLIED TO THE COMPOSITE
Time-to-Value Gains On End User Productivity
Following the deployment of the Now Platform, nearly all organizations
indicated a significant acceleration in development speed and, as a
result, increased business velocity. Existing development efforts with
native language, hard coding were time consuming and provided very
little carry-forward reusable code. With the Now Platform, the ease of
low-code development and reusable code bases form the base of
what one customer described as “an easy-to-use, scalable solution
that supports our overall business agility.” From the interviews and
survey conducted with customer organizations of the Now Platform,
Forrester has been able to determine the following:
› Simpler development projects, like those normally taking six months to
hard code, experienced gains of approximately 400%. Effectively,
simple applications produced on the Now Platform are now finished
in approximately six to seven weeks.
› More complex projects that previously required nearly nine months
are now finished with the Now Platform in under five months.
› Forrester has made the assumption that the composite organization
develops a mixture of both simple and complex development
projects.
› Applications deployed by interviewed and surveyed organizations
varied depending on industry and LOB demands. Some common use
cases that were prevalent across many firms include HR services,
compliance management, sales support, and operations
management. In aggregate, these additive and newly formed
systems of engagement enable users to work more effectively.
The table above shows the total of all benefits across the areas listed below, as well as present values (PVs) discounted at 10%. Over three years, the composite organization expects risk-adjusted total benefits to be a PV of more than $24.6 million.
Accelerated development
resulted not only in
improved business agility,
but also an earlier
realization of productivity
value from end users.
Total Benefits
REF. BENEFIT YEAR 1 YEAR 2 YEAR 3 TOTAL PRESENT VALUE
Atr Time-to-value gains on end user productivity
$7,136,640 $8,156,160 $9,175,680 $24,468,480 $20,122,307
Btr Cost reduction in shifting of outsourced development projects to internal resources
$720,000 $900,000 $1,080,000 $2,700,000 $2,209,767
Ctr Decreased dependency on specialized developers
$288,000 $288,000 $288,000 $864,000 $716,213
Dtr Legacy solution EOL/sunsetting savings
$648,000 $648,000 $648,000 $1,944,000 $1,611,480
Total benefits (risk-adjusted) $8,792,640 $9,992,160 $11,191,680 $29,976,480 $24,659,767
12 | The Total Economic Impact™ Of ServiceNow Now Platform
› Faster development velocity translates further into quicker realization
of end user productivity. For organizations that had already developed
multiple applications, the end users of the applications had gained an
average of 33 minutes per day, which can ultimately be captured as
added productivity. The model assumes that the composite
organization realized similar benefits and has been captured with the
following assumptions.
› End users gained 33 minutes per day, which translates into a 7%
productivity improvement. The level of productivity incrementally climbs
in ensuing years as additional applications are deployed, but of lower
value than first-year projects.
› End users’ usage of developed apps increased linearly across three
years, at a rate of 4,000 additional users per year.
› The total benefit for the productivity is not reflected; rather, only
productivity gained from the period of time between early deployment
and traditional deployment is captured as a time-to-value improvement.
› Employee productivity is not always captured and returned to the
organization as “productivity.” Our research indicates that newfound
time is often used by employees as coffee breaks, non-value-add
office conversations, or web browsing. The model reflects a 60%
capture rate of the productivity newly created by applications and
processes.
While we believe the productivity gains achieved from newly developed
applications and business processes are undeniable, readers should
be aware of the potential impact risk of lower development
acceleration, due to some organizations having a different mix of
simple and complex applications than that of the composite
organization. Considerations for this risk should include the progress of
an organization’s digital transformation as well as the types of
applications on the organizational road map.
To account for this risks, Forrester adjusted this benefit downward by
10%, yielding a three-year risk-adjusted total PV of $20,122,307.
Readers should also be aware that business outcomes such as
increased topline revenue or greater customer retention have not been
incorporated into this benefit category. Further information on business
outcomes not included in this category can be found in the Unquantified
Benefits section of this study.
Impact risk is the risk that the business or technology needs of the organization may not be met by the investment, resulting in lower overall total benefits. The greater the uncertainty, the wider the potential range of outcomes for benefit estimates.
“The delivery of our applications
has been accelerated by 6x to
10x compared to our traditional
format of developing in Java
and .NET.”
Development manager, financial
services organization

13 | The Total Economic Impact™ Of ServiceNow Now Platform
Shifting From Outsourced To Internal Dev
Resources
Prior to the introduction of the Now Platform, the composite organization
faced a tremendous amount of projects supporting business initiatives.
To satisfy these business needs, the organization often outsourced its
development projects, with as much as 45% of total projects being
outsourced to external vendors and providers, amounting to $2.4 million
annually. Following the deployment of the Now Platform, the composite
recognized both a significant gain in development velocity as well as an
improvement in the ease of development. As the organization worked
through the existing backlog of projects, the percentage of internalized
projects grew year over year. Projects that were shifted to internal
resources ranged in complexity from low-code projects on the Now
Platform to custom native-code projects. A key driver of this shift was the
enablement of junior-level developers to produce on the Now Platform,
freeing senior-level developers to engage specialized projects in native
code. See the next benefit section for more detail.
Over the course of three years, the composite organization would save a
total PV of $2,209,767.
Time-To-Value Gains On End User Productivity
REF. METRIC CALC. YEAR 1 YEAR 2 YEAR 3
A1 Simple development project time acceleration, with Now Platform
400% 400% 400%
A2 Complex development project time acceleration, with Now Platform
180% 180% 180%
A3 Average time acceleration for all projects (A1+A2)/2 290% 290% 290%
A4 Average duration for mixed project completion, before Now Platform, in months
9 9 9
A5 Average time for mixed project completion, on Now Platform, in months
A4/A3 3.1 3.1 3.1
A6 Delta in project completion time A4-A5 5.9 5.9 5.9
A7 Percentage improvement in productivity per end user
Survey and interviews
7% 8% 9%
A8 Annual cost of average business end user, fully loaded
$96,000 $96,000 $96,000
A9 Now Platform application/business processes users added
4,000 4,000 4,000
A10 End user productivity capture 60% 60% 60%
At Time-to-value gains on end user productivity (A6/12)*(A7*A8*A9*A10)
$7,929,600 $9,062,400 $10,195,200
Risk adjustment ↓10%
Atr Time-to-value gains on end user productivity (risk-adjusted)
$7,136,640 $8,156,160 $9,175,680
Organizations found the Now Platform easier and
quicker to develop on, reducing the need to
outsource dev projects.
9%
three-year benefit PV
$2.2 million

14 | The Total Economic Impact™ Of ServiceNow Now Platform
Decreased Dependency On Specialized Developers
With a more user-friendly low-code development platform, development
teams were able to leverage more existing code and already built APIs,
paving the way for more junior, nonspecialized developers to produce
applications and business processes, rather than resorting to native
language coders. Through the first year of usage, the composite was
able to reallocate 60% of the senior developer workforce to projects that
specifically required certain languages. To replace the senior developer
workforce, junior-level developers were introduced and displayed similar
development velocity as their more senior counterparts on the Now
Platform. Forrester believes that hard-coding will never disappear
altogether, but it can be greatly reduced with tools like the Now Platform.
With a significant difference in compensation between the junior and
senior developers, the composite was able to capture arbitrage benefits
in reallocating its developer workforce. Following the reallocation of six
senior-level developers, who were each compensated a $48,000
premium over junior developers, the composite gained an annual benefit
of $288,000. The total three-year gains of this benefit category in PV
were $716,213.
Shifting From Outsourced To Internal Dev Resources
REF. METRIC CALC. YEAR 1 YEAR 2 YEAR 3
B1 Outsourced development project spend, annually
Baseline: 45% of total dev projects outsourced
$2,400,000 $2,400,000 $2,400,000
B2 Shift to internal developer resources with Now Platform
60% 75% 90%
B3 Cost savings of using internal versus outsourced developer resources
50% 50% 50%
Bt Shifting from outsourced to internal dev resources
B1*B2*B3 $720,000 $900,000 $1,080,000
Risk adjustment 0%
Btr Shifting from outsourced to internal dev resources (risk-adjusted)
$720,000 $900,000 $1,080,000
$716,213 saved by leveraging six junior-level developers rather than specialized senior developers

15 | The Total Economic Impact™ Of ServiceNow Now Platform
Legacy Solution EOL/Sun-Setting Savings
In replacing existing solutions with the Now Platform, the composite
retired its existing on-premises solution for business automation and
knowledge sharing. Aside from feeding antiquated processes and
applets, the solution was incurring ongoing costs in the ways listed
below. Additionally, instance and resource provisioning were dramatically
reduced due to the migration to a cloud PaaS.
› Hardware required for the existing solution was retired, although at a
depreciated level due to its age.
› Hardware management, maintenance, and support were also stopped,
enabling IT personnel to support other functions within the business.
› Software support and disparate app debugging were reduced once
applications had been built on the Now Platform in a centralized state.
› External vendor support and maintenance support were eliminated.
It is assumed that prior licenses were in perpetuity, and hence accrued no additional yearly costs. Combining the factors listed above, the composite organization reaped the benefit of $600,000 annually from internal resources, and $120,000 for external resources, for a total of $720,000 per year. In using conservative estimates, the gain after three years of legacy hardware and software retirement amounted to $1,790,533.
Recognizing that not all organizations may have had such an extensive system of engagement in the past, we have assigned a risk adjustment to this benefit category, resulting in a downward adjustment of 10%, yielding a PV of $1,611,480 over three years.
Savings of retiring
existing system:
- Existing infrastructure
maintenance and
management
- Support of existing
disparate applications
- External maintenance
contracts
Decreased Dependency On Specialized Developers
REF. METRIC CALC. YEAR 1 YEAR 2 YEAR 3
C1 Cost per specialized sr. developer resource, annually fully loaded
$144,000 $144,000 $144,000
C2 Cost per jr.-level developer, annually fully loaded $96,000 $96,000 $96,000
C3 Cost delta per developer $48,000 $48,000 $48,000
C4 Shift in utilization of jr. developer full-time equivalents (FTEs) from sr. developers
6 6 6
Ct Decreased dependency on specialized developers
C3*C4 $288,000 $288,000 $288,000
Risk adjustment ↓0%
Ctr Decreased dependency on specialized developers (risk-adjusted)
$288,000 $288,000 $288,000

16 | The Total Economic Impact™ Of ServiceNow Now Platform
Legacy Solution EOL / Sun-Setting Savings
REF. METRIC CALC. YEAR 1 YEAR 2 YEAR 3
D1 Existing solution hardware and software annual internal support and administration costs
$600,000 $600,000 $600,000
D2 Existing solution external support/maintenance costs
$120,000 $120,000 $120,000
Dt Legacy solution EOL/sunsetting savings D1+D2 $720,000 $720,000 $720,000
Risk adjustment ↓10%
Dtr Legacy solution EOL/sunsetting savings (risk-adjusted)
$648,000 $648,000 $648,000

17 | The Total Economic Impact™ Of ServiceNow Now Platform
Unquantified Benefits
In addition to the quantitative benefits listed above, our research
revealed benefits that some customers were able to attain. While these
benefits are not quantified at this time, they are nevertheless important
gains that potential adopters might experience:
› Incremental revenue growth from improving customer
experience from newly built Now Platform apps and processes.
Forrester research has shown that leaders in customer experience
have dramatically different growth rates than the laggards of
customer experience within the same sector. For instance, two
financial services firms that were assessed over a five-year period
revealed a compounded annual growth rate (CAGR) difference of
6.2%, while another pair of financial services firms showed a CAGR
disparity of 9.1%. While products offered by firms will obviously have
differences, some of which have high switching costs, the attainment
of a better customer experience should always be an imperative for
those organizations setting long-run strategic decisions.
41% and growing:
number of organizations
that use the Now Platform
to develop external
consumer-facing apps to
more quickly and better
address the expectations
and needs of today’s
consumer.

18 | The Total Economic Impact™ Of ServiceNow Now Platform
› Improved internal employee experience. Newly minted applications
and processes from the Now Platform can also deliver a better
employee experience sooner. Automation and improved app
accessibility significantly raise employee satisfaction, which was cited
by multiple customers. Said one director, “Our accelerated functionality
delivery with [Now] Platform has absolutely removed user friction,
making their jobs that much easier.”
“Where GMs came to us in the
past saying that they had no
time to do more, we are
hearing the same managers
tell us now that our new apps
have empowered them to gain
better visibility and optimize
group workflows as a result.”
Director of safety, automotive
services organization

19 | The Total Economic Impact™ Of ServiceNow Now Platform
three-year cost PV
$2.2 million
Now Platform License Costs
Organizations with the Now Platform incurred a monthly service
charge related to the number of applications/processes deployed and
the number of users of which. For organizations that have more
expansive strategic digital transformation initiatives, a separate new
plan exists for unlimited applications, but it is still user-count
dependent. All pricing reflected in this study is based on list pricing.
With the Now Platform, many interviewed and surveyed organizations
found that development efforts had accelerated so much that the “low-
hanging fruit” goals were quickly achieved and IT resources were no
longer the bottleneck. Instead, budgeting for new app licenses became
the new logjam. Utilizing the newer unlimited application/process
pricing model, organizations will realize lower license costs as the
development of apps increase. Readers are encouraged to explore
pricing options with ServiceNow or a ServiceNow partner to determine
an optimized license plan.
The composite organization started with an initial user base of 4,000
users, anticipating that a moderate increase in the production rate of
applications and processes would eventually extend across the
organization, resulting in added users in years 2 and 3. Taking
advantage of the unlimited app licensing, the composite paid an
approximate $960,000 for Now Platform licensed users in the first year,
increasing to $1,920,000 and $2,888,000 in the second and third years,
respectively, as app users increased. Application production also
increased yearly, as shown in the table in Appendix B.
The three-year licensing cost for the composite accounts for a total PV
of $4,623,291.
Total Costs
The table above shows the total of all costs across the areas listed below, as well as present values (PVs) discounted at 10%. Over three years, the composite organization expects risk-adjusted total costs to be a PV of more than $6.77 million.
ServiceNow offers multiple
pricing options for the Now
Platform, one of which is a
pricing model that allows
unlimited applications,
which should be leveraged
by organizations on the
digital transformation fast-
track.
REF. COST INITIAL YEAR 1 YEAR 2 YEAR 3 TOTAL PRESENT VALUE
Etr Now Platform license costs $0 $960,000 $1,920,000 $2,880,000 $5,760,000 $4,623,291
Ftr Training and implementation
$440,000 $689,040 $689,040 $689,040 $2,507,120 $2,153,540
Total costs (risk-adjusted)
$440,000 $1,649,040 $2,609,040 $3,569,040 $8,267,120 $6,776,831

20 | The Total Economic Impact™ Of ServiceNow Now Platform
Training And Implementation
Multiple customers of the Now Platform conveyed that professional
services were key to their quick implementation and ramp-up period.
Data metrics corroborated the messaging, as clients who had
undertaken little outside help were less successful than those who
pursued professional services — both in terms of reaching full
development acceleration and meeting the needs of the business users.
Organizations that were extremely successful with the Now Platform
utilized professional services to learn how to best leverage the Now
Platform and jump-start development. Internally, additional knowledge
sharing continued with training programs to fully ramp the development
team.
Over the initial period of implementation, the composite organization
incurred a professional services cost of $250,000. In addition, the
organization invested an additional allotment of 1.5 months for its 10
developers to become truly proficient on the Now Platform. Knowledge
gained and lessons learned were documented for future training
sessions, greatly reducing the cost of future hires and resulting in
ongoing conformity to best practices. At a rate of $120,000 fully loaded
per developer annually, or $10,000 per month, the initial developer ramp-
up period of 1.5 months costs the organization a total of $150,000.
In addition to developer training, the organization trained business end
users who migrated to new apps and processes, at a rate of 3 hours per
year. This cost of this training totaled $600,000 yearly. Total three-year
costs of training and initial implementation amounted to $1,957,764,
inclusive of internal and external costs.
Training is often a variable for organizations depending on their IT
maturity and capability. Since organizations may have different starting
points and variability in uptake speed of different developers, we have
assigned an impact risk to this cost category by adjusting this cost
category upward by 10%. This results in a risk-adjusted PV cost of
$2,153,540 over three years.
Developer ramp-up:
With professional
services and customer
success programs,
developers were fully
acclimated to the Now
Platform in 1.5 months.
Implementation risk is the risk that a proposed investment may deviate from the original or expected requirements, resulting in higher costs than anticipated. The greater the uncertainty, the wider the potential range of outcomes for cost estimates.
Training, ramp-up, and implementation costs:
22% of total costs

21 | The Total Economic Impact™ Of ServiceNow Now Platform
ServiceNow Now Platform: Overview
The following information is provided by ServiceNow. Forrester has not validated any claims and does not
endorse ServiceNow or its offerings.
The Now Platform allows you to automate your enterprise with the applications you need on a platform built for
faster custom development. The platform breaks down data silos across the enterprise using a single data model
so that the right information can be shared and reused by other applications. Having a complete understanding
of all related data makes it easier to build contextual workflows that intelligently automate processes across the
enterprise.
The Now Platform allows organizations to create their own custom applications quickly by never having to start
from scratch. The platform provides out-of-the-box components and services that become reusable in other
applications you create. Simplified integration uses autogenerated and scripted APIs that are also reusable.
Developers also save valuable development time by being able to focus on business logic instead of
implementing and configuring technical details around infrastructure and security. This eliminates upfront
infrastructure build time costs by offering a “development ready” service instance that can also reduce ongoing
maintenance for upgrades and versioning.
There is no learning curve, and minimal training is required because you use standard languages and libraries
such as JavaScript, HTML5, and Angular. And, a single integrated environment allows diverse teams of no-code,
low-code, and pro-code developers to collaborate effectively on any project. Anyone, from the business user to
the professional developer, can easily build scalable, integrated applications using drag-and-drop or professional
developer tools.

22 | The Total Economic Impact™ Of ServiceNow Now Platform
Highlighted features include:
› Delegated Development enables provisioning of development resources to the entire enterprise while
maintaining granular control and governance over developer privileges, production deployments, and
application data, API, and resource access.
› Service Portal Designer allows you to deliver an engaging user interface based on modular, flexible designs
with the ability to develop a user experience free of any dependencies on the business logic of the app.
› Applications can deliver broad integrations via extensive REST and SOAP APIs, API frameworks to create new
APIs, and interfaces for data import/export with other software-as-a-service (SaaS) applications, on-premises
applications, and data sources.
› The CMDB provides a single data set enabling easy integration of data across diverse applications so that
every table, view, and application built on the ServiceNow platform leverages a consolidated, single system of
record.
› Studio IDE integrated with Git and the scoped app repository gives you a powerful means of implementing a
modern Agile development process within and across teams.

23 | The Total Economic Impact™ Of ServiceNow Now Platform
Appendix A: Total Economic Impact
Total Economic Impact is a methodology developed by Forrester
Research that enhances a company’s technology decision-making
processes and assists vendors in communicating the value proposition
of their products and services to clients. The TEI methodology helps
companies demonstrate, justify, and realize the tangible value of IT
initiatives to both senior management and other key business
stakeholders.
Total Economic Impact Approach
Benefits represent the value delivered to the business by the
product. The TEI methodology places equal weight on the
measure of benefits and the measure of costs, allowing for a
full examination of the effect of the technology on the entire
organization.
Costs consider all expenses necessary to deliver the
proposed value, or benefits, of the product. The cost category
within TEI captures incremental costs over the existing
environment for ongoing costs associated with the solution.
Flexibility represents the strategic value that can be
obtained for some future additional investment building on
top of the initial investment already made. Having the ability
to capture that benefit has a PV that can be estimated.
Risks measure the uncertainty of benefit and cost estimates
given: 1) the likelihood that estimates will meet original
projections and 2) the likelihood that estimates will be
tracked over time. TEI risk factors are based on “triangular
distribution.”
The initial investment column contains costs incurred at “time 0” or at the
beginning of Year 1 that are not discounted. All other cash flows are discounted
using the discount rate at the end of the year. PV calculations are calculated for
each total cost and benefit estimate. NPV calculations in the summary tables are
the sum of the initial investment and the discounted cash flows in each year.
Sums and present value calculations of the Total Benefits, Total Costs, and
Cash Flow tables may not exactly add up, as some rounding may occur.
PRESENT VALUE (PV)
The present or current value of (discounted) cost and benefit estimates given at an interest rate (the discount rate). The PV of costs and benefits feed into the total NPV of cash flows.
NET PRESENT VALUE (NPV)
The present or current value of (discounted) future net cash flows given an interest rate (the discount rate). A positive project NPV normally indicates that the investment should be made, unless other projects have higher NPVs.
RETURN ON INVESTMENT (ROI)
A project’s expected return in percentage terms. ROI is calculated by dividing net benefits (benefits less costs) by costs.
DISCOUNT RATE
The interest rate used in cash flow analysis to take into account the time value of money. Organizations typically use discount rates between 8% and 16%.
PAYBACK PERIOD
The breakeven point for an investment. This is the point in time at which net benefits (benefits minus costs) equal initial investment or cost.

24 | The Total Economic Impact™ Of ServiceNow Now Platform
Appendix B: Detailed Cost Structure Tables
Training And Implementation Costs
REF. METRIC CALC. INITIAL YEAR 1 YEAR 2 YEAR 3
F1 Dedicated Platform developers 10 10 10 10
F2 Application users on Platform apps and business processes
4000 8000 12000
F3 External professional services, implementation
$250,000
F4 Internal ramp-up training 10 developers * $120,000/yr @ 1.5 months
$150,000
F5 Ongoing developer training
1 week annually. $120,000/50 weeks*11 training sessions
$26,400 $26,400 $26,400
F6 End-user application training 3 hours, per new app user
$600,000 $600,000 $600,000
Ft Training and implementation F3+F4+F5+F6 $400,000 $626,400 $626,400 $626,400
Risk adjustment ↑10%
Ftr Training and implementation (risk-adjusted)
$440,000 $689,040 $689,040 $689,040
Now Platform License Costs
REF. METRIC CALC. INITIAL YEAR 1 YEAR 2 YEAR 3
E1 Application users on Now Platform apps and business processes
4,000 8,000 12,000
E2 Total live Platform applications / business processes
20 40 60
Et Now Platform license costs $0 $960,000 $1,920,000 $2,880,000
Risk adjustment 0%
Etr Now Platform license costs (risk-adjusted)
$0 $960,000 $1,920,000 $2,880,000

25 | The Total Economic Impact™ Of ServiceNow Now Platform
Appendix C: Supplemental Material
Related Forrester Research
“Vendor Landscape: The Fractured, Fertile Terrain Of Low-Code application Platforms,” Forrester Research,
Inc., January 15, 2016
“Use A Light Touch To Govern Low-Code Development Platforms,” Forrester Research, Inc., February 13, 2017
“The Forrester Wave: Low-Code Development Platforms, Q2 2016,” Forrester Research, Inc., April 14, 2016
“Customer Experience Drives Revenue Growth, 2016,” Forrester Research, Inc., June 21, 2016
Appendix D: Endnotes
i Net Promoter and NPS are registered service marks, and Net Promoter Score is a service mark, of Bain & Company, Inc., Satmetrix Systems, Inc., and Fred Reichheld. ii Source: “ Customer Experience Drives Revenue Growth, 2016,” Forrester Research, Inc., June 21, 2016.