the total feed business - forfarmersgroup.eu · swot-analysis 20 source: forfarmers positive...
TRANSCRIPT

the total feed business
ForFarmers N.V. Roadshow Presentation Annual Results 2018
NOTIFICATIONS AND DISCLAIMERREPORTING STANDARDS
The results in this presentation are derived from the ForFarmers 2018 audited financial statements which have been drawn up in accordance with the International Financial Reporting Standards as adopted by the EU (IFRS). General remark: presented percentages are calculated on the rounded amounts in million euro with one decimal.
SUPERVISION
In view of the fact that shares are freely tradable on EURONEXT Amsterdam, ForFarmers operates under the supervision of the Financial Markets Authority (AFM) and the company acts in accordance with the prevailing regulations for share-issuing companies.
IMPORTANT DATES
13-03-2019 Publication 2018 Annual Results and Annual Report
29-03-2019 Registration date AGM
26-04-2019 General Meeting of Shareholders
30-04-2019 Ex Dividend listing
02-05-2019 Publication Q1 2019 Trading Update; Registration date for those entitled to dividend
09-05-2019 Dividend payment
15-08-2019 Publication half-year 2019 results
31-10-2019 Publication Q3 2019 Trading Update
12-03-2020 Publication 2019 Annual Results and Annual Report
24-04-2020 General Meeting of Shareholders
FORWARD-LOOKING STATEMENTS
This presentation contains forward-looking statements, including those relating to ForFarmers legal obligations in terms of capital and liquidity positions in certain specified scenarios. In addition, forward-looking statements, without limitation, may include such phrases as “intends to”, "expects“, “takes into account”, "is aimed at“, ''plans to”, "estimated" and words with a similar meaning. These statements pertain to or may affect matters in the future, such as ForFarmers future financial results, business plans and current strategies. Forward-looking statements are subject to a number of risks and uncertainties, which may mean that there could be material differences between actual results and performance and expected future results or performances that are implicitly or explicitly included in the forward-looking statements. Factors that may result in variations on the current expectations or may contribute to the same include but are not limited to: developments in legislation, technology, jurisprudence and regulations, share price fluctuations, legal procedures, investigations by regulatory bodies, the competitive landscape and general economic conditions. These and other factors, risks and uncertainties that may affect any forward-looking statements or the actual results of ForFarmers, are discussed in the last published annual report. The forward-looking statements in this presentation are only statements as of the date of this document and ForFarmers accepts no obligation or responsibility with respectto any changes made to the forward-looking statements contained in this document, regardless of whether these pertain to new information, future events or otherwise, unless ForFarmers is legally obliged to do so.
2

ForFarmers: European leader in Total Feed solutions
3
Founded in 1896 as a cooperative
Servicing over 27,000 farmers
Completed 10 acquisitions since 2014
2,700 employees in 2018
2018 Revenue: €2.4 billionunderlying EBITDA2: €100 million
#1 European Total Feed solutions provider
Based in the Netherlands (head office), Germany, Belgium, Poland and the United Kingdom
Listed since 2016 on Euronext Amsterdam
1. Total Feed volume 2018 in million metric tonnes (mT); 2. earnings before interest, tax, depreciation and amortisation; Source: ForFarmers
Total Feed volume of 10 mT¹

ForFarmers’ products, clients and species
4
Poultry
All farm sizes
Compound feed
Specialties
Dry Moist Liquid (DML)
Crop
On-farm advisory
and support
with
c. 450
on-site
advisors
Total Feed solution
Swine
Ruminant

Central position in value chain to farmersForFarmers’ approach: From Feed To Farm
Source: ForFarmers
Raw materials suppliers
ForFarmers: Production, supply and application of
Total Feed solutionsFarmers
Dairy processors, slaughterhouses &
egg packers
Retail & Consumers
Feed millingLogistics &
deliveryFormulation,
Nutrition & Procurement On-farm feed solution advisory
5
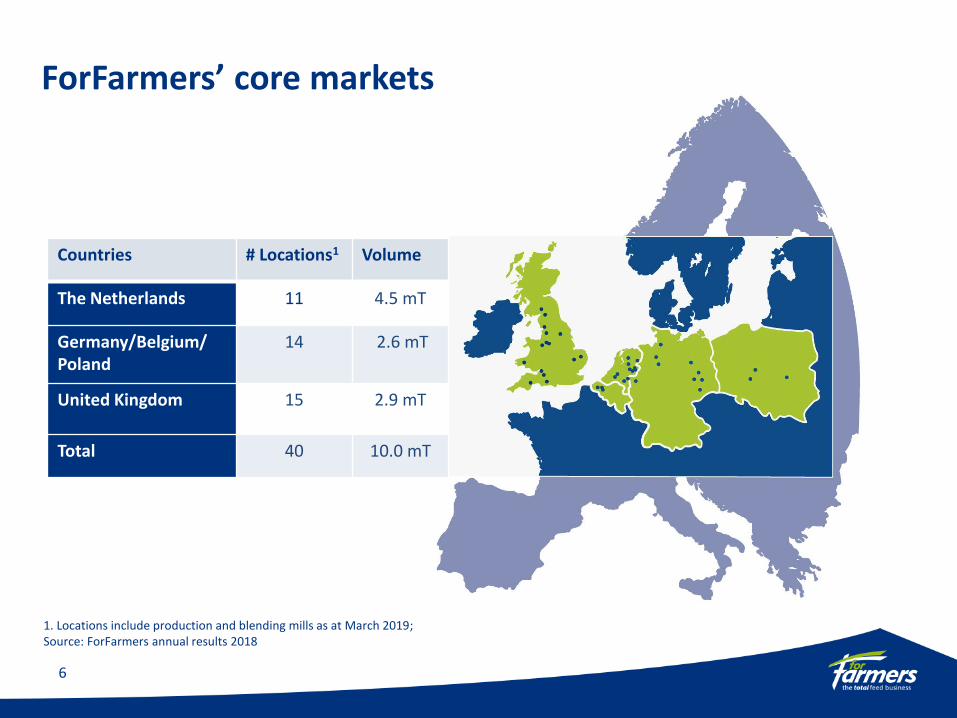
ForFarmers’ core markets
6
1. Locations include production and blending mills as at March 2019; Source: ForFarmers annual results 2018
Countries # Locations1 Volume
The Netherlands 11 4.5 mT
Germany/Belgium/Poland
14 2.6 mT
United Kingdom 15 2.9 mT
Total 40 10.0 mT
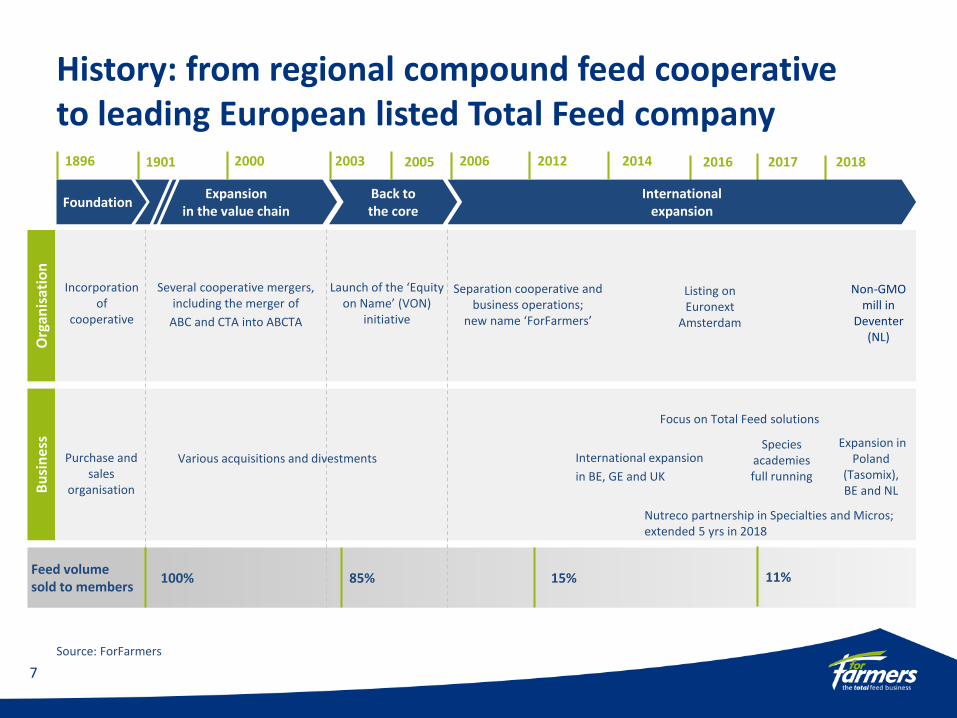
History: from regional compound feed cooperative to leading European listed Total Feed company
7
Bu
sin
ess
1896
Foundation
Feed volume sold to members
Listing onEuronext
Amsterdam
Separation cooperative and business operations;
new name ‘ForFarmers’
Nutreco partnership in Specialties and Micros; extended 5 yrs in 2018
Org
anis
atio
n
Incorporation of
cooperative
Several cooperative mergers, including the merger of
ABC and CTA into ABCTA
100%
Purchase and sales
organisation
Launch of the ‘Equity on Name’ (VON)
initiative
85% 15%
Focus on Total Feed solutions
International expansion
in BE, GE and UK
Various acquisitions and divestments
Source: ForFarmers
2016
Expansion in the value chain
International expansion
Back to the core
20061901 20032000 2005 20142012 2017
11%
Species academies full running
2018
Expansion in Poland
(Tasomix), BE and NL
Non-GMO mill in
Deventer (NL)

‘For the Future of Farming’ is our promise to farmers: we work side-by-side with our customers for the long-term good
of their farms and of the sector as a whole.
We aim to be the leading livestock nutrition company in Europe by supplying economic and sustainable Total Feed solutions on farm
Vision
Mission
Core values
ForFarmers addresses increasing need for sustainable food production
AmbitionWe drive for next level results
SustainabilityWe are here to stay
PartnershipWe believe in win-win
8

9
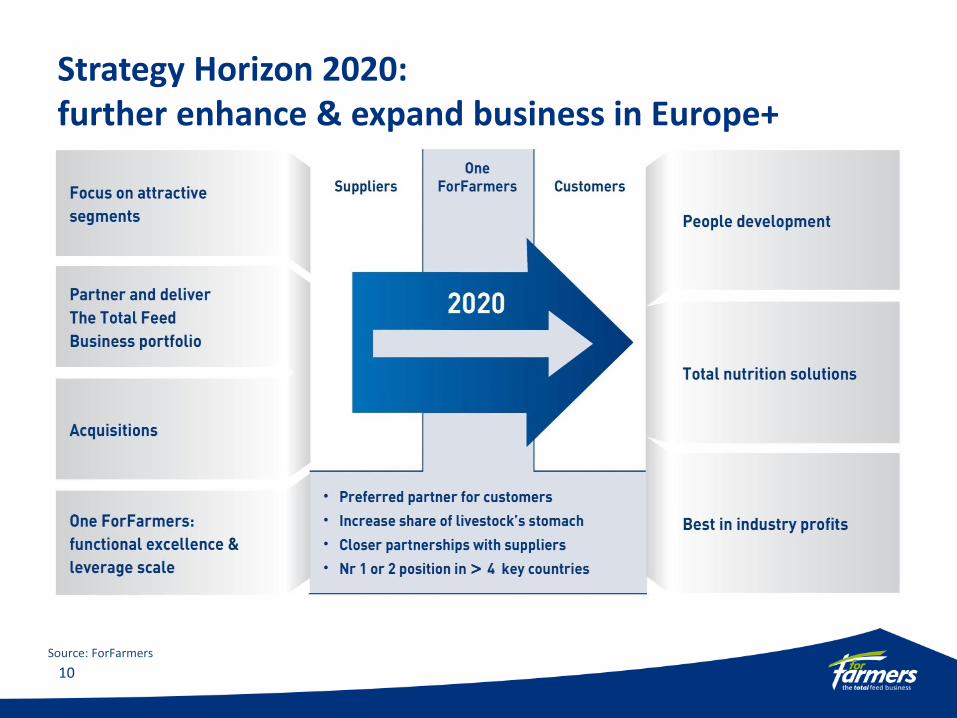
Strategy Horizon 2020: further enhance & expand business in Europe+
Source: ForFarmers
10

ForFarmers Executive Committee
Source: ForFarmers
x/xYears with the company or predecessors/Years active in the industry
11
Stijn SteendijkDir. Strategy & Organisation
[5/10]
Arnout TraasCFO[8/18]
Purchasing, Formulation & Quality, Production & Logistics, Operational Excellence, Engineering Projects, Health & Safety
Human Resources, Nutrition & Innovation Centre (NIC), Marketing, Communication, Sustainability, Corporate Affairs, Commercial Excellence, Digital Innovation
Control/Finance, Information Technology (IT), Legal Affairs, Risk Management, Mergers &Acquisitions, Investor Relations
Yoram KnoopCEO[6/12]
Pieter Wolleswinkel
COO[5/12]
ForFarmers Netherlands
David Fousert
COO[3/14]
ForFarmers BelgiumReudinkPavo
Adrie van der Ven
COO[4/10]
ForFarmers GermanyPolandNew regions
Steven Read
COO[33/33]
ForFarmers United Kingdom
Arthur van OchDir. Supply Chain[1/1] Jan Potijk is member of Executive Board until AGM 2019

Key investment highlights
12
Resilient markets with selective growth opportunities
Access to farm gate
Focussed strategy Horizon 2020
Proven M&A strategy to drive further expansion
Sustainability vital element in business model
Strong balance sheet
1
2
3
4
5
6
7
European leader providing Total Feed solutions to farmers
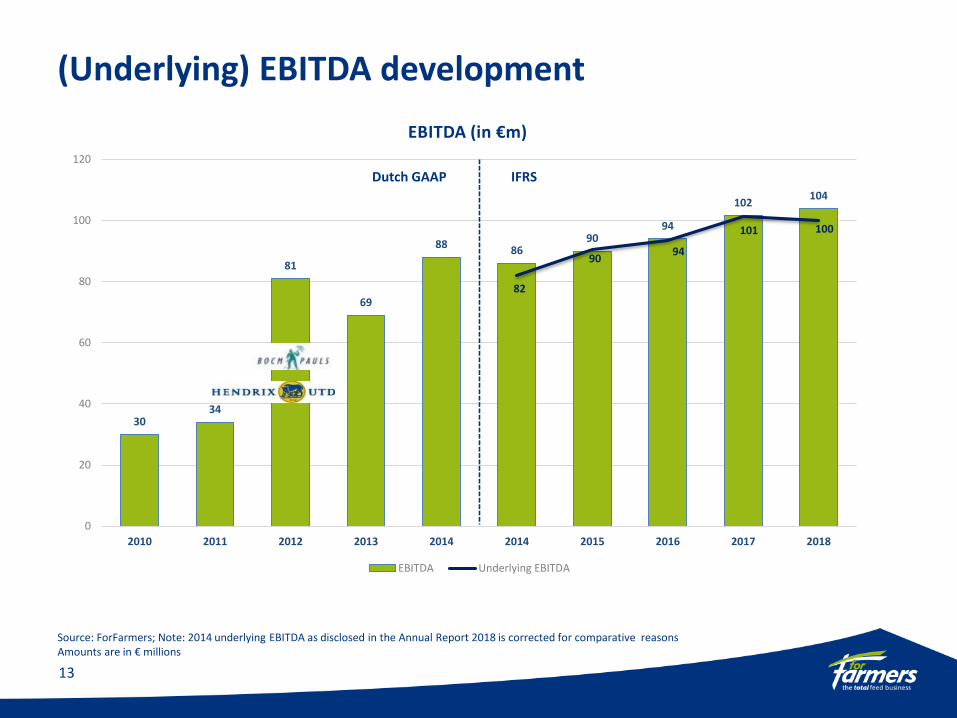
(Underlying) EBITDA development
13
Source: ForFarmers; Note: 2014 underlying EBITDA as disclosed in the Annual Report 2018 is corrected for comparative reasonsAmounts are in € millions
3034
81
69
8886
9094
102104
82
9094
101 100
0
20
40
60
80
100
120
2010 2011 2012 2013 2014 2014 2015 2016 2017 2018
EBITDA (in €m)
EBITDA Underlying EBITDA
Dutch GAAP IFRS

ForFarmers shareholders1
• Technical listing on Euronext Amsterdam: 24 May 2016
• Average daily traded volume in 2018: approx. 110,000
14
The stakes presented in Blue letters (Kempen, APG and J P Morgan) are based on rounded capital interests as last registered at AFM (on issued ordinary shares ForFarmers) and the stakes presented in White letter are the positions as presented in the Annual Report 2018 as at 31 December 2018; * Indirect holding of FromFarmers relates to the holdings of the individual members of the cooperative
Coöperatie FromFarmers U.A. -direct (17%)
Coöperatie FromFarmers U.A.-indirect* (28%)
APG AM N.V. (10%)
Kempen CM N.V. (5%)
St.Beheer- en Administratieknt. ForFarmers (7%)
ForFarmers N.V. (6%)
Other institutions (23%)
JP Morgan AM Holdings Inc (3%)
HORIZON 2020 IN PRACTICE
15
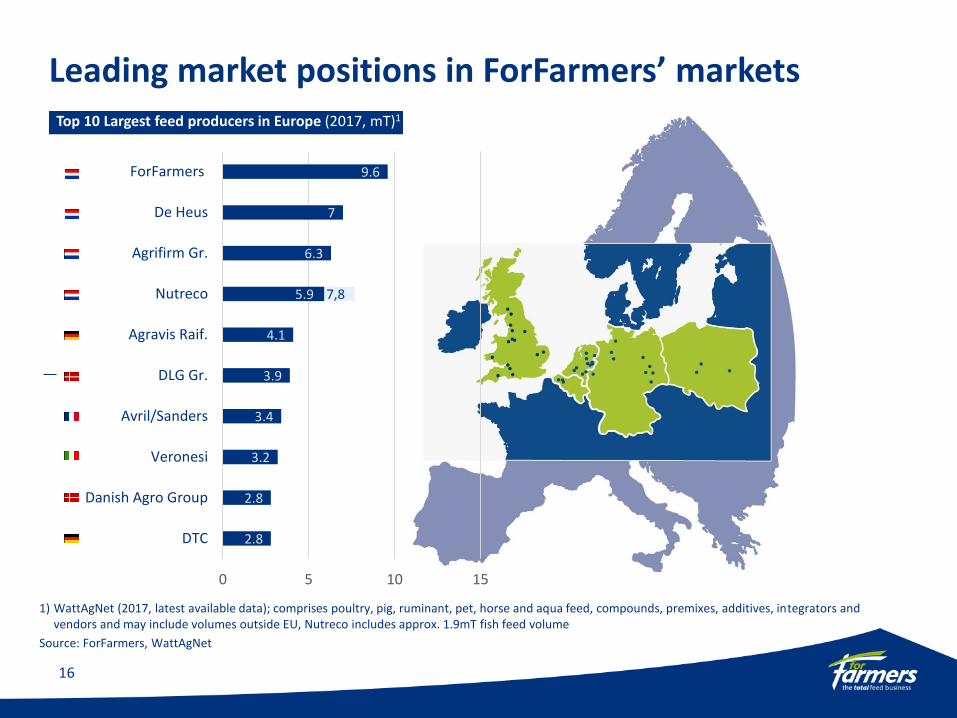
Leading market positions in ForFarmers’ markets
1) WattAgNet (2017, latest available data); comprises poultry, pig, ruminant, pet, horse and aqua feed, compounds, premixes, additives, integrators and vendors and may include volumes outside EU, Nutreco includes approx. 1.9mT fish feed volume
Source: ForFarmers, WattAgNet
Top 10 Largest feed producers in Europe (2017, mT)1
16
7,8
2.8
2.8
3.2
3.4
3.9
4.1
5.9
6.3
7
9.6
0 5 10 15
DTC
Danish Agro Group
Veronesi
Avril/Sanders
DLG Gr.
Agravis Raif.
Nutreco
Agrifirm Gr.
De Heus
ForFarmers

Leading positions in core countries
1) ForFarmers’ management best estimates; ForFarmers’ compound feed comprises compound feed, blends, concentrates and young animal feed.
Source: ForFarmers, WattAgNet based on 2017 results
Netherlands
Company Compound feed production (mT) Total feed
#1 ForFarmers 3.0
#2 Agrifirm 2.5
#3 De Heus 2.0
#4 Fuite 0.7
#1
United Kingdom
Company Compound feed production (mT) Total feed
#1 AB Nutrition 2.2
#2 ForFarmers 2.0
#3 2Agriculture 0.9
#4 Mole Valley Partners 0.8
Belgium
Company Compound feed production (mT) Total feed
#1 Aveve 1.3
#2 ForFarmers 0.6
#3 VandenAvenne 0.6
#4 Quartes 0.4
Germany
Company Compound feed production (mT) Total feed
#1 Agravis 4.1
#2 DTC 2.8
#3 Bröring 1.8
#4 ForFarmers 1.3
#1
#2
#4
17
Poland
Company Compound feed production (mT) Total feed
#1 Cargill 1.3
#2 De Heus 1.0
#3 Wipasz 0.6
#4 ForFarmers/Tasomix 0.4
#4

18
ForFarmers in the value chain:Focussed on feed solutions delivered on farm

Value creation within changing market circumstances
19

SWOT-analysis
20
Source: ForFarmers
Positive Negative
Internal STRENGTHS- Full focus on Total Feed approach on-farm
- Leveraging scale, internal academies, in-house
Nutrition Innovation Centre
- Solid financial position
WEAKNESSES- Total Feed portfolio not yet complete in all
countries
- Market position in Germany and Poland still sub-
optimal
- Imbalance in the contributions from the various
clusters
External OPPORTUNITIES- In consolidating markets: growing demand for
customer-specific data-driven / supportive
solutions, further acquisitions and further use of
big data
- Increase in environmental and other legislation
requires innovative feed solutions
- Growing interest in food quality and provenance
- Increasing global demand for animal proteins
THREATS- Animal diseases
- Increase in legislation concerning environmental
impact
- Growing attention for alternatives to animal
proteins for human consumption
- The use of algorithm solutions for feed advice

Ruminants
Swine
Poultry
Other/multi-species
Compound/blend
Compound/Specialties
DML
Crop
Other
10mT
Total Feed solutions tailored towards key species
Totals by species Totals by product
Source: ForFarmers
Total Volume ForFarmers (2018)
Layers
Broilers
Dairy
Beef, Goat, Sheep
Fatteners
Sows and piglets
Focus on key species
Poultry
Swine
Ruminant
Key
spec
ies
21
Crop
Organic
Other species Horse, game
All species
Mainly ruminant
4.5mT4.5mT
2.6mT
The Netherlands
Germany/Belgium/ Poland
2.9mT2.9mT United Kingdom
10mT
2.6mT

Complete portfolio to support our trusted advisor role
Source: ForFarmers
Product Description Application Examples Value add
Compound feed
Mix from various raw materials and premix and additives
Finished products to be fed as a complete feed to animals
Compound feed (e.g. Feed2Milk, NOVA, Apollo, ULTRA)
Blends
Specialty feed additives
Specific (complex) nutrientsSpecially designed for home mixing, young animals and animals in transition
Premixes and minerals
Additives (e.g. Selko, Milkpower)
Transition feeds (Translac)
Piglet feed (VIDA)
Calf milk replacers (e.g. VITAMILK)
Concentrates (e.g. MIXX, Blendix)
Fermentation (Ferm4Farm)
Prestart Neonatal
DML
Dry, Moist and Liquid (DML) co-products
Supplemental to rations
Rapeseed meal (D) Feedmix RV (D) Beet pulp (M) Corngold® (M) Citrocell (M) DGS Protiwanze® (L)
Crop
Broad product portfolio to support crop production
Nutrient planning, cultivation techniques, crop protection, rotations, variety choice, etc.
Seeds (Topgrass) Silage additives (SiloSolve©FC) Crop protection Fertilisers (e.g. Gro Grass, Gro Mais)
22

Swine Strategy: More with Less
Sow
Outstanding litter performance and lactational excellence
Piglet
Healthy piglet development and growth
Finisher
Optimal growth and feed efficiency to maximise carcass
value sustainably
Delivering customer value to become the preferred feed partner
Complete life stage portfolio design on common nutrition concepts in all markets
Demonstrating Added Value: animal feed profit & performance analysis
On-farm advisory and support is delivered by advisor
Harmonised nutritional approach simplifying and standardising Raw Material ingredients Standardised manufacturing processes enhancing product quality Leveraging nutritional innovation capacity & investment through strategic partnerships Optimising product portfolio architecture to deliver local market needs
Decomplexing products, production and supply chains to realise efficiencies
Products
Expert Team
Performance
€ efficiencies
€ added value
=
=
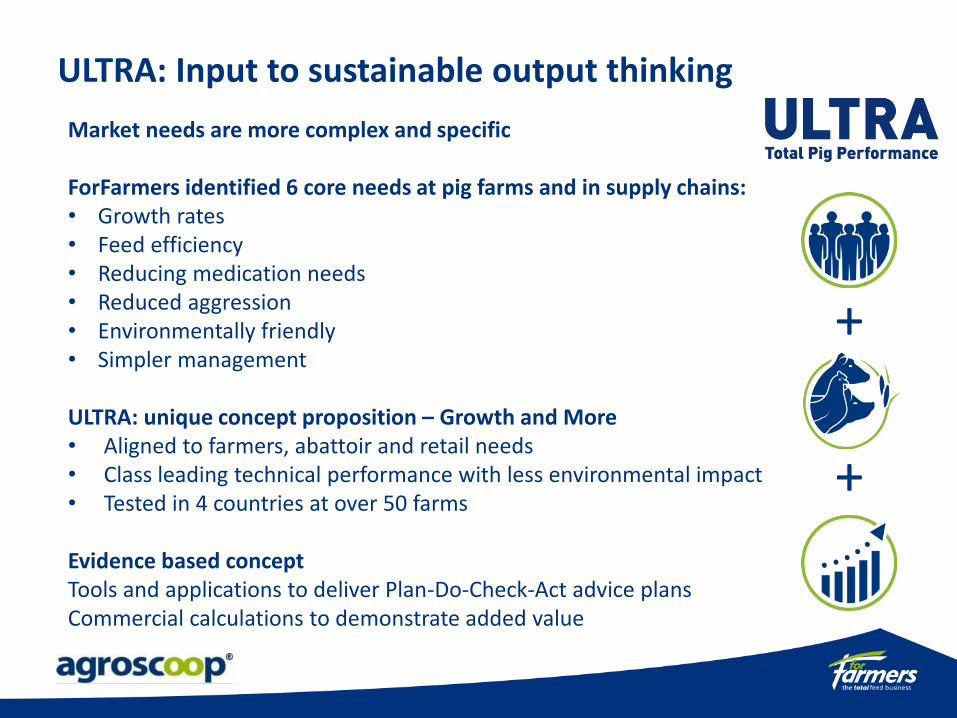
ULTRA: Input to sustainable output thinking
24
Market needs are more complex and specific
ForFarmers identified 6 core needs at pig farms and in supply chains:• Growth rates• Feed efficiency• Reducing medication needs• Reduced aggression• Environmentally friendly• Simpler management
ULTRA: unique concept proposition – Growth and More• Aligned to farmers, abattoir and retail needs• Class leading technical performance with less environmental impact• Tested in 4 countries at over 50 farms
Evidence based conceptTools and applications to deliver Plan-Do-Check-Act advice plansCommercial calculations to demonstrate added value
+
+

Clear and proven M&A strategy to drive further expansion and profitability
25
Source: ForFarmers
Rationale for leading market share
ScaleLeverage sales
force and organise it by species
Optimise production capacity with dedicated
plants by species
Leverage overhead and R&D functions
Characteristics….
Cross leveraging ForFarmers capabilities
Synergy potential
Regional leadership potential
Risk assessment
(i.e. management, geographical)
PortfolioAdd capabilities /
segments to portfolio
Capabilities e.g.:
DML, crop, specialties
Segments (e.g.):
Sow, piglets, poultry, dairy
Regional
market share
High regional market share
to optimise logistics
Direct access to the farmer with mills located near by
Ongoing initiative to further build on strong existing positions
Ongoing initiative to increase
market access, volumes & efficiency
Fine-tune NL & BE Strengthen UK/ GE/ PL
Tap into fast growing, large & attractive markets in Europe+
Europe+
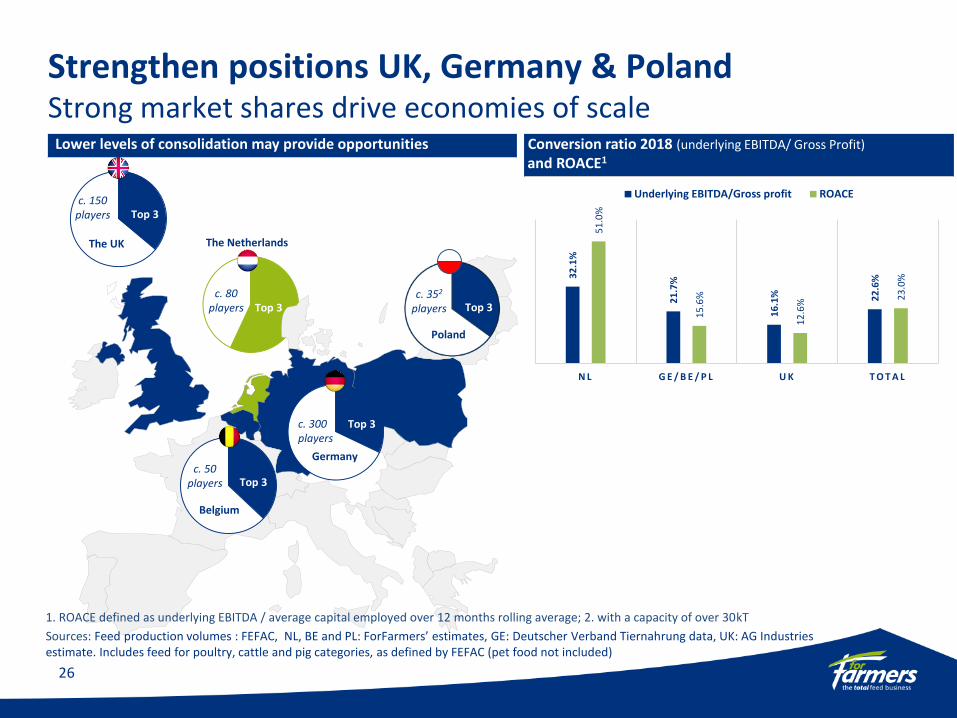
Strengthen positions UK, Germany & PolandStrong market shares drive economies of scale
Top 3
Top 3
Conversion ratio 2018 (underlying EBITDA/ Gross Profit)
and ROACE1
Lower levels of consolidation may provide opportunities
Top 3
Germany
Belgium
The NetherlandsThe UK
c. 80players
c. 150players
c. 300players
c. 50players
Top 3
Top 3
Top 3
Top 3
1. ROACE defined as underlying EBITDA / average capital employed over 12 months rolling average; 2. with a capacity of over 30kT
Sources: Feed production volumes : FEFAC, NL, BE and PL: ForFarmers’ estimates, GE: Deutscher Verband Tiernahrung data, UK: AG Industries estimate. Includes feed for poultry, cattle and pig categories, as defined by FEFAC (pet food not included)
26
Poland
c. 352
players Top 3
32
.1%
21
.7%
16
.1% 22
.6%
51
.0%
15
.6%
12
.6%
23
.0%
N L G E / B E / P L U K T O T A L
Underlying EBITDA/Gross profit ROACE

ForFarmers’ acquisitions in 2018
27
Maatman (NL)
Sector Poultry & Ruminants
Volume * 114 kT
Location Wolvega (FR)
Van Gorp Biologische Voeders (NL)
Sector Organic (all)
Volume * 67 kT
Location Schalkwijk (UT)
Voeders Algoet (BE)
Sector Swine & Ruminants
Volume * 150 kT
Location Zulte
Tasomix (60%) (PL)
Sector Poultry, Ruminant & Swine
Volume * 395 kT
Locations Pionki, Biskupice, Kaboro
* Volumes (2017) as disclosed in relating press releasesSource: ForFarmers

Acquisitions / divestments as of 2014
28
Company YearAcquisitions / Divestments
Sector CountryVolume
Total Feed1
(x1.000 ton)
Acquisitionamount 1
(€m)
Van Gorp Biologische Voeders 2018 Acquisition All (organic) Netherlands 67 9.1
Maatman 2018 Acquisition Poultry, ruminant Netherlands 105 8.3
Voeders Algoet 2018 Acquisition Swine, ruminant Belgium 150 15.5
Tasomix (60%) 2018 Acquisition Poultry, Ruminant and Swine Poland 402 92.02
Arable customer portfolio (FF NL) 2018 Divestment Crop / Arable Netherlands (5.7)
DML activities (FF NL) 2018 Partnership DML Netherlands 160
Wilde Agriculture Ltd. 2017 Acquisition All United Kingdom 2.0
Transport activities Wheyfeed 2016 Divestment Transport United Kingdom
Leafield Feeds Ltd. 2016 Divestment Other United Kingdom (1.3)
VleutenSteijnVoeders B.V. 2016 Acquisition Swine Netherlands 295 30.5
Countrywide Farmers 2015 Acquisition All United Kingdom 400 14.0
Export activities BOCM PAULS 50% 2014 Divestment All United Kingdom
Subli 2014 Divestment Horses Netherlands
De Peel Consultancy & Voeders B.V. 2014 Acquisition All Netherlands 1.2
Wheyfeed Ltd. 2014 Acquisition Liquid additives United Kingdom 200 5.4
HST Feed Ltd. 2014 Acquisition Ruminant, Poultry United Kingdom 140 16.2
1) Volumes and Purchase considerations as presented in financial statements 2018, or the relating press release, 2) First payment, €57.2 m in July 2018, second payment (earn-out) to follow in 2021; For exact dates of closing of transactions, reference is made to the relevant press releases; Source: ForFarmers

ForFarmers’ team
• 2,654 FTE’s1
• c. 650 commercial functions
• c. 450 on-farm advisors
• Management programmes (e.g. Masterclass Senior Management, Potential Program)
• Logistics Academy, Sales Academy and Sector Academies (Ruminants, Swine, Poultry)
1. As at 31-12-2018, equalling 2,761 employeesSource: ForFarmers
Profile
Focus on talent development & leadership
29

Sustainability KPIs 2018
30
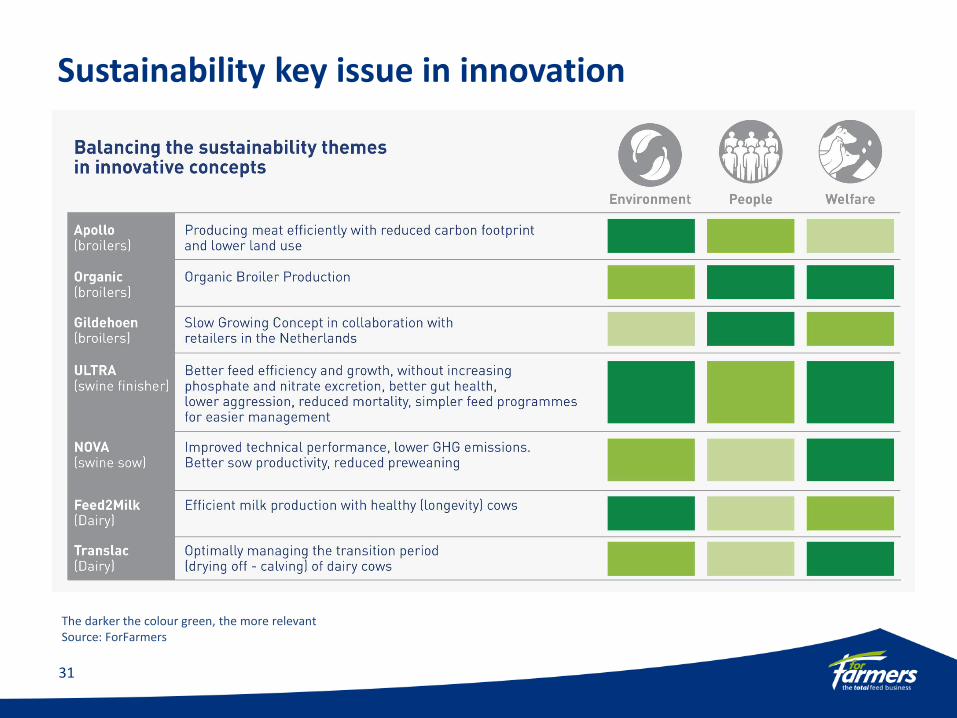
Sustainability key issue in innovation
31
The darker the colour green, the more relevantSource: ForFarmers

FINANCIAL RESULTS 2018
32
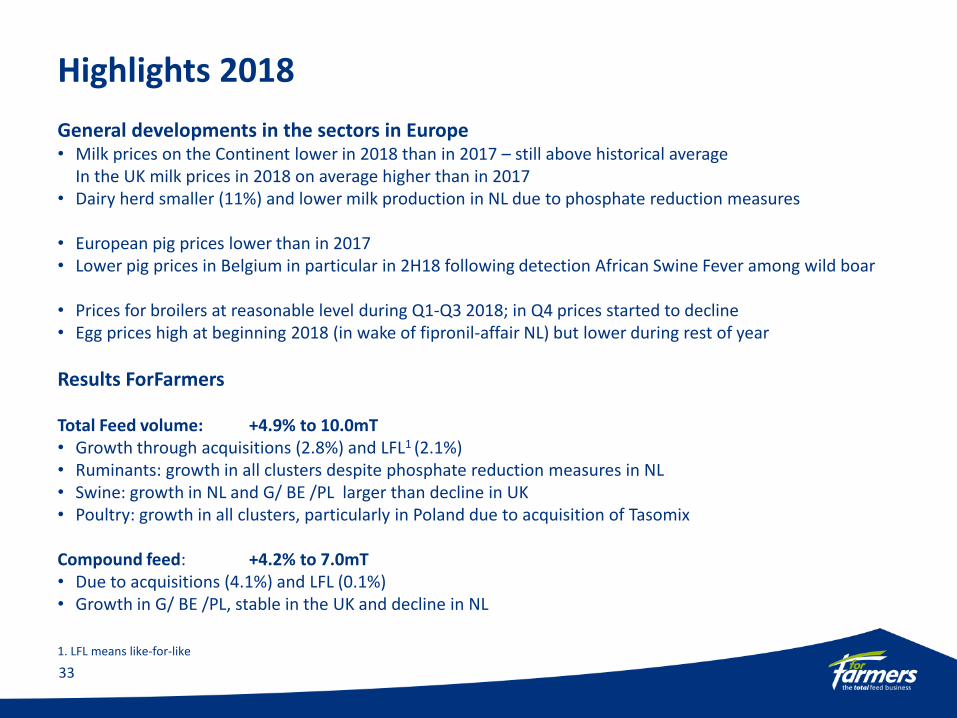
Highlights 2018
33
General developments in the sectors in Europe• Milk prices on the Continent lower in 2018 than in 2017 – still above historical average
In the UK milk prices in 2018 on average higher than in 2017• Dairy herd smaller (11%) and lower milk production in NL due to phosphate reduction measures
• European pig prices lower than in 2017• Lower pig prices in Belgium in particular in 2H18 following detection African Swine Fever among wild boar
• Prices for broilers at reasonable level during Q1-Q3 2018; in Q4 prices started to decline• Egg prices high at beginning 2018 (in wake of fipronil-affair NL) but lower during rest of year
Results ForFarmers
Total Feed volume: +4.9% to 10.0mT• Growth through acquisitions (2.8%) and LFL1 (2.1%)• Ruminants: growth in all clusters despite phosphate reduction measures in NL• Swine: growth in NL and G/ BE /PL larger than decline in UK• Poultry: growth in all clusters, particularly in Poland due to acquisition of Tasomix
Compound feed: +4.2% to 7.0mT• Due to acquisitions (4.1%) and LFL (0.1%)• Growth in G/ BE /PL, stable in the UK and decline in NL
1. LFL means like-for-like

Highlights 2018 - continuedGross profit: +5.6% to €443.4m; acquisitions (+2.3%), LFL1 (+3.6%), forex translation (-0.3%)
Underlying2 EBITDA at constant currencies: -1.0% to €100.4m; growth GE/BE/PL & UK could not compensate decline NL
Incidental gain €3.9m (on EBITDA level), mainly due to sale of arable activities in NL
Profit (to shareholders): flat at €58.6m
EPS: +3.6% to €0.58Underlying2 EPS flat at €0.58 (excl. impact of SBB3 : €0.56)
Net cash flow from operating €82.1m (2017: €116.3m) activities
Working capital + €7.1m, due to acquisitions (+€30.4m) and LFL improvement (-€23.3m)
Ratios: Conversion ratioUnderlying EBITDA/ gross profit 22.6% (2017: 24.2%)ROACE4 23.0% (2017: 24.3%)ROACE5 16.4% (2017: 18.2%)Solvency 50.4% (Dec-17: 52.1%)
34
1. LFL means Like-for-like and is the movement excluding acquisitions and divestments and currency effects; 2. ‘Underlying’ means excl. incidentals, see note 27 financial statement relating to Alternative Performance Measures (APMs); 3. SBB means share buy back programme; 4. ROACE means underlying EBITDA divided by 12-months average capital; 5. ROACE based on underlying EBIT divided by 12-months average capital
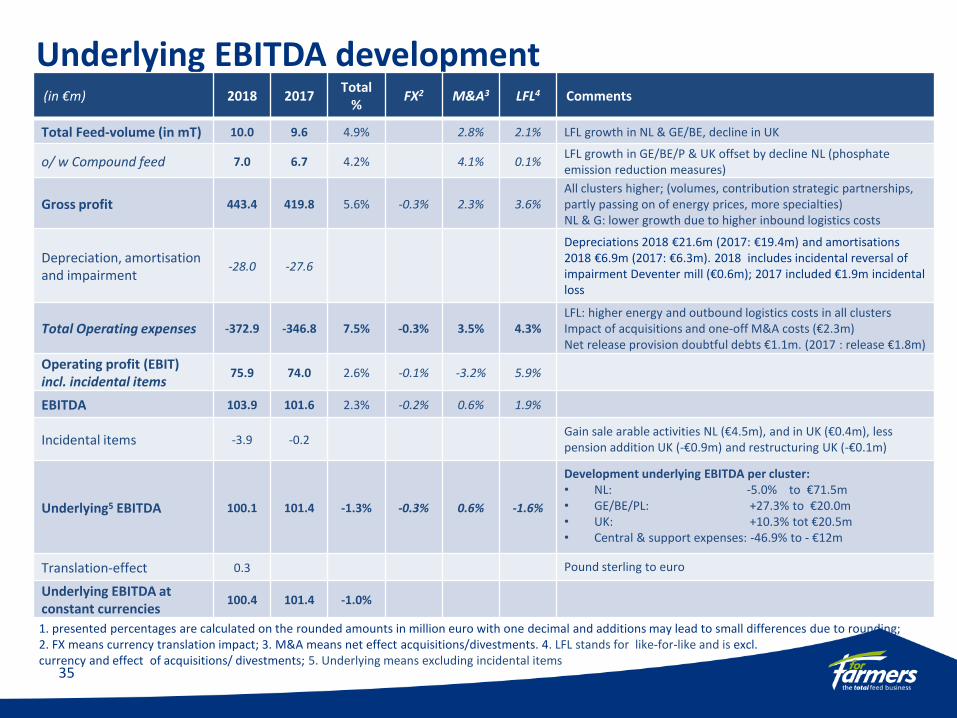
Underlying EBITDA development(in €m) 2018 2017
Total%
FX2 M&A3 LFL4 Comments
Total Feed-volume (in mT) 10.0 9.6 4.9% 2.8% 2.1% LFL growth in NL & GE/BE, decline in UK
o/ w Compound feed 7.0 6.7 4.2% 4.1% 0.1%LFL growth in GE/BE/P & UK offset by decline NL (phosphate emission reduction measures)
Gross profit 443.4 419.8 5.6% -0.3% 2.3% 3.6%All clusters higher; (volumes, contribution strategic partnerships, partly passing on of energy prices, more specialties)NL & G: lower growth due to higher inbound logistics costs
Depreciation, amortisation and impairment
-28.0 -27.6
Depreciations 2018 €21.6m (2017: €19.4m) and amortisations 2018 €6.9m (2017: €6.3m). 2018 includes incidental reversal of impairment Deventer mill (€0.6m); 2017 included €1.9m incidental loss
Total Operating expenses -372.9 -346.8 7.5% -0.3% 3.5% 4.3%LFL: higher energy and outbound logistics costs in all clusters Impact of acquisitions and one-off M&A costs (€2.3m) Net release provision doubtful debts €1.1m. (2017 : release €1.8m)
Operating profit (EBIT)incl. incidental items
75.9 74.0 2.6% -0.1% -3.2% 5.9%
EBITDA 103.9 101.6 2.3% -0.2% 0.6% 1.9%
Incidental items -3.9 -0.2Gain sale arable activities NL (€4.5m), and in UK (€0.4m), less pension addition UK (-€0.9m) and restructuring UK (-€0.1m)
Underlying5 EBITDA 100.1 101.4 -1.3% -0.3% 0.6% -1.6%
Development underlying EBITDA per cluster:• NL: -5.0% to €71.5m• GE/BE/PL: +27.3% to €20.0m• UK: +10.3% tot €20.5m• Central & support expenses: -46.9% to - €12m
Translation-effect 0.3 Pound sterling to euro
Underlying EBITDA at constant currencies
100.4 101.4 -1.0%
1. presented percentages are calculated on the rounded amounts in million euro with one decimal and additions may lead to small differences due to rounding; 2. FX means currency translation impact; 3. M&A means net effect acquisitions/divestments. 4. LFL stands for like-for-like and is excl. currency and effect of acquisitions/ divestments; 5. Underlying means excluding incidental items
35
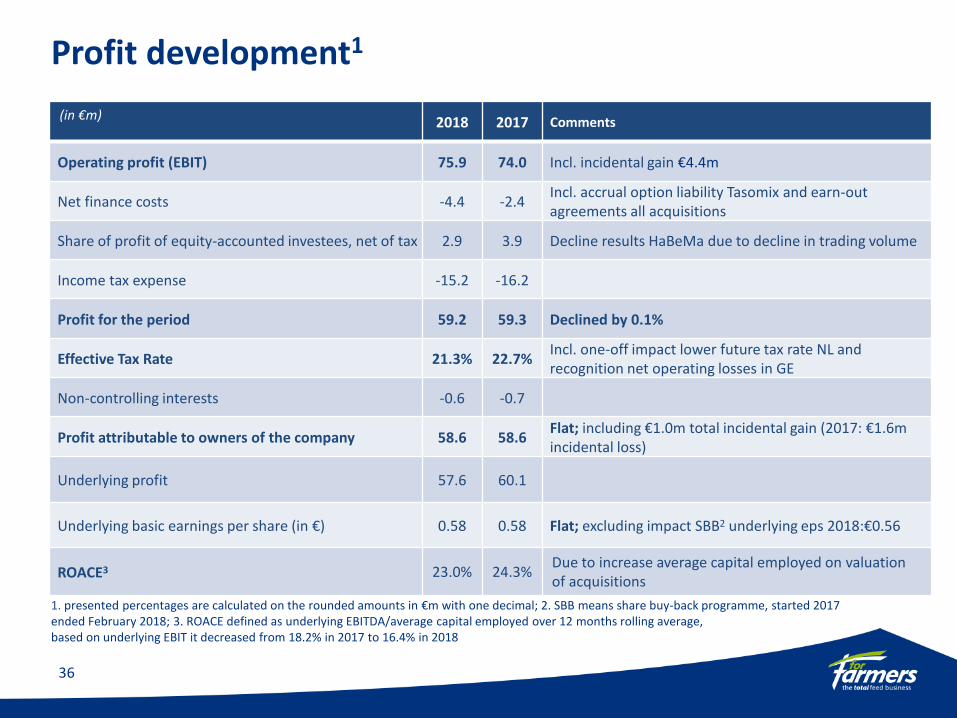
(in €m) 2018 2017 Comments
Operating profit (EBIT) 75.9 74.0 Incl. incidental gain €4.4m
Net finance costs -4.4 -2.4Incl. accrual option liability Tasomix and earn-out agreements all acquisitions
Share of profit of equity-accounted investees, net of tax 2.9 3.9 Decline results HaBeMa due to decline in trading volume
Income tax expense -15.2 -16.2
Profit for the period 59.2 59.3 Declined by 0.1%
Effective Tax Rate 21.3% 22.7%Incl. one-off impact lower future tax rate NL and recognition net operating losses in GE
Non-controlling interests -0.6 -0.7
Profit attributable to owners of the company 58.6 58.6Flat; including €1.0m total incidental gain (2017: €1.6m incidental loss)
Underlying profit 57.6 60.1
Underlying basic earnings per share (in €) 0.58 0.58 Flat; excluding impact SBB2 underlying eps 2018:€0.56
ROACE3 23.0% 24.3%Due to increase average capital employed on valuation of acquisitions
1. presented percentages are calculated on the rounded amounts in €m with one decimal; 2. SBB means share buy-back programme, started 2017 ended February 2018; 3. ROACE defined as underlying EBITDA/average capital employed over 12 months rolling average, based on underlying EBIT it decreased from 18.2% in 2017 to 16.4% in 2018
Profit development1
36
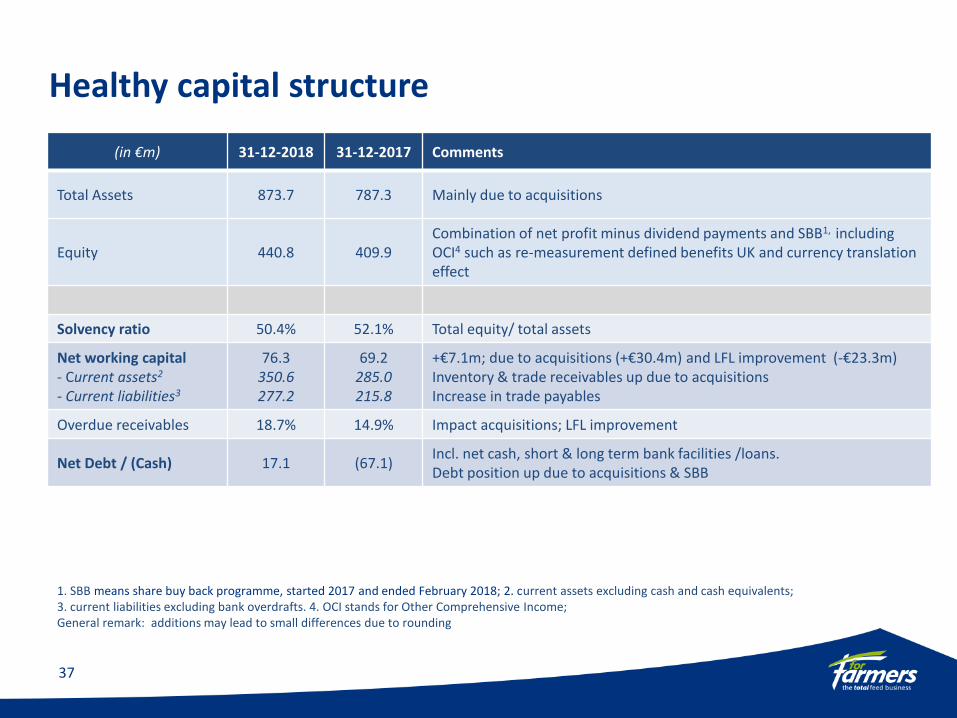
1. SBB means share buy back programme, started 2017 and ended February 2018; 2. current assets excluding cash and cash equivalents; 3. current liabilities excluding bank overdrafts. 4. OCI stands for Other Comprehensive Income; General remark: additions may lead to small differences due to rounding
Healthy capital structure
37
(in €m) 31-12-2018 31-12-2017 Comments
Total Assets 873.7 787.3 Mainly due to acquisitions
Equity 440.8 409.9Combination of net profit minus dividend payments and SBB1, including OCI4 such as re-measurement defined benefits UK and currency translation effect
Solvency ratio 50.4% 52.1% Total equity/ total assets
Net working capital- Current assets2
- Current liabilities3
76.3350.6277.2
69.2285.0215.8
+€7.1m; due to acquisitions (+€30.4m) and LFL improvement (-€23.3m)Inventory & trade receivables up due to acquisitionsIncrease in trade payables
Overdue receivables 18.7% 14.9% Impact acquisitions; LFL improvement
Net Debt / (Cash) 17.1 (67.1)Incl. net cash, short & long term bank facilities /loans. Debt position up due to acquisitions & SBB

Market and sector developments by region in 2018
38
General• Warm, dry summer months leading to low river levels (NL and Germany) & spike in raw materials prices (2H18)• Growing consumer interest in poultry products
The Netherlands• Increasing public pressure on agricultural sector in light of climate targets• Smaller dairy herd (-11%) & extra investments for farmers required following phosphate regulations• Demand for non-GMO1 feed is increasing (resulting in re-opening of Deventer mill)
Germany• Growing interest in animal welfare and environmentally friendly measures• Demand for non-GMO1 feed continues to grow
Belgium• Consumer interest in quality and provenance of food & more focus on AMR2
• African swine fever detected among wild boar, leading to pressure on pig prices
Poland• Growing discussion regarding use of GMO soy & use of local raw materials• Poultry sector grows faster than in other European countries
United Kingdom• Due to cold spring and dry summer increasing demand for compound feed in ruminant sector• Swine sector remained stable following increased demand and increased import from the Continent• Consumer demand for poultry growing
1. non-GMO means non genetically modified organisms, 2) AMR means anti microbial resistance

Total Feed volume-development in 2018
39
Volume Total Feed: +4.9% (10.0mT)• Compound feed +4.2% (7.0mT)
The Netherlands : + 2.9% (4.5mT)• Smaller dairy cow herd due to phosphate measures• Volume growth TF in all species• Volume growth biological (organic) feed (Reudink)• Volume compound feed declined in ruminant and swine
Germany/Belgium/Poland +15.3% (2.6mT) • Volume growth TF in all sectors• LFL growth market share in all species• Considerable increase in poultry sector due to Tasomix
acquisition• Volume growth compound feed (in %) higher than in TF, mainly
due to Tasomix and Voeders Algoet
United Kingdom: -0.1% (2.9mT)• Volume TF growth in ruminant sector, mainly to dairy farmers• TF volume decline in swine sector on lower DML volumes due to
discontinuation of some loss making activities• Volume growth TF in poultry sector• Volume compound feed rose more (in %) than TF
Development percentages are presented based on actual (non-rounded) volumes in tonnes
1) 2017 comparative data adjusted to reflect DML sales shift from NL to BE
4,5
49
2,5
69
2,9
03
10
,02
1
4,4
21
2,2
28
2,9
07
9,5
56
N L G E / B E / P L U K T O T A L
Total Feed volume per cluster1
2018 2017
NL45%
GE/BE/PL26%
UK29%
2018 volume split per cluster

Gross profit: LFL1 growth in all clusters
40
(in €m and %)Reported
2018 vs. 2017Total difference2018 vs. 2017
Currency impact M&A1
LFL3
change
Gross profit 443.4 419.8 23.6 5.6% -1.1 -0.3% 9.7 2.3% 15.0 3.6%
Gross profit per cluster
In all clusters:• More specialties in product mix• Contribution strategic partnerships• Partly passing on increased energy prices
The Netherlands: + €1.7m (0.8%)• Effect divestment arable activities• Lower compound feed volumes (phosphate measures)• Higher inbound logistics costs (low river levels)• No full pass-on of spike in raw material prices
Germany/Belgium/Poland: + €15.9m (20.9%)• Large impact acquisitions (Poland and Belgium),
particularly on compound feed volume • LFL volume growth• No full pass-on of spike in raw material prices in Poland
United Kingdom: + €6.2m (5.1%)• Higher growth (in %) compound feed volume than TF volume• Successfully renewed commercial proposition to large pig farmers
Additions may lead to slight differences due to roundings; 1) M&A means net effect acquisitions/divestments; 2) Incl. Group/eliminations; 3) LFL stands for like-for-like and means excluding currency impact and net effect acquisitions & divestments
22
3.1
92
.2 12
7.5
44
3.4
22
1.4
76
.2 12
1.3
41
9.8
N L G E / B E / P L U K T O T A L ( 2 )
2018 2017
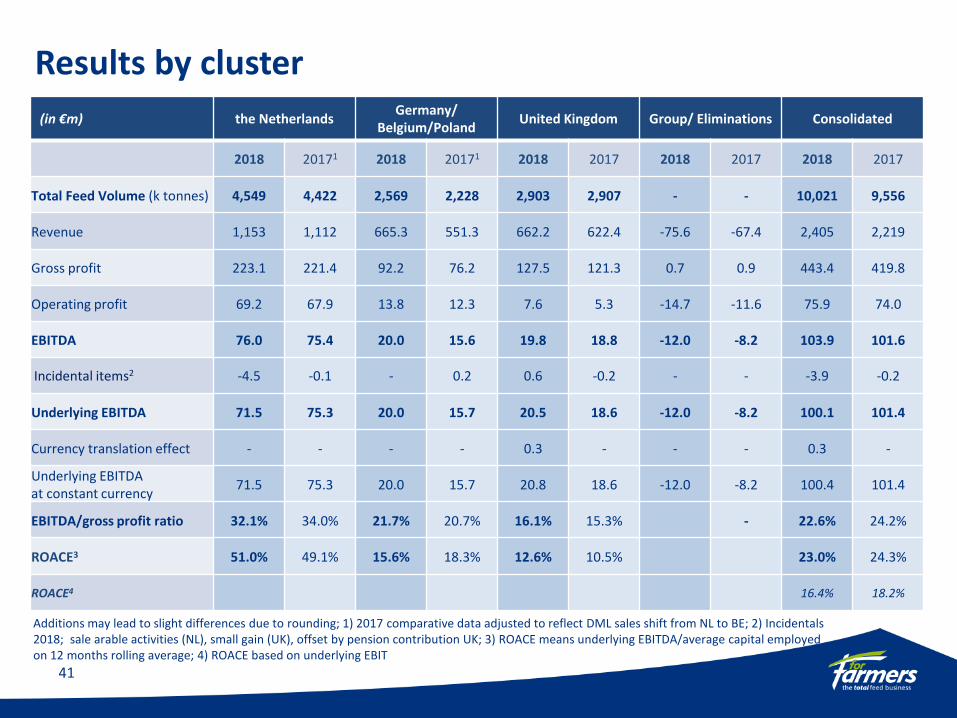
Results by cluster
41
(in €m) the NetherlandsGermany/
Belgium/PolandUnited Kingdom Group/ Eliminations Consolidated
2018 20171 2018 20171 2018 2017 2018 2017 2018 2017
Total Feed Volume (k tonnes) 4,549 4,422 2,569 2,228 2,903 2,907 - - 10,021 9,556
Revenue 1,153 1,112 665.3 551.3 662.2 622.4 -75.6 -67.4 2,405 2,219
Gross profit 223.1 221.4 92.2 76.2 127.5 121.3 0.7 0.9 443.4 419.8
Operating profit 69.2 67.9 13.8 12.3 7.6 5.3 -14.7 -11.6 75.9 74.0
EBITDA 76.0 75.4 20.0 15.6 19.8 18.8 -12.0 -8.2 103.9 101.6
Incidental items2 -4.5 -0.1 - 0.2 0.6 -0.2 - - -3.9 -0.2
Underlying EBITDA 71.5 75.3 20.0 15.7 20.5 18.6 -12.0 -8.2 100.1 101.4
Currency translation effect - - - - 0.3 - - - 0.3 -
Underlying EBITDA at constant currency
71.5 75.3 20.0 15.7 20.8 18.6 -12.0 -8.2 100.4 101.4
EBITDA/gross profit ratio 32.1% 34.0% 21.7% 20.7% 16.1% 15.3% - 22.6% 24.2%
ROACE3 51.0% 49.1% 15.6% 18.3% 12.6% 10.5% 23.0% 24.3%
ROACE4 16.4% 18.2%
Additions may lead to slight differences due to rounding; 1) 2017 comparative data adjusted to reflect DML sales shift from NL to BE; 2) Incidentals 2018; sale arable activities (NL), small gain (UK), offset by pension contribution UK; 3) ROACE means underlying EBITDA/average capital employed on 12 months rolling average; 4) ROACE based on underlying EBIT

Horizon 2020 – Activities update
Focus on attractive segments• Focus on growth in specialities
• Continuation growth in organic feed solutions (Reudink)
Partner and deliver the Total Feed Business portfolio• Strategic partnership with Nutreco extended for 5 years
• Strategic partnership with Baks in NL regarding moist co-products
• Use of CRM for offering Total Feed and focus on sales efficiency
Acquisitions (& divestments)• Sale of (non-core) arable activities in the Netherlands (February)
• Acquisition 60% shares of Tasomix, Poland (July)
• Acquisition Maatman, the Netherlands and Germany (September)
• Acquisition Voeders Algoet, Belgium (October)
• Acquisition Van Gorp Biologische Voeders, the Netherlands (October)
One ForFarmers: functional excellence & leverage scale• Health & Safety: increase in number LTIs1 requires attention
• UK business transformation: combination ruminant sales teams to one commercial organisation & announced closing of Blandford site
• Implementation of Financial Shared Service Centre on Continent (NL, BE and GE)
42
1. LTI’s means Lost Time Incidents

Horizon 2020 – delivery progress
Employee development• Appointment Arthur van Och as Supply Chain Director
• Retirement Jan Potijk and nomination Adrie van der Ven as of AGM 2019
• Appointment of Pieter Wolleswinkel and David Fousert as members of the Executive Committee
• Internal academies across species and functions fully operational
• Approx. 25% of ForFarmers employees shareholder of ForFarmers
Total nutrition solutions
• Apollo poultry concept launched in NL, GE, UK (starter feed concept for chickens)• ‘Pens Stimulator+’ product introduced in NL – for better roughage uptake by dairy cows• On-farm applications introduced for pig farmers in UK – to measure technical results• Ultra, new concept for finishers (swine sector) developed; launched in February 2019
Results 2018
• Underlying EBITDA at constant currencies -1.0% to €100.4m
• Profit for shareholders flat at €58.6m
• Underlying earnings per share flat at €0.58 (excl. impact of SBB1 : €0.56)
43
1) SBB means share buy back programme
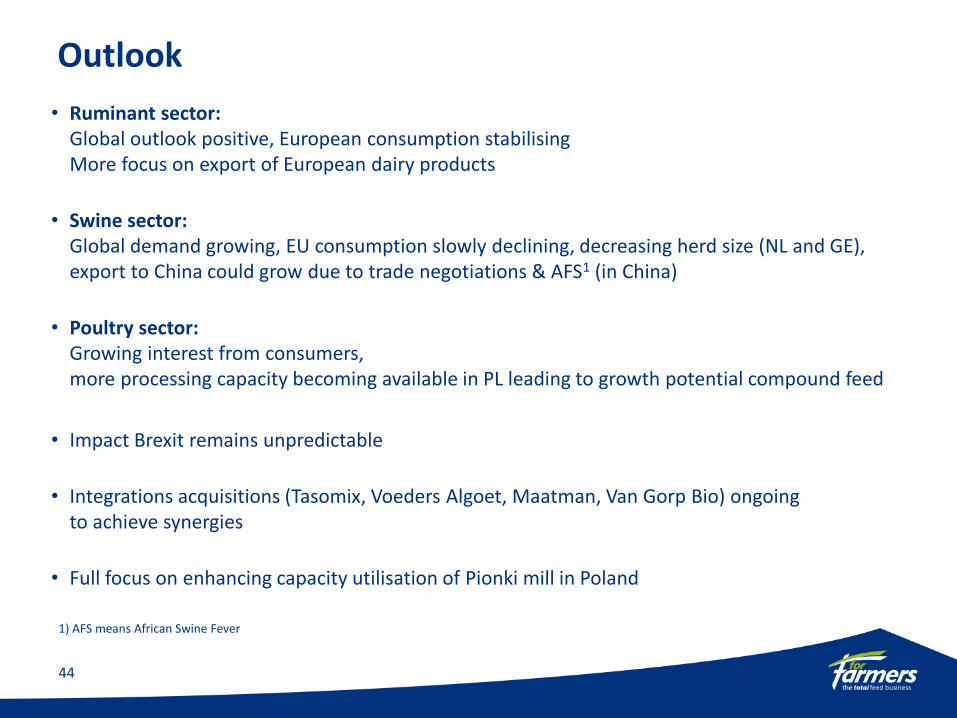
Outlook
• Ruminant sector:Global outlook positive, European consumption stabilising More focus on export of European dairy products
• Swine sector: Global demand growing, EU consumption slowly declining, decreasing herd size (NL and GE),export to China could grow due to trade negotiations & AFS1 (in China)
• Poultry sector: Growing interest from consumers, more processing capacity becoming available in PL leading to growth potential compound feed
• Impact Brexit remains unpredictable
• Integrations acquisitions (Tasomix, Voeders Algoet, Maatman, Van Gorp Bio) ongoing to achieve synergies
• Full focus on enhancing capacity utilisation of Pionki mill in Poland
44
1) AFS means African Swine Fever
Outlook (continued)• 2019 first-half results
Underlying EBITDA expected to show strong decline vs 1H2018 results due to current purchasing positions in combination with focus on sustaining market share
• Efficiency plans 2019 – 2020 launchedTotal cost savings of €10m (in 2021 vs 2018); optimisation group factory footprint & other efficiency projectsExisting 2017 UK supply chain rationalisation plans incorporated (e.g. recently announced closing Blandford site)Affects all countries excluding Poland and covers all functionsInvolves reduction of 125–150 FTEs (approx. 5 to 6% of FTEs); natural attrition & redundancies Efficiency plans will lead to incidental costs
• Planned capex and working capital 2019€50m capex, on e.g systems and processes to support ongoing growth, enhanced efficiency measures and digitalisation. Ongoing focus on further optimising working capital and leveraging strategic suppliers
• IFRS 16Impact (as of 1-1-2019): expected increase of EBITDA by approx. €5.0m, no impact on EBITExpected net decrease of profit before tax of €0.5m Per 1-1-2019: total assets increase approx. €25.0m
• Proposal for new Share Buy-Back (SBB1) programmeLimited SBB of €30m and a SBB for employee participation programmeStart after the publication of Q1 2019 trading update, end no later than October 2020
• Reconfirmation guidance: for the medium term an on average annual underlying EBITDA growth in the mid single digits at constant currencies, excl. impact of significant acquisitions & barring unforeseen circumstances
1) SBB means share buy-back programme45
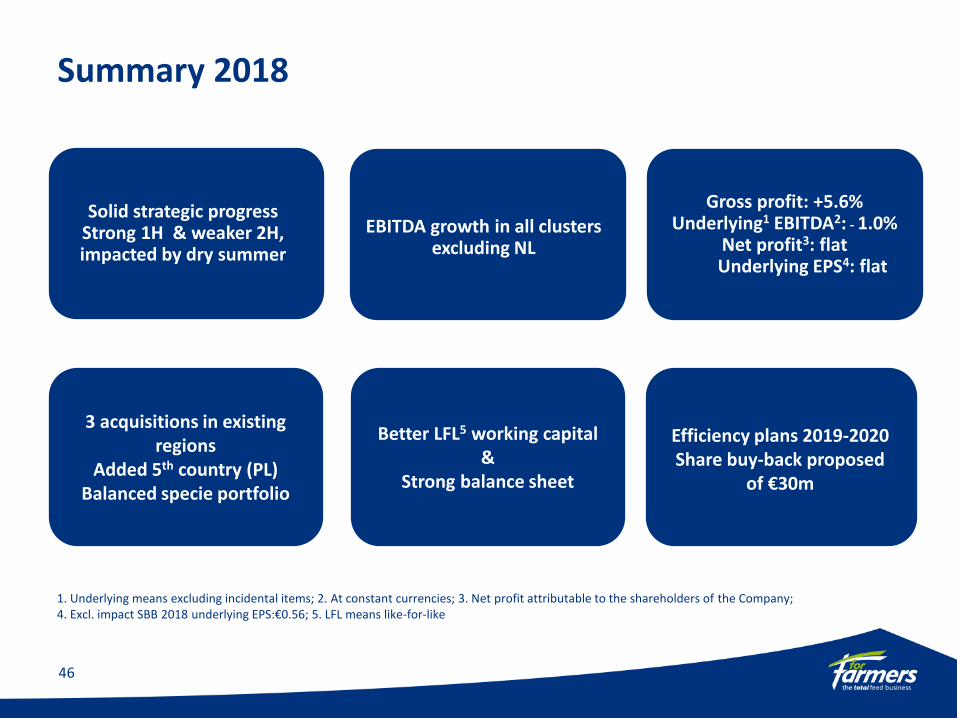
Summary 2018
46
Gross profit: +5.6%Underlying1 EBITDA2: - 1.0%
Net profit3: flatUnderlying EPS4: flat
Solid strategic progress Strong 1H & weaker 2H, impacted by dry summer
3 acquisitions in existing regions
Added 5th country (PL)Balanced specie portfolio
Efficiency plans 2019-2020Share buy-back proposed
of €30m
Better LFL5 working capital &
Strong balance sheet
EBITDA growth in all clusters excluding NL
1. Underlying means excluding incidental items; 2. At constant currencies; 3. Net profit attributable to the shareholders of the Company; 4. Excl. impact SBB 2018 underlying EPS:€0.56; 5. LFL means like-for-like

Contact
Caroline Vogelzang
Director Investor Relations & Communications
Mobile: +31 6 10 949 161
Landline:+31 573 288 194
ForFarmers N.V.
Kwinkweerd 12
7241 CW Lochem
The Netherlands
47
48