the trace element requirements of vegetable and poppies in ... · final report of the trace...
TRANSCRIPT

The trace element requirements of
vegetable and poppies in Tasmania
Ali Salardindi Tasmanian Institute of
Agricultural Research
Project Number: PT320

PT320
This report is published by Horticulture Australia Ltd to pass on information concerning horticultural research and development undertaken for the potato industry.
The research contained in this report was funded by Horticulture Australia Ltd with the financial support of the potato industry; Tasmanian Alkaloids Pty Ltd; Glaxo Australia Pty Ltd; McCains Foods (Aust) Pty Ltd; Thrive-Ag Ltd; Edgell Birds Eye (Scottsdale); EZ Fertilisers and TFGA Vegetable Council.
All expressions of opinion are not to be regarded as expressing the opinion of Horticulture Australia Ltd or any authority of the Australian Government.
The Company and the Australian Government accept no responsibility for any of the opinions or the accuracy of the information contained in this report and readers should rely upon their own enquiries in making decisions concerning their own interests.
ISBN 0 7341 0299 2
Published and distributed by:
Horticultural Australia Ltd
Level 1 50 Carrington Street Sydney NSW 2000 Telephone: (02) 8295 2300 Fax: (02) 8295 2399
E-Mail: [email protected]
© Copyright 2001 Horticulture Australia

%
^ l lAR. «• \ /
Tasmanian Institute of Agricultural Research
Project No. PT320
The Trace Element Requirements of Vegetables and Poppies in Tasmania
Project Leader: Dr Ali Salardini Tasmanian Institute of Agricultural Research
Final Report to
horticultures, Horticulture Australia limited
September 2001
Sponsors
Sirrmlot A U S T R A L I A
GlaxoWellcome
impact MCfi** SERVE-AG
m Tasmania
DEPARTMENT of PRIMARY INDUSTRY
und FISHERIES

Project No.: PT320
Project Title:
The Trace Element Requirements of Vegetables and Poppies in Tasmania
Project Leader: Dr Ali Salardini, University of Tasmania Tasmanian Institute of Agricultural Research (TIAR) GPO Box 252-54 Hobart Tas 7001 Phone: 03 6226 1804 Facsimile 03 6226 7450 E-mail: Ali.Salardini(g).utas.edu.au
Other Investigators Dr Leigh Sparrow. Tasmanian Institute of Agricultural Research PO Box 46 Kings Meadows, Tasmania 7249.
Technical officers, Richard Holloway, Andrew Baker, David Chambers, Leann Mclnnerney, Geoff Heazlewood and Owen Bantick
Acknowledgements Project partners
Horticulture Australia Limited (HAL) formly the Horticultural Research and Development Corporation (HRDC).
Tasmanian Institute of Agricultural Research
Department of Primary Industry, Water and Environment
Project sponsors Simplot A ustralia McCains Foods (A ustralia) Pivot Agriculture Impact Fertilizers Tasmanian Alkaloids Glaxo Australia Thrive-Ag, Serve-Ag TFGA Vegetable Council Tasmanian growers
Disclaimer Any recommendation contained in this publication do not necessarily represent current Horticulture Australia Limited policy. No person should act on the basis of the contents of this publication, whether as to matters of fact or opinion or other content, without first obtaining specific, independent professional advice in respect of the matters set out in this publication.
September 2001

Contents CONTENTS i
FIGURES iv
TABLES v
1 TECHNICAL SUMMARY 1
2 MEDIA SUMMARY 3
3 PUBLICATION SCHEDULE 5
4 PROJECT OVERVIEW - OBJECTIVES AND INFORMATION COMMON TO ALL STUDIES 6 4.1 INTRODUCTION 6
4.2 THE PROBLEM 7
4.3 OBJECTIVES 8
4.4 MATERIALS AND METHODS 9
4.4.1 Soils and crops 9 4.4.2 Site Selection P 4.4.3 Methods, source and rate of application of trace elements 10 4.4.4 Nature of treatments 10 4.4.5 Soil and plant analysis 11 4.4.6 Criteria determined 12
5 DETAILS OF FOLIAR TRACE ELEMENT EXPERIMENTS 13
5.1 POPPY EXPERIMENT (ZN, Cu, B, Mo) 13
5.1.1 Methods 13 5.1.2 Results 14 5.1.3 Conclusions to the poppy foliar study 17
5.2 SWEET CORN 17
5.2.1 Methods 17 5.2.2 Results 18 5.2.3 Conclusions to the Sweet corn foliar study 19
5.3 BROCCOLI 19
5.3.1 Methods 19 5.3.2 Results 20 5.3.3 Conclusions to the broccoli foliar study 23
5.4 GREEN BEANS 23
5.4.1 Methods 23 5.4.2 Results 24 5.4.3 Conclusions to the green beans foliar study 25
5.5 GREEN PEAS 26
5.5.1 Methods 26 5.5.2 Results 27 5.5.3 Conclusions to the green peas foliar study 28
5.6 POTATOES, GENERAL PROCEDURES 28
5.6.1 Methods 28 5.6.2 Soil sampling and site selection 29 5.6.3 Experimental design and spray application 29 5.6.4 Plant sampling 29 5.6.5 Harvest 32 5.6.6 Results 32 5.6.7 TE-20 (Zn, Cu Chelates, Solubor Band Cu, Zn, B, Co, Mo, Ca, Mo lignite) 32 5.6.8 TE-21 (Zn Chelate and Co, Mo, B, Mg lignate) 33 5.6.9 TE-22 (Cu Chelate, andZn, Co, Mo, BLignate) 33 5.6.10 TE-23 (Zn Chelate and Zn, Mo, B lignate) 33 5.6.11 TE-24 (Zn chelate) 34 5.6.12 TE-25 (Zn, Cu Chelate, Solubor B and Cu, Zn, Co, Mo, B Lignate) 35 5.6.13 TE-28 (Zn, Cu Chelate and Solubor B) 35 5.6.14 Conclusions to the foliar potato experiments 36
6 DETAILS OF BASAL TRACE ELEMENT EXPERIMENTS 39
Dr Ali Salardini and Dr Leigh Sparrow (2001). Final Report of the Trace Elements Project PT 320 to Horticulture Australia Limited. Page i

6.1 CAULIFLOWER (SOIL AND FOLIAR APPLIED ZN, CU, BAND MO) 39
6.1.1 Methods 39 6.1.2 Results 40 6.1.3 Conclusions to the cauliflower basal study 42
6.2 CARROTS (SOIL-INCORPORATED SOURCES OF B, ZN AND CU) 42
6.2.1 Method 43 6.2.2 Results 44 6.2.3 Conclusions to the carrot basal study 46
6.3 BROCCOLI 46
6.3.1 Method 46 6.3.2 Results 47 6.3.3 Conclusions to the Broccoli basal study 48
6.4 SWEET CORN 48
6.4.1 Methods 49 6.4.2 Result 50 6.4.3 Conclusions to the sweet corn basal study 51
6.5 POTATOES 52
6.5.1 Methods 52 6.5.2 Results 55 6.5.3 Conclusions to the potato basal experiments 61
7 PROJECT DISCUSSION 63
7.1 YIELD OR QUALITY RESPONSE 63
7.2 SOIL TESTS 66
7.3 PLANT ANALYSIS 68
7.4 NUTRIENT INTERACTIONS 69
7.5 SOURCES AND METHOD OF APPLICATION OF TRACE ELEMENTS 70
7.6 TRACE ELEMENT FERTILISER RECOMMENDATIONS 71
8 REFERENCES 72
9 PUBLICATIONS 75
9.1 BLUE POPPY SYNDROME 77
9.1.1 SUMMARY 77 9.1.2 INTRODUCTION 78 9.1.3 OBJECTIVES 78 9.1.4 METHODS 78 9.1.5 RESULTS AND DISCUSSION 79 9.1.6 CONCLUSIONS 82 9.1.7 RECOMMENDATION. 83 9.1.8 FUTURE WORK 84
9.2 TRACE ELEMENT REQUIREMENTS OF VEGETABLES AND POPPIES IN TASMANIA-ON THE UNIVERSITY OF
TASMANIA WEB SITE 85
9.2.1 Background. 85 9.2.2 Objectives 85 9.2.3 Work undertaken to date: 86 9.2.4 Results to date 86 9.2.5 Technology transfer 88 9.2.6 Acknowledgments 88 9.2.7 References 88
9.3 DIAGNOSIS OF TRACE ELEMENT DEFICIENCIES WITH REFERENCES TO TASMANIA 89 9.3.1 Summary 89 9.3.2 Need for trace element application 89 9.3.3 Trace element deficiencies in Tasmania 90 9.3.4 Diagnostic Techniques 90 9.3.5 References 96
9.4 BORON FOR VEGETABLES 98
9.4.1 Introduction 98 9.4.2 Are crops different in their B requirements? 98 9.4.3 What are the symptoms of boron deficiency? 98 9.4.4 Where and when B deficiency may occur? 100 9.4.5 Are there tests to identify or predict the B needs? 100 9.4.6 What B fertilisers are available? 101
Dr Ali Salardini and Dr Leigh Sparrow (2001). Final Report of the Trace Elements Project PT 320 to Horticulture Australia Limited. Page ii

9.4.7 HowB fertilisers are applied? 101 9.4.8 Could B fertilisers be mixed with pesticides sprays? 101 9.4.9 What rates should be applied? 102 9.4.10 Do you like to know more about B? 102
9.5 PLANT TESTING, Is THERE ANYTHING IN IT FOR You? 103 9.6 SOIL TEST FOR TRACE ELEMENTS ESSENTIAL 105
Dr AH Salardini and Dr Leigh Sparrow (2001). Final Report of the Trace Elements Project PT 320 to Horticulture Australia Limited. Page iii

Figures FIGURE 1. YIELD OF SEED (GREY SEGMENT), STRAW (BLACK SEGMENT) AND CAPSULE THE SUM OF THEM (COLUMN)
OF POPPY AS INFLUENCED BY FOLIAR LIGNATE TRACE ELEMENT APPLICATIONS. THE COLUMNS WITH THE
SAME LETTER ARE NOT SIGNIFICANTLY DIFFERENT BY DUNCAN MULTIPLE RANGE TEST (P<0 .05) 1 5
FIGURE 2. EFFECT OF FOLIAR APPLICATION OF DIFFERENT TRACE ELEMENT TREATMENTS ON CU AND ZN
CONCENTRATIONS IN THE Y F E L OF POPPY PLANTS AT HOOK STAGE, 3 7 DAYS AFTER THE FOLIAR
APPLICATION OF TRACE ELEMENTS 1 5
FIGURE 3. CONCENTRATION OF B AND M O IN WHOLE YFEL 37 DAYS AFTER THE FOLIAR APPLICATION OF TRACE
ELEMENTS 1 6
FIGURE 4. YIELD RESPONSE OF BROCCOLI AT FIRST HARVEST (GREY SEGMENT), SECOND HARVEST (BLACK
SEGMENT) AND THEIR SUM (WHOLE COLUMN) TO FOLIAR ZN FERTILISERS. VERTICAL LINES ARE LSD O.05 FOR
THE TOTAL YIELD 2 2
FIGURE 5. EFFECT OF FOLIAR TRACE ELEMENT APPLICATION ON THE HEAD COLOUR (BLACK COLUMN) AND
OVERALL QUALITY (GREY COLUMN) OF BROCCOLI AT FIRST HARVEST. VERTICAL LINES ARE LSD 0.05 FOR THE
RELEVANT QUALITY FACTORS 2 2
FIGURE 6. EFFECTS OF B , M O , ZN AND A COMPLETE FOLIAR FERTILISER ON YIELD AND B CONTENT OF GREEN PEAS
TISSUE AT SASSAFRAS SITE 25
FIGURE 7. EFFECTS OF B, M O , ZN AND A COMPLETE FOLIAR FERTILISER ON YIELD AND B TISSUE CONTENT OF
GREEN PEAS AT SASSAFRAS SITE. VERTICAL LINES INDICATE LSD 0 .05 OF THE MEANS 2 7
FIGURE 8. EFFECTS OF SOIL APPLIED TRACE ELEMENTS ON YIELD OF CARROTS AT WESLEY VALE. CU AND ZN WERE
APPLIED IN SULFATE (S) , CHELATE ( C ) AND LIGNATE ( L ) FORMS 4 5
FIGURE 9. EFFECTS OF SOIL APPLIED TRACE ELEMENTS ON ZN AND CU CONCENTRATION IN THE YFEL OF
CARROTS AT WESLEY VALE. CU AND ZN WERE APPLIED IN SULFATE (S), CHELATE (C) AND LIGNATE (L) FORMS 45
FIGURE 10. EFFECT OF COMPLETE LIGNATE OR MINERAL FERTILISERS AND OMISSION OF ONE TRACE ELEMENT ON
MARKETABLE YIELD OF BROCCOLI AT KINDRED 4 8
FIGURE 11. EFFECT OF RATE AND SOURCE OF BASAL TRACE ELEMENTS ON YIELD OF PRIMARY COBS OF SWEET CORN
50
FIGURE 12. ZN CONCENTRATION IN YFEL AT TASSELLING STAGE OF SWEET CORN AS INFLUENCED BY B AND ZN
APPLICATION 51
FIGURE 13.EFFECT OF FOLIAR AND DIFFERENT RATE OF BANDED (BAND) OR BROADCAST (BROAD) FERTILISER ZN
ON YIELD OF POTATOES AT TE-26 62
FIGURE 14.EFFECT OF FOLIAR AND DIFFERENT RATE OF BANDED (BAND) AND BROADCAST (BROAD) FERTILISER ZN
ON THE ZN CONCENTRATION IN PETIOLE (LEFT COLUMN OF THE PAIRS) AND LAMINA (RIGHT COLUMN) OF
POTATOES AT T E - 2 6 6 2
FIGURE IS.EFFECT OF FOLIAR AND DIFFERENT RATE OF BANDED (BAND) OR BROADCAST (BROAD) FERTILISER ZN
ON CD CONCENTRATION IN TUBER (COLUMN) AND LAMINA (LINE) OF POTATOES AT TE-26 63
FIGURE 1 A. EFFECT OF BANDED AND INCORPORATED P FERTILISERS ON THE SEEDLING COLOUR SCORE 81
FIGURE 2A. EFFECT OF BANDED AND INCORPORATED P FERTILISERS ON THE VEGETATIVE SCORE OF THE SEEDLINGS
81
FIGURE 3A. EFFECT OF BANDED AND APPLIED P ON THE SOIL EXTRACTABLE P 82
FIGURE IB. GLASSHOUSE STUDIES ON TRACE ELEMENT REQUIREMENTS OF POPPIES 86
FIGURE 2B. BORON DEFICIENCY ON BRASSICA CROPS WAS OBSERVED MORE FREQUENTLY THAN OTHER TRACE
ELEMENTS 87
Dr Ali Salardini and Dr Leigh Sparrow (2001). Final Report of the Trace Elements Project PT 320 to Horticulture Australia Limited. Page iv

Tables TABLE 1. SOURCES OF TRACE ELEMENT FERTILISERS USED IN EXPERIMENTS 11
TABLE 2. FOLIAR TREATMENTS APPLIED IN POPPY EXPERIMENT (TE-2) 14
TABLE 3. SOIL ANALYSIS RESULTS OF TOPSOIL (200 MM) OF SWEET CORN EXPERIMENT (TE-05) 19
TABLE 4. SOME CHARACTERISTICS OF SOIL (0-200 MM) USED FOR THE BROCCOLI EXPERIMENT 20
TABLE 5. THE RATE AND SOURCES OF ZN FERTILISERS 20
TABLE 6. SOIL ANALYSIS OF FVRS GREEN BEANS SITES BEFORE PLANTING 24
TABLE 7. RATES AND SOURCES OF FOLIAR FERTILISER USED IN THE TE18 AND TE19 EXPERIMENTS 24
TABLE 8. SOIL ANALYSIS RESULTS OF SASSAFRAS SITE USED FOR GREEN PEAS FOLIAR EXPERIMENT 26
TABLE 9. EXPERIMENT SITES AND TYPES 28
TABLE 10. SOIL CHEMICAL CHARACTERISTICS OF THE SITES USED FOR POTATO TRIALS 30
TABLE 11. TIMETABLE OF OPERATIONS 31
TABLE 12. DETAILS OF LIGNATE TREATMENTS (RATES IN G/HA) 31
TABLE 13. PETIOLE NUTRIENT CONCENTRATIONS AT FIRST SAMPLING 31
TABLE 14. EFFECT OF FOLIAR TRACE ELEMENT APPLICATION ON YIELD AND TISSUE COMPOSITION OF POTATO
FROM T E - 2 0 EXPERIMENT AT EPPING FOREST 3 2
TABLE 15. THE YIELD AND TISSUE COMPOSITION RESULTS FROM TE-21 AT GAWLER 34
TABLE 16. SOME RESULTS FROM TE-22 AT LOWER BARRINGTON 34
TABLE 17. SOME RESULTS FROM TE-23 AT SASSAFRAS 34
TABLE 18. SOME RESULTS FROM TE-24 AT KINDRED 35
TABLE 19. SOME RESULTS FROM TE-25 AT WESLEY VALE 35
TABLE 20. SOME RESULTS FROM TE-28 AT PALOONA 36
TABLE 21. NUTRIENT CONCENTRATIONS IN PETIOLES FROM COMMERCIAL CROPS 36
TABLE 22. SOIL ANALYSIS RESULTS (0-200 MM DEPTH) FROM CAULIFLOWER EXPERIMENT AT KINDRED 39
TABLE 23. BASAL AND FOLIAR TREATMENTS A 40
TABLE 24. MARKETABLE YIELD OF CAULIFLOWER (T/HA) AS INFLUENCED BY SOIL AND/OR FOLIAR APPLIED TRACE
ELEMENT FERTILISERS (LSD BASAL =4 .24 , FOLIAR=2.01) 4 1
TABLE 25. COMPOSITION OF YOUNGEST FULLY EXPANDED LEAVES (INCLUDING PETIOLES) OF CAULIFLOWER CV.
PLANA AT BUTTONING STAGEA 41
TABLE 26. TOPSOIL (0-150 MM) TEST RESULTS FROM CARROT EXPERIMENTS AT KINDRED AND WESLEY VALE
ANALYSED BY D P I W E AND THRIVE-AG LABORATORIES 4 3
TABLE 27. THE COMPOSITION AND AMOUNTS OF FERTILISERS USED IN THE CARROT EXPERIMENT 44
TABLE 28. THE COMPOSITION OF LIGNATE FERTILISERS A USED AT KINDRED CARROTS EXPERIMENT 44
TABLE 29. TOPSOIL (0-200 MM) ANALYSIS RESULTS OF SITE USED FOR BROCCOLI EXPERIMENTA 47
TABLE 30. SOIL ANALYSIS RESULTS FROM SWEET CORN EXPERIMENT AT MERSEYLEA (TE-5)A 49
TABLE31. THE COMPOSITION AND AMOUNTS OF FERTILISERS USED IN THE SWEET CORN EXPERIMENT 49
TABLE32. SOME SITE CHARACTERISTICS 53
TABLE33. BASAL TREATMENTS 5 3
TABLE 34. TIMETABLE OF OPERATIONS 54
TABLE 35. RATES OF FOLIAR APPLIED TRACE ELEMENTS IN G/HA 54
TABLE 36. SOME RESULTS FROM WINTON (TE9) 55
TABLE 37. SOME RESULTS FROM LANGTON (TE8) 56
Dr Ali Salardini and Dr Leigh Sparrow (2001). Final Report of the Trace Elements Project PT 320 to Horticulture Australia Limited. Page v

TABLE 38. SOME RESULTS FROM MORRIS (TE-7) 57
TABLE 39. SUMMARY OF PREVIOUS WORK ON TRACE ELEMENTS IN POTATOES 58
TABLE 40 EFFECT OF SPRAYING ON SPECIFIC GRAVITY AT MORRIS 59
TABLE 41. EFFECT OF SPRAYING ON BRUISING AT LANGTON 59
TABLE 42. EFFECT OF SPRAYING ON HOLLOW HEART AT WINTON 59
TABLE 43. PETIOLE MICRONUTRIENT CONCENTRATIONS (MG/KG) F O R N E TASMANIAN RUSSET BURBANK CROPS IN
1993/4 60
TABLE 44. PETIOLE MICRONUTRIENT CONCENTRATIONS (MG/KG) FOR 35 NW TASMANIAN RUSSET BURBANK
CROPS IN 1993/4 60
TABLE 45. SUMMARY OF THE YIELD AND QUALITY RESPONSES TO FOLIAR APPLICATION OF TRACE ELEMENTS B, ZN,
CU, MO AND MN AND THE VALUE OF SOIL OR PLANT ANALYSIS IN PREDICTING CROP RESPONSE TO FOLIAR
APPLICATION OF TRACE ELEMENTS 64
TABLE 46. SUMMARY OF THE YIELD AND QUALITY RESPONSES TO BASAL APPLICATION OF TRACE ELEMENTS B, ZN,
CU, M O AND M N AND THE VALUE OF SOIL OR PLANT ANALYSIS IN PREDICTING CROP RESPONSE TO BASAL
APPLICATION OF TRACE ELEMENTS 6 5
TABLE 47. INTERPRETATION OF SOIL D T P A - Z N TEST FOR VEGETABLE CROPS IN NORTH WESTERN TASMANIA AND
SIMILAR REGIONS 6 7
TABLE 48. INTERPRETATION OF SOIL HWSB TEST FOR VEGETABLE CROPS IN NORTH WESTERN TASMANIA AND
SIMILAR REGIONS 6 7
TABLE 49. INTERPRETATION OF SOIL D T P A - C U TEST FOR VEGETABLE CROPS IN NORTH WESTERN TASMANIA AND
SIMILAR REGIONS 6 8
TABLE IC. CONCENTRATION OF IMPORTANT ELEMENTS IN SOME FIELD AND HORTICULTURAL CROPS (MG/KG DRY
MATTER)L 92
TABLE 2C. THE MOST WIDELY USED EXTRACTANTS FOR ASSESSMENT OF SOIL MICRONUTRIENT STATUSA 94
TABLE 3C. INFORMATION ON THE WIDELY ADOPTED UNIVERSAL EXTRACTANTS IN THE U.S.A. COMPILED MAINLY
FROM PECK (1990), JONES (1990) AND SIMS (1989) 95
TABLE ID. BORON DEMAND OF CROPS AND THE CONCENTRATION OF B IN THEIR DRIED LEAF (MG/KG) 99
TABLE 2D. SINGLE AND MIXED B FERTILISERS MARKETED IN TASMANIA 101
TABLE 3D. THE RATES OF COMMON B FERTILISERS APPLIED TO VEGETABLES 102
Dr AH Salardini and Dr Leigh Sparrow (2001). Final Report of the Trace Elements Project PT 320 to Horticulture Australia Limited. Page vi

Final Report of Project Number PT320 to Horticulture Australia Limited
The Trace Element Requirements of Vegetables and Poppies in Tasmania
Dr Ali Salardini and Dr Leigh Sparrow, Tasmanian Institute of Agricultural Research, University of Tasmania
i Technical Summary
Before 1950s, the deficiency of trace elements, Zn, B, Mo, and Cu had frequently been
reported from vegetable growing regions of Tasmania. In contrast, in the recent years,
the incidence of these deficiencies has been sporadic. Tasmanian growers are often
presented with conflicting advice on trace element requirements and are encouraged to
use the forms and formulations of trace elements, the benefits of which have not been
adequately demonstrated.
Objectives
This project aimed to develop better trace element fertiliser through the following
topical investigations:
1. To determine the need for trace element use on vegetables and poppies.
2. To compare the efficiency of foliar and soil applied trace elements in mineral,
chelated or lignated forms.
3. To examine the usefulness of soil and plant analysis as a diagnostic technique
for predicting the trace element requirements of vegetables and field poppies.
4. To provide vegetable and poppy growers with accurate trace element fertiliser
recommendations based on soil and plant analysis.
Methodology. During the three years life of the study, we completed 12 foliar and 7
soil applied trace element experiments on the main processing vegetable crops- potatoes
(10 sites), cauliflower, broccoli, green peas, green beans, carrots, sweet corn and field
poppies. The sites with the lowest content of one or more of the Zn, Cu, B, Mo and Mn
were selected after consulting more than 1000 commercial soil analytical results and
repeating the sampling and analysis of 60 with the lowest trace element concentrations.
Two or all of the commonly used sources of trace element fertilisers, mineral, chelate
and lignate were compared in most experiments. We applied trace elements as foliar
sprays, in bands together with NPK fertiliser and in preplant broadcasting or
Dr Ali Salardini and Dr Leigh Sparrow (2001). Final Report of the Trace Elements Project PT 320 to Horticulture Australia Limited. Page 1

combination of these methods. Total and marketable yields, industry quality criteria and
soil and plant tissue composition were determined and discussed in all experiments.
Yield response. Because of routine application of trace elements in the past two or
three decades, most long-established vegetable farms are sufficiently supplied with trace
elements. Although we selected sites with the lowest trace element content that we
could find, in 171 combinations of treatments resulted from variations in crops, method
and rates of application and trace elements, only 9 positive or negative yield or quality
responses were observed.
Soil analysis. This study showed that, when the interpretation criteria presented in the
recent Australian "Soil Analysis- an Interpretation Manual" (Peverill et al. 1999.) were
used, soil analysis gave reasonable predictions of soil trace element status. The
predictions were more accurate where crop species and soil type were taken into
account. We tabulated the interpretation guides for soil Zn, Cu and B status that could
be used more appropriately on vegetable crops in northern Tasmania. We strongly
believe that the critical soil trace element concentrations employed by the local fertiliser
advisers are many folds greater than the correct values.
Plant analysis. In nearly all experiments, plant analysis results when interpreted using
the guidelines reported in the "Plant analysis-an Interpretation Manual (Reuter and
Robinson 1997), correctly predicted the response of crop to trace elements. We did not
attempt to tabulate the critical concentration of trace element in plant tissues, because
these concentrations may vary with the plant species, cultivars and parts, stage of
growth and the interaction of other nutrients. We recommend that the plant analysis
manual to be consulted for plant analysis interpretation.
Source and methods of application. All sources, when applied as foliar spray, were
readily absorbed and translocated to other tissues, such as seeds in poppies. When these
were applied to soil, the change in tissue concentration was not as pronounced as in the
case of foliar use. Band placed method, even at lower rate was more effective than
broadcast application. The efficiency of sources applied at similar rates were in order of
Chelate<Lignate<Mineral. At commercially recommended rates, they were similarly
effective and costing the same.
Dr Ali Salardini and Dr Leigh Sparrow (2001). Final Report of the Trace Elements Project PT 320 to Horticulture Australia Limited. Page 2

Trace element recommendation. We believe that the need for trace elements
application to vegetables in Tasmania is grossly over-estimated by most local and
visiting farm consultants.
Although it is correct that certain crops require more of some trace elements, we do not
believe that trace elements routinely be applied to these crops unless soil analysis
identified a need. This suggestion prevents the probable imbalance of these nutrients in
soil, which may cause toxicity of one or deficiency of other trace elements.
In Tasmania, vegetable crops are receiving foliar sprays of trace elements only as
insurance, and not to correct known deficiencies. Much of visual improvements are due
to the effects of major elements mainly N in the commercial mixes. Although the
reduction of yield or damage to soil health is not expected by the use of most
commercial foliar products, they are more likely to be costly and useless under our
conditions, unless are used to correct a known deficiency.
Technology transfer. The outcomes of the study were presented to vegetable, poppy
and associated industries such as fertiliser companies, agricultural consultants,
analytical laboratories, seed and seedling companies. The outcomes were decimated in
six technical seminars, six field days, a number of extension talks to farmers and two
popular publications. We recommend establishing a new series of activities to extend
the outcomes of the project further.
2 Media Summary
A Horticulture Australia funded project was conducted in 1993-96 by the Tasmanian
Institute of Agricultural Research and Department of Primary Industry, Water and
Energy, Tasmania to develop better trace element fertiliser use strategies for vegetable
crops and field poppies in Tasmania. We acknowledge the financial support of
Tasmanian Farmers and Grazier Association, Simplot, McCain, Tasmanian Alkaloids,
Glaxo Welcome, Pivot Agriculture, Impact Fertilizers and Serve-Ag.
In 19 experiments on potatoes (10 sites), cauliflower, broccoli, green peas, green beans,
carrots, sweet corn and field we studied the use of different forms of Zn, Cu, B and Mo
fertilisers.
Dr Ali Salardini and Dr Leigh Sparrow (2001). Final Report of the Trace Elements Project PT 320 to Horticulture Australia Limited. Page 3

Because of routine application of trace elements in the past two or three decades, most
long-established vegetable farms were sufficiently supplied with trace elements.
Although we selected sites with the lowest trace element content only in three
experiments, we found a yield or quality responses to trace element fertilisers. All forms
of trace element fertilisers (mineral or complex), at commercially recommended rates,
were similar in being taken up by vegetables and were costing the same. We believe
that the need for trace elements application to vegetables in Tasmania is grossly over
estimated by most local and visiting farm consultants.
Soil analysis gave accurate predictions of soil trace element needs, when the recent
Australian publication "Soil Analysis- an Interpretation Manual" (Peverill et al. 1999.)
was used for the interpretation. The predictions were more accurate where crop species
and soil type were taken into account. We tabulated the interpretation guides for soil Zn,
Cu and B status that could be used more appropriately on vegetable crops in northern
Tasmania.
Plant analysis also correctly predicted the response of crop to trace elements when the
guidelines reported in the "Plant analysis-an Interpretation Manual (Reuter and
Robinson 1997) were used.
The outcomes of the study were presented to vegetable and poppy growers and fertiliser
suppliers, agricultural consultants, analytical laboratories, seed and seedling companies
in technical seminars, field days, farmers groups and popular publications
We recommend that trace elements should not be routinely or as an insurance policy
applied to vegetable crops, unless a trace element deficiency is identified by soil and
plant analysis. This will prevent the loss of resources and occurrence of probable
imbalance of these nutrients in soil, which may cause toxicity of one or deficiency of
other trace elements.
To achieve a full use of the outcomes of the project, we recommend conducting a new
series of extension activities in the form of workshops, field days, discussion groups for
farmers and farm advisers and popular publications. Additionally, the information may
be prepared as pocket size manuals and Internet files to be added to the relevant sites.
Dr Ali Salardini and Dr Leigh Sparrow (2001). Final Report of the Trace Elements Project PT 320 to Horticulture Australia Limited. Page 4

Publication schedule
The outcomes of the study have already been presented to vegetable, poppy and
associated industries such as fertiliser companies, agricultural consultants, analytical
laboratories, seed and seedling companies. The outcomes were decimated in six
technical seminars, six field days, a number of extension talks to farmers and two
popular publications.
As more scientific publications and extension activities are required to extend the
outcomes of the project further, we recommend establishing a new projct to fufill these
objectives..
Dr AH Salardini and Dr Leigh Sparrow (2001). Final Report of the Trace Elements Project PT 320 to Horticulture Australia Limited. Page 5

Final Report of Project Number PT320
The Trace Element Requirements of Vegetables and Poppies in Tasmania
Dr Ali Salardini and Dr Leigh Sparrow
Tasmanian Institute of Agricultural Research, University of Tasmania
4 Project overview - objectives and information common
to all studies
4.1 Introduction
Plants synthesise their food from simple substances taken out of their environment, the
air and the soil. They need several nutrient elements in sufficient amounts and in proper
balance to build their body tissues and to synthesise a group of enzymes for the
functioning of their tissues. At least 20 nutrient elements are known to be essential for
the normal functioning of green plants. These elements are divided into two arbitrary
groups: the major elements and trace elements. Those vital elements that are required
only in very small quantities by plants have been identified as microelements,
micronutrients or trace elements. For higher plants, copper (Cu), manganese (Mn), iron
(Fe), zinc (Zn), boron (B), molybdenum (Mo), and chlorine (CI) are generally
recognised as essential trace elements and cobalt (Co) essential only for leguminous and
some other crops. The total weight of trace elements removed by an average vegetable
crop is less than 2 kg/ha, nearly 150 fold less than that for the major elements.
Some soils contain low levels of certain trace elements because of the nature of their
parent materials and/or climatic factors particularly rainfall (leaching) and temperature
(Cox and Kamprath, 1972). Most ferrosols, the major soil used in vegetable production
in Tasmania, especially the high rainfall zones, are naturally low in B, Mo, Zn and Cu
(Srivastava and Gupta 1996).
A sub-optimal or excess supply of trace elements adversely affects yield and quality of
crops. An accurate and early diagnosis of trace element problems is very important to
adopt timely corrective measures. Most acute deficiencies or toxicities of trace elements
are manifested by some morphological and visual symptoms on plants that can be used
for diagnosis of the problem. However, more reliable diagnostic methods, involving soil
Dr Ali Salardini and Dr Leigh Sparrow (2001). Final Report of the Trace Elements Project PT 320 to Horticulture Australia Limited. Page 6

and/or plant analyses are used universally to identify the soil and plant trace element
status.
The diagnosis of soil trace element disorders is based on the use of suitable extractants
that could dissolve a quantity of trace elements closely correlated to plant uptake. For a
test to be acceptable for prediction of soil trace element status and to be used for
recommendation of fertiliser, it must be calibrated with the yield and/or quality of crops.
The more common extractants used for soil trace element diagnosis have been
calibrated for many crops and the critical concentrations are reported in literature for
different soil types and for the crops.
Most boron soil tests are the modifications of the hot water extraction method of Berger
and Truog (1939) of which hot 0.01M CaCl2 of Aitken et al. (1987) is routinely used in
Australia. The more common test for the metallic trace elements is based on the use of
extractants containing a chelating agent. In Australia, the DTP A test of Lindsay and
Norvell (1978) which employs diethylenetriaminepentaacetic acid (DTPA) is well
accepted. Some laboratories however use the ammonium bicarbonate/EDTA procedure
of Trierweiler and Lindsay (1969) with modifications suggested by Best et al. (1985).
4.2 The problem
The deficiency of four trace elements, B, Mo, Zn and Cu had frequently been reported
on crops including vegetable crops before 1950s. Deficiencies of Mo have been
reported in the sandy soils of Cressy (Fricke 1944) in ferrosols of north western (Fricke
1945) and other regions of Tasmania (Paton 1956). Boron and Mo deficiency in
Brassica forage crops (Lamp 1964), Mo deficiency in green peas (Wade 1952) and Zn
deficiency in beans had frequently been reported. Laughlin (1980) studied B deficiency
in poppies and showed a yield response to B application.
In contrast, in recent years, the incidence of trace element deficiencies has been
sporadic and mostly limited to the deficiency of B or Mo in Brassica crops. The scarcity
of trace element deficiency may have been the result of a common practice that fertiliser
containing trace elements has been frequently used in vegetable production as an
insurance against probable deficiencies. The routine soil test for the recommendation of
fertiliser in vegetable growing areas of Tasmania does not normally include trace
element assessments. Even when soil trace element tests are conducted, the critical trace
Dr Ali Salardini and Dr Leigh Sparrow (2001). Final Report of the Trace Elements Project PT 320 to Horticulture Australia Limited. Page 7

element concentration, below which the application of trace elements is recommended,
are set to the levels higher than those reported in the literature in other countries.
The infrequent soil trace element tests and elevated critical concentrations have
encouraged vegetable growers to apply trace elements routinely at least once during 3-5
year rotations, which normally include onions, potatoes and Brassica crops. This has
enhanced the development and promotion of various commercial forms of micronutrient
fertilisers widely recommended to farmers.
Since metallic trace elements are less mobile they are accumulated in the topsoil, while
B and Mo may not remain in the root zone even after only a year of their application.
With the application of large amounts of Zn and Cu to the vegetable soils in the past
two to three decades it is possible that the deficiency of these elements is less likely.
However, the status of soil B and Mo may not be clearly anticipated.
4.3 Objectives
Although in excess of $1,000,000 is annually spent on trace element fertilisers for
vegetable crops in Tasmania (estimated from the sale values of major fertiliser
suppliers), there has been no firm evidence that this expenditure was justified or
conversely that higher inputs of trace elements were needed. Tasmania growers and
probably growers in other states, are often presented with conflicting advice on trace
element requirements and are encouraged to use forms and formulations of trace
elements, the benefits of which have not been adequately demonstrated. This project
seeks to develop better trace element fertiliser strategies to maximise production and
provide vegetable growers with accurate recommendations through the following
topical investigations:
1. To determine the need for Zn, Cu, B, Mo and Mn in potatoes, Brassica crops, carrots,
peas, beans and field poppies.
5. To compare the efficiency of foliar and soil applied trace elements in mineral, chelated
or lignated forms.
6. To examine the usefulness of plant analysis as a diagnostic technique for predicting the
trace element requirements of vegetables and field poppies.
7. To provide vegetable and poppy growers with accurate trace element fertiliser
recommendations based on soil and plant analysis.
Dr Ali Salardini and Dr Leigh Sparrow (2001). Final Report of the Trace Elements Project PT 320 to Horticulture Australia Limited. Page 8

4.4 Materials and Methods
4.4.1 Soils and crops
In 20 experiments on 8 crops on soils of northern Tasmania, the effects of soil, foliar or
both soil and foliar application of one or a range of trace elements B, Cu, Mn, Mo and
Zn supplied from different sources were studied. The soil types were predominantly
ferrosol, but some vertosol and sandy demosols were also included. The crops
investigated were potatoes, carrots, green beans, green peas, field poppies, cauliflower,
Brussels sprouts, and broccoli.
4.4.2 Site Selection
As there had been no report of visual symptoms of trace element deficiency, the only
possibility of finding sites with suitable available trace element content for our
experiments was by random soil analysis of the paddocks. This procedure was very
costly and did not guarantee reaching the suitable sites. With the help of the Tasmanian
Farmers and Graziers Association (TFGA) and the commercial soil and plant analysis
service providers, many vegetable growers authorised us to access the results of their
soil and plant analyses. Only a small proportion of soils analysed for fertiliser
recommendation included trace element tests. Most of soils from the vegetable growing
region of northern Tasmania were shown relatively high in most trace elements.
Probably this was the result of application of trace elements following the return of
previous soil results. Using the United States and European soil critical trace element
concentrations to identify trace element deficient soils, we found only 60 paddock
amongst those 1000 analysed to be deficient in any of trace elements. The soils from
these sites were re-analysed by the DPIWE Analytical Laboratories, using the
Australian standard methods (Rayment and Higginson 1992) However, some local
consultants were using much elevated critical concentrations that would have grouped
many of those soils to be deficient in trace elements. To determine whether there was
any needs for trace element use under those conditions, we conducted our experiments
in the paddocks with the lowest soil test value for one or more of the trace elements that
we could find. Those paddocks, however, would have been identified as deficient by the
consultants and would have received trace element recommendations.
Dr Ali Salardini and Dr Leigh Sparrow (2001). Final Report of the Trace Elements Project PT 320 to Horticulture Australia Limited. Page 9

4.4.3 Methods, source and rate of application of trace elements
Trace element and other fertilisers were applied using three soil and one foliar
application method. Soil application methods included incorporation, band-placement
and top-dressed. In the incorporation method, before planting, solid fertilisers were
broadcast and liquid fertilisers were sprayed on the soil surface before they were
incorporated into the top 10-15 cm soil, using a disk plough or rotary hoe. In band
placing, at the time of planting, trace element and major fertilisers were mixed together
and placed in two bands 10-15 cm deep and 5 cm to each side of plant rows. Top-
dressing was performed after crop establishment and usually at mid-growth stage. In
top-dressing, solid trace element fertilisers were broadcast onto the plots immediately
before irrigation being applied. In the foliar method, solid and liquid trace element
fertilisers were dissolved or diluted with water and a surfactant or wetting agent was
added before they were brought to an equivalent volume of 250-400 L/ha and sprayed
on the crop using a standard knapsack spray unit.
The rate of applied fertilisers varied with the elements and method of application.
However, when the effect of rate of any propriety fertiliser was studied a rate close to
the producer recommended rates was included in the treatments. In the case of generic
material, the rates applied contained one or two rates conventionally used.
Metallic trace elements Zn, Cu and Mn were applied from three sources: mineral,
chelates and lignosulfonate. Boron and Mo were used as either mineral or
lignosulfonate. We did not examine the chemical nature of any of the sources and
assumed that they were in the forms, as the labels would indicate. The specifications of
some of the fertilisers used in the experiments are shown in Table 1.
4.4.4 Nature of treatments
In many experiments, the need for each trace element was studied especially when
foliar applications were tested. In those experiments the crop receiving a balanced
mixture composed of all trace elements (Complete or Full) was compared with those
receiving no trace element {Control) and those on mixtures from which one of the
various micronutrients were deleted (Deficient). Since some propriety foliar blends
employed contained nitrogen to enhance the uptake of trace elements, the effect of
addition and deletion of N was also tested. In another series of experiments, the effects
of source and rate of trace element application were studied. In those experiments,
Dr Ali Salardini and Dr Leigh Sparrow (2001). Final Report of the Trace Elements Project PT 320 to Horticulture Australia Limited. Page 10

usually only one trace element was investigated. When application methods were
compared, at an appropriate stage of growth the plots, which had or had not received the
basal trace elements at planting, were split and foliar treatment was applied to the
subplot, so that basal, foliar and combined treatments could be compared.
Table 1. Sources of trace element fertilisers used in experiments
Form Composition Element
(%)
Trade name
Supplier Elemental rate Form Composition Element
(%)
Trade name
Supplier Foliar Basal
Form Composition Element
(%)
Trade name
Supplier
(g/ha) (kg/ha)
B lignate Lignosulfonate 0.75 B B lignate Thrive-Ag 100-500 0.1-0.5 Borax 11.3B Borax Borax Cons - 1-4 Solubor 20.5 B Solubor Borax Cons 500-1000 1-2 Mo lignate Lignosulfonate 13 Mo Mo lignate Thrive-Ag 35-100 0.01-0.05 Molybdate Na2Mo04.2 H20 39 Mo Generic - 50-100 0.1-0.4 Cu lignate Lignosulfonate 5.5 Cu Cu lignate Thrive-Ag 75-150 0.5-1 Cu chelate Cu-EDTA 6Cu Supa Copper Agrichem 0.1-0.2 1-2 Cu sulfate CuS04 6.7 Cu Coppersol Pivot 300-500 1-2 Cu sulfate CuS04.H20 22.4 Cu Generic - 100-250 5-10 Mn chelate Mn-EDTA 9Mn Supa
Manganese Agrichem 250-500 500-1000
Zn sulfate ZnS04. 7H20 6.25 Zincsol, L Pivot 0.5-1 1-2 Zn chelate Zn-EDTA 6.25 Supa Zinc, L Agrichem 0.1-0.5 0.5-2 Zn lignate Lignosulfonate 6.8 Zn Zn lignate Thrive-Ag 0.01-0.05 0.1-0.5 Trace B, Zn, Cu and 0.7 B, Generic - 5-10 kg supplement Mo 0.6 Zn,
0.57 Cu 0.02 Mo
of mixture/ ha
Complete NPK + Trace 9-4-6 + Top Foliar Pivot - -liquid trace
4.4.5 Soil and plant analysis
Before any experiments were established, soil cores of 0-150 and 150-300 mm were
taken from the experimental site and bulked to give one composite sample for each
depth. Samples were analysed by the commercial DPIWE Laboratories, following the
Australian Laboratory Handbook of Soil and Water Chemical Methods (Rayment and
Higginson, 1992). Electrical conductivity and pH (pHw) in a 1:5 soil/water suspension;
bicarbonate extractable P and K (Colwell et ah, 1963), using 1 part soil in 100 parts 0.5
M sodium bicarbonate solution at pH 8.5. The elements Mn, Cu, Zn, Mg and Ca were
extracted with DTPA (diethylenetriaminepentaacetic acid) at a soilrsolution ratio of 1:2
at pH 7.3. Boron was extracted by hot water or hot CaCb and results were reported as
hot water soluble B (HWSB). However, some samples were also tested by other
commercial laboratories such as Thrive-Ag Consultants Ltd. (Yarraville Victoria), Pivot
Ltd. or Incitec Ltd.
Dr Ali Salardini and Dr Leigh Sparrow (2001). Final Report of the Trace Elements Project PT 320 to Horticulture Australia Limited. Page 11

For plant tissue sampling, our selection of time of sampling and the tissue sampled was
generally guided by the Plant Analysis Manual (Reuter and Robinson 1986) with some
modification as needed. In most experiments, the petioles of the youngest fully
expanded leaves (PYFEL) were sampled. However for broccoli in two experiments
whole leaf (WYFEL) was sampled. In tissue sampling after foliar application, at least
two weeks period was allowed, to provide sufficient time after foliar or top-dressed
treatments, for the new leaves to emerge and become fully expanded. In some
experiments, before foliar treatment, tissue samples were also taken from each plot or
the site.
Plant tissue samples were dried at 70 °C, ground and sub-samples were digested in a
HNO3 - HCIO4 mixture and analysed for a range of nutrients. Either a graphite furnace
atomic absorption spectrophotometer (AAS) or an inductively coupled plasma emission
spectrophotometer (ICP) used to determine the concentrations of nutrients in the both
soil extracts and the plant digests.
4.4.6 Criteria determined
The criteria determined varied with the crop. For potato the total and processing yields
of tubers, the distribution of tubers into size grades of <100, 100-280, 280-450, > 450g
and misshapen were determined. Subsamples from the 280-450 g grade were taken for
quality assessment, which consisted of determination of specific gravity (SG), bruising
index and crisp colour.
The criteria determined for carrots were total and marketable yields, size distribution of
roots into size grades of >40, 40-120, 120-240, >240 g and misshapen. Subsamples of
the marketable roots were tested for quality assessment such as cracking intensity,
hollow root and discoloration.
For sweet corn the total and marketable primary and secondary cob yield and the cob
quality criteria such as weight, diameter, length, cob: husk ratio, tip-fill, colour and seed
row pattern were recorded.
The criteria determined on broccoli were total and marketable yields, head weight and
the head quality factors including colour, hollow stem, starring (yellow open flower),
browning, compactness and leaves in the head.
Dr Ali Salardini and Dr Leigh Sparrow (2001). Final Report of the Trace Elements Project PT 320 to Horticulture Australia Limited. Page 12

For cauliflower the total and marketable yields, curd (head) weight and curd quality
criteria: shape, evenness, colour, firmness, riciness (powdery appearance), hollow stem
and presence of bract (small leaves) were recorded.
For green peas and green beans the total and marketable pod yield, pod: straw ratio, and
seed maturity index (MI) were recorded.
5 Details of Foliar trace element experiments
Some growers in the vegetable growing area of northern Tasmania use foliar fertilisers
containing trace elements or a combination of both major and trace elements, hoping to
improve the yield and/or quality of different vegetable and other crops. This practice is
supported by the positive responses observed in other states on different soil types,
many of which are very poor in fertility (Robson and Gilkes 1980) Although some
colour or vigour improvements had been shown in demonstrational experiments by
some of the suppliers, there was no evidence available to conclude that any significant
yield or quality improvement had been achieved. Our objective in the following
investigations was to identify the usefulness of application of a series of foliar trace
element fertilisers for vegetable and poppy crops under our soil and climatic conditions.
5.1 Poppy experiment (Zn, Cu, B, Mo)
5.1.1 Methods
This foliar experiment (TE-2) was established within a commercial poppy crop at
Forthside Vegetable Research Station (FVRS) 5 km west of Devonport (41 ° 12' S, 146°
22'E) into a deep clay loam ferrosol. The paddock had received 5 t/ha dolomite (26% Ca
and 8.5% Mg) and 375 kg/ha a commercial grade fertiliser 14-16-11 (N-P-K) prior to
sowing of poppy in August 1993. Soil and plant samples were taken in late November,
immediately before application of foliar treatments, when plants were at hook stage.
Poppy crop usually receives top-dressing and foliar fertilisers at this stage of growth.
The soil analysis results for 0-200 mm depth were pH H20, 6.1, Colwell P and K, 78 and
150 mg/kg, DTPA extractable trace elements (in mg/kg) Fe 42, Zn 1.05, Cu, 2.43, and
Mn 68.5.
Dr Ali Salardini and Dr Leigh Sparrow (2001). Final Report of the Trace Elements Project PT 320 to Horticulture Australia Limited. Page 13

Foliar treatments consisted of applications of 8 different fertiliser solutions (Table 2) at
rate recommended by the supplier at hook stage and capsule formation on 24 November
1993 and 1 January 1994 respectively.
Table 2. Foliar treatments applied in poppy experiment (TE-2)
Treatment Description No Name or code
Description
1 2
Control Full traces with urea [FT]
No foliar fertiliser applications 12.5 L Lignate-Trace Elements and 1 kg/ha urea providing (in g/ha) 225 Cu, 375 Zn, 37.5 Mo, 8.78 B and 460 N
3 Urea [U] Urea alone 4 5 6 7 8
[FT} - Zn [FT] - Cu [FT] - B [FT] - Mo [FT] -Urea
As 2, but without Zn As 2, but without Cu As 2, but without B As 2, but without Mo As 2, but without Urea
Whole leaf (YFEL) samples were taken on 1 January immediately before the second
foliar spray was applied. Samples were washed with deionised water, dried, ground and
analysed for both major and trace elements. The crop was harvested on 7 February 1994
and capsule and seed yields were recorded. All capsules were picked from 2 m of each
plot, dried at 60 °C and the weight was recorded (total). The capsules were then
crushed, seeds and the remaining dried materials (straw) were separated and weighed.
Samples of seed were also taken and analysed for trace element content.
5.1.2 Results
The yield of straw and seed was not affected by application of urea alone or together
with trace elements. When urea, Zn, or Mo was omitted from the spray solution, the
yields of both capsule and seed were significantly lower (P=0.03). When copper was
left out of the solution there was no changes in yield (Figure 1). This indicated that Cu
might have been the cause of lower yield in other treatments, and addition of urea, Zn
and especially Mo had reduced the damage caused by copper.
There is no published information on the levels of soil and plant concentration of trace
elements relating to poppy YFEL that can be used for diagnostic purposes. The
concentrations of Cu and Zn in YFEL at hook stage, prior to foliar treatment were 8 and
27 mg/kg respectively, and are considered marginal.
Dr Ali Salardini and Dr Leigh Sparrow (2001). Final Report of the Trace Elements Project PT 320 to Horticulture Australia Limited. Page 14

Isd caps 5 j
A
ules=0.47 DSeed • Straw
a a a a
iH'ljJli (A a CO
0 1 1—,—I 1—,—I 1—,—L—I—,—I 1—,—I 1—,—I 1—,—I 1—, No Foliar Urea FT+Urea FT-Urea FT-Zn FT-B FT-Cu FT-Mo
Foliar treatment
Figure 1. Yield of seed (grey segment), straw (black segment) and capsule the sum of them (column) of poppy as influenced by foliar lignate trace element applications. The columns with the same letter are not significantly different by Duncan Multiple range Test (p<0.05)
120
100
* 80 O)
E. c % 60 ro *-• C 0) u g 40
20
D C u MZn
J No Foliar Urea FT+Urea FT-Urea FT-Zn FT-B
Foliar treatments
FT-Cu FT-Mo
Figure 2. Effect of foliar application of different trace element treatments on Cu and Zn concentrations in the YFEL of poppy plants at hook stage, 37 days after the foliar application of trace elements
Dr AH Salardini and Dr Leigh Sparrow (2001). Final Report of the Trace Elements Project PT 320 to Horticulture Australia Limited. Page 15

Figure 3. Concentration of B and Mo in whole YFEL 37 days after the foliar application of trace elements
The results of YFEL analysis (Figure 2) showed that when either B, Mo or especially
Zn was not present in the Cu containing foliar solution, the concentration of Cu
increased by 3-10 fold the normal concentrations (P=<0.001), which may have been a
cause of yield reduction. Absence of Zn caused the Cu concentration to rise more
significantly.
Boron and Mo also showed an interaction (Figure 3). In the absence of Mo, the
concentration of B increased (PO.001), but unlike the Zn-Cu interaction, the absence
of B reduced the concentration of Mo in YFEL.
The results of seed analysis showed that foliar nutrients have been transported to the
seed, and there was significant increase (PO.001) in the concentration of Zn, Cu and
Mo when these elements were present in the foliar fertiliser mix. The Zn-Cu interaction,
similar to that in the YFEL tissues, was also observed for the seed concentrations of
these elements. In the presence of Cu and with application of Zn, the concentration of
Zn remained at 48±2 mg/kg seed dry matter, but when Cu was not present application
of Zn increased Zn concentration in the seed to 54 mg/kg.
Dr Ali Salardini and Dr Leigh Sparrow (2001). Final Report of the Trace Elements Project PT 320 to Horticulture Australia Limited. Page 16

5.1.3 Conclusions to the poppy foliar study
The application of foliar trace elements increased the uptake of these nutrients into
YFEL tissue and the seed when applied at hook stage. This indicated that trace elements
applied to the foliage of poppy could be readily absorbed and translocated within the
plant and influence the composition of seed. Had plant been deficient in any of trace
elements, their application could have resulted in a plants growth improvement.
The remedial effect of urea in this experiment could not be attributed to its effect on
plant trace element composition, since it did not change the concentration of any of the
elements studied (Figures 2 and 3). Incidence of Cu toxicity because of the use of only
100 g Cu/ha, shows the hazard of unnecessary use of foliar trace element fertilisers. In
addition, the corrective effect of Zn on excess Cu may indicate that application of Zn
may be able to be used to reduce the toxic effect of Cu, where soils are high in Cu. The
soil DTPA extractable Zn results (DTPA-Zn=lmg/kg), based on the scale commonly
used in the USA predicted no response to Zn application for other crops, while locally a
soil DTPA-Zn of <2 mg/kg is considered to be deficient and Zn fertiliser is
recommended. The result of this experiment confirms that, at least for the poppies, the
critical Zn concentration used in Tasmania is too high.
5.2 Sweet corn
5.2.1 Methods
This foliar experiment (TE-5) was established within a commercial sweet corn crop at
Forthside Vegetable Research Station (see 2.1 for station information). The paddock
had received a full range of trace elements prior to an onion crop two years earlier, and
500 kg/ha of a commercial grade fertiliser 14-16-11 (N-P-K) band-placed at planting of
this experiment, on 20 November 1993. Sweet corn hybrid Terrific was sown on 20
November 1993 and harvested on 8 March 1994. The number and fresh weight of
marketable and unmarketable primary and secondary cobs, weight of husk and the
quality of cob including husk length, cob length, cob diameter, tip fill, cob colour, and
seed rowing grades were recorded. Soil samples were taken before planting. Plant
samples were taken 3 weeks after application of second foliar treatments, on 4 February
1994, when plants were at full tasselling stage and were analysed by two commercial
laboratories. Leaf blades opposite and below the primary cob were taken, dried, ground
Dr Ali Salardini and Dr Leigh Sparrow (2001). Final Report of the Trace Elements Project PT 320 to Horticulture Australia Limited. Page 17

and analysed for the major and trace elements. The soil analysis results are given in
Table 3.
Fertiliser treatments consisted of two foliar applications of lignosulfonate liquid
fertilisers on 24 November 93 and 11 January 1994. The treatments included Control
(no foliar fertiliser), FT-Lignate, FT-Mineral, FT-Zn, FT-B, FT-Cu and FT-Mo. The
treatment codes and trace element concentrations are as reported in Table 2 for the
poppy experiment, except that urea was not included in the foliar solutions. FT-Mineral
had identical composition to that of FT-Lignate, but trace elements were applied from
generic mineral sources (see Table 1).
5.2.2 Results
The results of soil analysis by Thrive-Ag Ltd. indicated the paddock to be very high in
Mn and Cu, low in Zn, very deficient in Mo and marginal in B. We interpreted the
results of tests conducted by DPIWE laboratory (the laboratory did not provide
interpretation) to be adequate in all trace elements, except Zn that was considered to be
deficient (Table 3).
As predicted from the DPIWE laboratory soil analysis results, there was no significant
response in either yield to the omission of Cu, Mn, B or Mo from the foliar solutions.
Although the soil Zn content was slightly below the adequate level of 1 mg/kg, and we
assumed the possibility of reduction in yield or changes in the quality characteristics in
the treatments without Zn (control and FT-Zn), there was no response to the omission of
Zn from the fertiliser solution. Plant tissue analysis showed only small changes in the
trace element content of leaves with addition or omission of the relevant or other
elements. Zinc concentration of leaves were high (50 ±10 mg/kg)) in all treatments.
However, tissue Cu content was slightly, but significantly (P=0.05) reduced when Cu
was omitted or Zn was added to the solution.
The quality characteristics such as tip-fill, colour, weight, diameter, length and kernel
rows of the primary or secondary cobs were not affected by any of the treatments
applied.
Dr Ali Salardini and Dr Leigh Sparrow (2001). Final Report of the Trace Elements Project PT 320 to Horticulture Australia Limited. Page 18

Table 3. Soil analysis results of topsoil (200 mm) of sweet corn experiment (TE-05)
Laboratory pH
(H20)
Org.C
%
P K B Zn Cu Mn Laboratory pH
(H20)
Org.C
% (mg/kg)
DPIWE, Tasmania Thrive-Ag
6.0 Ad 5.5 VAcid
4.4 Hi 4.3 Hi
96 Marg 10 Marg
190 Marg 208 Ad
2.06 Ad 1.36 Marg
0.81 Lo 2.30 Lo
2.59 Ad 10.29 VHi
129 Hi 386 VHi
AMethodsofsc )il analysi 3 are described in section 1.4.5. Abbreviations: Ad = Adequate, Hi = High, Marg = Marginal, Lo = Low, V = Very
5.2.3 Conclusions to the Sweet corn foliar study
There was a significant difference in the methods of analyses employed by Thrive-Ag
as compared with the Australian Laboratory Handbook of Soil and Water Chemical
Methods (Rayment and Higginson, 1992). It appears that the soil threshold of
deficiency adapted by the consultants for the recommendation of trace elements to
sweet corn in northern Tasmania, is much higher than those adapted by the independent
organisations.
The plant tissue test showed that the control plants were adequate in Zn, Cu and B and
predicted the response to the application of these elements more accurately than soil
analysis.
5.3 Broccoli
5.3.1 Methods
This foliar experiment (TE-14) was conducted in a commercial broccoli crop at
Forthside Vegetable Research Station (FVRS) 5 km west of Devonport into a deep clay
loam ferrosol. In the previous experiments, the effects of omission of a single element
from a fertiliser solution containing all elements were investigated. That is, all trace
elements were present except one. In the current experiment the objective was to
investigate the effect of application of a single trace element in the, different rates and
sources of this element was chosen to be investigated. The crop received 500 kg DAP
(20-18-0, N-P-K) fortified with 0.7% B and 0.02% Mo band-placed at planting on 23
August, two top-dressings of ammonium nitrate at 20 kg N/ha each on 29 September
and 3 November and a foliar NPK fertiliser (7-7-9, N-P-K) on 1 September 1994. The
crop was harvested sequentially at 5 different dates (25 November to 7 December 1994)
Dr Ali Salardini and Dr Leigh Sparrow (2001). Final Report of the Trace Elements Project PT 320 to Horticulture Australia Limited. Page 19
when heads reached marketable sizes. The yield and quality characteristics such as
hollow stem, starring, colour, compactness, browning and presence of leaves were
assessed for sub-samples of harvested heads. Each quality characteristic was ranked to a
scale of 1 to 5 (5 was the best) and the overall quality ranking was calculated as the
mean of individual quality characteristics.
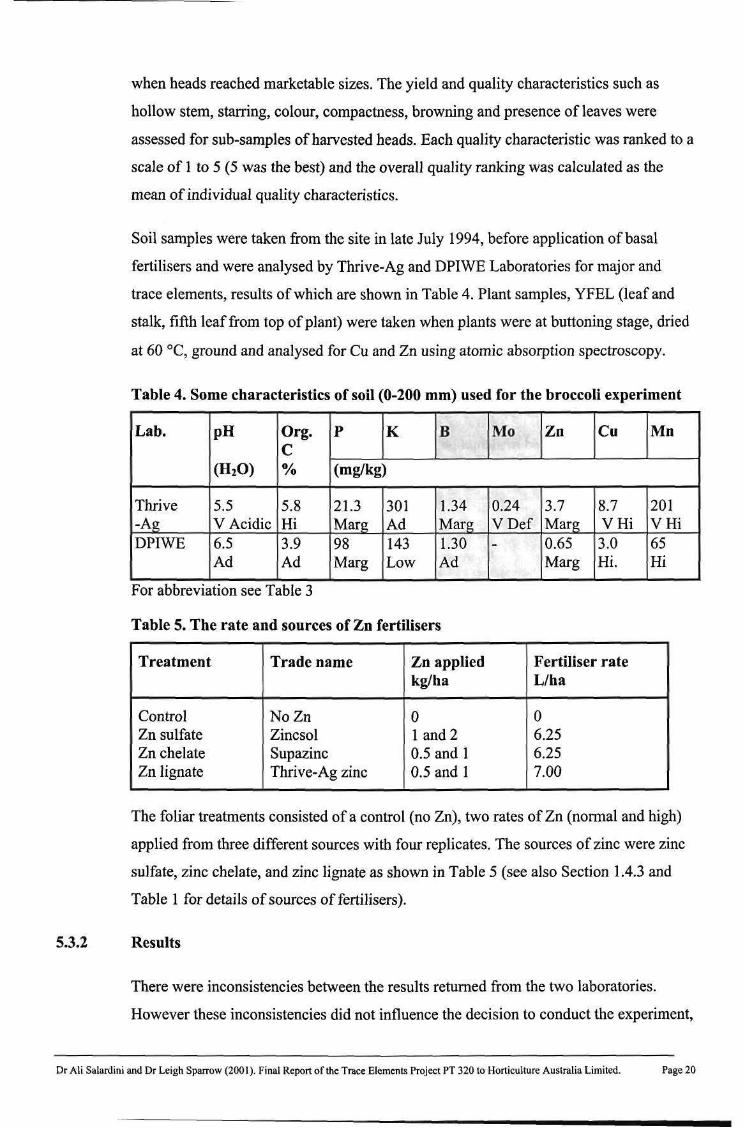
Soil samples were taken from the site in late July 1994, before application of basal
fertilisers and were analysed by Thrive-Ag and DPI WE Laboratories for major and
trace elements, results of which are shown in Table 4. Plant samples, YFEL (leaf and
stalk, fifth leaf from top of plant) were taken when plants were at buttoning stage, dried
at 60 °C, ground and analysed for Cu and Zn using atomic absorption spectroscopy.
Table 4. Some characteristics of soil (0-200 mm) used for the broccoli experiment
Lab. pH
(H20)
Org. C %
P K B Mo Zn Cu Mn Lab. pH
(H20)
Org. C % (mg/kg)
Thrive -Ag
5.5 V Acidic
5.8 Hi
21.3 Marg
301 Ad
1.34 Marg
0.24 VDef
3.7 Marg
8.7 VHi
201 VHi
DPIWE 6.5 Ad
3.9 Ad
98 Marg
143 Low
1.30 Ad
~ 0.65 Marg
3.0 Hi.
65 Hi
For abbreviation see Table 3
Table 5. The rate and sources of Zn fertilisers
Treatment Trade name Zn applied Fertiliser rate kg/ha L/ha
Control NoZn 0 0 Zn sulfate Zincsol 1 and 2 6.25 Zn chelate Supazinc 0.5 and 1 6.25 Zn lignate Thrive-Ag zinc 0.5 and 1 7.00
The foliar treatments consisted of a control (no Zn), two rates of Zn (normal and high)
applied from three different sources with four replicates. The sources of zinc were zinc
sulfate, zinc chelate, and zinc lignate as shown in Table 5 (see also Section 1.4.3 and
Table 1 for details of sources of fertilisers).
5.3.2 Results
There were inconsistencies between the results returned from the two laboratories.
However these inconsistencies did not influence the decision to conduct the experiment,
Dr Ali Salardini and Dr Leigh Sparrow (2001). Final Report of the Trace Elements Project PT 320 to Horticulture Australia Limited. Page 20

as one of objectives of this work was to examine the validity of some soil analysis
interpretations leading to recommendation of trace element use for vegetable crops.
Only a soil DTP A extractable Zn concentration of <1 mg/kg is considered deficient for
many crops (Brennan et al. 1993).
This crop produced a marketable yield of 16 t/ha, about 30% higher than the region
average. Application of Zn from any sources did not influence marketable yield or the
overall quality characteristics determined for the sum of five harvesting dates, but the
effects were different when the date of each harvest was also considered. The yield of
first and second harvest was doubled when 0.5 kg Zn/ha was applied in chelate form. At
1 kg Zn/ha in chelate form, the increase was 30%. At the lower rate of Zn, the lignate
and sulfate sources did not have any effect, but at the higher rate the yield increase over
the control was 25 and 30% for lignate and sulfate respectively (Figure 4).
Some of the quality characteristics including starring, hollow heart, colour and presence
of bracts in the head were also improved by Zn application. The overall quality ranking
of the heads from the first two harvests was influenced by Zn application similar to that
of the yields. Figure 5 shows the overall quality and colour ranking, the latter as an
example of individual quality characteristics, at first harvest. The figure indicated that
there was an improvement in the quality of heads with application of the lower rate of
Zn chelate and the higher rate of Zn from the other sources.
Application of Zn did not influence the concentration of Zn in the YFEL (24.7 ± 1.8),
but Cu concentration, contrary to the antagonistic effects between Zn and Cu observed
in other crops, increased Cu concentrations (3.9 + 0.2) in the YFEL. The increase,
although small (10%), was highly significant (P=0.01) for the lower rate of Zn chelate
and higher rate of Zn from other sources.
Dr Ali Salardini and Dr Leigh Sparrow (2001). Final Report of the Trace Elements Project PT 320 to Horticulture Australia Limited. Page 21

n
a)
I First cut • Second cut
Jl + NoZn CheH Chel2 Lig1 Lig2 Sulfl sulf2
Zn Fertiliser
Figure 4. Yield response of broccoli at first harvest (grey segment), second harvest (black segment) and their sum (whole column) to foliar Zn fertilisers. Vertical lines are lsd o.os for the total yield.
• Overall quality • Colour
c 3
NoZfl
Figure 5. Effect of foliar trace element application on the head colour (black column) and overall quality (grey column) of broccoli at first harvest. Vertical lines are lsd o.os for the relevant quality factors.
Dr Ali Salardini and Dr Leigh Sparrow (2001). Final Report of the Trace Elements Project PT 320 to Horticulture Australia Limited. Page 22

5.3.3 Conclusions to the broccoli foliar study
The time of cutting of broccoli, especially the first cutting, is withheld until the number
of marketable heads are large enough to justify the cost of cutting without reducing the
quality of the produce. Any agronomic practice, which could enhance the maturity and
improve the quality of crop, is of value to the growers. The yield and quality response
of broccoli to Zn application in this experiment could have commercial application. The
differential response to rates and sources of fertiliser indicates that for best result these
factors should be appropriately chosen.
The rate of Zn should be relevant to the source chosen. Zinc at 0.5 kg/ha applied as
chelate was as effective for yield asl kg Zn in lignate form and 2 kg Zn in sulfate form.
They were equally effective in improving quality at these rates. We do not know
whether higher rates, greater than those employed in the experiment, from sulfate and
lignate could have increase the yield further. We also did not conduct a cost/benefit
analysis to identify the more economical source and rate of Zn. However chelated Zn
may not be recommended at higher than 0.5 kg/ha because of the risk of phytotoxicity.
The antagonistic relationships between Zn and Cu frequently reported in the literature
(reviewed by Loneragan and Webb 1993), refer to the soil and growth media. We are
not aware of these interactions when one is applied to foliage. Further work is necessary
to clarify the findings of this experiment.
5.4 Green beans
5.4.1 Methods
Similar to the other experiments, a foliar experiment (TE-19) was conducted on an
established green bean crop at FVRS 5 km west of Devonport. The objectives of the
experiment were to investigate the effect of application of a single trace element in
absence of others in the fertiliser solution.
Soil, a clay loam ferrosol, analysed prior to planting, indicated a low available Zn
(Table 6). Boron and Mo were not determined, but the previous season soil analysis
report indicated also a low Mo and adequate B. Boron and Mo had not been applied in
the past two years prior to this study. The paddock had received 300 kg/ha of DAP
band-placed at planting of green beans, cultivar Montano, with inter- and intra-row
spacing of 500 and 50 mm respectively (400 000 plants/ha).
Dr Ali Salardini and Dr Leigh Sparrow (2001). Final Report of the Trace Elements Project PT 320 to Horticulture Australia Limited. Page 23

Table 6. Soil analysis of FVRS green beans sites before planting
Depth pH InH20
OC
(%)
P K Zn Mn Cu B Depth pH InH20
OC
(%) mg/kg
0-200 mm 6.7 Ad
4.7 Ad
50 Lo
317 Ad
0.60 Lo
18.8 Lo
1.63 Ad
ND-
ND-not determined
Experimental treatments are given in Table 7. Two foliar applications of B and Mo from
one source and Zn from 3 sources, chelate, lignate and sulfate were compared with a
control (no foliar fertiliser) and a commercial foliar fertiliser (9-4-6 and trace elements.
Foliar trace elements were sprayed on 16 and 24 January 1995, when plants were in full
flower. It had been planned to apply the treatments at early bud stage, but weather
condition delayed the work.
Table 7. Rates and sources of foliar fertiliser used in the TE18 and TE19 experiments
Treatment Trade Name Rate of Rate of Included in fertiliser
L/ha in each spray
element kg/ha in each
spray
E19
Control No trace elements
Nil 0 Yes
Zn sulfate (ZnS) Zincsol 6.00 1.00 No Zn chelate (ZnC) Supazinc 6.50 0.50 Yes Zn Lignate (ZnL) Thrive-Ag zinc 7.36 0.5 No Molybdenum Na-molybdate 0.127 0.05 Yes Boron Solubor 1.00 0.20 Yes Full treatment Top Foliar 6.25 - Yes
Plant tissue samples, whole blade and petioles of YFEL were taken two weeks after the
second foliar spray. Plant samples were washed, dried and analysed for Cu and Zn by
AAS and for other nutrients by ICP.
5.4.2 Results
Although soil analysis results indicated a low available Zn content, and previous soil
analysis and paddock history indicated a probable responses to Mo, two foliar
applications of Zn and Mo, or a complete fertiliser did not influence the marketable
yield (Figure 6), total yield or total fresh matter produced. The yield obtained at this site
Dr Ali Salardini and Dr Leigh Sparrow (2001). Final Report of the Trace Elements Project PT 320 to Horticulture Australia Limited. Page 24

was 30% higher than the region average. Trace element concentrations in plant tissue
increased by application of the elements supplied in the foliar solution. As an example,
the change in B concentration due to foliar treatments is given in Figure 6 and showed
that even where B was not applied B was in the adequate range. Zinc content of plant
tissues without application of Zn (19+1.5 mg/kg) was also in the adequate range for
green beans (Reuter and Robinson 1997) and increased to 100 mg/kg when Zn was
applied.
15
12
re 9
> 6
WM Yield LSD=NS - 0 - B LSD=7
+ +
150
120
90
60
30
"5) E, c o ".5 (0 c o o c o o
No foliar B Mo ZnSul ZnChel ZnLig Complete
Foliar treatment
Figure 6. Effects of B, Mo, Zn and a complete foliar fertiliser on yield and B content of green peas tissue at Sassafras site
5.4.3 Conclusions to the green beans foliar study
It appeared that soil test for Zn did not predict the response of green peas to foliar
application of Zn. The soil DTPA extractable Zn of 0.6 mg/kg is generally considered
deficient for many crops. The lack response to Zn or B application in these experiments
may be attributed to may factors including:
8. A fast growing short life crop such as green beans was not given sufficient time to
absorb and assimilate the trace elements applied
9. Insufficient amounts of trace elements were supplied by foliar treatments
10. The soil critical Zn concentration for green beans is below 0.6 mg/kg
11. Soil tests cannot identify Zn or B requirements of green beans.
Dr Ali Salardini and Dr Leigh Sparrow (2001). Final Report of the Trace Elements Project PT 320 to Horticulture Australia Limited. Page 25

With limited information obtained from these experiments, it is not possible to identify
the reason for the lack of response of green beans to Zn and B applications. However,
general interpretation standard for plant tissue tests for both trace elements predicted the
lack of response better than soil test.
5.5 Green Peas
5.5.1 Methods
A foliar experiment (TE-18) was established on a commercial crop at Sassafras 16 km
west of Devonport on a clay loam vertosol. The soil unlike ferrosols of the region
became firm and very hard to cultivate when dry. The site had been under pasture for
many years prior to 1990 followed by poppies, potatoes and carrots. Very little trace
element had been applied to the paddock and soil analysis indicated the soil being
deficient in Zn (Table 8). Green peas, cultivar Small Sieve Freezer, were planted on 1
September 1994 at 100 plants/m2. Prior to planting 250 kg/ha of 3-15-13+Mo had been
incorporate into the top 100 mm.
Table 8. Soil analysis results of Sassafras site used for green peas foliar experiment
Site pH inH 2 0
OC (%)
P K Zn Mn Cu B Site pH inH 2 0
OC (%) mg/kg
Sassafras 6.1 Ad
2.3 Lo
102 Ad
71 Lo
0.65 Lo
77 Ad
0.77 Ad
0.73 Ad
The foliar treatments applied, on 1 and 9 December 1994 at early flowering stage, were
the same as those employed at the FVRS site for green beans, except that only one
source of Zn, chelate, was used (Table 7). Further details of composition of these
fertilisers are given in Table 1.
Plant tissue samples, whole blade and petioles of YFEL were taken two weeks after the
second foliar spray. Plant samples were washed, dried and analysed for Cu and Zn by
AAS and for other nutrients by ICP.
The crop was harvested on 19 December 1994 and total fresh matter, total and.
marketable pea yield and pea maturity index were recorded.
Dr Ali Salardini and Dr Leigh Sparrow (2001). Final Report of the Trace Elements Project PT 320 to Horticulture Australia Limited. Page 26
5.5.2 Results
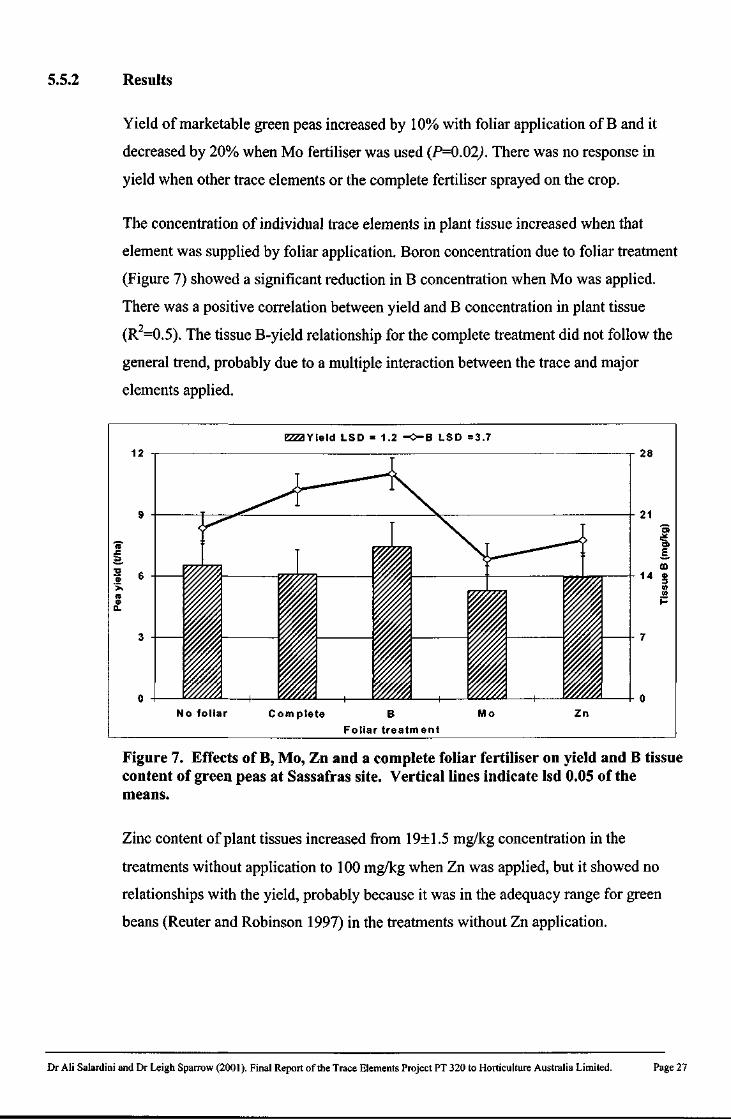
Yield of marketable green peas increased by 10% with foliar application of B and it
decreased by 20% when Mo fertiliser was used (P=0.02). There was no response in
yield when other trace elements or the complete fertiliser sprayed on the crop.
The concentration of individual trace elements in plant tissue increased when that
element was supplied by foliar application. Boron concentration due to foliar treatment
(Figure 7) showed a significant reduction in B concentration when Mo was applied.
There was a positive correlation between yield and B concentration in plant tissue
(R2=0.5). The tissue B-yield relationship for the complete treatment did not follow the
general trend, probably due to a multiple interaction between the trace and major
elements applied.
Figure 7. Effects of B, Mo, Zn and a complete foliar fertiliser on yield and B tissue content of green peas at Sassafras site. Vertical lines indicate lsd 0.05 of the means.
Zinc content of plant tissues increased from 19+1.5 mg/kg concentration in the
treatments without application to 100 mg/kg when Zn was applied, but it showed no
relationships with the yield, probably because it was in the adequacy range for green
beans (Reuter and Robinson 1997) in the treatments without Zn application.
Dr Ali Salardini and Dr Leigh Sparrow (2001). Final Report of the Trace Elements Project PT 320 to Horticulture Australia Limited. Page 27
5.5.3 Conclusions to the green peas foliar study
As for green beans, the threshold of deficiency for soil Zn commonly employed for
other crops didn't apply to green peas for recommending foliar Zn fertilisers. However,
DTPA extractable Zn of 0.65 is considered adequate for some crops (Brennan and
Gartell 1990) and that might be the case for green peas. The YFEL Zn concentration
being in adequacy range without Zn application may support the view that a lower
critical soil Zn concentration may be employed for green beans.
Soil B test in this experiment could not predict the yield response to B application.
However, the critical concentration of soil hot water soluble B employed in the region is
2 mg/kg, many fold greater that that employed for green peas (0.1 mg/kg) in other
countries (Srivastava and Gupta 1996).
5.6 Potatoes, general procedures
5.6.1 Methods
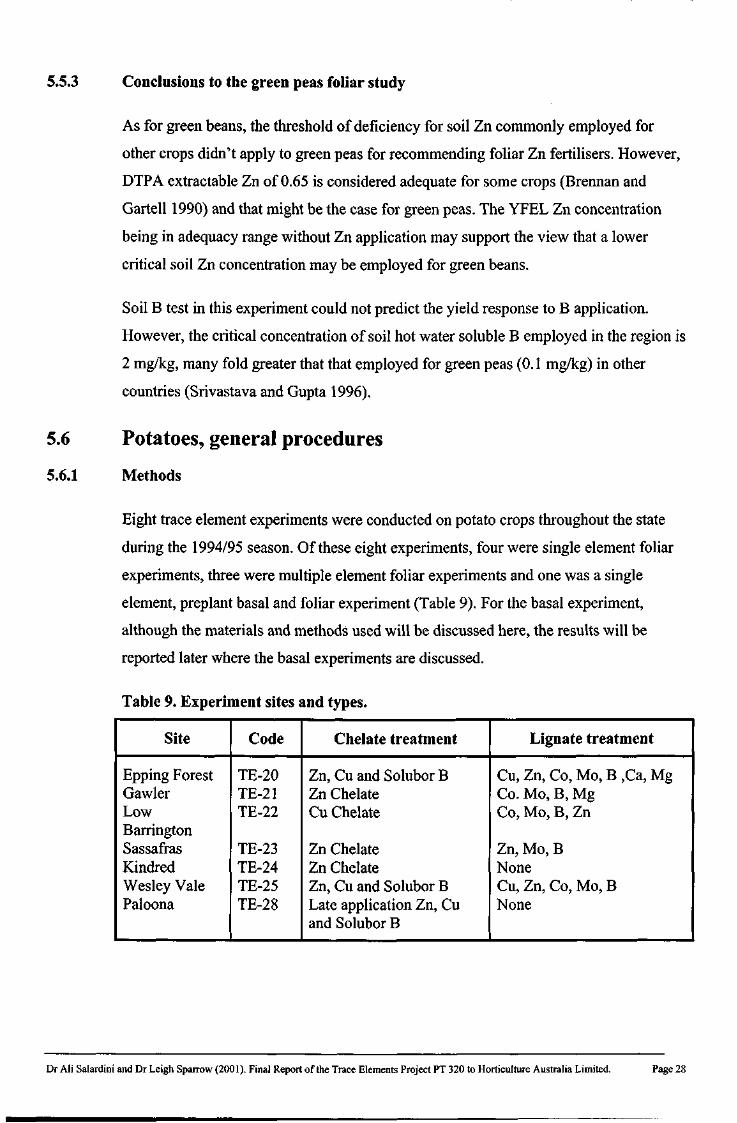
Eight trace element experiments were conducted on potato crops throughout the state
during the 1994/95 season. Of these eight experiments, four were single element foliar
experiments, three were multiple element foliar experiments and one was a single
element, preplant basal and foliar experiment (Table 9). For the basal experiment,
although the materials and methods used will be discussed here, the results will be
reported later where the basal experiments are discussed.
Table 9. Experiment sites and types.
Site Code Chelate treatment Lignate treatment
Epping Forest TE-20 Zn, Cu and Solubor B Cu, Zn, Co, Mo, B ,Ca, Mg Gawler TE-21 Zn Chelate Co. Mo, B, Mg Low TE-22 Cu Chelate Co, Mo, B, Zn Barrington Sassafras TE-23 Zn Chelate Zn, Mo, B Kindred TE-24 Zn Chelate None Wesley Vale TE-25 Zn, Cu and Solubor B Cu, Zn, Co, Mo, B Paloona TE-28 Late application Zn, Cu
and Solubor B None
Dr Ali Salardini and Dr Leigh Sparrow (2001). Final Report of the Trace Elements Project PT 320 to Horticulture Australia Limited. Page 28

5.6.2 Soil sampling and site selection
Prior to the establishment of each experiment, a soil sample was taken from the
experiment site. The sample was made up of 30 cores to a depth of 150mm and each
composite sample was analysed for the major and trace elements by the DPIWE and
Thrive-Ag laboratories. Results of soil analyses are shown in Table 10. Sites low in one
or more trace elements were selected for experiments.
5.6.3 Experimental design and spray application
All experiments were randomised block designs with either 5 or 6 replications. Plot size
was 4 rows by 7m (22.4 m2). All foliar experiments were imposed on established
commercial crops. Each element in the foliar experiments was applied as a single spray
about 6 weeks after planting (tuber size 5-10 mm long) and also as a double spray at
about 6 and 8 weeks after planting (Table 11). TE-28 received a single foliar application
10 weeks after planting (Table 11). Zn chelate was applied as Zn- EDTA at 400g Zn/ha,
Cu as Cu- EDTA at 300g Cu/ha and B as Solubor or sodium borate at 300g B/ha.
Thrive-Ag supplied a recommendation based on their soil analysis and where possible
their recommendation was included as a foliar treatment. It did not necessarily contain
the same elements as were applied in other treatments (Table 12). Lignate treatments
were applied at 6 weeks after planting in most cases.
All foliar sprays were mixed in tap water, which had been analysed as free of trace
elements. The spray rate was 900 L/ha, which wetted the leaf surface but produced very
little drip from leaves. Crops were sprayed in the morning to minimise drift. Leaf
surfaces had usually dried within 30 minutes
5.6.4 Plant sampling
Forty petioles of the youngest fully expanded leaves (P-YFEL) were sampled from each
replicate prior to the first foliar spray when the largest tubers were 5-10 mm long. A
second sample of 20 petioles was taken from the control plots and those receiving the
double spray. These samples were taken before the second spray was applied to
examine the effect, if any, of the first spray. All petiole samples were dried at 70°C,
ground in a stainless steel mill, and analysed for B by ICP emission spectroscopy and
for Cu and Zn by atomic absorption spectrometry (AAS).
Dr Ali Salardini and Dr Leigh Sparrow (2001). Final Report of the Trace Elements Project PT 320 to Horticulture Australia Limited. Page 29

At harvest, 5m of the middle two rows in every plot was harvested. The total tuber yield
for each plot was recorded and the tubers were graded according to Edgell factory
requirements. The grading categories were <100g, 100-250g, 250-850g, >850g, cut and
green and misshapen. The grading at TE-25 also included a badly misshapen category
due to the large numbers of such tubers.
Table 10. Soil chemical characteristics of the sites used for potato trials. Trace elements were analysed by both DPI WE and Thrive-Ag laboratories.
Site pH
(1:5) water
EC
(1:5) water
Colwell Org.C Mo Site pH
(1:5) water
EC
(1:5) water
P (mg/kg)
K (mg/kg) (%)
Thrive-Ag (mg/kg)
TE-20 TE-21 TE-22 TE-23 TE-24 TE-25 TE-28
5.3 6.5 5.5 6.8 6.0 6.3 5.4
0.06
0.08 0.12 0.08 0.03
10 69 26 61 58 77 46
45 68
245 73 105 65 106
1.7
4.0 4.4 1.9 3.5
0.07 0.22 0.17 0.08
0.13
Site Cu (mg/kg) Zn (mg/kg) B (mg/kg)
DTPA Thrive-Ag
DTPA Thrive-Ag
Hot H 2 0 Thrive-Ag
TE-20 TE-21 TE-22 TE-23 TE-24 TE-25 TE-28
0.1 1.1 0.9 1.3 1.5 0.6 0.5
0.65 6.37 4.69 8.26
2.45
1.0 1.0 2.1 1.2 1.2 1.2 0.7
1.39 4.28 4.23 4.22
2.56
0.3 1.2 1.1 1.4 1.4 0.8 0.5
0.27 0.98 0.73 1.32
0.92
Dr Ali Salardini and Dr Leigh Sparrow (2001). Final Report of the Trace Elements Project PT 320 to Horticulture Australia Limited. Page 30

Table 11. Timetable of operations.
Site Planting First First Second Second Harvest Date petiole foliar petiole foliar date
sampling spray sampling spray
TE-20 _ 19/12/94 19/12/94 6/1/95 9/1/95 20/4/95 TE-21 5/10/94 29/11/94 29/11/94 13/12/94 14/12/94 6/2/95 TE-22 19/10/94 19/10/94 8/12/94 - - 29/3/95 TE-23 25/10/94 12/12/94 13/12/94 4/1/95 4/1/95 30/3/95 TE-24 29/10/94 15/12/94 15/12/94 4/1/95 4/1/95 23/3/95 TE-25 24/10/94 12/12/94 15/12/94 4/1/95 5/1/95 27/3/95 TE-28 7/11/94 24/1/95 25/1/95 - - 10/4/95
Table 12. Details of Lignate treatments (rates in g/ha).
Site Cu Zn Co Mo B Mg Ca
TE-20 1330 1370 565 920 863 417x2 417x2 TE-21 - 565 920 863 417 -TE-22 - 343 283 920 863 - -
TE-23 - 343 920 575 - -
TE-24 - - - - - - -
TE-25 665 685 565 920 863 - -
TE-26 - - - - - - -
TE-28 - - - - - - -
Weights and numbers in each grade were recorded and a 20-tuber sample from the 250-
850 category was taken for quality assessment. The quality assessment consisted of
determination of specific gravity (SG), bruising index and crisp colour. Tubers from TE
21 were also assessed for common scab.
Table 13. Petiole nutrient concentrations at first
Site Size of largest tuber (mm)
Petiole nutrient concentrations (mg/kg dw) Site Size of largest tuber (mm) Zn Cu B Cd
TE-20 TE-21 TE-22 TE-23 TE-24 TE-25 Radcliff TE-28
hook-8 5-10 5-10 5-10 5 5-10 5 NM
58 83 76 60 69 59 34 30
3.9 4.6 5.3 3.4 5.8 3.8 4.0 5.7
30 26 26 28 26 29 NM 22
NMA
4.1 1.2 1.7 2.5 1.5 1.7 NM
ANM = not
Dr Ali Salardini and Dr Leigh Sparrow (2001). Final Report of the Trace Elements Project PT 320 to Horticulture Australia Limited. Page 31

5.6.5 Harvest
5.6.6 Results
As was the case in 1994, very few significant differences between treatments were
observed at any of the experimental sites. No plant top size, habit or colour responses to
our treatments were seen. Tables, which summarise results for each experiment, are
given in this section. Yield and petiole data are presented for each site, but data on
quality are only included where quality was significantly affected.
Table 14. Effect of foliar trace element application on yield and tissue composition of potato from TE-20 experiment at Epping Forest
Nutrient Nil Cu-EDTA
Zn-EDTA
Solubor Thrive-Ag
lsd(0.05)
Total yield (t/ha)
56.5 52.2A
(58.6) 58.8
(50.8)
58.6
(57-4) .........
56.8 NSB
P=(0.2S) Processing. yield (t/ha)
53.4 47.3 (53.2)
54.2 (47.2)
53.7 (53.5)
50.8 NS P=(0.28)
Petiole Zn (mg/kg)
29 55 54 59 46 18.3
Petiole Cu
img/kg). 2.5 3.1 2.1 3.0 4.2 NS
(P=0.06) Petiole B (mg/kg)
30 28 30 30 28 NS (P=0.2S)
Data in bracket are from plots with double spray, NS = Not statistically significant
5.6.7 TE-20 (Zn, Cu Chelates, Solubor B and Cu, Zn, B, Co, Mo, Ca, Mo lignite)
There was no effect of any treatment on yield or quality at this site despite the 15%
difference between the highest and lowest yielding treatments (Table 14), and despite
the relatively low soil micronutrient concentrations, especially for Cu and B (Table 10).
Variability at this site was increased by the patchy infection of plants with Rhizoctonia.
Surprisingly, petiole Zn was increased by all sprays (Table 14). There was no
measurable Zn in either the Cu-EDTA or Solubor. These latter treatments gave no
measurable increase in petiole Cu or B (Table 14).
Dr Ali Salardini and Dr Leigh Sparrow (2001). Final Report of the Trace Elements Project PT 320 to Horticulture Australia Limited. Page 32

5.6.8 TE-21 (Zn Chelate and Co, Mo, B, Mg lignate)
As for TE-20, there were no treatment effects on either yield (Table 15) or quality (not
shown). However, Zn-EDTA did increase petiole Zn (Table 15). It did not affect
concentrations of other elements measured.
5.6.9 TE-22 (Cu Chelate, and Zn, Co, Mo, B Lignate)
There were no effects of Cu-EDTA or of the Lignate treatment which contained Zn, Co,
B and Mo (Table 16). Petiole Cu was slightly increased by Cu-EDTA (Table 16), but
the increase was only significant at a probability of 6.8%.
5.6.10 TE-23 (Zn Chelate and Zn, Mo, B lignate)
Again, yields responses were extremely even at this site (Table 17), and quality was
generally not affected. There was an increase in chip colour when 2 Zn-EDTA sprays
were applied compared to one, and also when Lignate Zn, Mo and B were applied
(Table 17). However, the size of the differences was of little practical importance, and
was the only such effect observed in this study. Although the average petiole Zn
concentration was 6 mg/kg more in the Zn-EDTA treatment compared to the control
(Table 17), the difference was not statistically significant (P=0.68).
Dr Ali Salardini and Dr Leigh Sparrow (2001). Final Report of the Trace Elements Project PT 320 to Horticulture Australia Limited. Page 33

Table 15. The yield and tissue composition results from TE-21 at Gawler.
Treatment Nil Zn-EDTA Zn-EDTA x2
Lignate lsd (P=0.05)
Total yield (t/ha) Proc. yield (t/ha) Petiole Zn mg/kg) Petiole Cd (mg/kg) Petiole Cu (mg/kg) Petiole B (mg/kg)
52.6 46.8 60 3.5 4.7 24
53.3 47.9 67 3.6 4.5 24
51.9 45.7
52.1 48.0
NS P=0.95 NS P=0.95 5.7 NS P>0.05 NS 7^0.05 NS P>0.05
Table 16. Some results from TE-22 at Lower Barrington.
Treatment Nil Cu-EDTA
Cu-EDTA x2
ThriveAg lsd (P=0.05)
Total yield (t/ha) 83.4 85.2 85.7 83.9 NS P=0.82 Proc. yield (t/ha) 69.0 74.7 76.5 71.7 NS P=0.27 Second growth (t/ha) 10.6 6.5 5.8 8.5 NS P=0.22 Petiole Zn (mg/kg) 43 41 NS P=0.29 Petiole Cd (mg/kg) 1.2 0.9 NSP=0.14 Petiole Cu (mg/kg) 3.5 4.1 NS P=0.068
Table 17. Some results from TE-23 at Sassafras.
Treatment Nil Zn- Zn-EDTA Thrive lsd EDTA x2 Ag (i*=0.05)
Total yield (t/ha) 74.1 73.3 75.0 75.4 NS P=0.85 Proc. yield (t/ha) 67.9 67.5 66.4 69.2 NS P=0.69 Chip colour 5.6 5.0 6.0 6.2 0.67 Petiole Zn (mg/kg) 59 65 - - NS P=0.68 Petiole Cd (mg/kg) 1.1 1.0 NS P=0.70 Petiole Cu (mg/kg) 3.6 3.8 - - NS P=0.69
5.6.11 TE-24 (Zn chelate)
Table 18 shows no effects of Zn-EDTA sprays at this site. No Lignate treatment was
included in this experiment
Dr Ali Salardini and Dr Leigh Sparrow (2001). Final Report of the Trace Elements Project PT 320 to Horticulture Australia Limited. Page 34

Table 18. Some results from TE-24 at Kindred.
Zn EDTA Treatment Nil Zn-EDTA x2 lsd (P=0.05)
Total yield (t/ha) 53.3 52.5 52.9 NS P=0.93 Proc. yield (t/ha) 45.3 44.3 45.1 NS P=0.S3 Petiole Zn mg/kg 63.4 63.9 - NS P=0.98 Petiole Cu mg/kg 4.3 4.4 - NS P=0.64 Petiole Cd mg/kg 2.5 2.3 - NS P=0.07
5.6.12 TE-25 (Zn, Cu Chelate, Solubor B and Cu, Zn, Co, Mo, B Lignate)
There were no statistically significant effects of any of the treatments, but the nil had
the lowest marketable yield (Table 19). There was a substantial yield of misshapen
tubers at this site, about 30-40% of the total (Table 19). Such a result suggests a
possible water stress. Whatever the cause, there was a high amount of variability within
treatments, such that the 37% increase in marketable yield of the Lignate treatment was
not statistically significant.
Petiole analysis showed that both Cu-EDTA and the Lignate treatments increased
petiole Cu, but no treatment increased petiole Zn or B (Table 19).
Table 19. Some results from TE-25 at Wesley Vale.
Treatment Nil Cu-EDTA
Zn-EDTA
Thrive Ag
Solubor lsd(0.05)
Total yield (t/ha)
Proc. yield (t/ha)
Second growth (t/ha)
60.0
29.9
25.6
61.5 (56.2) 32.6 (31.8) 22.3 (19.0)
60.5 (60.9) 30.6 (32.6) 26.3 (22.5)
64.5
40.8
19.5
62.1 (58.3) 34.5 (31.1) 22.9 (21.6)
NS P=0.26
NS P=0A4
NS P=0.65
Petiole analyses prior to second spray
Petiole Zn mg/kg Petiole Cu mg/kg Petiole B mg/kg Petiole Cd mg/kg
41 3.4 30 1.6
46 4.3 30 1.8
38 3.3 30 1.8
37 4.1 30 1.8
39 3.3 30 1.8
NS P=0A1 0.56 NS P=0.98 NS P=0.29
5.6.13 TE-28 (Zn, Cu Chelate and Solubor B)
Although the Solubor treatment gave the highest average processing yield (Table 20),
the 3 t/ha difference was not statistically significant (P=0.42). No petiole samples were
Dr Ali Salardini and Dr Leigh Sparrow (2001). Final Report of the Trace Elements Project PT 320 to Horticulture Australia Limited. Page 35

taken at this site because of the late spraying (79 days after planting Table 11), and no
Lignate treatment was included.
Table 20. Some results from TE-28 at Paloona.
Treatment Nil Zn-EDTA Cu-EDTA Solubor lsd (i*=0.05)
Total yield (t/ha) Proc. yield (t/ha)
63.6
46.2
62.7
46.2
61.5
46.1
65.0
49.2
NSP=0.41
NS P=0.42
Table 21. Nutrient concentrations in petioles from commercial crops
Edgell's site Concentration (mg/kg dw)
Serve-Ag site Concentration (mg/kg dw)
ID Cu Zn B ID Cu Zn B
60909 5.9 57 20 60910 4.3 54 21 60911 9.9 70 19 60912 4.1 88 22 60913 7.8 48 20 60914 7.2 98 21 60915 9.8 81 23 60916 3.7 86 38 60917 16.2 - 30 60918 6.0 82 38 60919 8.5 19 60920 10.1 20 60921 10.0 65 21 60922 6.7 21 60923 13.0 29
9 6.8 52 25 16 5.7 47 24 17 5.0 57 23 18 5.6 49 23 19 2.6 49 24 20 4.6 52 21 21 7.5 33 26 22 6.3 71 25 23 4.3 34 30 24 9.8 88 34 25 6.3 71 21 26 5.2 36 23 27 5.5 45 24 28 4.5 67 22 29 3.2 106 26 32 4.2 46 22 33 2.5 74 20 34 3.1 63 23 35 5.8 53 21
5.6.14 Conclusions to the foliar potato experiments
At all eight potato sites, there was no significant yield response to trace element
treatments, and only one minor quality response. This result agrees with that from the
Dr Ali Salardini and Dr Leigh Sparrow (2001). Final Report of the Trace Elements Project PT 320 to Horticulture Australia Limited. Page 36

basal experiments reported later in this report. There are 3 possible reasons for our
negative finding in this work.
1. Our application methods, timing and amounts did not permit real responses to
show,
2. Our experimental designs, perhaps through a lack of sufficient replication,
were unable to show significant responses,
3. Trace elements were not required by potatoes at our trial sites, and
4. Soils were already adequate in trace elements and a response to trace element
fertiliser should not be expected.
1. During the life of this work we applied trace elements as foliar sprays, in a
band with NPK fertiliser and in a pre-plant broadcasting. Resources prevented
us from comparing all methods for all elements at all sites. The treatments we
have used are current practice for many growers. Foliar sprays may not always
be as effective as banding or broadcasting on soil, but they have still given
increased production in responsive situations (Soltanpour et al. 1970). We do
not believe we missed out on responses through inappropriate practices.
2. Variation within a trial site affects the sensitivity of experiments. With more
variation, the treatment differences have to be larger to be statistically
significant. Even the best trial sites have variation which means that small
differences (5% or less) go undetected. At 6 of the 8 sites, the yields of
different treatments were so similar that we do not believe variability was a
limitation. There was simply no response. At TE 20 and TE 25, where disease
and other factors increased site variability, more replication may have helped
show some differences to be significant. Even so, at TE 20 the nil treatment
was one of the best, so it is doubtful that real responses were being masked.
3. Our comments on 1 and 2 above lead us to conclude that potatoes did not need
trace element fertilisers at our sites. This is supported by the apparent
sufficient levels of Zn and B in petioles when trials were sprayed (Table 13).
No reference data for Cu in potato petioles exists by which we can judge the
sufficiency of the pre-spray Cu concentrations. Sanderson and Gupta (1990)
found 7 mg Cu/kg in leaves to be adequate, but did not have a more deficient
situation to test. The petiole status of a number of commercial crops (Table
21) was similar to that at our sites. Petiole Zn in commercial crops was
Dr AH Salardini and Dr Leigh Sparrow (2001). Final Report of the Trace Elements Project PT 320 to Horticulture Australia Limited. Page 37

generally higher. Six crops had petiole B of 20 mg/kg or less (Table 21),
which may be of concern. Pregno and Armour (1992) showed a B response of
Sebago potatoes when leaves contained 19 mg B/kg.
4. Our soil analysis results when compared with the threshold of deficiency
reported in literature suggest that nearly all potato sites we selected were
adequately supplied with the trace elements under investigation. In addition,
that has been the main factor for finding no responses despite choosing sites
lowest in trace elements and which, by current commercial standards, tested
low in one or more elements. There seems to be little likelihood that growers
will obtain positive responses to trace elements in Russet Burbank potatoes in
Tasmania. Furthermore, a negative response is possible, as we found with
boron in 1993/94bst year. Sanderson and Gupta (1990) also induced toxicities
by spraying potatoes with CUSO4 and ZnSC>4 solutions, but at higher rates than
we used. Growers need to weigh the odds before deciding to apply trace
elements.
The petiole data indicate that caution should be exercised when using petiole analysis to
monitor the effectiveness of sprays. Only at some sites did the sprays significantly
increase the concentration of relevant trace elements in petioles. At others, the trend
was in the right direction, but at some, it was not. Such erratic responses have been
observed elsewhere. Soltanpour et al. (1970) showed a yield response to Zn despite a
lack of response in leaf Zn. Russet Burbank may be a cultivar, which has a particularly
poor leaf response to trace elements (Boawn and Leggett 1963).
Dr Ali Salardini and Dr Leigh Sparrow (2001). Final Report of the Trace Elements Project PT 320 to Horticulture Australia Limited. Page 38

6 Details of basal trace element experiments.
6.1 Cauliflower (soil and foliar applied Zn, Cu, B and Mo)
6.1.1 Methods
This experiment (TE-15) was established in a commercial paddock at Kindred. The
yields of crops on this property have been higher than the average of the region. The
soil, a high fertility ferrosol, in the past, regardless of soil analysis results, had received
large amount trace element fertilisers regularly. The experimental paddock had been
planted with poppy in 1993/1994, and had received B fertiliser.
The objective of this experiment was to compare the efficiency of basal and foliar
applied trace element fertilisers on highly fertile soils to which the farmer intended to
apply a mixture of Zn, Cu, B and Mo fertilisers. Soil analysis was conducted by two
laboratories and the results are reported in Table 22. Treatments included 16 variations
of basal and foliar applied fertilisers (Table 23).
Table 22. Soil analysis results (0-200 mm depth) from cauliflower experiment at Kindred
Lab pH OC P K Fe Zn Cu Mn B Mo
DPIWE Diagnosis
6.8 Ad
4.6 High
163C Hi
351C Hi
36 Ad
4.25 Hi
3.66 VHi
53 Hi
2.52 Ad
-
Thrive-Ag Diagnosis
6.2 Ad
6.3 VHi
12.50 Ad
353E Ad
145E Ad
5.39 VHi
7.37 VHi
201 VHi
2.12 Hi
0.28 VLo
Abbreviations: Ad, adequate; C, Colwell method; O, Olsen method; E, exchangeable; V, very; Hi, high; Lo, low, OC, % of organic carbon, the OC% for Thrive-Ag was calculated from OC = organic matter x 0.58
All plots received 200 kg/ha of a commercial grade diammonium phosphate (18%N,
20% P), except the control treatment. Prior to the planting of cauliflower seedlings
cultivar Plana on 3 June 1994, the major and trace element fertilisers were broadcast
and lignate solution was sprayed on each plot and incorporated to 150 mm depth using a
disc plough. Zinc and Cu were applied in sulfate form, B as Solubor and Mo as either
molybdate or lignate (see Table 1 for specification).
Dr Ali Salardini and Dr Leigh Sparrow (2001). Final Report of the Trace Elements Project PT 320 to Horticulture Australia Limited. Page 39

Table 23. Basal and foliar treatments A
Basal Trace element Basal Foliar Rate
treatment +Foliar treatment L/ha
Cont Control, Nil Cont+All Top Foliar 6.25 DAP Nil DAP+LMo Mo Lignate 0.63 All 20 Zn, 10 Cu, 2 B, 0.4 Mo
and 200 DAP (kg/ha) All+All Top Foliar 5.00
-Zn All except Zn -Zn+Zn Supa Zinc 5.00 -B All except B -B+B Solubor 5.00 -Cu All except Cu -Cu+Cu Supa Copper 5.00 -Mo All except Mo -Mo+Mo Na
molybdate 5.00
LA11 All in lignate form (10 L/ha) Lall+LMo Mo Lignate 0.63
For more information on the fertiliser specification see Table 1.
At 14 weeks after planting at buttoning stage (most heads were about 2.5 cm in
diameter), the plots were randomly split into two and the foliar treatments as detailed in
Table 23 were applied to one half. The foliar treatments were chosen with regard to the
basal treatment. Foliar Zn fertiliser, for example, was applied to half of the plots that did
not receive basal application of Zn. The LS treatment supplied (in g/ha) 225 Cu, 375
Zn, 37.5 Mo and 8.78 B all in lignate form. The rate and composition of fertiliser used
in the LS treatment was recommended by the supplier (Thrive-Ag Ltd.).
Plants were sampled on 28 September 1994 when they were at curd initiation stage.
Samples of YFEL were taken from all plots and were analysed for a series of nutrients
by ICP and Cu and Zn by AAS.
Harvest, commencing on 21 November 1994, lasted four days. Twenty four plants from
three middle rows were selected for harvest. Curds were cut when they were ready for
marketing. Individual curds were weighed and assessed for 8 quality criteria, shape,
evenness, riciness, colour, firmness, bracts, maturity and hollow heart.
6.1.2 Results
Although the yields of all basal fertiliser treatments were higher than the control, but
only DAP increased the yield significantly (Table 24). As all basal treatments receiving
trace elements also received DAP, their higher (non-significant) yield increase could be
attributed to the effect of DAP. Comparing DAP and LA11 treatments (see Table 23 for
Description of the treatments), it is evident that basal application of the lignate fertiliser
Dr Ali Salardini and Dr Leigh Sparrow (2001). Final Report of the Trace Elements Project PT 320 to Horticulture Australia Limited. Page 40

reduced the yield significantly. No visual symptoms of phytotoxicity were observed on
the foliage in any treatments. Addition or omission of individual trace elements in basal
treatments had no significant effect on the marketable yield and any of the quality
criteria studied.
Table 24. Marketable yield of cauliflower (t/ha) as influenced by soil and/or foliar applied trace element fertilisers (lsd basal =4.24, foliar=2.01)
Treat Basal
Yield (Basal only)
Cont.
16.860
DAP
23.279
All
20.679
-Zn
20.360
-Cu
20.653
-B
19.913
-Mo
20.666
LAU
18.402
Treat Basal +Foliar Yield (Basal +Foliar)
+A11 17.050
+LMo 24.164
+AU 22.954
+Zn 21.509
+Cu 18.413
+B 19.868
+Mo 23.182
+LMo 20.254
All foliar treatments especially +Mo foliar treatments tended to increase the yield over
the counterpart basal treatments, but there was only significant yield increase when Mo
was applied as Na-molybdate to the -Mo basal treatment, which had not received basal
Mo. The lowest yields of treatments receiving basal DAP and foliar trace element was
obtained in the foliar Cu treatment, showing the possibility of Cu toxicity. Soil analysis
results indicate that soil Cu was very high and probably had approached its toxicity
threshold and yield results may confirm this prediction.
Plant composition of the YFEL samples taken before foliar treatment showed no
significant changes with application of basal DAP or trace elements (Table 25). There
has been no report on the trace element composition of cauliflower tissues from work in
Australia (Reuter and Robinson 1997). However, the summary of the trace element
composition of YFEL reported here for general information, fell in the adequate range
of those reported from other countries.
Table 25. Composition of youngest fully expanded leaves (including petioles) of cauliflower cv. Plana at buttoning stageA
P Ca Ms K Na S Zn B Mn Cu Fe (%) (mg/kg)
Mean Maximum Minimum Stand Error
0.38 0.59 0.31 0.03
1.94 3.32 1.11 0.24
0.35 0.63 0.23 0.03
3.22 3.92 2.39 0.12
0.09 0.15 0.06 0.01
0.43 0.51 0.32 0.26
27 38 21 2.7
16 20 12 1.0
64 102 43 7.8
2.9 4.5 1.7 0.42
87 510 46 48
A Curd diameter 2.5 cm+ 0.5 cm.
Dr Ali Salardini and Dr Leigh Sparrow (2001). Final Report of the Trace Elements Project PT 320 to Horticulture Australia Limited. Page 41

The minimum B concentration in YFEL in the treatment without B, was below or near
the critical concentration for deficiency of 25 mg/kg suggested by Gupta (1979) and 11
mg/kg observed by others (Reuter and Robinson 1997), yet there was no response to
basal or foliar applied B.
Molybdenum deficiency was predicted by soil analysis and when basal Mo had not been
applied (eg in DAP basal treatment) a significant increase in yield was attained by a
foliar application of Mo. Where a range of other trace elements was supplied the
response to Mo might have been neutralised probably by Cu presence. Zinc was
predicted by soil analysis to be adequate and was confirmed by the yield results.
6.1.3 Conclusions to the cauliflower basal study
Soil test results predicting Mo deficiency and adequacy of other elements, which were
in conformity with the results of the experiments showed that the test could be
employed for recommendation of trace elements to cauliflower. The reduction of yield
with application of a complete range of trace elements also showed that the common
practice of use of a range of trace element fertilisers without due attention to the soil test
may not always serve as an "insurance policy", but be a liability. Because of the
interaction of trace elements, we concluded that if Mo alone had been applied in this
experiment, the yield increase could have been larger than what was attained.
Plant tissue tests, contrary to what was observed with other crops, and for reason
unknown to us, did not show any response to the high rates of soil-applied trace
elements and P. The tissue and sampling time chosen were conventional.
6.2 Carrots (soil-incorporated sources of B, Zn and Cu)
Trace element fortified trace elements are commonly recommended to carrot crops and
perceived to improve yields but specifically the quality of carrots. Although soil
analysis is conducted for some paddocks prior to sowing, the recommendations are
routine and not always relevant to the test results. During 1993-95 seasons, more than
fifty farms in northwestern Tasmania were contracted by the processing companies to
grow carrots. The soil test results from those paddocks was used to identify two sites for
our investigation. The sites' soil concentrations of Zn, Cu or B were the lowest that
could be found amongst 25 farms available for experiments. The crops at both
paddocks, as recommended to the farmer, would receive 500 kg/ha of commercial grade
14-16-11 (N-P-K + Full trace elements)
Dr Ali Salardini and Dr Leigh Sparrow (2001). Final Report of the Trace Elements Project PT 320 to Horticulture Australia Limited. Page 42

The objectives of this experiment were to study the effect of soil applied Zn, Cu and B
on the yield and quality of carrots on the sites to which normally trace element
fertilisers would have been applied and to compare the efficiency of different sources of
Cu and Zn
6.2.1 Method
Two trials were conducted in commercial carrot crops in northwestern Tasmania near
Devonport (41 ° 12' S, 146° 22'E). One of experiments (TE-4) was established in Jan
1994 at Kindred 15 km southwest of Devonport in a paddock with a continuous
vegetable cropping history of potatoes, Brassica crops, peas and poppies. The other
experiment was established on 21 October 1994 at Wesley Vale 8 km west of
Devonport in paddock with a cropping history of long term pasture and potato. The soils
at both sites were deep clay loam ferrosol and were situated on flat well-drained land.
The cultivars sowed were Frantes at Wesley Vale and Red Flame at Kindred. Soil
analysis was conducted by two laboratories and the results are reported in Table 26.
Table 26. Topsoil (0-150 mm) test results from carrot experiments at Kindred and Wesley vale analysed by DPIWE and Thrive-Ag laboratories.
Lab Site PH OC P K Fe Zn Cu Mn B Mo
DPIWE Kindred 6.6 4.6 173C 242C 36 2.6 3.21 37 1.52 _
Ad Hi Hi Ad Ad Ad Hi Ad Ad Thrive- Kindred 6.6 6.3 10.5O 240 E 252 E 5.03 6.4 157 1.35 0.46 Ag Ad VHi Marg Ad Hi VHi VHi VHi Marg VLo DPIWE Wesley 6.5 3.2 125 C 248 C 85 1.07 0.58 64 1.35 -
vale Ad Ad Ad Ad Ad Marg Marg Ad Ad Thrive- Wesley 6.6 3.9 8.5 0 258 E 253 5.0 6.9 170 1.6 0.17 Ag vale Ad Hi Marg Ad VHi VHi VHi VHi Ad VLo
For abbr eviations seeTa ble22
At Wesley Vale, prior to planting, 500 kg/ha of commercial grade 14-16-11 (N-P-K)
and the experiment trace elements were broadcast or sprayed on the plots and were
incorporated into the top 150 mm topsoil. In a randomised block design 8 treatments
consisting of control (no trace element) a complete fertiliser and 3 sources each of Zn
and Cu were employed with four replicates. Boron was applied only as Solubor,
whereas Zn and Cu were each applied as chelate, lignate or sulfate (Table 27). The rates
of Zn and Cu were chosen based on the common recommendation for those compounds.
Dr Ali Salardini and Dr Leigh Sparrow (2001). Final Report of the Trace Elements Project PT 320 to Horticulture Australia Limited. Page 43

Table 27. The composition and amounts of fertilisers used in the carrot experiment
Sources A Solubor (B)
Supa copper (CuC)
Supa zinc + (ZnC)
Cu-Lignate (CuL)
Zn-Lignate (ZnL)
CUSO4. H 2 0 (CuS)
ZnS04
•7H20 (ZnS)
Element (kg/ha) 2 1 2 1 2 10 20
AFor more information about these fertilisers see Table 1.
At Wesley Vale on 19 January 1995, when roots were about 10 mm in diameter and 100
mm long (mid-growth), tissue samples were taken. Twenty plants were pulled
randomly, and their tops were removed, washed, dried, ground and analysed for the
major and trace elements. The experiment site was harvested on 2 March 1995.
At Kindred the trace elements treatments consisted of a control and 6 different lignate
fertiliser solutions (Table 28) at rates recommended by the supplier. Prior to sowing of
carrots, 500 kg/ha of a commercial grade fertiliser (11-12-19, N-P-K) was broadcast and
the trace element fertilisers were sprayed on the plots and incorporated into the top 150
mm of soil using a disk plough. No plant tissue samples were taken from the Kindred
crop. The crop was harvested on 21 June 1994. For both sites the root quality, including
external, core, shoulder and margin colour, splitting, and deformities were recorded.
6.2.2
Table 28. The composition of lignate fertilisers used at Kindred carrots experiment
AT-.
Treatment Name
Control Full traces [FT]
Deficient treatments [FT]-one trace element Complete
Description
No basal trace element fertiliser 25 L liquid lignate trace element fertiliser, providing (in kg/ha) 1.125 Cu, 1.875 Zn, 0.187 Mo and 0.878 B Four treatments, each providing three of the four trace elements Zn, Cu, Mo or B. NPK + trace elements
For more information on the composition of fertilisers see Table 1.
Results
At Kindred, where all trace elements were in lignate form, there was no response to the
application of any trace element, even Mo that was identified to be deficient by Thrive-
Ag. At Wesley Vale where soil Cu and Zn where diagnosed to be marginally low, there
were yield increases with application of Zn and Cu, but not from all sources (Figure 8).
Application of Cu-sulfate, Cu-lignate and Zn-sulfate increased the yield by 23,26 and
Dr Ali Salardini and Dr Leigh Sparrow (2001). Final Report of the Trace Elements Project PT 320 to Horticulture Australia Limited. Page 44

28% respectively. Boron and other sources of Zn tended to increase yield, but the
differences were not significant at 5% probability level.
100 -t
(0
80
60
40
20 •
0
I
r^ _ ! _ 1_T_1 _J_ - k-|_^ k-]_^ k-|_^ ^
Nil B ZnS ZnC ZnL CuS CuC CuL
Fer t i l iser
Figure 8. Effects of soil applied trace elements on yield of carrots at Wesley vale. Cu and Zn were applied in sulfate (S), chelate (C) and lignate (L) forms.
"3) E
UJ u. >-£ C O IB
2 C 0) u c o o
30
25
20
15
10
5
0
ns
I ill
ICu DZn
ft ft "ft
III 1 W Nil B ZnS ZnC ZnL CuS CuC CuL
Trace element fertiliser
Figure 9. Effects of soil applied trace elements on Zn and Cu concentration in the YFEL of carrots at Wesley vale. Cu and Zn were applied in sulfate (S), chelate (C) and lignate (L) forms.
Dr Ali Salardini and Dr Leigh Sparrow (2001). Final Report of the Trace Elements Project PT 320 to Horticulture Australia Limited. Page 45

Concentrations of Cu in YFEL were not affected by application of any of the fertilisers
and remained at about 8 mg/kg (Figure 9). The concentration of Zn was only increased
in the ZnSC>4 treatment that produced the highest yield in the experiment (Figure 9).
Carrot root quality was not affected by any treatment in either experiment.
6.2.3 Conclusions to the carrot basal study
The resposes attained in this experiment were the only yield resposes observed to
application of Zn or Cu in many experiments conducted on different vegetable crops.
The condition of the experiment was somehow different from other experiments in that
the DTPA soil test for Zn and Cu indicated that the soil was marginally low in both
those elements and the fertilisers at high rates were incorporated into the soil prior to
planting. The efficiency of different sources of trace elements is difficult to study,
because they are not applied at same rate. The rates we employed in these and most
other experiments were those recommended by the suppliers and were near to the rates
recommended in the literature. Whether the rate employed for the other sources has
been the cause of the lack of response is not known at this stage.
6.3 Broccoli
6.3.1 Method
This experiment (TE-6) was established at Kindred on a commercial crop. The crop
beyond the experiment area received 750 kg/ha of 14-16-11 with trace element
supplement (Table 1), and two foliar of a complete foliar fertiliser containing both
major and trace elements (Top Foliar). The DPI WE soil analysis (Table 29) did not
show any need for the use of trace elements. However, Thrive-Ag soil test indicated
Mo, B and Zn deficiencies. This experiment was conducted to study the yield and
quality responses of the crop to trace elements
The experimental design was a randomised block design with 7 treatments and four
replicates. The treatment consisted of a control, a full lignate traces, four treatments
deficient in one of the trace elements (see Table 28 for more information) and a
treatment receiving trace element supplement, 5 kg of mineral trace elements as for the
commercial crop.
Dr Ali Salardini and Dr Leigh Sparrow (2001). Final Report of the Trace Elements Project PT 320 to Horticulture Australia Limited. Page 46

Table 29. Topsoil (0-200 mm) analysis results of site used for broccoli experiment
Lab. pH water
Organic C %
P K B Mo Zn Cu Mn Lab. pH water
Organic C % (mg/kg)
Thrive-Ag 5.48 5.8 11.3 281 0.75 0.13 4.1 4.67 122 VLo VHi Marg Ad Lo VLo Marg Ad Hi
DPIWE 5.9 4.4 89 300 1.30 2.28 2.1 53 Lo Ad Marg Ad Ad Nd Ad Ad. Hi
AMethods of soil analysis are described in s section .4.5. Abbreviations: Ad = Adequate, Hi = High, Marg = Marginal, Lo = Low, V = Very; Nd, not determined
Before transplanting of broccoli cultivar Marathon on 9 February 1994, the basal NPK
fertiliser (750 kg/ha 14-16-11) and the trace elements were broadcast or sprayed on the
soil and incorporated into the top 150 mm of soil. Plant tissue samples, whole YFEL,
were taken at head initiation on 25 March 1994.
The crop was harvested sequentially four times from 22 to 29 April 1994 as heads
reached marketable size and the weight and the quality of heads were recorded. The
main harvest date was on 26 April. The head quality factors, hollow heart, colour,
browning, starring, compactness and presence of bracts were ranked 1 to 5. A rank of 1
represented desired and 5 most undesired quality. The mean ranking of all quality
criteria was then calculated.
6.3.2 Results
Application of fertiliser containing all trace elements in either mineral or lignate form
did not influence the yield, but when the fertiliser was deficient in either Zn, B or Mo
yield was reduced by up to 20% (Figure 10). When Cu was omitted from the mix, there
was no yield reduction. This indicated that Cu toxicity might have been the cause of
yield reduction, and application of a balanced blend reduced the damage caused by Cu.
However, this argument is not supported by tissue composition, since there was no
effect of fertiliser treatments on the concentration of any of trace elements (data not
shown). Trace element treatments did not influence the quality of carrot roots except
when all trace elements were applied as lignate, which the mean quality was reduced.
Dr Ali Salardini and Dr Leigh Sparrow (2001). Final Report of the Trace Elements Project PT 320 to Horticulture Australia Limited. Page 47

6.3.3 Conclusions to the Broccoli basal study
As was reported above for other vegetable crops it appears that application of Cu to the
soil adequate or high in Cu may cause reduction in yield and the use of other trace
elements in combination with Cu may reduce the ill effect of Cu.
6.4 Sweet corn
Maize and sweet corn are considered to have a high demand for Zn and would benefit
from Zn application when soil DTPA extractable Zn is about 1 mg/kg or lower. The site
in this trial had been identified as Zn and B deficient after the first soil analysis report
was received from the Incitec Laboratory. Soil sampling was repeated from the
experiment area and was analysed by our laboratory. The results are reported in Table
30. Analyses from, both laboratories indicate that soil Zn levels were not adequate. In
most soils, band-placed fertilisers are more efficiently utilised by crops than when
applied as broadcast. The objective of this experiment was to study the effects of band-
placed B and Zn fertilisers on yield and quality of sweet corn.
Figure 10. Effect of complete lignate or mineral fertilisers and omission of one trace element on marketable yield of Broccoli at Kindred
Dr Ali Salardini and Dr Leigh Sparrow (2001). Final Report of the Trace Elements Project PT 320 to Horticulture Australia Limited. Page 48

Table 30. Soil analysis results from sweet corn experiment at Merseylea (TE-5)
6.4.1
Lab pH water
OC (%)
Fe Zn Cu Mn B Mo Lab pH water
OC (%) (mg/kg)
DPIWE 5.7 2.2 282 1.29 1.05 48 0.26 _
Acid Lo Ad Marg Hi Ad Ad Incitec 5.2 1.7 0.5 1.2 32 0.33 0.28
Acid Lo Nd Lo Hi Ad Lo VLo
^Methods of soil analysis are described in section 1.4.5. Abbreviations: Ad = Adequate, Hi = High, Marg = Marginal, Lo = Low, V = Very; Nd, not determined
Sweet corn, cultivar Jubilee, was sown on 14 November 1994 with row spacing of 800
mm and intra-row spacing of 250 mm, giving rise to 4.6 plants/m^. Trace elements, at
the rate given in Table 31, were uniformly mixed with 1 kg wetted attapulgite clay and
2 kg of a commercial grade 14-16-11 fertiliser (equivalent to 700 kg/ha) and band-
placed at sowing. Plot dimensions were 4.8 by 6 m and contained six plant rows.
Table31. The composition and amounts of fertilisers used in the sweet corn experiment
Sources A
- > •
Solubor (B)
«»*fi 5S
Supa zinc + (ZnC)
Zn-Lignate (ZnL)
Zn-Lignate (ZnL)
ZnS0 4
•7H20 (ZnS)
ZnS04 •7H20 (ZnS)
Control
Element (kg/ha) - »
1 0.5 1 0.5 1 10.5 21 No Trace
A For more ii lformatior i about th iese ferti isers see r fable 1.
On 2 February 1995, when plants were at tasselling stage, the leaves below and opposite
primary cobs were sampled, dried and ground. Copper and Zn were determined by AAS
procedure.
On 10 March 1995, all primary and secondary cobs from 26 plants on two middle rows
were handpicked. Cob weights with and without husk and cob quality including length,
diameter, row-evenness and tipfill were determined for both primary and secondary
cobs.
Dr Ali Salardini and Dr Leigh Sparrow (2001). Final Report of the Trace Elements Project PT 320 to Horticulture Australia Limited. Page 49

18
2 . 17
Basal trace e lement t reatment
Figure 11. Effect of rate and source of basal trace elements on yield of primary cobs of sweet corn
6.4.2 Result
The soil B was diagnosed to be adequate by us and low by the commercial laboratory
(Table 30). Application of B tended to increase primary cob yield, but the differences
were not statistically significant (Figure 11). Boron addition did not influence the
secondary and total yields either.
Application of 0.5 kg Zn as lignate increased the primary cob yield slightly (5%) and
doubling the rate tended to decrease the yield. Zn chelate reduced the primary yield and
had no effect on the secondary cob yield. The highest decrease in yield (6%) occurred
when 1 kg Zn was applied as chelate. At tasselling stage in that treatment leaves were
pale in colour and some showed tip and edge-burns. No toxicity symptom was observed
in any other treatment. Zinc sulfate did not have any effect on either primary or
secondary cob yield.
Mean Zn concentration in YFEL was high in all treatments (74 mg/kg), but in the
adequate range reported by Jones et al. (1991). The concentration of Zn in YFEL in the
treatment which received 1 kg Zn/ha as chelate, was 137 mg/kg, 3 times that of the
control (Figure 12). From these results, it was concluded that the reduction of yield in
the Zn chelate treatment was due to Zn toxicity. YFEL Zn concentration in the ZnCh
treatment was also higher than other treatments.
Dr Ali Salardini and Dr Leigh Sparrow (2001). Final Report of the Trace Elements Project PT 320 to Horticulture Australia Limited. Page 50

160
f 120 "5) E, Qj 80 LL >-C c 40 N
I I
RH»| H Fl a M*
i
a
' — i — '
b
• — i —
c a 9 >t
' — i — ' 1
a
No ZnS1 ZnS2 ZnC1 ZnC2 ZnL1 ZnL2 B trace
Basal trace element treatment
Figure 12. Zn concentration in YFEL at tasselling stage of sweet corn as influenced by B and Zn application.
Application of Zn did not influence Cu concentration in YFEL. Even in the ZnC2
treatment with symptoms of Zn toxicity, the Cu concentration (8.6 mg/kg) remained
similar to that in other treatments.
6.4.3 Conclusions to the sweet corn basal study
In this experiment there was no relationship between the YFEL concentration of major
and trace element and yield or the quality of sweet corn. The critical deficiency
concentration of soil HWSB may vary with crops. As reported by Srivastava and Gupta
(1996), while the HWSB of 0.5 mg/kg may be considered to be deficient for Brassica
crops, other crops such as corn, potatoes, legumes and cereals do not respond to B
application at soil B concentrations above 0.1 mg/kg.
Synthetic chelates of Zn are the most effective Zn sources and are 3-5 times more
effective than ZnS04 (least efficient) for many crops (Mortvedt and Gilkes 1993).
Natural organic complexes such as Zn lignate used in this experiment are somewhere in
between those sources (Mortvedt and Gilkes 1993). If increases in plant tissue Zn could
be taken as an index for the availability of Zn from different sources, Zn chelate would
be more than 30 times more available than the same amount of Zn from the ZnSO.
source.
Dr Ali Salardini and Dr Leigh Sparrow (2001). Final Report of the Trace Elements Project PT 320 to Horticulture Australia Limited. Page 51

Although the critical concentration of Zn in plant tissue varies with plant species and
the tissue (Mortvedt and Gilkes 1993), it remains about 20 mg/kg in YFEL and young
leaves. The concentration of Zn in YFEL of control plots in this experiment was more
than two folds greater than those reported in the literature and there was still a yield
response to the application of Zn lignate. The soil Zn test indicating a deficiency was in
conformity with yield response observed. The lack of response to Zn chelate might have
been due to the phytotoxicity of chelate, but inefficiency of 10 or 20 kg Zn as Zn SO4 is
difficult to explain.
6.5 Potatoes 6.5.1 Methods
Four field experiments investigating the effects of basal or basal in combination with
foliar trace element applications were completed in 1993/95. Each experiment was a
randomised block, split-plot experimental design with 5 replicates. Three sites (Morris
and Langton and Radcliff) were on ferrosols at Kindred, Sunnyside and Wesley Vale
respectively, and the other, Winton, was on wind-blown sand about 10 km north of
Campbell Town. Some site characteristics are shown in Table 32
Basal inorganic trace element (BTE) fertilisers plus one commercial lignate mixture
were main plots, and foliar trace elements from lignate or partly chelated source were
sub-plots. Main plot size was six rows by 12 m. The basal treatments are shown in
Table 33.
Dr Ali Salardini and Dr Leigh Sparrow (2001). Final Report of the Trace Elements Project PT 320 to Horticulture Australia Limited. Page 52

Table32. Some site characteristics.
SITE pH
1:5 H20 EC
dS/m Colwell
P (mg/kg)
Colwell K
(mg/kg)
OrgC (%)
DTPA-Cu
(mg/kg)
Winton Wesley Vale Morris Langton
6.1 6.4 6.5 6.3
0.06 0.12 0.05 0.06
5 115 127 32
146 450 194 401
0.8 5.5 4.8 5.0
0.6 1.4 2.5 2.1
Thrive-AgCu
DTPA-Zn
Thrive-AgZn
(mg
HWSB
/kg)
Thrive-AgB
Thrive-AgMo
Winton Wesley Vale Morris Langton
1.12
6.06 6.33
0.6 0.9 2.1 2.5
0.48
3.63 3.72
0.3 1.5 1.3 1.7
0.04
1.26 1.34
0.21
0.11 0.18
Table33. Basal treatments
Treatment Composition
Nil No trace element All Containing Cu, Zn, Mo and B applied as follow:
10 kg Cu/ha as coarse crystalline (2-5 mm) copper sulfate (25% Cu) 20 kg Zn/ha as granulated (2-3 mm) zinc oxysulfate (35% Zn) 0.46 kg Mo/ha as fine ground sodium molybdate (46% Mo) 4.0 kg B/ha as granulated (2-3 mm) sodium tetraborate pentahydrate (14%B)
-Zn As for All but without Zn -Mo As for All but without Mo -B As for All but without B -Cu As for All but without Cu Lignate A commercial liquid mix supplying (in g/ha) 310 Zn, 7 B, 190 Cu
and 31 Mo
The inorganic BTE were broadcast on cultivated soil a few days before final cultivation
and planting (Table 34). Lignate was applied as a spray to soil at the recommended
lOL/ha.
FTE were applied either as lignate TE (Morris and Langton) or as partly-chelated TE
(Winton), at rates recommended by the suppliers (3.47 L/ha) (Tables 34, 35).
The banded, broadcast and foliar Zn experiment (Radcliff) conducted at Wesley Vale
was planted using a Faun planter. Three rates of Zn (2.5, 5.0 and 10.0 kg Zn/ha) as zinc
Dr AH Salardini and Dr Leigh Sparrow (2001). Final Report of the Trace Elements Project PT 320 to Horticulture Australia Limited. Page 53

sulfate were either broadcast on cultivated soil and incorporated using a rotary hoe prior
to planting or band placed with NPK at planting. The foliar treatment was a double
spray applied to plots, which had received no other Zn. Irrigation, pest and disease
management on all sites was by the growers. The growers applied no trace elements.
Table 34. Timetable of operations
SITE BTE Planting Petioles FTE Harvest applied date sampled applied date
Winton 15/10/93 19/10/93 15/12/93 17/12/93 13/4/94 Radcliff 26/10/94 13/12/94 13/12/94 27/4/95 Morris 3/11/93 20/11/93 6/1/94 13/1/94 13/1/94 Langton 10/11/93 13/11/93 4/1/94 12/1/94 11/5/94
For Radcliff the second petiole sampling and foliar application was on 4/1/95
Table 35. Rates of foliar applied trace elements in g/ha
SITE Cu Zn B Mo
Winton 210 260 350 2.0 Radcliff 300 400 300 -
Morris 190 240 26 90 Langton 190 240 26 90 Lignate (all sites) 190 310 7 31
Zn and Cu applied as EDTA complex and B as Solubor.
Crops were planted by growers using their normal commercial seed, fertiliser, and
machinery. The subsequent irrigation, pest and disease management were also
conducted by the growers. No trace elements were applied by growers.
Forty petioles of youngest fully expanded leaves (P-YFEL) were sampled from each of
the inner rows of each main plot just prior to application of FTE, when the largest tubers
were 5-20 mm long. Petioles were dried at 70°C, ground in a stainless steel mill, and
analysed for B and Zn by ICP emission spectroscopy, and for Cu, Zn and Mo by atomic
absorption spectrometry (AAS).
At harvest, the middle 4 m of two inner rows from each sub-plot was harvested, except
at Winton. At Winton variable plant density due to poor emergence and rhizoctonia
unrelated to treatments (these could also be seen elsewhere in the commercial paddock)
restricted us to as little as 4 m of row in total in some sub-plots, and necessitated the
exclusion of 8 sub-plots from the experiment.
Dr Ali Salardini and Dr Leigh Sparrow (2001). Final Report of the Trace Elements Project PT 320 to Horticulture Australia Limited. Page 54

Total tuber yield from each sub-plot was recorded, and tubers were then graded into five
grades of lOOg, 100-280g, 280-450g, >450g and misshapen. Weights and numbers in
each grade were recorded, and a 5 tuber subsample from the 280-450 g grade taken for
quality assessment, which consisted of determination of specific gravity (SG), bruising
index and crisp colour.
6.5.2 Results
Very few significant differences between treatments were observed at any of the sites
(Tables 36, 37, 38). Perhaps the most important was at Winton where it appears that
basal application of B induced B toxicity (Table 36). Petiole B was lowest in the
absence of basal B (nil and -B treatments), while processing yield was highest in these 2
treatments (Table 36). Total yield was also highest in these treatments at this site, but
the differences between treatments were not statistically significant. Pregno and Armour
(1992) showed that 8 kg B/ha, when banded with NPK fertiliser, induced B toxicity in
Sebago potatoes grown on a ferrosol in north Queensland, while only 2 kg B/ha
increased yield by 38% compared with no B. This shows the fine line between B
deficiency and toxicity. We had not expected 4 kg B/ha broadcast to be toxic, especially
where the soil hot water B was only 0.3 mg/kg (Table 32), but the Winton site was very
sandy, which would have aided B mobility and uptake compared with a ferrosol. Pregno
and Armour (1992) showed that 19 mg B/kg in YFEL 7 weeks after planting was
deficient, 24-26 mg B/kg was sufficient and more than 30 mg B/kg was toxic (Table
39).
Table 36. Some results from Winton (TE9)
Treatment Nil All -Zn -B -Cu -Mo Lign ate
lsd 0.05
Proc Yield Bruise index Internal browning SG Petiole Zn Petiole B
42.0 3.4 0.50 1.082 57 21
35.7 2.4 0.05 1.083 57 30
38.1 2.9 0.28 1.081 57 30
43.7 2.9 0.25 1.079
28.2 2.8 0.33 1.084
32.9 2.7 0.10 1.082 64 28
32.5 2.5 2.10 . 1.079 58 25
8.01 0.45 0.99 0.004 NS 4.4
Proc Yield Bruise index Internal browning SG Petiole Zn Petiole B
42.0 3.4 0.50 1.082 57 21
35.7 2.4 0.05 1.083 57 30
38.1 2.9 0.28 1.081 57 30
62 23
54 30
32.9 2.7 0.10 1.082 64 28
32.5 2.5 2.10 . 1.079 58 25
8.01 0.45 0.99 0.004 NS 4.4
All yields in t/ha; all petiole concentrations in mg/kg dm. Shading shows significant treatments.
Dr Ali Salardini and Dr Leigh Sparrow (2001). Final Report of the Trace Elements Project PT 320 to Horticulture Australia Limited. Page 55

Table 37. Some results from Langton (TE8)
Treatment Nil All -Zn -B -Cu -Mo Lignat e
lsd 0.05
Proc Yield 44.2 48.7 47.8 48.1 45.3 45.0 43.6 NS Yield 100-280g 31.1 32.8 28.4 30.7 32.8 25.5 26.4 4.81 Yield 280-450g 8.0 9.4 11.3 10.4 7.5 12.0 10.1 2.97 Bruise index 5.4 5.6 5.5 5.2 5.5 5.6 5.4 NS SG 1.089 1.089 1.087 1.089 1.090 1.090 1.088 NS Petiole Cu 5.2 5.4 5.4 5.3 5.0 5.5 5.5 NS Petiole Zn 101 101 89 82 82 91 90 NS Petiole B 23 24 24 23 24 23 25 NS Petiole Mo 0.27 0.37 0.38 0.43 0.39 0.31 0.42 NS Petiole Cd 0.79 0.80 0.75 0.69 0.75 0.72 0.76 NS
All yields in t/ha; a ill petiole concentrations in me/kg dm. Shading shows significant treatments.
At Winton, there was a high incidence of misshapen tubers, and spraying per se
increased the yield of misshapen tubers from 11.9 to 14.6 t/ha. At Morris, application of
Zn decreased the yield of large (>450g) tubers (Table 38), but only by a small amount,
and without affecting the processing yield (Table 38). Similarly, at Langton, it appeared
that application of everything but Mo shifted some yield from 100-280 g tubers to 280-
450 g tubers (Table 37), although processing yield was unaffected. There were no other
notable effects of BTE or FTE on yield or its components at any site.
There were inconclusive effects of BTE on SG at Winton and Morris (Tables 36 and
38). BTE which contained everything but Cu gave the highest SG at these sites, while
BTE which had everything but B gave the lowest SG (Tables 36 and 38). At Morris, the
subsequent follow up spray with lignate TE (both the complete commercial mix and -
Zn) depressed SG significantly (P<0.05) where lignate sprays of other treatments did
not (Table 40). These effects are difficult to explain. SG at all sites was quite
acceptable.
Application of BTE decreased bruising at Winton (Table 36), but the magnitude of the
decrease was of little commercial importance. At Langton, the follow up spray with the
commercial lignate mix decreased the incidence of bruising (P=0.04) compared with the
other lignate sprays, but again the magnitude of the decrease was small (Table 41). Also
at Winton, Lignate trace elements applied as a basal dressing gave a higher incidence of
tuber internal browning (Table36), while reapplication of the Lignate trace elements as
a foliar spray increased the incidence of hollow heart from 0.01 to 0.76 (P=0.058, Table
Dr Ali Salardini and Dr Leigh Sparrow (2001). Final Report of the Trace Elements Project PT 320 to Horticulture Australia Limited. Page 56

42). Other FTE had no significant effect on hollow heart relative to their BTE
counterparts (Table 42).
Table 38. Some results from Morris (TE-7)
Treatment Nil All -Zn -B -Cu -Mo Ligna te
lsd 0.05
Proc Yield 43.6 43.0 44.8 45.6 45.0 45.0 45.7 NS >450g 3.8 3.3 4.4 2.5 3.0 2.9 3.0 1.01 Bruise index 5.9 5.9 6.3 6.1 5.5 6.3 6.0 NS SG 1.092 1.092 1.091 1.090 1.095 1.090 1.091 0.003 Petiole Cu 4.4 4.5 4.3 4.5 4.3 4.9 4.6 NS Petiole Zn 67 65 57 73 70 71 71 NS Petiole B 24.0 23.9 23.9 23.9 23.3 23.5 24.0 NS Petiole Mo 0.39 0.39 0.40 0.41 0.46 0.31 0.34 NS Petiole Cd 1.31 1.27 1.20 1.15 1.25 1.29 1.33 NS
All yields in t/ha; all petiole concentrations in mg/kg dm. Shading shows significant treatments.
Apart from B at Winton, there were no significant effects of BTE on petiole TE or Cd
concentrations in P-YFEL (Tables 36, 37, 38), although there was a tendency for
treatments lacking a certain element to be lower than others containing it. It appears that
on the ferrosols especially, broadcast BTE were not very effective at increasing petiole
micronutrient concentrations, which may reflect immobilisation in these soils. Applied
rates which were at the high end of the range of rates broadcast to good effect on other
crops elsewhere (Martins and Westermann, 1991) to try and counter this sort of effect,
but perhaps did not go high enough. Banding a lower rate of these fertilisers may have
proved more successful than broadcasting, but would have meant much more work in
experiment establishment. Using fine ground rather than coarse or granulated sources of
Cu, Zn and B, and using the more soluble ZnS04 instead of Zn oxysulfate may also
have been better.
Dr Ali Salardini and Dr Leigh Sparrow (2001). Final Report of the Trace Elements Project PT 320 to Horticulture Australia Limited. Page 57
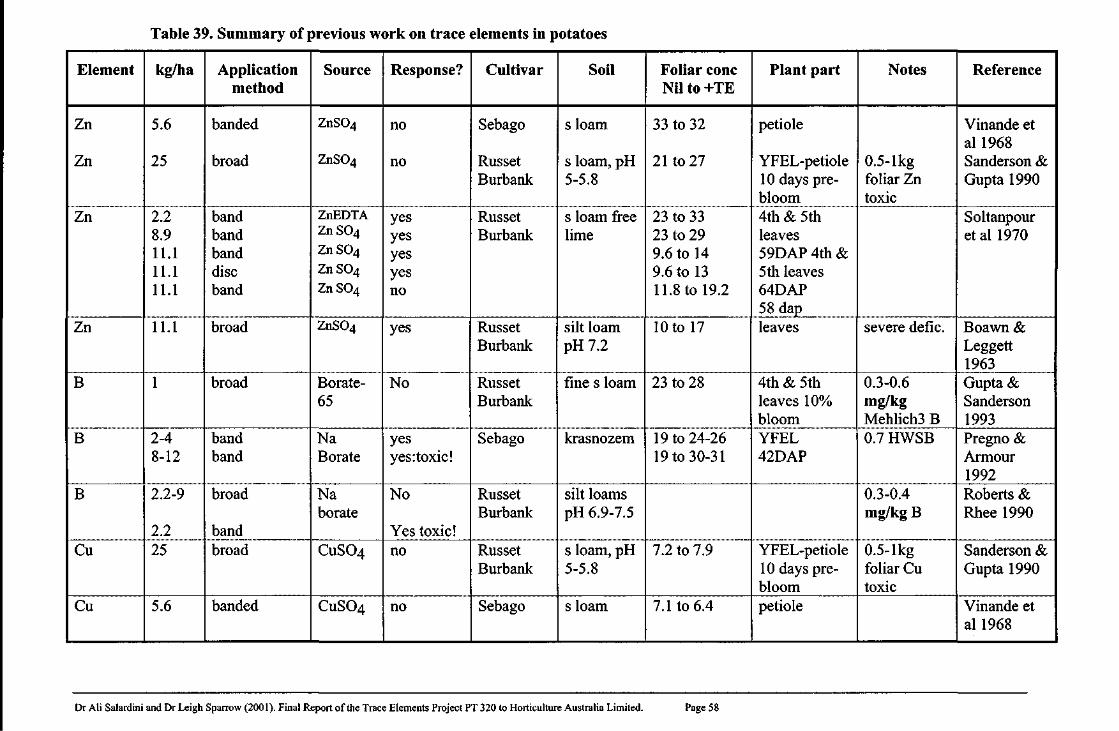
Table 39. Summary of previous work on trace elements in potatoes
Element kg/ha Application method
Source Response? Cultivar Soil Foliar cone Nil to +TE
Zn
Zn
5.6
25
banded
broad
ZnS04
ZnS04
no
no
Sebago
Russet Burbank
s loam
s loam, pH 5-5.8
33 to 32
21 to 27
Zn 2.2 8.9 11.1 11.1 11.1
band band band disc band
ZnEDTA Z n S 0 4
Z n S 0 4
Z n S 0 4
Z n S 0 4
yes yes yes yes no
Russet Burbank
s loam free lime
23 to 33 23 to 29 9.6 to 14 9.6 to 13 11.8 to 19.2
Zn 11.1 broad ZnS04 yes Russet Burbank
silt loam pH7.2
10 to 17
B 1 broad Borate-65
No Russet Burbank
fine s loam 23 to 28
B 2-4 8-12
band band
Na Borate
yes yes:toxic!
Sebago krasnozem 19 to 24-26 19 to 30-31
B 2.2-9
2.2
broad
band
Na borate
No
Yes toxic!
Russet Burbank
silt loams pH 6.9-7.5
Cu 25 broad CuS04 no Russet Burbank
s loam, pH 5-5.8
7.2 to 7.9
Cu 5.6 banded C11SO4 no Sebago s loam 7.1 to 6.4
Dr Ali Salardini and Dr Leigh Sparrow (2001). Final Report of the Trace Elements Project PT 320 to Horticulture Australia Limited. Page 58

Table 40 Effect of spraying on specific gravity at Morris
Treatment BTE only BTE+FTE
Lignate - All All -Zn -B -Cu -Mo
1.093 1.089 1.092 1.089 1.089 1.096 1.092
Lignate - All All -Zn -B -Cu -Mo
1.092 1.093 1.092 1.094 1.089
1.089 1.092 1.089 1.089 1.096 1.092
lsd 0.05 = 0.0038 (shading indicates significant differences)
Table 41. Effect of spraying on bruising at Langton
Treatment BTE only BTE+FTE
Lignate - All All -Zn -B -Cu -Mo
5.99 A81 5.56 5.65 5.43 5.20 5.57
Lignate - All All -Zn -B -Cu -Mo
5.53 5.36 4.96 5.70 5.55
A81 5.56 5.65 5.43 5.20 5.57
lsd 0.05 = 0.755 (shading indicates significant differences)
Table 42. Effect of spraying on hollow heart at Winton
Treatment BTE only BTE+FTE
Lignate - All 0.01 '/*-
0.76 All 0.01 0.01 -Zn 0.07 0.07 -B 0.21 0.46 -Cu 0.01 0.01 -Mo 0.21 0.21
lsd 0.05 within treatment = 0.40
Although it appears that the BTE were not effective on the ferrosols, the petiole
Zn and B concentrations in the nil treatments at Morris and Langton suggest that
responses to these elements would have been unlikely. Critical deficiency levels
for Zn and B observed elsewhere for potatoes have been 20-30 mg Zn/kg and <20
mg B/kg (Table39), below the concentrations observed at our sites, although
direct comparisons with this data are difficult because of differences in plant part
and age at sampling. However, we also applied extra of all elements as FTE which
should have elicited any response not given by BTE. While 2 foliar applications
Dr Ali Salardini and Dr Leigh Sparrow (2001). Final Report of the Trace Elements Project PT 320 to Horticulture Australia Limited. Page 59

are often needed for maximum yield, one spray still provides a measurable
response (Soltanpour et al. 1970). We are therefore reasonably confident that no
positive yield responses to B and Zn were seen at these sites because none were to
be had in this season. We did not sample petioles after spraying because of
restrictions on labour and laboratory resources, and because of the uncertainty
about surface residues masking true uptake.
Table 43. Petiole micronutrient concentrations (mg/kg) for NE Tasmanian Russet Burbank crops in 1993/4.
Sample Zn B Sample Zn B
1 45 27 10 43 26 2 30 27 11 44 28 3 36 21 12 33 18 4 44 18 13 32 29 5 71 20 14 45 26 6 32 21 15 43 28 7 40 21 16 42 20 8 48 25 17 31 23 9 51 27
Shaded cells have either Zn < 30 mg/kg or B < 20 mg/kg
Table 44. Petiole micronutrient concentrations (mg/kg) for 35 NW Tasmanian Russet Burbank crops in 1993/4.
Sample Zn B Sample Zn B
8 12 10 33 32 16 12 27 43 26 8 12 11 30 32 16 12 28 37 29 8 12 12 39 31 16 12 29 51 33 8 12 13 40 26 16 12 30 17 32 8 12 14 69 30 16 1231 55 30 8 12 15 84 28 16 12 33 64 27 9 12 27 45 25 16 12 34 88 27 9 12 28 55 26 16 12 35 28 19 91231 60 31 16 12 36 37 33 9 12 32 60 31 16 12 37 55 26 9 12 33 49 31 16 12 38 38 33 9 12 34 21 31 16 12 39 42 28 9 12 35 40 28 20 12 19 45 27 13 12 01 47 30 20 12 20 49 30 13 12 02 40 25 20 12 21 40 30 13 12 03 41 29 20 12 22 69 24 13 12 04 64 26 20 12 23 37 28 13 12 05 57 29
Shaded cells have either Zn < 30 mg/kg or B < 20 mg/kg
Dr Ali Salardini and Dr Leigh Sparrow (2001). Final Report of the Trace Elements Project PT 320 to Horticulture Australia Limited. Page 60

There is very little data elsewhere on either petiole or yield responses to Cu (Table
39) and none on Mo. Our petiole data suggest that >4 mg Cu/kg and >0.3 mg
Mo/kg is adequate, but these are tentative conclusions at this stage. The low rate
of foliar Mo applied at Winton (Table 36), due to miscalculation, may have
restricted a Mo response. We need to see the petiole Mo concentrations before
judging this further.
A number of petiole samples from commercial crops in the NE and NW were
analysed for micronutrients to see how representative our experiment sites were.
The analyses of commercial crops are shown in Tables 43 and 44. The data from
commercial potato crops suggest that last year only a small proportion of them
were likely to respond to B or Zn, and further, that many were well in the
sufficiency range for these elements. This is especially so given that several of the
NE samples were from crops with largest tubers 25 to 70 mm long (M Coote,
pers. comm.). These potatoes would likely have had higher petiole B and Zn when
they were at a stage comparable with our experiment samples (5-20 mm).
At Radcliff site, there was no effect of Zn application by any method on yield
(Figure 13) or quality (data not shown), although banded Zn increased petiole Zn
concentrations and broadcast Zn tended to do the same (Figure 14). Analysis of
the leaf lamina separate from the petioles showed no such pattern (Figure 14).
Because Zn has been shown to affect Cd uptake, tuber and petiole Cd were
measured, but there was no effect of Zn in this experiment on these measures
(Figures 15).
6.5.3 Conclusions to the potato basal experiments
Three basal experiments in one season are only a limited sample. Nevertheless,
when taken alongside the results of foliar experiments and the analyses of petioles
from commercial Tasmanian crops, the results from these experiments indicate
that responses by potatoes to B and Zn are unlikely to be widespread in Tasmania.
They also sound a warning that B toxicity is possible on sandy soils. We may
need to rethink interpretation criteria for micronutrient analyses of soil B and Zn.
Because of the lack of published data on potato responses to Cu and Mo, and the
unavailability yet of petiole Cu and Mo analyses from all of our experiments, it is
Dr Ali Salardini and Dr Leigh Sparrow (2001). Final Report of the Trace Elements Project PT 320 to Horticulture Australia Limited. Page 61

difficult to relate the lack of response to Cu and Mo to the probability of such
responses generally.
80
I ? 6 0
(0
2
o)40 to w d) u o
20 Jl—H—
Nil Foliar 2.5 Broad
5 Broad
10 Broad
10 Band
Fertiliser Zn (kg/ha)
Figure 13.Effect of foliar and different rate of banded (Band) or broadcast (Broad) fertiliser Zn on yield of potatoes at TE-26.
60
45 O)
"3) E
N 0) 3 (0 (A
30
15
Isd 0 05 Lamina and petiole=NS
im
Nil Foliar 2.5 10 2.5 10 Broad Broad Broad Band Band Band
Fertiliser Zn (kg/ha)
Figure 14.Effect of foliar and different rate of banded (Band) and broadcast (Broad) fertiliser Zn on the Zn concentration in petiole (left column of the pairs) and lamina (right column) of potatoes at TE-26.
Dr Ali Salardini and Dr Leigh Sparrow (2001). Final Report of the Trace Elements Project PT 320 to Horticulture Australia Limited. Page 62

Figure 15.Effect of foliar and different rate of banded (Band) or broadcast (Broad) fertiliser Zn on Cd concentration in tuber (column) and lamina (line) of potatoes at TE-26.
7 Project discussion
7.1 Yield or quality response
Because of routine application of trace elements in the past two decades, most
long-established vegetable farms are probably sufficiently supplied with trace
elements Zn, Cu and Mn. The soil analysis results from the commercial soil
laboratories and our own works clearly support this statement. The likelihood of
obtaining a yield or quality response to application of Zn, Cu and Mn in these
farms is therefore very small. Since mobile trace elements such as B and to a
lesser extent Mo, are not accumulated in the soils under normal cropping, only
recent fertiliser application history influences the soil available B and Mo and the
response of crops to these trace elements.
Although we selected sites with the lowest trace element content, in 171
combinations of treatments resulted from foliar and/or basal application of
different sources of four trace element fertilisers to different crops, there was only
9 positive or negative yield or quality responses.
Dr Ali Salardini and Dr Leigh Sparrow (2001). Final Report of the Trace Elements Project PT 320 to Horticulture Australia Limited. Page 63

Table 45. Summary of the yield and quality responses to foliar application of trace elements or plant analysis in predicting crop response to foliar application of trace elements.
Crop Experiment Trace element form Criteria B
Poppy TE-2 Lignate Yield Soil Plant
X
+A Sweet corn TE-5 Lignate Yield
Quality Soil Plant
X
X
+A +A
Broccoli TE14 Lignate, mineral, chelate Yield quality Soil Plant
X
X
Green beans TE-19 Lignate, mineral, chelate Yield Soil Plant
X
+A Green peas TE-18 Mineral Yield
Soil Plant
T -D 0.73 +DA
Potato TE-(20,22,23,24,25,28)
TE-(20,21, 28) TE-(22,23,24,25) TE-(20,22,23,24,25,28)
Lignate, chelate Yield Quality Soil
Plant
X
X
+A0.3 +A +A
Symbols used are f, yield increase; -l, yield decrease; x, no effect on yield or quality; + and -, corre adequate and D in the deficient range. Threshold of deficiency in mg/kg soil taken were DTPA-Zn, potatoes, corn, peas and beans, 0.5 for Brassica crops.
AH Salardini and Leigh Sparrow (2001). Final Report of the Trace Elements Project to Horticulture Australia Limited Page 64

Table 46. Summary of the yield and quality responses to basal application of trace elements B, Z plant analysis in predicting crop response to basal application of trace elements.
Crop Experiment TE form Criteria B
Cauliflower TE-15 Lignate Yield Soil Plant
X
+A2.5 +A
Carrots TE-4 Lignate, mineral, chelate Yield Quality Soil Plant
X
X
+A1.5 +A
Broccoli TE-6 Lignate, mineral Yield Quality Soil Plant
X
X
+A1.3 +A
Sweet corn TE-17 Lignate, mineral, chelate Yield Soil
X
+A0.3 Potato TE-(7, 8, 9) Lignate, mineral Yield
Quality Soil Plant
X
t +A0.3
+A Symbols used are T, yield increase; -l, yield decrease; x, no effect on yield or quality; + and -, correct a in the adequate and D deficient range. Threshold of deficiency in mg/kg soil taken were DTPA-Zn, Cu corn, peas and beans, 0.5 for Brassica crops.
Ali Salardini and Leigh Sparrow (2001). Final Report of the Trace Elements Project to Horticulture Australia Limited Page 65

In a foliar poppy experiment (TE2), when from a complete solution (containing Zn, Cu, B and
Mo), either Zn or Mo was omitted, there was a yield reduction and this was coincided with
high Cu concentration in the YFEL. In a green peas experiment (TE18), the yield increased by
10% with foliar B application and reduced by 20% when Mo solution was sprayed. In the TE-
15 experiment, basal and foliar treatments were combined. In that experiment when Mo was
not included in the basal fertiliser, its foliar application increased the yield of tubers by 12%,
but in the same experiment application of Cu as foliar only, reduced the yield by 12%.
Positive responses (23-28% yield increase) were attained in one of the two carrot sites (TE-4)
with the soil incorporation of Zn or Cu at planting. Similar to the TE-2 experiment,
application of a complete fertiliser mix (containing Major and trace elements) as either foliar
or basal treatment in the TE-6, did not have any effect on yield or quality of broccoli.
However, the mixes containing Cu, but not Zn, B or Mo produced yields about 20% lower
than the control. Sweet corn in the TE-17 experiment showed quality improvements with 0.5
kg Zn-chelate/ha, but at 1 kg Zn-chelate/ha, there was a 6% reduction in yield and
development of tip and edge burning and leaf yellowing.
In all 11 potato experiments, there was no significant yield response, minor quality responses
to basal, foliar and combinations of basal and foliar applications of trace elements, except at
TE-9. In that experiment, the broadcast dressing of a trace element mix containing 4 kg B/ha
prior to planting of Russet Burbank potatoes, produced a yield 8 t/ha (20%) less than when B
was not included in the mix.
7.2 Soil tests
This study showed that, when the interpretation criteria presented in the recent Australian soil
analysis manual (Peverill et al. 1999) were used, soil analysis gave reasonable predictions of
soil trace element status. The predictions were more accurate where crop species and soil
group were taken into account.
Of the 7 non-potato sites with soil Zn-DTPA of 1.0 mg/kg or less, four sites (carrots,
cauliflower, broccoli and sweet corn) responded in yield or quality to foliar or basal
application of Zn fertilisers. None of the 4 potato sites with similar soil Zn content showed
any significant yield response to trace element treatments, and only 1 minor quality response.
Armour and Brennan (1999) from the studies in Australia and elsewhere, suggested the
critical soil DTPA critical concentration for most crops to be in the range of 0.3-0.55 mg/kg.
Dr Ali Salardini and Dr Leigh Sparrow (2001). Final Report of the Trace Elements Project PT 320 to Horticulture Australia Limited. Page 66

Based on Armour and Brennan (1999) review and the results of our own work, we conclude
that, until detailed soil Zn calibration studies are undertaken, the soil DTPA critical
concentration may be set for the vegetable crops as summarised in Table 47.
Table 47. Interpretation of soil DTPA-Zn test for vegetable crops in north western Tasmania and similar regions
Soil DTPA-Zn (mg/kg)
Soil status Crop Response
<0.3 0.3-0.55 0.55-1.0 1.0 and greater
Very deficient Deficient Marginal Sufficient
All vegetables Most vegetables Few vegetables All crops
Very likely Likely Likely in near neutral soils Unlikely
Soil HWSB concentrations from 15 sites were above 1 mg/kg, which is considered to be
adequate for all crops (Bell 1999) and no responses were observed. The HWSB of all
remaining sites, but one, were below 1 mg/kg and above the threshold of B deficiency for the
crop investigated. In those ranges of soil B, a crop response to B application is possible, but
the probability is not great. In our experiments, peas (soil B=0.73 mg/kg) responded in yield
to foliar B application, and potato (soil B=0.04 mg/kg) showed a quality improvement with
soil B application. Table 48 summarises the soil HWSB interpretation for crop response to B
fertiliser.
Table 48. Interpretation of soil HWSB test for vegetable crops in north western Tasmania and similar regions
Soil HWSB (mg/kg) Soil status Crop Response
<0.3 0.3-0.5 0.5-1.0
<1.0
Very deficient Deficient Marginal
Sufficient
All vegetables Most Brassica vegetables Poppy Other vegetables
All crops
Very likely Likely Likely Unlikely
Unlikely
A yield response to Mo was observed with foliar application of Mo to poppy and soil
incorporation for cauliflower. As soil Mo tests are difficult to conduct and are not always
reliable predictors for soil Mo status, we did not attempt to evaluate those tests.
We recommend the application of Mo fertiliser prior to establishing crops such as beans, peas,
and Brassica vegetables. One application of Mo fertiliser in 3-4 year rotations, supplies
sufficient Mo to sustain healthy supply of Mo to other crops in the rotation.
Dr Ali Salardini and Dr Leigh Sparrow (2001). Final Report of the Trace Elements Project PT 320 to Horticulture Australia Limited. Page 67

Soil DTPA-Cu concentration of our sites ranged between 0.1 and 3.2 mg Cu/kg and no
response to foliar or soil applied Cu was observed, except in our carrots experiment (TE-4).
The soil Cu-DTPA at this site was 0.58 mg/kg and with basal application of Cu-sulfate more
than 23% yield increase was attained. On a soil with DTPA-Cu of 2.4 mg/kg, foliar
application of Cu lignate, in the absence of Zn or Mo in the foliar solution, reduced the yield
of poppy due to Cu toxicity. The high YFEL and seed Cu concentrations confirmed the Cu
toxicity.
At another site with DTPA-Cu concentration of 2.1 mg/kg, basal application of a mixture
containing Cu did not affect the yield of broccoli. However, omission of Zn, B or Mo from
the spray mix decreased the yield indicating Cu induced trace element deficiencies.
Calibration of soil Cu tests with the vegetable yield response to Cu application is usually
conducted in pot trials, but Rayment (1993) from a field survey, suggested that soil DTPA Cu
concentration of >0.1 were very low, 0.1-0.3 low and 0.3-5 mg/kg as medium for most
vegetables. The low ranges are similar to those reported by others (Brennan and Best 1999),
The medium range falls within the adequate range for most crops reported by others (Brennan
and Best 1999). We suggest Table 49 would be more applicable to the soils and vegetable
crops in north-western Tasmania.
Table 49. Interpretation of soil DTPA-Cu test for vegetable crops in north western Tasmania and similar regions
Soil DTPA- Soil status Crop Response Cu (mg/kg)
<0.1 Very deficient All vegetables Very likely 0.1-0.3 Deficient Most vegetables Likely 0.3-1.0 Marginal Few vegetables Occasionally likely 1.0 or greater Sufficient All crops Unlikely, may induce Zn or other
deficiencies
7.3 Plant analysis
The youngest fully expanded leaf or its petioles were sampled in nearly all experiments.
Sufficient time lapsed between foliar applications and sampling to make sure that the new
tissues that had appeared after application of fertiliser were emerged and fully developed
before being sampled. This prevented physical contamination, and ensured that changes in
tissue composition reflected the absorbed and translocated nutrients. Only at some potato sites
Dr AH Salardini and Dr Leigh Sparrow (2001). Final Report of the Trace Elements Project PT 320 to Horticulture Australia Limited. Page 68

did the sprays significantly increase the concentration of relevant trace elements in petioles.
At others, the trend was in the right direction, but at some, it was not. Russet Burbank may be
a cultivar that has a particularly poor leaf response to trace elements (Boawn and Leggett
1963). In a foliar broccoli experiment, application of different rates of Zn from different
sources had no effect on the YFEL Zn concentration. In the poppy experiment, foliar trace
element applications increased the concentration in both YFEL and seeds showing that
poppies could readily absorb trace elements and translocate them within the plant.
When trace elements were applied to the soil, changes in the composition of YFEL were not
always observed. The concentration of trace elements in cauliflower YFEL did not change
with the soil incorporated trace elements. However, Zn concentration in the YFEL of corn and
carrots increased with the application of soil applied Zn fertilisers.
In all experiments where no response to trace element application was observed, the
concentration of trace elements in the YFEL fell in the adequacy range as compiled for those
crops in the Australian plant analysis handbook (Reuter and Robinson 1997). Six Russet
Burbank potato crops had petiole B of 20 mg/kg or less and no response to B was observed.
Pregno and Armour (1992) showed a B response of Sebago potatoes when leaves contained
19 mg B/kg. In a foliar experiment, the Cu concentration in YFEL of poppy at hook stage was
above 60 mg/kg when toxicity caused yield reduction. In a basal experiment with carrot, the
concentration of Cu in leaves at mid-growth stage was about 8 mg/kg and application of Cu
increased the yield, but not the Cu in the leaves.
We did not attempt to tabulate the critical concentration of trace elements in plant tissues,
because these concentrations may vary with the plant cultivar, plant part, stage of growth and
the interaction of other nutrients. The ranges identified as deficient, adequate and toxic have
large overlaps or gaps, depending on the condition of calibration. This information is well
reviewed and collated in the book by Reuter and Robinson (1997).
7.4 Nutrient interactions
We observed some highly significant interactions between Cu, Zn, Mo and B concentrations
in the YFEL in the poppy experiment. When B, Mo or Zn were omitted from a complete
foliar solution containing Cu, the concentration of Cu in YFEL increased by 3-10 fold. In the
absence of Mo, B concentration increased, but omission of B reduced the concentration of
Mo. These interactions may complicate the use and interpretation of plant analysis.
Dr Ali Salardini and Dr Leigh Sparrow (2001). Final Report of the Trace Elements Project PT 320 to Horticulture Australia Limited. Page 69

7.5 Sources and method of application of trace elements
In our experiments, metallic trace elements Zn, Cu and Mn were applied from three sources:
mineral, chelates and lignosulfonate. Boron and Mo were used as either in mineral or
lignosulfonate forms. The mineral forms of Zn, Cu and Mn, such as sulfate, nitrate and
chloride and the complex forms such as chelate and citrate have been used for many decades
in Australia and elsewhere. Lignosulfonate trace elements have been shown to be efficient
sources of trace elements (Salardini and Murphy 1977 a, b), but are not commonly used in
Australia. Attempts were made when possible to compare the latter source of trace elements
with either mineral or chelated forms.
Since there were only a few yield responses to the trace elements applied, the comparison of
the effectiveness of the sources was only possible by comparing the changes in plant
composition. All sources, when applied as foliar spray, were readily absorbed and
translocated to other tissues, such as seeds in poppies. When trace elements were applied to
soil, the change in tissue concentration was not as pronounced as in the case of foliar use.
Band placement, even at lower rate, was more effective than broadcast application.
In most cases the changes in tissue nutrient concentrations from sources applied at similar
rates was in order Chelate>Lignate>Mineral. At commercially recommended rates, they all
changed the tissue composition significantly. We did not conduct any cost/benefit analysis for
trace element sources used, but compared the cost of materials at recommended rates.
Although chelates were much more effective than the mineral forms and were recommended
at lower rates, they were more expensive per unit weight, and the final cost of application was
nearly the same. We could not make similar comparisons for the lignate sources, as they were
costom formulated for the individual farmers or us.
We found Zn toxicity and reductions in yield of sweet corn and broccoli when 1 kg Zn/ha or
more was broadcast as chelate prior to planting, whereas 0.5 kg Zn/ha from the same source
increased the yield. In some foliar trials, Cu and Mo lignate at the producer's recommended
rate caused leaf burn and toxicity, whereas Cu sulfate and sodium molybdate were safe even
at concentration supplying many fold greater amounts of Cu and Mo than the lignate
Dr Ali Salardini and Dr Leigh Sparrow (2001). Final Report of the Trace Elements Project PT 320 to Horticulture Australia Limited. Page 70

7.6 Trace element fertiliser recommendations
This study showed that the use of trace elements in vegetable crops in Tasmania, based on
current method of recommendation, goes far above the crop requirement and on occasions
may result in levels of trace elements toxic to some crops
The current study showed that the past practice of using trace element fertiliser routinely to
reduce the risk of trace element deficiencies would in most cases results be a wasteful action.
More over, in some occasions a reduction in yield could have been experienced due to B or
Cu toxicity. We also found that a yield or quality response to trace elements was only likely
where soil test indicated a deficiency.
Although it is correct that certain crops require more of some trace elements, we do not
believe that trace elements be applied to these crops unless soil analysis results identified the
need for application. Blanket application of single or multiple trace elements may cause an
imbalance of these nutrients in soil, causing toxicity of one or deficiency of others and fail to
act as an insurance against probable trace element deficiencies.
Foliar use of trace elements has been an acceptable practice in other states or countries. The
practice is based on the fact that a deficiency of a trace element has been confirmed by
previous studies including soil and plant analysis, but the correction of the deficiency by soil
fertilisation has not been practical or economical for that crop. Conversely in Tasmania,
vegetable crops are receiving foliar sprays of trace elements only as an insurance or for the
'just in case' scenario. Much of visual crop improvements gained by foliar use of most of
foliar fertilisers are due to the effects of major elements mainly N in the mix. Although the
reduction of yield or damage to soil health is not expected by the use of most commercial
foliar products, they are more likely to be costly and useless under our conditions.
Most soil analysis laboratories, which provide services to the Tasmanian farmers, are offering
reliable soil trace element tests on affordable costs. We strongly recommend that soil test for
trace elements be carried out at least once every 3 years, but the interpretation of results
should be based on the scales of critical concentrations suggested in the current report (based
on Peverill et al. 1999).
Dr Ali Salardini and Dr Leigh Sparrow (2001). Final Report of the Trace Elements Project PT 320 to Horticulture Australia Limited. Page 71

8 References
Aitken, R. L., Jeffrey, A. J. and Compton, B. L. (1987) Evaluation of selected extractants for
boron in some Queensland soils. Australian Journal of Soil Research 25, 263-73.
Berger, K. C. and Truog, E. (1939). Boron determination in soils and plants. Industrial
Engineering Chemical Analysis Edition 11, 540-545.
Best, E. K., Manning, G. K. and Grundon, N. J. (1985). The ability of several soil extractants
to identify copper-responsive wheat soils. Australian Journal of Experimental
Agriculture 25, 863-868.
Boawn, L. C and Leggett, G. E. (1963). Zinc deficiency of the Russet Burbank potato. Soil
Science 95, 137-41.
Boawn, L. C. and Leggett, G. E. (1964). Phosphorus and zinc concentrations in Russet
Burbank potato tissue in relation to development of zinc deficiency symptoms. Soi
Science Society American Proceedings 28, 229-232.
Brennan, R. F. Armour, J. D. and Reuter, D. J. (1993). Diagnosis of zinc deficiency. In "Ed:
Robson, A. DE. Zinc in Soils and Plants:Development in Plant and Soil Sciences
Volume 55", pp 167-181. Ed. A. D. Robson. (Kluwer Academic Publishers Dordrecht,
The Netherlands).
Brennan, R. F. and Gartell, J. W. (1990). Reaction of zinc with soil affecting its availability to
subterranean clover. Australian Journal of Soil Research 28,293-302.
Colwell, J. D. and Donnelly, J. D. (1971). Effects of soil composition on the relationships
between soil test values for phosphorous fertilizer requirements. Australian Journal of
Soil Research 28, 147-162.
Cox, F. R. and Kamprath, E. J. (1972). Micronutrient soil tests. In "Ed Mortvedt, J. J.,
Giordano P.M. and Lindsay, W. L. Trace elements in Agriculture", pp. 289-318. (Soil
Science Society of America, Inc. Wisconsin).
Fricke, E. F. (1944). Molybdenum deficiency: Field experiments at Cressy, Longford and
North Motton. Tasmanian Journal of Agriculture. 15,65-70.
Fricke, E. F. (1945). Molybdenum trials on pastures in north-western districts. Tasmanian
Journal of Agriculture. 16,109- 111.
Dr Ali Salardini and Dr Leigh Sparrow (2001). Final Report of the Trace Elements Project PT 320 to Horticulture Australia Limited. Page 72

Gupta, U. C and Sanderson, J. B. (1993). Effect of sulfur, calcium and boron on tissue
nutrient concentration and potato yield. Journal of Plant Nutrition 16, 1013-1023.
Gupta, U. C , James, Y. W., Campbell, C. A., Leyshon, A. J. and Nicholaichuk, W. (1985).
Boron toxicity and deficiency: A review. Canadian Journal of Soil Science 65, 381-409.
Gupta, U. C. (1979). Boron in nutrition of crops. Advances in Agronomy, 31, 273-307.
Isbell, R. F. (1996). 'Australian Soil and Land Survey Handbook: The Australian Soil
Classification.' (CSIRO Publishing, Collingwood, Victoria, Australia).
Jones, J. B. Jr, Wolf, B. and Mills, H. A. (1991). "Plant Analysis Handbook". (Micro-Macro
Inc; Athens, USA).
Lamp, C. A. (1964). Boron deficiency in forage crops. Tasmanian Journal of Agriculture 35,
181-189.
Laughlin, J. C. (1980). The boron nutrition of poppies (Papaver somniferum L.) on
krasnozem and alluvial soils of Tasmania. Acta Horticulturae 96,227-234.
Lindsay, W. L. and Norvell, W. A. (1978). Development of a DTP A soil test for zinc, iron,
manganese and copper. Soil Society of America Proceedings, 42:421-428.
Loneragan, J. F. and Webb, M. J. (1993). Interactions between zinc and other nutrients
affecting the growth of plants. In 'Ed: Robson A. D. Zinc in Soils and Plants.
Developments in Plant and Soil Sciences Vol. 55' (Kluwer Academic Publishers,
Dordrecht).
Martens, D. C. and Westermann, D. T. (1991). Fertilizer applications for correcting
micronutrient deficiencies. In ' Ed. Mortvedt, J. J. Micronutrients in Agriculture, 2nd
Edition" (Soil Science Society of America Book Series 4, pp 592. SSSA, Madison,
isconsin).
Mortvedt, J. J. and Gilkes R. J. (1993). Zinc fertilizers. In "Ed Robson A. D. Zinc in soil and
plants". (Kluwer Academic Publishers, Dordrecht, The Netherlands).
Olsen, S. R., Cole, C. C, Dean, L. A. and Watanabe, P. S. (1954). 'Estimation of available
phosphorus in soils by extraction with sodium bicarbonate'. (U.S. Department of
Agriculture Circular 939. U.S. Government Office, Washington, DC).
Paton, D. F. (1956). Investigations on trace element deficiencies of pastures in Tasmania.
Journal of the. Australian Institute of Agricultural Science 22, 33-36.
Dr Ali Salardini and Dr Leigh Sparrow (2001). Final Report of the Trace Elements Project PT 320 to Horticulture Australia Limited. Page 73

Pregno, L. M. and Armour, J. D. (1992). Boron deficiency and toxicity in potato cv Sebago
on an oxisol of the Atherton Tablelands, North Queensland. Australian Journal of
Experimental Agriculture 32, 251-253.
Rayment, G. E. and Higginson, F. R. (1992). 'Australian Laboratory Handbook of Soil and
Water Chemical Methods.' (Inkata Press, Melbourne)
Reuter, D. J. (1975). The recognition and correction of trace element deficiencies. In "Eds.
Nicholas, D. J. J. and Egan A. R. Trace elements in soil-plant-animal system", pp. 291-
324. (Academic Press, Inc., New York.)
Reuter, D. J. and Robinson, J. B. (Editors). (1997). "Plant Analysis, an Interpretation
Manual". (CSIRO Publishing, Collingwood Victoria, Australia).
Roberts, S. and Rhee, J. K. (1990.) Boron utilization by potato in nutrient culture and in field
plantings. Communications in Soil Science and Plant Analysis 21, 921-932.
Robson, A. D. and Gilkes, B. J. (1980). Fertiliser responses (N, P, K, S and micronutrients) on
laterite soils in southwestern Australia-a review. Proceedings of International Seminar
on Lateritization Process. Unesco-ICS, Trivandarum, India, pp 381-390.
Sanderson, J. B. and Gupta, U. C. (1990). Copper and zinc nutrition of Russet Burbank
potatoes grown on Prince Edward Island. Canadian Journal of Agricultural Science 70,
357-362.
Soltanpour, P. N., Reuss, J. O., Walker, J. G., Heil, R. D., Lindsay, W. L., Hansen, J. C,
Relyea, A. J. (1970). Zinc experiments on potatoes in the San Luis Valley of Colorado.
American Potato Journal 47,435-43.
Srivastava, P. C. and Gupta, U. C. (1996). 'Trace elements in crop production'. (Science
Publisher, Inc. Lebanon, USA).
Trierweiler, J. F. and Lindsay, W. L. (1969). EDTA-ammonium carbonate soil test for zinc.
Soil Science Society American Procedures 33, 49-54.
Vinande, R., Knezek, B. Davis, J., Doll, E. and Melton, J. (1968). Field and laboratory studies
with zinc and iron fertilization of pea, beans, corn and potatoes in 1907. Michigan State
University Agricultural Experimens, Quarterly Bulletin. 50, 625-636.
Zarcinas, B. A., and Cartwnght, B. (1983). "Analysis of soil and plant material by inductively
coupled plasma - optical emission spectrometry". (CSIRO Division of Soils. Technical
Paper No. 45).
Dr Ali Salardini and Dr Leigh Sparrow (2001). Final Report of the Trace Elements Project PT 320 to Horticulture Australia Limited. Page 74

9 Publications
The outcomes of the study were presented to vegetable, poppy and associated industries such as fertiliser companies, agricultural consultants, analytical laboratories, seed and seedling companies. The outcomes were decimated in 6 technical seminars, 6 field days, a number of extension talks to farmers and two popular publications. We recommend establishing a new series of activities to extend the outcomes of the project further. Samples of the print materials are given hereafter.
Dr Ali Salardini and Dr Leigh Sparrow (2001). Final Report of the Trace Elements Project PT 320 to Horticulture Australia Limited. Page 75

£> -•-• r ^ i p>% Department of ^ The BlUe POppy Primary Industry
and Fisheries T A S M A N I A ty Syndrome Project _ ^
HRDC \y
1994/95 Progress Report to Poppy Industry Contributors
Dr Ali A Salardini Senior Plant Nutritionist
Tasmanian Institute of Agricultural Research
Department of Primary Industry and Fisheries
Supported by
Tasmanian Alkaloids, Glaxo Australia
and
The Horticultural Research and Development Corporation.
September 1995
Dr Ali Salardini and Dr Leigh Sparrow (2001). Final Report of the Trace Elements Project PT 320 to Horticulture Australia Limited. Page 76

9.1 Blue Poppy Syndrome 9.1.1 SUMMARY
In some fields after germination of poppy, the seedlings turn blue or purple and either die or
stop growing. The number of dead plants, in some fields, is so great that crop should be
abandoned. The problem is known as blue poppy syndrome and was percieved to be a trace
element related problem.
The objective of the project were to identify the causes of blue syndrome and to reproduce the
field symptoms in the glasshouse.
Six sites showing the incidence of blue syndrome visited at least twice by the research and
field officers of DPIF and poppy companies. Detail information including soil and crop
condition, paddock history and the location of affected areas were examined and recorded.
Two glasshouse trials conducted. In both trial three levels of P, equivalent to 0, 50 and 200
kg P/ha were incorporated into the soil and two levels of banded P, equivalent to 0 and 20 kg
P/ha were employed. After germination, the intensity of blue colour, vigour and height of
seedlings were scored.
The results of glasshouse trials indicated that in the absence of banded P, nearly all seedlings
grown on nil or even 50 kg incorporated P/ha showed severe purplish colour and had a
retarded growth. At 200 kg incorporated P/ha rate the majority of seedlings were healthy but
small. When 20 kg P/ha was band-placed, the rate of incorporated P was less important and
most seedlings were healthy.
The results of glasshouse work and the field surveys strongly suggested that the cause of the
problem was the low supply of P from soil to seedlings and it was exacerbated by drought,
low temperature, insufficient contact between the seed and soil and loose soil structure.
It was recommended that paddocks lower in soil Colwell P than 40 mg/kg (Olsen P of 8) not
be selected for poppies. In soils low in P, bulking the seed with triple superphosphate (low
ed) is recommended. When sowing in paddocks with a loose soil structure, especially after
pasture, a slower speed and the use of press wheels to improve the soil-seed contact is
recommended. Soil moisture condition should be kept high enough to insure a good
establishment.
Dr Ali Salardini and Dr Leigh Sparrow (2001). Final Report of the Trace Elements Project PT 320 to Horticulture Australia Limited. Page 77

9.1.2 INTRODUCTION
In some fields after germination of poppy, the seedlings turn blue or purple and stop growing.
Application of herbicides normally applied in one to two weeks after germination, kills these
stressed plants. The number of dead plants, in some fields, is so great that crop should be
abandoned. In many paddocks, the problem may appear in only some parts of the field and in
patches. This problem is called blue poppy syndrome.
Blue poppy syndrome occurs 1-2 weeks after germination and the failure in establishment of
poppy would be expected if after a week or two of germination a large number of seedlings
are purple in colour. Plants in some fields, especially if irrigated or received rain may
partially or fully recover. The poppy industry assumed that trace element deficiencies might
be the cause of the problem, and supported the Trace Elements Project (PT320) to resolve the
problem.
9.1.3 OBJECTIVES
The objective of the project were
1. to identify the causes of blue syndrome
2. to reproduce the field symptoms in the glasshouse
9.1.4 METHODS
Two major methods were employed in identification of causes of syndrome. Field survey of
affected paddocks and conducting glasshouse trials to reproduce the symptoms were
conducted.
9.1.4.1 Field Surveys
The research and field officers of poppy companies reported any incidence of blue syndrome
and the sites were visited and soil, crop, paddock history and the location of affected areas
were examined and recorded. The sites were revisited a few days later, especially after a rain
or irrigation and changes in plant colour and vigour were recorded.
9.1.4.2 Glasshouse trial
The objective of glasshouse was to reproduce the blue poppy syndrome, and consequently,
identify at least one of the factors contributing to the incidence of the problem
Dr Ali Salardini and Dr Leigh Sparrow (2001). Final Report of the Trace Elements Project PT 320 to Horticulture Australia Limited. Page 78

In the last year trial, the effect of rate and method of application of P was studied, but due to a
fault in the cooling system, the rate of germination was lower than was desired. To be more
confident of the finding the glasshouse trial was repeated in the 1994 season.
A soil collected from a paddock under a long-term pasture was used in this trial. The soil
analysis is given in Table (1A).
In a completely randomised design experiment with 5 replicates, the effect of 3 rates of
incorporated and two rates of band-placed P on the incidence of blue poppy syndrome was
studied.
Three levels of P, equivalent to 0, 50 and 200 kg P/ha were mixed with the soil and placed in
600 g aluminium trays. Sufficient P fertiliser and poppy seed were mixed with a batch soil to
be able to supply equivalent of 20 kg P/ha and 50 seeds per tray, when 20 g of the mix was
added used for each tray. Two bands of the mixture (10 g per band) were placed on the
surface of each tray. Similar mixture of soil and seed was also prepared without addition of P
and used in another series of trays. After germination, the intensity of blue colour, vigour and
height of seedlings were scored. Soil Olsen P was determined at termination of the trial.
Table 1A. Some characteristics of the soil used
pH
1:5 H20
EC
dS/m
OrgC
(%)
P K Cu Zn Fe Mn B pH
1:5 H20
EC
dS/m
OrgC
(%) mg/kg
5.5 0.09 6.2 16 145 1.71 1.18 56.4 56.4 1.66
The colour score, calculated as the product of the number and extend of blue syndrome is
shown in Figure. (1A). A score of 100 represents the condition when 100% of seedlings were
showing severe purplish, while a score of 300 indicates that all of seedling being healthy and
green.
9.1.5 RESULTS AND DISCUSSION
9.1.5.1 Field observations in 1993
9.1.5.1.1 East Devonport
Only a small area on a shallow soil located on the north-facing slope was affected. Seedlings
in this area were compared with the healthy plants in other parts of paddock. The main
difference was found to be the lack of fertiliser delivery, caused by the blockage of the
fertiliser applicator. This was exacerbated by dryness of soil, due to the direction of slope and
Dr Ali Salardini and Dr Leigh Sparrow (2001). Final Report of the Trace Elements Project PT 320 to Horticulture Australia Limited. Page 79

higher evaporation. The seedlings were also smaller than the healthier seedlings in the rest of
the paddock. The seedlings recovered significantly a week later after receiving a 10 mm rain.
9.1.5.1.2 Sassafras
Blue seedlings were observed in widespread small patches in the field. The soil, to a depth of
50 to 75 mm, was very dry. The seedbed was coarse and cloddy, probably due to cultivation
or drilling in a wet soil. Most of the affected seedlings were not covered by soil and their
roots had not entered sufficiently into the soil. Following a rainfall, a small number of
seedlings recovered. They were sufficient to maintain an acceptable plant density.
9.1.5.1.3 Elliott
The paddock had been under long term pasture. Soil was loose and bulky. The affected areas
were located on the slope. The flat parts of paddock maintained a healthy plant population. A
close examination of plant rows showed a very shallow sowing. Judging by the location of
the clay particles used for bulking of seed, in the affected area seeds were placed on the
surface. After a good rain, the problem was over, and many blue poppy seedlings recovered.
9.1.5.2 Field observations in 1994
Similar visits were made in 1994 as the in the previous year. Fewer affected sites than 1993
season were reported by the advisory officers of poppy companies. Where the symptoms
appeared, they were caused by the factors identified in the 1993 report.
9.1.5.3 Glasshouse trial
The results of glasshouse trial indicated that in absence of banded P, nearly all seedlings
grown on nil or even 50 kg incorporated P/ha showed sever purplish colour and had a retarded
growth. At 200 kg incorporated P/ha rate the majority of seedlings were healthy.When 20 kg
P/ha was band-placed, the rate of incorporated P was less important and most seedlings were
healthy (Fiqure 3A).
Vegetative scores (Figure 2 A) showed that both rate and the method of placement of P
fertiliser influenced the seedling development, but the differences were not as large as for the
colour score (Figure 1 A).
Dr Ali Salardini and Dr Leigh Sparrow (2001). Final Report of the Trace Elements Project PT 320 to Horticulture Australia Limited. Page 80

Colour score 400
300
20 Banded P
(kg/ha)
Incorporated P (kg/ha)
Figure 1A. Effect of banded and incorporated P fertilisers on the seedling colour score
Vegetative score
600
400
200
20 Banded P
Nil (kg/ha)
Incorporated P (kg/ha)
Figure 2A. Effect of banded and incorporated P fertilisers on the vegetative score of the seedlings
Dr Ali Salardini and Dr Leigh Sparrow (2001). Final Report of the Trace Elements Project PT 320 to Horticulture Australia Limited. Page 81
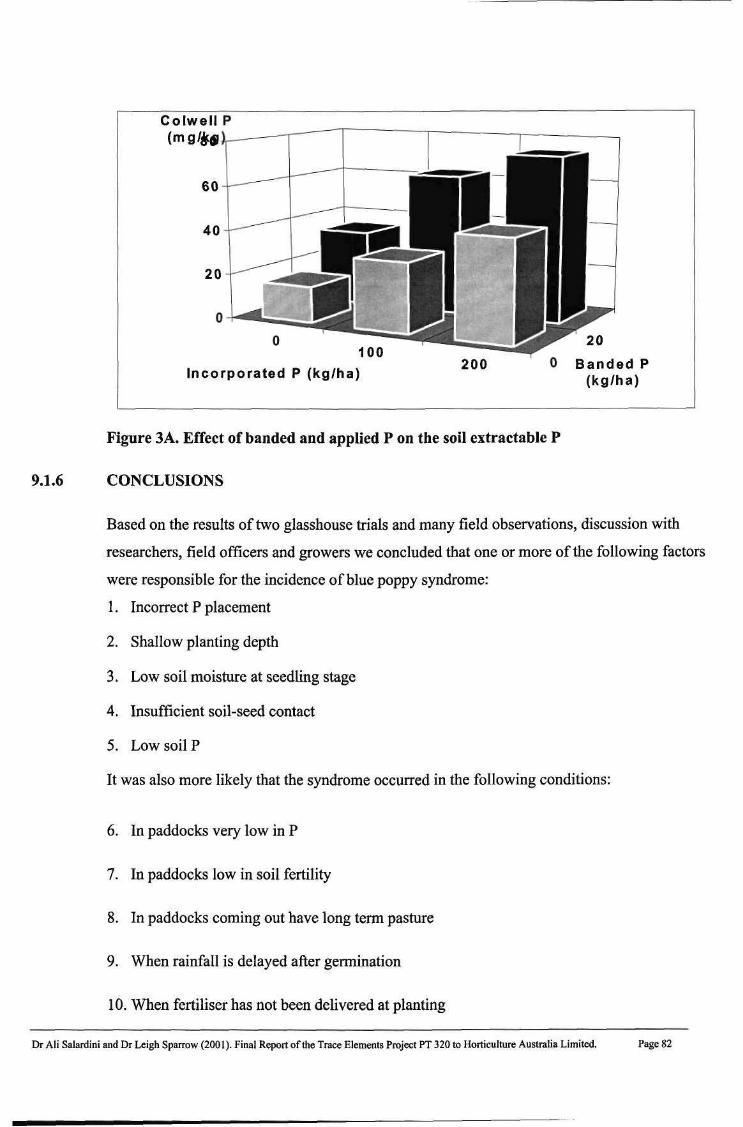
Figure 3A. Effect of banded and applied P on the soil extractable P
9.1.6 CONCLUSIONS
Based on the results of two glasshouse trials and many field observations, discussion with
researchers, field officers and growers we concluded that one or more of the following factors
were responsible for the incidence of blue poppy syndrome:
1. Incorrect P placement
2. Shallow planting depth
3. Low soil moisture at seedling stage
4. Insufficient soil-seed contact
5. Low soil P
It was also more likely that the syndrome occurred in the following conditions:
6. In paddocks very low in P
7. In paddocks low in soil fertility
8. In paddocks coming out have long term pasture
9. When rainfall is delayed after germination
10. When fertiliser has not been delivered at planting
Dr Ali Salardini and Dr Leigh Sparrow (2001). Final Report of the Trace Elements Project PT 320 to Horticulture Australia Limited. Page 82

11. When seedbed is course
12. In paddocks low in pH and high in soluble Al
Based on the information gained from the glasshouse work and the field surveys and the
experience of growers and operators, it is strongly suggested that following factors are the
causes of the problem:
1. Soil P is one of the important factors causing blue syndrome and its effect will be
exacerbated by drought, low temperature and insufficient contact between the seed and
soil.
2. Transfer of water from soil to seedling is another important factor. A coarse seed bed,
shallow planting, and bulky soil structure contribute to both insufficient soil moisture
transferee and reduced uptake of P.
3. Soil pH is only important at this stage, if lime super has not been mixed with the seed or its delivery has stopped during sowing.
The following factors are the result of other factors rather than the cause:
1. Aluminium toxicity will be an important factor in pH below 5.0. It is, therefore, less
important in many cropped soils. At the early stages of poppy growth when blue
syndrome occurs, roots are mainly developed in the topsoil that have a pH of 5.5 or
greater. At this pH, the concentration of soluble Al is very low.
2. Frequent incidence of blue poppy syndrome after long term pasture, is the results of
combination effects of some or all these factors. Factors such as loose soil structure, low
phosphorus low soil-seed contact or low soil pH may be responsible for the blue
syndrome in paddocks sown after a long-term pasture.
9.1.7 RECOMMENDATION
1. Soil P would be a critical criterion in selecting sites for poppy. Paddocks lower in soil
Colwell P of 40 mg/kg (Olsen P of 8) are likely to experience the blue syndrome problem
and are not recommended for poppies.
2. In soils low in P, mixing of seed with lime and super is recommended. Use of triple
superphosphate in place of single super is highly recommended, unless you are sure the
Dr AH Salardini and Dr Leigh Sparrow (2001). Final Report of the Trace Elements Project PT 320 to Horticulture Australia Limited. Page 83

single super is low in Cd. Some of commercial single superphosphates add more than 8
times Cd than standard triple super for the same rate of P.
3. Loose soil structure is another major cause of the problem. Paddocks with a loose soil
structure, especially after pasture, would have problem in making a suitable soil-seed
contact. Sowing in these soils in a slower speed and using a press wheel improves the
contact.
4. Soil moisture condition should be appropriate for good establishment. If the sowing is
conducted in dry soil, a rain or irrigation is necessary
9.1.8 FUTURE WORK
The objectives of the project have been achieved and further experimental work is not
recommended. However, the extension of the results to the industry field officers, operators
and contractors needed to be pursued by poppy industry. I would be glad to help if needed.
Dr Ali Salardini and Dr Leigh Sparrow (2001). Final Report of the Trace Elements Project PT 320 to Horticulture Australia Limited. Page 84

Trace elements project on the University of Tasmania web site
http ://www.tiar.tas. edu.au/domino/tiar/tiar.nsf/framv/frameset_rd
9.2 Trace element requirements of vegetables and poppies in Tasmania-on the University of Tasmania web site
Research Investigator: Dr Ali Salardini, Dr Leigh Sparrow
Funding: Horticulture Australia Limited, vegetable processing companies, fertiliser manufacturing companies, poppy industry and TFGA.
Commencement and Completion Date: Project commenced October 1993, completion date for the field work October 1997, report is due October 2001
9.2.1 Background
Although in excess of $ 800,000 is annually spent on trace element fertilisers for vegetables in Tasmania, there are still frequent reports on trace element deficiencies on vegetables. There has been no reported research in this field in the past half-century and limited work in other States has mainly been on pastures and field crops.
Because of the lack of information relevant to horticulture in Tasmania, growers are often presented with conflicting advice on trace element requirements. They are often encouraged to use the more expensive chelated forms of trace elements, but the benefits of these formulations have not been adequately demonstrated. Recommendations can cost more than $200/ha.
9.2.2 Objectives
This project seeks to develop better trace element fertiliser strategies to maximise production and provide vegetable growers with accurate recommendations through the following topical investigations:
To determine the need for Zn, Cu, B, Mo and Mn in potatoes, brassica crops, carrots, peas, beans and field poppies.
To compare the efficiency of foliar and soil applied trace elements in mineral, chelated or lignated forms.
To evaluate three internationally used Universal extractants: Morgan-Wolf, Mehlich-3 and Ammonium bicarbonate - DTP A, and the recommended method for the single trace element tests, as diagnostic technique.
To examine the usefulness of plant analysis as a diagnostic technique for predicting the trace element requirements of vegetables and field poppies.
Dr Ali Salardini and Dr Leigh Sparrow (2001). Final Report of the Trace Elements Project PT 320 to Horticulture Australia Limited. Page 85

To provide vegetable and poppy growers with accurate trace element fertiliser recommendations based on soil and plant analysis.
9.2.3 Work undertaken to date:
During the four years life of the field studies, we completed 12 foliar and 7 basal trace element experiments on the main processing vegetable crops- potatoes (10 sites), cauliflower, broccoli, green peas, green beans, carrots sweet corn and field poppies (Figure IB).
The sites with the lowest content of one or more of the trace elements were selected after consulting more than 1000 commercial soil analytical results and repeating the sampling and analysis of 60 of the most deficient sites.
The trace elements targeted for investigation in the order of priority were Zn, Cu, B, Mo and Mn. Two or all of the commonly used sources of trace element fertilisers, mineral, chelate and lignate were compared in most trials.
Total and marketable yields, industry quality criteria and soil and plant tissue composition were determined and discussed in all trials.
The outcomes of the study were presented to vegetable, poppy and associated industries such as fertiliser, agricultural consultants, analytical laboratories, seed and seedling companies in 6 technical seminars, four field days, number of extension talks to farmers and two popular publications.
Figure IB. Glasshouse studies on trace element requirements of poppies
9.2.4 Results to date
9.2.4.1 Yield response
Because of routine application of trace elements in the past two or three decades, most long-established vegetable farms are sufficiently supplied with trace elements. Although we
Dr Ali Salardini and Dr Leigh Sparrow (2001). Final Report of the Trace Elements Project PT 320 to Horticulture Australia Limited. Page 86

selected sites with the lowest trace element content that we could find, in 171 combinations of treatments resulted from variations in crops, method and rates of application and trace elements, only 9 positive or negative yield or quality responses were observed.
9.2.4.2 Soil analysis
This study showed that, when the interpretation criteria presented in the recent Australian "Soil Analysis- an Interpretation Manual" (Peverill et al. 1999.) were used, soil analysis gave reasonable predictions of soil trace element status. The predictions were more accurate where crop species and soil type were taken into account. We tabulated the interpretation guides for soil Zn, Cu and B status that could be used more appropriately on vegetable crops in northern Tasmania. We strongly believe that the critical soil trace element concentrations employed by the local fertiliser advisers are many folds greater than the correct values.
Figure 2B. Boron deficiency on brassica crops was observed more frequently than other trace elements
9.2.4.3 Plant analysis
In nearly all experiments, plant analysis results when interpreted using the guidelines reported in the "Plant analysis-an Interpretation Manual (Reuter and Robinson 1997), correctly predicted the response of crop to trace elements. We did not attempt to tabulate the critical concentration of trace element in plant tissues, because these concentrations may vary with the plant species, cultivars and parts, stage of growth and the interaction of other nutrients. We recommend that the plant analysis manual to be consulted for plant analysis interpretation.
9.2.4.4 Source and methods of application
All sources, when applied as foliar spray, were readily absorbed and translocated to other tissues, such as seeds in poppies. When these were applied to soil, the change in tissue concentration was not as pronounced as in the case of foliar use. Band placed method, even at lower rate was more effective than broadcast application. The efficiency of sources applied at
Dr Ali Salardini and Dr Leigh Sparrow (2001). Final Report of the Trace Elements Project PT 320 to Horticulture Australia Limited. Page 87

similar rates were in order of Chelate<Lignate<Mineral. At commercially recommended rates, they were similarly effective and costing the same.
9.2.4.5 Trace element recommendation
We believe that the need for trace elements application to vegetables in Tasmania is grossly over-estimated by most local and visiting farm consultants.
Although it is correct that certain crops require more of some trace elements, [eg. brassica crops need more B (Figure 2B) and Mo], we do not believe that trace elements routinely be applied to these crops unless soil analysis identified a need. This suggestion prevents the probable imbalance of these nutrients in soil, which may cause toxicity of one or deficiency of other trace elements.
In Tasmania, vegetable crops are receiving foliar sprays of trace elements only as an insurance, and not to correct known deficiencies. Much of visual improvements are due to the effects of major elements mainly N in the commercial mixes. Although the reduction of yield or damage to soil health is not expected by the use of most commercial foliar products, they are more likely to be costly and useless under our conditions, unless are used to correct a known deficiency.
9.2.5 Technology transfer
The outcomes of the study were presented to vegetable, poppy and associated industries such as fertiliser companies, agricultural consultants, analytical laboratories, seed and seedling companies. The outcomes were decimated in 6 technical seminars, 6 field days, a number of extension talks to farmers and two popular publications. We recommend establishing a new series of activities to extend the outcomes of the project further.
9.2.6 Acknowledgments
We acknowledge the financial support of Tasmanian Farmers and Grazier Association, Simplot, McCain, Tasmanian Alkaloids, Glaxo Welcome, Pivot Agriculture, Impact Fertilizers and Serve-Ag.
9.2.7 References
Peverill, K. I., Sparrow, L. A. and Reuter D. J. (1999). "Soil Analysis, an Interpretation Manual (CSIRO Publishing, Collingwood Victoria, Australia).
Reuter, D. J. and Robinson, J. B. (Editors). (1997). "Plant Analysis, an Interpretation Manual". (CSIRO Publishing, Collingwood Victoria, Australia).
Dr AH Salardini and Dr Leigh Sparrow (2001). Final Report of the Trace Elements Project PT 320 to Horticulture Australia Limited. Page 88

This article was presented in many courses held throughout Tasmania in the Whole Farm Planning program organized by by Department of Primary Industry, September 1994.
9.3 DIAGNOSIS OF TRACE ELEMENT DEFICIENCIES WITH REFERENCES TO TASMANIA
Ali A Salardini
Vegetables and Allied Crops Branch
Department of Primary Industry
9.3.1 Summary
Different tmethods of diagnosis for trace element status of soil and plants are reviewed. Information essential to the most effective use of these methods for determining the fertiliser needs of crops are briefly discussed. The major problem with recommendation of trace element fertilisers in Tasmania is the lack of scientific information in the field of trace elements and the use of diverse diagnostic methods with doubtful reliability. It is suggested that a discussion group consisting of parties involved should examine the present Tasmanian situation and means of improving fertiliser recommendations by encouraging a unified approach to the problem.
9.3.2 Need for trace element application
Amongst many trace elements that are essential for a normal growth of plants and animals only a few may be of concern in Tasmanian agriculture. Soils are generally capable of supplying the required amounts of trace elements to plants and consequently to the animals.
In certain circumstances, it is essential to supplement the trace elements provided by soil.
A. Certain crops naturally need more of some trace elements than others. Brassica plants require a larger amount of boron (B) and molybdenum (Mo) and legumes including legume pastures, beans and peas need a good supply of Mo. Plants with a latex system like poppies and lettuces have the highest requirements for B. In contrast plants of grass family, eg, pasture grasses, oats and sweet corn may be successfully grown in low B soils.
B. Some soils contain less of some trace elements because they are developed from the parent material low in those elements. Sandy soils and red soils developed from basalt especially when acidic are generally low in B and Mo. Neutral alluvial soils and soils with high organic matter contain greater amounts of these trace elements in available forms.
C. Soil conditions and management practices would influence the availability of trace elements to plants. Application of lime to an acid soil improves the availability of Mo. Excessive use of lime may lead to copper (Cu), cobalt (Co), iron (Fe) and/or manganese (Mn) deficiencies in plant and animals. Excessive application of phosphate fertilisers, especially high analysis mixes reduce zinc (Zn), Cu and Mo availability to plants.
Dr Ali Salardini and Dr Leigh Sparrow (2001). Final Report of the Trace Elements Project PT 320 to Horticulture Australia Limited. Page 89

9.3.3 Trace element deficiencies in Tasmania
An annotated list of plant diseases including trace elements disorders has been compiled by the Department of Primary Industry Tasmania (Sampson and Walker 1982). There are 40 references to the problems related to the trace element disorders in pasture, field and horticultural plants in Tasmania since 1935. Except in a handful, only the incidence of deficiency of B, Cu, Mn, Mo and Zn and the toxicity of Mn have been reported and no experimental results has been produced.
Molybdenum deficiency was examined in more detail by Fricke (1943,1944,1945) and Wade (1949). The problem of B deficiency in apple trees was discussed by Carne and Martin (1937). The response of poppies to B applications was examined by Laughlin (1980) in glasshouse and field experiments. Routine or periodic applications of Mo containing fertilisers to brassica crops, beans and peas and borax to poppies, brassica crops and fruit trees are now an accepted practice. This is based on the results of research from other states or countries or the individual experiences.
Iodine, selenium (Se), Co and Cu deficiencies in farm animals are wide spread in Tasmania, but more frequently observed in areas of high rainfall with light textured acid soils (Campbell and Pitt 1988). Trace element deficiency in pasture plants is rare except Mo deficiency (Paton 1956) that is corrected by routing application of molybdate superphosphate.
In recent years, there has been a large increase in recommendation and use of trace elements to pastures and crops in Tasmania. These recommendations, besides Mo and B, are covering a list of trace elements. These elements are Zn, Cu, Se and Co that were assumed either sufficiently supplied by the soil or in the grazing situation could be prescribed for direct animal treatment. In some recommendations, the use of special trace element compounds has been advised. Whether the new compounds are more effective than the usual forms, has not been examined under our conditions but they are certainly more expensive.
The reason we are not able to come to a quick and fair judgement on the accuracy of these recommendations lies in the complexity of the diagnostic techniques. This subject is here been dealt with.
9.3.4 Diagnostic Techniques
Trace element deficiencies may be recognised by examining the visual symptoms or the results of soil or plant analysis.
9.3.4.1 Visual symptoms
Usually when the symptom of trace element deficiency appears the damage to the crop has already been inflicted and it is too late to correct the shortage. This method of diagnosis however may provide the clues to the causes of deficiency. The causes may include inadequacy or low availability of the element in the soil, too acid soil, over application of water, lime or fertilisers. This information may be used to prevent the incidence of deficiency in the future.
9.3.4.2 Diagnostic tests
Plant nutrient requirements can be identified by separate or combined soil and plant tissue tests. These tests are used to determine that nutrients are outside normal limit in soil and plant tissues. To attain a maximum benefit in application of these tests 3 stages must be
Dr Ali Salardini and Dr Leigh Sparrow (2001). Final Report of the Trace Elements Project PT 320 to Horticulture Australia Limited. Page 90

considered: A. selection of suitable test, B. calibration of the test against crops responses and estimating the critical level that separates the deficiency from adequacy, C. interpretation of the results and recommendation. These stages will be discussed later.
9.3.4.3 Plant tissue tests
As a rule a young mature leaf, in another word the youngest fully expanded leaf (YFEL) is selected for most crops. The petiole or the mid-rib is generally selected for evaluating the status of nitrogen, potassium and phosphorus but whole leaf or blade (lamina) is preferable for trace elements.
Plant tissue test for pastures may be used to examine the trace element status of plants regarding herbage production. This technique is not as effective in examining the trace element disorders in livestock. For the latter additional animal tissue testing and treatment of animals directly is recommended (Egan 1975).
Plant tissue test is not always suitable for identifying the need of trace element of the current crop. Unless it is performed in early stages of growth and a proper calibration is available for that physiological stage of growth.
The analysis of dry plant tissues (plant test) is highly recommendable for the major and trace elements. The sap test has successfully been used for the major elements. The confidence in plant tissue test has been obtained by examining the results of hundred of thousand of samples analysed annually in research laboratories all over the world. In contrast, the use of sap test for assessing trace element status is still in its rudimentary stage Table (1C).
Correct application of plant tissue testing, as a diagnostic technique is much more complex than it first appears to be. In contrast to soil test, the selection of test is simple but sampling plant tissue is a very delicate affair. The concentration of trace elements decreases significantly with plant age, it is different at different plant parts and may be influenced by change in concentration of other nutrients (Reuter 1975, Smith 1986). Plant tissue testing should be related to specific stages of plant development, to specific plant part or tissue and specified plant species or even cultivars (Jones 1972). Without knowledge of critical concentrations that gives the limits of deficiency, sufficiency and toxicity plant tests are useless. The advantage of plant test over soil test is that these values may be obtained from the works conducted in different parts of the world on the same plant. Generally, there will be little concern about the effects of regional soil and environmental differences on the critical concentrations.
The interpretation of the results of plant tissue tests although simpler than that of soil tests requires some knowledge of nutrient interactions in the plant. A low zinc in plant tissue may not often be due to a low soil zinc availability but to an excessive application of phosphate. Low boron in plant may have been caused by high application of nitrogen, lime or even potassium fertilisers. In both cases, recommendation of trace elements is not the correct solution.
9.3.4.4 Soil tests
The major advantage of soil test over plant test is in its ability, when suitably selected and performed, to indicate the need for trace element application at sowing time. The number of soil samples analysed in the U.S.A. is nearly 8 times greater than that of plant samples (Peck 1990, Jones 1972). Most of soil and plant samples are analysed for both the major and trace elements. That is why in the United States the recommendation of trace elements still relies
Dr Ali Salardini and Dr Leigh Sparrow (2001). Final Report of the Trace Elements Project PT 320 to Horticulture Australia Limited. Page 91

Table IC. Concentration of important elements in some field and horticultural crops
Crop Stage of growth
B Cu Mn Crop Stage of growth Critical Adeq. Critical Adeq. Critical
Bean Bud 15 40-60 3-5 5-15 25 Broccoli Heading 20 30-50 0.5 1-5 20 Brussel sprout Budding 10 30-100 - - -Capsicum Early fruit 15 40-100 5 10-200 20 Onion Mid-growth 20 25-45 3 5-10 40 Pea Early flower 20 25-60 - 5-10 -Potato Early flower 15 20-50 3 5-10 20 Sweet corn Silking - 50-70 5 8-12 -
Tomato Early flower 10 30-100 5 8-15 25 Oats In boot 3 6-15 2.5 3.3-5 15 Soybean Early flower 10 20-100 - 6-15 20 Wheat In boot 5 6-10 1.6 2-5 15 Clover Pre flower 20 25-30 4 5-7 20 Ryegrass Pre flower 3 5-15 4 5-12 -Apple January 15 20-40 4 6-20 20 Cherry January 15 20-60 3 5-16 20 Grapevine Flowering 20 30-100 3 6-16 20 Azalea On flower 15 20-100 5 6-15 30 Carnation Pre flower 20 30-100 2 4-20 30 Chrysanthemum Pre flower 20 25-200 5 10-15 20 Rose Early flower 30 30-60 5 5-15 30
1 Compiled mainly from Reuter and Rob inson (198 >6) with ac ditions fr< Dm own work and ma The plant tissue employ* sd in most crops has been 1 the whole youngest fully expanded leaf (Y
Dr AH Salardini and Dr Leigh Sparrow (2001). Final Report of the Trace Elements Project PT 320 to Horticulture Australia Limited. Page 92

heavily on soil analysis. To increase the usefulness of soil test, an appropriate soil test should be selected with regards to regional soil and climatic characteristics. The interpretation of theresults must be based on research studies calibrating the test with crop response to addition of trace elements in similar soil and plant conditions.
There are many methods for the extraction of available forms of trace elements from soils. Some of these methods are specifically developed to be used for one or two trace elements and others are designed to evaluate the status of several elements in the soil (Cox and Kamprath 1972). In an ideal situation, a universal extractant suitable for estimating the availability of most trace elements may be found. Table (2C) shows the most widely used extractant for testing trace elements in the U.S.A., U.K., Canada and Australia. Since more than 3.3 million soil samples are analysed annually in research and commercial laboratories in the U.S.A. (Peck 1991) more emphasis is placed on the methods adopted in that country.
9.3.4.5 Universal soil extractant
The term 'universal soil extractant' is used to designate a single extractant that can be used to extract most of major and trace elements. The advantage of universal extractants in reducing time and cost of soil analysis is considerable. The extract is normally used for multi-element analysis by ICP spectrometers and autoanalysers.
The first universal soil extractant was developed by Morgan (1935) in Connecticut Experimental Station in the U.S.A. and was quickly accepted by most states and other countries. This extractant and its modified forms have been frequently used by commercial laboratories in many countries until late 1950's. Morgan solution is in little use today (Jones 1990) and has been replaced by the more reliable extractants. In most soil and plant test, services in the U.S.A. one or two of the six universal extractant reported in Table (3C) are employed to diagnose the soil trace elements status.
The confidence on reliability of trace element soil tests is not as strong as for the major element tests. From a grower or consultant's standpoints, if the trace element status of a field is not known, a soil test will nearly always be better than guessing or waiting to see the symptom of a deficiency. Plant analysis alone may not serve the purpose due to differences between the plants and the influence of temporary factors including weather conditions and fertiliser application.
Trace element tests have their limitations. No plant test or chemical soil test can perfectly reflect or simulate the conditions that exist in the soil during the whole period of crop growth. Thus, the influence of weather, plant density, availability of other nutrients and management factors must also influence the interpretations. Sometimes the results of both soil and plant analysis in necessary to reach a conclusive result.
9.3.4.6 Correlation and calibration
The results of soil and plant test for major and trace elements are useless without existence of a proven relationship between the test values and response of crop to application of fertilisers. The advantage of selecting a well-examined method is that a large body of information is available on their suitability for different crops and under different climatic and soil conditions. This information provides a sound basis for a correct interpretation and recommendation.
Dr AH Salardini and Dr Leigh Sparrow (2001). Final Report of the Trace Elements Project PT 320 to Horticulture Australia Limited. Page 93

To date, only few studies on yield responses of crops to the application of major nutrients have been performed in Tasmania and even fewer have been published. Roberts (1989) has summarised the calibration studies for grazed pastures. Thorp and Wallace (1987) introduce a fertiliser model for predicting potato yield. Chapman (1990) compiled the recent work of the DPIF staff on N, P and K requirements of vegetable crops. For the trace elements in the past, half a century there have been a few reports from the observational field trials but nearly none from the experimental investigations.
Although acquisition of this information is a very expensive and time-consuming undertaking, it is essential that at least for the more important trace elements some experimental evaluations be initiated.
Table 2C. The most widely used extractants for assessment of soil micronutrient statusA.
Element Method Soil Interacting Predictive group factor value
B Hot water All types Texture, pH, Excellent AB-DTPA Calcareous OM, Good Acid Acid soils pH,OM
None Poor
Cu DTPA Calcareous None Acceptable DTPA All type pH Good Mehlich 1 Acid soils None Good Mehlich 3 Acid soils None Very good
Zn DTPA Calcareous None Good DTPA Acid pH, lime Very good O.lnhcl Acid None Very good Mehlich 1 Acid None Very good Mehlich 3 Acid None Excellent
Mn DTPA All type None Poor DTPA Calcareous pH Good Mehlich 1 Acid pH Good Mehlich 3 Acid PH Excellent
MO Acid All type None Poor ammoninum oxoiate
pH Good
A compiled mainly from Peck (1990), Jones (1990) and Sims (1989).
9.3.4.7 Diagnostic services in Tasmania
In Tasmania, the lack of information has lead to a situation in which some soil and plant analysis laboratories or consulting companies have adopted the diagnostic techniques that best suited their conditions. Sometimes the techniques are not suitable at all or the use of some techniques has been pushed beyond their capacity or validity. The calibration scales used are arbitrary and little adjustment is made for the variations in soil and regional conditions. In some occasions, one gets the impression that the diagnostic services are used to seduce growers into purchase of unneeded fertilisers. For the trace element tests, the problem is even more serious and incorrect recommendations and large financial losses to growers have recently been reported.
Dr Ali Salardini and Dr Leigh Sparrow (2001). Final Report of the Trace Elements Project PT 320 to Horticulture Australia Limited. Page 94

There are several diagnostic techniques for predicting the trace element requirements of crops and pasture that have successfully been employed in some countries. In Tasmania a correct recommendation encounters major problems:
1. Nearly no diagnostic technique has been scientifically evaluated to recommend trace elements application to crops and pastures.
2. Validity of existing methods employed by some consultants is doubtful.
3. Interpretations of the results of soil and plant analysis are generally based on the knowledge of the individuals rather than following a uniform guideline.
4. The confidence of growers on the value of this service is not at its optimum level due to the lack of a unified approach of parties involved.
Table 3C. Information on the widely adopted universal extractants in the U.S.A. compiled mainly from Peck (1990), Jones (1990) and Sims (1989).
ExtractantA Soil group Elements Status today
1. Morgan (1 935) All acid Soil P, K, Ca, Mg, Cu, Fe, Mn, Abandoned 0.73M sodium acetate p H 4.8
Pot mixes Zn, N03 , NH4, S04, Al, As,Hg,Pb
2. Morgan-Wolf (Wolf All acid soils P, K, Ca, Mg, B, Cu, Fe, Frequently 1983) Morgan Organic soils Mn, Zn, Al, N03 , NH4 used reagent-0.001m
Organic soils
DTPA
3. MehlichNo. 1 Acid sandy soils P, K, Ca, Mg, Na, Mn, Zn Used in (Mehlich 1954) coastal sandy 0.05N HCI + 0.025N H2S04
4. MehlichNo. 3 All acid and neutral P, K, Ca, Mg, Na, B, Cu, It is (Mehlich 1954) 0.2N soils, Fe, Mn, Zn replacing acetic acid + 0.25N (ammoninium
Soilless mixes most other extractants
nitrate+ 0.001 M for acid soils EDTA, pH 2.5
5. AB-DTPA Alkaline soils P, K, Na, Cu, Fe, Mn Zn, Only method (Soltanpour and As, Cd, N0 3 widely used Workman 1979) 1M for alkaline ammonium soils bicarbonate + 0.005M DTPA pH 7.6
6. DTPA (Linsay and Alkaline soils Cu, Fe, Mn, Zn in alkaline Widely Norwell 1978) 0.005 soils adopted MDTPA+0.01M CaCI2 + 0.1MTEA, pH7.3
Dr Ali Salardini and Dr Leigh Sparrow (2001). Final Report of the Trace Elements Project PT 320 to Horticulture Australia Limited. Page 95

AComputer programs for making lime and fertiliser recommendations based on the results of soil test for and crops are available for extractant 2 and 5.1.
There is no quick or cheap solution to all the problems mentioned above. I hope that we would be able to reach an acceptable approach in solving these problems by exchanging views and sharing experiences.
I suggest that the Department of Primary Industry initiate a discussion group from the representatives of the parties involved to examine the problem and search for the solutions. This group should include consulting and soil and plant testing services, fertiliser manufacturers, farmers and graziers associations and the DPIF to examine the problems and search for the solutions.
9.3.5 References
Campbell, P. .H. and Pitt, D. (1988). Diseases of calves (3): Plant poisoning, mineral deficiencies and other diseases. Farmnotes 146, Department of Agriculture, Tasmania.
Chapman, K. S .R. (Ed.) (1990). Vegetable Nutrition. Proceedings of the Vegetable Nutrition seminar. October 1990. Department of Primary Industry, VACB, Devonport, Tasmania.
Cox, F. R. and Kamprath, E. J. 1972. Micronutrient soil tests. In 'Trace elements in Agriculture'. (Ed J. J. Mortvedt, P.M. Giordano and W. L. Lindsay), pp. 289-318. (Soil Science Society of America, Inc. Wisconsin).
Egan, A. R. (1975). The diagnosis of trace element deficiencies in the grazing ruminant. In 'Trace Elements in Soil-Plant-Animal System*. (Ed D. J. D. Nicholas and A. R. Egan). pp. 371-384 (Academic Press, Inc. New York).
Fricke, E. F. (1943). Pasture establishment on ironstone soil at Cressy. Molybdenum deficiency. Tasmanian Joural of Agriculture. 14,69-73.
Fricke, E. F. (1945). Molybdenum trials on pastures in north-western districts Tasmanian Journal of Agriculture. 16, 109-111.
Fricke, E. F. (1944). Molybdenum deficiency. Field experiments at Cressy, Longford and North Motton. Tasmanian Joural of Agriculture. 15, 65-70.
Jones, J. B. (1972). Plant tissue analysis for trace elements. In 'Trace elements in Agriculture'. (Ed J. J. Mortvedt, P.M. Giordano and W. L. Lindsay), pp. 319-346. (Soil Science Society of America, Inc. Wisconsin).
Jones, J. B. (1990). Universal soil extractants: Their composition and use. Communications in Soil Science and Plant Analysis. 21, 1091-1102.
Laughlin, J. C. (1980). The boron nutrition of poppies (Papaver somniferum L.) on krasnozem and alluvial soils of Tasmania. Acta Horticulturae. 96, 227-234.
Morgan, M. F . (1935). The universal soil testing system. Conneticut State Experimental Station Bulletin. 372,457-483.
Dr Ali Salardini and Dr Leigh Sparrow (2001). Final Report of the Trace Elements Project PT 320 to Horticulture Australia Limited. Page 96

Paton, D. F. (1956). Investigations on trace element deficiencies of pastures in Tasmania. Jour. Aust. Instit. Agric. Sci. 22(1), 33-36.
Peck, T. R. (1990). Soil testing: Past, present and future. Commun.Soil Sci. Plant Anal. 21,1165-1186.
Reuter, D. J. and Robinson, J. B. (1986). 'Plant Analysis, an Interpretation Manual'. (Inkata Press, Melbourne).
Roberts, A. H. C. (1989). Improving fertiliser recommendations for Tasmanian dairy pastures. Report on Rural Credit Fellowship with the Department of Primary Industry, Burnie, Tasmania.
Sims, J. T. (1989). Comparison of Mehlich 1 and Mehlich 3 extractants for P, K, Ca, Mg, Mn, Cu and Zn in Atlantic Coastal Plain soils. Communications in Soil Science and Plant Analysis. 20,1707-1726.
Smith, F. W. (1986). Interpretation of plant analysis: Concepts and principles. In 'Plant Analysis, an Interpretation Manual'. (Ed. D. J. Reuter and J. B. Robinson), pp. 1-12. (Inkata Press. Melbourne).
Thorp, J. R. and Wallace, S. P. (1987). A fertiliser model for predicting potato yield based on soil tests. Proceedings of the fourth Australian Agronomy Conference in Melbourne, p. 274.
Dr Ali Salardini and Dr Leigh Sparrow (2001). Final Report of the Trace Elements Project PT 320 to Horticulture Australia Limited. Page 97

This article was presented in many courses held throughout Tasmania in the Whole Farm Planning program organized by by Department of Primary Industry, September 1994.
9.4 Boron for vegetables
Ali Salardini
Crop Nutrition Specialist DPIF, Tasmania
9.4.1 Introduction
To achieve high yields and good quality in our vegetable production, vegetables or any crop should receive balance nutrients composed of major and trace elements. Major elements, nitrogen, phosphorus, potassium, calcium, magnesium and sulphur, are provided by application of mixed fertilisers, lime and dolomite. Trace elements, boron, zinc, copper, manganese and molybdenum are also essential to crops, but are needed, relative to major elements, only in small amounts. Boron is one of the more important trace elements to our vegetable production. Many of you, when growing brassica crops, celery or poppy have used boron fertilisers to correct or prevent boron deficiency. This article answers most of the fundamental questions and provides further information for those who like to know a little more about boron.
The main function of Boron (Chemical symbol B) in plant is related to the growth of root and shoot apical tissues, fruit formation and development, and cell division. That is why B deficiency causes serious reduction in yield and crop quality.
9.4.2 Are crops different in their B requirements?
As regards the B requirements, there is a considerable difference between crops. The usual concentration of B in plants, in most cases, is relative to their need. Table (ID) shows the B demands and B concentration in dried leaves of commercially grown crops in Tasmania. As many growers, besides vegetables, are involved with other crops, this table would help them in knowing B requirements of other enterprises.
9.4.3 What are the symptoms of boron deficiency?
When B deficiency is mild, although yield and quality would deteriorate, no visual symptoms would appear on plant. We call this a hidden deficiency. The symptoms are only visible when there is an acute B deficiency. Only plant analysis can reveal both a hidden and acute deficiency. The symptoms of B deficiency varies in different crops and are describe for some of the vegetables in this article. Please contact us if you would like to know the symptoms on others. As you may notice, in some vegetables, like brassica crops and poppies, the symptom are easily recognised, while in others like beans it could be mistaken with other deficiencies and other information, including soil and plant analysis results may be necessary.
In Brussels sprouts the first sign of boron deficiency is appearance of swellings on the stem and petioles which later become suberised. The leaves are curled and the midribs wrinkled, and older leaves fall prematurely. The stem branches at the top end and the stem pith would be hollow and discoloured. The sprouts are too few, small and loose.
Dr Ali Salardini and Dr Leigh Sparrow (2001). Final Report of the Trace Elements Project PT 320 to Horticulture Australia Limited. Page 98

Table ID. Boron demand of crops and the concentration of B in their dried leaf (mg/kg)
High B-demanding crops
B Cone. Medium B-demanding crops
B Cone. LowB-demanding crops
B Cone.
Vegetables Beetroot Broccoli Brussels sprouts Cabbage Cauliflower Capsicum Celery Sweet corn Tomato
Field
60-80 40-60 30-40
40-60 30-40 40-60 30-60 40-60 40-80
crops
Beans Carrots Lettuce
Onion Peas Potato
20-40 20-30 25-30
20-40 20-30 20-40
Lupin
Fodder and p
50-60
asture plants
Field beans Maize
20-30 10-20
Barley Oats Wheat
5-10 2 -10 5-10
Turnip Lucern
Ornamental s
40-50 30-40
Clovers 25-30 Oats Phalaris Rye grass
5-15 5-10 5-10
Carnations Rose Geranium
Fruits
30-60 30-60 30-60
Azalea 15-25
Apple Strawberry Vine Others
30-50 50 -100 30-50
Cherries Plums
20-30 20-30
Peach 10-20
Poppy 90 -120
The characteristic symptom of B deficiency in celery, lettuce and Chinese cabbage is the cracking of upper surface of midribs and petioles which will later turn brown
In severe B deficiency, poppy plants are thin and stunned, leaves are rolled upward and lamina becomes chlorotic between the veins. Growing points die and flower formation drastically reduced. In less severe B deficiency, plant appearance is normal, except for some stems that may be twisted and capsules are deformed. A part of capsule wall turn yellow and later brown, and stops growing. The growth of other parts forces the capsules to bend to one side. Under the damaged wall, tissues and seeds are damaged, gummy and turn light brown to black. Yield of capsule and seed, and morphine concentration decreases even with mild B deficiency.
Dr Ali Salardini and Dr Leigh Sparrow (2001). Final Report of the Trace Elements Project PT 320 to Horticulture Australia Limited. Page 99

The symptoms of boron deficiency on beetroot turnip, sewed and most other root crops are the development of internal black or brown spots and hollow area. When these zones occur at beet surface, disease organisms may enter and canker may develop. These disorders render the roots unmarketable.
Beans are both sensitive to B deficiency and toxicity. Boron deficient plants are stunned, compact and produce several lateral shoots at the base of stem. Growing points are shrivelled and may blacken and die. Flower buds are compressed together and may be shed without opening. Pods are small and twisted.
9.4.4 Where and when B deficiency may occur?
Boron deficiency is most likely to occur in light textured and sandy soils in high rainfall area. This will includes most of sandy coastal soils in northern Tasmania. Another likely condition for the occurrence of B deficiency is the acid soils with naturally low B parent material. This will cover most krasnozem soils in north and northwest Tasmania. Some krasnozem soils are high in organic matter and B release from organic matter could supply sufficient B to a low to medium B-demanding crop, but not to the high B-demanding crops.
When soil is very low in B nearly all crops and in most conditions develop B deficiency, but if B deficiency is mild, other factors including the need of crop, liming, nitrogen fertiliser and soil moisture may influence the extent of damage to the crops. These factors have little or no effect on B supply to crop if soil was supplied with sufficient B.
In soils with marginal B availability low or medium B-demanding crops like cereal grains, peas, carrots and onion may find enough B to get them through the season without a serious deficiency damage. However, the yield and quality of brassica crops, celery and poppy in these soils would suffer.
Liming induces boron deficiency on most crops in medium-B soils. We have frequently seen this problem in poppy crops in red soils of northern Tasmania. It is also possible that by liming hidden B deficiencies had occurred with other crops and had not been recognised. It is essential to apply B to even medium B-demanding crops if lime has been applied recently.
High rates of nitrogen may also cause B deficiency. Growers in northern Tasmania have experienced this with poppy, brassica crops and celery. In some instances high K and P fertilisers may induce B deficiency, but not as commonly as with the N fertilisers.
Delay in rain or irrigation could also increase the chance of boron deficiency in high B-demanding crops. Although supply of water may correct the deficiency, but some damage has certainly been inflicted.
9.4.5 Are there tests to identify or predict the B needs?
Yes there are. There are B soil tests which determine the soil available B. The results of soil test together with the knowledge of the paddock history in relation to lime and B applications can predict the need of B for the crop that you intend to grow. If the results of plant analysis of current crop is available and showed to be low in B, you would be certain that next crop need B application.
Plant analysis for B is an efficient way of knowing whether you should apply B to the current crop as post-emergence treatment. Plant analysis is normally done automatically and the concentrations of a range of elements are reported. The results is,
Dr Ali Salardini and Dr Leigh Sparrow (2001). Final Report of the Trace Elements Project PT 320 to Horticulture Australia Limited. Page 100

therefore, may be used to identify the need for other nutrients. When recommendation of fertilisers are based on pre-planting soil results and paddock history, there will, normally, be no need for plant analysis.
The methods of soil and plant analysis vary with different laboratories and the interpretation of results depends on the method used and soil characteristics. The recommendation of B based on soil and plant analysis is therefore requires further information and it is best left to experts and the consultants, who provide the service.
Table 2D. Single and mixed B fertilisers marketed in Tasmania
Material Mode of use in order B % kg of material of preference needed for 1 kg B
Borax Soil and foliar 11.3 8.9
Boric acid Soil and foliar 17.5 5.7
Solubor® Foliar and soil 20.5 4.9
B in mixed solid fertilisers Soil Varies -
B in mixed liquid fertilisers Foliar and soil Varies -
B fertiliser in liquid form Foliar and soil Varies -
9.4.6 What B fertilisers are available?
Several B fertilisers are marketed in Tasmania and could be used to prevent or cure boron deficiency. Although B fertilisers are marketed under different trade names, they contain one of the first three materials shown in Table (2D).
9.4.7 How B fertilisers are applied?
The amounts of B fertilisers applied are usually less than 20 kg/ha and would be difficult to be spread uniformly. If there are hot spots after spreading B fertiliser, plants may be burnt or even die of B toxicity in those spots. It is recommended to apply your B fertiliser in one of following ways to prevent plant injury. Boron fertilisers are compatible with most liquid and solid mixed fertilisers:
1. Mix B fertiliser with NPK solid fertilisers and band-place or broadcast the mixture. Some companies custom formulate fertilisers at your request.
2. Mix B fertiliser with N fertiliser and top-dress the crop.
3. Dissolve B fertiliser in water, alone or as an addition to soluble or liquid NPK fertilisers, and spray to the foliage or to the soil.
4. Use liquid B fertiliser for foliar or soil spray or aerial application (if recommended on the package).
9.4.8 Could B fertilisers be mixed with pesticides sprays?
As crops are frequently sprayed with pesticides (includes herbicides, insecticides and fungicides) it would be cheaper and more convenient if B fertilisers could be mixed with them and applied in one operation. To be on the safe side, always follow the instruction given on the label or test the compatibility of B fertilisers with the intended
Dr Ali Salardini and Dr Leigh Sparrow (2001). Final Report of the Trace Elements Project PT 320 to Horticulture Australia Limited. Page 101

pesticide sprays in advance. Boron fertilisers may be safely mixed with liquid and foliar fertilisers.
Solubor® is designed primarily for spray application and can be mixed with nearly all pesticides, and you could contact the supplier to get the list of spray chemicals compatible with it.
Borax is an alkaline chemical and is not compatible with most pesticides. Use borax solution alone or test its compatibility before mixing. Borax may be mixed with liquid fertilisers.
Boric acid is placed between the two and is compatible with many pesticides, but still it is better checking it in advance. For other B foliar fertilisers follow the label instruction or test the compatibility.
9.4.9 What rates should be applied?
The amounts of B fertiliser depend on method of application and the demand of crop. Using B less than lower rate mentioned in Table (3D) normally have little or no effect on correcting or preventing B deficiency. The lower rates in the Table (3D) are for crops with medium B demand. The higher rates are for high demanding vegetables. Half the lower rate is applied to low B-demanding crops. For foliar application, dissolve the recommended amounts in 300 - 500 litres of water add the recommended rate of surfactant (usually 0.5 - 1 in 1000) and spray until it drips from plants. Foliar application may be repeated fortnightly up to 3 times.
Table 3D. The rates of common B fertilisers applied to vegetables
Fertiliser Pre-planting Post-planting Fertiliser
Broadcast Band-placed Top-dressed Foliar
Borax 10-20 5-10 5-10 1-2
Boric acid 7.5 - 15 3 - 8 3 - 8 0.5-1
Solubor® 5-10 2.5-5 2.5-5 0.25 - 1
Others Follow the instruction on the label
Pre-planting application of B may be combined with herbicide applications. Solubor® may be added to the tank at up to 7% and spray the soil. Other B fertilisers may also be used in the same way, but their solubility may be a problem for low volume sprays.
If during your crop rotation you apply equivalent of 10 - 20 kg borax to brassica crops or poppy, the soil B would be kept sufficiently high to provide enough B to other crops in the rotation.
9.4.10 Do you like to know more about B?
Please contact Dr Ali Salardini, Senior Research Fellow, Soils and Plant Nutrition, Tasmanian Institute of Agricultural Research (TIAR),University of Tasmania, New Town Laboratories, 13 St Johns Avenue, New Town, Tasmania, Australia 7008, Telephone: 03 6233 7638, 0417 385 576, Fax: 03 6233 6145, Another E-mail: [email protected]/.
Dr Ali Salardini and Dr Leigh Sparrow (2001). Final Report of the Trace Elements Project PT 320 to Horticulture Australia Limited. Page 102

This article was published in the Tasmanian Country
9.5 Plant testing, Is there Anything in it for You? By Ali Salardini
When plants suffer from a shortage, excess or imbalance of nutrients their tissue chemical composition would be affected. That is why when your crop doesn't perform well enough, plant tests are suggested as diagnostic tools. If fertiliser recommendations were based on the results of soil analysis and paddock history, plant tests would rarely be needed. There are occasions; of course, those plant tests could be very useful in the diagnosis of deficiencies and fertiliser recommendation:
When through the fault of our own or not, we have a problem and we would like to know whether that is related to plant nutrition, especially in the case of trace element deficiencies.
Soil nitrogen and nitrogen fertilisers, in all soil types, and potassium in sandier soils, could be easily leached out of plant reach by rain or over-irrigation. With plant test we would be able to predict whether there is a need for top-dressing of these fertilisers.
Plant tests can also tell us about the nutrient reserve in the soil and can help us in our fertiliser recommendations to the current and succeeding crops.
There are two types of plant tests: plant analysis and sap test. In plant analysis, certain part of plant is sampled, dried, ground, ashed and analysed for different elements. While for sap test the sap is expressed from plant tissue and directly used for analysis.
To be able to make a good recommendation by sap test or plant analysis the test results should be compared with critical levels. The critical level of nutrients for plant analysis has been worked out nationally and internationally and the method is efficient and reliable, but the turnaround time may be up to two weeks. For some crops this is too long.
For the sap test the critical levels have also been worked out for nitrogen and to a lesser extend for potassium internationally and adapted by the DPIF and Serve-Ag for Tasmania. Sap test can, therefore, be used efficiently for nitrogen and potassium, with turnaround time of 1 or 2 days. Serve-Ag is also using sap test for phosphorus and trace elements. Their method has been developed by comparing the results of many tests that they have done for the growers. Although the sap test for P and trace elements can be used as a general guide, they are yet to be improved for accurate diagnoses.
The results of both sap test and plant analysis are affected by time of sampling, environmental conditions and plant growth stage. Interpretation of plant tests and fertiliser recommendations should take the sampling method, paddock history, soil type, and possible economic returns into consideration. If you have decided to use plant tests, leave the details to the specialist.
It always pays to plan long ahead of planting. Talk to your adviser, discuss your paddock history, results of previous analyses, water availability, your previous problems relevant to that crop with him or her and get your soil analysed if needed a month or two before planting. Use recommended type and rate of fertiliser. This reduces the risk of sacrifying the yield or wasting the fertiliser and normally there would no need for plant test.
Dr Ali Salardini and Dr Leigh Sparrow (2001). Final Report of the Trace Elements Project PT 320 to Horticulture Australia Limited. Page 103

In most cases, when a symptom of nutrient deficiency appears on the crop, it would be too late to recover all the losses by top-dressing or foliar feeding. Top-dressing and foliar applications (except for N) are generally less effective than soil applications at or before
Planting. So don't wait for the symptoms. Prevention is cheaper and more assured than the cure.
Dr Ali Salardini and Dr Leigh Sparrow (2001). Final Report of the Trace Elements Project PT 320 to Horticulture Australia Limited. Page 104

Soil test for trace elements essential
Soil test for trace elements essential
Fodhside= HKSfAKCI I at Ihe
Furlhside Vegetable Re-search Sl,ith>n and on I'livalr properties last tenon his shown ll:nt recommendations for (rap? elements should be
ased on soil tests
• More than JH'.HI.OOO is spent annually on trace element fertlllM'rs for vegetables and puppies hi Tasmania. Despite litis, there arc a till frr. q ieut reports or trace dement deficiencies In these crops. There is also speculation that trace elements have been unnecessarily rcc. oi'iruended in some In. stances.
Pari of < three-year p r o g r a in in a , I a a ( season's » n r k was undertaken lo see how useful (race elements were when applied using prorednioj commonly used by r e g e f a b l e growers.
Trials on poppies and :cn beans at Forlhside
ini no potables, broccoli
and Sweet corn en private properties were undertaken.
There wan no improve. mcnl In yield at any of the seven sites, but in some of Ihe potato crojn there ins significant l.m-provement in the tuber iruality. However, at •lies v. linre the soil trace element levels were ail. equate, application of trace elements caused a reduction in yield or In quality of the produce.
The DPTF's rrop nu Irlllon specialist. Dr Ali Sa lan l ln l . said that although these result* were only from one . yeai' i mirk, they Indicated ll iat ( r o w e r s needed to he careful In their use of ttare element* In vegetable production.
" I would j ecu in mend growers only put on trace elements where soil tests clearly show < the soil Is locking those elements," Or 5alardinl said.
$&&*!/&+ *.
Pr All Sj»,'*rr(.'/>;
"Applying rutin when Ihere Is already enough in Ihe full Is not only a waste or money but may lead to toxic levels resulting. ultimately, In loss of yield or quality."
Dr Salaiiliui stressed that there was still a lot ol work t« be done before w* fully understood the role of trace element fertiliser* In vegetable production. ihe DP1F will be riolJlJJ at least two mure seasons of research work In tills area.
If you have a process-Ing cni|i paddock that returns a soil test low In trace elements, and you are prepared for Ihe DP1F to conduct a trUI in that crop, please con tact Dr Salardini on 217*27.
CROP INSPECTION: Dr Sabtdmi inspects a poppy emp which was tehtm! for trace elements prior to planting,
tf?l .Tke.1
H H u i t m t j r e i » - «« i »»» «• u n m t y r m '
;>.WS'" " • • • • • • " » - »
Raporjt| entries for Ulverstone poultry show
THERE was a recoii number of entries In the Ultvrxtoiie Peultry Society's D I M M I show lw»M i t t ie SBOwgrnuntfi • Situntay,
The total of 341 birds entered wis blflk for this time of near, according to loelety president Mr Fet ir May.
Kiihles canie from M far away at i.'erve'l.iii, * l lh birds also IromLautttcston and Congfurd. as well as tne.il5.
Mr Reg Hope. MLI-". opr:i"it the show and Mr Verji Most presented trophies Lo the winners.
Wcsl Atislisllan judges Mr I'ater SSiike and Mr Kevin Nordstrnm said birds in some claues were very good,
Mr Norditiuin luilerd the niid-fenlhcrs, toll-frather bantam.) and water fa " I .
Mr Strike Jiltlui-il Hie wit leathered large and hard fcnlhered baitimui.
The next show runs In conjunction with the UlversEooe Agrknil lira! Show.
r »f*ii»lHt -If.'I If Shft*. Will* WfiurtTiif piK-tl. t'«vW lli-l- r»« . Bl»(k.
Ull WbrttM he** T.fM 11*1*. Wl-frtlhrr lui ' lltoil' FflDdd KiiofrXFrvl. .*rJin S'«4if4-: r*i..
fl^tlr I* trnl Kid IJMIICI. Mm I'Mrrf. tUiSlrilArrMrff: Oi<IA-ix bir« Vrf rork, Rr ble W«l»h: (*t.
SilMk l iaeit F it'l. li"&elf WBinti Salt I'liM* UK»M. I'l'!d \Upi\ tr* . C*' -1 HuT«. Ki-'l rrallnr btnftir.- n«s tlv7<i ifJ., M- Kill* oittrfovl' Hv*tnr drnkmunt. ttiy Mi-irf ;rt«^ »Utfci»r trtLt,
Ajefflril kni Mitt
Station hold-up descri
W he at
Cf (Afl -klfleit f hc'rlln knlfcpi slnre y
Th into Hi Stnmes said SR
Ma either t called |
Off she he* said.
Till and hi-fi her wit advanci
"St charges'
Oni Ihe cat ...r, officers cat," Sf
Ibe Ive leav
HUKNIE C1B has relea.<ctl a dticriplicn of the rlufhfng »Drn by a man who held tip Ihe Somerset Callc*. Service Stal im, on the flaj.i Hwy, at ifu.-ipuiht on Friday nighl. • • • • • " • i • .
Del, SR I Kerry DanicJj said that, accordim to a witness, Ihe..
man was wearing a quarter length Drlrsbom' and brovn pu!l-i>n. Blum
• bouts.
- l ie was alio wearing t balaclava with ftirnted eye and * rough))' cut out RIPU
The offender Is.dejcrlb
tit£VUNroRT - Iltfix* Madstriie Mr , S r. MaUud (Auniiil HI: D M U F » F . Maui.'k-M Its). Chlrheiur Or., rievmimrt, un'PS-iil<ri4 and siilnMrfd niMer wMrif, reRlrtritlAii Uferl rii?tilattdi to ilete^f, fallliiK b>r-el:.-in •i|i|rearta.ibkllsii pt-Hel. IIM, I Ill.TiHh 4M9
D«»Wf W.slKulfKtT..' Hill K x u n IS)- Andrew t'l.iirl t » <K.l. Surrey M, l»»ciflBort>. dr;>:tg wWHt djl(|U4^1l<il, I «eeki'fs^ ii-ifpe'tacdon Ij-iiiauililmndl, IS ahealli** dwq.
' lltfnrr Utditrtle llr 5. !'. MnU.j.f <\uauit is. r-tillllp Jsmu l.>rt-'t: t i l ) . ' Liens 114. Mole t / i t l , ttetrttoi C < »i>. II9M, m re»rr .sq. Jli*iil Mlrhnrl Illy (MX Fnfji VI.. PtviiiiiiMl, HMKfflll s InioitifUns 111jor k S ntwtivx ifhltk, tiw. Adnaa HMu.tl ixli <»), Hik-a m . rjfft LS»vn«|t4rl. usreslsttird pad. unlaiui rd nmtce rehltlc, n^oilin p|*lei' v«tcul4teS t* drept", unllcen»*d dilv&nK, SSW. I atHithi' .iliu
ULVRRSTOhG ~ Deldit Midnratr Mr S F, Melltid l,lu«iiit IS): rrrrcnte KHia Gnrrlr IIS;, ttaol -y 51, Ff/.*.uiii, mirfS'i'trrd and mlri bred midni rphlcle,
(JM. UtcpVii M,« rrriu* III), Will . Vlverilbaa. 1*111*1 lo five WIJ, dls: i i iwid sar«. Stj|Q.ld>9ttriiBs<iiiii«.
Ceollrtjr ChlKfm l:»\ n«Hjlfe It jtiiln, estfrslorrnf aad. awlAftirvil
.•tpbirh SIM. Grtgwy IUS>«rl llfrr Fe»<Lln Cif*v»n f*»rfc. fpHdlna. 4«merll p ln i; tv««d.A|C Sltff,
. l.-ni-jt KwiTfy til). Un* SI. t'lvt r<> r«illni K (Jit), MW. » tf" l" d lipurs' coin muiiHy irrvlee. Shinr Ansell (HI, UmiiluM Bj- Ciwlar, Rr dtlw »IUi ilcnfarl h . M y . , flail Irlvln/ SSrW, J Jt lr l ' i l l iq. I s
' prib*Uon. F4 Ihitii*' -(immunity s Hirry F.»... h .'.ckir.n (til, »«!• l | i l i iua», imlktiKed and htrvf: Lr«llrr. 11% CsiiiMnn Akrih Va<j<
J Abbot &l, |ji»r»i^ff. ilnteftJilTd i lu i . 1 nwMhi- din Douglas atarltl i;a>, AMre St, UUKtlod*. fcuirent*t*r fsitnitirtd RM4or wftrirlv. tl O- L
, tfell l lm« iM), $aundrld(e lid, fsecdlns, lur. ) 4fta>erll piilntt: w lirrd iteitar vthlrW- SI7S: unlniur liiele, 1179 liiTnlcn nr#in«ld Slair I'rettea Milil R.I, Ni.itli NOMHS. Ul terod jtml itnlsuiired mol«r. vraotlf.
Dr Ali Salardini and Dr Leigh Sparrow (2001). Final Report of the Trace Elements Project PT 320 to Horticulture Australia Page 105