the transatlantic economy 2020 - u.s. chamber
TRANSCRIPT

EXECUTIVE SUMMARY
Annual Survey of Jobs, Trade and Investment between the United States and Europe
Daniel S. Hamilton and Joseph P. Quinlan
THE
TRANSATLANTIC ECONOMY 2020
EXECUTIVE SUMMARY
Annual Survey of Jobs, Trade and Investment between the United States and Europe
Daniel S. Hamilton and Joseph P. Quinlan
THE
TRANSATLANTIC ECONOMY 2020
Table of contents
Transatlantic Investment: Still Driving the Transatlantic Economy 8
Transatlantic Trade 15
Transatlantic Services 17
The Transatlantic Digital Economy 20
Transatlantic Jobs 24
The Transatlantic Energy Economy 28
The Transatlantic Innovation Economy 30
3
The world’s largest and most important market
4
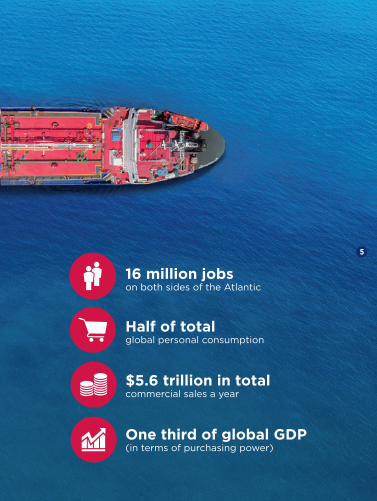
16 million jobs on both sides of the Atlantic
Half of total global personal consumption
$5.6 trillion in total commercial sales a year
One third of global GDP (in terms of purchasing power)
5
• Despite transatlantic political turbulence, the U.S. and Europe remain each other’s most important markets. The transatlantic economy generates $5.6 trillion in total commercial sales a year and employs up to 16 million workers in mutually “onshored” jobs on both sides of the Atlantic. It is the largest and wealthiest market in the world, accounting for half of total global personal consumption and close to one-third of world GDP in terms of purchasing power.
• Ties are particularly thick in foreign direct investment (FDI), portfolio investment, banking claims, trade and affiliate sales in goods and services, mutual R&D investment, patent cooperation, technology flows, and sales of knowledge-intensive services.
Thriving Together No two other regions in the world are as deeply integrated as the U.S.
and Europe
6
Investment
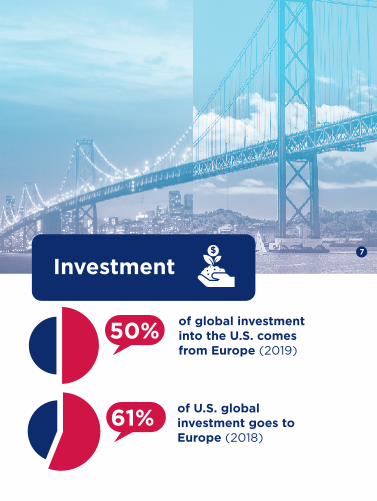
of global investment into the U.S. comes from Europe (2019)
61%of U.S. global investment goes to Europe (2018)
50%
7

Transatlantic Investment: Still Driving the Transatlantic Economy
• Trade alone is a misleading benchmark of international commerce; mutual investment dwarfs trade and is the real backbone of the transatlantic economy. The U.S. and Europe are each other’s primary source and destination for foreign direct investment.
• Together the U.S. and Europe accounted for 27% of global exports and 32% of global imports in 2018. But together they accounted for 63% of the outward stock and 58% of the inward stock of global FDI. Moreover, each partner has built up the great majority of that stock in the other economy. Mutual investment in the North Atlantic space is very large, dwarfs trade, and has become essential to U.S. and European jobs and prosperity.
• European firms based in the U.S. accounted for 51% of the $383 billion in U.S. exports by U.S.-based foreign affiliates in 2017. UK, German and Dutch firms based in the U.S. accounted for 63% of U.S. exports by European companies in 2017.
• U.S. foreign affiliate sales in Europe of $3.2 trillion in 2018 were greater than total U.S. exports to the world of $2.5 trillion and roughly half of total U.S. foreign affiliate sales globally.
• Foreign investment and affiliate sales drive transatlantic trade. 63% of U.S. imports from the EU consisted of intra-firm trade in 2018 - much higher than U.S. intra-firm imports from Asia-Pacific nations (around 40%) and well above the global average (49%). Percentages are notably high for Ireland (88%) and Germany (70%).
• Intra-firm trade also accounted for 37% of U.S. exports to Europe and 57% to the Netherlands, 35% to Germany and 30% to France.
The U.S. in Europe
• Over many decades no place in the world has attracted more U.S. FDI than Europe. During the past decade Europe attracted 57.5% of total U.S. global investment – more than in any previous decade.
8
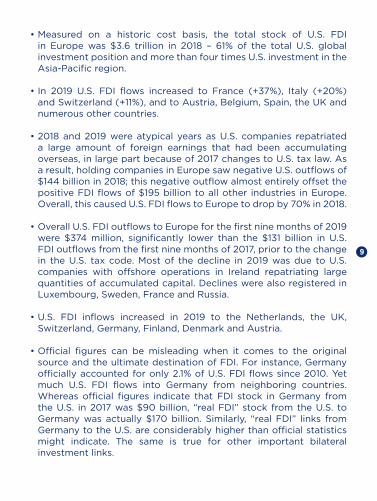
• Measured on a historic cost basis, the total stock of U.S. FDI in Europe was $3.6 trillion in 2018 – 61% of the total U.S. global investment position and more than four times U.S. investment in the Asia-Pacific region.
• In 2019 U.S. FDI flows increased to France (+37%), Italy (+20%) and Switzerland (+11%), and to Austria, Belgium, Spain, the UK and numerous other countries.
• 2018 and 2019 were atypical years as U.S. companies repatriated a large amount of foreign earnings that had been accumulating overseas, in large part because of 2017 changes to U.S. tax law. As a result, holding companies in Europe saw negative U.S. outflows of $144 billion in 2018; this negative outflow almost entirely offset the positive FDI flows of $195 billion to all other industries in Europe. Overall, this caused U.S. FDI flows to Europe to drop by 70% in 2018.
• Overall U.S. FDI outflows to Europe for the first nine months of 2019 were $374 million, significantly lower than the $131 billion in U.S. FDI outflows from the first nine months of 2017, prior to the change in the U.S. tax code. Most of the decline in 2019 was due to U.S. companies with offshore operations in Ireland repatriating large quantities of accumulated capital. Declines were also registered in Luxembourg, Sweden, France and Russia.
• U.S. FDI inflows increased in 2019 to the Netherlands, the UK, Switzerland, Germany, Finland, Denmark and Austria.
• Official figures can be misleading when it comes to the original source and the ultimate destination of FDI. For instance, Germany officially accounted for only 2.1% of U.S. FDI flows since 2010. Yet much U.S. FDI flows into Germany from neighboring countries. Whereas official figures indicate that FDI stock in Germany from the U.S. in 2017 was $90 billion, “real FDI” stock from the U.S. to Germany was actually $170 billion. Similarly, “real FDI” links from Germany to the U.S. are considerably higher than official statistics might indicate. The same is true for other important bilateral investment links.
9
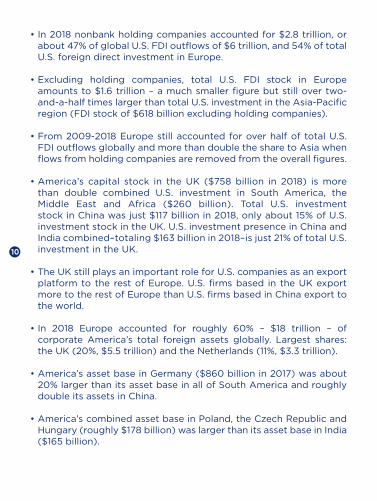
• In 2018 nonbank holding companies accounted for $2.8 trillion, or about 47% of global U.S. FDI outflows of $6 trillion, and 54% of total U.S. foreign direct investment in Europe.
• Excluding holding companies, total U.S. FDI stock in Europe amounts to $1.6 trillion – a much smaller figure but still over two-and-a-half times larger than total U.S. investment in the Asia-Pacific region (FDI stock of $618 billion excluding holding companies).
• From 2009-2018 Europe still accounted for over half of total U.S. FDI outflows globally and more than double the share to Asia when flows from holding companies are removed from the overall figures.
• America’s capital stock in the UK ($758 billion in 2018) is more than double combined U.S. investment in South America, the Middle East and Africa ($260 billion). Total U.S. investment stock in China was just $117 billion in 2018, only about 15% of U.S. investment stock in the UK. U.S. investment presence in China and India combined–totaling $163 billion in 2018–is just 21% of total U.S. investment in the UK.
• The UK still plays an important role for U.S. companies as an export platform to the rest of Europe. U.S. firms based in the UK export more to the rest of Europe than U.S. firms based in China export to the world.
• In 2018 Europe accounted for roughly 60% – $18 trillion – of corporate America’s total foreign assets globally. Largest shares: the UK (20%, $5.5 trillion) and the Netherlands (11%, $3.3 trillion).
• America’s asset base in Germany ($860 billion in 2017) was about 20% larger than its asset base in all of South America and roughly double its assets in China.
• America’s combined asset base in Poland, the Czech Republic and Hungary (roughly $178 billion) was larger than its asset base in India ($165 billion).
10

• America’s assets in Ireland alone ($1.7 trillion in 2017) were much larger than either those in France ($408 billion), or Switzerland ($1 trillion), and light years ahead of those in China ($446 billion).
• Ireland has also become the number one export platform for U.S. affiliates in the entire world. Exports from U.S. affiliates based in Ireland reached $288 billion in 2017, four times more than U.S. affiliate exports from China and about three times more than from Mexico.
• Total output of U.S. foreign affiliates in Europe ($740 billion) and of European affiliates in the U.S. ($666 billion) in 2018 was greater than the output of such countries as Indonesia, Mexico, the Netherlands, or Turkey.
• Aggregate output of U.S. affiliates globally reached $1.5 trillion in
2018; Europe accounted for 51% of the total.
• U.S. affiliate output in Europe ($715 billion) in 2017 was roughly double affiliate output in all of Asia ($362 billion). U.S. affiliate output in China ($72 billion) and India ($35 billion) pale in comparison to U.S. affiliate output in the UK ($180 billion), Germany ($85 billion), or even Ireland ($97 billion).
• Sales of U.S. affiliates in Europe were 70% larger than the comparable figures for the entire Asian region in 2017. Affiliate sales in the UK ($643 billion) were double total sales in South America. Sales in Germany ($339 billion) were over double the combined sales in Africa and the Middle East.
• We estimate that U.S. affiliate income in Europe reached a record $295 billion in 2019 – more than 60% larger than a decade earlier.
• U.S. affiliate income from Europe of $217 billion in the first nine months of 2019 was 1.5 times more than combined U.S. affiliate income in Latin America and Asia (each with $76 billion in profits).
11

• U.S. affiliate income in China in the first three quarters of 2019 ($9.9 billion), however, was more than combined affiliate income in Germany ($4.1 billion), Spain ($2.9 billion) and France ($2.5 billion), and income in India ($3.7 billion) was well more than that earned in many European countries.
Europe in the U.S.
• Europe accounted for half ($125 billion) of the $251 billion in global FDI that flowed into the U.S. in 2019.
• UK firms were the largest source of greenfield foreign investment projects in 19 U.S. states during the ten-year period from October 2009-September 2019. German companies led in 15 states, followed by Canadian companies in 8 states and Japanese companies in 7.
• German investment flows to the United States grew 53% in the first three quarters of 2019, while flows from Spain and Sweden were almost triple the amount of flows received during the first three quarters of the year before. U.S. inflows from France, Ireland, Italy, the Netherlands, Switzerland and the UK were all lower in the first three quarters of 2019 than the same period a year earlier.
• Europe accounted for roughly 68% of the $4.3 trillion invested in the United States in 2018 on a historic cost basis. Total European stock in the U.S. of $3.0 trillion was four times the level of comparable investment from Asia.
• The bulk of the capital was sunk by British firms (with total UK stock amounting to $561 billion), the Netherlands ($479 billion), Luxembourg ($356 billion), Germany ($324 billion), Switzerland ($310 billion), and France ($292 billion).
• In 2017 total assets of European affiliates in the U.S. were an estimated $8.1 trillion. The UK ranked first, followed by Germany, Switzerland and France.
12
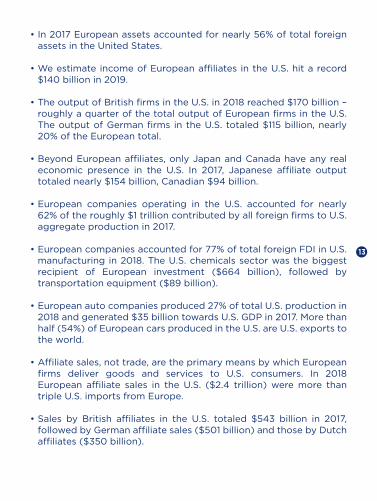
• In 2017 European assets accounted for nearly 56% of total foreign assets in the United States.
• We estimate income of European affiliates in the U.S. hit a record $140 billion in 2019.
• The output of British firms in the U.S. in 2018 reached $170 billion – roughly a quarter of the total output of European firms in the U.S. The output of German firms in the U.S. totaled $115 billion, nearly 20% of the European total.
• Beyond European affiliates, only Japan and Canada have any real economic presence in the U.S. In 2017, Japanese affiliate output totaled nearly $154 billion, Canadian $94 billion.
• European companies operating in the U.S. accounted for nearly 62% of the roughly $1 trillion contributed by all foreign firms to U.S. aggregate production in 2017.
• European companies accounted for 77% of total foreign FDI in U.S. manufacturing in 2018. The U.S. chemicals sector was the biggest recipient of European investment ($664 billion), followed by transportation equipment ($89 billion).
• European auto companies produced 27% of total U.S. production in 2018 and generated $35 billion towards U.S. GDP in 2017. More than half (54%) of European cars produced in the U.S. are U.S. exports to the world.
• Affiliate sales, not trade, are the primary means by which European
firms deliver goods and services to U.S. consumers. In 2018 European affiliate sales in the U.S. ($2.4 trillion) were more than triple U.S. imports from Europe.
• Sales by British affiliates in the U.S. totaled $543 billion in 2017, followed by German affiliate sales ($501 billion) and those by Dutch affiliates ($350 billion).
13
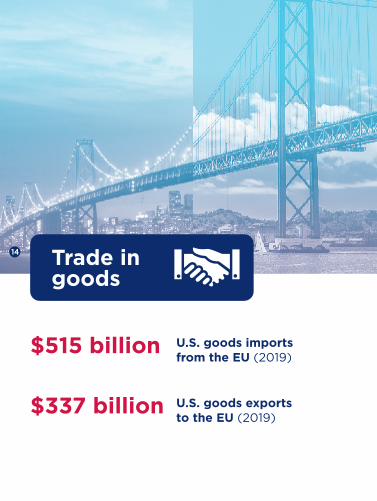
Trade in goods
U.S. goods exports to the EU (2019)
$337 billion
U.S. goods imports from the EU (2019)
$515 billion
14
Transatlantic Trade
• U.S. merchandise exports to the EU rose by 5.9% in 2019 to a record $337 billion. Notably strong export markets included Belgium (U.S. exports up 11% in 2019), Spain (+15%), Austria (+60%), Bulgaria (+25%) and Denmark (+22%).
• The U.S. annual merchandise trade deficit with the EU, at $178 billion in 2019, was at a record high, up 5% from the year earlier. The U.S. deficit with China ($345 billion) is more than double the U.S. deficit with the EU.
• The U.S. and the EU are each other’s largest trading partners. U.S. goods exports to the EU in 2019 ($337 billion, up 6%) were over 3 times more than U.S. goods exports to China ($107 billion).
• The U.S. imports 29% of total EU auto exports; the EU imports 19% of total U.S. car exports.
• U.S. exports to Europe were up 11% in 2018 over 2017, and have almost doubled in value since 2000. Twenty-two U.S. states registered double-digit growth in goods exports to Europe from 2017 to 2018.
• 48 of the 50 U.S. states export more to Europe than to China, in many cases by a wide margin. America’s five Pacific coast states exported about 50% more goods to Europe than to China.
• In 2018 New York exports to Europe were more than 8 times those to China. Louisiana, Kentucky, Florida and Pennsylvania each sent more than four times the amount of goods to Europe than China. California, Texas, Michigan, Illinois and Ohio each exported more than twice as much to Europe as to China.
• Germany was the top European export market for 18 U.S. states and the UK for 12 in 2018.
15

Trade in services
$312 billion
$236 billion
U.S. to Europe
(2018)
Europe to the U.S.(2018 )
16
Transatlantic Services
• The U.S. and Europe are the two leading services economies in the world. The U.S. is the largest single country trader in services, while the EU is the largest trader in services among all world regions. The U.S. and EU are each other’s most important commercial partners and major growth markets when it comes to services trade and investment. Moreover, deep transatlantic connections in services industries, provided by mutual investment flows, are the foundation for the global competitiveness of U.S. and European services companies.
• Four of the top ten export markets for U.S. services are in Europe. Europe accounted for 38% of total U.S. services exports and for 42% of total U.S. services imports in 2018.
• U.S. services exports to Europe reached a record $312 billion in 2018, up 50% from 2009. The U.S. had a $75 billion trade surplus in services with Europe in 2018, compared with its $202 billion trade deficit in goods with Europe. With the EU the U.S registered a $55 billion trade surplus in services, versus a $170 billion trade deficit in goods.
• U.S. imports of services from Europe also hit an all-time high in 2018 of $236 billion, up over 40% from 2009. The UK, Germany, Switzerland, Ireland, France and Italy are top services exporters to the U.S.
• Moreover, foreign affiliate sales of services, or the delivery of transatlantic services by foreign affiliates, have exploded on both sides of the Atlantic over the past few decades and become far more important than exports.
• We estimate that sales of services of U.S. affiliates in Europe rose by around 5%, to $882 billion, in 2018, 2.8 times more than U.S. services exports to Europe of $312 billion.
17

• The UK alone accounted for 30% of all U.S. affiliate sales in Europe in 2017 – $247 billion, greater than combined affiliate sales in South and Central America ($122 billion), Africa ($14 billion) and the Middle East ($21 billion).
• On a global basis, Europe accounted for roughly 54% of total U.S. affiliate services sales.
• European affiliate sales of services in the U.S. of $607 billion in 2017 were about 28% below U.S. affiliate sales of services in Europe.
• Nonetheless, European companies are the key provider of affiliate services in the U.S. Foreign affiliate sales of services in the U.S. totaled $1.1 trillion in 2017; European firms accounted for 56% of the total. British affiliates lead in terms of affiliate sales of services ($153 billion), followed closely by Germany ($148 billion).
• European companies operating in the U.S. generated an estimated $635 billion in services sales in 2018, which is 2.8 times more than European services exports to the U.S. of $237 billion. 18
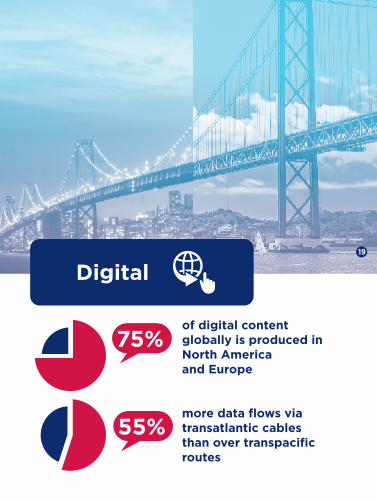
Digital
more data flows via transatlantic cables than over transpacific routes
of digital content globally is produced in North America and Europe
75%
55%
19

The Transatlantic Digital Economy
• Transatlantic flows of data continue to be the fastest and largest in the world, accounting for over one-half of Europe’s data flows and about half of U.S. flows. Almost 40% of those flows are through business and research networks.
• North America and Europe generate about 75% of digital content for internet users worldwide.
• U.S. and European cities (Frankfurt, London, Amsterdam, Paris, Stockholm, Miami, New York, Marseille, Los Angeles, San Francisco) are the world’s foremost hubs for international communication and data exchange.
• Transatlantic cable connections are the densest and highest capacity routes, with the highest traffic, in the world, with an estimated 38% compound annual growth rate until 2025. Submarine cables in the Atlantic carry 55% more data than transpacific routes, and 40% more data than between the U.S. and Latin America.
• The U.S. and Europe are each other’s most important commercial partners when it comes to digitally-enabled services. The U.S. and the EU are also the two largest net exporters of digitally-enabled services to the world.
• In 2018, digitally-enabled services accounted for 55% of all U.S. services exports, 48% of all services imports, and 69% of the U.S. global surplus in trade in services.
• In 2018 the U.S. registered a $178 billion trade surplus in digitally-enabled services with the world. Its main commercial partner was Europe, to which it exported over $213 billion in digitally-enabled services and from which it imported $120 billion, generating a trade surplus with Europe in this area of $93 billion.
20

• U.S. exports of digitally-enabled services to Europe were about 2.6 times greater than U.S. digitally-enabled services exports to Latin America, and double U.S. digitally-enabled services exports to the entire Asia-Pacific region.
• In 2018 EU member states exported $1.39 trillion and imported $1.17 trillion in digitally-enabled services to countries both inside and outside the EU.
• Excluding intra-EU trade, EU member states exported $657.34 billion and imported $523.67 billion in digitally-enabled services, resulting in a surplus of $133.67 billion for these services.
• Digitally-enabled services represented 58% of all EU services exports to non-EU countries and 57% of all EU services imports from non-EU countries.
• In 2018 the U.S. accounted for 32% of the EU’s digitally-enabled services exports to non-EU countries, and 39% of EU digitally-enabled services imports from non-EU countries.
• The U.S. purchased $210.77 billion of EU digitally-enabled services exports, making it the largest non-EU consumer of EU digitally-enabled services exports, accounting for more EU exports than the rest of non-EU Europe ($124.41 billion), and more than all digitally-enabled services exports from the EU to Asia and Oceania ($192.62 billion).
• EU member states with the largest estimated value of digitally-enabled services exports were Germany ($189.8 billion), Ireland ($171.9 billion), the UK ($161.0 billion), and the Netherlands ($154.0 billion).
• Digitally-enabled services are not just exported directly, they are used in manufacturing and to produce goods and services for export. Over half of digitally-enabled services imported by the U.S. from the EU is used to produce U.S. products for export, and vice versa.
21

• In 2018, EU member states imported $1.17 trillion in digitally-enabled services. 55% originated from other EU member states. Another 17% came from the U.S. ($202.02 billion), making it the largest supplier of these services. The EU imported more of these services from the U.S. than from EU member states Germany ($107.0 billion) and the UK ($124.5 billion).
• Even more important than both direct and value-added trade in digitally-enabled services, however, is the delivery of digital services by U.S. and European foreign affiliates.
• 53% of the $838.86 billion in services provided in Europe by U.S. affiliates in 2017 was digitally-enabled.
• In 2017 U.S. affiliates in Europe supplied $444.33 billion in digitally-enabled services, more than double U.S. digitally-enabled exports to Europe.
• In 2017 European affiliates in the U.S. supplied $268.54 billion in digitally-enabled services, 2.2 times greater than European digitally-enabled exports to the U.S.
• In 2017, Europe accounted for 69% of the $259.6 billion in total global information services supplied abroad by U.S. multinational corporations through their majority-owned foreign affiliates.
• U.S. overseas direct investment in the “information” industry in the UK alone was greater than such investment in the entire Western Hemisphere outside the U.S. or such investment combined in the Middle East, Africa and the entire Asia-Pacific region.
22
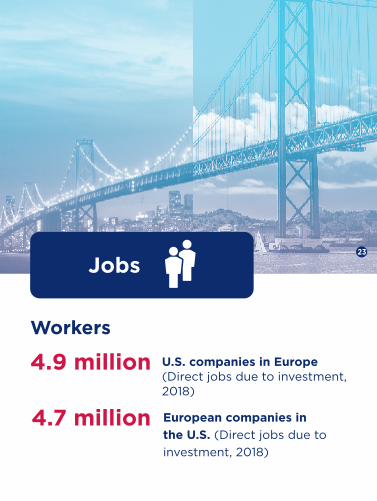
Jobs
4.9 million
4.7 million
U.S. companies in Europe(Direct jobs due to investment, 2018)
European companies in
the U.S. (Direct jobs due to
investment, 2018)
Workers
23

Transatlantic Jobs
• Despite stories about U.S. and European companies decamping for cheap labor markets in Mexico or Asia, most foreigners working for U.S. companies outside the U.S. are European, and most foreigners working for European companies outside the EU are American.
• European companies in the U.S. employ millions of American workers and are the largest source of onshored jobs in America. Similarly, U.S. companies in Europe employ millions of European workers and are the largest source of onshored jobs in Europe.
• U.S. and European foreign affiliates directly employed 9.6 million workers in 2018. Further gains in employment were most likely achieved in 2019.
• These figures understate the overall job numbers, since they do not include
- jobs supported by transatlantic trade flows; - indirect employment effects of nonequity arrangements such as
strategic alliances, joint ventures, and other deals; and - indirect employment generated for distributors and suppliers.
• U.S. affiliates directly employed an estimated 4.9 million workers in Europe in 2018 – close to one-third more than in 2000.
• Roughly 33% of the 14.4 million people employed by U.S. majority-owned affiliates around the world in 2017 lived in Europe; that share is down from 38% in 2008.
• U.S. affiliates employed more manufacturing workers in Europe in 2017 (1.9 million) than they did in 1990 (1.6 million), and about the same as in 2000 (1.9 million). Manufacturing employment has declined in some countries but has rebounded in others.
• Poland has been a big winner: U.S. affiliate manufacturing employment grew more than 2.5 times between 2000 and 2017, rising from 51,000 to over 136,000, and continuing upwards.
24

• In 2017 the UK, France and Germany accounted for less than 50% of U.S. affiliate manufacturing employment in Europe. In 1990 they accounted for 67%. Meanwhile, the combined share of U.S. affiliate manufacturing employment in Poland, the Czech Republic and Hungary jumped from virtually zero in 1990 to nearly 13% in 2017, indicative of the eastern spread of U.S. European operations.
• Manufacturing employment among U.S. affiliates in the UK has declined from 431,000 in 2000 to 308,000 in 2017 and in France from 249,000 to 195,000.
• Manufacturing employment among U.S. affiliates in Germany is near levels seen at the start of the century – 376,000 jobs in 2017, compared to 388,000 in 2000.
• U.S. affiliates employ more Europeans in services than in manufacturing and this trend is likely to continue. Manufacturing accounted for 40% of total employment by U.S. affiliates in Europe in 2017. U.S. affiliates employed nearly 382,000 European workers in transportation and 295,000 in chemicals. Wholesale employment was among the largest sources of services-related employment, which includes employment in such areas as logistics, trade, insurance and other related activities.
• The manufacturing workforce of U.S. affiliates in Germany (376,000) in 2017 was greater than the number of manufacturing workers employed in Brazil (302,000) and India (211,000)–although well below China (764,000).
• European majority-owned foreign affiliates directly employed 4.6 million U.S. workers in 2017–some 123,000 more workers than in 2016.
• Firms from Germany accounted for over half (63,000) of the boost in U.S. employment by European companies between 2016 and 2017.
25

• In 2017 the top five European employers in the U.S. were firms from the United Kingdom (1.2 million), Germany (774,000), France (734,000), the Netherlands (571,000), and Switzerland (454,000).
• European firms employed roughly two-thirds of all U.S. workers on the payrolls of majority-owned foreign affiliates in 2017.
• European companies directly supported 187,000 jobs in the U.S. motor vehicles and parts industry – 43% of total foreign affiliate employment in this industry.
• Texas gained 135,700 jobs (57% more) directly from European investment between 2006 and 2017. Others with significant gains included California – 101,700 jobs added (+29.4%); Illinois 64,400 (+37.6%); New York 59,500 (+21.1%); Florida 54,900 (+34.2%); Pennsylvania 43,400 (+23.8%); North Carolina 42,000 (+27.3%); Massachusetts 41,100 (34.5%); Georgia 39,200 (+34.9%); Michigan 34,500 (+24.5%); Minnesota 33,200 (+65.4%) and Tennessee 29,800 (+39.9%).
• The top five U.S. states in terms of jobs provided directly by European affiliates in 2017 were California (447,200), Texas (371,600), New York (341,600), Illinois (235,700) and Pennsylvania (225,900).
26
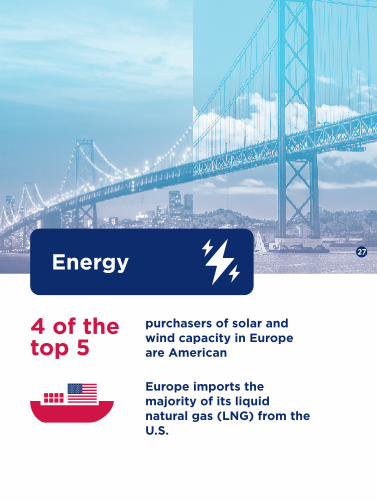
Energy
purchasers of solar and wind capacity in Europe are American
Europe imports the majority of its liquid natural gas (LNG) from the U.S.
4 of the top 5
27
The Transatlantic Energy Economy
• Foreign companies have ploughed almost $400 billion into U.S. energy-related industries. In 2017, FDI in the U.S. energy economy directly supported 154,500 U.S. jobs, contributed $1.1 billion in R&D and generated $5.1 billion in U.S. exports.
• In 2018 European companies accounted for just over half of all FDI in 779 greenfield project investments in the U.S. energy economy.
• German companies are by far are the leading source of foreign direct investment in the U.S. energy economy, accounting for one in five greenfield investment projects in the U.S. energy sector. Other notable European investors include France (9%), Spain (8%), and the UK (8%).
• Between July 2018 and November 2019, U.S. LNG exports to Europe surged by almost 600%, making the U.S. by far the largest LNG exporter to Europe. Europe also imports more U.S. coal than any other world region. The U.S. is a net energy exporter of crude and petroleum products to Europe.
• U.S. companies in Europe have become a driving force for Europe’s green revolution. Since 2007 U.S. companies have been responsible for more than half of the long-term renewable energy agreements in Europe. U.S. companies account for four of the top five purchasers of solar and wind capacity in Europe.
28

Innovation
$33 billion
$44 billion
U.S. companies
in Europe (2017)
European companies
in the U.S. (2017)
R&D spending
29

The Transatlantic Innovation Economy
• Bilateral U.S.-EU flows in R&D are the most intense between any two international partners. In 2017 U.S. affiliates invested $33 billion in research and development in Europe, representing 58% of total global R&D expenditures by U.S. foreign affiliates.
• R&D expenditures by U.S. affiliates were the greatest in Germany ($8.1 billion), the UK ($6.4 billion), Switzerland ($4.7 billion), Ireland ($3.4 billion), France ($2 billion), the Netherlands and Belgium ($1.4 billion each). These seven nations accounted for 84% of U.S. spending on R&D in Europe in 2017.
• In the U.S, R&D expenditures by majority-owned foreign affiliates totaled $63 billion in 2017. R&D spending by European affiliates totaled $44 billion, representing 70% of all R&D performed by majority-owned foreign affiliates in the United States.
• Swiss-owned R&D in the U.S. totaled $10 billion in 2017, nearly a quarter of total European affiliate R&D in the United States. British affiliates accounted for 20%, German for 19.5% and French for 12.2%.
30

Hamilton, Daniel S., and Quinlan, Joseph P., The Transatlantic Economy 2020: Annual Survey of Jobs, Trade and Investment between the United States and EuropeWashington, DC: Foreign Policy Institute, Johns Hopkins University SAIS, 2020.© Foreign Policy Institute, Johns Hopkins University SAIS, 2020
Foreign Policy InstituteThe Paul H. Nitze School of Advanced International StudiesThe Johns Hopkins University1717 Massachusetts Ave., NW, 8th floorWashington, DC 20036Tel: (202) 663-5880Fax (202) 663-5879Email: [email protected]://transatlanticrelations.org ISBN ISBN
American Chamber of Commerce to the European Union (AmCham EU)Avenue des Arts/Kunstlaan 531000 Brussels, BelgiumTel: +32 2 513 68 92Fax: +32 2 513 79 28Email: [email protected] www.amchameu.eu Twitter: @AmChamEU
U.S. Chamber of Commerce1615 H Street NWWashington, DC 20062, USATel: +1 202-659-6000Email: [email protected]: @USCC_Europe
31

Foreign Policy InstituteThe Paul H. Nitze School of Advanced International StudiesThe Johns Hopkins University1717 Massachusetts Ave., NW, 8th floorWashington, DC 20036Tel: +1 202-663-5880Fax: +1 202-663-5879http://transatlanticrelations.org
Desi
gn
by in
extr
em
is.b
e -
Illu
stra
tio
ns:
sto
ck.a
do
be.c
om
THE
TRANSATLANTIC ECONOMY 2020Annual Survey of Jobs, Trade and Investment between the United States and Europe
Daniel S. Hamilton and Joseph P. Quinlan
Supporting partners