the transformations and challenges facing the russian gas
TRANSCRIPT

The Transformations and Challenges
Facing the Russian Gas Industry
Paris
8 October, 2013
Dr. Tatiana Mitrova
Head of Oil and Gas Department
Energy Research Institute of the Russian Academy of Sciences
1
2
4
3
CHANGING GLOBAL GAS MARKETS: IMPLICATIONS FOR THE RUSSIAN GAS EXPORTS
HOW TO BREAK THE DEADLOCK?
2
THE ROLE OF OIL AND GAS FOR THE RUSSIAN ECONOMY
LNG AND DOMESTIC GAS MARKET DEVELOPMENT
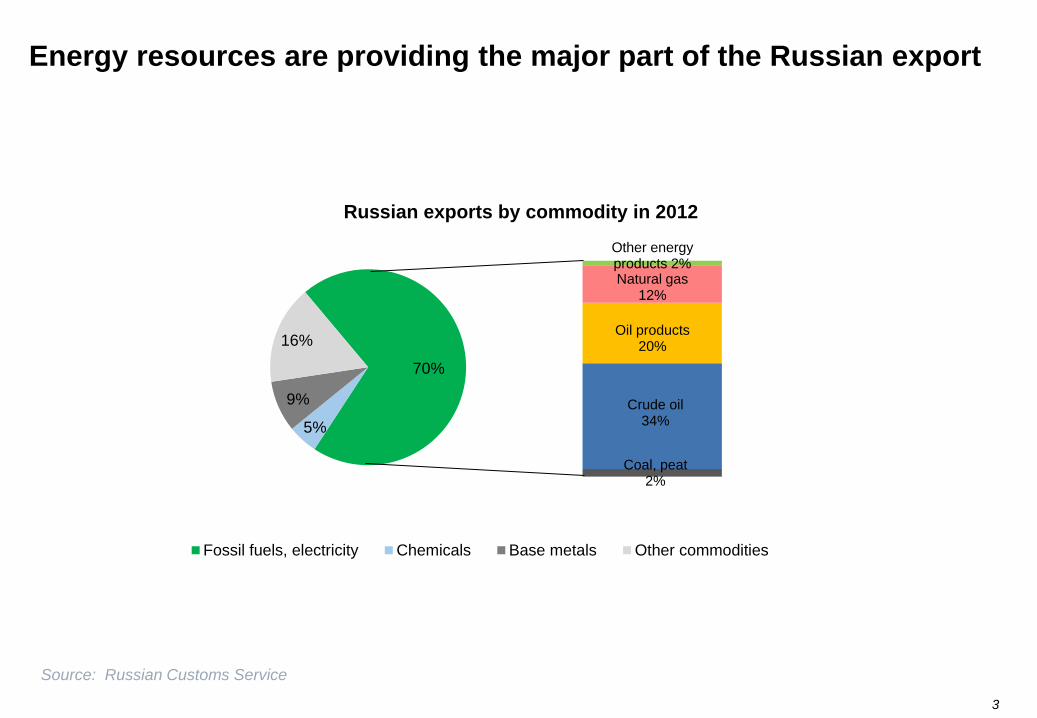
Energy resources are providing the major part of the Russian export
3
70%
5%
9%
16%
Russian exports by commodity in 2012
Fossil fuels, electricity Chemicals Base metals Other commodities
Coal, peat 2%
Crude oil 34%
Oil products 20%
Natural gas 12%
Other energy products 2%
Source: Russian Customs Service
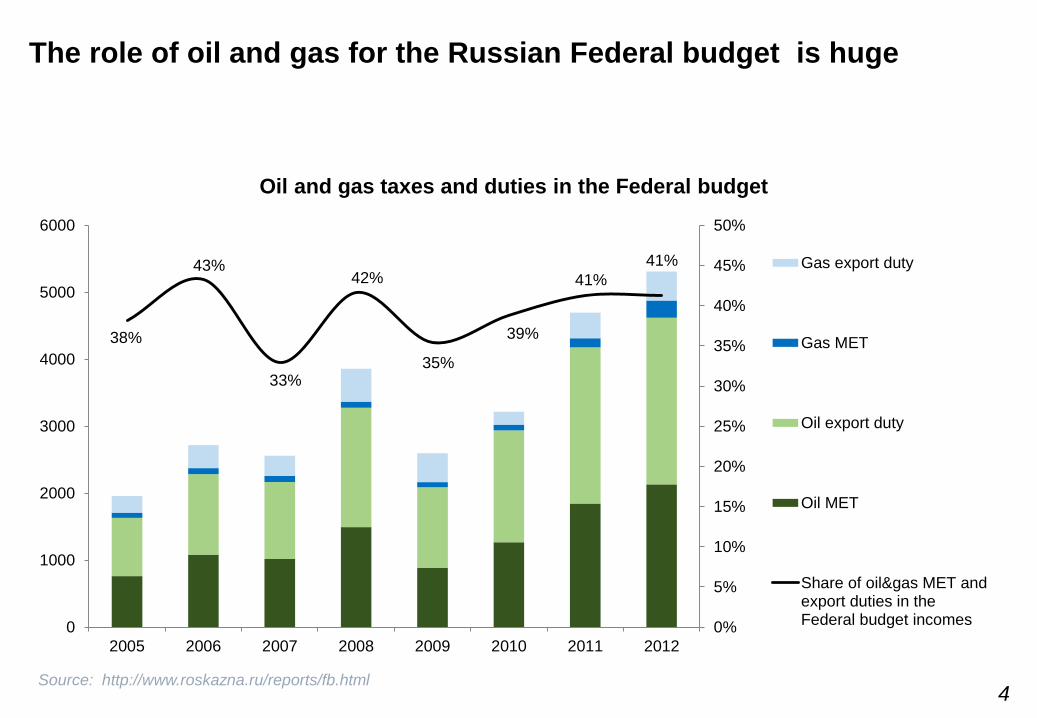
The role of oil and gas for the Russian Federal budget is huge
Oil and gas taxes and duties in the Federal budget
4
38%
43%
33%
42%
35%
39%
41%
41%
0%
5%
10%
15%
20%
25%
30%
35%
40%
45%
50%
0
1000
2000
3000
4000
5000
6000
2005 2006 2007 2008 2009 2010 2011 2012
Gas export duty
Gas MET
Oil export duty
Oil MET
Share of oil&gas MET andexport duties in theFederal budget incomes
Source: http://www.roskazna.ru/reports/fb.html
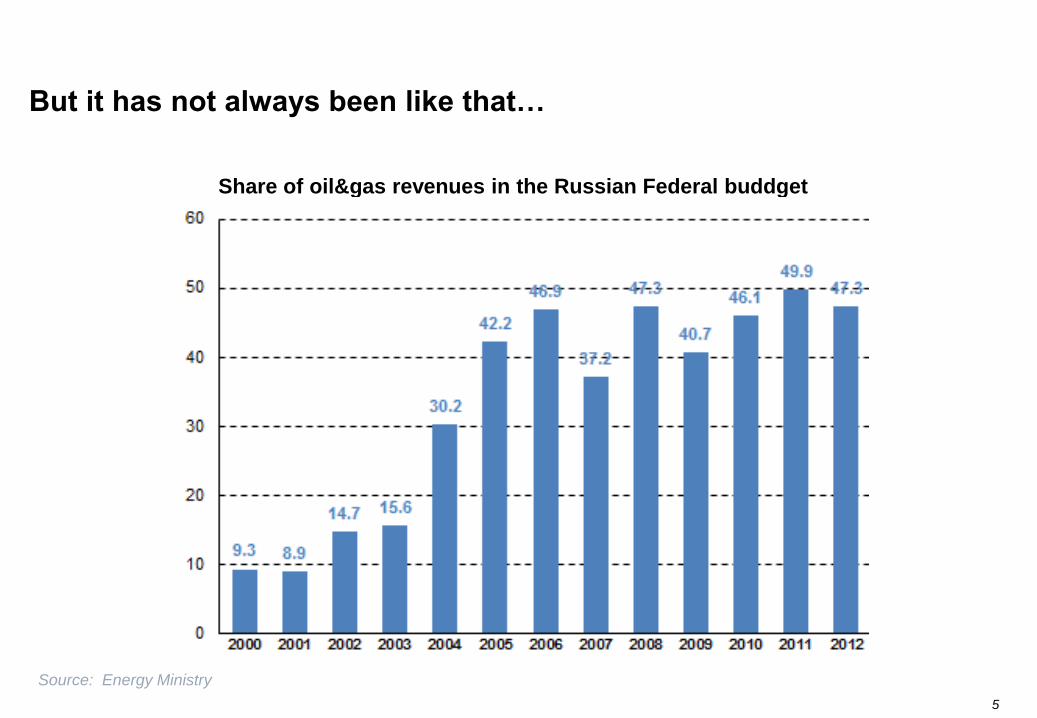
But it has not always been like that…
Share of oil&gas revenues in the Russian Federal buddget
5
Source: Energy Ministry
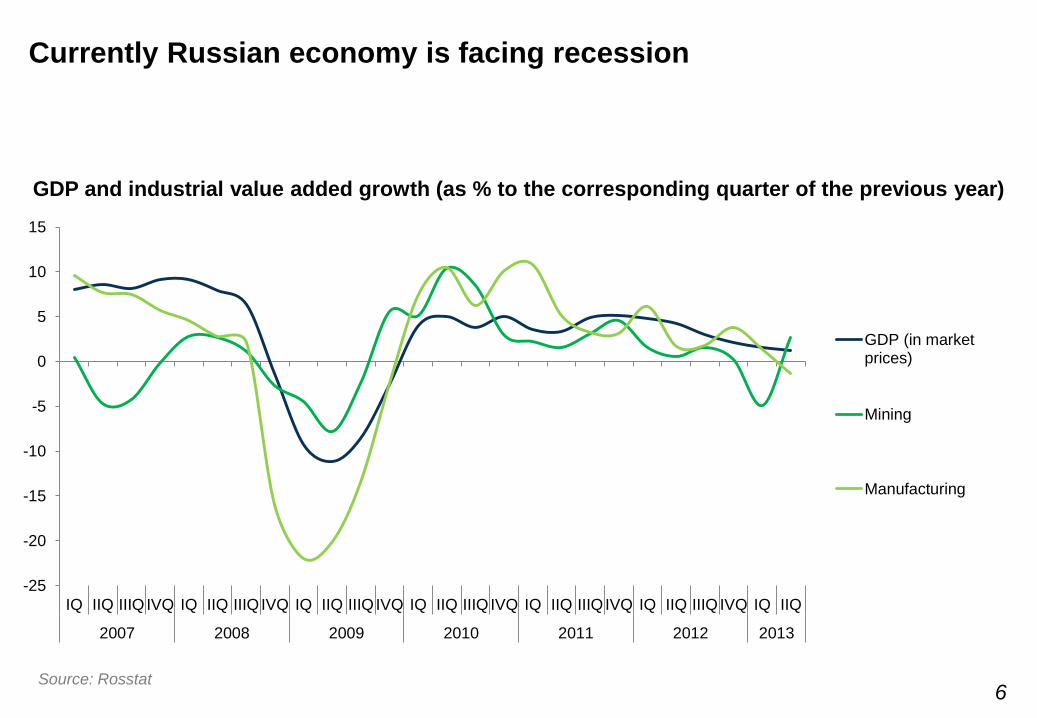
Currently Russian economy is facing recession
6 Source: Rosstat
GDP and industrial value added growth (as % to the corresponding quarter of the previous year)
-25
-20
-15
-10
-5
0
5
10
15
IQ IIQ IIIQ IVQ IQ IIQ IIIQ IVQ IQ IIQ IIIQ IVQ IQ IIQ IIIQ IVQ IQ IIQ IIIQ IVQ IQ IIQ IIIQ IVQ IQ IIQ
2007 2008 2009 2010 2011 2012 2013
GDP (in marketprices)
Mining
Manufacturing
1
2
4
3
CHANGING GLOBAL GAS MARKETS: IMPLICATIONS FOR THE RUSSIAN
GAS EXPORTS AND DOMESTIC GAS MARKET
HOW TO BREAK THE DEADLOCK?
THE ROLE OF OIL AND GAS FOR THE RUSSIAN ECONOMY
7
LNG AND DOMESTIC GAS MARKET DEVELOPMENT
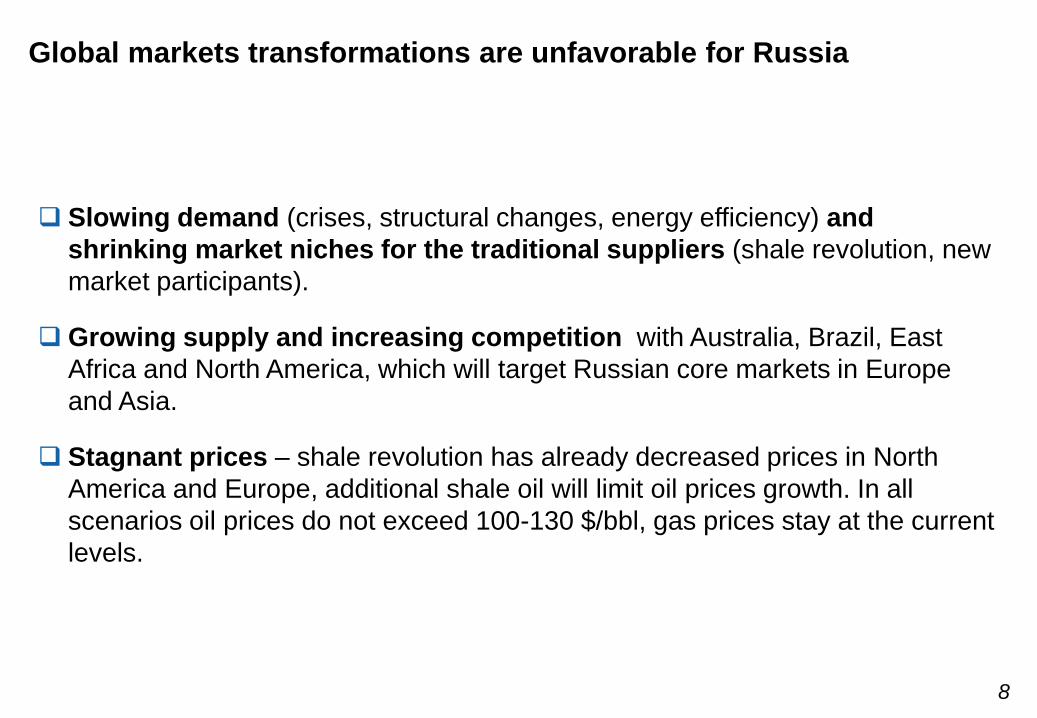
Global markets transformations are unfavorable for Russia
8
Slowing demand (crises, structural changes, energy efficiency) and
shrinking market niches for the traditional suppliers (shale revolution, new
market participants).
Growing supply and increasing competition with Australia, Brazil, East
Africa and North America, which will target Russian core markets in Europe
and Asia.
Stagnant prices – shale revolution has already decreased prices in North
America and Europe, additional shale oil will limit oil prices growth. In all
scenarios oil prices do not exceed 100-130 $/bbl, gas prices stay at the current
levels.
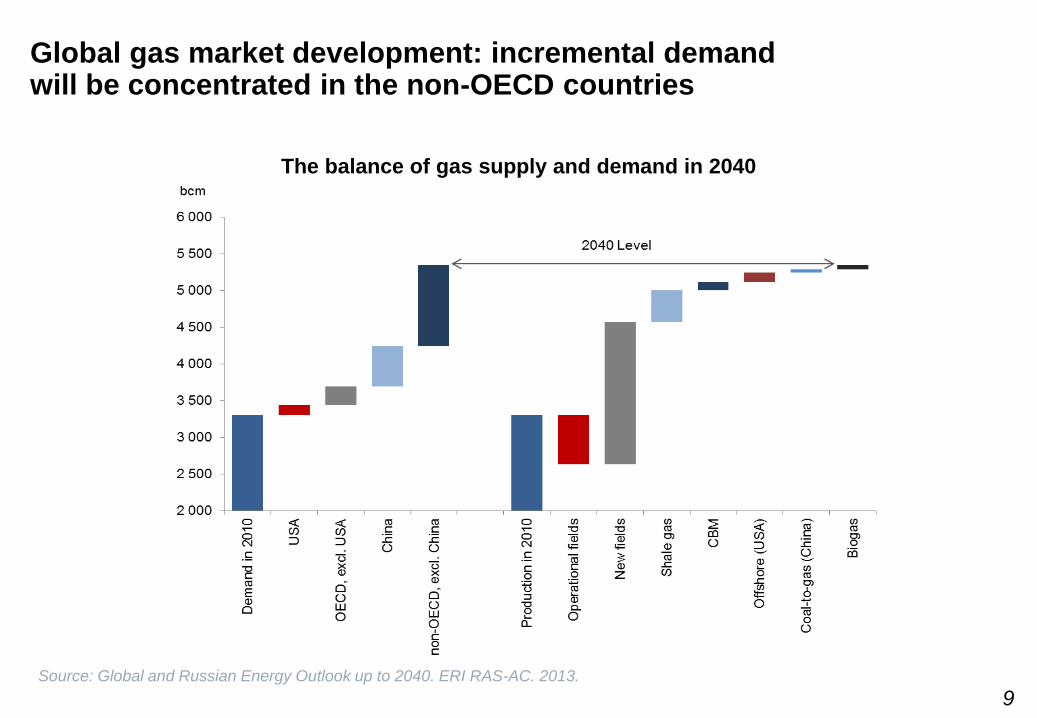
Global gas market development: incremental demand will be concentrated in the non-OECD countries
9
The balance of gas supply and demand in 2040
Source: Global and Russian Energy Outlook up to 2040. ERI RAS-AC. 2013.
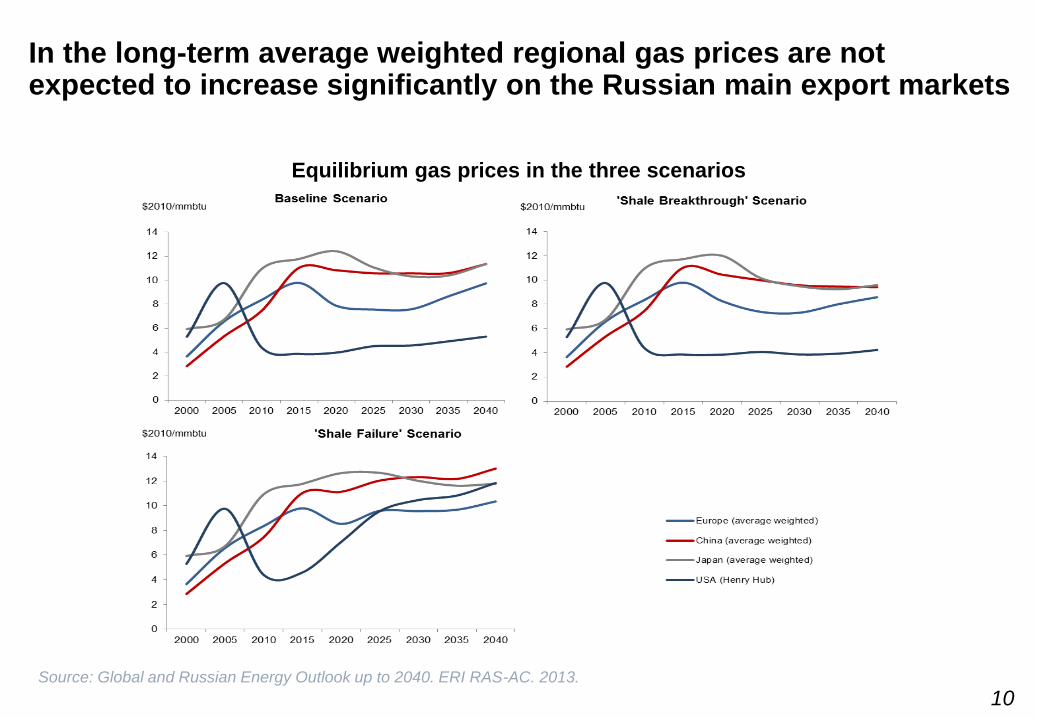
In the long-term average weighted regional gas prices are not expected to increase significantly on the Russian main export markets
10
Equilibrium gas prices in the three scenarios
Source: Global and Russian Energy Outlook up to 2040. ERI RAS-AC. 2013.
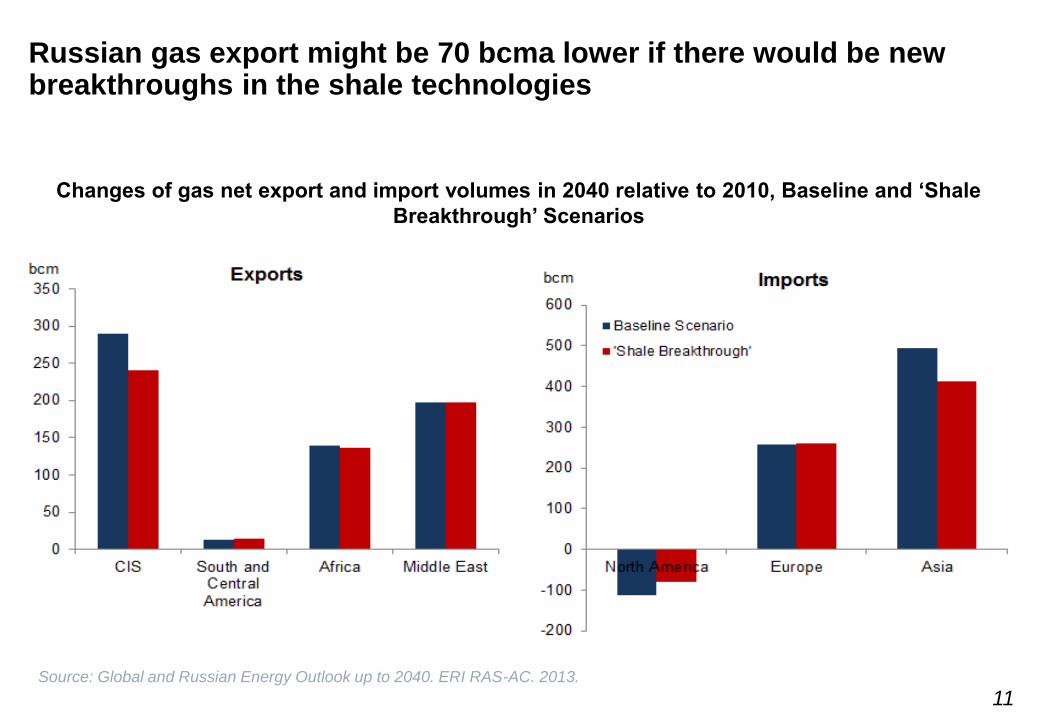
Russian gas export might be 70 bcma lower if there would be new breakthroughs in the shale technologies
11
Changes of gas net export and import volumes in 2040 relative to 2010, Baseline and ‘Shale
Breakthrough’ Scenarios
Source: Global and Russian Energy Outlook up to 2040. ERI RAS-AC. 2013.
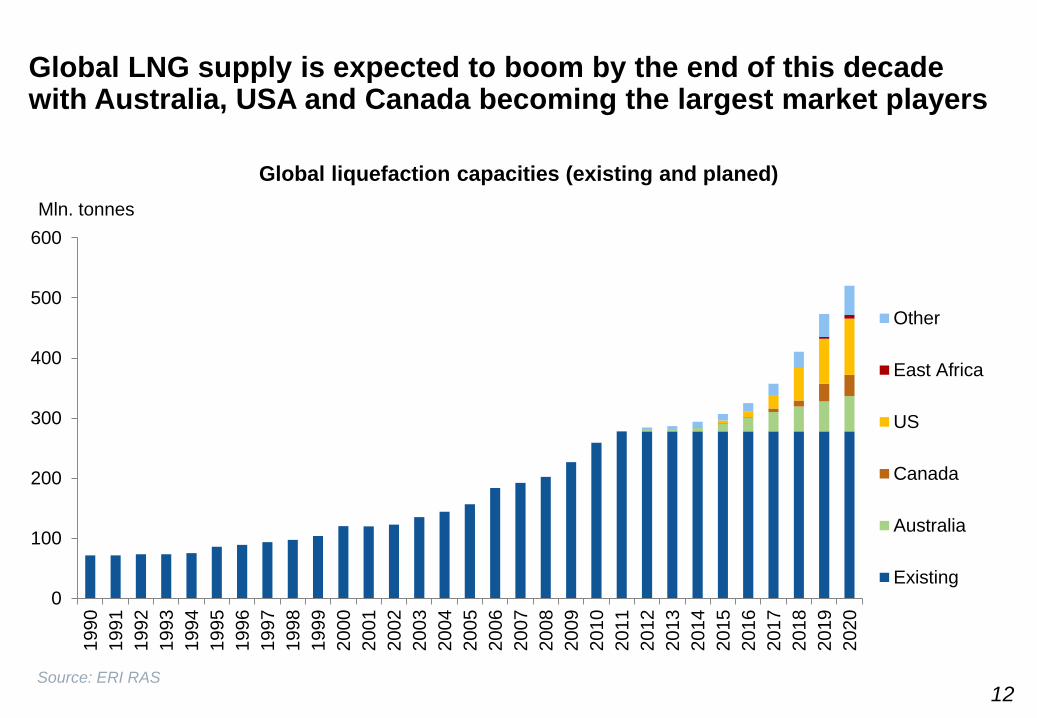
Global LNG supply is expected to boom by the end of this decade with Australia, USA and Canada becoming the largest market players
Mln. tonnes
Global liquefaction capacities (existing and planed)
0
100
200
300
400
500
600
1990
1991
1992
1993
1994
1995
1996
1997
1998
1999
2000
2001
2002
2003
2004
2005
2006
2007
2008
2009
2010
2011
2012
2013
2014
2015
2016
2017
2018
2019
2020
Other
East Africa
US
Canada
Australia
Existing
Source: ERI RAS 12

Situation on the European gas market during the last years did not favor Russian exports…
13
• Unbundling
• Gas Target Model requires all gas to be supplied at the virtual hubs
• Spot volumes are increasing very fast (30-40% p.a.)
• Majority of the European stakeholders support transition to the spot pricing
• Lower than contracted volumes
• Recovers very slowly
• In the power sector gas is strongly competing with coal
• Growing supplies of LNG
• Diversification of pipeline supply sources
Supply Demand
Regulation Pricing
13
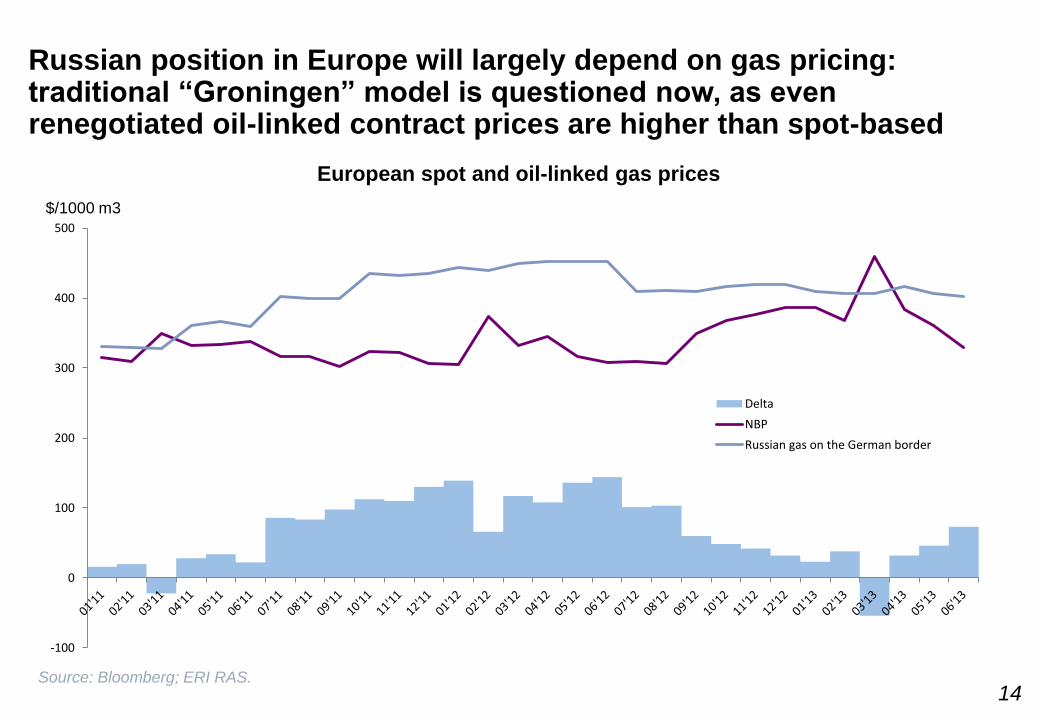
Russian position in Europe will largely depend on gas pricing: traditional “Groningen” model is questioned now, as even renegotiated oil-linked contract prices are higher than spot-based
-100
0
100
200
300
400
500
Delta
NBP
Russian gas on the German border
European spot and oil-linked gas prices
Source: Bloomberg; ERI RAS.
$/1000 m3
14
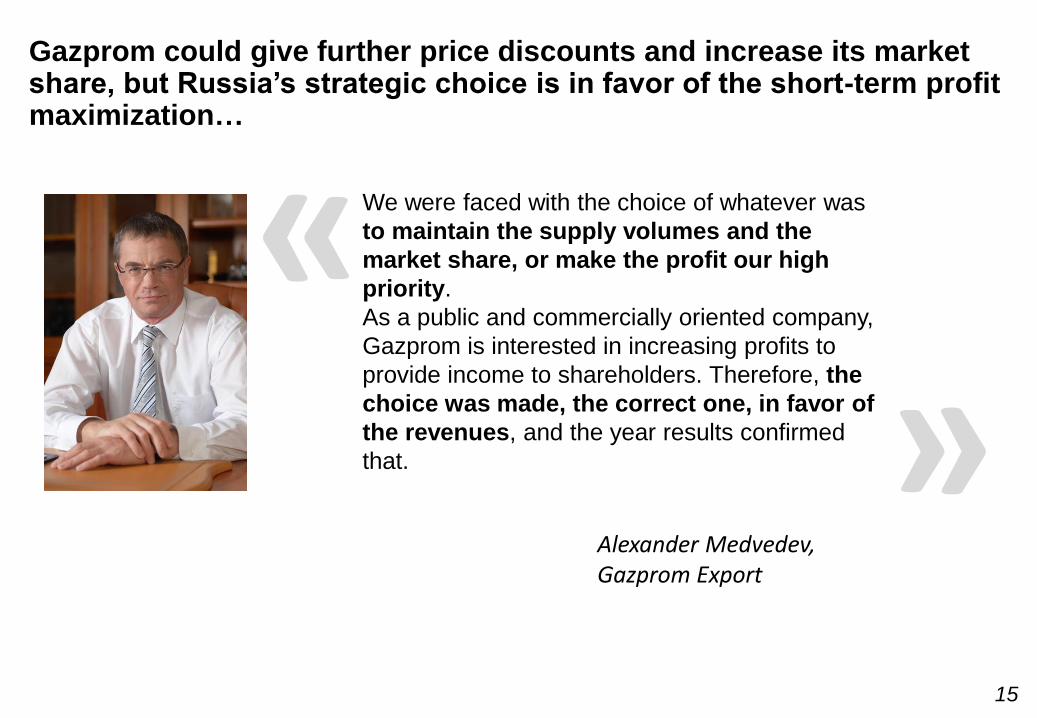
Gazprom could give further price discounts and increase its market share, but Russia’s strategic choice is in favor of the short-term profit maximization…
Alexander Medvedev, Gazprom Export
We were faced with the choice of whatever was
to maintain the supply volumes and the
market share, or make the profit our high
priority.
As a public and commercially oriented company,
Gazprom is interested in increasing profits to
provide income to shareholders. Therefore, the
choice was made, the correct one, in favor of
the revenues, and the year results confirmed
that.
« »
15
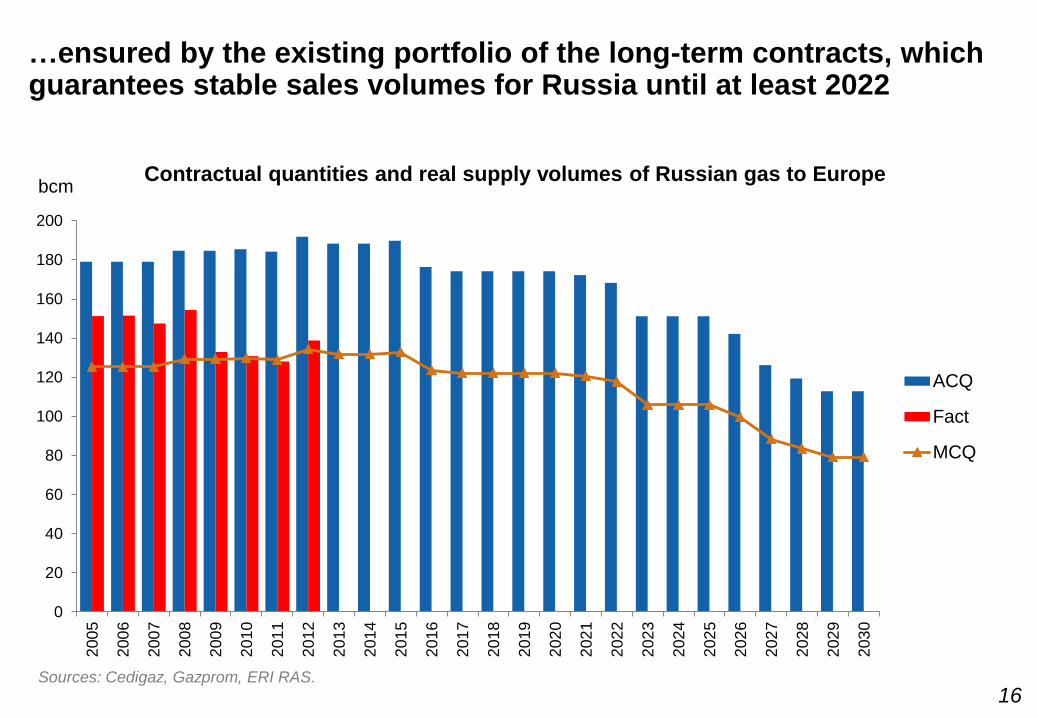
…ensured by the existing portfolio of the long-term contracts, which guarantees stable sales volumes for Russia until at least 2022
Sources: Cedigaz, Gazprom, ERI RAS.
Contractual quantities and real supply volumes of Russian gas to Europe bcm
0
20
40
60
80
100
120
140
160
180
200
200
5
200
6
200
7
200
8
200
9
201
0
201
1
201
2
201
3
201
4
201
5
201
6
201
7
201
8
201
9
202
0
202
1
202
2
202
3
202
4
202
5
202
6
202
7
202
8
202
9
203
0
ACQ
Fact
MCQ
16
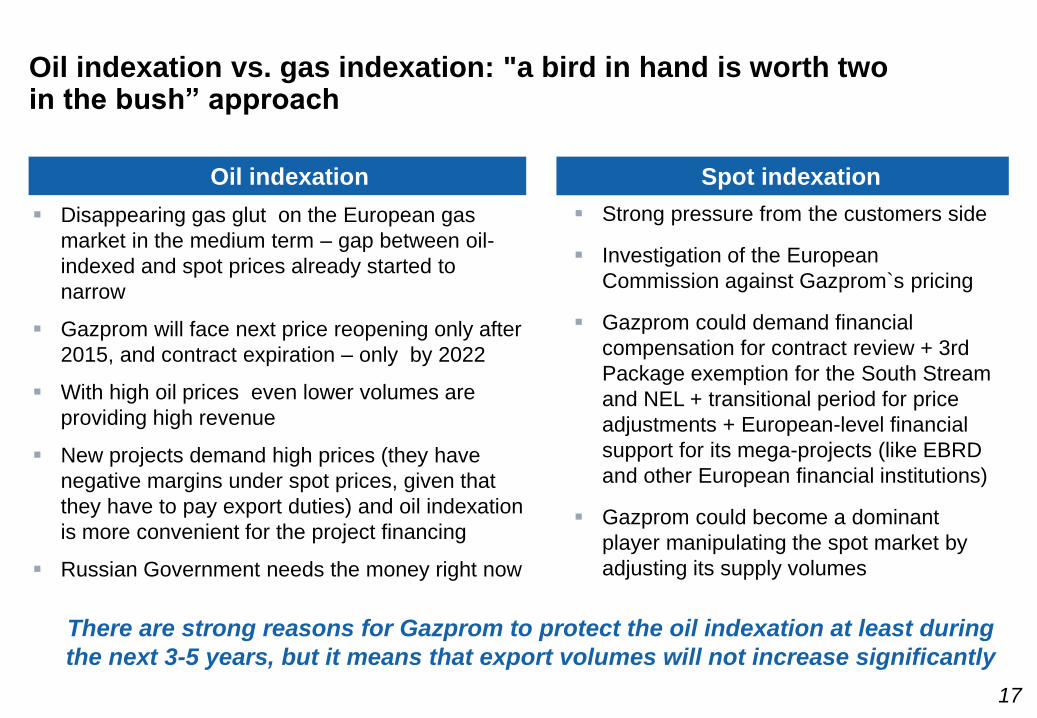
Oil indexation vs. gas indexation: "a bird in hand is worth two in the bush” approach
Strong pressure from the customers side
Investigation of the European
Commission against Gazprom`s pricing
Gazprom could demand financial
compensation for contract review + 3rd
Package exemption for the South Stream
and NEL + transitional period for price
adjustments + European-level financial
support for its mega-projects (like EBRD
and other European financial institutions)
Gazprom could become a dominant
player manipulating the spot market by
adjusting its supply volumes
Disappearing gas glut on the European gas
market in the medium term – gap between oil-
indexed and spot prices already started to
narrow
Gazprom will face next price reopening only after
2015, and contract expiration – only by 2022
With high oil prices even lower volumes are
providing high revenue
New projects demand high prices (they have
negative margins under spot prices, given that
they have to pay export duties) and oil indexation
is more convenient for the project financing
Russian Government needs the money right now
Oil indexation Spot indexation
There are strong reasons for Gazprom to protect the oil indexation at least during
the next 3-5 years, but it means that export volumes will not increase significantly
17
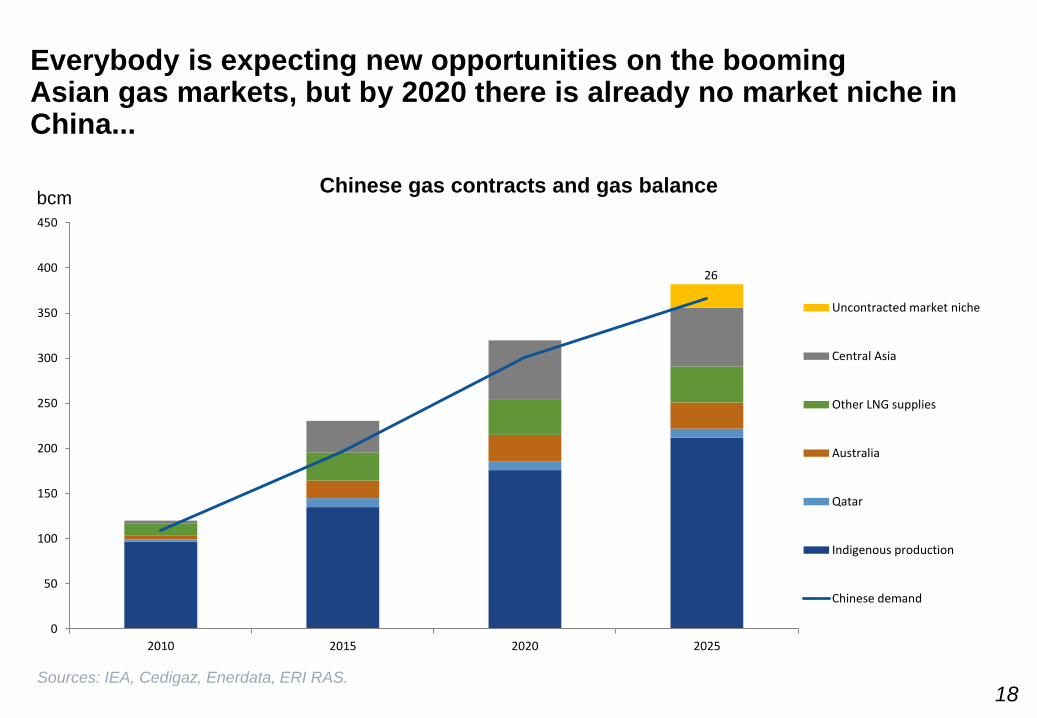
Everybody is expecting new opportunities on the booming Asian gas markets, but by 2020 there is already no market niche in China...
bcm Chinese gas contracts and gas balance
26
0
50
100
150
200
250
300
350
400
450
2010 2015 2020 2025
Uncontracted market niche
Central Asia
Other LNG supplies
Australia
Qatar
Indigenous production
Chinese demand
Sources: IEA, Cedigaz, Enerdata, ERI RAS. 18

…and OECD Asia is quickly contracting the North American LNG
Japan and South Korea contracts and gas balance bcm
Sources: IEA, Cedigaz, Enerdata, ERI RAS.
34 32
65
0
20
40
60
80
100
120
140
160
180
200
2010 2015 2020 2025
Uncontracted market niche
USA and Canada
Others
Russia
Qatar
Other Middle East
Papua New Guenia
Malasia
Indoneisa
Brunei
Australia
Indigenous production
OECD Asia demand
19

Russian “Eastern Gas Program” is moving on, but as there are still no SPAs,
the window of opportunities is becoming smaller and price negotiations
have now to take into account Henry Hub pricing of the potential US LNG
Sources: Gazprom 20
1
2
4
3
CHANGING GLOBAL GAS MARKETS: IMPLICATIONS FOR THE RUSSIAN
GAS EXPORTS AND DOMESTIC GAS MARKET
HOW TO BREAK THE DEADLOCK?
THE ROLE OF OIL AND GAS FOR THE RUSSIAN ECONOMY
21
DOMESTIC GAS MARKET DEVELOPMENT

LNG in the Governmental policy
Increasing export volumes
Geographic diversification, access to the new markets in (South America, South-West
Europe, Asia Pacific, Africa and Middle East)
No transit risks with strong control over transportation to the final customers
Arbitrage opportunities
Regional development (sensitive regions - Artic, Far East)
New technologies (including shipbuilding)
Northern Sea Route development
Securing geopolitical position in Arctic and in Asia Pacific
Share of LNG in gas exports, according to ES-2030, %
1 stage 2 stage 3 stage
LNG share 6-7 10-11 14-15
Source: ES-2030.
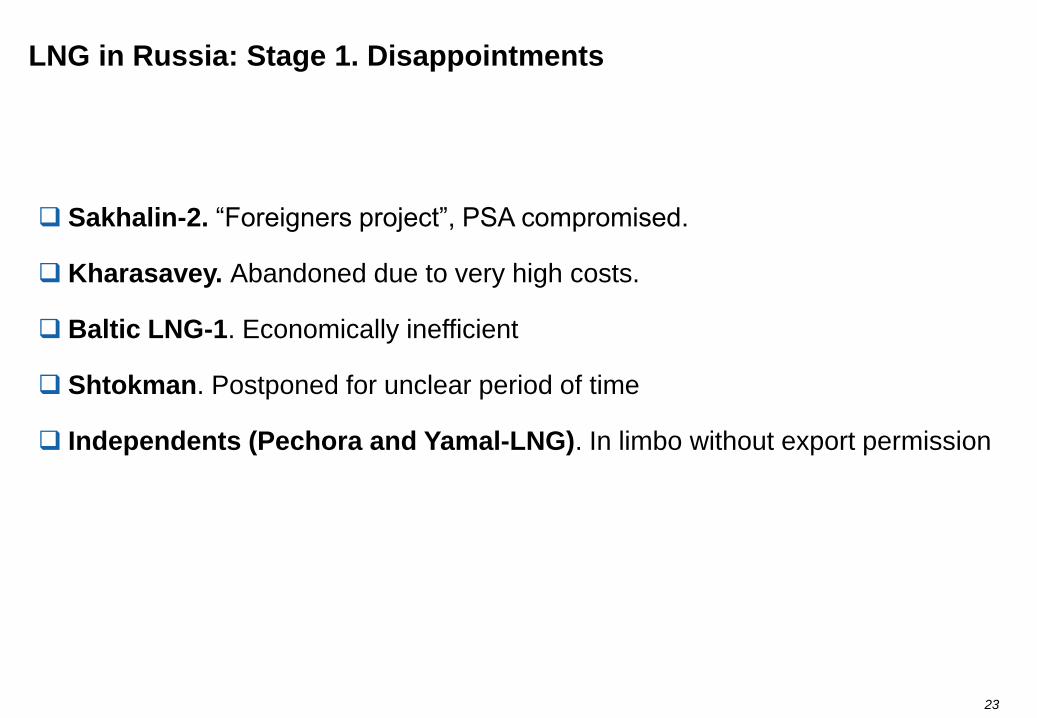
LNG in Russia: Stage 1. Disappointments
23
Sakhalin-2. “Foreigners project”, PSA compromised.
Kharasavey. Abandoned due to very high costs.
Baltic LNG-1. Economically inefficient
Shtokman. Postponed for unclear period of time
Independents (Pechora and Yamal-LNG). In limbo without export permission
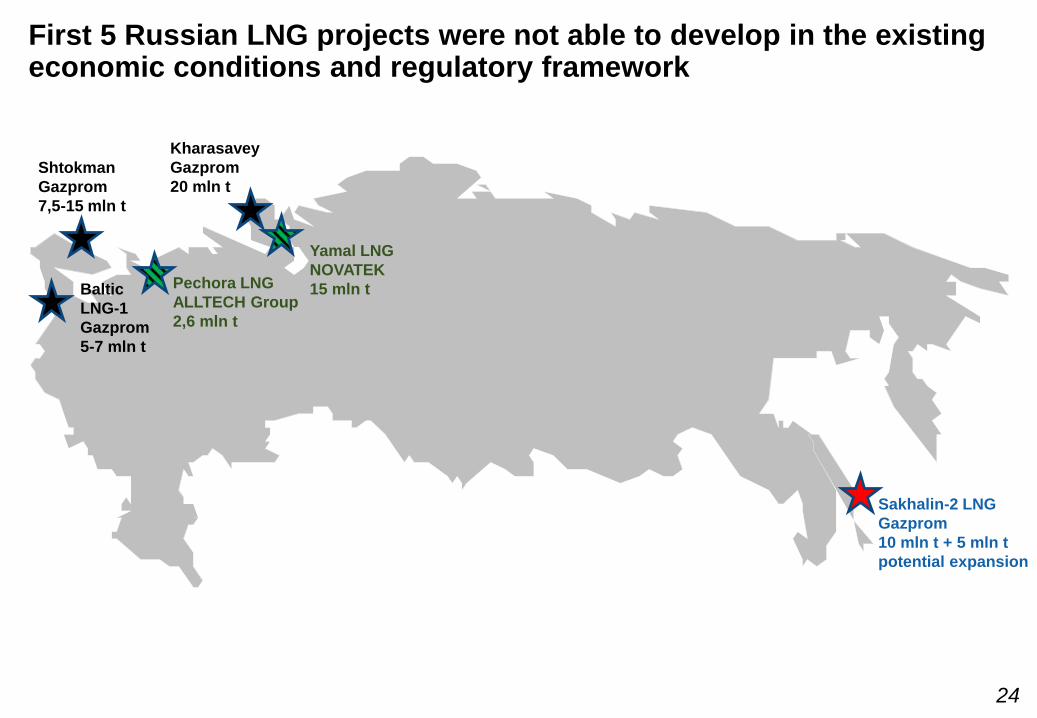
First 5 Russian LNG projects were not able to develop in the existing economic conditions and regulatory framework
Shtokman
Gazprom
7,5-15 mln t
Pechora LNG
ALLTECH Group
2,6 mln t
Yamal LNG
NOVATEK
15 mln t
Sakhalin-2 LNG
Gazprom
10 mln t + 5 mln t
potential expansion
24
Kharasavey
Gazprom
20 mln t
Baltic
LNG-1
Gazprom
5-7 mln t
LNG in Russia: Stage 2. Trying to catch the last train
25
Vladivostok LNG
Sakhalin-2 expansion
Baltic LNG-2
Yamal-LNG
Sakhalin-1
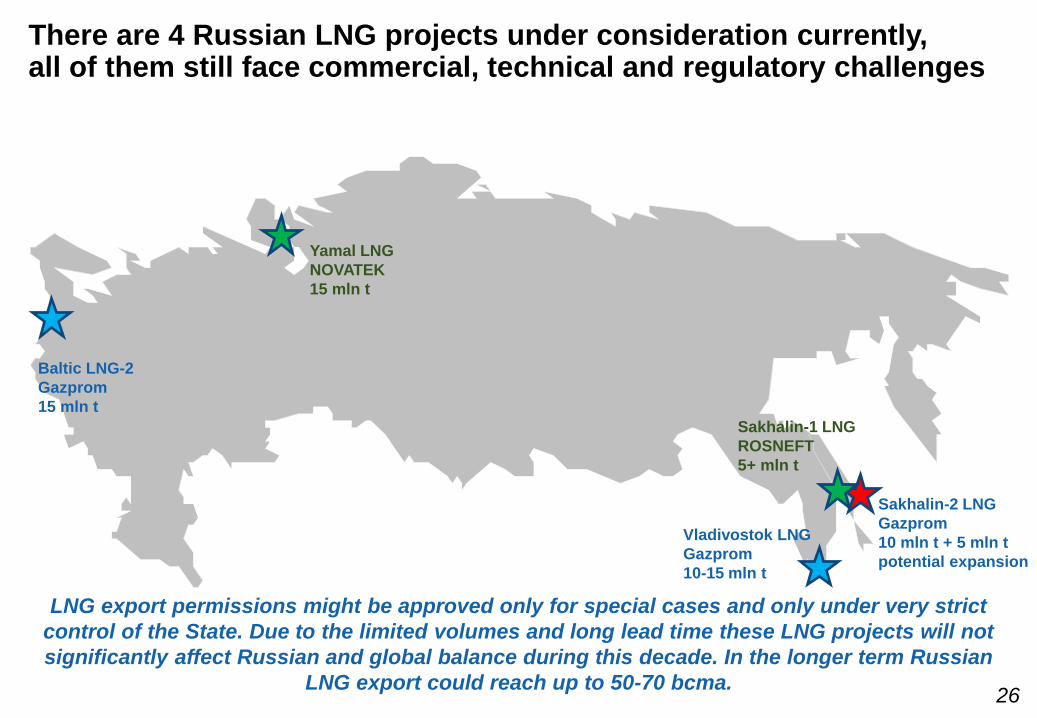
There are 4 Russian LNG projects under consideration currently, all of them still face commercial, technical and regulatory challenges
LNG export permissions might be approved only for special cases and only under very strict
control of the State. Due to the limited volumes and long lead time these LNG projects will not
significantly affect Russian and global balance during this decade. In the longer term Russian
LNG export could reach up to 50-70 bcma.
Baltic LNG-2
Gazprom
15 mln t
Yamal LNG
NOVATEK
15 mln t
Sakhalin-1 LNG
ROSNEFT
5+ mln t
Sakhalin-2 LNG
Gazprom
10 mln t + 5 mln t
potential expansion
Vladivostok LNG
Gazprom
10-15 mln t
26
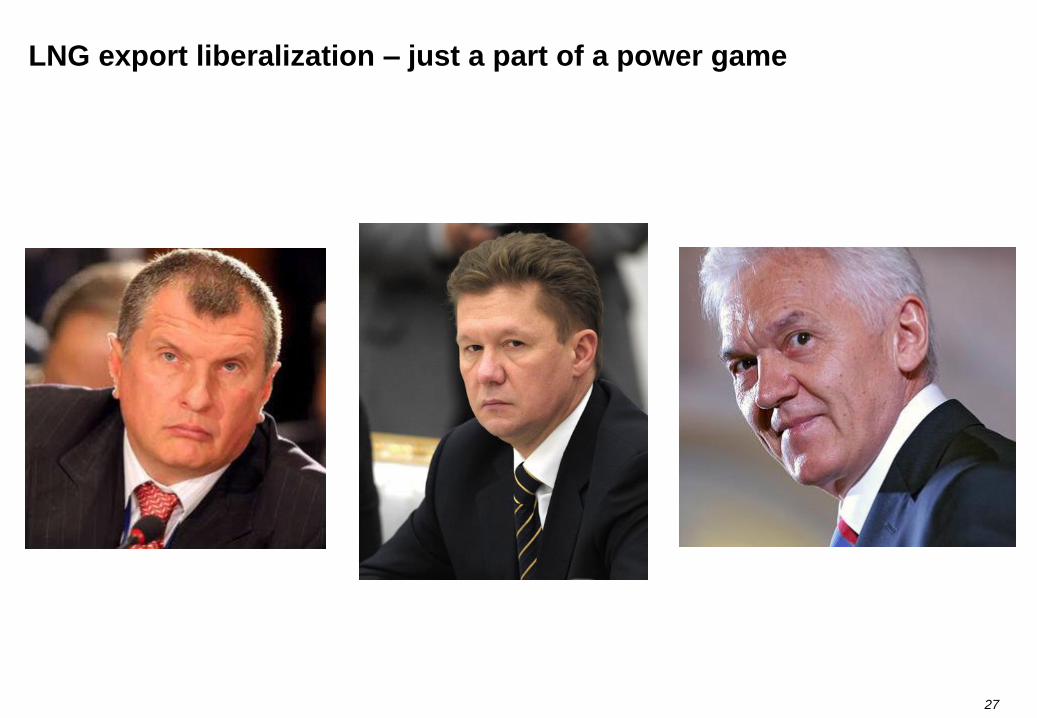
LNG export liberalization – just a part of a power game
27
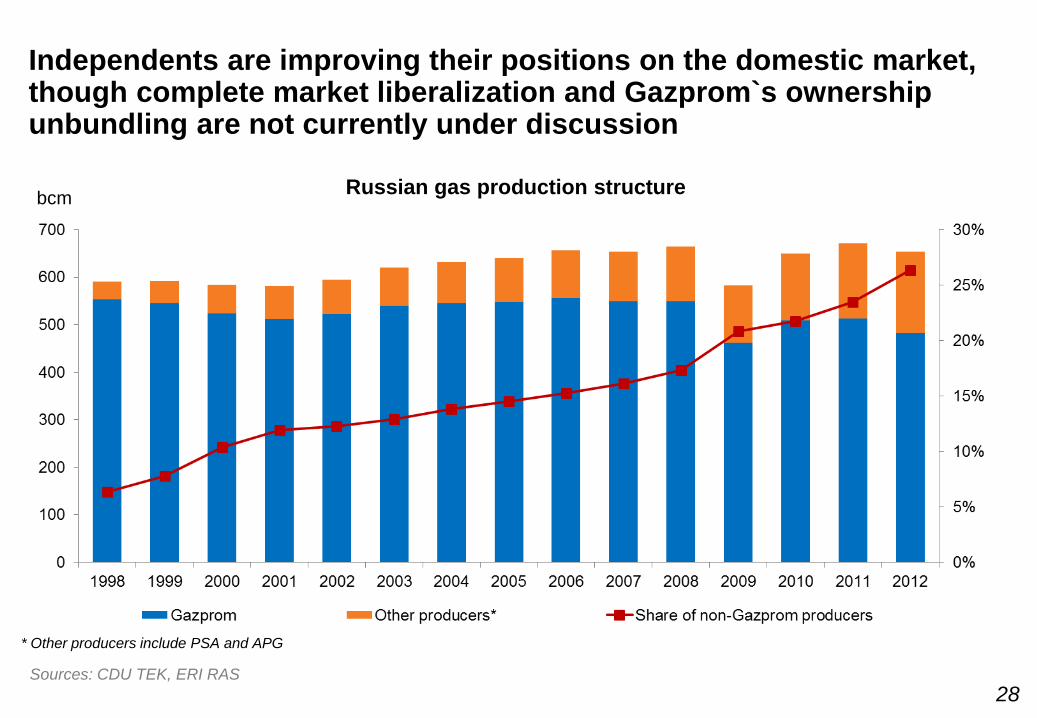
Independents are improving their positions on the domestic market, though complete market liberalization and Gazprom`s ownership unbundling are not currently under discussion
Russian gas production structure
Sources: CDU TEK, ERI RAS
* Other producers include PSA and APG
bcm
28
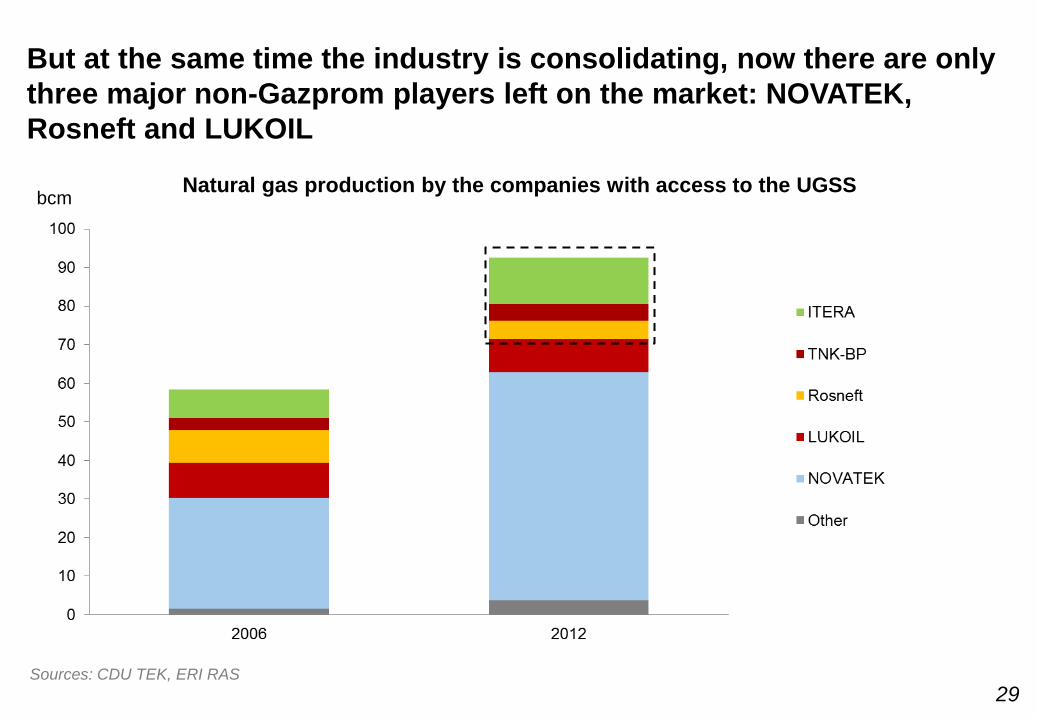
But at the same time the industry is consolidating, now there are only
three major non-Gazprom players left on the market: NOVATEK,
Rosneft and LUKOIL
Natural gas production by the companies with access to the UGSS bcm
Sources: CDU TEK, ERI RAS
29
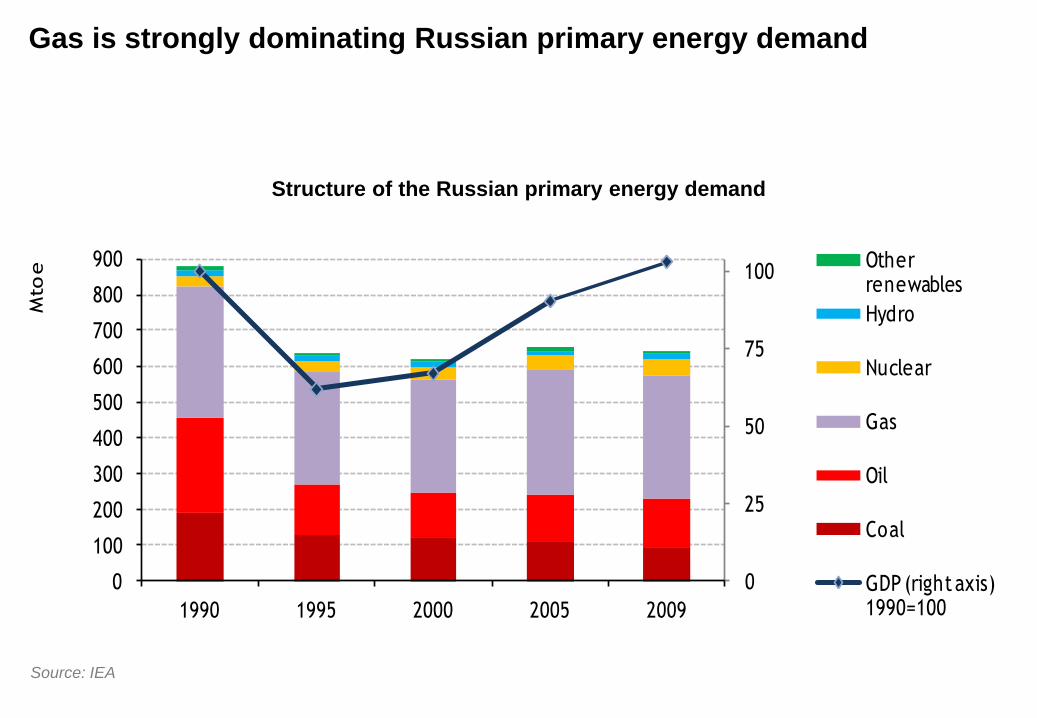
Gas is strongly dominating Russian primary energy demand
0
25
50
75
100
0
100
200
300
400
500
600
700
800
900
1990 1995 2000 2005 2009
Mto
e Other renewables
Hydro
Nuclear
Gas
Oil
Coal
GDP (right axis) 1990=100
Source: IEA
Structure of the Russian primary energy demand
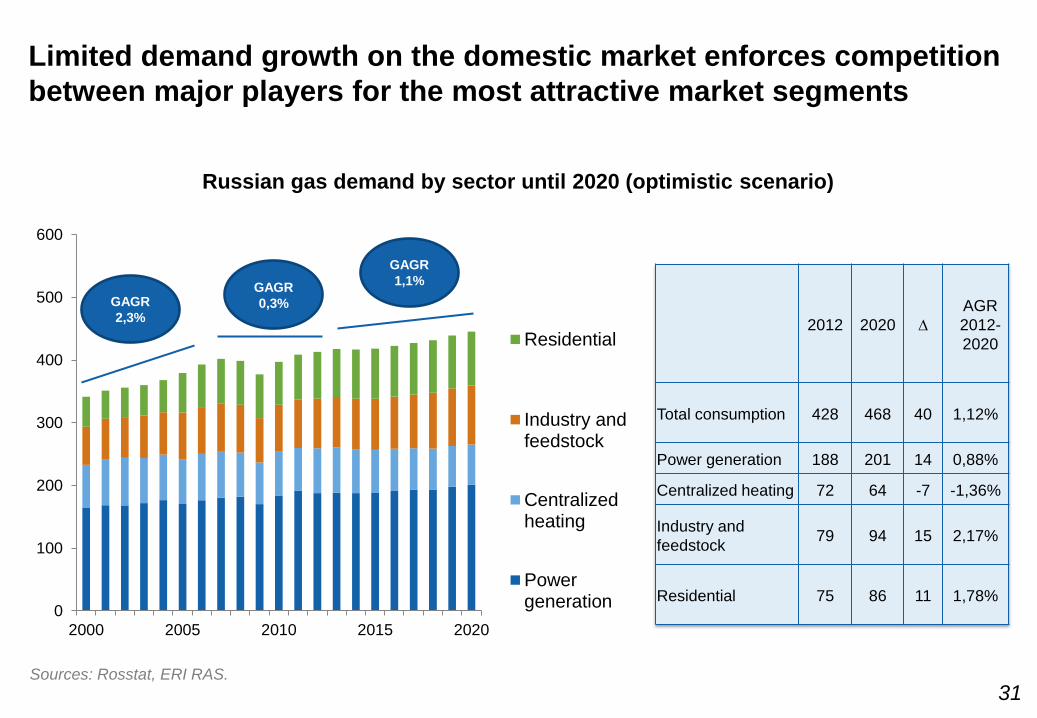
2012 2020 ∆
AGR
2012-
2020
Total consumption 428 468 40 1,12%
Power generation 188 201 14 0,88%
Centralized heating 72 64 -7 -1,36%
Industry and
feedstock 79 94 15 2,17%
Residential 75 86 11 1,78% 0
100
200
300
400
500
600
2000 2005 2010 2015 2020
Residential
Industry andfeedstock
Centralizedheating
Powergeneration
Russian gas demand by sector until 2020 (optimistic scenario)
GAGR
2,3%
GAGR
0,3%
GAGR
1,1%
Limited demand growth on the domestic market enforces competition
between major players for the most attractive market segments
Sources: Rosstat, ERI RAS.
31
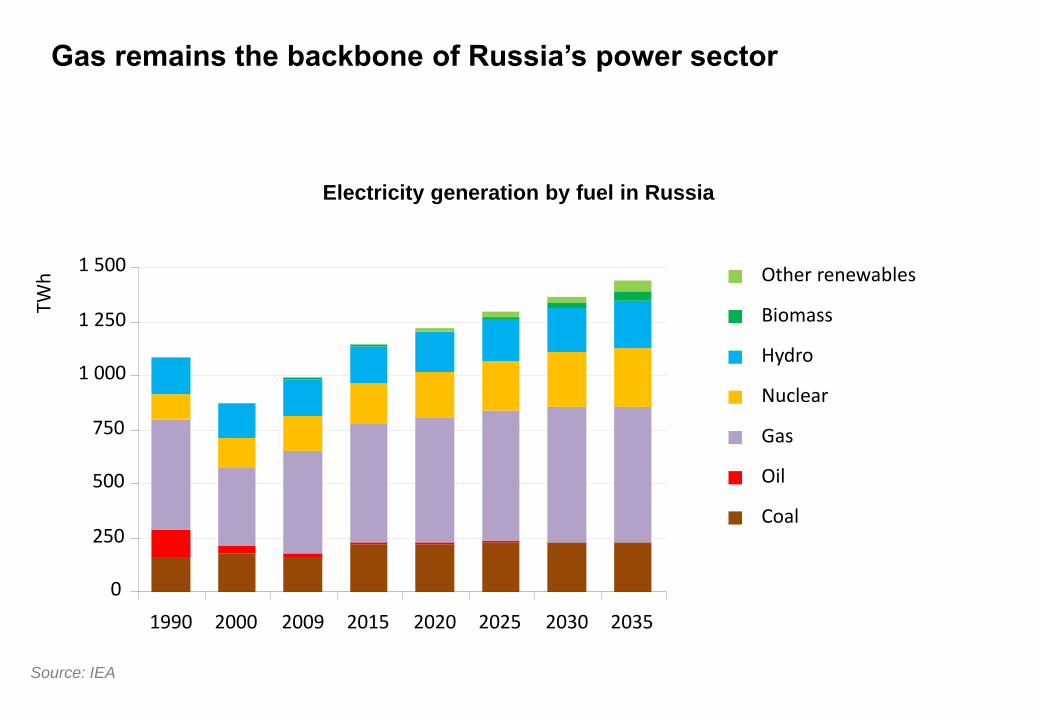
Gas remains the backbone of Russia’s power sector
Electricity generation by fuel in Russia
0
250
500
750
1 000
1 250
1 500
1990 2000 2009 2015 2020 2025 2030 2035
TWh
Other renewables
Biomass
Hydro
Nuclear
Gas
Oil
Coal
Source: IEA

0,00
0,50
1,00
1,50
2,00
2,50
3,00
2011 2012 2013 2014 2015 2016 2017 2018 2019 2020 2021 2022
Netback price (forecast2011)
Netback price (forecast2013)
MED forecast up to2030
Gas price growth in linewith inflation
Sources: MED, ERI RAS.
Government frightened by the industrial output decline is ready to
slow gas and electricity prices growth down to the rate of inflation,
which is justified by lower European prices and weak domestic
demand
Different proposed dynamics of the domestic gas price increase (compared to 2010 = 1)
33
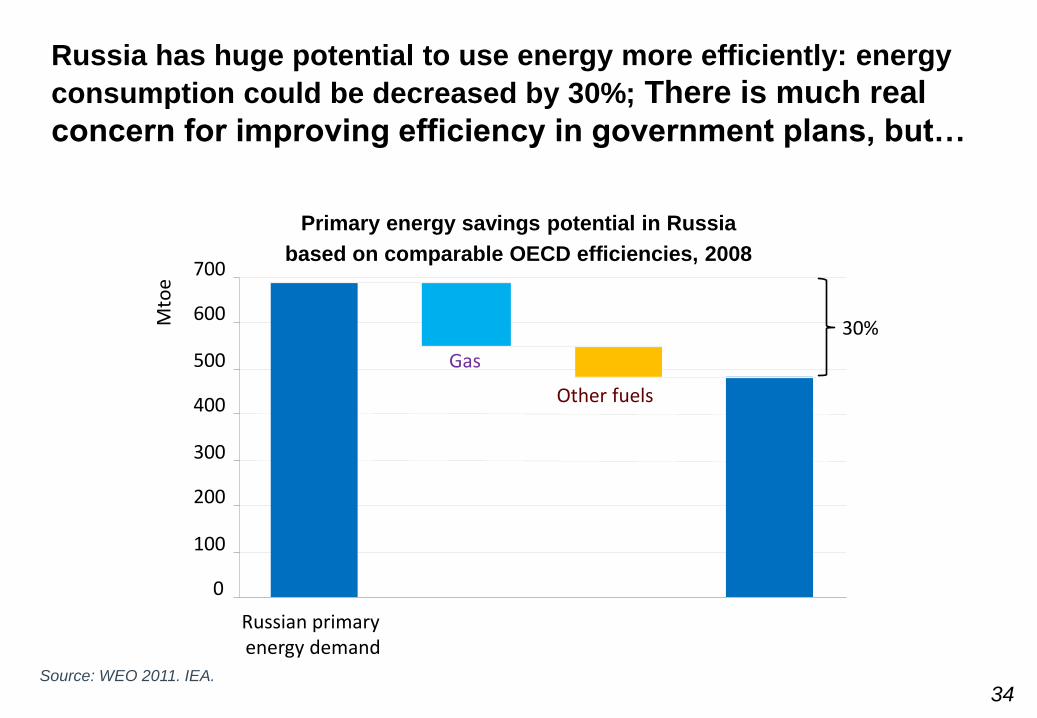
Russia has huge potential to use energy more efficiently: energy
consumption could be decreased by 30%; There is much real
concern for improving efficiency in government plans, but…
Primary energy savings potential in Russia
based on comparable OECD efficiencies, 2008
0
100
200
300
400
500
600
700
Mto
e
30%
Gas
Other fuels
Russian primary energy demand
Source: WEO 2011. IEA.
34
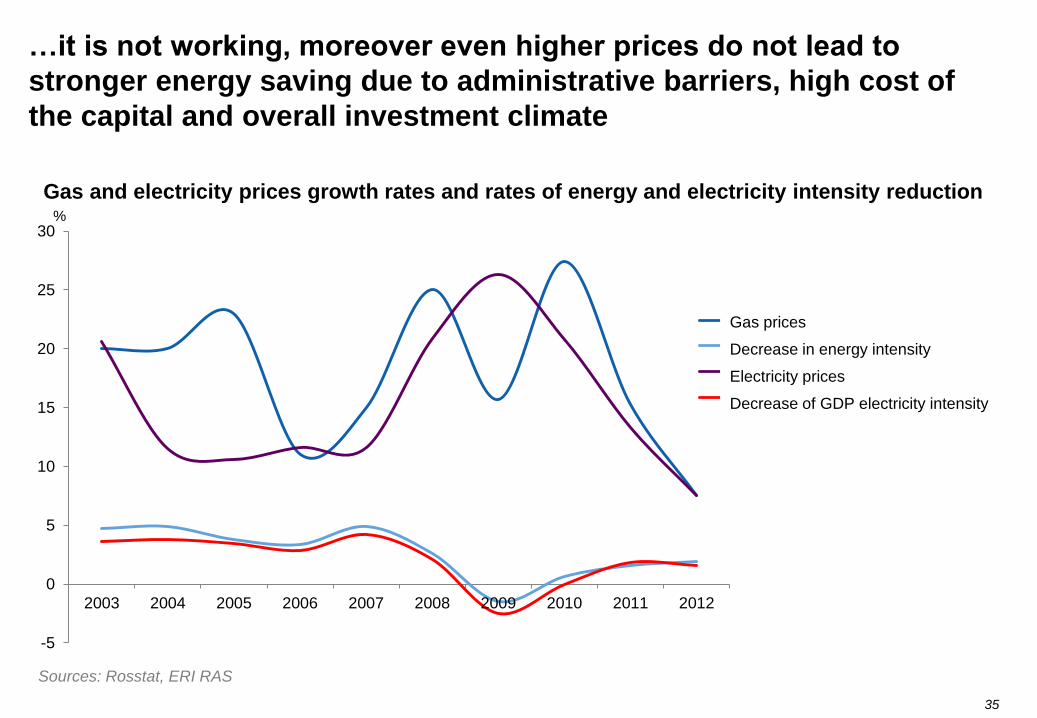
Gas and electricity prices growth rates and rates of energy and electricity intensity reduction
…it is not working, moreover even higher prices do not lead to
stronger energy saving due to administrative barriers, high cost of
the capital and overall investment climate
35
Sources: Rosstat, ERI RAS
-5
0
5
10
15
20
25
30
2003 2004 2005 2006 2007 2008 2009 2010 2011 2012
цены газа
снижение энергоёмкости ВВП
цены электроэнергии
снижение электроёмкости ВВП
Gas prices
Decrease in energy intensity
Electricity prices
Decrease of GDP electricity intensity
%
1
2
4
3
CHANGING GLOBAL GAS MARKETS: IMPLICATIONS FOR THE RUSSIAN
GAS EXPORTS AND DOMESTIC GAS MARKET
HOW TO BREAK THE DEADLOCK?
THE ROLE OF OIL AND GAS FOR THE RUSSIAN ECONOMY
36
DOMESTIC GAS MARKET DEVELOPMENT
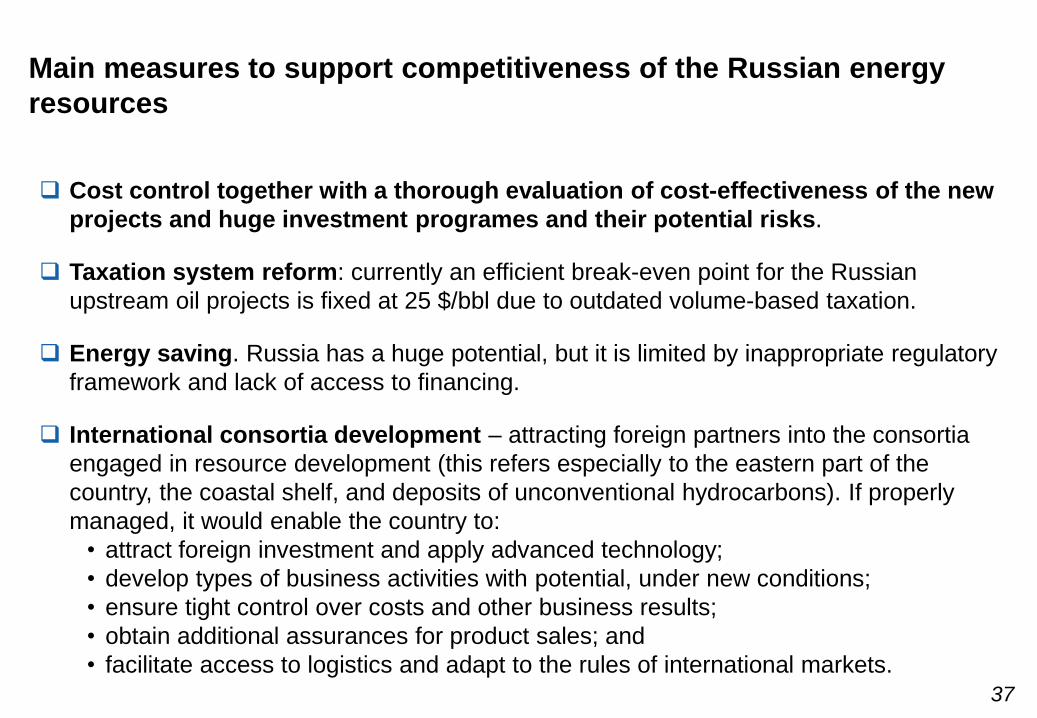
Main measures to support competitiveness of the Russian energy
resources
Cost control together with a thorough evaluation of cost-effectiveness of the new
projects and huge investment programes and their potential risks.
Taxation system reform: currently an efficient break-even point for the Russian
upstream oil projects is fixed at 25 $/bbl due to outdated volume-based taxation.
Energy saving. Russia has a huge potential, but it is limited by inappropriate regulatory
framework and lack of access to financing.
International consortia development – attracting foreign partners into the consortia
engaged in resource development (this refers especially to the eastern part of the
country, the coastal shelf, and deposits of unconventional hydrocarbons). If properly
managed, it would enable the country to:
• attract foreign investment and apply advanced technology;
• develop types of business activities with potential, under new conditions;
• ensure tight control over costs and other business results;
• obtain additional assurances for product sales; and
• facilitate access to logistics and adapt to the rules of international markets.
37
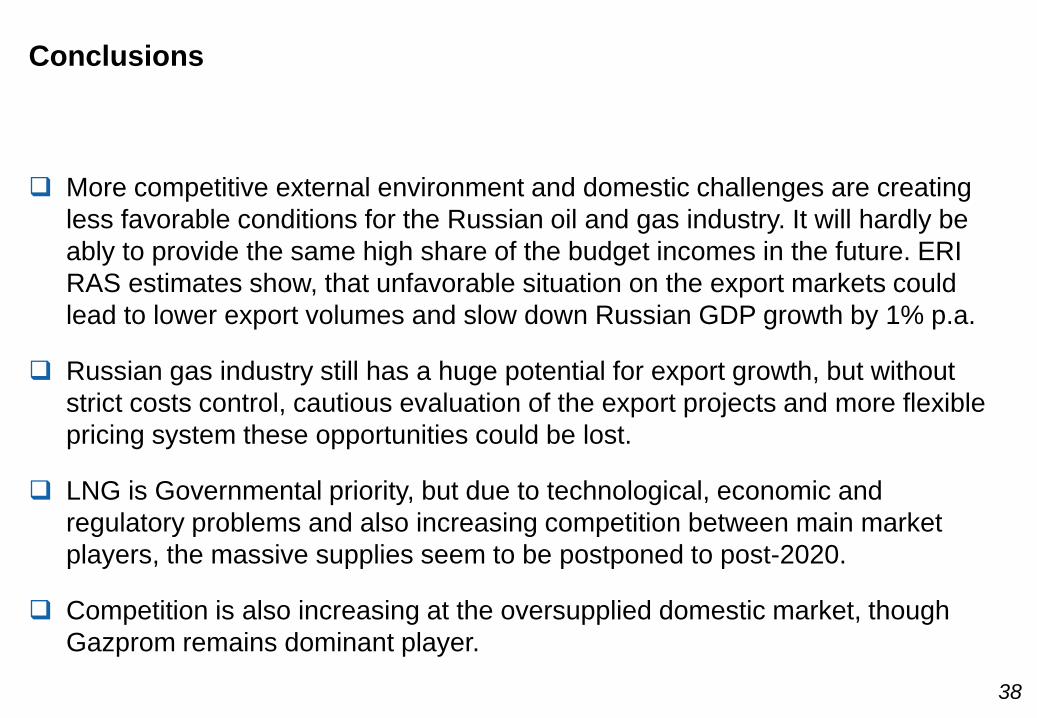
Conclusions
More competitive external environment and domestic challenges are creating
less favorable conditions for the Russian oil and gas industry. It will hardly be
ably to provide the same high share of the budget incomes in the future. ERI
RAS estimates show, that unfavorable situation on the export markets could
lead to lower export volumes and slow down Russian GDP growth by 1% p.a.
Russian gas industry still has a huge potential for export growth, but without
strict costs control, cautious evaluation of the export projects and more flexible
pricing system these opportunities could be lost.
LNG is Governmental priority, but due to technological, economic and
regulatory problems and also increasing competition between main market
players, the massive supplies seem to be postponed to post-2020.
Competition is also increasing at the oversupplied domestic market, though
Gazprom remains dominant player.
38
39
Contacts
Nagornaya st., 31, k.2, 117186, Moscow,
Russian Federation
phone: +7 985 368 39 75
fax: +7 499 135 88 70
web: www.eriras.ru
e-mail: [email protected]
Energy Research Institute of the Russian Academy of Sciences
"Global and Russian Energy Outlook up to 2040"
http://www.eriras.ru/files/Global_and_Russian_energy_outlook_up_to_2040.pdf