the trung son hydro project:...
TRANSCRIPT
The Trung Son Hydro Project:
Alternatives
3 December 2009 Peter Meier
Pub
lic D
iscl
osur
e A
utho
rized
Pub
lic D
iscl
osur
e A
utho
rized
Pub
lic D
iscl
osur
e A
utho
rized
Pub
lic D
iscl
osur
e A
utho
rized
Pub
lic D
iscl
osur
e A
utho
rized
Pub
lic D
iscl
osur
e A
utho
rized
Pub
lic D
iscl
osur
e A
utho
rized
Pub
lic D
iscl
osur
e A
utho
rized
i
Contents
Contents ...................................................................................................................................... iExecutive Summary .................................................................................................................. 1
Alternatives To Supply Side Expansion ........................................................................... 1Hydro in the Optimum Capacity Expansion Strategy ....................................................... 2Alternative Hydro Projects to Trung Son ......................................................................... 2Conclusions ....................................................................................................................... 2
1. Introduction ....................................................................................................................... 4Vietnam’s Power Development Strategy .............................................................................. 4Assumptions .......................................................................................................................... 5
2. Alternatives to Supply Side Expansion ............................................................................ 6Supply Side Efficiency Improvements .................................................................................. 6Demand Side Management ................................................................................................... 7Summary ............................................................................................................................... 7
3. Hydro in the Optimum Capacity Expansion Strategy ....................................................... 8Vietnam’s Capacity Expansion Plan ..................................................................................... 8
Load Forecasts .................................................................................................................. 8Hydro v. Thermal ............................................................................................................ 10Medium hydro v. small hydro and other renewables ...................................................... 12Hydro Development Strategy ......................................................................................... 13
4. Trung Son in the Hydro Development Strategy ............................................................. 18Comparison of Projects ....................................................................................................... 18
Cost of Energy ................................................................................................................ 18Loss of Forest ................................................................................................................. 19Power density .................................................................................................................. 20Displaced persons ........................................................................................................... 20
Hydro imports from Laos, Cambodia or Yunnan ............................................................... 21Position in Least Cost Expansion Plan ................................................................................ 22
5. Site and reservoir configuration alternatives ....................................................................... 23Master Plan for Hydropower Development of the Ma river ........................................... 23The 1998 Master Plan, and its 1999 update .................................................................... 23The 2003 Master Plan ..................................................................................................... 24Selection of the dam site in the pre-feasibility study. ..................................................... 25Feasibility study selection of the high water level .......................................................... 26
Annex 1: The IoE Power System Modeling Studies ............................................................... 27Results ............................................................................................................................ 27
ii
ABBREVIATIONS AND ACRONYMS
BTU British thermal unit
CCGT Combined cycle gas turbine
CDM Clean Development Mechanism
CFB Circulating fluidized bed (boiler)
DP Displaced person
DSM Demand side management
ESPI Environmental/social preference index
EVN Electricity of Vietnam
FGD Flue gas desulfurization
GDP Gross domestic product
GHG Greenhouse gas
HWL high water level
IoE Institute of Energy
LDU Local Distribution Utility
LNG Liquefied natural gas
MARD Ministry of Agriculture and Rural Development
MoIT Ministry of Industry and Technology
MONRE Ministry of Natural Resources and Environment
NPV Net present value
NTPI Normalized total preference index
PMDP6 6th
SEA
Power Master Development Plan
Strategic Environmental Assessment
SEI Stockholm Environmental Institute
T&D Transmission and distribution
TEPI Technical/economic preference index
TPI Total preference index
VND Vietnamese Dong
ZoI Zone of influence

1
Executive Summary The general question of alternatives to Trung Son examined in this report has four parts:
• Could the need for additional peaking power be met by more aggressive energy conservation, demand side management and transmission and distribution (T&D) loss reduction? In other words, is there a need to expand supply at all?
• Given that Vietnam does indeed need to add capacity, what is the optimum supply side expansion strategy, and does it include hydro? Put another way, is there a cost-effective alternative to the strategy of developing hydro as the best source of peaking power?1
• Given that hydro is indeed the best option for peaking power, how does Trung Son compare to other hydro options? Are there more attractive hydro projects that should be built in its place (or built before Trung Son)? Would imports from Laos, Cambodia or China be more attractive (lower costs or lower environmental impacts)?
The reasonable alternatives are gas in some combination of open and combined cycle generators, possibly using imported liquefied natural gas (LNG); and pumped storage (in combination with either nuclear or coal).
• Given that a hydro project in the Trung Son section of the Ma river is the best option, what specific site alternatives are available, and what are the general alternatives for project configuration (particularly with respect to high water elevations and environmental and social impacts of the project alternatives)?
Some further engineering design questions that are of negligible impact on environmental and social impacts are not discussed here: these are covered in the detailed feasibility and engineering studies.
Alternatives To Supply Side Expansion The proposition that Trung Son might not be needed because alternatives to supply side expansion could meet the incremental demand, cannot be sustained. Given Vietnam’s need for economic development, the increasing demand for electricity in general, and peaking supply in particular, simply cannot be accommodated by demand side options alone Moreover, unlike many South Asian countries, T&D losses are already quite low, and the present strategy already includes significant expenditures to bring this down from around 11% presently to 9%. With one or two exceptions, the efficiency of Vietnam’s thermal projects is good, and the older ones (such as the Pha Lai 1 and Uong Bi coal projects) will either be rehabilitated or retired by 2015 – measures that again are already envisaged in the power development plan.
The same is true of DSM. EVN has embarked on an ambitious DSM program (including a CFL program, and a major initiative to improve commercial energy efficiency). The same is true of small renewable energy projects: several recent reforms (such as the introduction of a standardized power purchase agreement, and a published avoided tariff), and the World Bank supported Renewable Energy Development Project) is expected to enable the ambitious 6th
1 Environmental considerations may constrain operation as a pure peaking project because ramp-up times are constrained (which should not exceed increases in stream flow rates experienced under natural conditions), and because of the minimum downstream flow requirement. However, detailed studies (reported in the Economic Analysis Background report) show that the contribution of the capacity credit to the total economic benefit is modest, and that ramp-up constraints have a correspondingly small impact on the economic returns.
Power Development Plan for around 1500 MW of small hydro and other renewables by 2015. In short, while all of these alternatives to supply side expansion are unquestionably desirable,
2
they are already under implementation, and simply do not represent an alternative to Trung Son: both are needed.
Hydro in the Optimum Capacity Expansion Strategy All power systems require peaking projects, and if hydro projects were not built, the likely alternative is natural gas based combined cycle projects. Not only does this imply additional greenhouse gas emissions, it incurs significantly higher costs, particularly were gas priced at international levels (which means a gas price equivalent to about 90% of the Singapore fuel oil price). Even when gas is priced at the Ca Mau pricing formula, at 45% of the fuel oil price, developing Vietnam’s remaining hydro projects bring significant economic benefits. In short, at capital costs of below $2000/kW, hydro projects are win-win, bringing significant avoided GHG emission and economic benefits. In addition, reducing the dependence of imported fossil fuel by developing indigenous renewable energy resources improves energy security through greater supply diversity.
A study of the national hydropower development plan by the Stockholm Environmental Institute confirms these arguments. Based on a series of capacity expansion scenarios with progressively less hydro it finds the costs of not developing the hydro projects presently identified in Vietnam’s 6th
Alternative Hydro Projects to Trung Son
Power Development Plan as prohibitively expensive. This is true even when all indirect costs are quantified, such as the economic loss of forest products from the inundated area. (The economic analysis of Trung Son follows all of the SEI recommendations on internalizing environmental and indirect costs in the benefit-cost assessment).
Trung Son is one of many potential hydro projects in the remaining inventory of candidates, which raises the question of whether there are better hydro projects than Trung Son, which might in turn lead to Trung Son being delayed in favor of other projects, including projects in Laos and Cambodia. This question is answered in two parts. First, when all of the uncommitted hydro projects are provided as candidates to a capacity expansion optimization, Trung Son is built first (and before the Lai Chau project): a summary of the results of these studies conducted by the Institute of Energy is provided in Annex I.
Second, when one compares Trung Son against all of the other potential hydro projects on the basis of the main environmental attributes (loss of forest, persons displaced, power density, cost of energy), the high ranking of Trung Son is confirmed. In short, given that the overall strategy requires the development of Vietnam’s remaining economic hydropower resource endowment, Trung Son is one of the most attractive projects within that strategy.
Alternative project sites and reservoir configurations The Master Plan for the Development of the Ma river has considered a range of sites and development options. The subsequent evaluation of alternative Trung Son project configurations was based on a trade-off analysis between optimal hydro production on the one hand, and environmental and risk considerations on the other – including minimization of geotechnical risks, minimizing the number of project affected persons, and avoiding reservoir impacts in Laos (which constrained the full reservoir elevation to 164 meters above sea level)
Conclusions The following conclusions may be drawn from this analysis of alternatives to Trung Son
• Vietnam’s power sector development strategy of developing its indigenous conventional hydro resources, and its domestic gas and coal resources, before turning to other imported fuels, is robust to a wide range of uncertainty in input assumptions, including assumptions on load forecast and international energy prices.
3
• Alternatives to this hydro strategy would be extremely costly, with significant increases in GHG emissions.
• These general findings are also confirmed by the Strategic Environmental Assessment of the hydro development plan prepared for MoIT by the Stockholm Environmental Institute.
• The power development plan already envisages a substantial program of small hydro and renewable energy development, as well as efforts to promote supply and demand side energy efficiency. Not building any additional peaking power generation projects is not a reasonable alternative, given Vietnam’s likely progress in economic development and poverty alleviation.
• Among the remaining hydro projects, Trung Son has favorable economics and relatively modest environmental impacts that are expected to be fully mitigated by the World Bank’s safeguards policies.
• The Trung Son investment decision is robust with respect to load forecast uncertainty and international oil price uncertainty.
4
1. Introduction
Vietnam’s Power Development Strategy 1. The proposed Trung Son Hydropower Project is part of a strategy that emphasizes the development of Vietnam’s remaining hydro and indigenous fossil fuel resources in the short to medium term, before turning in the longer term to imported coal and pumped storage for additional peaking power and, eventually, to nuclear power.2
2. Over the past decade, most of the thermal power capacity additions in Vietnam have used domestic coal (anthracite) in the North, and natural gas in the South (notably the development of the CCGT complexes at Phu My and Ca Mau).
The Power Master Development Plan 6 (2006-2015 with a view to 2025 – PMDP6), which is the Government’s guiding document for power sector investments in Vietnam reflects this strategy.
3
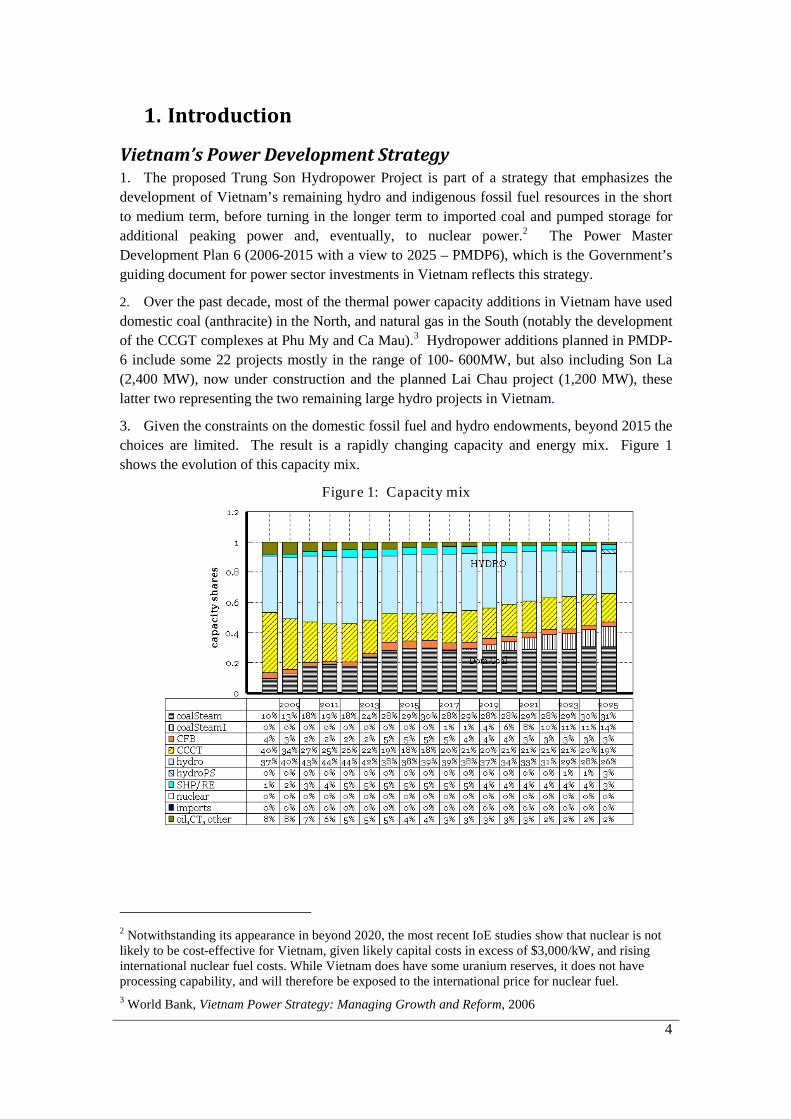
3. Given the constraints on the domestic fossil fuel and hydro endowments, beyond 2015 the choices are limited. The result is a rapidly changing capacity and energy mix. Figure 1 shows the evolution of this capacity mix.
Hydropower additions planned in PMDP-6 include some 22 projects mostly in the range of 100- 600MW, but also including Son La (2,400 MW), now under construction and the planned Lai Chau project (1,200 MW), these latter two representing the two remaining large hydro projects in Vietnam.
Figure 1: Capacity mix
2 Notwithstanding its appearance in beyond 2020, the most recent IoE studies show that nuclear is not likely to be cost-effective for Vietnam, given likely capital costs in excess of $3,000/kW, and rising international nuclear fuel costs. While Vietnam does have some uranium reserves, it does not have processing capability, and will therefore be exposed to the international price for nuclear fuel. 3 World Bank, Vietnam Power Strategy: Managing Growth and Reform, 2006
5
4. The hydro capacity share peaks in 2011-2012 at 44%, but then falls steadily to 19% by 2025. The gas share also declines steadily from the present 40% to 19%, as does the remaining oil and diesel plant (much of which is retired in 2012-2015). Coal, presently just 10% of the total, increases to 45% by 2025: the first large imported coal project would start in 2017 on an assumed demand growth rate of 9-10 percent per year. A key conclusion is that even if large new gas fields were discovered, making possible some shift away from coal, it would not change the need to depend on hydropower with capital costs of $2000/kW or less.
Assumptions 5. In this assessment of project alternatives, it is assumed that the costs of Trung Son and its project alternatives have all been adjusted to internalize the costs of mitigating the environmental and social impacts as required by application of international best practice safeguards to hydro projects. In the case of alternatives to hydro, Vietnam already requires new coal plants to be fitted with flue gas desulfurization (FGD) and high performance electrostatic precipitators (ESP), whose capital and operating costs are reflected in the project cost estimates. Similarly, it is assumed that the same safeguard policies as apply to environment and environmental management plans, resettlement and relocation are applied across all project alternatives, including coal, gas, and other hydropower, and not just to Trung Son.
6. The evaluation of project alternatives for power sector expansion has traditionally required a showing of “least cost”, but with a rather narrow definition of costs limited to production costs. Indeed the most recent 6th Power Master Development Plan (PMDP6) has been criticized on grounds that the assumptions for fuel costs were based on the assumed financial costs to the sector: both domestic gas and domestic coal prices remain reflect production costs, not economic opportunity cost (though the latest gas-based generation project at Ca Mau now has a gas price linked to the Singapore fuel oil price). However, a report commissioned by the World Bank to assess the impact of using financial rather than economic prices in PMDP64
7. This report uses the same information as the economic analysis, which is reported on in more detail separately
concluded that the results would not have been significantly different had economic prices been used.
5. It relies on the least-cost expansion planning studies using fossil fuel prices based on international (border) prices. These are derived from a forecast for the long run price of crude oil of $75/bbl,6 consistent with the World Bank’s December 2008 report on the global outlook for commodities.7
4 Economic Consulting Associates, Economic Chapter of Power Sector Masterplan No.6, Report to the World Bank, January 2006.
The view of most observers is that the $30-$35/bbl oil prices experienced at the end of 2008 was a typical over-reaction to the collapse of the speculative oil price bubble of mid 2008, and the fears of global recession: at the time of writing (early December 2009), crude oil prices have returned again to the $75/bbl mark, and that may well be exceeded by 2010 as the global economy resumes growth.
5 World Bank, Trung Son Hydropower Project Economic Analysis Background Report June 2009 hereinafter cited as Economic Analysis Background Report. 6 The derivation of the corresponding border prices for coal and gas are discussed further in the Economic Analysis Background Report (ibid) 7 World Bank, Global Economic Prospects 2009: Commodities at the Crossroads, December 2008.
6
2. Alternatives to Supply Side Expansion 8. Between 1995 and 2008, household access increased from 50 percent to nearly 94 percent; and annual per capita consumption increased from 156 kilowatt hours (kWh) to about 800 kWh. Between 2003 and 2008 installed capacity increased from about 9,300MW to over 15,800MW, implying a demand elasticity of about two: for every one percentage point of GDP growth, the demand for electricity grows by two percent. In 2008, however, the power system was unable to meet peak demand of over 13,000MW8
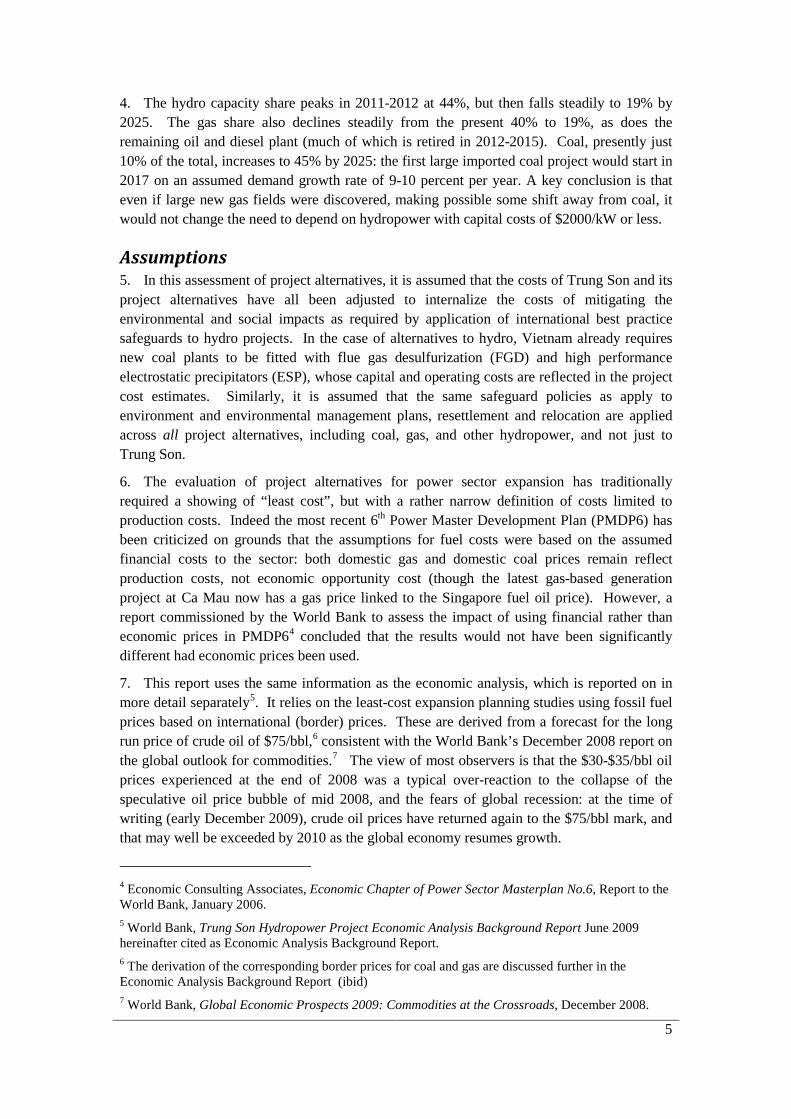
9. A regional comparison of per capita electricity consumption is shown in Table 1 (2005 figures are the latest available for all comparable countries, 2002 for electrification rates). Consumption of electricity per capita can be expected to rise to the levels seen in China and Thailand and other middle income countries (which worldwide averaged 1,492 kWh per capita per year in 2005). Although Indonesia and the Philippines have comparable levels of per capita consumption, the electrification rate is substantially lower, and much of the supply is from mini-grids on remote islands, which do not run 24 hours a day. It is therefore reasonable to conclude that the trend for Vietnam will be towards the middle-income countries average or the regional average, suggesting continued high demand growth rates over the coming years.
with this level of installed capacity. This is unsurprising as reserve margins have been eroded in recent years, and are well below the 25-30 percent levels normally considered prudent for a modern power system.
Table 1: Per capita electr icity consumption (2005) kWh/capita1 PPP
$GDP/capita1 Electrification
Rate (2002)2
China 1783 4100 99.0
Indonesia 509 3040 52.5
Philippines 578 3200 71
Thailand
3
1988 6730 91.1
Vietnam 598 2100 79.6
East Asia 1928 - 88.8
Middle Income 1492 - n/a
Sources: 1: World Bank World Development Indicators Database; 2: IEA World Energy Outlook; 3: Authors’ estimate. n/a: not available
Supply Side Efficiency Improvements 10. Vietnam’s T&D system is relatively efficient at 11.5% in 2008. Continued upgrading is expected to bring this down to 9.6 % by 2015, and 8.5% by 2020.9
8 Due to system outages and the difference between name-plate installed capacity and actual capacity of each plant which is affected by ambient conditions, age, fuel quality and other factors.
There are some cost-effective opportunities to upgrade the rural distribution network as the low voltage assets of poorly performing local distribution utilities (LDUs) are transferred to EVN’s power companies. This will give opportunities for EVN to pursue supply side efficiency upgrades, with financial support from donors.
9 IoE estimates for the PMDP-6.
7
11. Detailed estimates of the possible demand reductions are not available but based on existing project experience total demand from LDUs could be reduced by 10-20 percent. Taking demand in rural areas of about 15% of the total and total sales of 66TWh in 2008, then rural demand was about 10TWh per year. Demand could thus be reduced by about 2TWh per year. Assuming that all this demand occurs during four hours in the day, then total peaking capacity could be reduced by somewhere between 700 and 1,400MW.
Demand Side Management 12. Estimating the potential for demand side management is notoriously difficult, since it must take into account the individual decisions of millions of consumers and the specific uses in several industrial sectors. A review of DSM potential for PMDP-6 suggested that evening peak demand could be reduced by 1,200MW and the mid-day peak by 450MW, leading to reductions in energy consumption of over 6TWh per year. These would be achieved by programs for compact fluorescent lamps, solar water heating and improved refrigeration among others.
13. EVN’s energy efficient lighting program has recently been scaled up, and more general efforts to encourage energy efficiency will be given new impetus of an Energy Efficiency Law which was reviewed by the National Assembly in May 2009.10
Summary
In practice, the demand side management program in PMDP-6 is targeted to result in a 207MW reduction of the peak by 2012, and 450 MW by 2015 at day time peak load. As this day time peak is the absolute peak level, this is the most significant one that must be addressed.
14. Supply and demand side measures can complement each other to address the day and evening peaks. Simple arithmetic addition of the two peaks would over-state possible reductions because capacity to meet the daytime peak – which is the higher of the two and expected to become higher still as the demand profile increasingly switches to industry – is also available to meet the evening peak. Hence peak demand reduction from supply and demand would be 450MW through efficiency measures. Total energy saved would be about 8TWh per year. It is thus clear that even if all efficiency measures became immediately achievable they would not restore reserve margins to the desirable 25-30% level, let alone defer the construction of any plants in the capacity expansion plan.
15. Although supply and demand side management options have potential and are being vigorously pursued, they alone cannot be relied on to meet Vietnam’s burgeoning power requirements. Thus the proposition that additional capacity, whether from base load or peaking plants is not needed, or could be significantly deferred, by supply side efficiency improvements and DSM programs not already planned, cannot be sustained. Despite much recent progress, Vietnam remains a poor country with low per capita electricity consumption, and further demand growth is an inescapable consequence of its continued economic development.
10 Law of Energy Conservation and Efficient Use

8
3. Hydro in the Optimum Capacity Expansion Strategy
Vietnam’s Capacity Expansion Plan 16. Figure 2 illustrates the least cost capacity expansion plan by technologies.11 Net capacity retirements are shown as negative entries.12
Figure 2: Vietnam’s capacity expansion plan
Trung Son is highlighted. This shows quite clearly that the projected increases in demand will be met by a substantial build out of a combination of hydro, gas and coal, with coal, in particular, playing an increasingly important role, albeit with increasingly sophisticated technologies new to Vietnam.
Note: Coal Steam is domestic anthracite; coalSteamI is supercritical PC using imported coal
Load Forecasts 17. The IoE load forecast, on which PMDP-6 is based shows high growth rates, and the 2009 energy growth forecast of 30 percent is already most unlikely to be met in light of economic conditions (the first eight months of 2009 shows an annualized growth rate of about 10 percent). The World Bank forecast makes more modest assumptions about short term demand growth of 9% in 2009 and 10% in 2010). Demand growth is assumed to peak at 12% in 2012 following global recovery, declining to 8% by 2019, as the expected energy intensity
11 Figure 2 shows the expansion plan using the World Bank load forecast. 12 The coal retirements are 4 x22MW at Ninh Binh and 2 x50MW at Uong Bi, all in 2015; the remaining retirements are 70MW of small diesels in PC2’s area in 2011; the fueloil/diesel plant at Thu Duc in 2015; and 200MW of CCGT at Phu My 1.
9
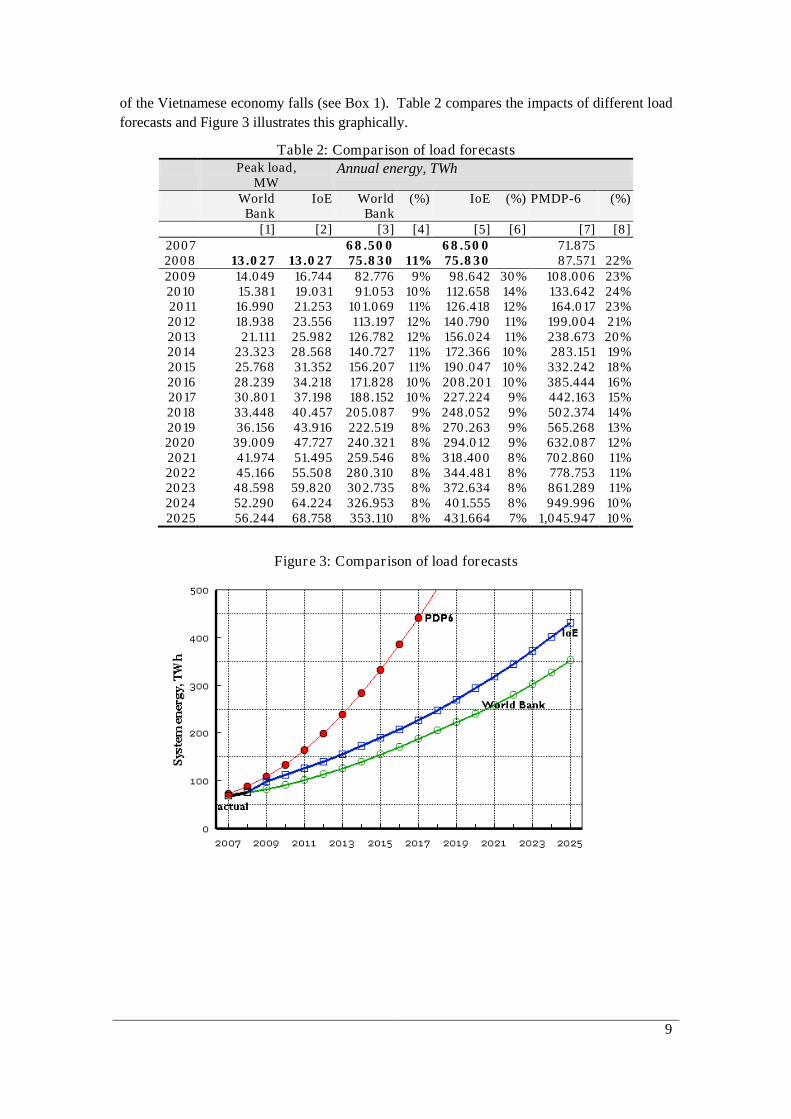
of the Vietnamese economy falls (see Box 1). Table 2 compares the impacts of different load forecasts and Figure 3 illustrates this graphically.
Table 2: Compar ison of load forecasts Peak load,
MW Annual energy, TWh
World Bank
IoE World Bank
(%) IoE (%) PMDP-6 (%)
[1] [2] [3] [4] [5] [6] [7] [8] 2007 68.500 68.500 71.875 2008 13.027 13.027 75.830 11% 75.830 87.571 22% 2009 14.049 16.744 82.776 9% 98.642 30% 108.006 23% 2010 15.381 19.031 91.053 10% 112.658 14% 133.642 24% 2011 16.990 21.253 101.069 11% 126.418 12% 164.017 23% 2012 18.938 23.556 113.197 12% 140.790 11% 199.004 21% 2013 21.111 25.982 126.782 12% 156.024 11% 238.673 20% 2014 23.323 28.568 140.727 11% 172.366 10% 283.151 19% 2015 25.768 31.352 156.207 11% 190.047 10% 332.242 18% 2016 28.239 34.218 171.828 10% 208.201 10% 385.444 16% 2017 30.801 37.198 188.152 10% 227.224 9% 442.163 15% 2018 33.448 40.457 205.087 9% 248.052 9% 502.374 14% 2019 36.156 43.916 222.519 8% 270.263 9% 565.268 13% 2020 39.009 47.727 240.321 8% 294.012 9% 632.087 12% 2021 41.974 51.495 259.546 8% 318.400 8% 702.860 11% 2022 45.166 55.508 280.310 8% 344.481 8% 778.753 11% 2023 48.598 59.820 302.735 8% 372.634 8% 861.289 11% 2024 52.290 64.224 326.953 8% 401.555 8% 949.996 10% 2025 56.244 68.758 353.110 8% 431.664 7% 1,045.947 10%
Figure 3: Comparison of load forecasts

10
Box 1: Load forecasting
The IoE load forecast (based on the growth rates in PMDP-6) is considered by some to be unrealistically high. But even were the growth rate to be 50% less than forecast (either for reasons of lower economic growth rates in wake of the global recession, or as a consequence of a reduction in the income elasticity), the incremental capacity required over the five year period 2015-2020 will still be some 7,500MW, of which around 2,000 MW is needed immediately just to bring the reserve margin to acceptable levels.
Over the last few years, the income elasticity has been at a fairly high value of around 2 – i.e. a 1% increase in GDP results in a 2% increase in electricity demand: as shown in the figure below, this is much higher than in Vietnam’s neighbors (China is 1.6; Thailand 1.1).
KWh/capita
GDP US$ Per Capita
Source: JICA, Vietnam: A Study on National Energy Masterplan. November 2007
Although it is reasonable to suppose that energy intensity will decline in the future, its timing is highly uncertain. As noted, the alternative World Bank forecast assumes a somewhat faster reduction in income elasticity, with a 2015 energy requirement some 34TWh lower than the IoE forecast (Table 2).
In any event deriving the perfect forecast is impossible: rather the questions of whether the decision to install additional capacity and individual investments are robust given the various uncertainties are more important. These uncertainties include not just the load forecast, but also international energy prices, or possible future gas field discoveries.
Hydro v. Thermal 18. The main alternative to development of the remaining large and medium hydropower sites in Vietnam is some combination of natural gas combined cycle and coal: during the wet season when hydro runs 24 hours a day, it would displace coal generation in the North (allowing baseload units to be taken out of service for scheduled maintenance); and during the dry season it would displace gas CCGT in the South, though limited to the 500kV transmission capacity and its ability to store water. At the margin, in the absence of adequate interregional transfer capacity, peaking requirements would have to be met by either LNG (as in neighboring provinces of China) or pumped storage (which is not a renewable energy

11
source, since it requires about 1.6 kWh of thermal (baseload) energy to produce one 1kWh of peak (pumped storage hydro energy).
19. The comparison between hydro and an alternative as a peaking plant depends critically on assumptions about the long term gas price, which, in turn, depends not just on the international oil price, but the pricing formula13. Taking Trung Son for illustrative purposes, if LNG is priced at parity with fueloil at $75/bbl oil price, and if Trung Son displaced only gas, then the ERR for Trung Son is 19.5 percent; if the Ca Mau formula were used14, the ERR falls to 12.5%15
20. Figure 4 shows the corresponding sensitivity analysis: the switching value (at which the ERR falls to the hurdle rate of 10%) is 38$/bbl at fuel oil parity, and $52/bbl under the Ca Mau formula. As a long term average, this is an extremely unlikely price band; even the 2009 average oil price, almost certainly at its lowest point given the global recession, is likely to be around $60/bbl.
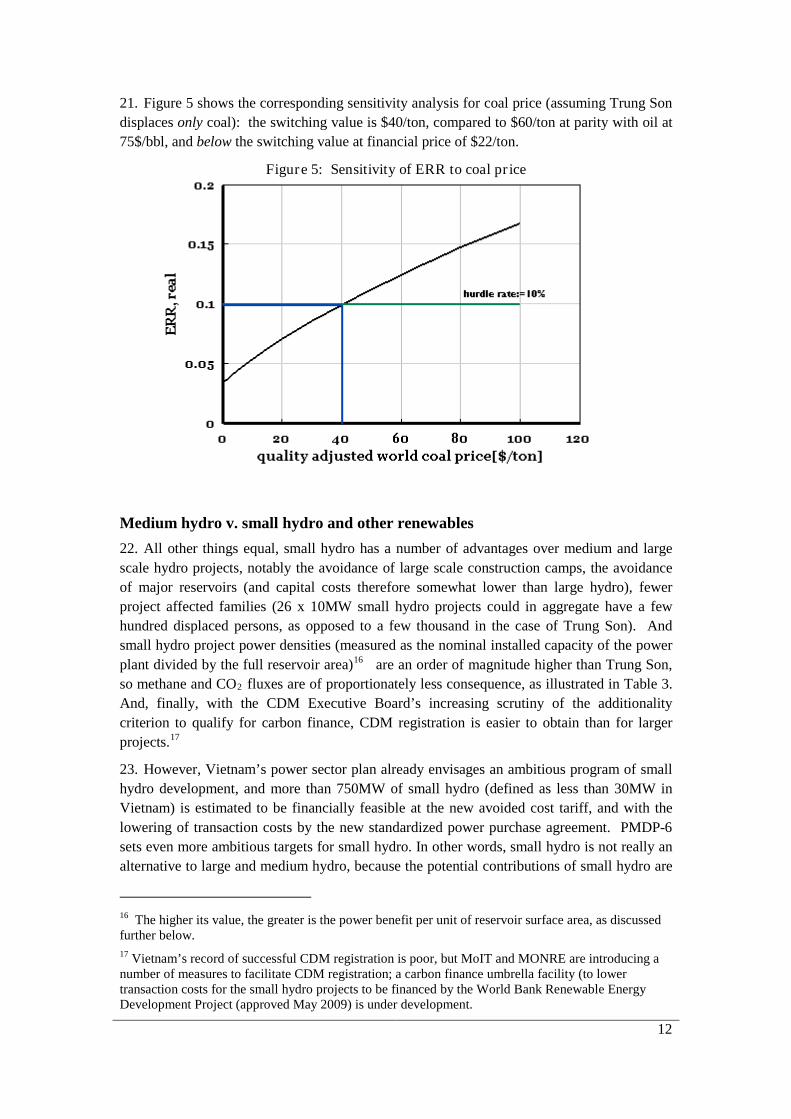
. Similarly, comparisons with coal options depend on assumptions about the price at which coal can be obtained. Again using Trung Son for illustrative purposes, if Trung Son displaced only domestic coal priced at international parity (for similar quality coal) of around $50/ton, then the ERR is 13.4 percent. If the present financial price of $22/ton were used, the ERR falls to 7.5 percent.
Figure 4: Sensitivity of ERR to the long-term wor ld o il pr ice
Fraction of Singapore
HFSO price
ERR at switching value
75$/bbl $/bbl Ca Mau 0.45 12.9% 52 Singapore 0.90 16.7% 38
13 Environmental considerations may constrain operation as a pure peaking plant because ramp-up times are constrained so as not to exceed increases in stream flow rates experienced under natural conditions, and because of minimum environmental flow requirements. 14 This sets the delivered price, in $/mmBTU, at 1.17+0.45*Singapore Fueloil Price($.mmBTU). The latter has historically been around 0.8 of the crude oil price. LNG pricing formulas in the Asia-Pacific region are discussed further in the Trung Son Economic Analysis Background Report. 15 As discussed further in the Economic Analysis Background Report, Trung Son displaces coal and gas.
12
21. Figure 5 shows the corresponding sensitivity analysis for coal price (assuming Trung Son displaces only coal): the switching value is $40/ton, compared to $60/ton at parity with oil at 75$/bbl, and below the switching value at financial price of $22/ton.
Figure 5: Sensitivity of ERR to coal pr ice
Medium hydro v. small hydro and other renewables 22. All other things equal, small hydro has a number of advantages over medium and large scale hydro projects, notably the avoidance of large scale construction camps, the avoidance of major reservoirs (and capital costs therefore somewhat lower than large hydro), fewer project affected families (26 x 10MW small hydro projects could in aggregate have a few hundred displaced persons, as opposed to a few thousand in the case of Trung Son). And small hydro project power densities (measured as the nominal installed capacity of the power plant divided by the full reservoir area)16 are an order of magnitude higher than Trung Son, so methane and CO2 fluxes are of proportionately less consequence, as illustrated in Table 3. And, finally, with the CDM Executive Board’s increasing scrutiny of the additionality criterion to qualify for carbon finance, CDM registration is easier to obtain than for larger projects.17
23. However, Vietnam’s power sector plan already envisages an ambitious program of small hydro development, and more than 750MW of small hydro (defined as less than 30MW in Vietnam) is estimated to be financially feasible at the new avoided cost tariff, and with the lowering of transaction costs by the new standardized power purchase agreement. PMDP-6 sets even more ambitious targets for small hydro. In other words, small hydro is not really an alternative to large and medium hydro, because the potential contributions of small hydro are
16 The higher its value, the greater is the power benefit per unit of reservoir surface area, as discussed further below. 17 Vietnam’s record of successful CDM registration is poor, but MoIT and MONRE are introducing a number of measures to facilitate CDM registration; a carbon finance umbrella facility (to lower transaction costs for the small hydro projects to be financed by the World Bank Renewable Energy Development Project (approved May 2009) is under development.

13
already factored into the least cost plan. All of the financially feasible small hydro projects can be expected to be built over the next 10-15 years, and entirely unaffected by the presence or absence of hydro in the expansion plan.18
Table 3: Power densities of r epresentative Projects
Project Installed Capacity
Reservoir area
Power density
MW Km2 W/m2 Medium Hydro Trung Son 260 13.13 19.8 Song Bung 4 156 15.8 9.9 Small Hydro Sung Vui 18 3.2 ha 563 Nam Tang 6.5 0.3 ha 2167 Dak Me 4 2.1 ha 190 Can Ho 4.2 0.7 ha 600 Ha Tay 9 64ha 14
Hydro Development Strategy 24. The question of alternatives to the hydro strategy adopted by the PMDP-6 has been studied in some detail by the Strategic Environmental Assessment of the Hydropower Masterplan, recently prepared for MoIT by the Stockholm Environmental Institute (SEI).19
25. The sequence of deletions from the PMDP-6 hydro project construction sequence was based on the overall rankings for hydro projects established in the National Hydropower Plan.
This study examined a series of alternative scenarios, that ranged from a base case that included all of the hydro projects recommended by PMDP-6 (for which construction had not already begun), to three alternatives with a decreasing number of hydro projects, to a scenario in which no hydropower projects are built at all (though replaced by thermal power), and, finally, to a scenario in which no hydropower projects are built, and not replaced by thermal power.
20
18 Other renewable energy technologies such as biomass and bagasse cogeneration will also make some contributions, but according to the recently completed Renewable Energy Masterplan, are of limited potential, and would require some additional subsidy (up to the avoided social cost) to be enabled. The development of large scale wind power is constrained by few good sites and little long-term monitoring data, and would require a feed-in tariff of around VND1500/kWh, double the avoided cost tariff.
This calculated a “technical /economic preference index (TEPI),” and an “environmental/ social preference index (ESPI)”. These were combined into a “total preference index (TPI)”, and then normalized into a “normalized total preference index (NTPI)” on a scale of zero to 100 – where a low score indicates a less desirable project. Table 4 lists the hydro projects examined, together with their index scores (listed in descending order of economic attractiveness as measured by the benefit cost ratio).
19 Strategic Environmental Assessment of the Hydropower Masterplan in the Context of the 6th Power Development Plan, Final Report, January 2009. The 22 projects are listed in Annex 2-2. 20 SWECO-NORPLAN, National Hydropower Master Plan Stage 2, 2003.
14
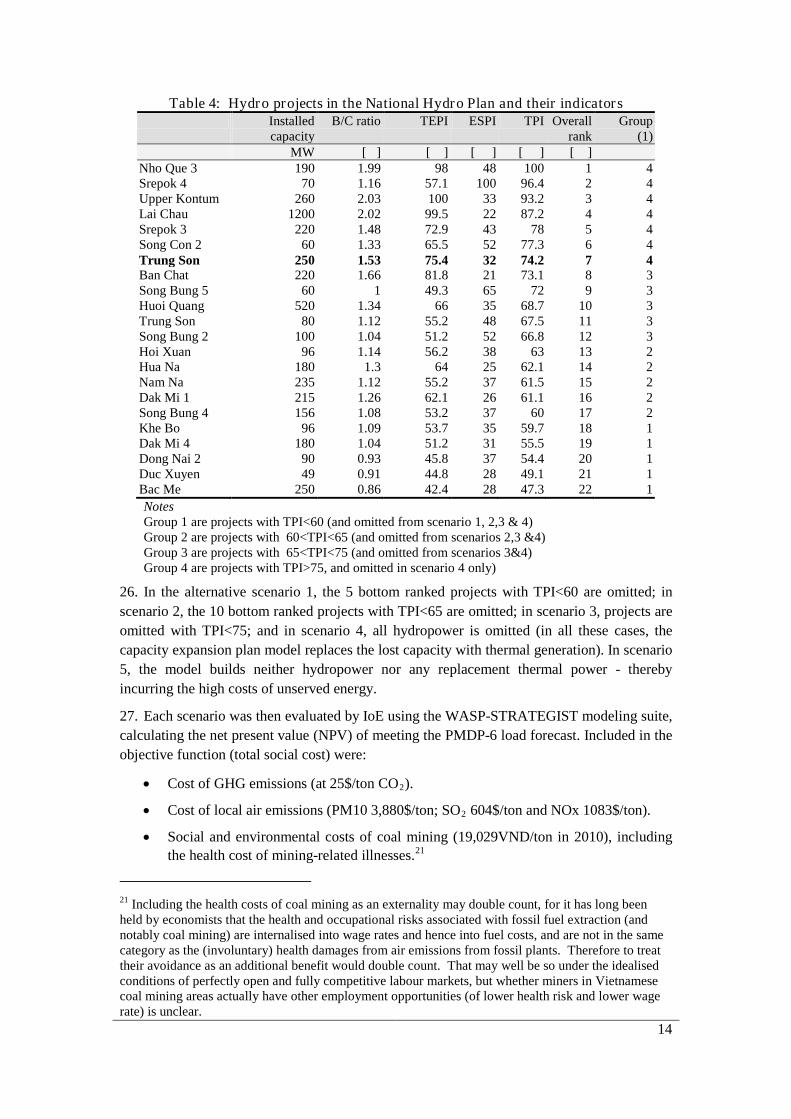
Table 4: Hydro projects in the National Hydro Plan and their indicators Installed
capacity B/C ratio TEPI ESPI TPI Overall
rank Group
(1) MW [ ] [ ] [ ] [ ] [ ]
Nho Que 3 190 1.99 98 48 100 1 4 Srepok 4 70 1.16 57.1 100 96.4 2 4 Upper Kontum 260 2.03 100 33 93.2 3 4 Lai Chau 1200 2.02 99.5 22 87.2 4 4 Srepok 3 220 1.48 72.9 43 78 5 4 Song Con 2 60 1.33 65.5 52 77.3 6 4 Trung Son 250 1.53 75.4 32 74.2 7 4 Ban Chat 220 1.66 81.8 21 73.1 8 3 Song Bung 5 60 1 49.3 65 72 9 3 Huoi Quang 520 1.34 66 35 68.7 10 3 Trung Son 80 1.12 55.2 48 67.5 11 3 Song Bung 2 100 1.04 51.2 52 66.8 12 3 Hoi Xuan 96 1.14 56.2 38 63 13 2 Hua Na 180 1.3 64 25 62.1 14 2 Nam Na 235 1.12 55.2 37 61.5 15 2 Dak Mi 1 215 1.26 62.1 26 61.1 16 2 Song Bung 4 156 1.08 53.2 37 60 17 2 Khe Bo 96 1.09 53.7 35 59.7 18 1 Dak Mi 4 180 1.04 51.2 31 55.5 19 1 Dong Nai 2 90 0.93 45.8 37 54.4 20 1 Duc Xuyen 49 0.91 44.8 28 49.1 21 1 Bac Me 250 0.86 42.4 28 47.3 22 1 Notes Group 1 are projects with TPI<60 (and omitted from scenario 1, 2,3 & 4) Group 2 are projects with 60<TPI<65 (and omitted from scenarios 2,3 &4) Group 3 are projects with 65<TPI<75 (and omitted from scenarios 3&4) Group 4 are projects with TPI>75, and omitted in scenario 4 only)
26. In the alternative scenario 1, the 5 bottom ranked projects with TPI<60 are omitted; in scenario 2, the 10 bottom ranked projects with TPI<65 are omitted; in scenario 3, projects are omitted with TPI<75; and in scenario 4, all hydropower is omitted (in all these cases, the capacity expansion plan model replaces the lost capacity with thermal generation). In scenario 5, the model builds neither hydropower nor any replacement thermal power - thereby incurring the high costs of unserved energy.
27. Each scenario was then evaluated by IoE using the WASP-STRATEGIST modeling suite, calculating the net present value (NPV) of meeting the PMDP-6 load forecast. Included in the objective function (total social cost) were:
• Cost of GHG emissions (at 25$/ton CO2
• Cost of local air emissions (PM10 3,880$/ton; SO
).
2
• Social and environmental costs of coal mining (19,029VND/ton in 2010), including the health cost of mining-related illnesses.
604$/ton and NOx 1083$/ton).
21
21 Including the health costs of coal mining as an externality may double count, for it has long been held by economists that the health and occupational risks associated with fossil fuel extraction (and notably coal mining) are internalised into wage rates and hence into fuel costs, and are not in the same category as the (involuntary) health damages from air emissions from fossil plants. Therefore to treat their avoidance as an additional benefit would double count. That may well be so under the idealised conditions of perfectly open and fully competitive labour markets, but whether miners in Vietnamese coal mining areas actually have other employment opportunities (of lower health risk and lower wage rate) is unclear.
15
• Social mitigation costs.
• Environmental costs of hydropower, including value of forests lost in the reservoir,22
• The costs of potential methane emissions from reservoirs (using a global warming potential of 23 for methane).
and offset by the benefits of increased agricultural production.
• Multi-purpose benefits of hydro projects (notably flood control).23
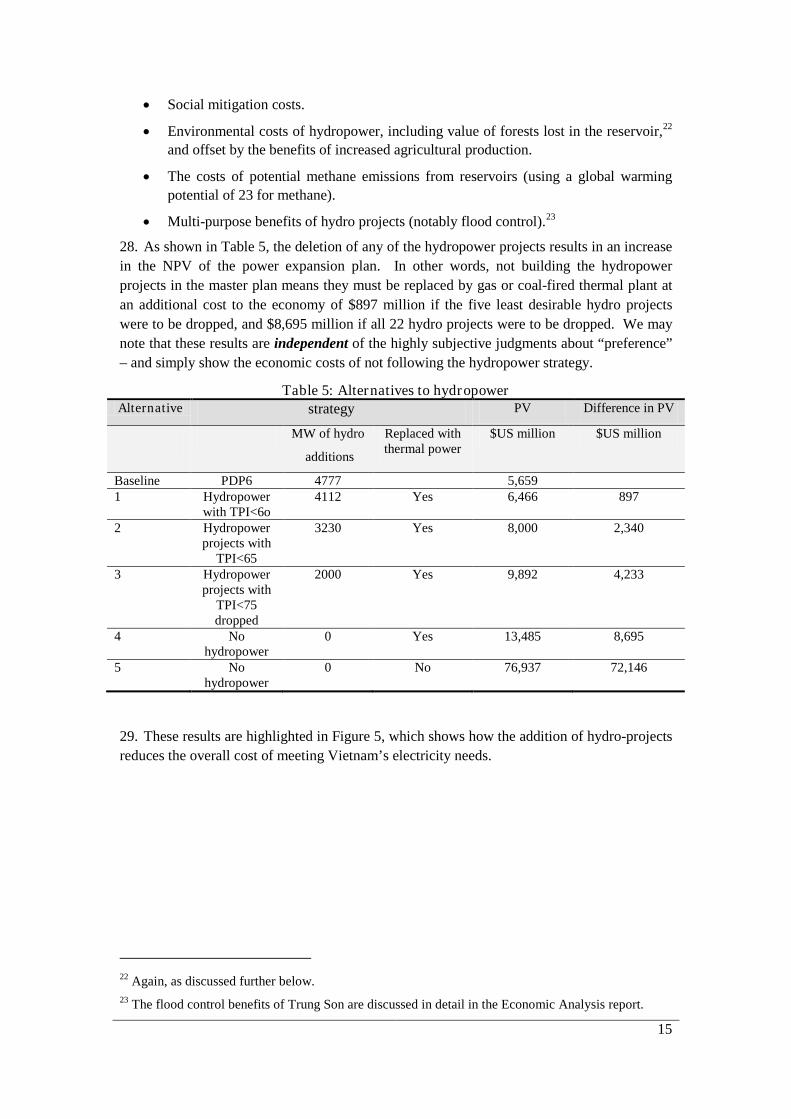
28. As shown in Table 5, the deletion of any of the hydropower projects results in an increase in the NPV of the power expansion plan. In other words, not building the hydropower projects in the master plan means they must be replaced by gas or coal-fired thermal plant at an additional cost to the economy of $897 million if the five least desirable hydro projects were to be dropped, and $8,695 million if all 22 hydro projects were to be dropped. We may note that these results are independent of the highly subjective judgments about “preference” – and simply show the economic costs of not following the hydropower strategy.
Table 5: Alternatives to hydropower Alternative strategy PV Difference in PV
MW of hydro
additions
Replaced with thermal power
$US million $US million
Baseline PDP6 4777 5,659 1 Hydropower
with TPI<6o 4112 Yes 6,466 897
2 Hydropower projects with
TPI<65
3230 Yes 8,000 2,340
3 Hydropower projects with
TPI<75 dropped
2000 Yes 9,892 4,233
4 No hydropower
0 Yes 13,485 8,695
5 No hydropower
0 No 76,937 72,146
29. These results are highlighted in Figure 5, which shows how the addition of hydro-projects reduces the overall cost of meeting Vietnam’s electricity needs.
22 Again, as discussed further below. 23 The flood control benefits of Trung Son are discussed in detail in the Economic Analysis report.

16
Figure 5: MW of hydropower v. cost
30. The conclusion of this analysis is that when the social mitigation costs, the value of forest lost in the reservoir, and GHG emissions from reservoirs are properly taken into account in an economic analysis (in the above analysis, these costs are all internalized in the cost function), the strategy of hydropower generation is justified. The SEA concludes that: 24
the base scenario according to PMDP-6 is clearly the best option not only from cost of supply perspective, but being reinforced when the other factors are taken into account, and even if the multi-purpose benefits are excluded.
31. The SEA goes on to note that25
the level of hydropower planned in PMDP-6 is essentially a desirable one in terms of the least cost means to ensure that Viet Nam’s future power needs are met. This is true even where the full range of social and environmental costs are internalized into the economic analysis of hydropower, as the full costs of alternative generation sources are even higher. As such, the significance of hydropower in contributing to overall national development has been demonstrated.
…hydropower can contribute to development in another way if appropriate measures are taken: it can be a catalyst to the development of the economies of remote locations inhabited by poor and marginalized people. This is far from guaranteed and the planning of hydropower needs to include measures to take advantage of local development opportunities. Where this is the case, hydropower can provide significant benefits to local communities through improved access to external markets, new livelihood opportunities and better access to a range of services.
The displacement of local communities is a key and controversial issue for hydropower development. It is an inevitable consequence of hydropower in many localities. Past experiences in mitigating the impact of displacement have not been adequate when compared to international good practice on resettlement. The SEA has demonstrated that this need not be the case: it is possible to provide a mitigation and development package that will provide a means to ensure that displaced people have long-term
24 SEA, op.cit., p.106 25 Ibid, p.217.
17
development support to restore and improve livelihoods and ultimately are better off after they are resettled.
32. In other words, provided that international good practice on resettlement and livelihood restoration is followed, development of the hydropower option is sound from Vietnam’s point of view, as well as from the global climate change and local environmental impact perspectives.

18
4. Trung Son in the Hydro Development Strategy 33. Given that Vietnam should indeed be exploiting its hydropower resources as part of its overall power development strategy, the third question is whether Trung Son should be part of that strategy, and, if so, when should it be built. Trung Son does of course appear in PMDP-6, and in the rankings used by the National Hydropower Plan; in the SEA, Trung Son has the 7th
Comparison of Projects
overall rank (Table 4). In this section we compare Trung Son with the other hydro projects based on specific quantitative indicators, rather than the somewhat subjective “preference rankings”.
Cost of Energy 34. The National Hydropower Plan evaluated the “economic-technical” rankings on the basis of benefit/cost ratio, and then “scored” to derive a “preference ranking”. The benefit/cost ratio is not in general use by the World Bank as an indicator of the economic merit of power and energy sector projects, NPV being the preferred metric. Since the information on benefits is not available (and was not reported in the SEA), a more useful indicator is the cost of energy, shown together with other salient data in Table 6 (and sorted in increasing order of that cost of energy).
Table 6: Hydropower projects in National Hydropower Plan26 Capacity Displaced
persons (DP)
Area Capital cost Energy Energy cost
Power density
DP/kW
[MW] Km2 $USm $/kW GWh/year USc/kWh W/m2 Lai Chau 1,200 8,460 39.6 946.4 789 4,748 2.43 30.3 7 Nho Que 3 190 565 0.5 151.7 799 676 2.74 3 TRUNG SON 260 2,285 12.7 327.9 1,261 1,058 3.78 20.5 8.8 Huoi Quang 520 7,050 8.7 509.5 980 1,613 3.85 59.8 14 Dong Nai 5 140 4.5 234.1 1,672 709 4.03 31.1 0 Ban Chat 220 14,800 60.4 396.6 1,803 1,188 4.07 3.6 67 Upper Kon Tum
260 650 4.4 209.2 805 602 4.24 59.1 3
Srepok 4 70 0 4.8 114.2 1,631 312 4.46 14.6 0 Hoi Xuan 96 1,615 5.9 143.1 1,491 386 4.52 16.3 17 Dak Mi 1 215 0 4.5 313.5 1,458 824 4.64 47.8 0 Khe Bo 96 3,482 9.5 153.5 1,599 396 4.73 10.1 36 Hua Na 180 4,865 20.6 295.9 1,644 736 4.90 8.7 27 Nam Na 235 2,325 9.3 353.3 1,504 862 5.00 25.3 10 Song Bung 5 60 0 1.7 106.8 1,780 252 5.17 35.3 0 Song Bung 2 100 0 2.9 176.4 1,764 395 5.45 34.5 0 Song Bung 4 156 1,216 15.8 251.9 1,614 558 5.51 9.9 8 Dak Mi 4 180 150 11 318.6 1,770 703 5.53 16.4 1 Dong Nai 2 90 2,993 6.5 197.0 2,189 375 6.41 13.8 33 Bac Me 250 10,700 20.2 390.2 1,561 689 6.91 12.4 43 Source: Data from the National Hydro Plan. Costs have been updated to 2009 price levels. Displaced persons and reservoir area from SEA
26 The Projects in the National Hydropower Master Plan do not correspond exactly with those in the SEA discussed in the previous chapter.
19
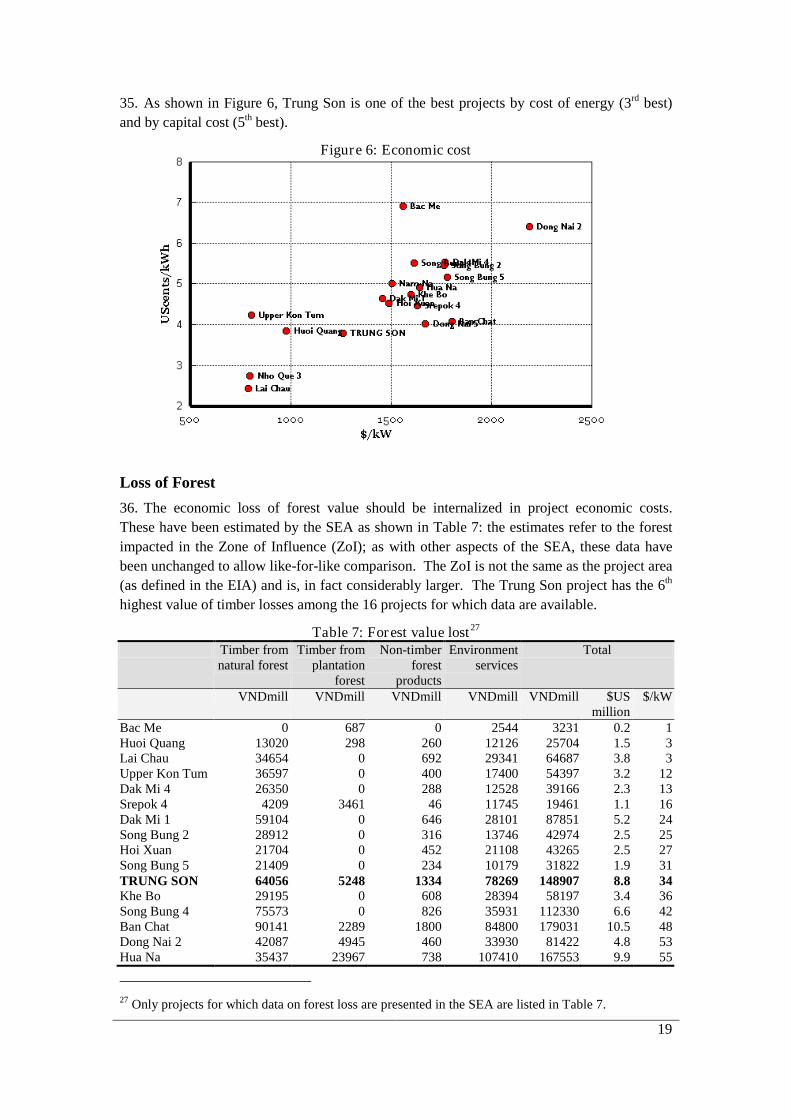
35. As shown in Figure 6, Trung Son is one of the best projects by cost of energy (3rd best) and by capital cost (5th
Figure 6: Economic cost
best).
Loss of Forest 36. The economic loss of forest value should be internalized in project economic costs. These have been estimated by the SEA as shown in Table 7: the estimates refer to the forest impacted in the Zone of Influence (ZoI); as with other aspects of the SEA, these data have been unchanged to allow like-for-like comparison. The ZoI is not the same as the project area (as defined in the EIA) and is, in fact considerably larger. The Trung Son project has the 6th
Table 7: Forest value lost
highest value of timber losses among the 16 projects for which data are available.
27 Timber from natural forest
Timber from plantation
forest
Non-timber forest
products
Environment services
Total
VNDmill VNDmill VNDmill VNDmill VNDmill $US million
$/kW
Bac Me 0 687 0 2544 3231 0.2 1 Huoi Quang 13020 298 260 12126 25704 1.5 3 Lai Chau 34654 0 692 29341 64687 3.8 3 Upper Kon Tum 36597 0 400 17400 54397 3.2 12 Dak Mi 4 26350 0 288 12528 39166 2.3 13 Srepok 4 4209 3461 46 11745 19461 1.1 16 Dak Mi 1 59104 0 646 28101 87851 5.2 24 Song Bung 2 28912 0 316 13746 42974 2.5 25 Hoi Xuan 21704 0 452 21108 43265 2.5 27 Song Bung 5 21409 0 234 10179 31822 1.9 31 TRUNG SON 64056 5248 1334 78269 148907 8.8 34 Khe Bo 29195 0 608 28394 58197 3.4 36 Song Bung 4 75573 0 826 35931 112330 6.6 42 Ban Chat 90141 2289 1800 84800 179031 10.5 48 Dong Nai 2 42087 4945 460 33930 81422 4.8 53 Hua Na 35437 23967 738 107410 167553 9.9 55
27 Only projects for which data on forest loss are presented in the SEA are listed in Table 7.
20
Source: SEA
37. The value of forest lost to the reservoir is VND148billion ($US8.8m), or $34/kW. When included in the economic analysis, the economic rate of return decreases by about 0.5%. This may be contrasted with the present value of the downstream flood control benefits conservatively estimated at $24million.28
Power density
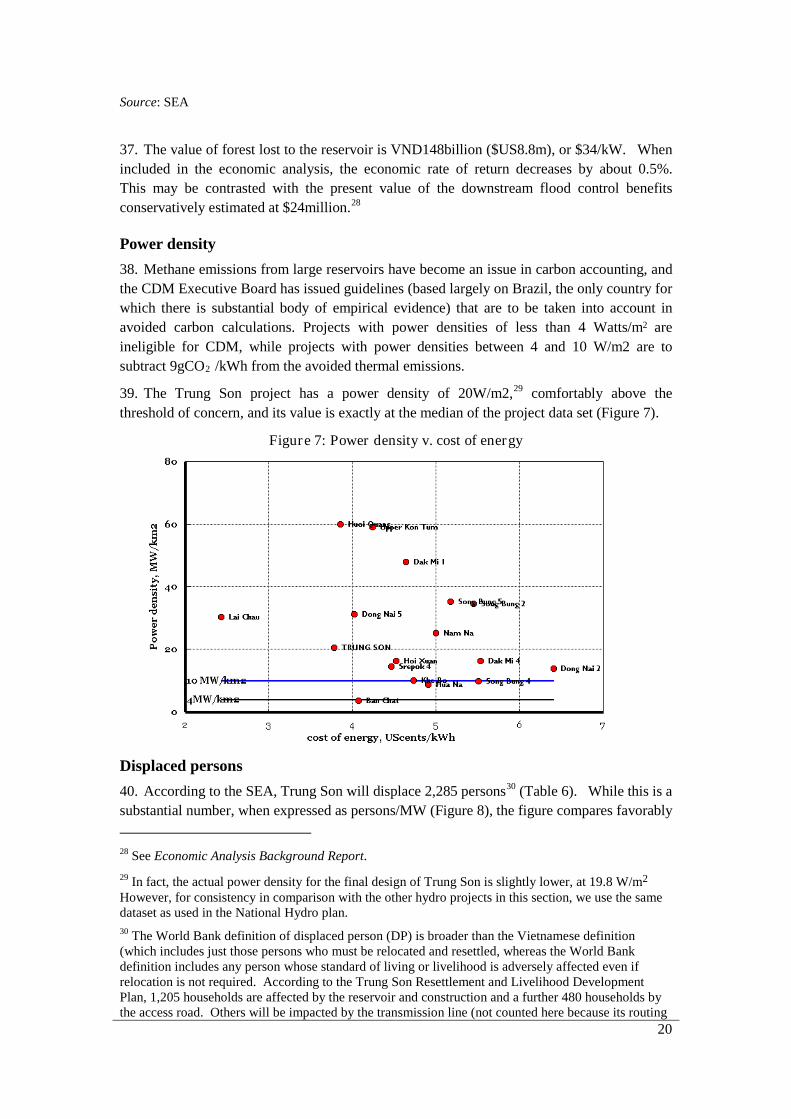
38. Methane emissions from large reservoirs have become an issue in carbon accounting, and the CDM Executive Board has issued guidelines (based largely on Brazil, the only country for which there is substantial body of empirical evidence) that are to be taken into account in avoided carbon calculations. Projects with power densities of less than 4 Watts/m2 are ineligible for CDM, while projects with power densities between 4 and 10 W/m2 are to subtract 9gCO2
39. The Trung Son project has a power density of 20W/m2,
/kWh from the avoided thermal emissions. 29
Figure 7: Power density v. cost of energy
comfortably above the threshold of concern, and its value is exactly at the median of the project data set (Figure 7).
Displaced persons 40. According to the SEA, Trung Son will displace 2,285 persons30
28 See Economic Analysis Background Report.
(Table 6). While this is a substantial number, when expressed as persons/MW (Figure 8), the figure compares favorably
29 In fact, the actual power density for the final design of Trung Son is slightly lower, at 19.8 W/m2 However, for consistency in comparison with the other hydro projects in this section, we use the same dataset as used in the National Hydro plan. 30 The World Bank definition of displaced person (DP) is broader than the Vietnamese definition (which includes just those persons who must be relocated and resettled, whereas the World Bank definition includes any person whose standard of living or livelihood is adversely affected even if relocation is not required. According to the Trung Son Resettlement and Livelihood Development Plan, 1,205 households are affected by the reservoir and construction and a further 480 households by the access road. Others will be impacted by the transmission line (not counted here because its routing
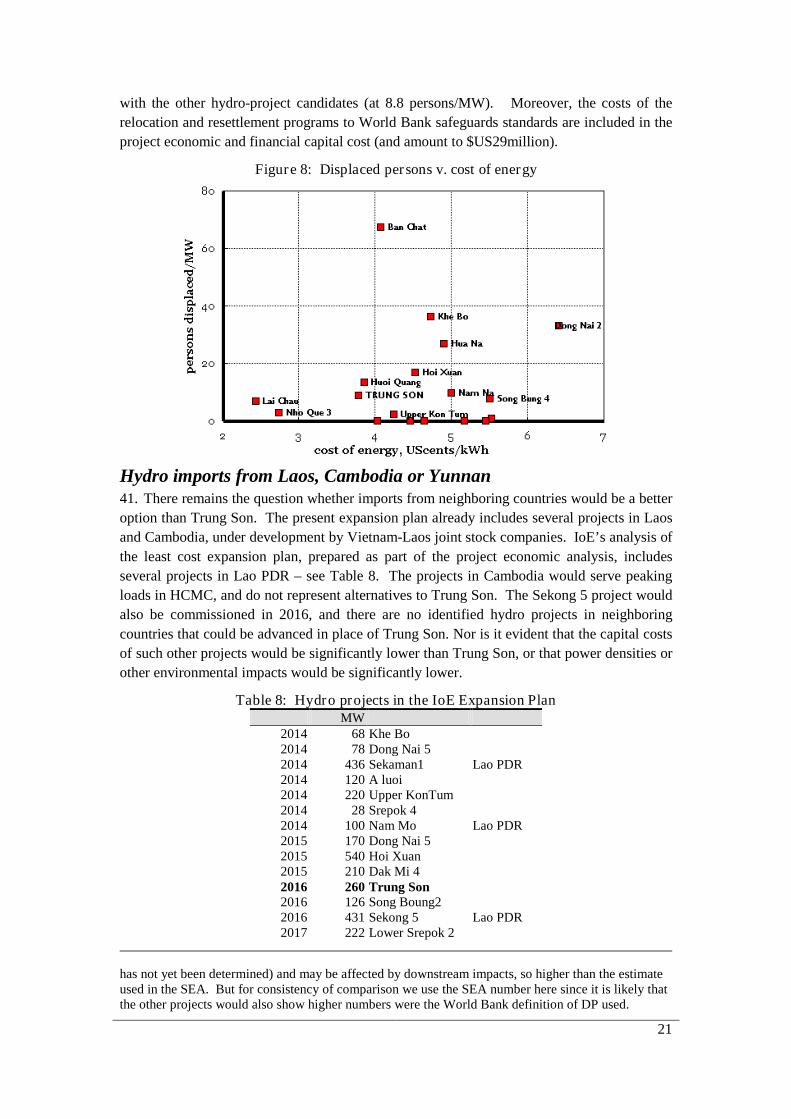
21
with the other hydro-project candidates (at 8.8 persons/MW). Moreover, the costs of the relocation and resettlement programs to World Bank safeguards standards are included in the project economic and financial capital cost (and amount to $US29million).
Figure 8: Displaced persons v. cost of energy
Hydro imports from Laos, Cambodia or Yunnan 41. There remains the question whether imports from neighboring countries would be a better option than Trung Son. The present expansion plan already includes several projects in Laos and Cambodia, under development by Vietnam-Laos joint stock companies. IoE’s analysis of the least cost expansion plan, prepared as part of the project economic analysis, includes several projects in Lao PDR – see Table 8. The projects in Cambodia would serve peaking loads in HCMC, and do not represent alternatives to Trung Son. The Sekong 5 project would also be commissioned in 2016, and there are no identified hydro projects in neighboring countries that could be advanced in place of Trung Son. Nor is it evident that the capital costs of such other projects would be significantly lower than Trung Son, or that power densities or other environmental impacts would be significantly lower.
Table 8: Hydro projects in the IoE Expansion Plan MW
2014 68 Khe Bo 2014 78 Dong Nai 5 2014 436 Sekaman1 Lao PDR 2014 120 A luoi 2014 220 Upper KonTum 2014 28 Srepok 4 2014 100 Nam Mo Lao PDR 2015 170 Dong Nai 5 2015 540 Hoi Xuan 2015 210 Dak Mi 4 2016 260 Trung Son 2016 126 Song Boung2 2016 431 Sekong 5 Lao PDR 2017 222 Lower Srepok 2
has not yet been determined) and may be affected by downstream impacts, so higher than the estimate used in the SEA. But for consistency of comparison we use the SEA number here since it is likely that the other projects would also show higher numbers were the World Bank definition of DP used.

22
2017 1200 Lai Chau 2017 210 Dak Mi 1 2017 375 Lower Se San 3 Cambodia 2017 207 Lower Se San 2 Cambodia 2018 85 Song Buong 5 2019 195 Hua Na 2019 53 Hieu River 2020 229 Nam Kong 1
42. In any event, Trung Son is in a relatively favorable location with respect to the greater Hanoi load centre, and any imports into Northern Vietnam would involve long transmission lines (at least 5 times longer than the Trung Son lines), and correspondingly greater environmental impacts associated with transmission lines in remote forested areas. From a GHG emission reduction standpoint, a kWh from Trung Son displaces more thermal generation than a kWh generated at these more distant locations in Vietnam’s neighbors.
Position in Least Cost Expansion Plan 43. The Trung Son investment decision is robust with respect to the demand forecast uncertainty. Modeling studies conducted by the Institute of Energy, (IoE - discussed further below) show that under the IoE load forecast, Trung Son is part of the least cost investment plan with a commissioning date of 2013; under the lower World Bank load forecast, the Trung Son commissioning date slips to 2016. Given a five-year construction time, and construction start in 2010, 2016 is in any event the earliest feasible implementation date. In short, whatever the load forecast assumptions, and even were efficiencies on both the supply and demand side more successful than envisaged (discussed in the first section of this report), Trung Son remains in the least cost plan.
44. In summary, among the hydro projects examined, Trung Son has one of the lowest costs of energy (only Lai Chau has a significantly lower cost/kWh). It is a relatively efficient project in terms of its demands on the natural and social environment: the area of reservoir required (power density) and the persons displaced per MW are small. There is a potentially significant loss of forest value, but this is more than offset by downstream flood control benefits.

23
5. Site and reservoir configuration alternatives
Master Plan for Hydropower Development of the Ma river 45. The 512 km long Ma Chu river rises in Lau Chau province. It then flows through Lao territory and back into Vietnam in Thanh Hoa province, finally discharging into the East Sea. The catchment area of the river is estimated at 28,400 sq km, of which 10,800 sq km, accounting for 38%, is in Laos territory. The Ma river has two main tributaries; the Chu and Buoi rivers.
46. A Hydropower Development Master Plan for the Ma river was first prepared in the 1960s, and updated in 1988, 1998 and 2003. Subsequent minor revisions were made to include several small hydropower projects downstream of the then named Ban Uon project, which, following the identification of a precise site in the much later detailed feasibility studies (described below), is now known as Trung Son.
47. The objective of the Master Plans was to identify the optimal cascade development of the river with a view:
• To exploit the hydro-energy potential of the river for power generation.
• To provide water supply for irrigation of hundred thousand ha of agricultural land along the river.
• To reduce the downstream flood impact.
• To provide water for industrial and residential uses, and
• To supplement water during dry season to reduce salinity and improve the downstream environment.
48. Requirements for flood control, water supply, and reduction of salinity were defined in the most recent Water Resources Development Master Plan for the Ma river prepared by the Ministry of Agriculture and Rural Development (MARD).
The 1998 Master Plan, and its 1999 update 49. Six hydropower projects were studied in 1998 in five hydropower cascade alternatives as presented in Table 9. The Trung Son project was included in all alternatives as it was considered to have the best potential. Alternative V was recommended because it had the smallest number of project affected persons, the highest hydroelectric potential, and the best financial and economic indicators.
Table 9: Hydropower cascade options for the Ma r iver (1998): HWL levels
Project Option I
Option II
Option III
Option IV
Option V
Pa Ma 455 455 455 Nam Thi 390 430 Huoi Tao 330 370 Ban Uon(Trung Son) 170 170 170 170 18031
Hoi Xuan
120 Cam Ngoc 62 31 In the 1998 Master Plan, the elevation of border with Laos was estimated at 180 meters based on a map of 1:50.000. The elevation was re-estimated in 2001 at 166.55 m
24
The Updated May 2001 Master Plan 50. The 2001 update covered just the Chu river, with the purpose of developing the Cua Dat project, and based on additional and updated data the on hydrology, geology, and people affected; the latest Water Resources Development Master Plan; and the pre-FS of Cua Dat project. The study recommended two projects for the Chu river including Huoi Na III (HWL of 240 m) and Cua Dat III (HWL of 119 m).
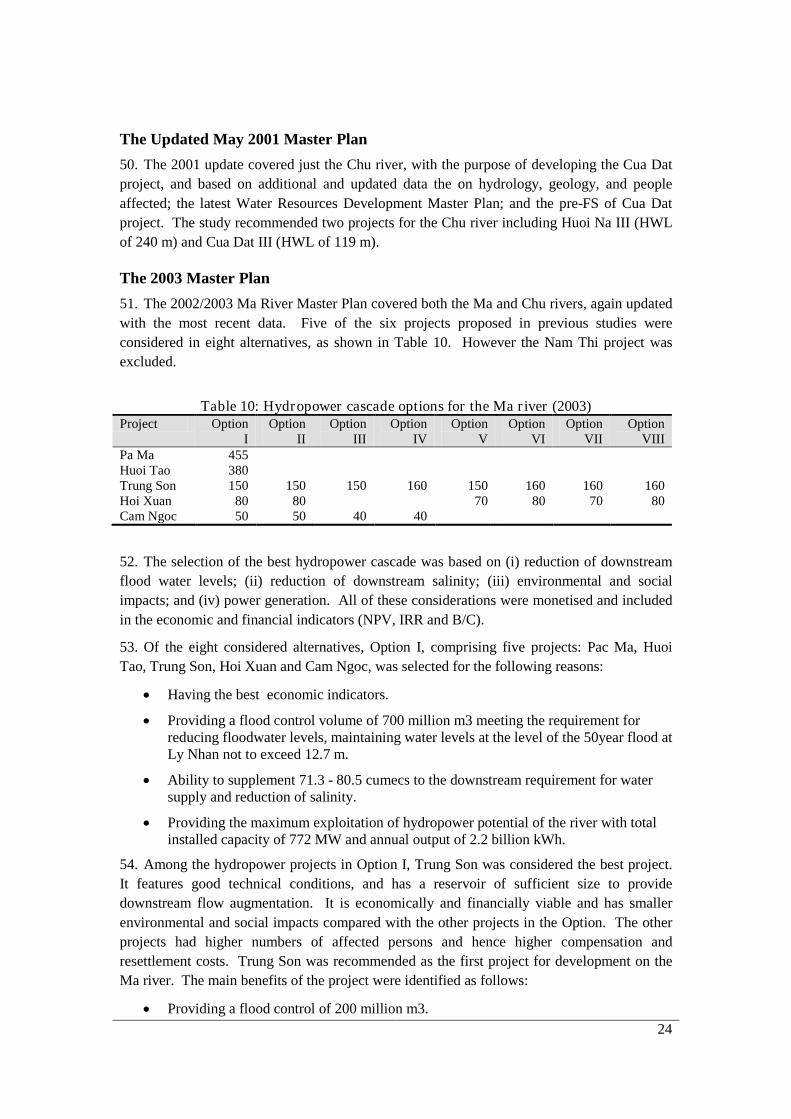
The 2003 Master Plan 51. The 2002/2003 Ma River Master Plan covered both the Ma and Chu rivers, again updated with the most recent data. Five of the six projects proposed in previous studies were considered in eight alternatives, as shown in Table 10. However the Nam Thi project was excluded.
Table 10: Hydropower cascade options for the Ma r iver (2003)
Project Option I
Option II
Option III
Option IV
Option V
Option VI
Option VII
Option VIII
Pa Ma 455 Huoi Tao 380 Trung Son 150 150 150 160 150 160 160 160 Hoi Xuan 80 80 70 80 70 80 Cam Ngoc 50 50 40 40
52. The selection of the best hydropower cascade was based on (i) reduction of downstream flood water levels; (ii) reduction of downstream salinity; (iii) environmental and social impacts; and (iv) power generation. All of these considerations were monetised and included in the economic and financial indicators (NPV, IRR and B/C).
53. Of the eight considered alternatives, Option I, comprising five projects: Pac Ma, Huoi Tao, Trung Son, Hoi Xuan and Cam Ngoc, was selected for the following reasons:
• Having the best economic indicators.
• Providing a flood control volume of 700 million m3 meeting the requirement for reducing floodwater levels, maintaining water levels at the level of the 50year flood at Ly Nhan not to exceed 12.7 m.
• Ability to supplement 71.3 - 80.5 cumecs to the downstream requirement for water supply and reduction of salinity.
• Providing the maximum exploitation of hydropower potential of the river with total installed capacity of 772 MW and annual output of 2.2 billion kWh.
54. Among the hydropower projects in Option I, Trung Son was considered the best project. It features good technical conditions, and has a reservoir of sufficient size to provide downstream flow augmentation. It is economically and financially viable and has smaller environmental and social impacts compared with the other projects in the Option. The other projects had higher numbers of affected persons and hence higher compensation and resettlement costs. Trung Son was recommended as the first project for development on the Ma river. The main benefits of the project were identified as follows:
• Providing a flood control of 200 million m3.
25
• Maintaining a salinity level at Ham Rong of less than 2.48‰.
• Providing 260 MW of power with annual output of 1.015 billion kWh.
• The project would require relocation of 1,338 HH (6,793 people) in the two provinces of Thanh Hoa and Son La.
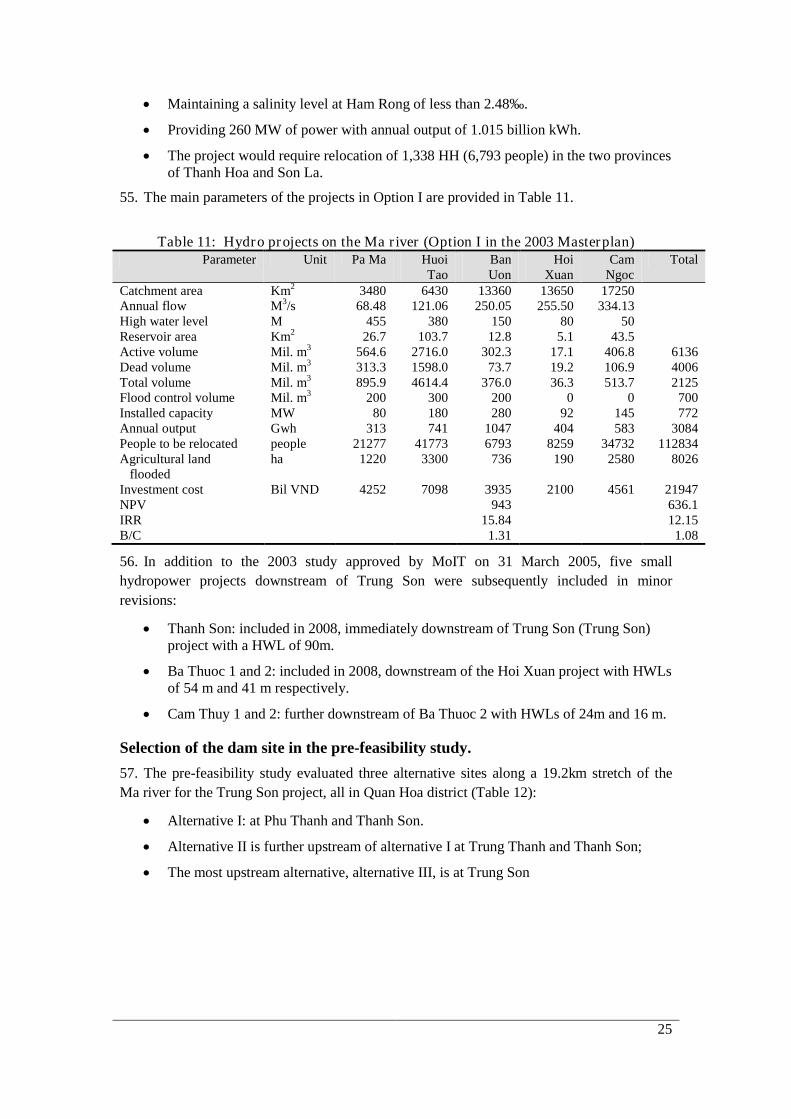
55. The main parameters of the projects in Option I are provided in Table 11.
Table 11: Hydro projects on the Ma r iver (Option I in the 2003 Masterplan)
Parameter Unit Pa Ma Huoi Tao
Ban Uon
Hoi Xuan
Cam Ngoc
Total
Catchment area Km 3480 2 6430 13360 13650 17250 Annual flow M3 68.48 /s 121.06 250.05 255.50 334.13 High water level M 455 380 150 80 50 Reservoir area Km 26.7 2 103.7 12.8 5.1 43.5 Active volume Mil. m 564.6 3 2716.0 302.3 17.1 406.8 6136 Dead volume Mil. m 313.3 3 1598.0 73.7 19.2 106.9 4006 Total volume Mil. m 895.9 3 4614.4 376.0 36.3 513.7 2125 Flood control volume Mil. m 200 3 300 200 0 0 700 Installed capacity MW 80 180 280 92 145 772 Annual output Gwh 313 741 1047 404 583 3084 People to be relocated people 21277 41773 6793 8259 34732 112834 Agricultural land flooded
ha 1220 3300 736 190 2580 8026
Investment cost Bil VND 4252 7098 3935 2100 4561 21947 NPV 943 636.1 IRR 15.84 12.15 B/C 1.31 1.08
56. In addition to the 2003 study approved by MoIT on 31 March 2005, five small hydropower projects downstream of Trung Son were subsequently included in minor revisions:
• Thanh Son: included in 2008, immediately downstream of Trung Son (Trung Son) project with a HWL of 90m.
• Ba Thuoc 1 and 2: included in 2008, downstream of the Hoi Xuan project with HWLs of 54 m and 41 m respectively.
• Cam Thuy 1 and 2: further downstream of Ba Thuoc 2 with HWLs of 24m and 16 m.
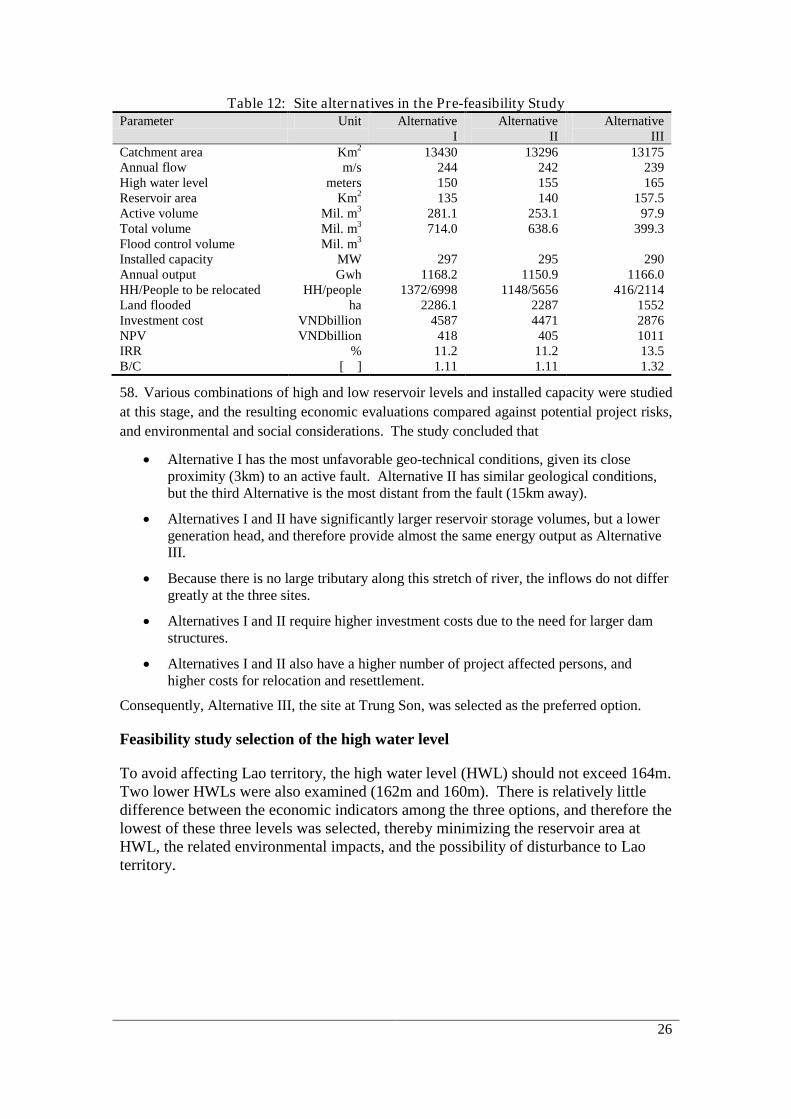
Selection of the dam site in the pre-feasibility study. 57. The pre-feasibility study evaluated three alternative sites along a 19.2km stretch of the Ma river for the Trung Son project, all in Quan Hoa district (Table 12):
• Alternative I: at Phu Thanh and Thanh Son.
• Alternative II is further upstream of alternative I at Trung Thanh and Thanh Son;
• The most upstream alternative, alternative III, is at Trung Son
26
Table 12: Site alternatives in the Pre-feasibility Study Parameter Unit Alternative
I Alternative
II Alternative
III Catchment area Km 13430 2 13296 13175 Annual flow m/s 244 242 239 High water level meters 150 155 165 Reservoir area Km 135 2 140 157.5 Active volume Mil. m 281.1 3 253.1 97.9 Total volume Mil. m 714.0 3 638.6 399.3 Flood control volume Mil. m 3 Installed capacity MW 297 295 290 Annual output Gwh 1168.2 1150.9 1166.0 HH/People to be relocated HH/people 1372/6998 1148/5656 416/2114 Land flooded ha 2286.1 2287 1552 Investment cost VNDbillion 4587 4471 2876 NPV VNDbillion 418 405 1011 IRR % 11.2 11.2 13.5 B/C [ ] 1.11 1.11 1.32
58. Various combinations of high and low reservoir levels and installed capacity were studied at this stage, and the resulting economic evaluations compared against potential project risks, and environmental and social considerations. The study concluded that
• Alternative I has the most unfavorable geo-technical conditions, given its close proximity (3km) to an active fault. Alternative II has similar geological conditions, but the third Alternative is the most distant from the fault (15km away).
• Alternatives I and II have significantly larger reservoir storage volumes, but a lower generation head, and therefore provide almost the same energy output as Alternative III.
• Because there is no large tributary along this stretch of river, the inflows do not differ greatly at the three sites.
• Alternatives I and II require higher investment costs due to the need for larger dam structures.
• Alternatives I and II also have a higher number of project affected persons, and higher costs for relocation and resettlement.
Consequently, Alternative III, the site at Trung Son, was selected as the preferred option.
Feasibility study selection of the high water level
To avoid affecting Lao territory, the high water level (HWL) should not exceed 164m. Two lower HWLs were also examined (162m and 160m). There is relatively little difference between the economic indicators among the three options, and therefore the lowest of these three levels was selected, thereby minimizing the reservoir area at HWL, the related environmental impacts, and the possibility of disturbance to Lao territory.

27
Annex 1: The IoE Power System Modeling Studies 1. The IoE has conducted a least cost planning study to assess Trung Son’s role in the least cost plan. This study had the following objectives:
• to determine whether Trung Son is in the least cost plan; and, if so, when is its optimal commissioning date.
• to examine the robustness of the Trung Son investment decision to the various uncertainties, notably regarding the demand forecast.
2. The details of this study are provided by IoE in its report, 32 to which the reader is referred for more information about assumptions and results, and for a detailed description of the models used and their limitations.33
3. When the model is run with Trung Son as a candidate, the optimal timing of Trung Son is determined: the model would be free not to build Trung Son at all if more economic alternatives were available. In fact, in all cases examined, Trung Son is built. The economic analysis report shows that the switching value of the natural gas price would have to be 1.5$/mmBTU (corresponding to a world oil price of 15-20$/bbl) for CCGT to be a more cost effective option to meet the equivalent energy and capacity.
For each of the scenarios, the model is run with and without Trung Son.
34
4. In the without Trung Son counterfactual, the model is allowed to adjust the capacity expansion plan. The adjustments if Trung Son is not built may take some or all of the following forms
• Adjustment in the timing of the remaining hydropower projects in the expansion sequence.
• Bringing forward the commissioning dates of thermal units (to replace the capacity not provided by Trung Son).
• Adjusting the dispatch of thermal power plants to replace the energy not provided by Trung Son.
5. The optimal combination of these adjustments then defines the incremental costs if Trung Son is not built, and defines the environmental benefits due to the avoided GHG and local air pollutant emissions.
Results 6. The main results of the modeling results are as follows:
• In all cases examined, Trung Son appears in the least cost expansion plan.
• In the high (IoE) load forecast, Trung Son is built at the earliest allowable start-up date, which is set at 2013. It is of course very unlikely that this could be achievable in practice, given a 5-year total construction time. However, an early allowable start-
32 Institute of Energy: Review of Power System Expansion Planning in Vietnam, Report to the World Bank, June 2009. 33 The power planning process in Vietnam is also reviewed in Mario Pereira, Review of Power System Expansion Planning in Vietnam, report to the World Bank, June 2008; and in Duncan Wilson, Review and Assessment Report for the Development of Least-Cost Planning and Implementation Procedures for the Vietnam Competitive Generation Market, report to Electricity Regulatory Authority of Vietnam, August 2008 34 Economic Analysis Background Report, Section 7.

28
up date was set in the model to limit the impact of exogenous assumptions. Under the low (World Bank) demand growth forecast the startup date slips to 2016.
• Trung Son’s impact on the capacity expansion plan is to displace a 300MW coal unit in the North that would otherwise enter the optimal plan in 2016.
• The 1200 MW Lai Chau hydro project – based just on modeling expansion plan criteria, always appears later than the Trung Son project (and in the low load forecast, enters in 2017, one year later). However, in reality, its timing would be dictated by other constraints (since being part of a cascade immediately upstream of Son La, its construction needs to be completed before full flooding of the Son La reservoir).
• The timing of Trung Son is unaffected by international fuel prices or a CO2 tax. A CO2 tax of 15$/ton has minimal impacts on the expansion plan, though load factors at CCGTs are somewhat higher (and lower at coal plants): only at a tax of 60$/ton CO2 does one observe significant expansion plan impacts (at this level nuclear power may become economic, depending on assumptions on capital cost).