the truth about your web app's performance
TRANSCRIPT
The Truth About YourWeb App’s PerformanceJohn Riviello
@JohnRiv
Distinguished Engineer, Comcast Interactive Media
Web Conference at Penn State – June 22, 2015

John Riviello – The Truth Behind Your Web App’s Performance2
Frontend Performance Data
1. What do existing tools provide?
2. What data do you care about?
3. How do you gather that data?
4. What do you do with the data?
John Riviello – The Truth Behind Your Web App’s Performance3

1. Existing Tools2. The Data You Care About3. Gathering the Data4. Analyzing the Data
Frontend Performance Data – Existing Tools
WebPagetest.org
John Riviello – The Truth Behind Your Web App’s Performance5


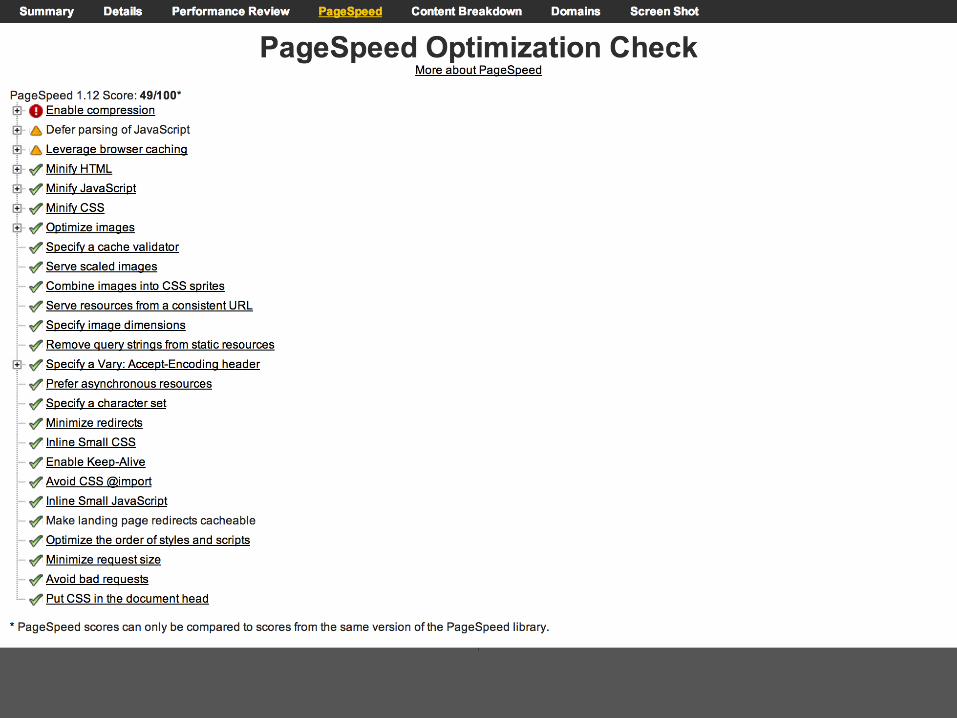

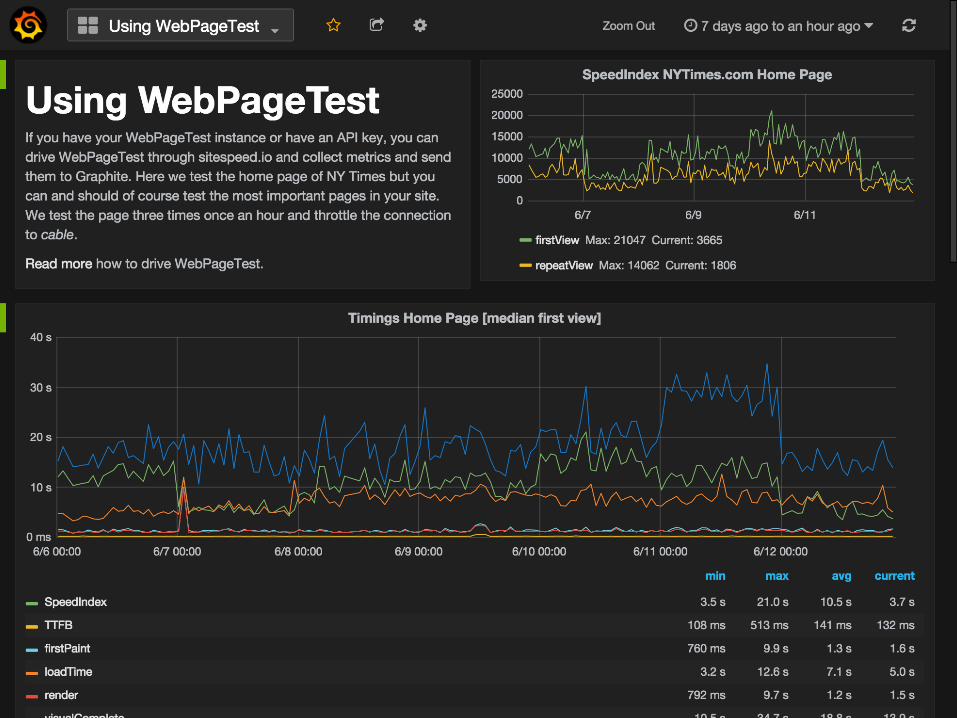
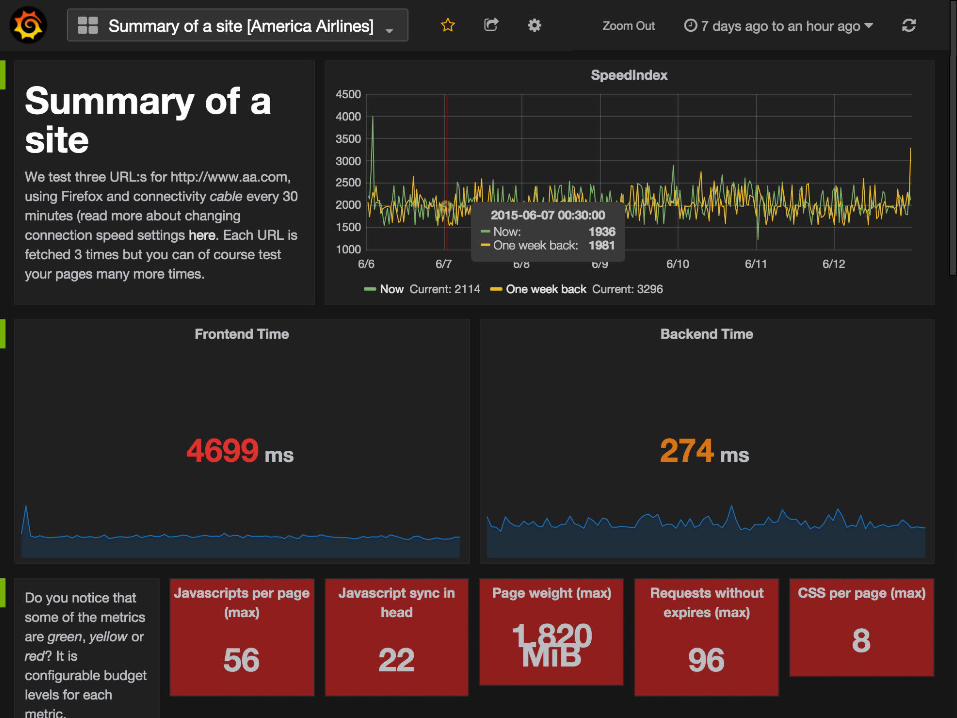
Frontend Performance Data – Existing Tools
http://www.sitespeed.io/
John Riviello – The Truth Behind Your Web App’s Performance11
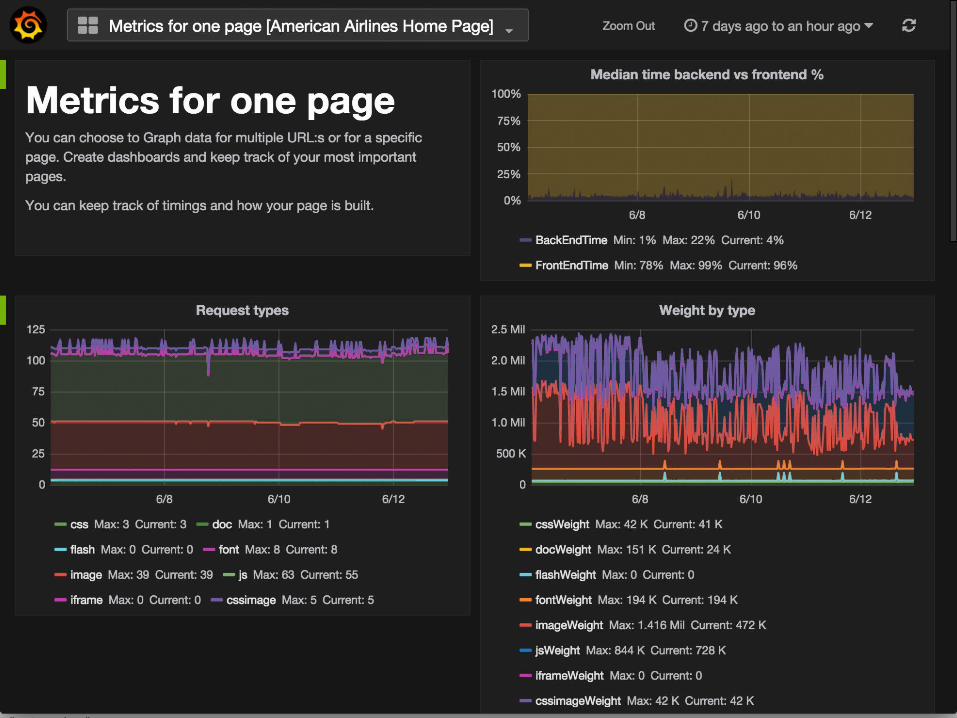
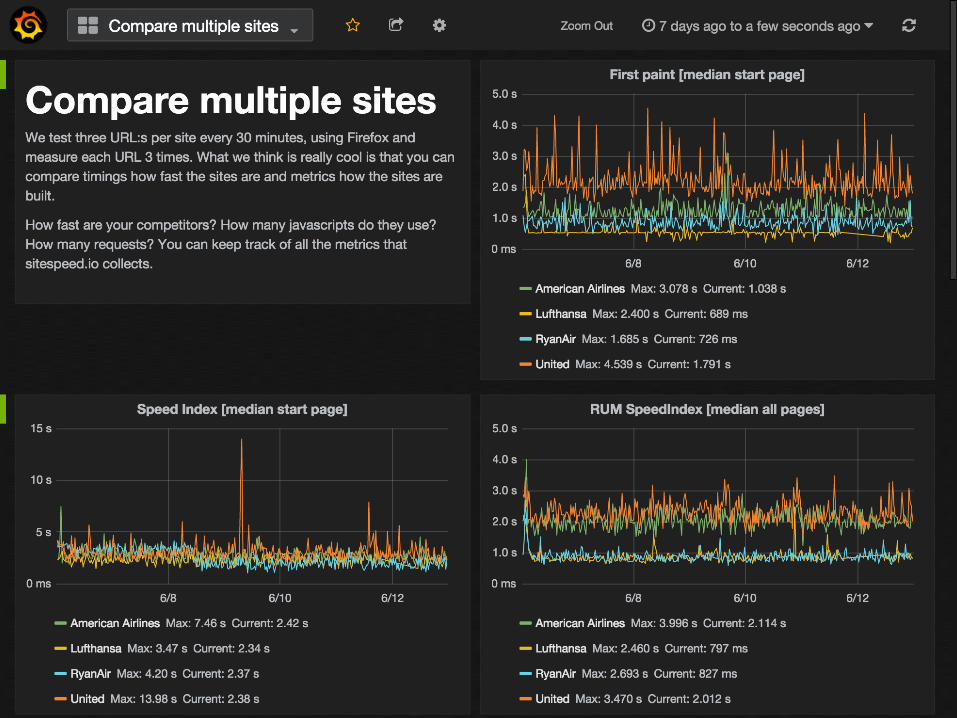
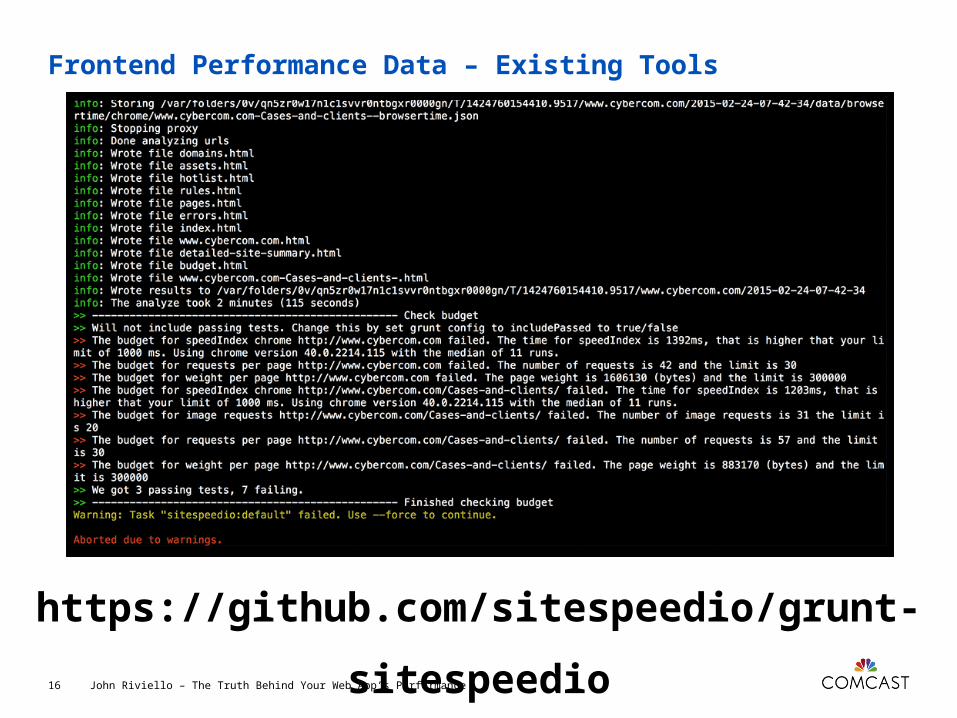
Frontend Performance Data – Existing Tools
https://github.com/sitespeedio/grunt-sitespeedio
John Riviello – The Truth Behind Your Web App’s Performance16
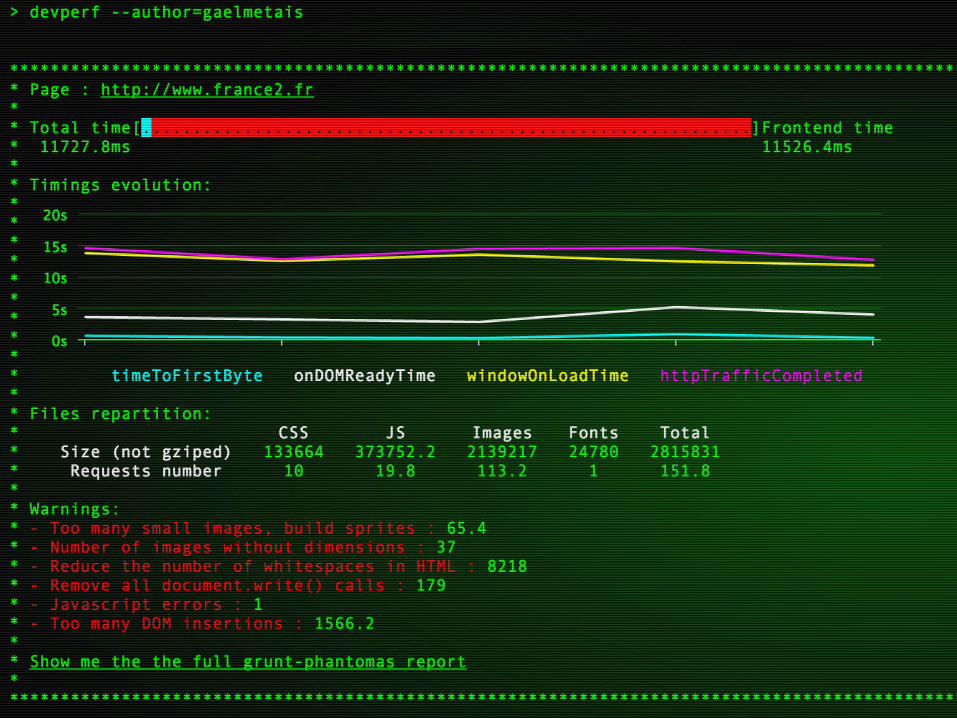
Frontend Performance Data – Existing Tools
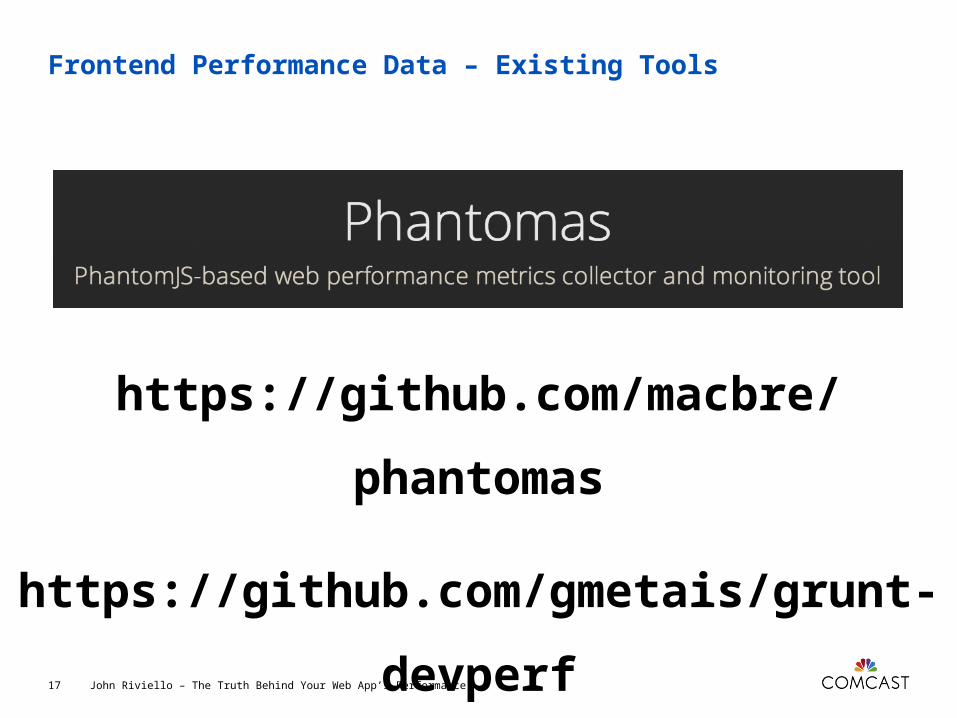
https://github.com/macbre/phantomas
https://github.com/gmetais/grunt-devperf
John Riviello – The Truth Behind Your Web App’s Performance17

http://yellowlab.tools/
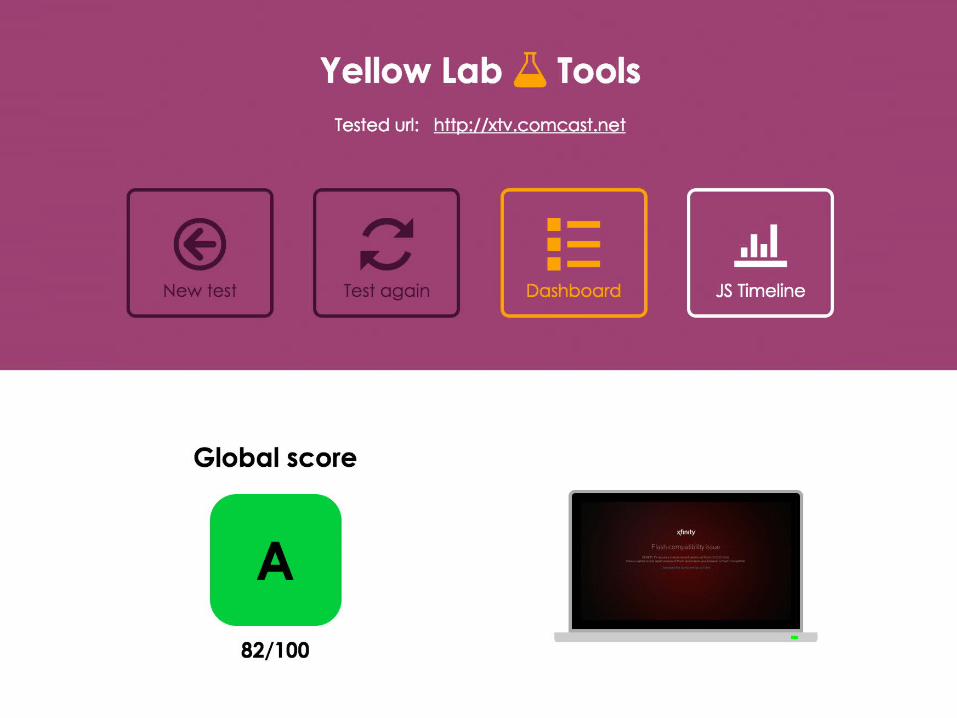

Frontend Performance Data – Existing Tools
https://github.com/gmetais/grunt-yellowlabtools
John Riviello – The Truth Behind Your Web App’s Performance21
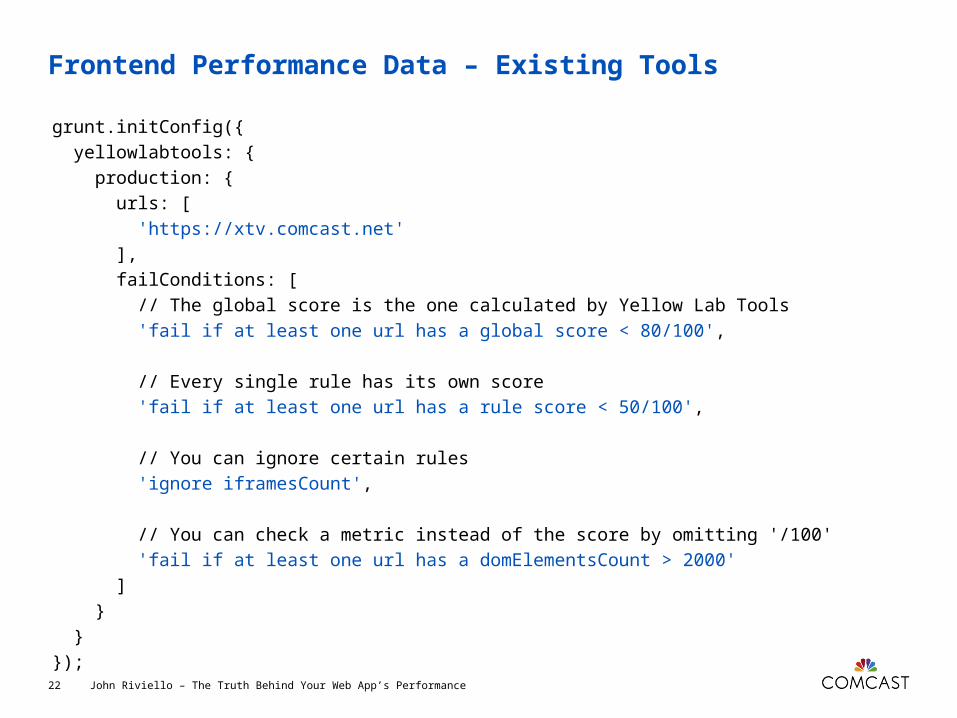
Frontend Performance Data – Existing Tools
John Riviello – The Truth Behind Your Web App’s Performance22
grunt.initConfig({ yellowlabtools: { production: { urls: [ 'https://xtv.comcast.net' ], failConditions: [ // The global score is the one calculated by Yellow Lab Tools 'fail if at least one url has a global score < 80/100',
// Every single rule has its own score 'fail if at least one url has a rule score < 50/100',
// You can ignore certain rules 'ignore iframesCount',
// You can check a metric instead of the score by omitting '/100' 'fail if at least one url has a domElementsCount > 2000' ] } }});
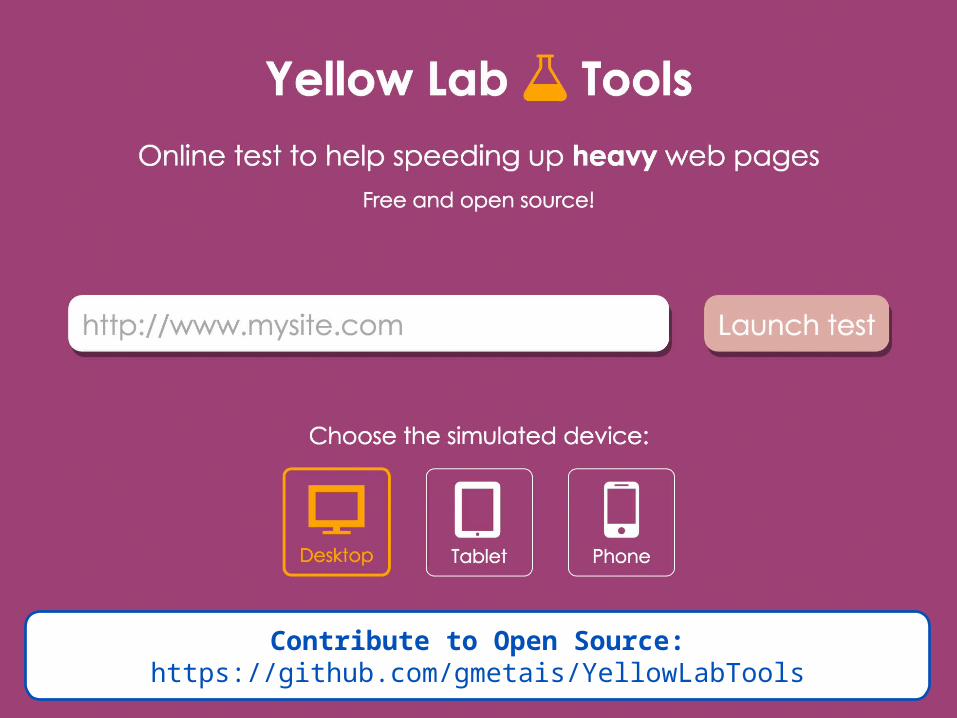
Contribute to Open Source:https://github.com/gmetais/YellowLabTools
"RUM" by Tom B is licensed under CC BY-NC-SA 2.0

RealUserMonitoring
"yes, that's a rum filled coconut." by Brandon King is licensed under CC BY-NC 2.0 / Color adjusted from original

Frontend Performance Data – Existing Tools
John Riviello – The Truth Behind Your Web App’s Performance26
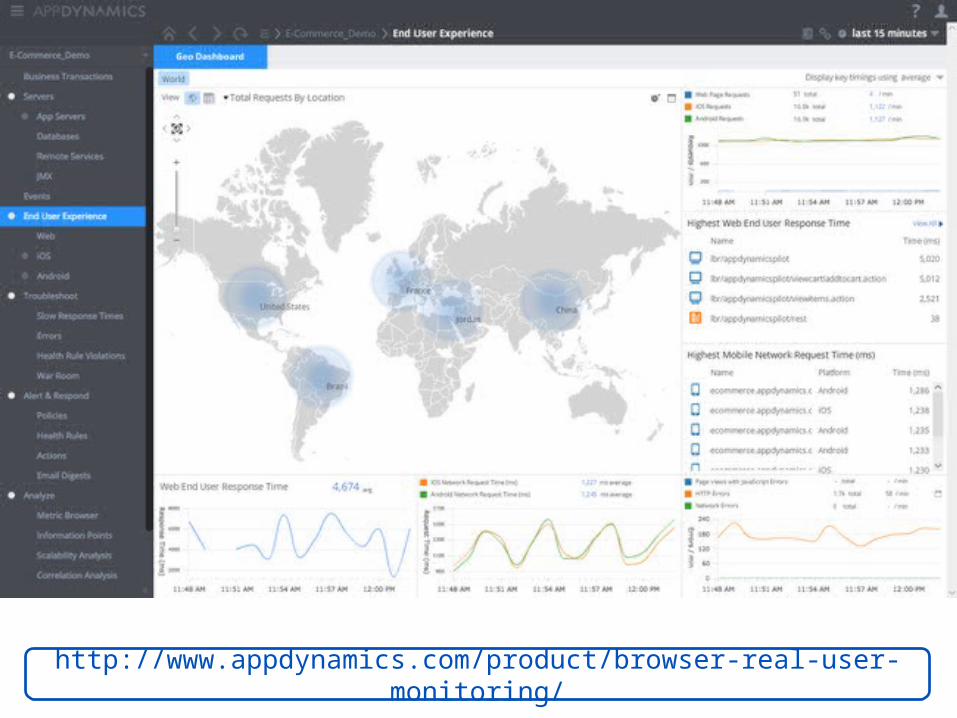
http://www.appdynamics.com/product/browser-real-user-monitoring/
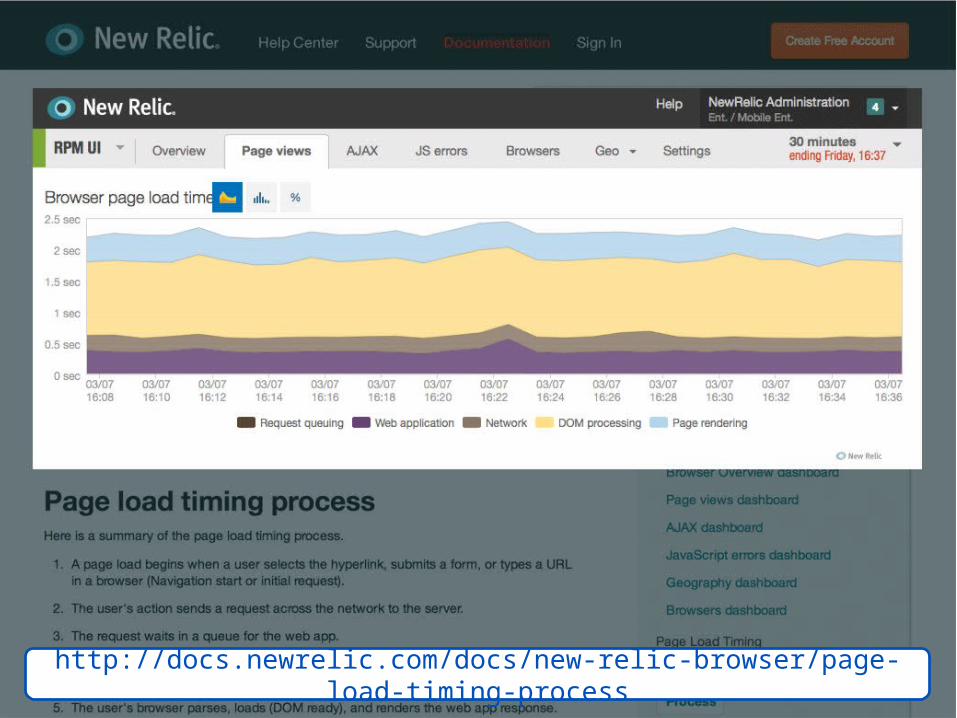
http://docs.newrelic.com/docs/new-relic-browser/page-load-timing-process
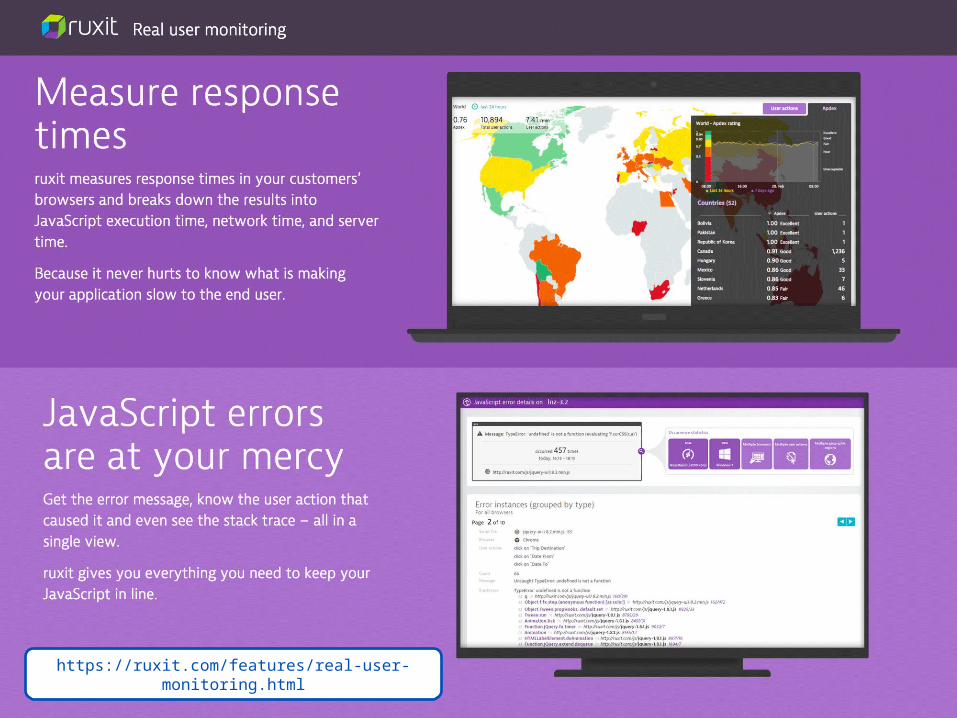
https://ruxit.com/features/real-user-monitoring.html
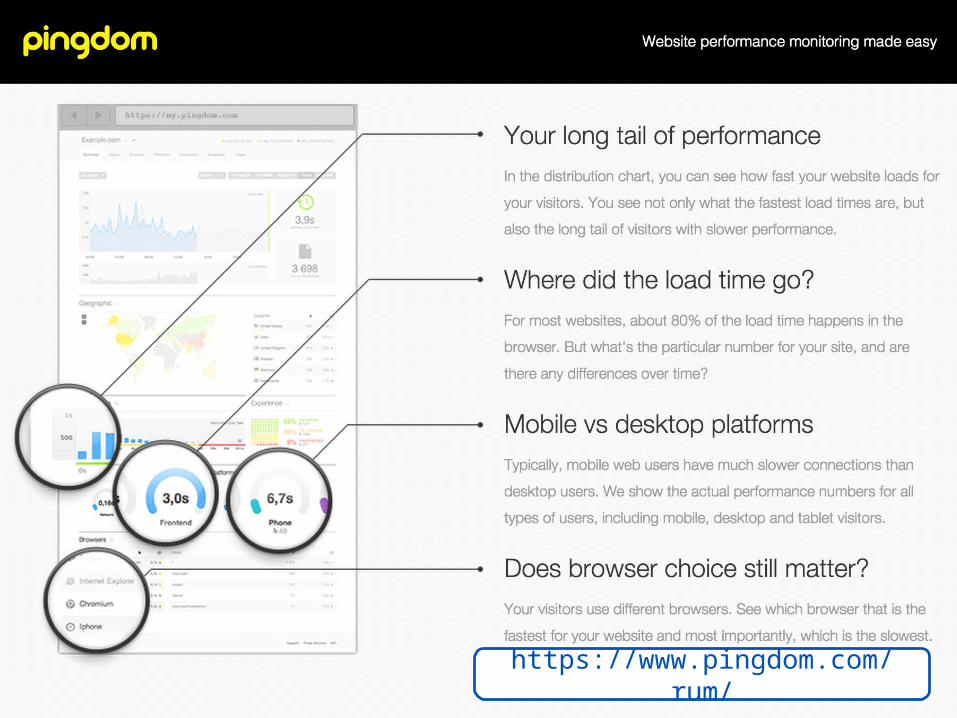
https://www.pingdom.com/rum/
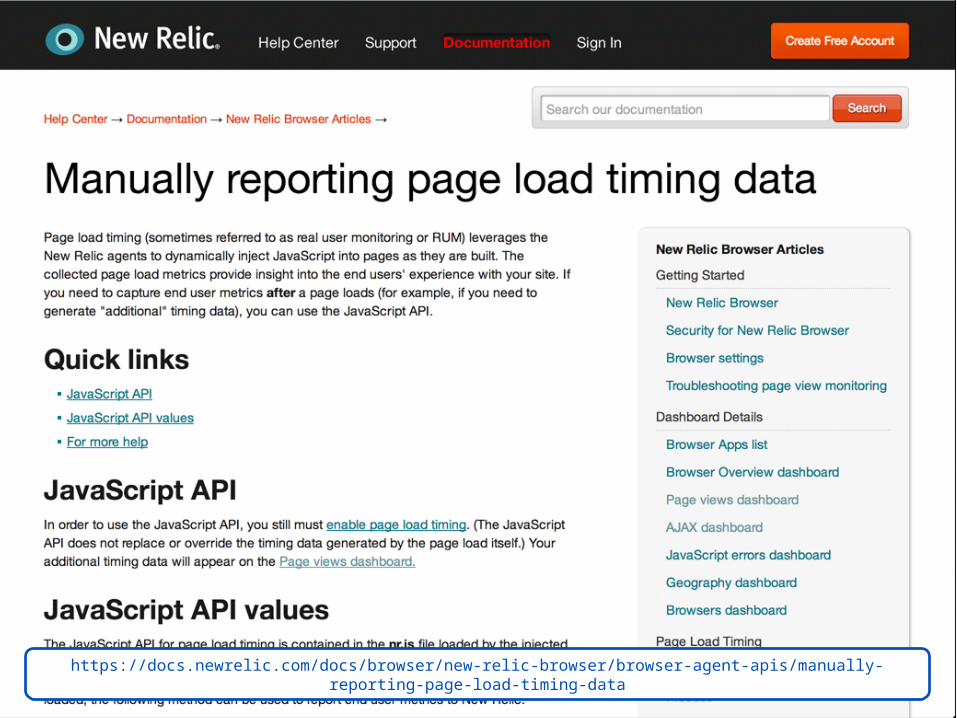
https://docs.newrelic.com/docs/browser/new-relic-browser/browser-agent-apis/manually-reporting-page-load-timing-data
1. Existing Tools2. The Data You Care About3. Gathering the Data4. Analyzing the Data
RealUserMonitoring
"yes, that's a rum filled coconut." by Brandon King is licensed under CC BY-NC 2.0 / Color adjusted from original
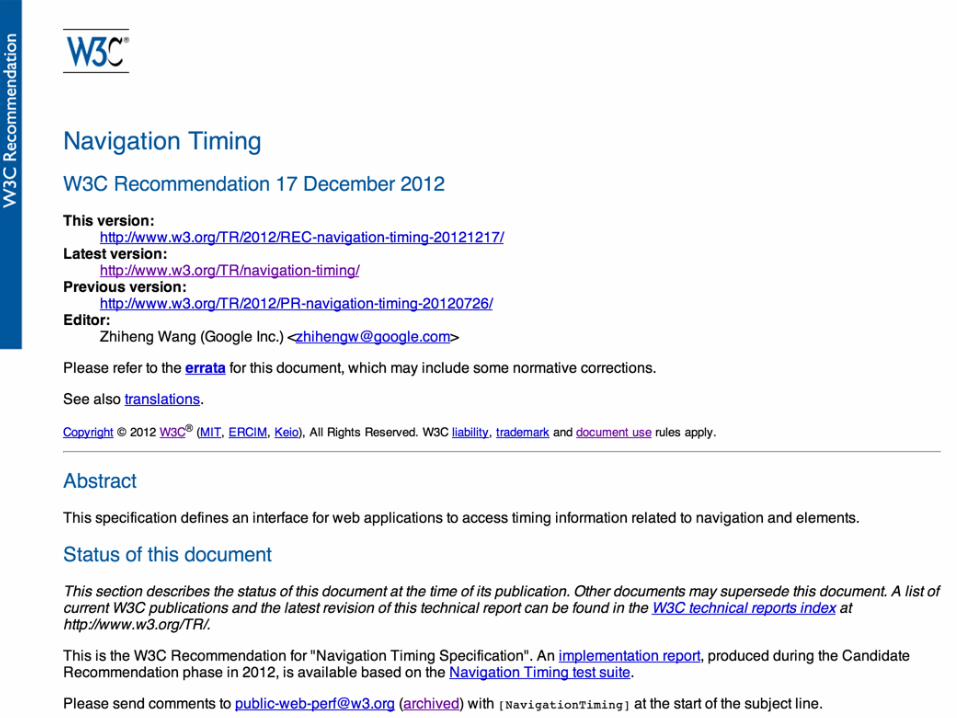
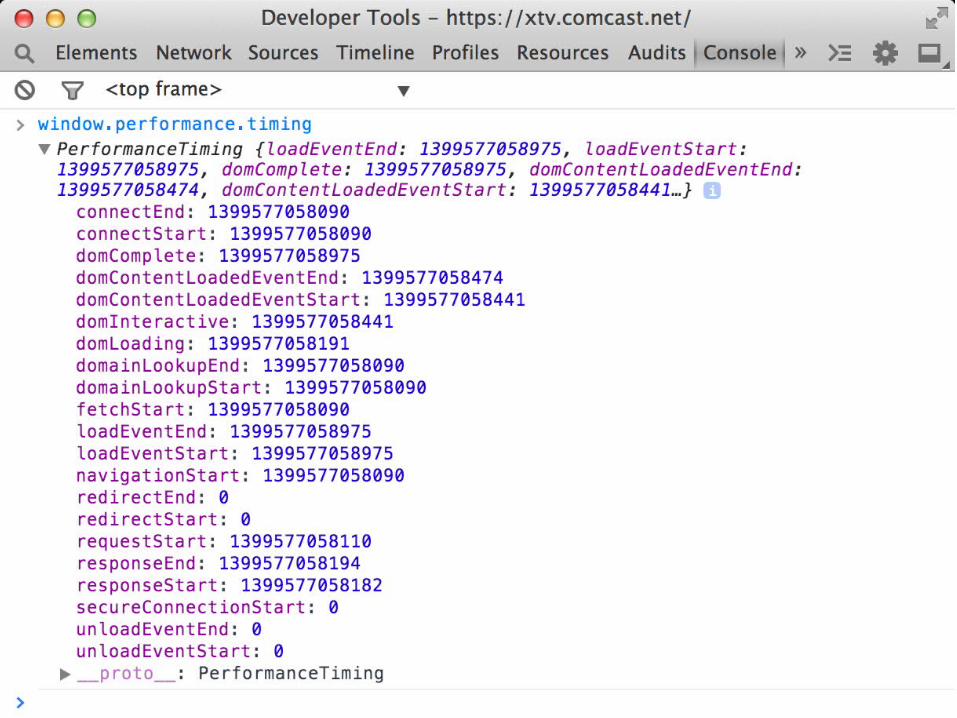
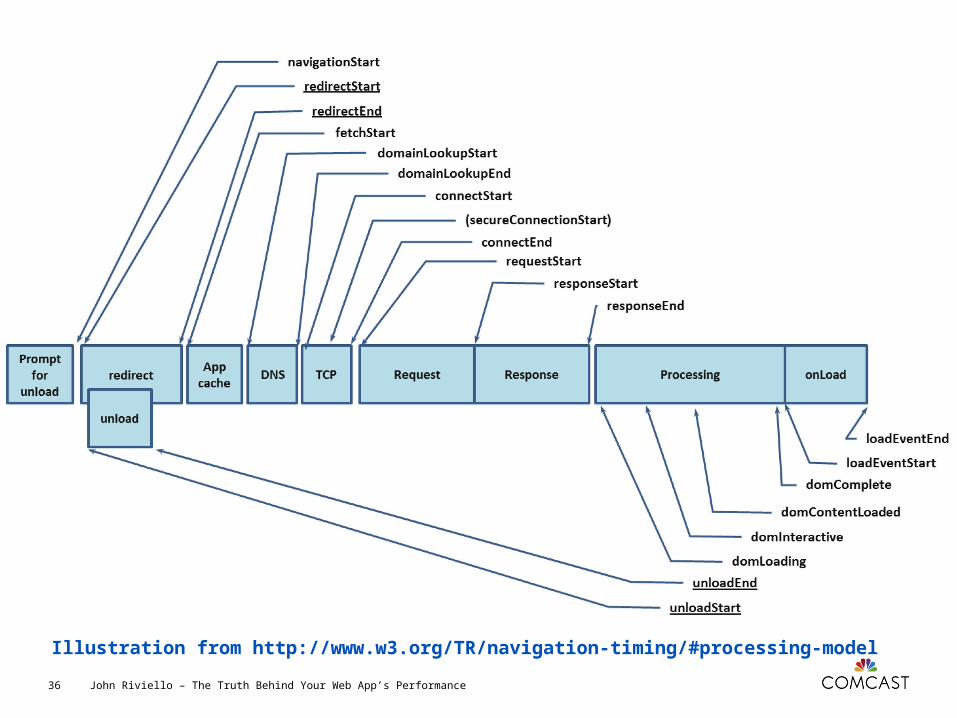
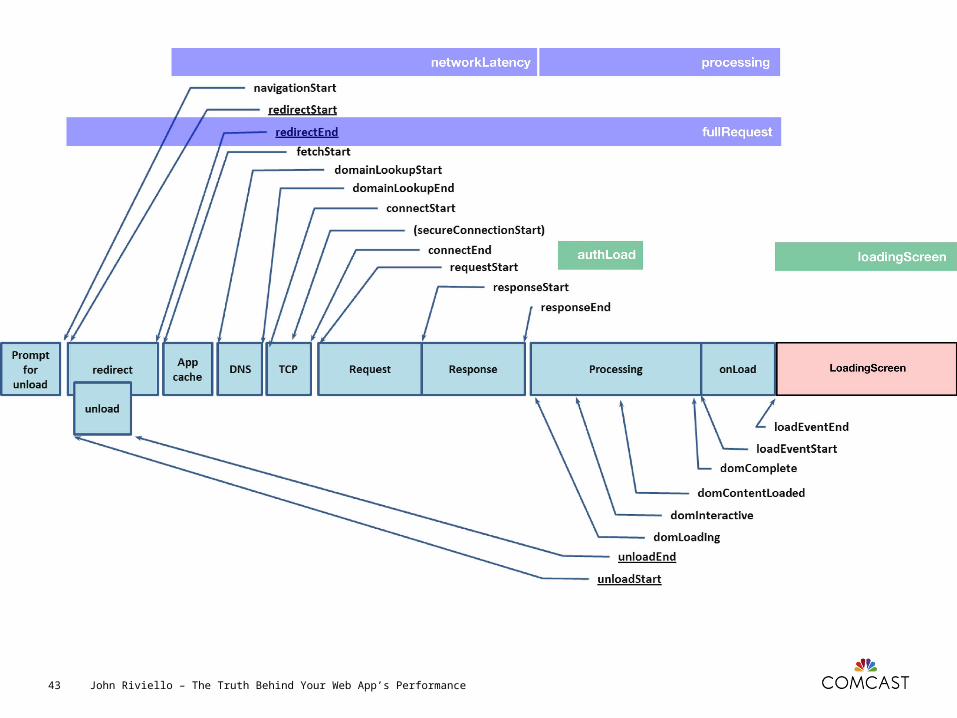
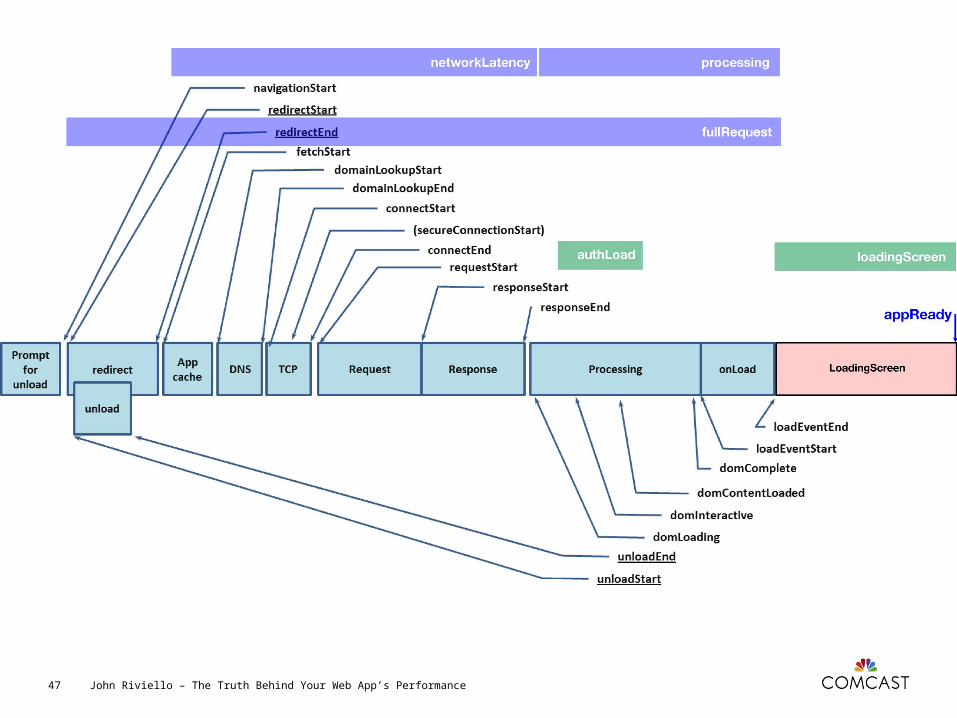
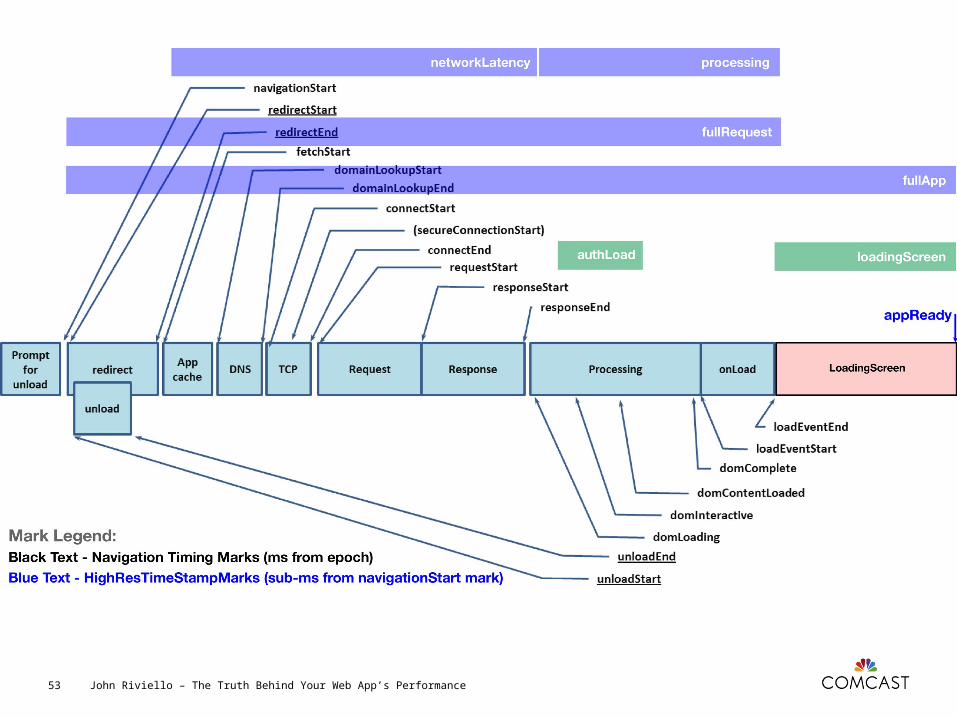
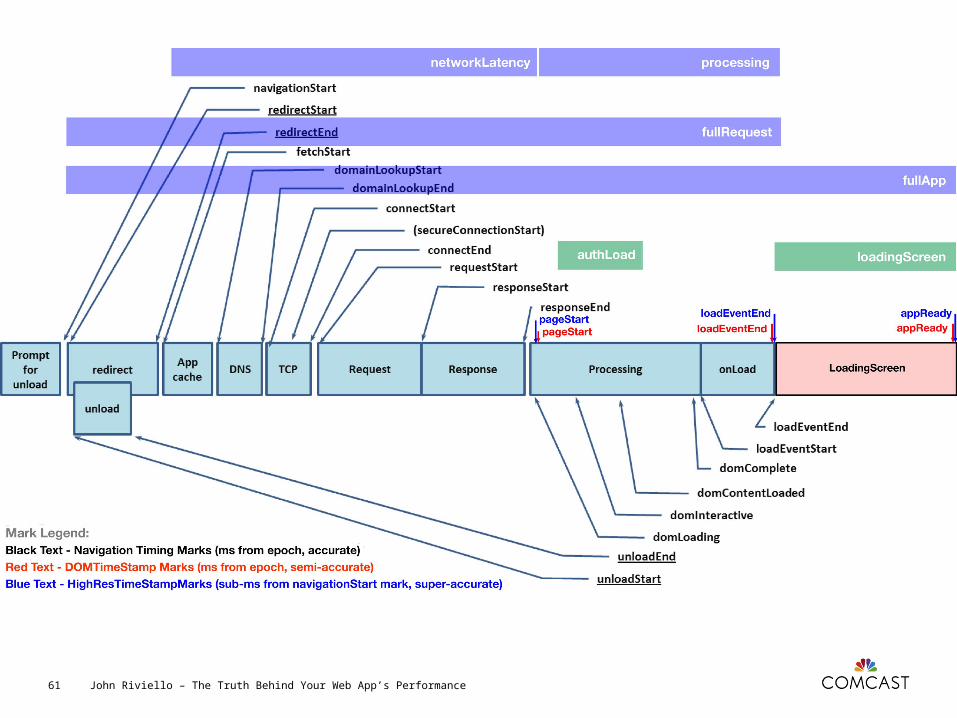
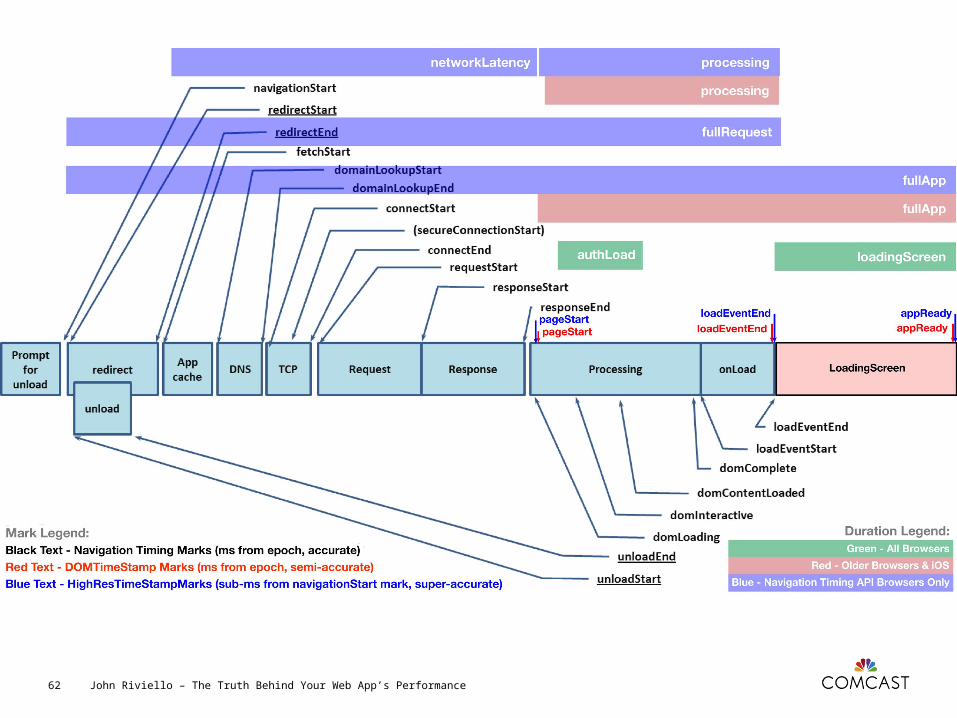
Illustration from http://www.w3.org/TR/navigation-timing/#processing-model
John Riviello – The Truth Behind Your Web App’s Performance36
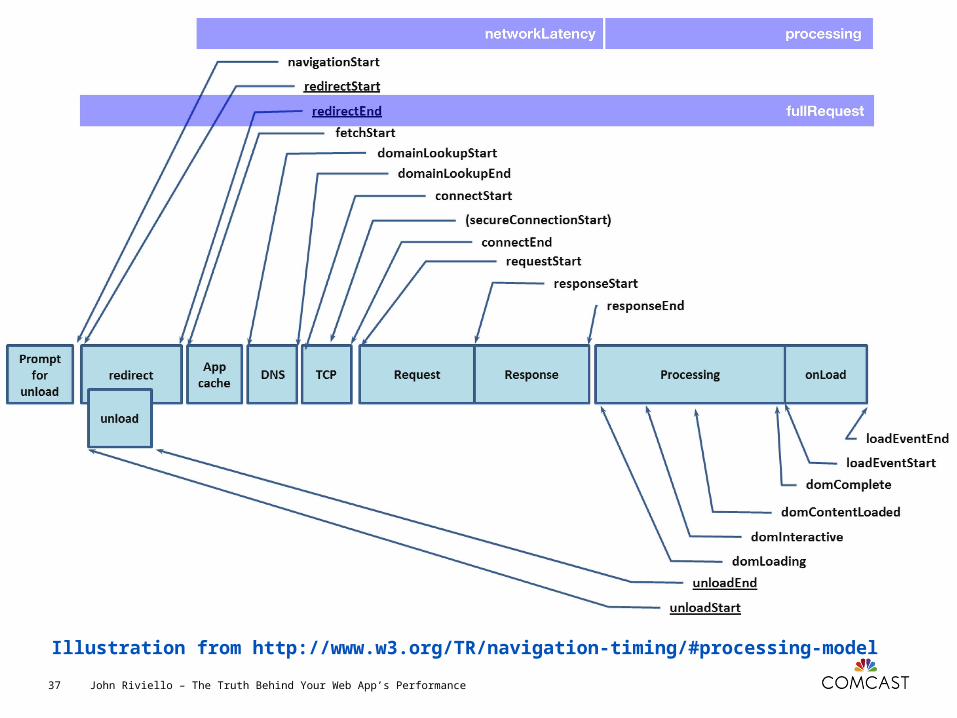
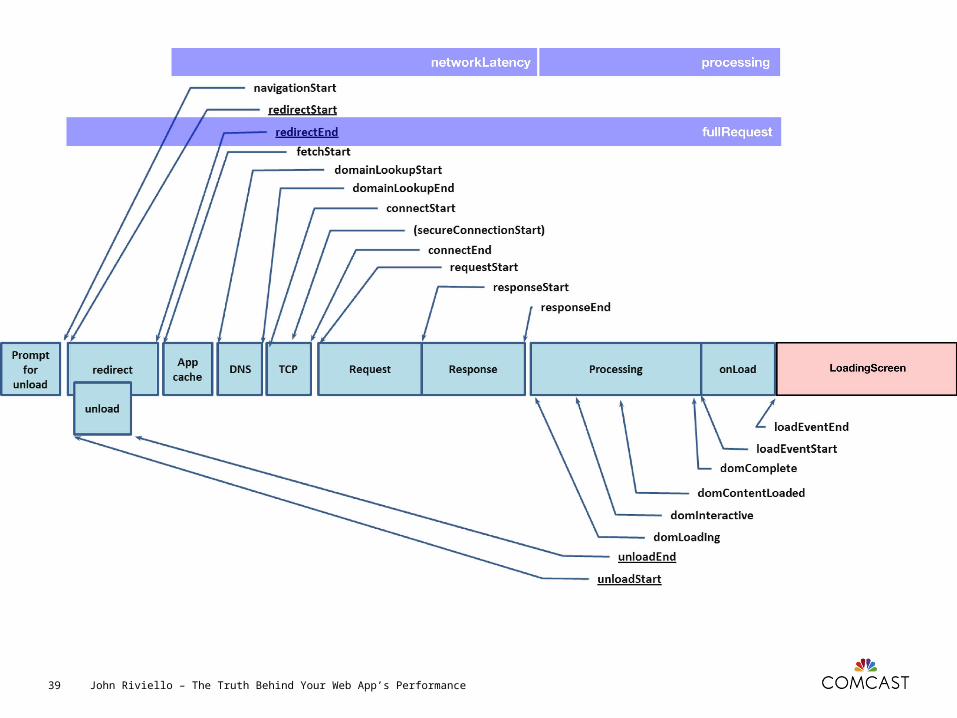
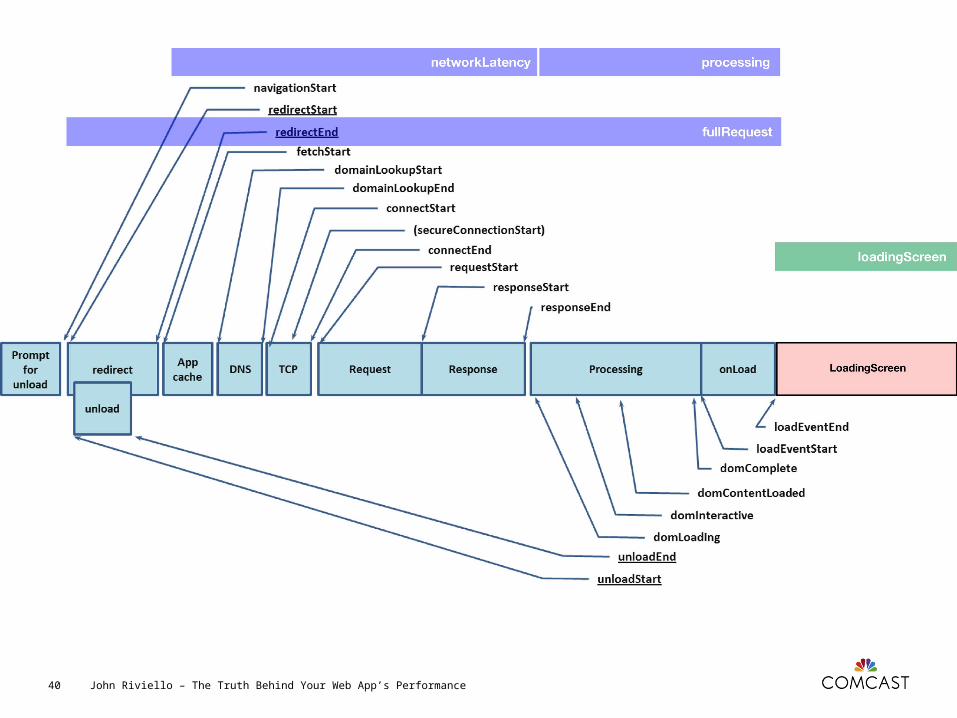
Illustration from http://www.w3.org/TR/navigation-timing/#processing-model
John Riviello – The Truth Behind Your Web App’s Performance37

John Riviello – The Truth Behind Your Web App’s Performance39
John Riviello – The Truth Behind Your Web App’s Performance40
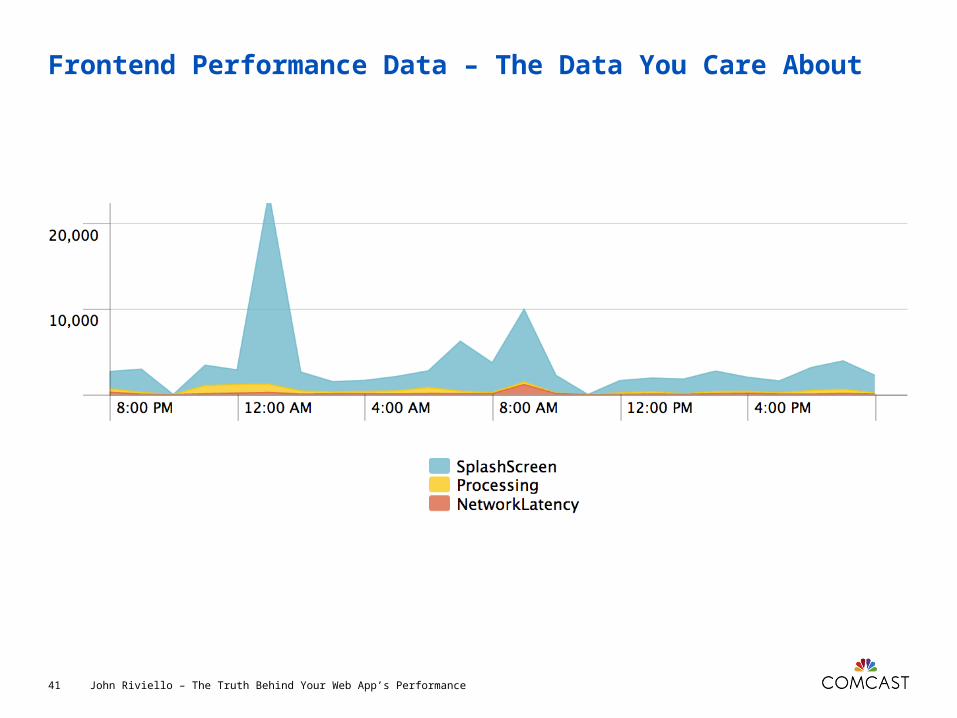
Frontend Performance Data – The Data You Care About
John Riviello – The Truth Behind Your Web App’s Performance41
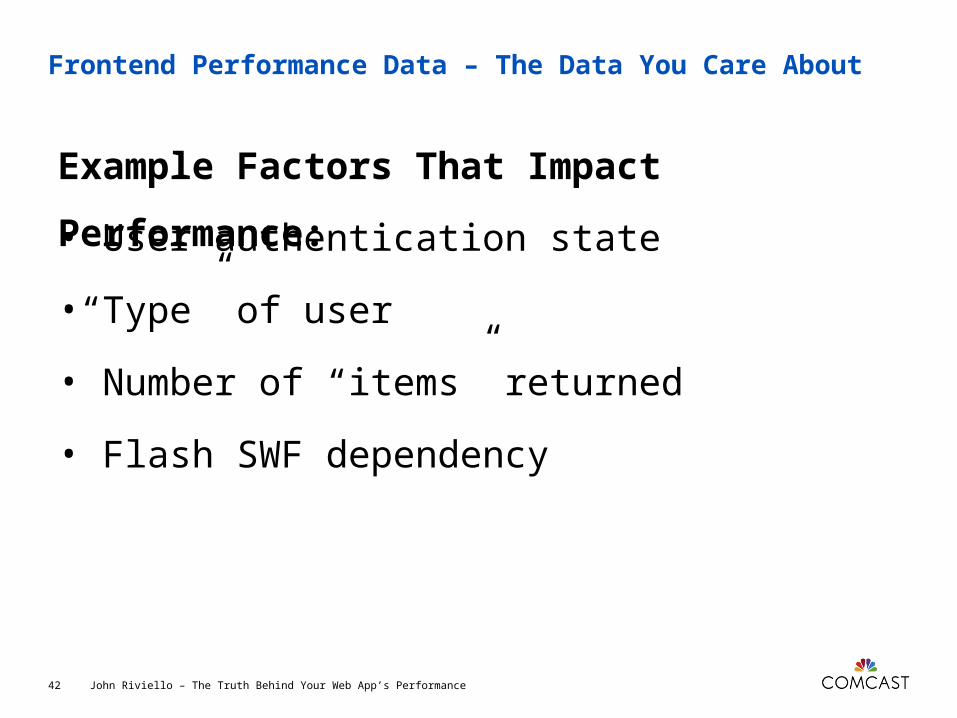
Frontend Performance Data – The Data You Care About
Example Factors That Impact Performance:
John Riviello – The Truth Behind Your Web App’s Performance42
• User authentication state
• “Type” of user
• Number of “items” returned
• Flash SWF dependency
John Riviello – The Truth Behind Your Web App’s Performance43
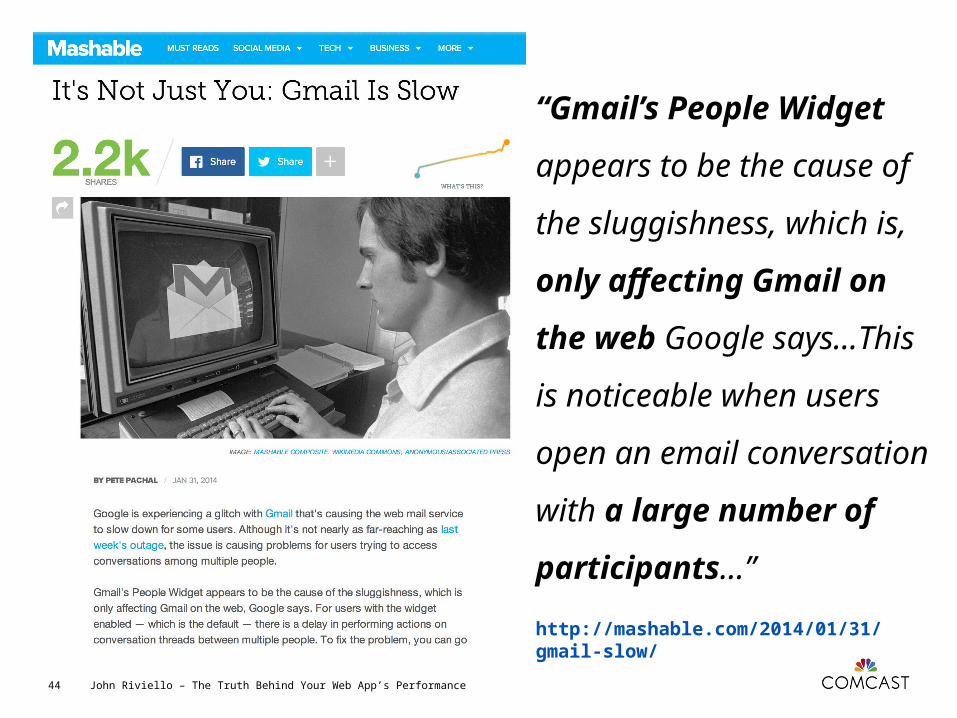
http://mashable.com/2014/01/31/gmail-slow/
John Riviello – The Truth Behind Your Web App’s Performance44
“Gmail’s People
Widget appears to be
the cause of the
sluggishness, which is,
only affecting Gmail
on the web Google
says…This is noticeable
when users open an
email conversation with
a large number of
participants…”
Consider what other unique factors in your app may impact performance
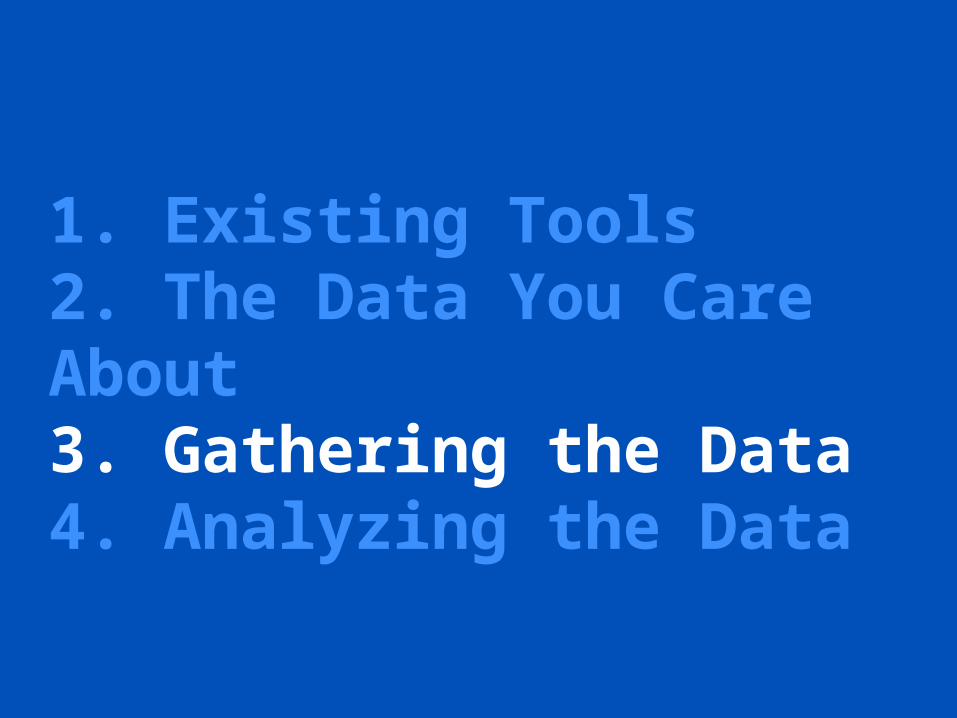
1. Existing Tools2. The Data You Care About3. Gathering the Data4. Analyzing the Data
John Riviello – The Truth Behind Your Web App’s Performance47
Frontend Performance Data – Gathering the Data
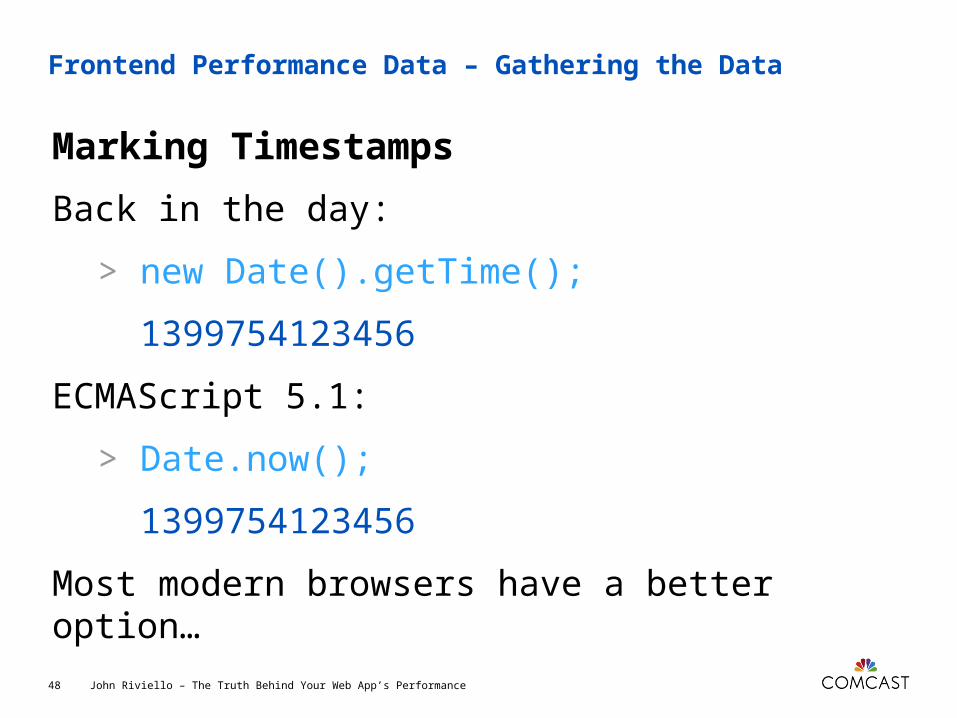
Marking Timestamps
John Riviello – The Truth Behind Your Web App’s Performance48
Back in the day:
> new Date().getTime();
1399754123456
ECMAScript 5.1:
> Date.now();
1399754123456
Most modern browsers have a better option…
Frontend Performance Data – Gathering the Data
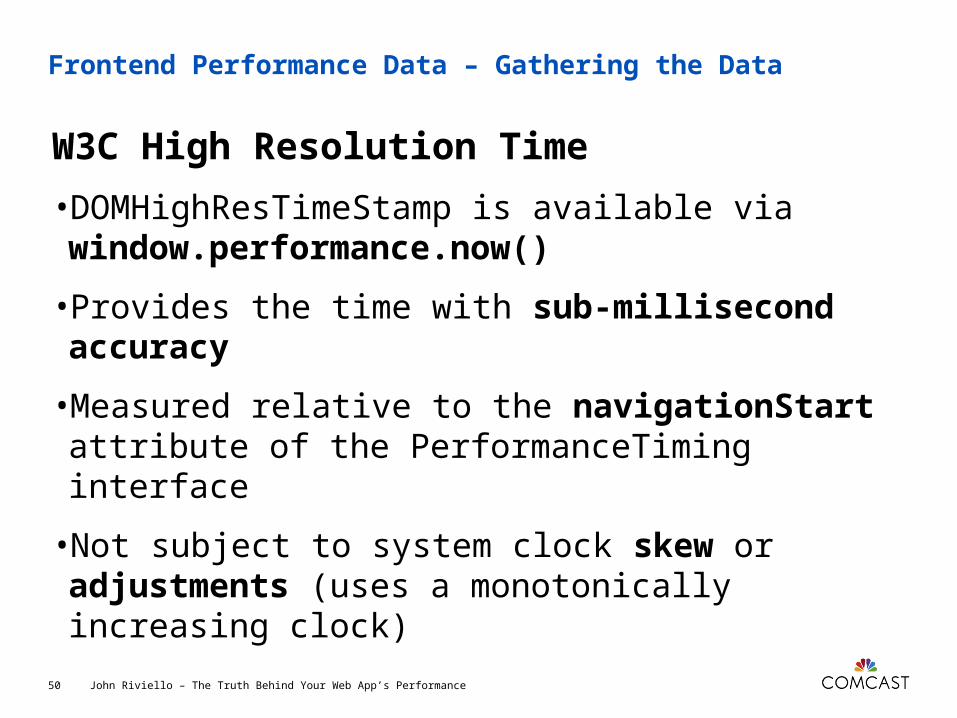
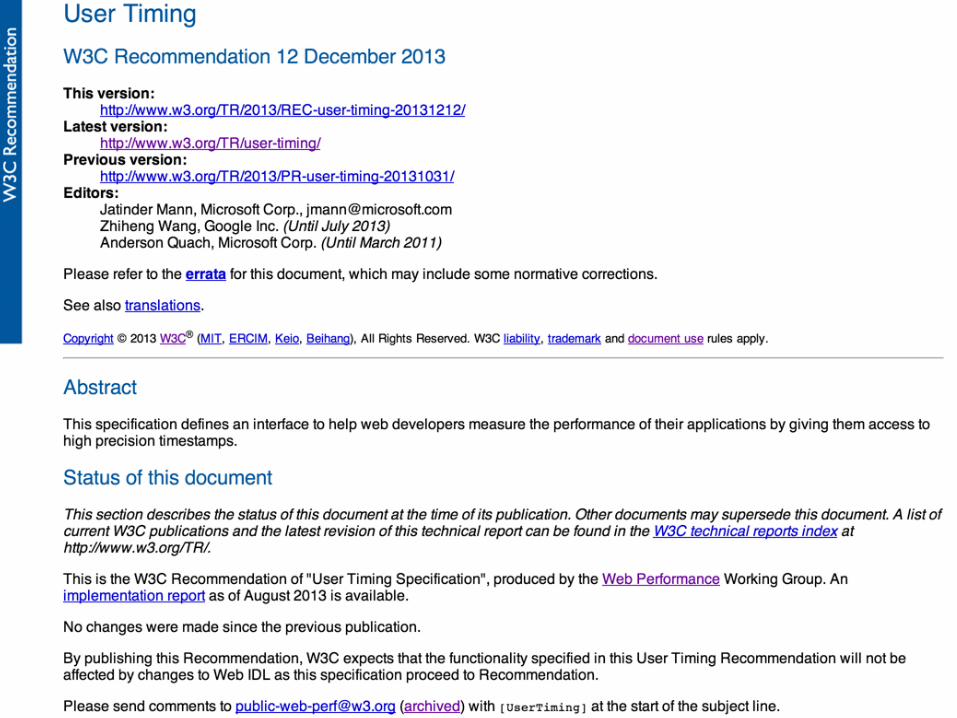
W3C High Resolution Time
John Riviello – The Truth Behind Your Web App’s Performance50
•DOMHighResTimeStamp is available via window.performance.now()
•Provides the time with sub-millisecond accuracy
•Measured relative to the navigationStart attribute of the PerformanceTiming interface
•Not subject to system clock skew or adjustments (uses a monotonically increasing clock)
Frontend Performance Data – Gathering the Data
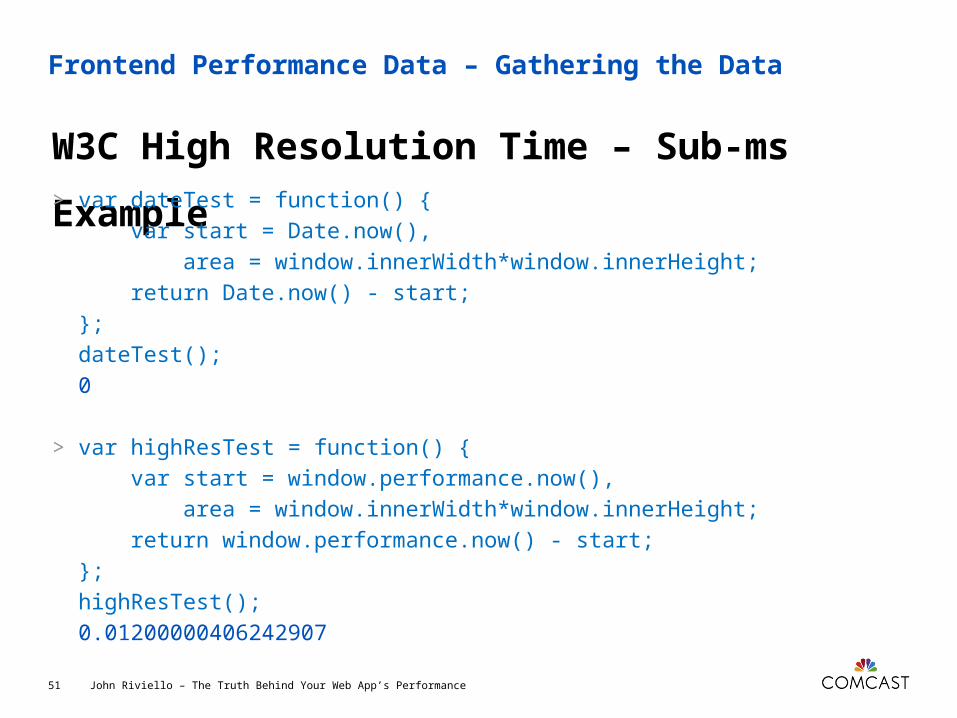
W3C High Resolution Time – Sub-ms Example
John Riviello – The Truth Behind Your Web App’s Performance51
> var dateTest = function() { var start = Date.now(), area = window.innerWidth*window.innerHeight; return Date.now() - start; }; dateTest(); 0
> var highResTest = function() { var start = window.performance.now(), area = window.innerWidth*window.innerHeight; return window.performance.now() - start; }; highResTest(); 0.01200000406242907
Frontend Performance Data – Gathering the Data
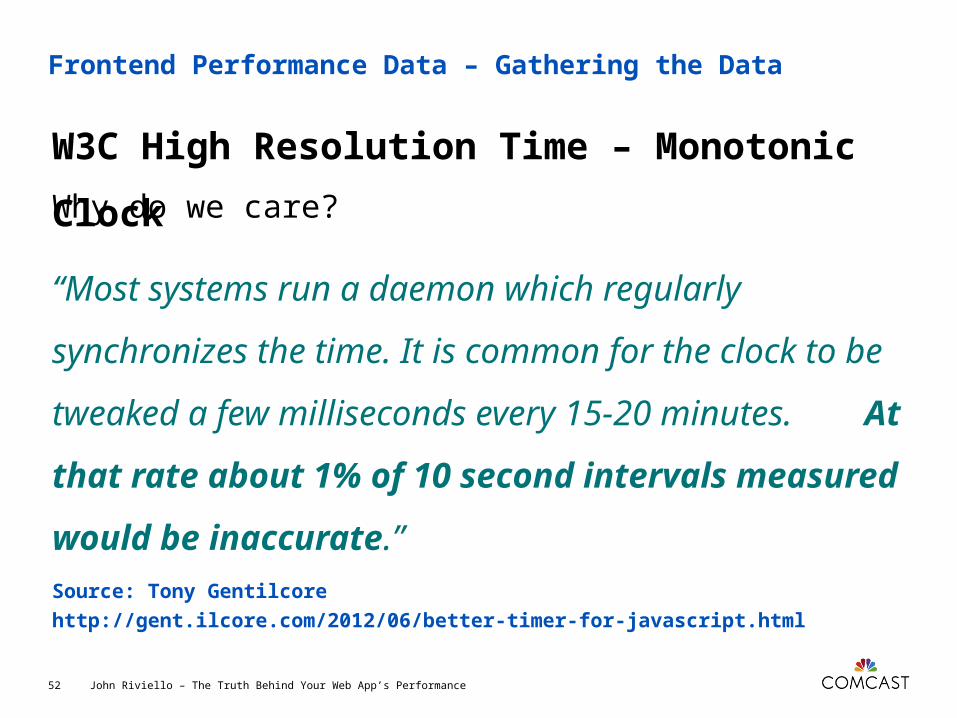
W3C High Resolution Time – Monotonic Clock
John Riviello – The Truth Behind Your Web App’s Performance52
Why do we care?
“Most systems run a daemon which regularly
synchronizes the time. It is common for the clock to be
tweaked a few milliseconds every 15-20 minutes.
At that rate about 1% of 10 second intervals
measured would be inaccurate.”Source: Tony Gentilcore
http://gent.ilcore.com/2012/06/better-timer-for-javascript.html
John Riviello – The Truth Behind Your Web App’s Performance53

John Riviello – The Truth Behind Your Web App’s Performance54
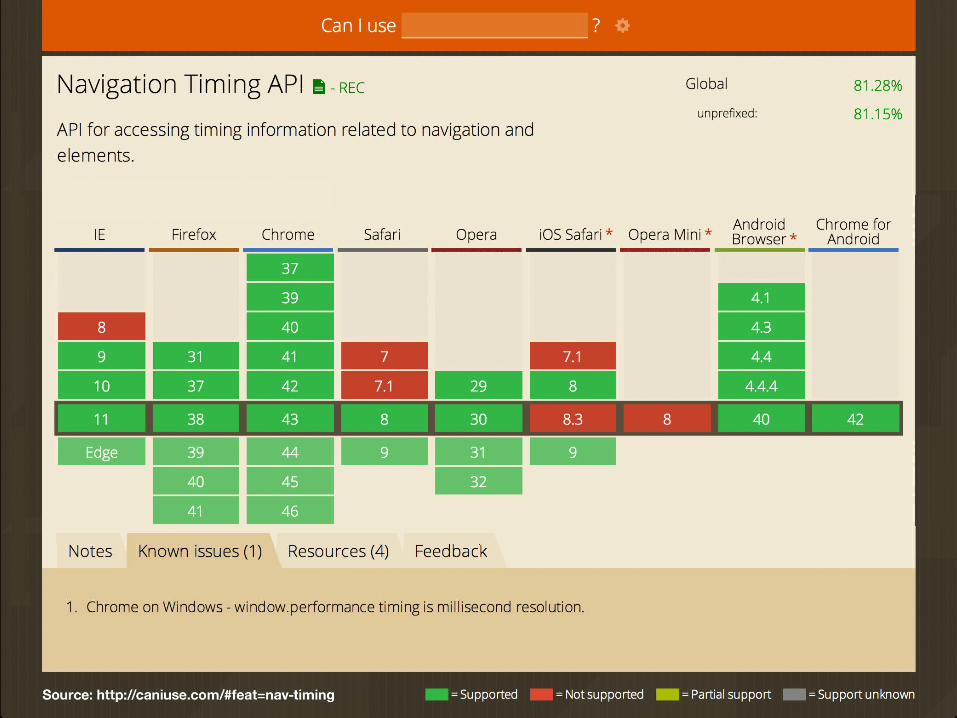
Browser Support


John Riviello – The Truth Behind Your Web App’s Performance61
John Riviello – The Truth Behind Your Web App’s Performance62
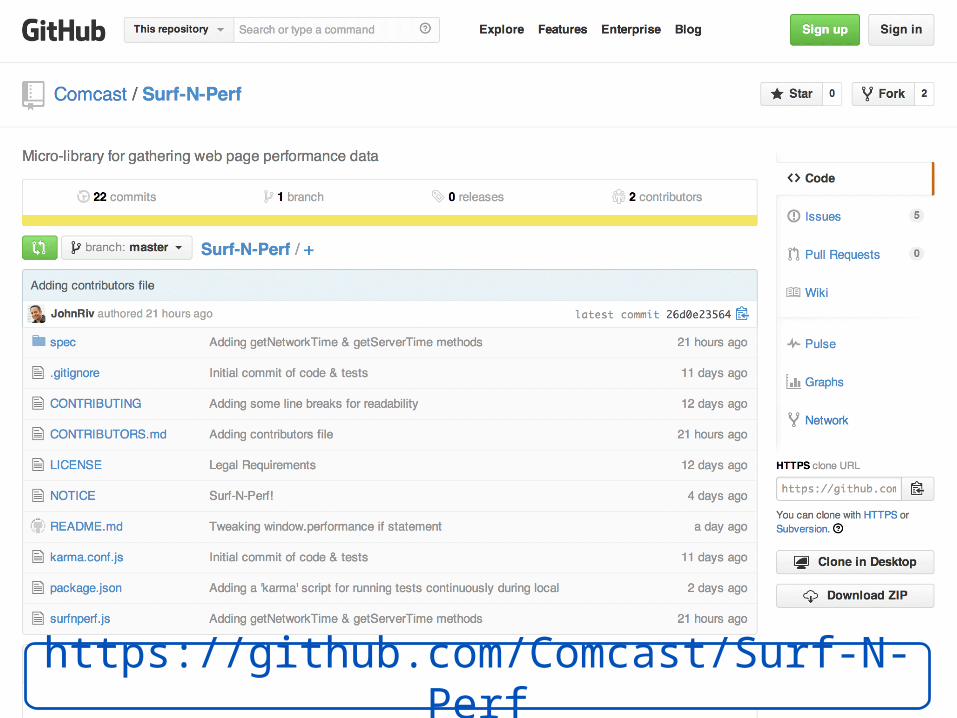
https://github.com/Comcast/Surf-N-Perf
User Timingvs.
Surf-N-Perf"Hurricane Earl's Waves" by John Riviello is licensed under CC BY-NC-SA 2.0 / Color adjusted from original
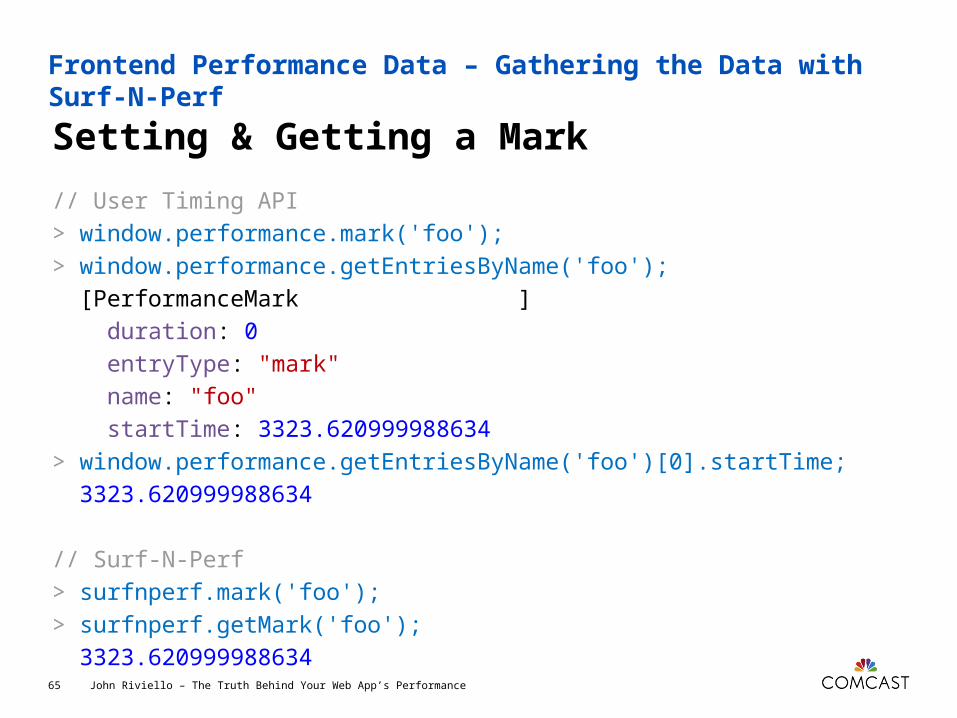
Frontend Performance Data – Gathering the Data with Surf-N-Perf
Setting & Getting a Mark
John Riviello – The Truth Behind Your Web App’s Performance65
// User Timing API> window.performance.mark('foo');> window.performance.getEntriesByName('foo'); [PerformanceMark ] duration: 0 entryType: "mark" name: "foo" startTime: 3323.620999988634> window.performance.getEntriesByName('foo')[0].startTime; 3323.620999988634
// Surf-N-Perf> surfnperf.mark('foo');> surfnperf.getMark('foo'); 3323.620999988634
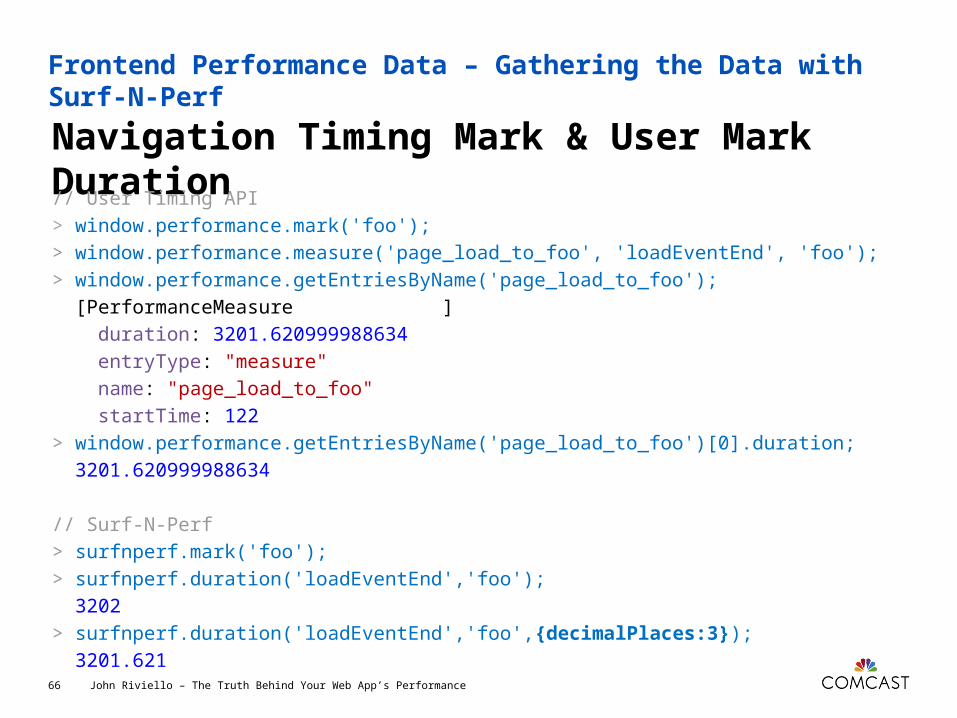
Frontend Performance Data – Gathering the Data with Surf-N-Perf
Navigation Timing Mark & User Mark Duration
John Riviello – The Truth Behind Your Web App’s Performance66
// User Timing API> window.performance.mark('foo');> window.performance.measure('page_load_to_foo', 'loadEventEnd', 'foo');> window.performance.getEntriesByName('page_load_to_foo'); [PerformanceMeasure ] duration: 3201.620999988634 entryType: "measure" name: "page_load_to_foo" startTime: 122> window.performance.getEntriesByName('page_load_to_foo')[0].duration; 3201.620999988634
// Surf-N-Perf> surfnperf.mark('foo');> surfnperf.duration('loadEventEnd','foo'); 3202> surfnperf.duration('loadEventEnd','foo',{decimalPlaces:3}); 3201.621

Frontend Performance Data – Gathering the Data with Surf-N-Perf
Event Duration (i.e. 2 User Marks)
John Riviello – The Truth Behind Your Web App’s Performance67
// User Timing API> window.performance.mark('barStart');> window.performance.mark('barEnd');> window.performance.measure('barEvent', 'barStart', 'barEnd');> window.performance.getEntriesByName(’barEvent')[0].duration; 3512.499000004027
// Surf-N-Perf> surfnperf.eventStart('bar');> surfnperf.eventEnd('bar');> surfnperf.eventDuration('bar'); 3512> surfnperf.eventDuration('bar',{decimalPlaces:12}); 3512.499000004027

Frontend Performance Data – Gathering the Data with Surf-N-Perf
Custom Event Data
John Riviello – The Truth Behind Your Web App’s Performance68
// Surf-N-Perf> surfnperf.eventStart('bar');// surfnperf.eventEnd(KEY, CUSTOM_DATA_OBJECT);> surfnperf.eventEnd('bar', {baz:'qux'});> surfnperf.getEventData('bar', 'baz'); "qux"
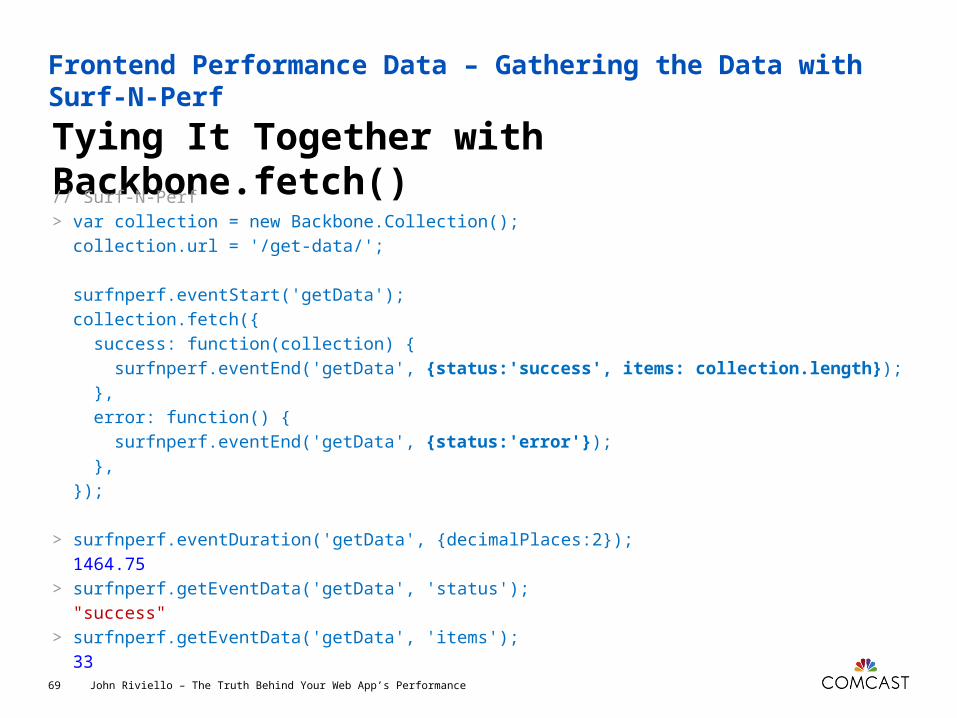
Frontend Performance Data – Gathering the Data with Surf-N-Perf
Tying It Together with Backbone.fetch()
John Riviello – The Truth Behind Your Web App’s Performance69
// Surf-N-Perf> var collection = new Backbone.Collection(); collection.url = '/get-data/';
surfnperf.eventStart('getData'); collection.fetch({ success: function(collection) { surfnperf.eventEnd('getData', {status:'success', items: collection.length}); }, error: function() { surfnperf.eventEnd('getData', {status:'error'}); }, });
> surfnperf.eventDuration('getData', {decimalPlaces:2}); 1464.75> surfnperf.getEventData('getData', 'status'); "success"> surfnperf.getEventData('getData', 'items'); 33
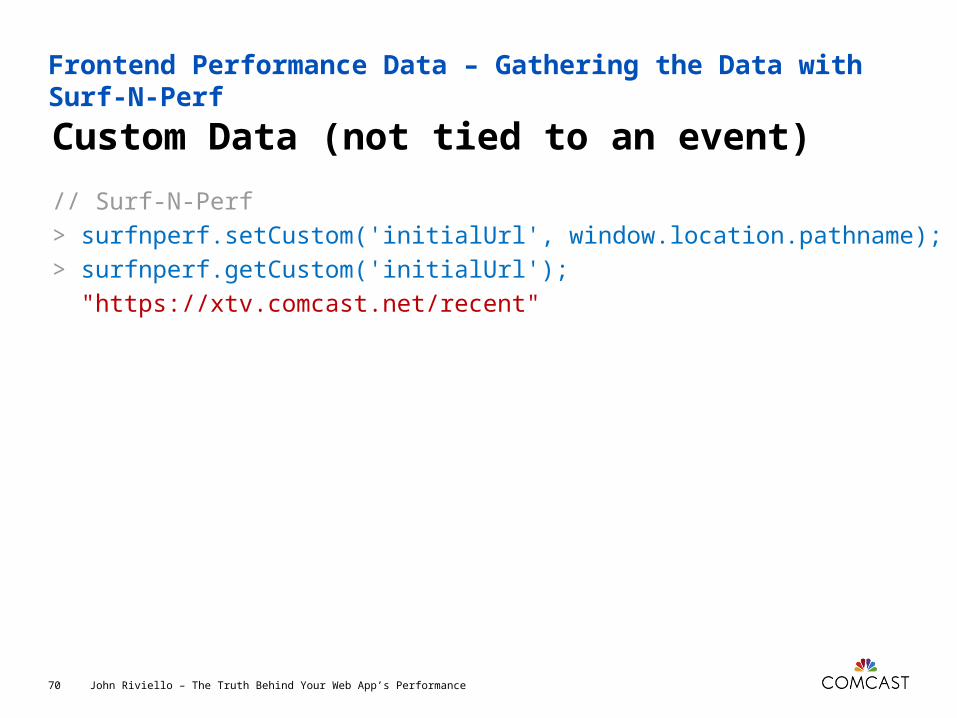
Frontend Performance Data – Gathering the Data with Surf-N-Perf
Custom Data (not tied to an event)
John Riviello – The Truth Behind Your Web App’s Performance70
// Surf-N-Perf> surfnperf.setCustom('initialUrl', window.location.pathname);> surfnperf.getCustom('initialUrl'); "https://xtv.comcast.net/recent"
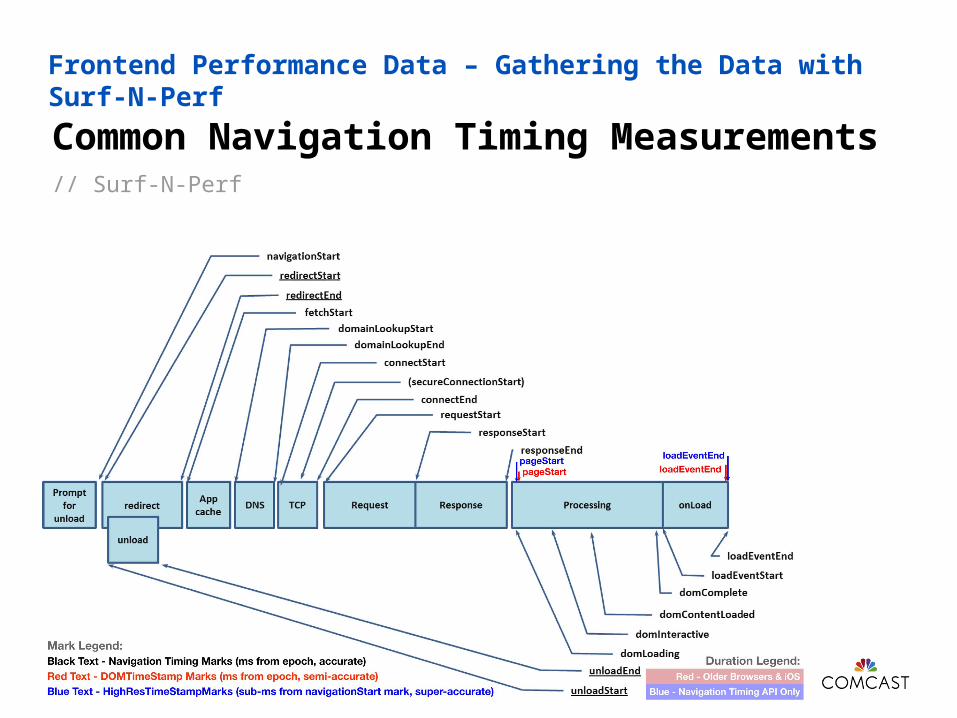
Frontend Performance Data – Gathering the Data with Surf-N-Perf
Common Navigation Timing Measurements
John Riviello – The Truth Behind Your Web App’s Performance71
// Surf-N-Perf
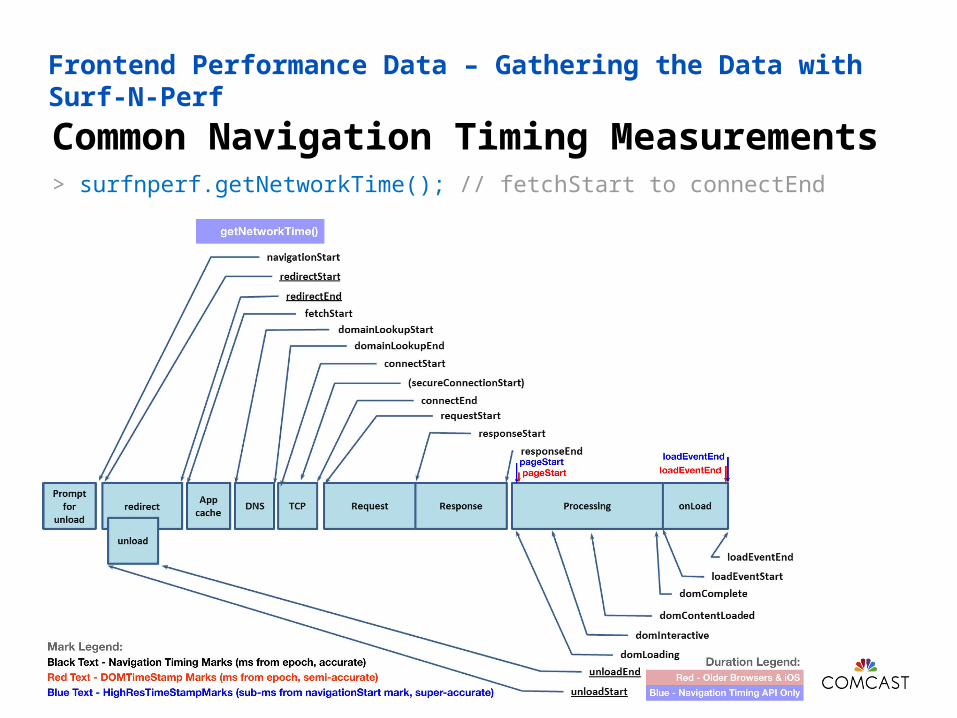
Frontend Performance Data – Gathering the Data with Surf-N-Perf
Common Navigation Timing Measurements
John Riviello – The Truth Behind Your Web App’s Performance72
> surfnperf.getNetworkTime(); // fetchStart to connectEnd
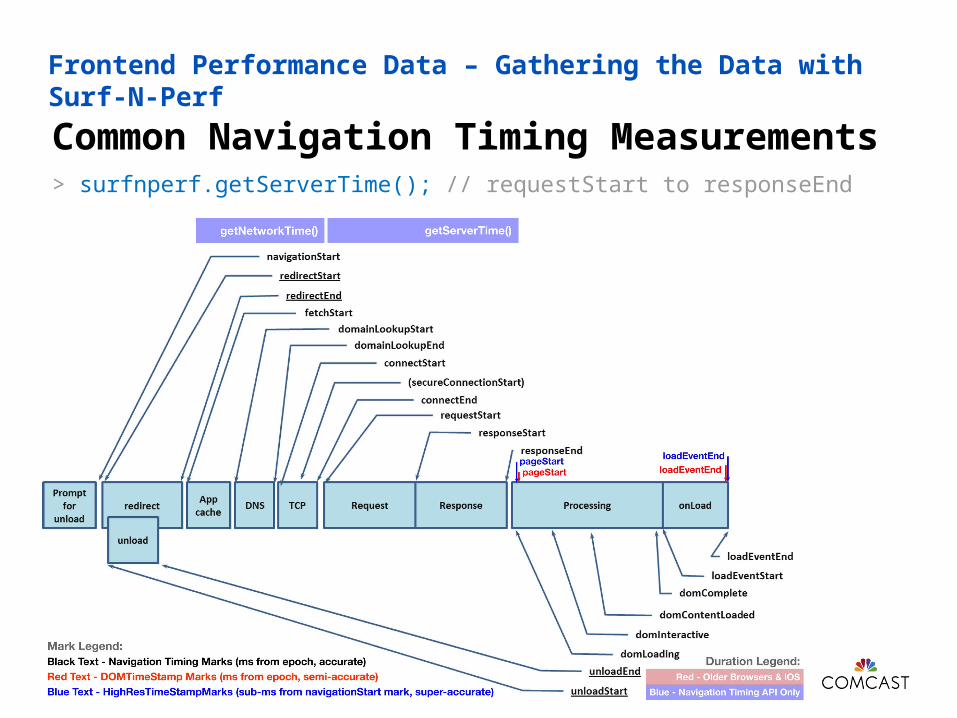
Frontend Performance Data – Gathering the Data with Surf-N-Perf
Common Navigation Timing Measurements
John Riviello – The Truth Behind Your Web App’s Performance73
> surfnperf.getServerTime(); // requestStart to responseEnd
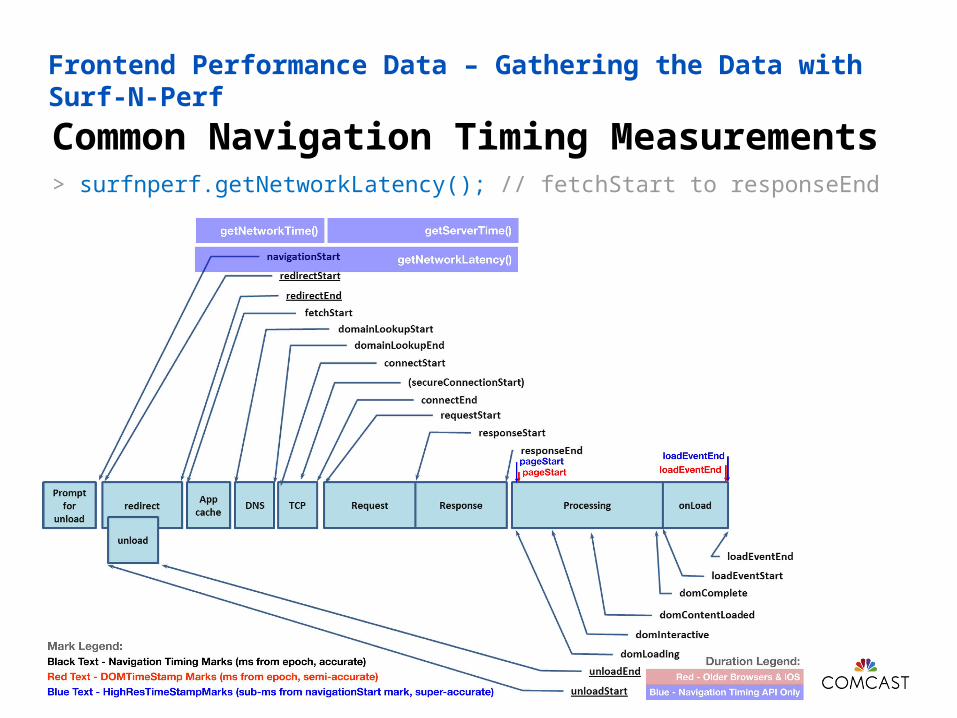
Frontend Performance Data – Gathering the Data with Surf-N-Perf
Common Navigation Timing Measurements
John Riviello – The Truth Behind Your Web App’s Performance74
> surfnperf.getNetworkLatency(); // fetchStart to responseEnd
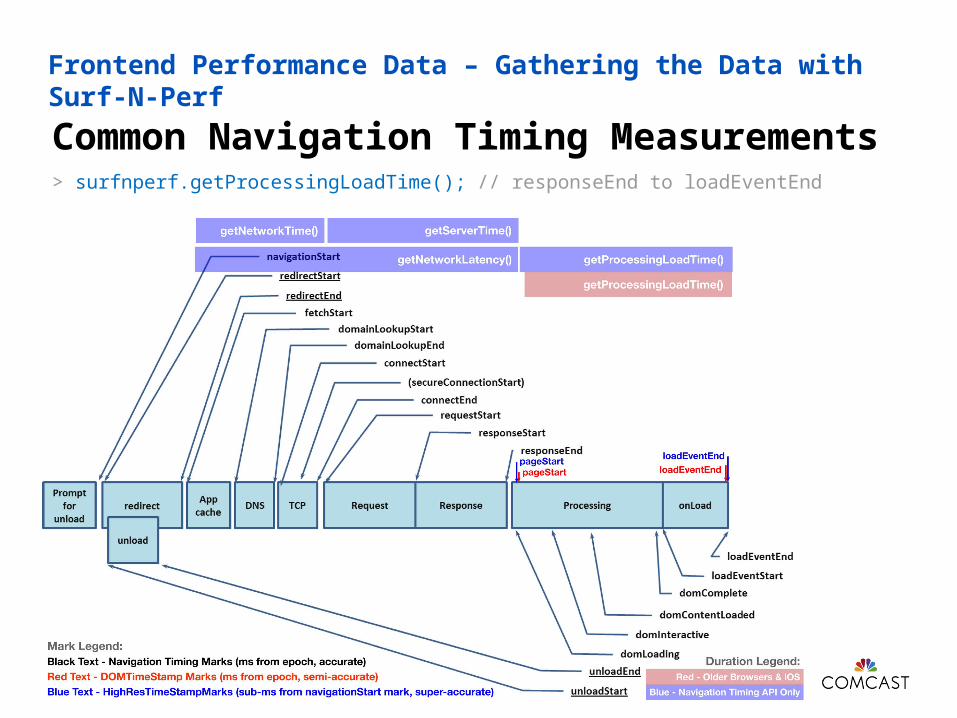
Frontend Performance Data – Gathering the Data with Surf-N-Perf
Common Navigation Timing Measurements
John Riviello – The Truth Behind Your Web App’s Performance75
> surfnperf.getProcessingLoadTime(); // responseEnd to loadEventEnd

Frontend Performance Data – Gathering the Data with Surf-N-Perf
Common Navigation Timing Measurements
John Riviello – The Truth Behind Your Web App’s Performance76
> surfnperf.getFullRequestLoadTime(); // navigationStart to loadEventEnd
1. Existing Tools2. The Data You Care About3. Gathering the Data4. Analyzing the Data
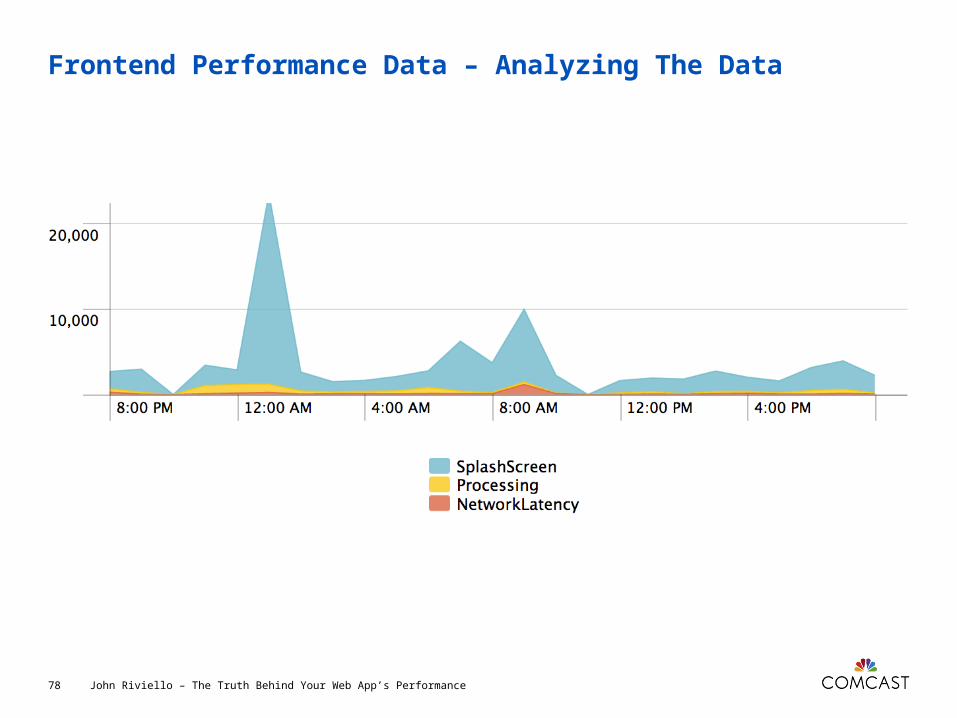
Frontend Performance Data – Analyzing The Data
John Riviello – The Truth Behind Your Web App’s Performance78
Average Response Timesare forAverage Products
99th PERCENTILE
(at a minimum)
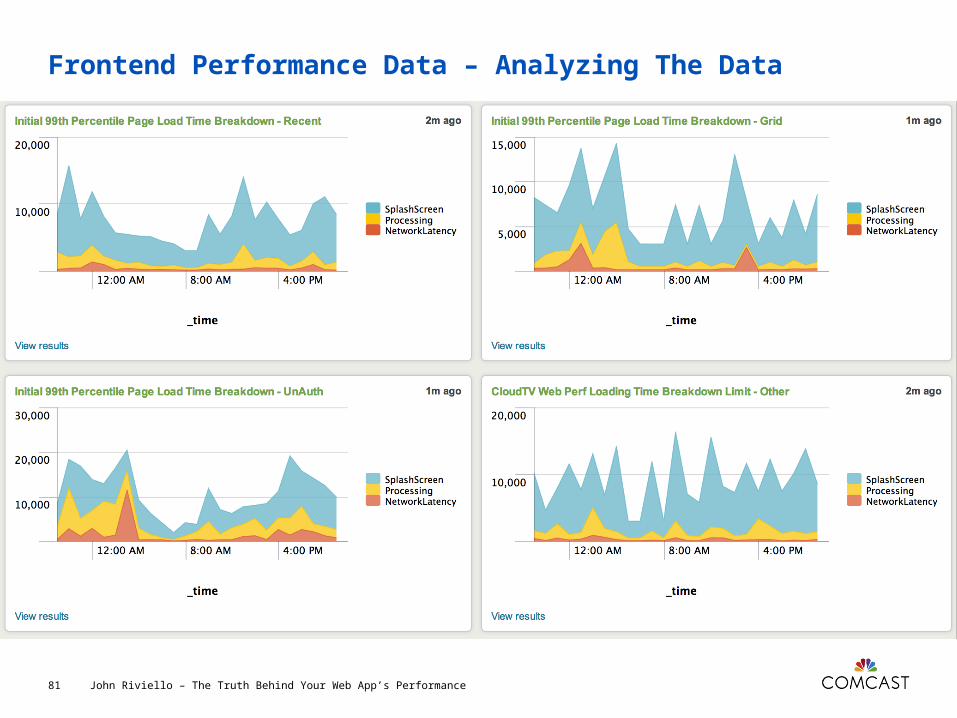
Frontend Performance Data – Analyzing The Data
John Riviello – The Truth Behind Your Web App’s Performance81
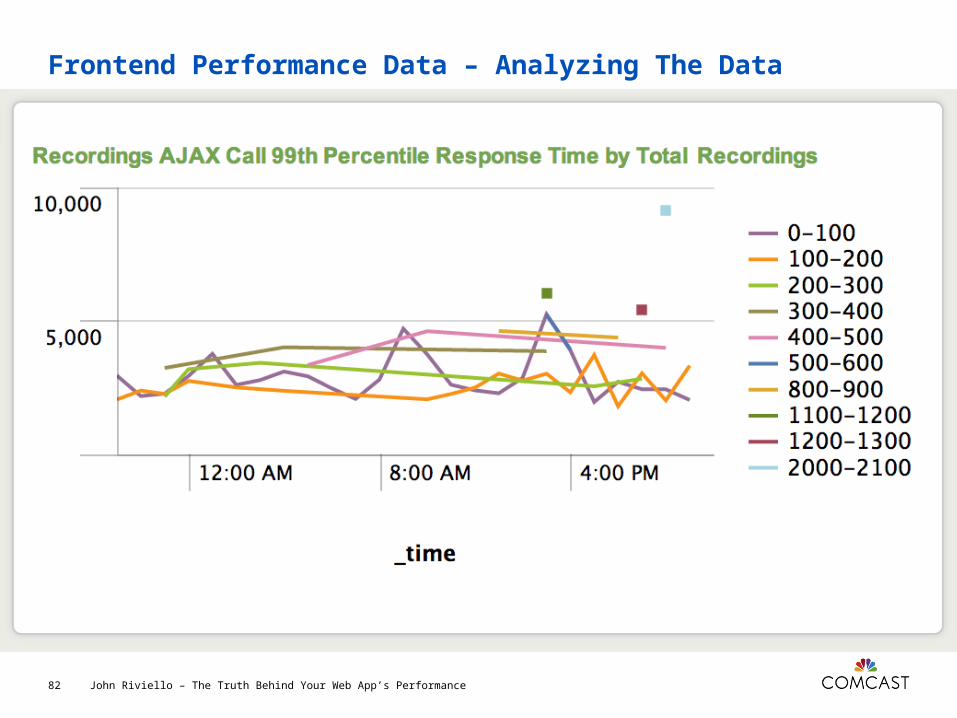
Frontend Performance Data – Analyzing The Data
John Riviello – The Truth Behind Your Web App’s Performance82

Frontend Performance Data – Analyzing The Data
John Riviello – The Truth Behind Your Web App’s Performance83
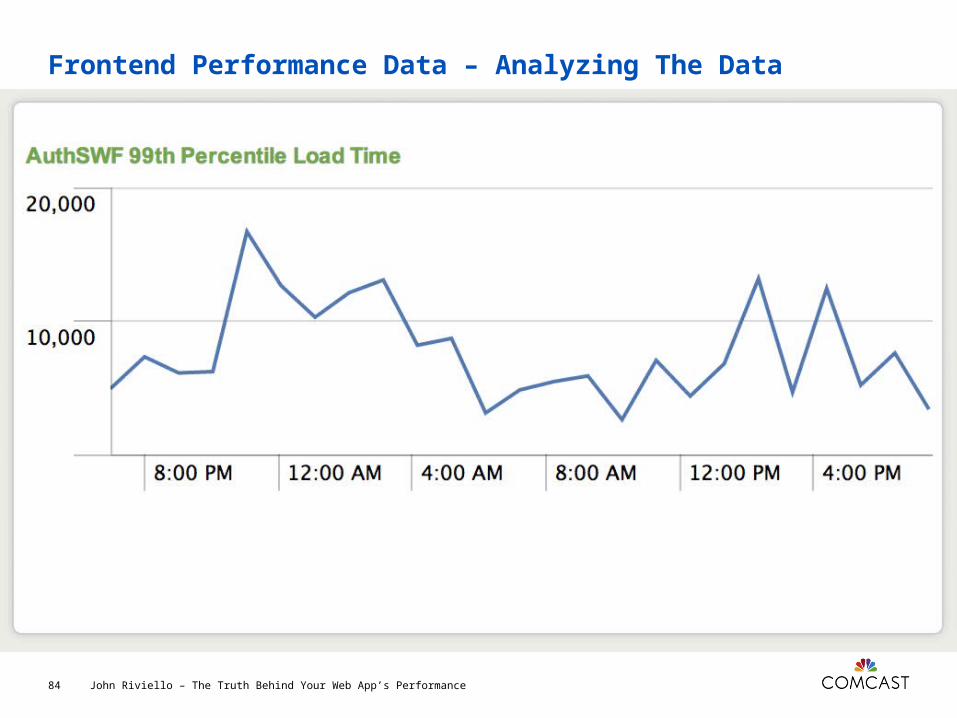
Frontend Performance Data – Analyzing The Data
John Riviello – The Truth Behind Your Web App’s Performance84
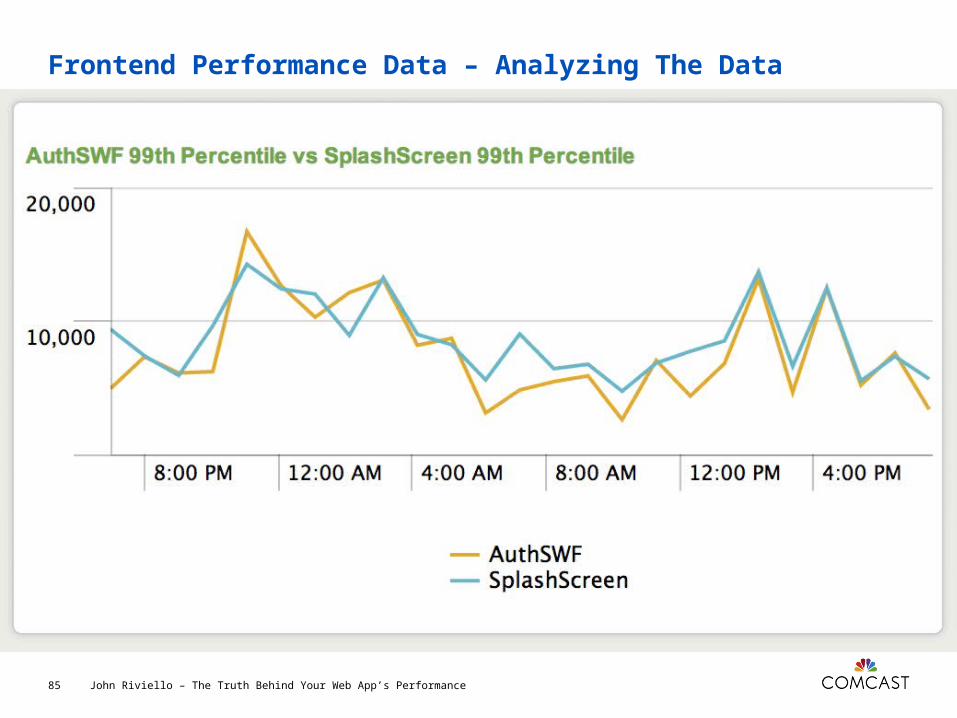
Frontend Performance Data – Analyzing The Data
John Riviello – The Truth Behind Your Web App’s Performance85
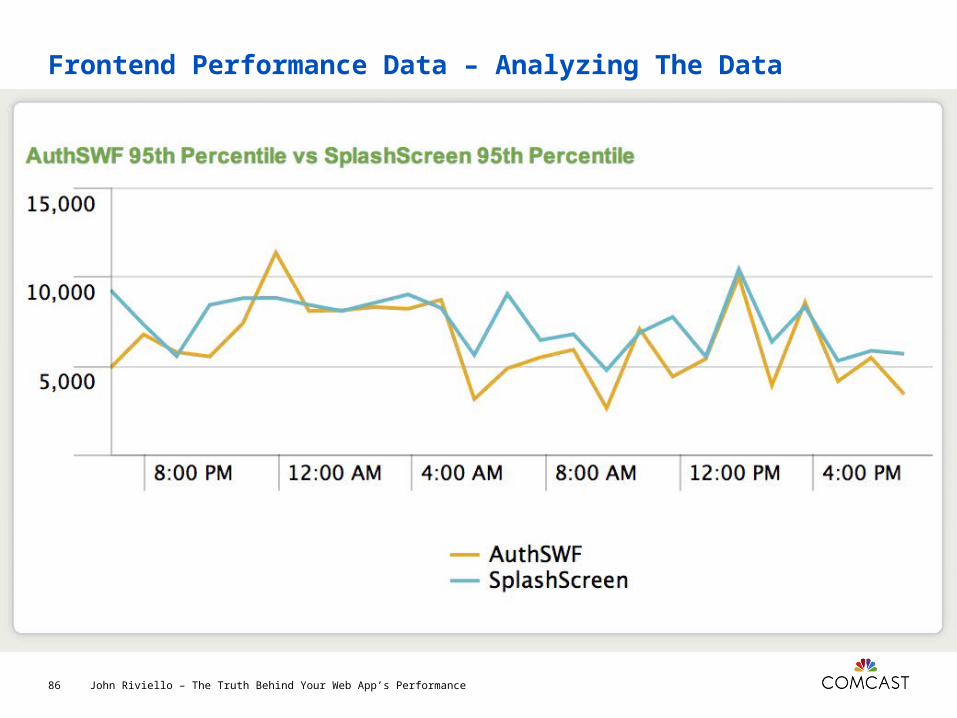
Frontend Performance Data – Analyzing The Data
John Riviello – The Truth Behind Your Web App’s Performance86
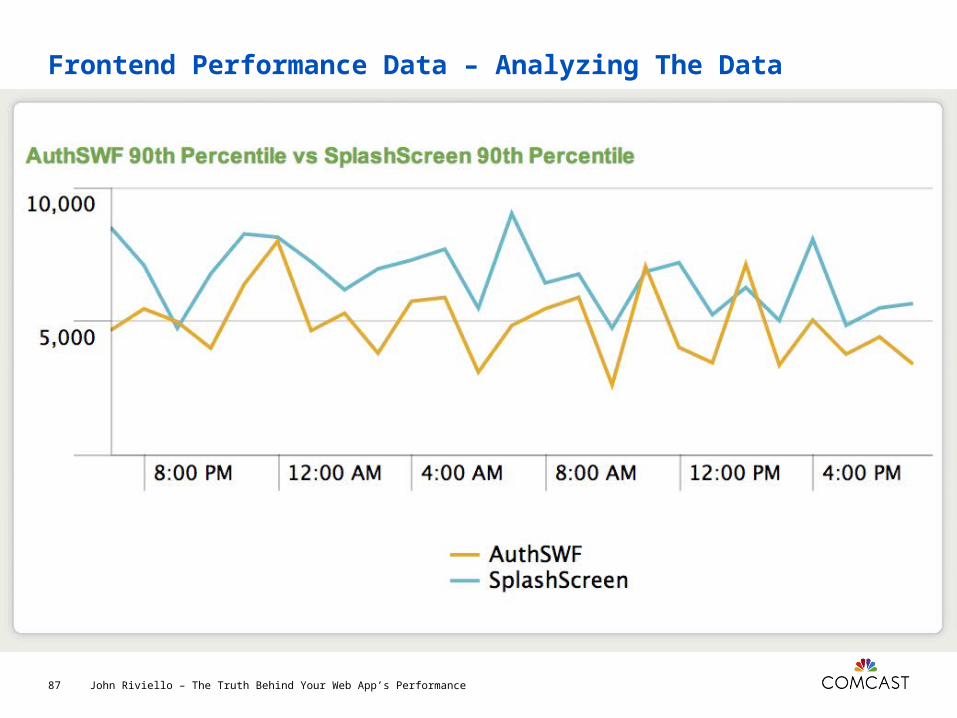
Frontend Performance Data – Analyzing The Data
John Riviello – The Truth Behind Your Web App’s Performance87
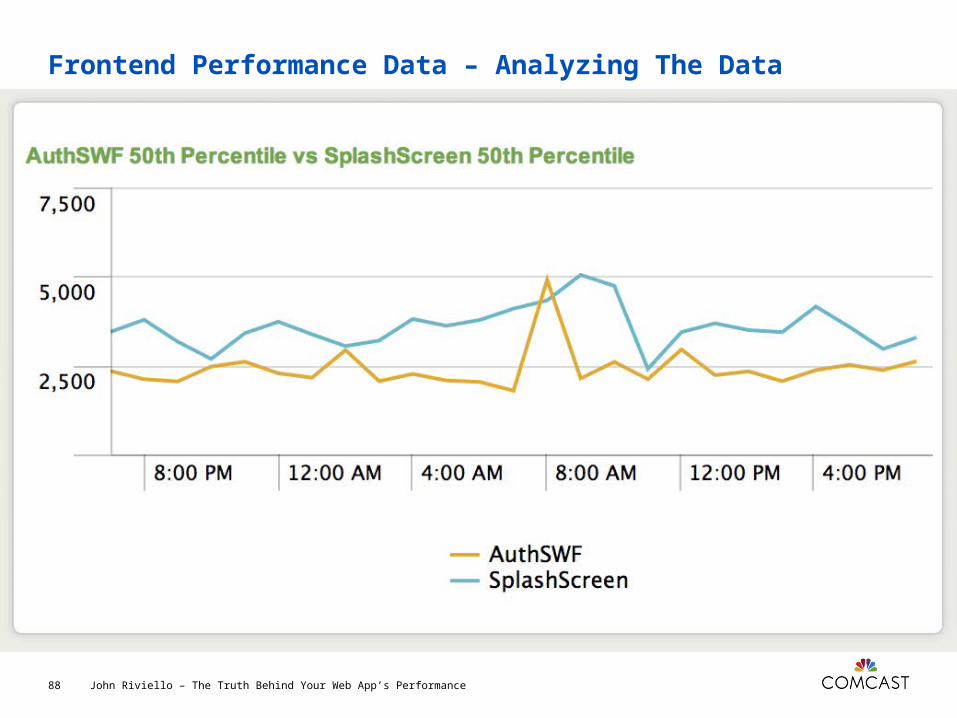
Frontend Performance Data – Analyzing The Data
John Riviello – The Truth Behind Your Web App’s Performance88

Frontend Performance Data – Analyzing The Data
John Riviello – The Truth Behind Your Web App’s Performance89

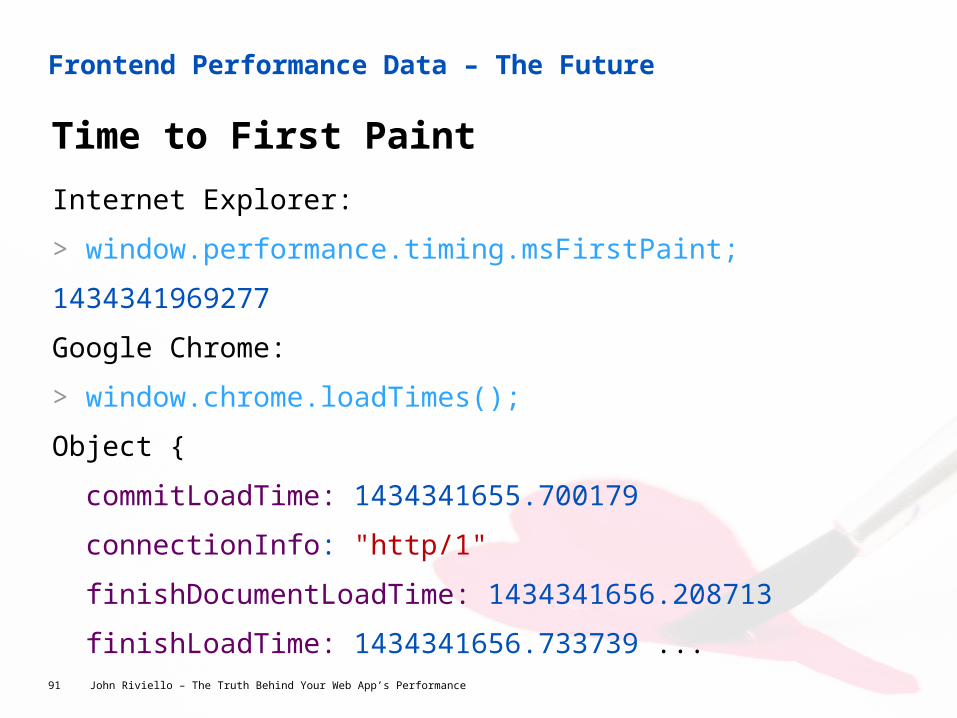
Frontend Performance Data – The Future
Time to First Paint
John Riviello – The Truth Behind Your Web App’s Performance91
Internet Explorer:
> window.performance.timing.msFirstPaint;
1434341969277
Google Chrome:
> window.chrome.loadTimes();
Object {
commitLoadTime: 1434341655.700179
connectionInfo: "http/1"
finishDocumentLoadTime: 1434341656.208713
finishLoadTime: 1434341656.733739 ...
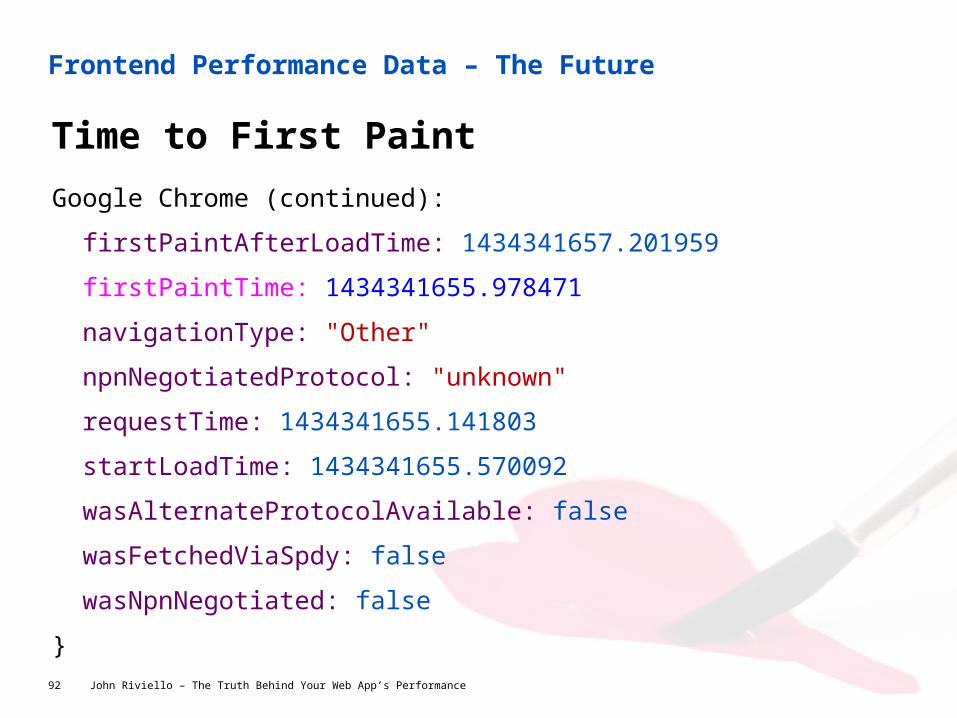
Frontend Performance Data – The Future
Time to First Paint
John Riviello – The Truth Behind Your Web App’s Performance92
Google Chrome (continued):
firstPaintAfterLoadTime: 1434341657.201959
firstPaintTime: 1434341655.978471
navigationType: "Other"
npnNegotiatedProtocol: "unknown"
requestTime: 1434341655.141803
startLoadTime: 1434341655.570092
wasAlternateProtocolAvailable: false
wasFetchedViaSpdy: false
wasNpnNegotiated: false
}
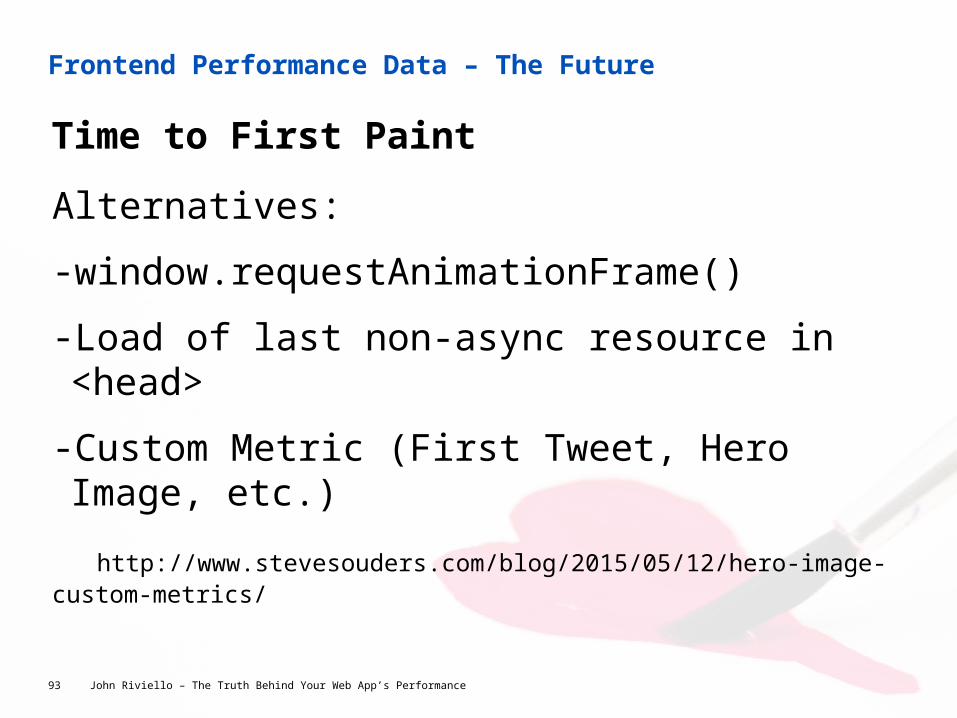
Frontend Performance Data – The Future
Time to First Paint
John Riviello – The Truth Behind Your Web App’s Performance93
Alternatives:
-window.requestAnimationFrame()
- Load of last non-async resource in <head>
- Custom Metric (First Tweet, Hero Image, etc.)
http://www.stevesouders.com/blog/2015/05/12/hero-image-custom-metrics/
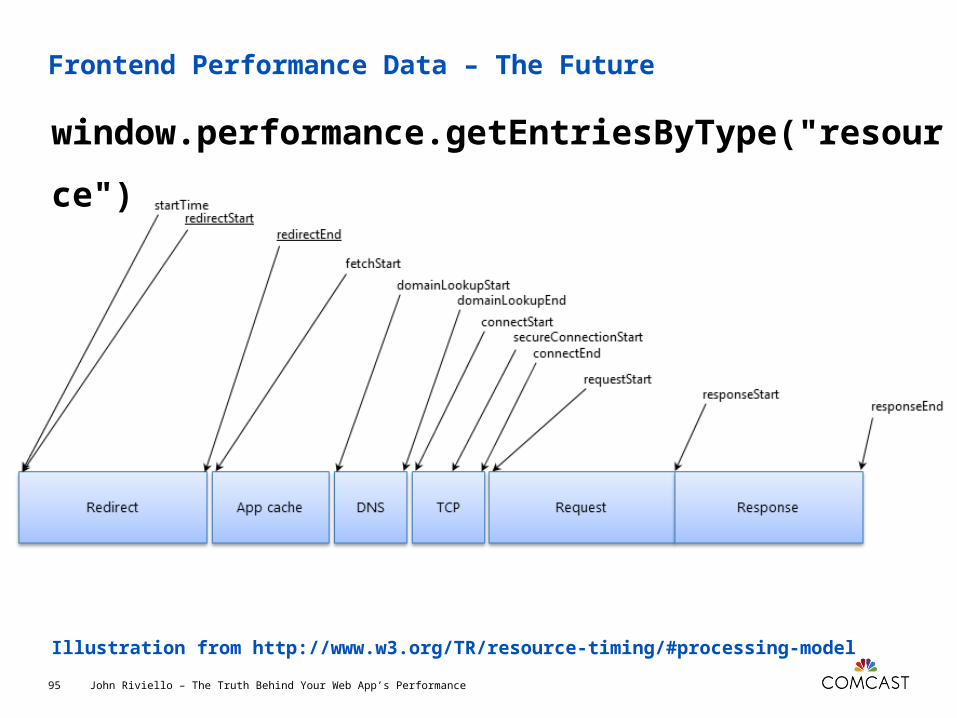
Frontend Performance Data – The Future
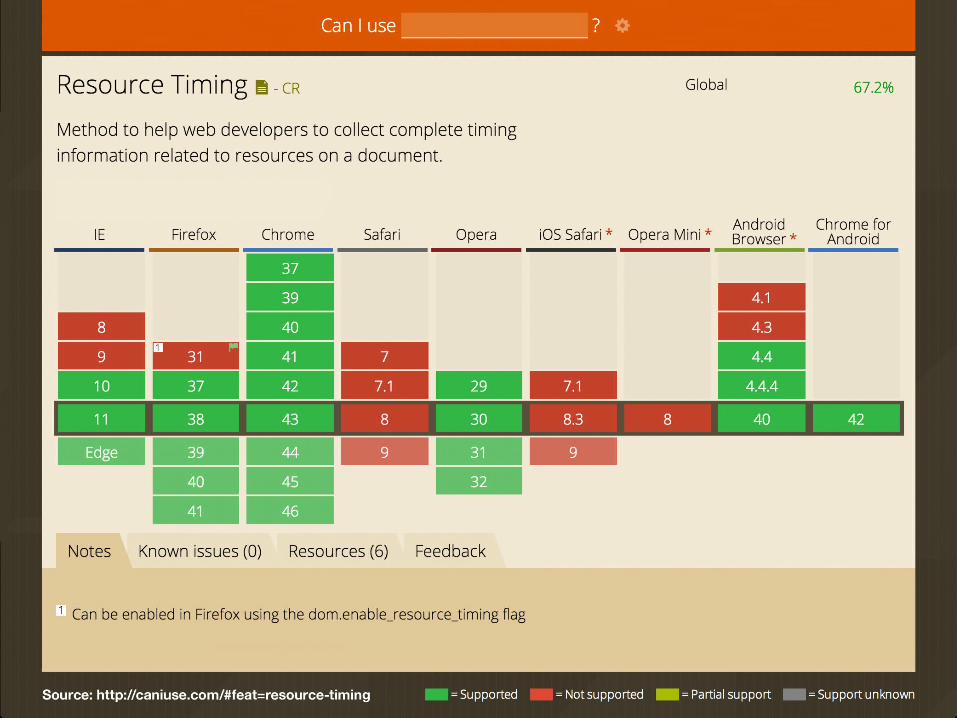
John Riviello – The Truth Behind Your Web App’s Performance95
Illustration from http://www.w3.org/TR/resource-timing/#processing-model
window.performance.getEntriesByType("resou
rce")
Frontend Performance Data – The Future
John Riviello – The Truth Behind Your Web App’s Performance96
3rd Party Resource
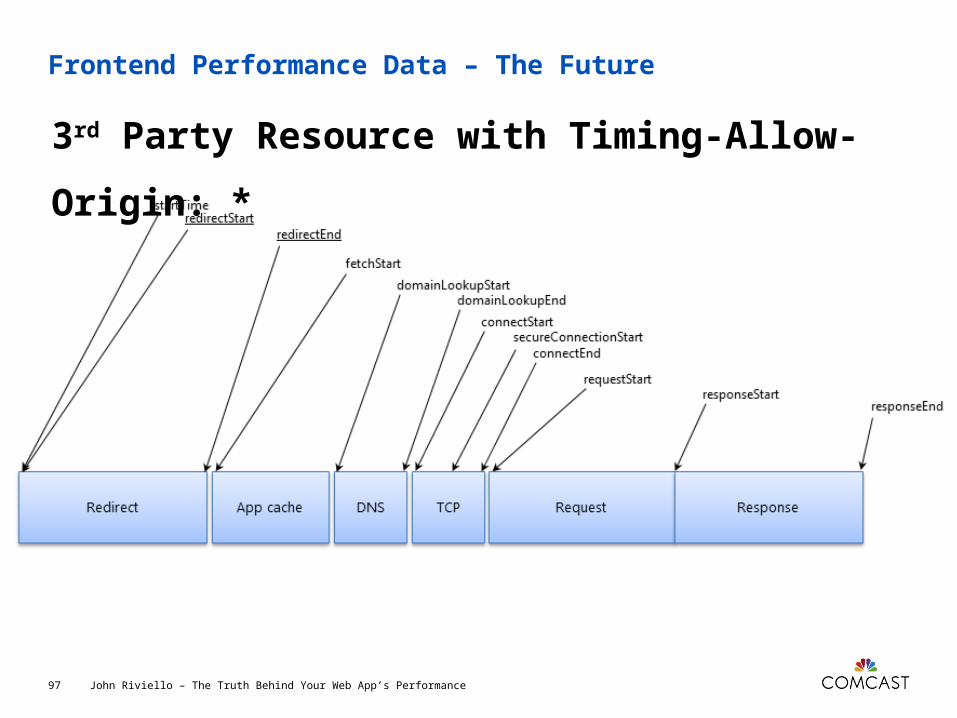
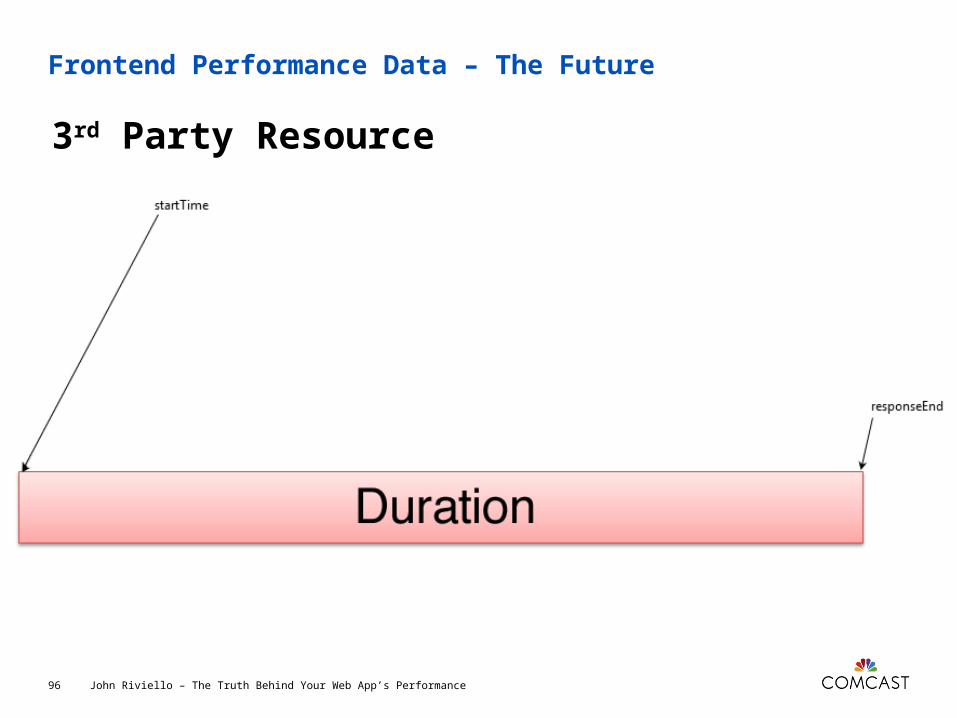
Frontend Performance Data – The Future
John Riviello – The Truth Behind Your Web App’s Performance97
3rd Party Resource with Timing-Allow-Origin:
*

Recap
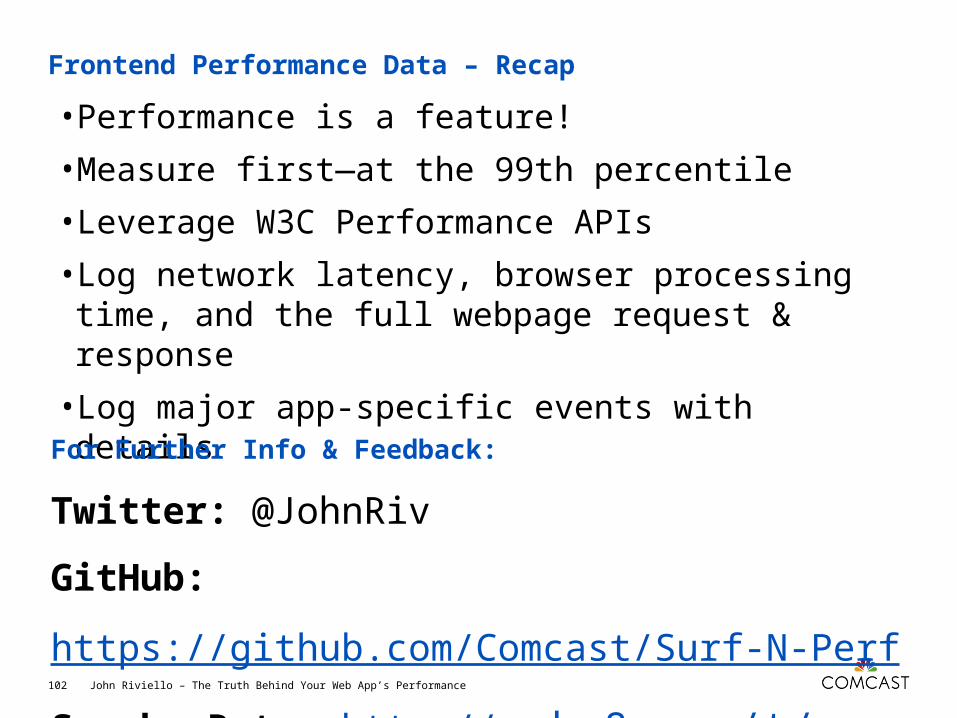
Frontend Performance Data – Recap
John Riviello – The Truth Behind Your Web App’s Performance102
• Performance is a feature!
• Measure first—at the 99th percentile
• Leverage W3C Performance APIs
• Log network latency, browser processing time, and the full webpage request & response
• Log major app-specific events with details
For Further Info & Feedback:
Twitter: @JohnRiv
GitHub: https://github.com/Comcast/Surf-N-Perf
SpeakerRate: http://spkr8.com/t/60261