the u s economic outlookthe u.s. economic outlook
TRANSCRIPT
The U S Economic OutlookThe U.S. Economic Outlook
Charts presented by William C DudleyCharts presented by William C. DudleyPresident and Chief Executive OfficerFederal Reserve Bank of New YorkWashington and Lee University
H. Parker Willis Lecture in Political EconomicsLexington, VAApril 1, 2010

2 2Percent Percent
Current Account Balance as a Percent of GDP
0 0
-2 -2
-4
2
-4
2
6
-4
6
-4
8
-6
8
-6
-81970 1976 1982 1988 1994 2000 2006
-8
Source: Bureau of Economic AnalysisNote: Shading represents NBER recessions, vertical line
represents 2007Q4 business cycle peak.1

130 130
Real Broad Trade Weighted Value of the US DollarIndex Index
120
130
120
130
110
120
110
120
100
110
100
110
90
100
90
100
80
90
80
90
801980 1985 1990 1995 2000 2005 2010
80
Source: Federal Reserve Board2Note: Shading represents NBER recessions, vertical line
represents 2007Q4 business cycle peak.

20 20
10-Year Treasury Note Yield at Constant MaturityPercent Percent
16 16
12 12
8 8
4
8
4
8
0
4
0
4
01980 1985 1990 1995 2000 2005 2010
0
Source: Federal Reserve Board3Note: Shading represents NBER recessions, vertical line
represents 2007Q4 business cycle peak.

% Change – Year to Year % Change Year - Year
Net Stock: Private Residential, Nonresidential Structures, and Equipment and Software
10 10
Equipment and Software
8 8
6 6
4 4
Residential
2 2
Nonresidential Structures
01960 1966 1972 1978 1984 1990 1996 2002 2008
0
Source: Bureau of Economic Analysis4Note: Shading represents NBER recessions, vertical line
represents 2007Q4 business cycle peak.

Total Balance by Credit Score QuintileBillions of Dollars
Median Credit Score
of Quintile Percent of Percent of
Percent Change
from Previous Percent of
Percent Change
from Previous
2005-Q1 2008-Q3 2009-Q3
(2005-Q1) Total Debt Total Total Debt Total Period Total Debt Total Period
807 2020.0 22.2% 2290.0 18.7% 13.4% 2190.0 18.8% -4.4%
767 2330 0 25 6% 3110 0 25 5% 33 5% 3010 0 25 8% -3 2%767 2330.0 25.6% 3110.0 25.5% 33.5% 3010.0 25.8% -3.2%
708 2360.0 26.0% 3450.0 28.2% 46.2% 3300.0 28.3% -4.3%
631 1450.0 16.0% 2280.0 18.7% 57.2% 2130.0 18.3% -6.6%
538 928.0 10.2% 1090.0 8.9% 17.5% 1040.0 8.9% -4.6%
Total 9088.0 100.0% 12220.0 100.0% 34.5% 11670.0 100.0% -4.5%Source: FRBNY Equifax Panel Datasetq
5

70 70Percent Percent
Homeownership Rate
68 68
66 66
64 64
62 62621970 1976 1982 1988 1994 2000 2006
62
Source: Census Bureau6Note: Shading represents NBER recessions, vertical line
represents 2007Q4 business cycle peak.

72 15
Consumption and Personal SavingPercent Percent
70
72
12
15
Consumption as Personal
68
9
12pShare of GDP
(left axis)
Personal Saving Rate (right axis)
66
6
9
64
3
6
60
62
0
3
601960 1965 1970 1975 1980 1985 1990 1995 2000 2005 2010
0
Source: Bureau of Economic Activity7Note: Shading represents NBER recessions, vertical line
represents 2007Q4 business cycle peak.
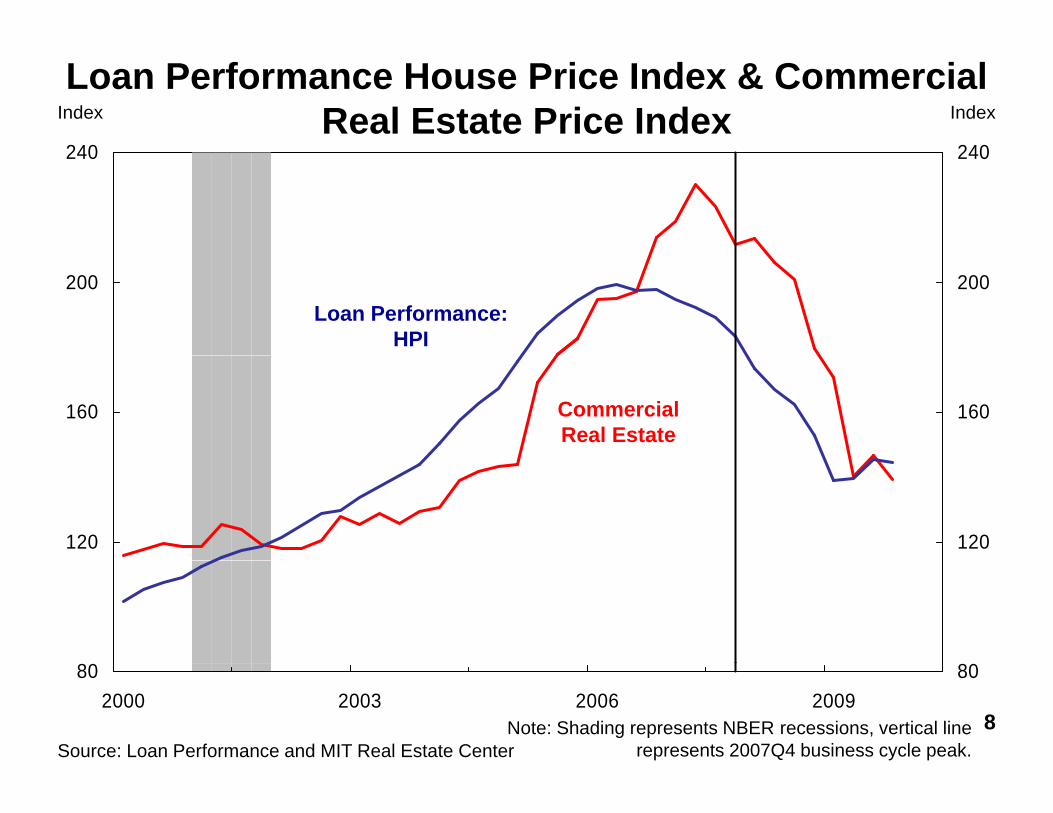
240 240
Index IndexLoan Performance House Price Index & Commercial
Real Estate Price Index240 240
200 200Loan Performance:
HPI
160 160Commercial Real Estate
120 120
802000 2003 2006 2009
80
Source: Loan Performance and MIT Real Estate Center8Note: Shading represents NBER recessions, vertical line
represents 2007Q4 business cycle peak.

5 0 5 0
First Mortgages: 90+ Day Delinquency RatesRatio Ratio(Series set to 1.0 at 4Q prior to NBER peak)
4 0
5.0
4 0
5.0% of number of loans% of number of loans Q4 ‘09Q4 ‘09
3.0
4.0
3.0
4.0
Current Cycle
2.0 2.02001 Cycle
1.0 1.0
2001 Cycle
0.08 6 4 2 0 2 4 6 8 10 12
0.0
1990-1991 Cycle 1981-1982 Cycle1974-1975 Cycle
-8 -6 -4 -2 0 2 4 6 8 10 12
Quarters Since 4Q Prior to NBER Peak
Source: Mortgage Bankers Association9

Percent of 90+ days Late Mortgage Balance Owned by Multiple Home Owners
40
45
40
453+ home owners 2 home owners
Percent Percent
30
35
40
30
35
40
20
25
30
20
25
30
15
20
15
20
5
10
5
10
0004Q1 05Q1 06Q1 07Q1 08Q1 09Q1 10
Source: Equifax, FRBNY

30 30Percent Percent
Household Liabilities as a Percent of Net Worth
25 25
20 20
15 15
10 10101970 1976 1982 1988 1994 2000 2006
10
Source: Federal Reserve Board11Note: Shading represents NBER recessions, vertical line
represents 2007Q4 business cycle peak.

Ratio Ratio(Series Set to 1.0 at NBER Peak)
Real GDP
1.10 1.10
1.05 1.05
1973 Cycle1981 Cycle
1.00 1.00
0.954 2 0 2 4 6 8 10 12
0.95
Current Cycle
-4 -2 0 2 4 6 8 10 12Quarters Since NBER Peak
Source: Bureau of Economic Analysis12

Difference Difference(Series Set to 0.0 at NBER Peak)Unemployment Rate
5.0
6.0
5.0
6.0
Current Cycle
4.0 4.0
1973 Cycle
2.0
3.0
2.0
3.01973 Cycle
1.0 1.01981 Cycle
-1.0
0.0
4 2 0 2 4 6 8 10 12-1.0
0.0
-4 -2 0 2 4 6 8 10 12Quarters Since NBER Peak
Source: Bureau of Labor Statistics13
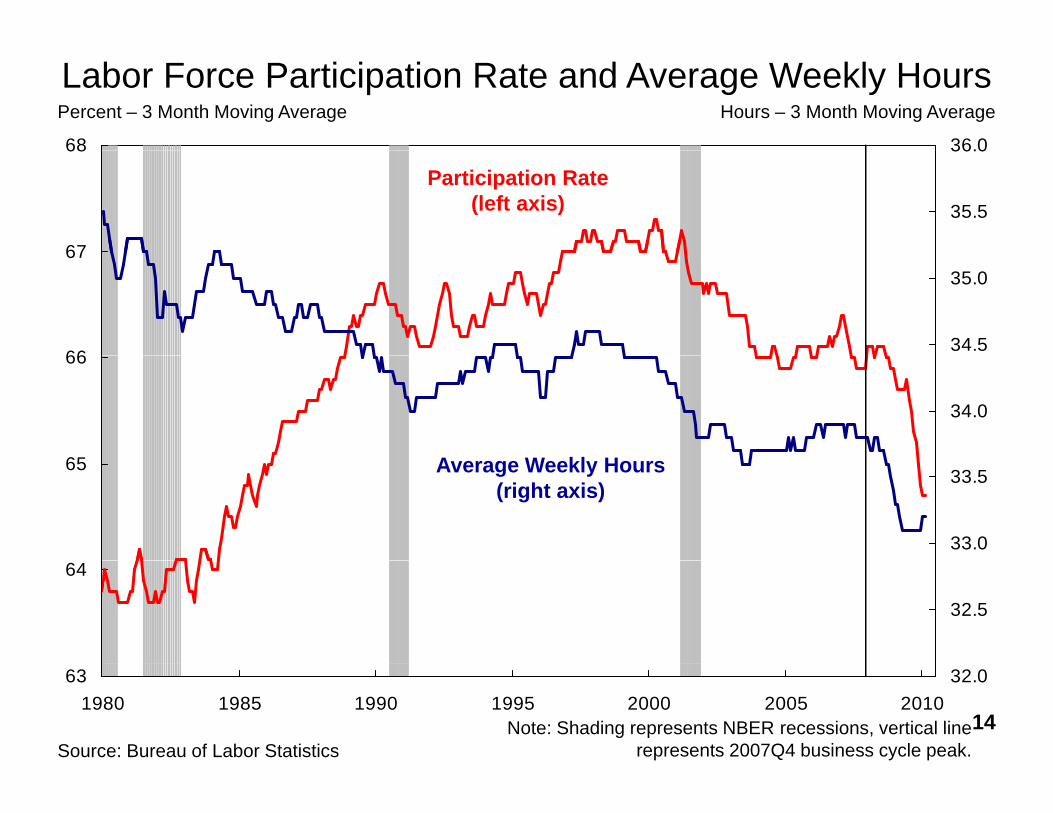
68 36.0
Labor Force Participation Rate and Average Weekly HoursPercent – 3 Month Moving Average Hours – 3 Month Moving Average
67
68
35.5
36.0
Participation Rate (left axis)
66
67
34.5
35.0
65
66
34.0
A W kl H65
33.0
33.5Average Weekly Hours (right axis)
64
32.5
631980 1985 1990 1995 2000 2005 2010
32.0
Source: Bureau of Labor Statistics14Note: Shading represents NBER recessions, vertical line
represents 2007Q4 business cycle peak.

Ratio Ratio(Series Set to 1.0 at NBER Peak)
Nonfarm Business Sector: Hours Worked
1.05
1.10
1.05
1.10
1981 C l
1.00 1.00
1981 Cycle
0.95 0.951973 Cycle
0 85
0.90
0 85
0.90Current Cycle
0.80
0.85
4 2 0 2 4 6 8 10 120.80
0.85
-4 -2 0 2 4 6 8 10 12Quarters Since NBER Peak
Source: Bureau of Labor Statistics15
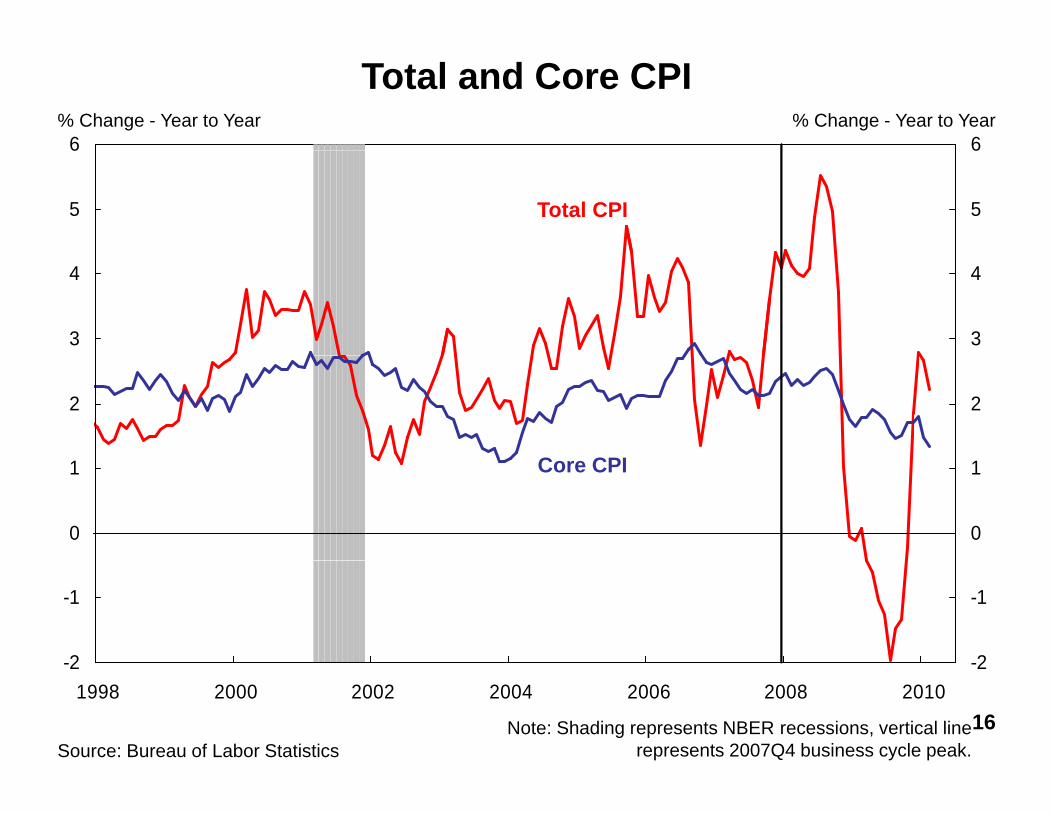
6 6
Total and Core CPI% Change - Year to Year % Change - Year to Year
5
6
5
6
Total CPI
3
4
3
4
2 2
C CPI
0
1
0
1Core CPI
-2
-1
-2
-1
-21998 2000 2002 2004 2006 2008 2010
-2
Source: Bureau of Labor Statistics16Note: Shading represents NBER recessions, vertical line
represents 2007Q4 business cycle peak.

6-Month % Change - Annualized
Exports and Industrial Production6-Month % Change - Annualized
20
30
10
15
Exports (left axis)
10
0
5
-10
0
-5Industrial Production: Manufacturing
(right axis)
-20-15
-10(right axis)
-40
-30
-25
-20
-401995 1997 1999 2001 2003 2005 2007 2009
-25
Source: Federal Reserve Board and Census Bureau
17Note: Shading represents NBER recessions, vertical line
represents 2007Q4 business cycle peak.

Net Worth over Disposable Personal IncomePercent Percent
650
700
650
700
600
650
600
650Net Worth/DPI
550 550
500 500
400
450
400
450
4001960 1965 1970 1975 1980 1985 1990 1995 2000 2005 2010
400
Source: Federal Reserve Board18Note: Shading represents NBER recessions, vertical line
represents 2007Q4 business cycle peak.

30 30Percent Percent
Household Liabilities as a Percent of Net Worth
25 25
A
20 20
Average over last 10 years
15 15
10 10101970 1976 1982 1988 1994 2000 2006
10
Source: Federal Reserve Board19Note: Shading represents NBER recessions, vertical line
represents 2007Q4 business cycle peak.

MBA Purchase Mortgage Applications and Existing Home SalesIndex Thousands
450
500 8000Purchase Loan
Applications (left axis)
400
450
7000
(left axis)
350 6000
300
5000
Existing Home Sales (right axis)
200
250
40002001999 2001 2003 2005 2007 2009
4000
Source: Mortgage Bankers Association, National Association of Realtors
20Note: Shading represents NBER recessions, vertical line
represents 2007Q4 business cycle peak.

3.5 12
Percent PercentVacancy Rates
3.0
2.5
10
Rental Vacancy Rate (right axis)
2.0 8
1.5
6Homeowner Vacancy
0 5
1.0
4
Rate (left axis)
0.51970 1976 1982 1988 1994 2000 2006
4
Source: Census Bureau21Note: Shading represents NBER recessions, vertical line
represents 2007Q4 business cycle peak.
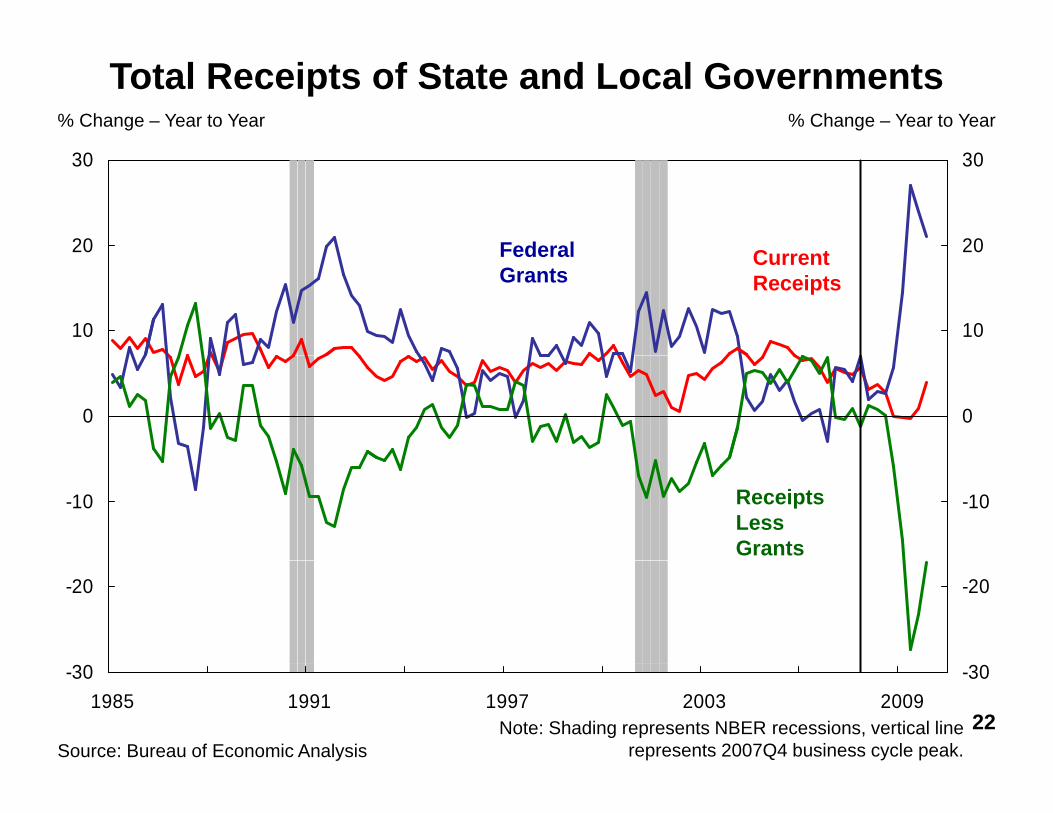
Total Receipts of State and Local Governments% Change – Year to Year % Change – Year to Year
20
30
20
30
Federal C t
10 10
Federal Grants
Current Receipts
0 0
-10 -10Receipts Less Grants
-20 -20
-301985 1991 1997 2003 2009
-30
Source: Bureau of Economic Analysis22Note: Shading represents NBER recessions, vertical line
represents 2007Q4 business cycle peak.

30 302-qtr % Change - Annualized 2-qtr % Change - Annualized
Real Imports and Exports
20 20E t
10 10
Imports Exports
0 0
-10 -10
30
-20
30
-20
-301999 2001 2003 2005 2007 2009
-30
Source: Bureau of Economic Analysis23Note: Shading represents NBER recessions, vertical line
represents 2007Q4 business cycle peak.

0.14 0.14Ratio Ratio
Corporate Profits as a Fraction of National Income
0.12 0.12
0.10 0.10
0.08 0.08
0 06 0 060.061960 1965 1970 1975 1980 1985 1990 1995 2000 2005 2010
0.06
Source: Bureau of Economic AnalysisNote: Shading represents NBER recessions, vertical line
represents 2007Q4 business cycle peak.24

0.12 0.12Ratio RatioCorporate Net Cash Flow as a Fraction of Nominal GDP
0.10 0.10
0.08 0.08
0 06 0 060.061960 1965 1970 1975 1980 1985 1990 1995 2000 2005 2010
0.06
Source: Bureau of Economic AnalysisNote: Shading represents NBER recessions, vertical line
represents 2007Q4 business cycle peak.25
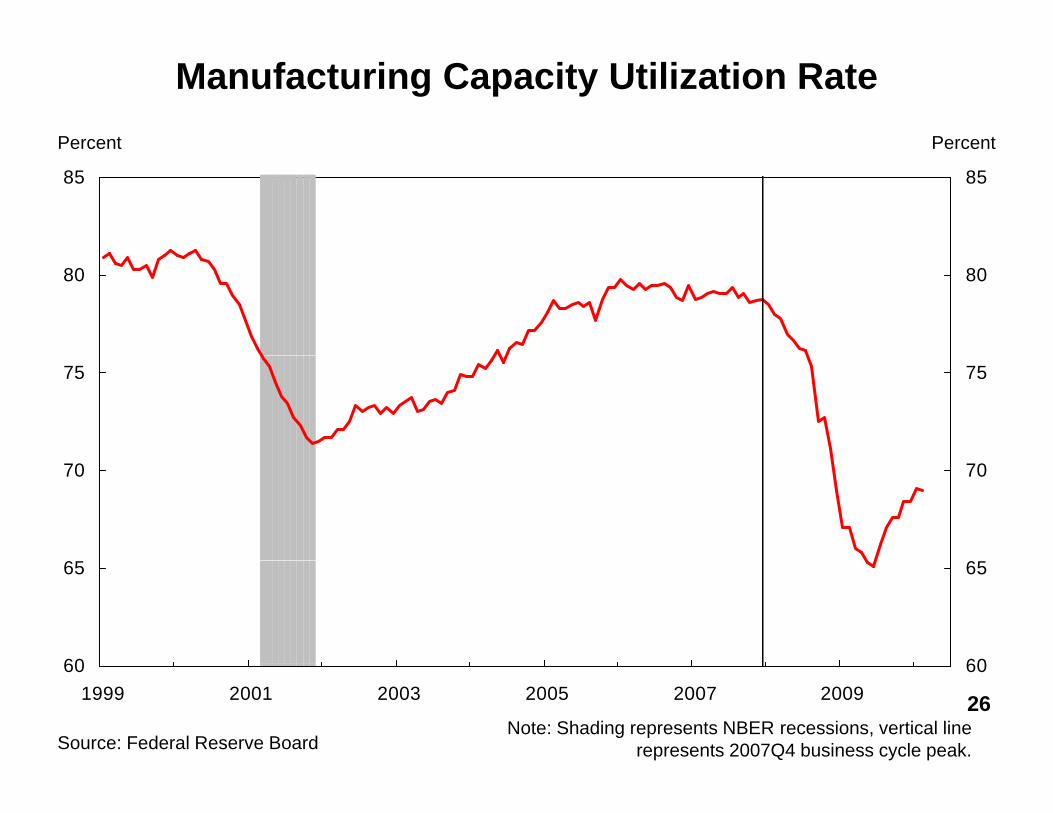
Manufacturing Capacity Utilization RatePercent Percent
85 85
80 80
75 75
70 70
60
65
60
65
601999 2001 2003 2005 2007 2009
60
Source: Federal Reserve BoardNote: Shading represents NBER recessions, vertical line
represents 2007Q4 business cycle peak.
26

5 0 5 0
Rent Inflation% Change - Year to Year % Change - Year to Year
4 0
4.5
5.0
4 0
4.5
5.0
3 0
3.5
4.0
3 0
3.5
4.0Tenant Rent (8%)
2 0
2.5
3.0
2 0
2.5
3.0
Owners'
1 0
1.5
2.0
1 0
1.5
2.0Equivalent Rent
(31%)
0.0
0.5
1.0
0.0
0.5
1.0
0.01996 1998 2000 2002 2004 2006 2008 2010
0.0
Source: Bureau of Labor Statistics27
Note: Shading represents NBER recessions, vertical line represents 2007Q4 business cycle peak.
Numbers in parentheses represent share of core CPI.

1003Productivity, Compensation, and Unit Labor CostsNonfarm Business Sector
% Change - Year to Year% Change - Year to Year
8
10
8
10
4
6
4
6Compensation per Hour
2
4
2
4
-2
0
-2
0Output per Hour
-4 -4Unit Labor Costs
-61999 2001 2003 2005 2007 2009
-6
Source: Bureau of Labor Statistics28Note: Shading represents NBER recessions, vertical line
represents 2007Q4 business cycle peak.

4 0 4 0
TIPS Implied Inflation Compensation: 2-3, 4-5, 5-10 Year HorizonsPercent Percent
3 0
3.5
4.0
3 0
3.5
4.0
5-10 YearMar 30:
2.92
2 0
2.5
3.0
2 0
2.5
3.0
4-5 YearMar 30:
2 57
1 0
1.5
2.0
1 0
1.5
2.02-3 Year
2.57Mar 30:
1.92
0 0
0.5
1.0
0 0
0.5
1.0
1 0
-0.5
0.0
1 0
-0.5
0.0
-1.0Jun-07 Aug-07 Nov-07 Feb-08 May-08 Jul-08 Oct-08 Jan-09 Apr-09 Jun-09 Sep-09 Dec-09 Mar-10
-1.0
Source: Federal Reserve Board Note: Carry Adjusted.29