the uganda green growth development strategy …...the uganda green growth development strategy,...
TRANSCRIPT

THE UGANDA GREEN GROWTH DEVELOPMENT STRATEGY 2017/18 – 2030/31

"Sustainability is about simultaneously looking after the three Es; the Environment, the Economy and Everyone".1
1 Sustainable Business Team, Government for South West, UK, 2000.

iiiTHE UGANDA GREEN GROWTH DEVELOPMENT STRATEGY, 2017/18 – 2030/31
FOREWORDAs the 2030 Agenda takes effect globally, the Government is taking steps to implement principles such as green growth that are embodied in the Sustainable Development Goals (SDGs). Uganda was among the first countries to mainstream SDGs into its development plan, although a strategy that unpacks green growth into sectoral interventions that can be implemented has yet to be devised. In response, the Government has developed the Uganda Green Growth Development Strategy (UGGDS) to operationalize green growth principles and accelerate the implementation of global development goals, Uganda Vision 2040 and the second National Development Plan (NDP II).
With principles such as resource efficiency, equity and social inclusiveness, low emissions and sustainable economic growth, green growth presents an innovative growth path that simultaneously generates inclusive economic development and environment sustainability. As Agenda 2030 stipulates, no development target (Vision or NDP target) should be achieved while leaving out some sections of society. Social inclusiveness should shape all development efforts. The UGGDS goal is to achieve an inclusive low emissions economic growth process that emphasizes effective and efficient use of natural, human and physical capital while ensuring that natural assets continue to provide for present and future generations.
The UGGDS focuses on five core catalytic investment areas of agriculture, natural capital management, green cities (urban development), transport and energy. The envisaged outcomes of the UGGDS implementation are: income and livelihoods enhancement; decent green jobs; climate change adaptation and mitigation; sustainable environment and natural resources management; food and nutrition security; resource use efficiency; and social inclusiveness and economic transformation at the sub-national and national levels.
I urge all state and non-state actors (Government, CSOs, the private sector and development partners) to rally behind the implementation of the UGGDS by mainstreaming the recommended green growth interventions into their planning and budgeting frameworks.
I appreciate the concerted efforts of Government, civil society, the private sector and development partners who have contributed to the development of the UGGDS through the National Task Force. The drafting process was led by a multi-sectoral Task Force chaired by the National Planning Authority (NPA) in partnership with the Climate Change Department. I further thank the United Nations Development Programme (UNDP) for supporting the National Task Force financially. The Global Green Growth Institute is also appreciated for technically supporting the development of the UGGDS implementation roadmap and its costing annexed hereto. The NPA commits to continue partnering with the United Nations and other development partners in the transition towards a green economy.
Kisamba-Mugerwa (PhD)Chairperson, National Planning Authority (NPA)

iv ACKNOWLEDGEMENTS
ACKNOWLEDGEMENTS The Government of Uganda through the National Planning Authority (NPA), the Climate Change Department (CCD) of the Ministry of Water and Environment (MWE) and the Ministry of Finance, Planning and Economic Development (MFPED) thanks the Ministries, Departments and Agencies (MDAs) of Government, civil society organizations (CSOs), the private sector and development partners for their contributions towards the development of the Uganda Green Growth Development Strategy (UGGDS). Special thanks are extended to the United Nations Development Programme, Low Emissions Capacity Building Programme (UNDP, LECB) for the financial and technical support provided towards the completion of this strategy. The following institutions are specially acknowledged for their contribution to taskforces, steering committees, stakeholder consultation and expert review for the UGGDS:
National Planning Authority (NPA)
Ministry of Finance Planning and Economic Development (MFPED)
Climate Change Department (CCD)
Ministry of Water and Environment (MWE)
Ministry of Gender Labour and Social Development (MoGLSD)
Ministry of Agriculture, Animal Industry and Fisheries (MAAIF)
Ministry of Tourism, Wildlife and Antiquities (MTWA)
Ministry of Works and Transport (MoWT)
Ministry of Energy and Mineral Development (MEMD)
National Environment Management Authority (NEMA)
National Forestry Authority (NFA)
Uganda Cleaner Production Centre (UCPC)
Uganda Manufacturers’ Association (UMA)
The Climate Action Network (CAN) Uganda
Environmental Management for Livelihoods Improvement – Bwaise Facility
United Nations Development Programme (UNDP)
Global Green Growth Institute (GGGI)
All district and local governments in Uganda
Kampala Capital City Authority (KCCA)
Economic Policy Research Center

1THE UGANDA GREEN GROWTH DEVELOPMENT STRATEGY, 2017/18 – 2030/31
TABLE OF CONTENTS
List of Tables 3
List of Figures 4
Acronyms 5
Executive Summary 7
1. Introduction 11
1.1 Background 11
1.2 Context of Green Growth and Development 12
1.3 Conceptual Framework for Green Growth 13
1.4 Objectives of the UGGDS 14
1.5 Methodology for Design and Flow of the UGGDS 15
2. The Challenge and Opportunity of Green Growth 16
2.1 The Challenge 16
2.2 The Opportunity to Adopt a Green Growth Approach to Development 17
2.3 Why Green Growth for Uganda? 17
2.3 Status of the Green Growth / Economy 19
2.3.1 Climate Change Actions 19
2.3.2 Biodiversity Conservation and Natural Resource Management 20
2.3.3 Sustainable Land Management 20
2.3.4 Sustainable Energy 22
2.3.5 Sustainable Transport Options 23
2.3.6 Cities and Urban Development 24
2.3.7 Agriculture 25
2.3.8 Status of Policy and Financing Instruments for Green Growth 26
2.4 Opportunities for Green Growth and Development in Uganda 34
2.4.1 Agriculture 34
2.4.2 Natural Capital Management 36
2.4.3 Planned Green Cities 39
2.4.4 Sustainable Transport 40
2.4.5 Energy for Sustainable Livelihoods and Development 41

2 TABLE OF CONTENTS
3. Green Growth Development Strategic Framework 44
3.1 UGGDS Strategic Direction 44
3.2 Green Growth and Development Strategies 46
3.3 The Results Framework 48
3.3.1 Baselines and assumptions and targets outcomes proposed. 48
3.3.2 Target Outcomes 51
4. Enabling Arrangements 57
4.1 Institutional Arrangements and Governance 57
4.2 Resource Mobilization 59
4.3 Macroeconomic conditions 60
4.4 Shift in government expenditure 60
4.5 More effective enforcement of legislation 60
4.6 Education and Training 61
4.7 Resource and Land Rights Regimes 61
4.8 Creating Enabling Conditions for Psychological and Behaviour Change 61
4.9 Facilitating Businesses to Integrate Sustainability and Equity Concerns 61
4.10 Generate Appropriate Data, Statistics and Policy Support Information. 62
5. Road Map For Implementation 63
5.1 Getting started 63
5.1.1 Mobilizing for Action (2017/18-2020/21) 63
5.1.2 Consolidated Best Practices for Green Growth Interventions (2017/18-2020/21) 63
5.1.3 Programme Design and Resource Mobilization Arrangements (2017/18-2020/21) 64
5.2 Implementing Strategies of UGGDS (2020/21-2030/31) 64
References 70
Annexes 76
Annex 1: GHG Emissions Reduction Potential Used in Results Framework 76
Annex 2: Agriculture 77
Annex 3: Indicative Costing of the Uganda Green Growth Development Strategy 79

3THE UGANDA GREEN GROWTH DEVELOPMENT STRATEGY, 2017/18 – 2030/31
LIST OF TABLESTable 1: Target practices/technologies to be scaled up in target agro-ecological zones 21
Table 2: Energy balance for Uganda 22
Table 3: Sustainability Financing Opportunities 27
Table 4: Million UGX of imports, between 2011 and 2015 35
Table 5: Urban and rural populations and rates of annual changes 39
Table 6: Number of urban centres by type and urban population, 1991 - 2016 40
Table 7: NDP and Vision 2040 electricity targets 42
Table 8: Proposed nuclear generation plan 43
Table 9: A summary of target outcomes 52
Table 10: Results Framework - Planned Outcomes of the UGGDS 53
Table 11: Matrix of monitoring and evaluation framework 65
Table 12: Public investment costs required to implement the UGGDS 80
Table 13: Public investment costs for each of the Core Areas of the UGGDS 80
Table 14: List of interventions by the Core Areas of the UGGDS 81
Table 15: Estimated public investment costs for each intervention 83
Table 16: List of external project financing relevant to the UGGDS for FY2016/17 86

4 LIST OF FIGURES
LIST OF FIGURESFigure 1: Conceptual frame work for Green Growth Development Strategy 14
Figure 2: Flow process of the Green Growth framework in Uganda 45
Figure 3: Proposed institutional framework for Uganda’s Green Growth Development Strategy 58
Figure 4: Implementation path for Uganda’s green growth development strategy 63
Figure 5: Maize yield gap percentage to yield realised with optimal water content 77
Figure 6: Rice yield gap percentage to yield realised with optimal water content 78
Figure 7: Millet yield gap percentage to yield realised with optimal water content 79

5THE UGANDA GREEN GROWTH DEVELOPMENT STRATEGY, 2017/18 – 2030/31
ACRONYMSAfDB African Development Bank
ASSP Agriculture Sector Strategic Plan
BAU Business as Usual
BIOFIN Biodiversity Finance Initiative
CAADP Comprehensive African Agriculture Development Programme
CCD Climate Change Department
CDKN Climate and Development Knowledge Network
CNDPF Comprehensive National Development Planning Framework
DFID Development for International Development of the United Kingdom Government
DRC Democratic Republic of Congo
EMLI Environmental Management for Livelihoods Improvement – Bwaise Facility
EPRC Economic Policy Research Centre
ERA Electricity Regulatory Authority
GETFIT Global Energy Transfer Food-in-Tariff
GDeVP Grid Development Plan
GGGI Global Green Growth Institute
GKMA Greater Kampala Metropolitan Area
GoU Government of Uganda
GTZ German Technical Cooperate Agency
ICT information communication and technology
IFPRI International Food Policy Research Institute
JLOS Justice Law and Order Sectors
KCCA Kampala Capital City Authority
MAAIF Ministry of Agriculture, Animal Industry and Fisheries
MDAs Ministries, Departments and Agencies
M&E Monitoring and Evaluation
MEMD Ministry of Energy and Mineral Development
MFPED Ministry of Finance Planning and Economic Development
MLHUD Ministry of Lands, Housing and Urban Development
MoGLSD Ministry of Gender, Labour and Social Development
MoWT Ministry of Works and Transport
MTIC Ministry of Trade, Industry and Cooperatives

6 ACRONYMS
MTWA Ministry of Tourism, Wildlife and Antiquities
MWE Ministry of Water and Environment
NARO National Agricultural Research organization
NBSAP National Biodiversity Stratgey Action Plan
NCE New Climate Economy
NDCs National Development Plan
NDP Nationally Determined Contributions to climate change mitigation
NEMA National Environment Management Authority
NEPAD New Economic Partnership for African Development
NFA National Forestry Authority
NPA National Planning Authority
OECD Organisation for Economic Cooperation and Development
SEEA System of Environmental Economic Accounts
SGR Standard Gauge Railway
SLM Sustainalbe Land Management
SNA System of National Accounts
UBOS Uganda Bureau of Statistics
UCPC Uganda Cleaner Production Centre
UEDCL Uganda Electricity Distribution Company Limited
UEGCL Uganda Electricity Generation Company Limited
UETCL Uganda Electricity Transmission Company Limited
UGDS Uganda Green Growth Development Strategy
UIA Uganda Investment Authority
UMA Uganda Manufacturers’ Association
UNRA Uganda National Roads Authority
UNDP United Nations Development Programme
UNFCC United Nations Framework Convention on Climate Change
USAID-EMOS United States Agency for International Development -Environment Management for oil/gas
U-SIF-SLM Uganda Strategic Investment Framework for Sustainable Land Management
UWA Uganda Wildlife Authority

7THE UGANDA GREEN GROWTH DEVELOPMENT STRATEGY, 2017/18 – 2030/31
EXECUTIVE SUMMARY
The 2030 Transformative Agenda on Sustainable Development that is defined by 17 Sustainable Development Goals (SDGs) presents an opportunity for Uganda to renew its commitment to sustainable development principles. Sustainable development is a basic principle that runs through the Uganda Vision 2040, the second National Development Plan and the 1995 Constitution of the Republic of Uganda. As the country rallies behind transforming from a peasant to a modern and prosperous country by 2040, the Government is taking steps to ensure that this transformation is cognizant of green growth tenets stipulated by all the SDGs, the 2015 Paris Agreement on Climate Change and the 2063 Agenda of the African Union. This implies that the envisaged economic growth must not only be socially inclusive but also uphold the integrity of the environment and natural resources. Over the last two decades, Uganda has registered an impressive 7 percent annual economic growth rate contributing to a decline in income poverty from 56 percent in 1991 to 19 percent in 2015, a rise in life expectancy from 48.1 years to 63.3 years and an increase in electricity access from 5.6 percent to 20.4 percent over the same period. This impressive performance notwithstanding, challenges such as unemployment, income inequalities and regional imbalances, and environmental degradation persist.
For this reason, Uganda will need to reconsider its growth model to deliver inclusive economic and social outcomes while protecting natural capital, addressing climate change, creating jobs and accelerating economic growth. The green growth model, also referred to as the vehicle for sustainable development, presents an approach that addresses these multi-dimensional development needs simultaneously. The 2030 Agenda on Sustainable Development provides the global context for green growth. While the broad principles of green growth run through the Uganda Vision 2040 and the second National Development Plan, they need to be unpacked into strategies and interventions that can be implemented to deliver the desired outcomes. The Uganda Green Growth Development Strategy has therefore been developed to operationalize the broad green growth tenets highlighted in Agenda 2030, the Uganda Vision 2040 and the NDPII (2015/16-2019/20) to support the country’s accelerated transition to middle-income status.

8 EXECUTIVE SUMMARY
The Uganda Green Growth Development Strategy (UGGDS 2017/18 –2029/30) aims to ensure that the goals of the Uganda Vision 2040 and the NDPII 2015/16-2019/20 are attained in a sustainable manner. Although there is no global common definition of green growth, in Uganda’s context, green growth is defined as an inclusive low emissions economic growth process that emphasizes effective and efficient use of the country’s natural, human, and physical capital while ensuring that natural assets continue to provide for present and future generations. Empirical macroeconomic sector modeling indicates that full implementation of the UGGDS interventions (green growth scenario) will enhance national GDP by 10 percent beyond the business as usual (BAU) target, deliver an additional 4 million green jobs and reduce greenhouse gas emissions by 28 percent relative to the conventional growth pathway.
The general objective of the UGGDS is to provide guidance on priorities, strategies and governance frameworks for implementing the green growth principles within the existing development frameworks towards the sustainable development of the country.
Specifically, the UGGDS seeks to:
i. Accelerate economic growth and raise per capita income through targeted investments in priority sectors with the highest green growth multiplier effects;
ii. Achieve inclusive economic growth along with poverty reduction, improved human welfare and employment creation;
iii. Ensure that the social and economic transition is achieved through a low carbon development pathway that safeguards the integrity of the environment and natural resources.
The UGGDS has five focus areas whose selection was informed by empirical macroeconomic analytical studies that identified the areas with the highest green growth potential in terms of investments and contribution to the achievement of national development goals and targets. The focus areas are;
i. Sustainable agriculture production through upgrading the value chain of strategic commodities and enterprises with a focus on irrigation and integrated soil fertility management.
ii. Natural capital management and development which focuses on tourism development, sustainable forestry, wetlands and optimal water resources management;
iii. Planned urbanization and development of green cities (comprehensive economic physical planning and sustainable procurement and interlinkage between the rural raw materials production base and industrial production in cities);
iv. Sustainable transport with a concentration on multi-modal and mass transport systems for urban areas and development, utilization and interconnectivity of planned national and regional transport connectivity; and
v. Energy for green growth with increased emphasis on renewable energy investment through biomass energy for electricity and improved technology for enhanced efficiency in using biomass for domestic and industrial uses, enhancing solar power potential for on-grid, exploitation of geothermal energy and reinforcement of environmental, health and economic safeguards for energy generation.

9THE UGANDA GREEN GROWTH DEVELOPMENT STRATEGY, 2017/18 – 2030/31
Implementation of the UGGDS is expected to generate eight development outcomes by 2030 and these are:
i. Income and livelihoods enhancement;
ii. Decent green jobs;
iii. Climate change mitigation and adaptation;
iv. Environment and natural resources management;
v. Food and nutrition security;
vi. Resource use efficiency;
vii. Social inclusiveness; and
viii. Economic transformation at national and sub-national level.
These outcomes were used as the criteria for appraising the various strategies and interventions in the UGGDS.
The smooth implementation of the UGGDS to facilitate national transition to a green economy is based on the following conditions:
i. Stable macroeconomic conditions, with the GDP growth rate ranging between 5 and 10 perent per annum sustained in the medium to long term;
ii. Shifting government expenditure, especially public procurements, towards value chains that encourage sustainable consumption and production;
iii. Effective enforcement of legislation;
iv. Structural changes that impart new knowledge and skills to government, decision makers, professionals and workers, down to local levels;
v. Improved resource and land rights to increase access to resources for producers and developers;
vi. Enabling conditions for psychological and behaviour change;
vii. Facilitating businesses to integrate sustainability and equity concerns.
viii. A gradual decline in population growth rate from the current 3 per cent to the envisaged 2.4 percent by 2040.
The UGGDS is to be implemented within the existing institutional framework, based on three pillars:
i. National Green Growth Governance and Coordination Frameworks to provide regulatory oversight and support to ensure that the macroeconomic and sustainability drivers and policies will guide the activities of all actors, including the private sector.
ii. Multisectoral Implementation (MDAs, District Local Governments (DGAs), urban authorities, civil society, and development partners) through integration in their planning and budgeting tools.
iii. Microlevel implementation landscapes including cooperative groups.

10 EXECUTIVE SUMMARY
The resource mobilization strategy for the UGGDS is informed by the following six funding sources:
i. Public sector allocation and environmental fiscal reform and subsidy reforms;
ii. Sustainable public procurement;
iii. International funding:
iv. Sustainable production and trade and inclusive green social enterprises;
v. Green energy investments; and
vi. Incentives and green innovations.
The UGGDS will be implemented in two parts. An initial period from FY2017/18 to FY2020/21 (1 July-30 June) will be used for consolidating best practices for a green economy, capacity-building and awareness creation, programme and project design and resource mobilization. Full scale implementation is for the period between FY2020/21 and FY2030/31. The strategy will be integrated into the implementation of the 10-year National Development Plan 2020/21 to 2030/31, NDP III (2020/21-2024/25) and NDP IV (2025/26-2030/31). A detailed action plan and costing that sequences and unpacks the UGGDS strategies into actions for implementation has been prepared and is an annex document for the UGGDS.

11THE UGANDA GREEN GROWTH DEVELOPMENT STRATEGY, 2017/18 – 2030/31
1 INTRODUCTION
1.1 Background
The Government of Uganda has demonstrated a commitment towards the principles of green growth and sustainable development as indicated in various legal, policy and planning and institutional frameworks. The 1995 Uganda Constitution provides for sustainable development and public awareness about effective management of natural resources. The Uganda Vision 2040 aspires to transform Uganda from a peasant to modern and prosperous country by 2040 through strengthening fundamentals to harness existing opportunities. It further acknowledges that green growth is the approach desired for implementation of sustainable development and wealth creation. Similarly, the second National Development Plan 2015/16-2019/20 (NDP II) seeks to strengthen Uganda’s competitiveness for sustainable wealth creation, employment and inclusive growth, and achieve lower middle income status by 2020 with a per capita income of US$ 1,039. The Uganda Green Growth Development Strategy (UGGDS) is one of the steps that must be taken to achieve the envisaged transformation in an inclusive and environmentally sustainable way.
Uganda has achieved various milestones on social, economic and environmental targets. For example, between 1991 and 2015:
Income poverty fell from 56 percent to 19 percent;
The percentage of the national budget funded from domestic sources increased from 64.7 percent to 82 percent;
Literacy levels rose from 54.0 percent to 72.2 percent;
Life expectancy rose from 48.1 63.3 years; and
Access to electricity grew from 5.6 percent to 20.4 percent.

12 INTRODUCTION
These achievements notwithstanding, Uganda still faces development challenges such as high levels of unemployment, income and regional inequality, high costs of production mainly driven by human and technological inefficiencies, external shocks caused by a slowdown in global growth, impacts of climate change and deteriorating natural capital driven by falling forest and wetland coverage as a percentage of the total land area. For instance, forests and wetlands continue to disappear at alarming rate, mainly because of their direct consumption use value. Specifically, the forest cover as a percentage of the total land area has fallen from 24 percent in 1990 to 14 percent by 2015.
Cognizant of the above challenges, Uganda seeks to pursue a green growth development path in line with national, regional and global commitments such as the Sustainable Development Goals and the 2015 Paris Agreement on Climate Change. The 2030 Transformative Agenda on Sustainable Development highlights the transition to a green economy as the vehicle for sustainable development with associated benefits such as poverty alleviation, sustained economic growth, social inclusion, climate change adaptation and mitigation, improving human welfare and creating opportunities for decent work for all, while maintaining the healthy functioning of the planet, also referred to as the earth’s ecosystems.
The UGGDS has therefore been developed as a tool to reconcile the existing economic, social and environment conflicts and facilitate the achievement of economic, social and environment targets simultaneously. The UGGDS is expected to optimize the potential, maximize the benefits, and minimize the costs of the country’s economic growth pathway. It is noteworthy that the UGGDS is anchored in Uganda’s policy and development planning frameworks, notably the Uganda Vision 2040 and the second National Development Plan (NDPII) (2015/16 – 2019/20) as embodied in the Comprehensive National Development Framework.
1.2 Context of Green Growth and Development
Globally, the 2030 Transformative Agenda on Sustainable Development is the guiding framework for green growth. The five principles of the 2030 Agenda—Planet, Prosperity, People, Peace and Partnership— are aligned with the three pillars (economic, social and environmental) of sustainable development. It should be noted that the 2030 Agenda was informed by the Rio+20 Outcome document on the “Future that we want” developed in 2012, which rallied all countries to pursue green growth as a means to sustainable development. This translated into the mainstreaming of sustainable development principles in Uganda’s development framework. While there is no internationally agreed definition of green growth, there are a number of principles that must define and govern the green growth approach to development. Key among these are: sustained economic growth; resource use efficiency; climate change response through adaptation and mitigation; creation of decent green jobs; and human wellbeing and social inclusiveness. Green growth/economy definitions have been advanced by a number of global players as enumerated below:
i. The OECD: defines Green Growth as “fostering economic growth and development, while ensuring that natural assets continue to provide the resources and environmental services on which our well-being relies.”
ii. World Bank: Green growth is growth “that is efficient in its use of natural resources, clean in that it minimizes pollution and environmental impacts, and resilient in that it accounts for natural hazards and the role of environmental management and natural capital in preventing physical disasters.”

13THE UGANDA GREEN GROWTH DEVELOPMENT STRATEGY, 2017/18 – 2030/31
iii. African Development Bank (AfDB): Defines green growth as “the promotion and maximisation of opportunities for economic growth through building resilience, managing natural assets effieicntly and sustainably including enhancing agricultural productivity, and promoting sustainable infrastructure”
iv. UNEP: Defines a green economy as a “system of economic activities related to the production, distribution and consumption of goods and services that result in improved human well-being over the long term, while not exposing future generations to significant environmental risks and ecological scarcities.”
v. United Nations Economic and Social Commission for Asia and the Pacific (UNESCAP): Green growth is “growth that emphasizes environmentally sustainable economic progress to foster low-carbon, socially inclusive development.”
In light of Uganda’s development needs, green growth will be defined as an inclusive low emissions economic growth process that emphasizes effective and efficient use of the country’s natural, human, and physical capital while ensuring that natural assets continue to provide for present and future generations.
The UGGDS seeks to unpack the broad principles of green growth espoused in the 2030 Agenda, Uganda Vision 2040 and the NDP II into key intervention areas that can be implemented. Additionally, the UGGDS is an opportunity to use the additional efficiency and resource maintenance capacity generated to accelerate the country’s economic growth towards the achievement of middle income status targets set in NDP II and the Uganda Vision 2040. The envisaged eight outcomes of the Uganda Green Growth Development Strategy will contribute directly to the implementation of the five principles of the 2030 Agenda on Sustainable Development. The eight outcomes entail; income and livelihood enhancement; decent green jobs; climate change adaptation and mitigation; environment and natural resources management; food and nutritional security; resource use efficiency; and social inclusiveness and economic transformation at national and local level.
1.3 Conceptual Framework for Green Growth
Figure 1 illustrates the conceptual framework of the UGGDS, which is designed to guide and govern green growth investments in the country. This conceptual framework is based on resource exploitation through production, consumption and efficiency in distribution.
The conventional/current development approach allocates minimal effort to resource maintenance during exploitation, production and consumption and the resulting inefficiencies. Consequently, there is significant slack in production, distribution and consumption that derails economic transformation. Minimal resource maintenance reduces the base of economic activity and builds up large future costs for restoring natural systems. The green growth conceptual framework suggests that redressing these gaps ensures use of the additional efficiencies and capacity to accelerate economic transformation.

14 INTRODUCTION
Figure 1: Conceptual framework for Green Growth Development Strategy
1.4 Objectives of the UGGDS
Main objective:
To provide guidance and describe the governance framework on priorities and strategic interventions for implementation of the green economy, green growth and development in Uganda.
Specific objectives:
i. Accelerate economic growth and raise per capita income through targeted investments in the priority sectors with the highest green growth multiplier effects;
ii. Achieve inclusive economic growth with poverty reduction, improved human welfare and employment creation;
iii. Ensure that social and economic transition is achieved through a low carbon development pathway that safeguards the integrity of the environment and natural resources.
1.5 Methodology for Design and Flow of the UGGDS
The UGGDS was developed through a consultative process led by a multi-sectoral National Task Force comprising state and non-state actors. The institutions that were members of this task force are enumerated on the acknowledgement page. The Task Force held retreats and workshops which were marked by extensive literature reviews, brainstorming sessions and analytical discussions on the green growth definition, goal setting, appraisal of options, considering implementation roadmap and monitoring and evaluation, among other activities.
Resource Maintenance
E�ciency, total factor productivity
Resource Access Production
Consumption DistributionE�ciency
inclusiveness
Improved livelihoods,
re-investment into resources

15THE UGANDA GREEN GROWTH DEVELOPMENT STRATEGY, 2017/18 – 2030/31
It also important to note that the design used existing knowledge and analysis on green growth in the country to develop and unpack the green growth tenets prioritized in the Uganda Vision 2040 and the NDP II. Other key studies that informed the strategy include analyses by: the New Climate Economy (NCE) and the Global Green Growth Institute (GGGI); the Ministry of Water and Environment (MoWE) and the Climate and Development Knowledge Network (CDKN); UNDP: and the National Environment Management Authority (NEMA).

16 THE CHALLENGE AND OPPORTUNITY OF GREEN GROWTH
2 THE CHALLENGE AND OPPORTUNITY OF GREEN GROWTH
2.1 The Challenge
Uganda has achieved an impressive economic growth rate estimated at an annual average of 6.6 percent over the last decade (World Bank 2016). This growth has produced positive changes in the economic, social and environment development indicators as discussed in the preceding chapter. However, this impressive growth has not been inclusive, as demonstrated by the high levels of income inequalities and regional imbalances. The eastern and northern regions of the country continue to lag behind and remain stagnant in terms of income poverty and age dependency levels. Additionally, the growth has mainly been generated by the service sectors, such as banking and finance and telecommunications, which have a low job creation multiplier effect.
Consequently, each unit of economic growth has not resulted in an equivalent increase in the employment rate, thereby contributing to the high levels of unemployment. From the environment perspective, natural resources such as forests and wetlands have shrunk, raising concerns about whether the economic growth was achieved at the expense of the environment and natural resources. National forest coverage as a percentage of total land surface area declined from 24 percent in 1990 to 14 percent in 2015 while national wetlands coverage as a percentage of the total land area declined from 15.6 percent in 1994 to 8 percent in 2014. The impacts of climate change have also plagued Uganda in the form of intense and more frequent prolonged droughts, torrential and poorly distributed rainfall and a rise in temperatures, as demonstrated by a significant reduction in the volume of glaciers on Mountain Rwenzori. Containing these impacts calls for a novel development approach that can sustain the economic growth while improving the social and environment development targets.

17THE UGANDA GREEN GROWTH DEVELOPMENT STRATEGY, 2017/18 – 2030/31
2.2 The Opportunity to Adopt a Green Growth Approach to Development
The challenge discussed in the preceding section presents an opportunity to adopt a growth approach that simultaneously achieves economic and social development while conserving the sustainability and integrity of the environment and natural resources. The archetypal tradeoff between economic development and environmental sustainability is resolved by the green growth development model which simultaneously achieves both. The existing legal, policy and planning framework will underpin the adoption of a green growth development model over the Uganda Vision 2040 period. This lays the ground for developing a strategy on how to operationalize the green growth principles highlighted in the various legal, policy and planning frameworks.
For instance, the second NDP II elaborates macro green growth statements. The NDP II theme is strengthening Uganda’s competitiveness for sustainable wealth creation, employment and inclusive growth. The UGGDS presents an impetus to unpack these broad green growth strategies into actionable areas for implementation.
2.3 Why Green Growth for Uganda?
The major driver for the pursuit of green growth and the development of the Uganda Green Growth Development Strategy is to ensure that the goals and targets of the Uganda Vision 2040 and the NDPII are achieved in a sustainable manner. The UGGDS will provide policy options that enhance and exploit synergies between economic growth, environmental sustainability and social equity. As well as addressing persistent development challenges that seem insurmountable by means of the conventional development model, empirical evidence suggests that accelerated achievement of medium term and long term targets hinges on the transition to green growth. Key among the NDP II and the Uganda Vision 2040 targets are:
I. Accelerating annual economic growth from 5.2 percent (2012/13) to average 6.3 percent per annum by 2019/20 and 7.8 percent by 2040;
II. Increasing per capita income from US$ 743 in 2012/13 to US$1,039 by 2020 and US$9,500 by 2040;
III. Increase forestry coverage from 15 percent in 2010 to 24 percent by 2040;
IV. Reduce population growth rate from 3.2 percent in 2010 to 2.4 percent by 2040; and
V. Increase income distribution (GINI Coefficient) from 0.43 in 2010 to 0.32 by 2040.
Over the NDP II period, wealth creation for the economic transformation is expected to result from economic activity in: agriculture; tourism; mineral oil and gas; environment and natural resources; trade; industry and cooperatives; and infrastructure, among others. These sectors have enormous green growth potential.
A 2016 empirical macroeconomic study of the potential impact of green growth conducted by the Government of Uganda in partnership with the New Climate Economy (NCE) and the Global Green Growth Institute (GGGI) revealed that a green growth strategy is a viable development strategy for Uganda. The study identified agriculture, energy, industry and the urban sector as having the greatest green growth potential with resource productivity, infrastructure investment and innovation being the main potential drivers of growth in these areas. The economic benefits of implementing the transition to green growth scenario over the Uganda Vision 2040 period include boosting GDP by 10 percent above the Business as Usual (BAU) scenario, delivering an additional four million green jobs (clean energy transition, city level infrastructure investments, solar powered irrigation and agroforestry) and reducing future greenhouse gas emissions by 28 percent, equivalent to 30.4 million tons of emissions above the

18 THE CHALLENGE AND OPPORTUNITY OF GREEN GROWTH
national NDC target of 22 percent. This will however come at an additional cost in the short term with long term benefits in the medium and long term.
As earlier noted, growth over the years has not been equally distributed and marred by income inequalities and regional imbalances. One of the principles that govern green growth is social inclusiveness and the transition will address the growing inequality and imbalances. The inclusive aspect of the NDP II, entails reducing poverty levels from 19.7 percent in 2012/13 to 14.2 percent in 2019/20 and less than 5 percent by 2040 (GoU 2015), and increasing the share of the national labour force employed from 75.4 percent to 79 percent and 94 percent from 2012/13 to 2019/20 and 2040, respectively (GoU 2015), by means of regional equalization grants among others.
Uganda aspires to achieve the aforementioned economic and social targets while maintaining the integrity and functionality of its environment, ecosystems and natural resources. It is evident that various environment indicators are on the decline, despite the existence of a supportive policy and institutional framework. Forest cover declined from from 4.9 million ha in 1990 to 1.83 million ha in 2015, a reduction of 3.05 million ha in just 25 years . Wetland resources, particularly in the urban and peri-urban areas have declined considerably from 15.6 per cent of land cover in 1994 to about 8 percent of land cover by 2010 (UNDP and NEMA 2017). The attainment of development priorities at the expense of the environment not only undermines the sustainability of such growth and achievements but also harms the most vulnerable groups who depend on the environment and are at a high risk of being excluded from the development process. This exclusion, coupled with the impacts of climate change, end up compounding poverty and exacerbating the existing economic and environmental scarcities faced by such groups.
Another motivation for the transition to green growth is the impacts of climate change, whose severity is increasing. Climate change impacts, such as poorly distributed torrential rains and intense frequent droughts have harmed infrastructure systems, human health, and agriculture and compounded existing poverty. Green growth provides a tool box of options that address conventional development while also building national resilience against climate change through adaptation and mitigation. The projected damage associated with climate change inaction for agriculture, water, total infrastructure2 and energy (2010-2050) is estimated to cost between US$273 and US$437 billion, equivalent to US$7-US$11 billion per annum (MWE 2015).
Green growth provides for the incorporation of the environment and natural resources into the national accounts to ensure that prices and economic growth metrics reflect the corresponding effect of production processes on the environment. Declining natural capital poses a great threat to sectors such as tourism, forestry and agriculture to mention but a few. Although there some uncertainty about the exact figues, nature based tourism was recognized as having accounted for about 9 percent of GDP in 2012/13. A 2010 study of the forestry sector indicated that forestry may have contributed the equivalent of 8.7 percent of Uganda’s GDP in 2010 (MWE 2016). Adoption of green growth will end the computation of national accounts in a manner that excludes the impact of economic activity on the environment and natural resources.
In relation to the above, the study on the “Contribution of Water Resources Development and Environmental Management to Uganda’s Economy” (Industrial Economics, Incorporated 2016) indicated that water and environment sector investments are capable of yielding significant economy-wide impacts by 2040. The
2 Total infrastructure combines both transport infrastructure and human settlements.

19THE UGANDA GREEN GROWTH DEVELOPMENT STRATEGY, 2017/18 – 2030/31
beneficial effects of these investments result in a 3.5 percent to 3.9 percent difference in GDP between the Business as Usual (BAU) and High Investment scenarios, equivalent to an income improvement of US$120 per capita, above the BAU scenario. The investments required would be approximately US$4.3 billion for water development, and US$4 billion for environmental management for the high scenario over the full 26-year period.
2.3 Status of the Green Growth / Economy
The development of the UGGDS gives direction and contributes to the implementation of the green growth principles. Although the UGGDS is perceived as one of the initial steps of transitioning to green growth and implementing the 2030 Agenda on Sustainable Development, there have been ongoing green growth related initiatives. As already noted, green growth has been mainstreamed into the Uganda Vision 2040 and the NDP II 2015/16-2019/20, both of which informed the strategic direction of the UGGDS. As such, the UGGDS will build on the existing legal, policy, planning and institutional frameworks to advance the green growth transition. Globally, the 2030 Transformative Agenda on Sustainable Development and the Paris Agreement on Climate change provide the umbrella for the green growth transition.
Uganda is implementing the Switch Africa Green project directly, coordinated by the National Environment Management Authority and financially supported by various development partners. The project seeks to ensure resource use efficiency in small and medium enterprises by adopting sustainable consumption and production principles. Emphasis is on re-use, recycle and reduction of production inputs. Secondly, there is a programme that seeks to create green jobs for youths in Uganda. The UGGDS will be the guiding document for all green growth initiatives in the country. The following sections provide a review of the status of green growth in various areas of the economy.
2.3.1 Climate Change Actions
Climate change adaptation and mitigation is a salient component of green growth and Uganda has demonstrated remarkable commitment in its national climate change response. As the Uganda Vision 2040 stipulates, the climate change strategy is to prioritize national resilience through adaptation and mitigation. Uganda is a signatory to the UNFCCC and has mainstreamed climate change in its development framework for effective response. Uganda has a Climate Change Department which coordinates the national climate change response. Some of the current climate change response initiatives that are related to green growth include: creation of an updated inventory of greenhouse gas emissions by sector; preparation of various Nationally Appropriate Mitigation Actions (NAMAs); the community tree planting project which entails distribution of free tree seedlings; development of a national REDD+ strategy; an environmental tax on old vehicles with large emission; addressing the fiduciary requirements to make Uganda qualify for climate finance from the various climate finance windows; distribution of efficient charcoal saving cook stoves; and undertaking studies that quantify the economic cost of the climate change response compared the with the cost of inaction.
Progress in low emissions development and climate change mitigation has demonstrated the critical leverage for sectors such as: energy (particularly wood fuel usage, biomass for energy and hydropower generation): cities and urban areas (specifically in waste management, transport and housing development); agriculture through climate smart agriculture, conversion agriculture and regulating emissions in the agricultural value

20 THE CHALLENGE AND OPPORTUNITY OF GREEN GROWTH
chain: and and industry through energy efficiency and other low emissions activity (GoU 2015). The co-benefits of a low emission development programme have spurred participation, and increased development impact through sustainable production and consumption, and generation of revenue streams.
2.3.2 Biodiversity Conservation and Natural Resource Management
Green growth entails accelerated economic and social development while maintaining the integrity and functionality of ecosystems and biodiversity. The country’s overall framework for biodiversity conservation is the National Biodiversity Strategy Action Plan (NBSAP). The seven strategic areas of the NBSAP are:
i. Strengthening stakeholders’ coordination and frameworks for biodiversity management. This strategic area covers policy, regulations and legislative reforms, institutional and coordination action on the part of actors including MDAs, District Local Governments civil society and development partners.
ii. Facilitate and enhance capacity for research, monitoring, information management and exchange on biodiversity.
iii. Put in pace measures to reduce and manage negative impacts on biodiversity. This role involves direct environmental and natural resource (biodiversity) management.
iv. Sustainable use and equitable sharing of the costs and benefits of biodiversity. The leading examples on sustainable use and sharing are the revenue sharing from gate collections between the Uganda Wildlife Authority (UWA) and parishes (communities) surrounding the national parks. This collaborative resource management arrangement involves designing memorandums of understanding and capacity-building and community liaison to maintain the stewardship role.
v. Enhancing awareness and education in biodiversity issues among the various stakeholders.
vi. Harnessing modern biodiversity technology for socioeconomic development with adequate safety measures for human health and the environment. At the core of modern biotechnology research are innovations for increased agricultural production covering crops like stock and fisheries, investments in tree technologies and medicinal research. The country has a National Biotechnology and Biosafety Bill (2016) on the floor of parliament, which aims to clarify the position on biotechnology biosafety.
vii. Promoting innovative sustainable funding mechanisms to mobilize resources for implement of the NBSAP. Uganda has a biodiversity management funding gap estimated at US$455 million/year. A draft Biodiversity Finance Plan has been developed to provide a strategic direction for the NBSAP, with support from the Biodiversity Finance Initiative (BIOFIN).
2.3.3 Sustainable Land Management
Land is a key strategic asset for Uganda. It constitutes over half of the value of the asset basket of poor Ugandans. However, current farming practices threaten soil fertility. Annual losses of nitrogen potassium and phosphorous are estimated at 85, 75 and 10kg/ha/year.
In 2007, the Government commissioned the Strategic Investment Framework for Sustainable Land Management (U-SIF SLM) with direct support from various development partners. The targets of the U-SIF SLM include (Table 1): (i) development of land sustainability maps and land use plans for at least 75 percent of the

21THE UGANDA GREEN GROWTH DEVELOPMENT STRATEGY, 2017/18 – 2030/31
country; (ii) updating the soils information/mapping for at least 75 percent of the country; (iii) development and operationalization of watershed management plans in at least 15 sites; (iv) rehabilitation/restoration of degraded agricultural landscapes in at least 20 districts; (v) increaseing tree cover on agricultural landscapes through promotion of agro-forestry and afforestation with at least 60 tree nurseries; (vi) strengthening and training 150 cooperative produce and marketing groups in the development of SLM-friendly value chains; (vii) supporting the development of local communities in at least 10 districts to acquire and use efficient charcoal making kilns and assisting 20 schools to acquire energy efficient cook stoves (UNDP 2014).
Table 1: Target practices/technologies to be scaled up in target agro-ecological zones
Targets in the 4 priority zones
Practice Demonstrations Established with
incentives
Established voluntarily
through advice
Integrated Nutrient Management (INM) 1,000 ha 10,000 ha 2,500 ha
Contour bunds 1,000 km 10,000 km 2,500 km
Grass contours/bunds 1,000 km 10,000 km 2,500 km
Intercropping 2,000 ha 20,000 ha 5,000 ha
Mulching 2,000 ha 20,000 ha 5,000 ha
Conservation Agriculture 1,000 ha 20,000 ha 5,000 ha
Agroforestry 1,000 ha 20,000 ha 5,000 ha
Woodlots 1,000 ha 20,000 ha 5,000 ha
Terracing (targets SW & Eastern highlands)
100 ha 1,000 ha 250 ha
Rehabilitation/reclamation of degraded watersheds: 4 sites strategic interventions
200 ha/zone
Shallow wells 50 units 500 units 125 units
Household rainwater harvesting 100 units 1,000 units 250 units
Institutional rainwater harvesting 50 units 500 units 125 units
Run-off/water harvesting from roads, paths
2,000 ha 20,000 ha 5,000 ha
Large surface run-off harvesting reservoir (cattle corridor)
100 units (350m3 with HDPE dam liners valley tanks or check downs)
200 units 50 units
Household energy saving stoves 5,000 units 20,000 units 5,000 units
Institutional energy saving stoves 100 units 1,000 units 250 units
Efficient kilns for charcoal production (cattle corridor)
100 units 500 units 50 unit
Source: UNDP 2014

22 THE CHALLENGE AND OPPORTUNITY OF GREEN GROWTH
The institutional management of U-SIF SLM is held by MAAIF, in cooperation with the Ministry of Lands Housing and Urban Development (MLHUD), Ministry of Water and Environment (MWE), Ministry of Energy and Mineral Development (MEMD) and the Ministry of Trade, Industry and Cooperatives ( MTIC) who jointly developed the strategic investment framework. The SIF-SLM targets four land degradation hotspots/agro-ecological zones across the country. The agro-ecological zones are: (i) South Western and Eastern Highlands, (ii) Lake Victoria Crescent Region, (iii) the cattle corridor, (iv) Eastern and Northern Uganda. The U-SIF SLM will cost US$245.3 million and is financed through general budget support at national and subnational level, private investments by farmers, forest owners and users/and bilateral multi-lateral development partner support (UNDP 2014).
Although agricultural stakeholders are aware of the challenge of unsustainable land management, several factors have been identified that constrain action. The major constraints to adoption of improved technologies and accelerated agricultural commercialization in Uganda include: (i) high transport and energy costs; (ii) limited awareness of farming as a business; (iii) weak linkages of small farmers with value chain actors and rural financial institutions. (World Bank 2010).
2.3.4 Sustainable Energy
Existing green growth energy initiatives include the government commitment to increase the generation of electricity from renewable sources and distribution of efficient cooking stoves. Uganda also boasts a solar plant which contributes 10 MW to the national grid with the potential to triple this production to 30 MW. The plant is situated in Soroti and was launched in January 2017. The energy balance for Uganda is heavily dominated by biomass. Biomass contributes nearly 90 percent of the country’s total consumable energy (MEMD 2015). The dominant forms of biomass are firewood and charcoal which are the primary sources of cooking fuel. Other sources of primary energy are petroleum products and electricity (Table 2).
Table 2: Energy balance for Uganda 2014
Source of energy Contribution %
Biomass (fuel wood) 78.6
Biomass (charcoal) 5.6
Biomass (residues) 4.7
Petroleum products 9.7
Electricity 1.4
Total 100
Source:MEMD 2015.
Electricity is mainly generated from hydropower. Additional contributions are from bagasse co-generation and thermal diesel (MEMD 2015). Uganda’s per capita electricity consumption at 80kWh/year, is far below its peers Kenya at 155kWh/year, and Ghana at 300 kWh/year or the Republic of Korea at 8,502kWh/year (MEMD 2015). Electricity will be critical for Uganda to obtain the growth trajectory and socioeconomic transformation it needs through better access to education, health care, improved quality of life, and personal security among others (MEMD 2015).

23THE UGANDA GREEN GROWTH DEVELOPMENT STRATEGY, 2017/18 – 2030/31
Uganda’s per capita electricity consumption is to grow from 80kWh/capita to 578kWh/capita by 2020 and 3688kWh/capita by 2040. This will require increasing solar power production for the on-grid to 5000 MW by 2030 and generating geothermal power of 450MW by 2030 (GoU 2003). Additionally, current capacity utilization for hydropower plants is low, estimated at 60 percent to 70 percent accompanied by high grid power loss (ERA 2015).
The country’s electricity demand is growing at an annual average rate of 9 percent. It has 850MW of installed capacity, of which approximately 645MW is hydro and 101.5MW is thermal generating capacity (USAID 2016). The Government is building additional large hydropower facilities, including the Karuma Hydropower plant of 600MW and Isimba Fall Hydropower plant of 183MW. In December 2016, the Government announced that a 10MW solar power plant had started generating electricity for the national grid (ERA 2016b). When the generating capacity for sugarcane factories was added the installed capacity was close to 1,000MW. Plans for construction of the 840MW Ayago hydro plant are also under way, as well as several mini hydro structures.
2.3.5 Sustainable Transport Options
The transport sector in Uganda is divided into sub-sectors; road, railway, water and air (MoWT 2016). Road transport is the dominant mode, accounting for over 90 percent of cargo freight and passenger movement.
The road network falls into four categories: national, district, urban and community access roads. By June 2016, 20 percent of road network was paved and 80 percent was unpaved. National roads are managed by the Uganda National Roads Authority (UNRA). The authority also operates 10 ferries located at strategic points that link national roads across major water bodies. District roads total 35,556 km and are the mandated responsibility of District Local Governments (DLGs). Urban roads on the other hand, total about 12,000 km and are managed by urban authorities within whose boundaries they fall, excluding links maintained by UNRA. Community access roads have a current length estimated at 78,000 km and are the responsibility of sub-county local governments. It is estimated that the country has between 700,000 and 1,200,000 vehicles an annual growth rate estimated at 15 percent with motorcycles, the fastest growing category.
The railway transport network in Uganda extends for 1,260km. The Uganda rail track is a meter gauge. The government is in the process of constructing a Standard Gauge Railway (SGR) to improve cargo transportation from the coast in Mombasa (and Dar Es Salaam) and in-country goods transport.
Air transport is dominated by the operations at Entebbe International Airport (EBB). The Government has designated five additional airports as potential entry/exit (international) airports, namely Arua, Gulu, Pakube, Kidepo and Kasese. An addition eight airfields—Soroti, Kisoro, Jinja, Lira, Tororo, Masindi, Mbarara and Moroto—are expected to receive chartered flights. The rest of the upcountry airports are either privately owned or managed by local authorities.
Water transport is modestly developed in Uganda. Nonetheless, most of the main water bodies in the country (Lake Victoria, the River Nile, Lake Albert, Kazinga channel etc.) are navigable and are used by motorized and non-motorized vessels. Railway ferries in Jinja and Port Bell on Lake Victoria connect with railway networks in Mwanza (Tanzania) and Kisumu (Kenya). Large vessels in Lake Victoria operated by the Government and/or under concession, and by private entities include MV Kaawa, MV Kalangala, MV Pearl, MV Amani, MV Sese, and Kalangala Infrastructure Services (KIS). Numerous small craft operating on inland water ways have very poor safety standards and are a continuous source of concern for government and travellers (MoWT 2016).

24 THE CHALLENGE AND OPPORTUNITY OF GREEN GROWTH
Uganda’s Standard Gauge Railway (SGR) is part of the Regional SGR Protocol that obliges the four countries party to Northern Corridor Integration Projects (NCIP) to develop a seamless railway transport system, the Government of Uganda is undertaking its obligations to fulfil its commitments. The SGR Project Management Unit established by Cabinet Minute 107 is developing a modern and efficient railway transport system to address both the freight and passenger transportation needs of the country.
Currently, road trucks carry at least 97 percent of the international freight, resulting in high costs doing business and making Uganda an economically uncompetitive country. By introducing reliable, safe, affordable and efficient railway transport systems, the SGR will occasion a drastic freight transportation model shift from road to rail. This modal shift will reduce the economy’s cost of freight transportation from the seaport of Mombasa by 69 percent from the current average of US16 cents/ton/km to an average of US5 cents per ton/km. This will save the economy over US$2 billion annually in transport costs. Importantly, it will reduce the freight transportation time over land from Mombasa to Kampala from the current average of 10-14 days to just one day.
The Project is developing two types of railway systems:
I. The main SGR line – for both freight and passengers. The main SGR routes comprise; the Eastern route from Malaba to Kampala, The Northern route from Tororo via Gulu to Packwach -Vurra (at the DR Congo border) and a line going northwards from Gulu to Nimule (at the South Sudan border) as well as the Western & South Western Route from Kampala via Kasese to Mpondwe at the DR Congo border and from Kampala via Mbarara and Bihanga to Mirama Hills (at the Rwanda border).
II. The SGR-LRT (Light Rail Mass Transit): A town service rail system for only passengers to cater for commuters within the city and the Greater Kampala Metropolitan Area (GKMA) – especially in high traffic areas. The first phase of LRT routes cover 40KM route length, radiating from the current Kampala Railway Station and cover Kampala to Namanve, Kampala to Kajjansi, Kampala to Kawempe (Ttula), and Kampala to Kyengera. This will reduce the current travel time in these high traffic areas. The two railway systems will drastically improve the transport situation in the country, and reduce the transportation costs and transit time currently spent on the roads by over 70 percent (GoU 2016).
2.3.6 Cities and Urban Development
An assessment of the requirements for promotion of green urban development in Kampala City (World Bank 2015) found that inadequate and ineffective planning has been a key obstacle to providing the management required to protect the city’s environmental assets. For decades, the city has lacked an effective physical development plan to guide growth and development. Historically, there has been sectoral planning in silos, each with separate goals, targets and planning horizons. New procedures are underway to establish a more integrated urban planning approach. This will be essential to implementing more sustainable solutions. The stakeholder engagement process can be developed to bring a broad array of considerations into the planning process. Little protection for the city’s environmental assets has been afforded under the current regulatory regime. Environmental regulations have created the enabling framework for protecting the wetlands, but essential actions such as survey and delineation of wetland areas have not been implemented due to the political, social and economic implications of restricting land use.
Cities and municipalities are the principal actors dealing with waste management in the country. Regulations for discharge of effluent, particularly to control industrial discharge, have not been widely enforced, and the enforcement capacity of institutions charged with environmental management is generally limited. The land

25THE UGANDA GREEN GROWTH DEVELOPMENT STRATEGY, 2017/18 – 2030/31
management system requires significant financial outlays for public acquisition of land for infrastructure and service facilities, which constrains delivery of sanitation, solid waste and drainage services. The current system limits the supply of developable land, driving informal development to marginal areas and to environmentally sensitive areas. It distorts the spatial structure of the city and complicates and delays urban planning and development (World Bank 2015).
Kampala city, the country’s major city, is a rapidly growing city. As the built environment continues to expand, it leads to loss of natural resource and ecosystems. Key steps for the future include:
i. Development of a profile of natural assets at the metropolitan scale and a broad strategy to address pressures on these assets;
ii. Identification of specific opportunities for Green Urban Development interventions supported by thorough planning to take these opportunities forwards;
iii. Institutional actions to regulate, enforce and protect assets in line with what is already in current policy and law and the development of more sophisticated measures to address ecosystem loss (World Bank, 2015).
2.3.7 Agriculture
Agriculture accounts for about a quarter of Uganda’s GDP and a great proportion of exports. Nevertheless, the sector is marred by low levels of production and productivity, mainly driven by poor agronomic practices and the impacts of climate change. There has been a consistent increase in allocation of resources to the agriculture sector from UGX378.88 billion in the 2012/13 approved budget (out of the national budget of UGX10.90 trillion) to UGX484.68 billion (out of the national budget of UGX 17.95 trillion). However, this represented a decline in the percentage allocation to MAAIF from 3.4 percent to 2.7 percent in 2012/13 and 2015/16 respectively (NEPAD, 2015).
Over the NDP II 2015/16-2019/20 period, the Government aims to increase agricultural exports to US$4 billion by 2020 from the US$1.3 billion in 2015 and reduce the number of the labour force involved in subsistence production from 6 million in 2012/13 (the majority of whom are women) to 3 million in 2019/20. In this regard, MAAIF’s key focus areas include: increasing production and productivity; addressing challenges in the selected thematic technical areas including critical farm inputs mechanization and water for agricultural production; improving agricultural markets and value addition in the 12 prioritized commodities: and and institutional strengthening for agricultural development.
The Agriculture Sector Strategic Plan (ASSP) is the five-year strategy for the period 2015/16 to 2019/20. It defines the priorities and interventions to be implemented over the five-year period, in response to the national agricultural development priorities presented by MAAIF in the Agriculture Sector Issues Paper approved by the cabinet and subsequently incorporated into NDP II (NEPAD, 2015).
Over the five-year implementation period, activity will focus on four priority areas: (a) increasing production and productivity; (b) addressing challenges in the selected thematic technical areas including critical farm inputs mechanization and water for agricultural production; (c)improving agricultural markets and value addition in the prioritized commodities; and, (d) institutional strengthening for agricultural development. The strategic agricultural commodities for the ASSP are: bananas; beans; rice; tea; coffee; cassava; fruits and vegetables; fish; cocoa; meat (beef, cattle, goats, poultry, and pork); Irish potatos; and oil palm and oil seed crops.

26 THE CHALLENGE AND OPPORTUNITY OF GREEN GROWTH
2.3.8 Status of Policy and Financing Instruments for Green Growth
Table 3 below highlights some of the major financing mechanisms and instruments currently employed for implementing the green economy in Uganda (UNDP and NEMA 2017). There are 14 instrument categories comprising: environmental taxes and levies; compliance charges; local government fees; resource rents; biodiversity, water resources and climate finance instruments; international funds; non-tax revenue; revenue and benefit sharing and resource access; conservation funds; energy standards and voluntary compliance for trade; subsidies; central government transfers; overseas development assistance (ODA); and private sector contributions.
The instruments with the potential to generate the greatest financial resources include the environmental levy and tax, resource rents, energy standards and voluntary compliance for trade, central government transfers and private sector contributions. However, the contribution of these instruments to sustainable development is unclear even. Instruments such as biodiversity, water and climate finance instruments, conservation funds, and revenue and benefit sharing and resource access have enormous potential to bring benefits, particularly poor communities and smallholders.
Public expenditure reviews conducted by the BIOFIN project (UNDP and NEMA 2017) indicate that the performance of local government fees, non-tax revenue, subsidies, compliance charges, and resource rents is neither effective nor efficient. Inadequate resources are collected and often the resources are not used to investment in restoration and sustainable management of natural capital; instead the resources are used in administrative and coordination actions, while the state of the resource declines. Consequently, the revenue streams have also been declining, to the point that they are unable to provide significant contributions to financing of the green economy targets set.

27THE UGANDA GREEN GROWTH DEVELOPMENT STRATEGY, 2017/18 – 2030/31
Table 3: Sustainability Financing Opportunities
Policy/ financing instrument
Legislation and/or policy
Sustainability Outcome Performance of instrument
Environmental Taxes
1. Environmental Levy Public Finance Act 2015
Avoided pollution with heavy metals and chemicals to wetlands, and water catchments and air pollution
The levy is included in the main fiscal Public Finance Act 2015. There is no evidence of its direct and indirect contribution to pollution management. Environmental taxes for oil and gas were proposed but are not yet activated in legislation or action2. Environmental
TaxesOil and gas revenue management policy (2008)
Avoided pollution from spills, waste and industrial activities
Environmental compliance charges
1. Environmental Impact Assessmnet (EIA) fees
EIA Regulations 1998, National Environment Act Cap 153
Compliance with national environmental management standards
The charge systems are expected to be central to the national environmental fiscal reforms and administered by regulatory MDAs.
A Public Expenditure Review (PER), conducted as part of the UNDP/NEMA BIOFIN ,project indicated that there are effectiveness and efficiency concerns in terms of poor generation of revenue, and the allocation of funds to administrative activities and little investment in ecosystem restoration and management (includes the pollution charges, water charges, wetland charges, performance bonds, fines and fees). Comprehensive design, governance and M&E frameworks are needed.
Very little is committed to actions undertaken at District Local Government level.
Some of the charge systems proposed here are not active even though they have been proposed. Biodiversity offsets and economic instruments for the oil and gas sector are still under design and have incomplete enabling legislation (National Environment Bill 2015).
2. Enforcement Fines and Charges
National Environment Act Cap 153
Water Act Cap 153
Penalties for non-compliance with national environmental management standards
3. Economic Instruments for the Oil and gas Sector
Revised National Environment Bill
Incentive and disincentive options for environmental management for the oil and gas sector.
4. Wetland User Permit Fees
National Environment Act Cap 153
Resource use regulation charge levied on communities and other wetland users. In turn the wetland users agree to compliance and enforcement support based on wetland user standards, including penalties and restoration in case of misuse.
5. Wetland Restoration orders
National Environment Act Cap 153; Water Act Cap 153
Penalties to comply to national environmental management standards
6. Biodiversity Offsets Revised National Environment Bill
Compliance with national environmental management standards
7. Water abstraction permit fees
Water Act Cap 152 Resource use regulation charge. Administered by the Directorate of Water Resources Management (DWRM) in MWE
8. Water source protection charge
Water Act Cap 152 Compliance with national environmental management standards

28 THE CHALLENGE AND OPPORTUNITY OF GREEN GROWTH
Policy/ financing instrument
Legislation and/or policy
Sustainability Outcome Performance of instrument
9. Effluent discharge permits fees
Water Act Cap 152 Fees to discharge effluent, and compliance to national pollution discharge standards.
Local Governments – District, City, Municipal, Town & sub-county fees
1. Clean Development Mechanism Programme of Activities (CDM PoA) municipal solid waste project
Local Government Act Cap 234
Aimed at improving solid waste management and producing high quality organic manure for use on farms, also to achieve GHG emissions reductions. CDM PoA can be used for other Greenhouse Gas and environmental challenges, beyond waste management.
An extension of environmental fiscal reforms administered by a combination of MDAs and District Local Governments.
Major governance failures have been cited for fisheries, and timber and wood fuel licences. The PER (UNDP and NEMA 2017) highlights effectiveness and efficiency concerns for these instruments. Nonetheless, these instruments are crucial to sustainable management of natural resources and, when the natural resources and ecosystems are at optimal health, would be able to generate strong finances for management of natural capital.
Additional external funds may be needed to support recovery of these instruments. These would include investment from public-private funding arrangements.
2. Fish levies for boats, fish mongers and fishing licences
Fish (Beach Management) Rules, 2003 (S.I. No. 35 of 2003)
Originally intended to limit fishing to sustainable levels. The instrument has failed and instead increased fishing t and also encouraged illegal fishing practices
3. Charges on timber and wood fuel (licences to harvest timber or produce charcoal, movement permit)
National Forestry and Tree Planting Act, 2003
The charges are aimed at ensuring an accurate record of wood trade and to collect rents for the District Local Governments
The instruments use inadequate measuring tools and the governance process has been abused, encouraging deforestation instead
4. Creation of catchment management organizations/ committees developing catchment management plans
Water Act Cap 152
Catchment Management Guidelines
The country is divided into four water management zones, sub-regional centres, DWRM and catchments created with local management structures.
Resource Rents
1. Minerals and Oil and gas sector resource rents & royalties
Oil and gas revenue management policy (2008)
Mining Act 2003
Returns for resource extraction to government on behalf of citizens.
An assessment (UNDP and NEMA 2017) shows that this instrument can be a major source of capital for national economic growth. There are efficiency concerns with regard to minerals. However, the Government has set up strong institutional and governance arrangements for oil and gas which may help strong recoveries. Similar arrangements are needed for mineral resources.

29THE UGANDA GREEN GROWTH DEVELOPMENT STRATEGY, 2017/18 – 2030/31
Policy/ financing instrument
Legislation and/or policy
Sustainability Outcome Performance of instrument
Biodiversity, Climate and Water Resources Finance Instruments
1. Payments for Environmental Services (PES)
Proposed under Revised National Environment Bill
Incentives for stewards of ecosystems and ecosystem services for actions to conserve functioning of ecosystem
PES is a useful incentive, particularly for biodiversity, water resources and carbon mitigation action in landscapes with smallholder farmers. These incentives may be invaluable in enabling farmers to break even and as an instrument for forest landscape restoration, Wetland management, and soil and land management. However, it is still implemented on a very small scale, largely through NGO-led initiatives. There is very little public/private sector participation.
International Funds
1. Green Climate Fund (proposal)
UNFCCC in support of Rio Multilateral Environment Agreements
Investing in low-emission and climate-resilient development. GCF was established by 194 governments to limit or reduce greenhouse gas (GHG) emissions in developing countries, and to help vulnerable societies adapt to the unavoidable impacts of climate change e.g. wetlands management
International finance is important in providing pilot and catalytic funding for new areas of global and regional goods such as biodiversity, water, carbon sequestration, chemical management, among others.
International finance is the primary finance for biodiversity, water resources, climate change and chemical management action in Uganda.
International finance will continue to be an important source of finance. However, it is critical that these opportunities are appropriately pursued in terms of scale, feasibility and viability. The utilization of international finance has not always been viable in terms of ex-post evaluation (UNDP and NEMA 2017). This therefore renders their use expensive (especially loans but also including grants), and unsustainable. These funds should only and only be used when they are feasible and viable in ex ante and ex post evaluations and an M&E framework should aid the governance frameworks when the funds are unviable.
2. Global Environment Facility (Sustainable Land Management, Territorial Approaches to Climate Change, Albertine Rift Sustainable Environment Management etc.)
Convention on Biological Diversity, UNFCCC, UNCCD
Support implementation biodiversity conservation priorities in the NBSAPs
3. Emissions of Reductions for carbon–CDM, voluntary carbon projects
UNFCCC, National Forestry Policy (2001), National Forestry & Tree Planting Act, 2003
Afforestation and reforestation activities in Natural Forests
4. Emissions of Reductions for carbon– REDD+
UNFCCC, National Forestry Policy (2001), National Forestry & Tree Planting Act, 2003
Reduced deforestation and forest degradation
5. Climate Investment Funds (CIF)
Electricity Act 1999,
Renewable Energy Policy, 2007
Scaling up Renewable Energy in Low Income Countries Programme (SREP)

30 THE CHALLENGE AND OPPORTUNITY OF GREEN GROWTH
Policy/ financing instrument
Legislation and/or policy
Sustainability Outcome Performance of instrument
Non-Tax Revenue
1. Round wood harvest fees for plantations/stumpage fees
National Forestry & Tree Planting Act, 2003
Sustainable production of timber for the country’s needs in plantations
These funds are part of economic instruments that should be included in the environmental fiscal reforms. Government institutions require strong governance frameworks to appropriate and sustainably use these instruments for the good of the country.
Poor use of these instruments can lead loss of finances, unsustainable harvests and loss of benefit sharing opportunities with communities.
Some of the more successful schemes include the revenue sharing schemes, the tourism packages, concessions for ecotourism and tourism gate fees.
2. Concessional Land leases under Sawlog Production Grant Scheme (SPGS)
National Forestry & Tree Planting Act, 2003
Increase sustainable production of timber to meet the country’s needs
A subsidy to encourage commercial forestry production. Government of Uganda and the European Union funds
3. Concessions for ecotourism
National Forestry & Tree Planting Act, 2003, Wildlife Act, 2014
Increase Public-Private-Partnership and private investment in conservation
4. Gate or entrance fees
Uganda Wildlife Act Cap 200
Uganda Wildlife Education Centre Trust Deed of 1994
National Forestry & Tree Planting Act, 2003
Obtain revenues for running institutions and manage numbers of visitors
5. Tourism packages fees (hot springs, mountain climbing, birding, boat launch, bush camping, caves, chimp tracking, cultural encounters, gorilla tracking, etc.
Uganda Wildlife Education Centre Bill
Obtain resources for managing biodiversity under jurisdiction of institution
National Forestry & Tree Planting Act, 2003
Provide tourists and visitors with a quality service and experience
6. Revenue Sharing with communities near Protected Areas (Pas)
Enhance community participation in forest conservation and conservation of protected areas e.g. National Parks
7. Commercial activities (semen, eggs, ova, embryos).
The Animal Breeding Act, 2001
National Agricultural Research Organisation Act, 2005
Raise revenue to maintain livestock diversity in the country
Raise high quality breeds and stocks for distribution to farmers

31THE UGANDA GREEN GROWTH DEVELOPMENT STRATEGY, 2017/18 – 2030/31
Policy/ financing instrument
Legislation and/or policy
Sustainability Outcome Performance of instrument
Revenue, Benefit Sharing and Resource Access
1. Collaborative forest management arrangements or collaborative resource management
National Forestry and Tree Planting Act, 2003
Uganda Wildlife Act Cap 200
Enhance community participation in forest conservation and conservation of protected areas e.g. National Parks
Benefit sharing of ecosystem services within tourism or production zone in the PA.
These are opportunities for communities to use products from conservation areas. These products are under-used because of concerns over overexploitation.
Improved sustainable exploitation models are needed for sustainability of the conservation areas. An area requiring more environmental economic analysis and modelling.
2. Wetland user committees
National Environment Act Cap 153
National Wetland Policy, 1995
Enhance community and sustainable use of wetland resources
Limit degradation from encroachers
Conservation Funds
1. Uganda Biodiversity Conservation Fund
Proposed under Revised National Environment Bill
Uganda Wildlife Act Cap 200
Provide a funding pool for all biodiversity conservation actions in the country
Conservation funds are generally very successful but also very small schemes that are generally controlled by non-governmental organiszations.
Formal government and private sector participation is needed to scale up the benefits for ecosystem stewards (communities).
The funds have great potential for generating community benefit. They can easily be used for scaling up forest landscape restoration, wetland restoration, soil and land management actions and climate change mitigation and adaptation actions.
2. Bwindi Mgahinga Conservation Fund
Uganda Wildlife Act Cap 200
Provide incentives for communities to contribute to Mountain Gorilla Conservation in Bwindi Impenetrable and Mgahinga Gorilla National Parks
3. Community Environment Conservation Fund
Uganda Water Act Cap 152
National Forestry and Tree Planting Act, 2003
Support Forest Landscape Restoration and catchment management through providing livelihoods for integrated water resources management (IWRM)
4. EBA Climate Adaptation Fund for Mt. Elgon Ecosystem
Proposed under Revised National Environment Bill
proposed Climate Change Act
Adaptation through landscape restoration activities and supporting agricultural livelihoods and soil and water conservation practices
5. Carbon Bank for Mt. Elgon Ecosystem
Uganda NGO Registration Act, 1989
Reforestation actions and establishing a fund to buffer carbon sequestration mitigation for verified emission reductions under the Plan Vivo Standard

32 THE CHALLENGE AND OPPORTUNITY OF GREEN GROWTH
Policy/ financing instrument
Legislation and/or policy
Sustainability Outcome Performance of instrument
Energy standards and compliance programs
1. ISO 50001 Voluntary, consensus-based, market-relevant International Standards.
Using energy efficiently helps organizations save money as well as helping to conserve resources and tackle climate change
These are private sector oriented schemes. The Global Energy Transfer Food-in-Tariff (GETFIT) programme in Uganda has proved invaluable in scaling up private sector investment in renewable energy schemes. It is one of the most successful financing schemes as it is based on matching marketing demand for electricity with production and supply.
ISO standards are very comprehensively used in export value chains for coffee, tea, cocoa, fruits and vegetables. These standards are successful.
However, the performance of national standards and other standards under fair trade, sustainable production has been subpar.
2. Comprehensive Feed-in-Tariff (FiT) policy
Energy Policy 2002 Renewable Energy Policy 2007,
Electricity Act 1999
Increase private sector investment in electricity generation
Increase renewable energy options as a means of generating sustainable energy
Subsidies
1. Support for paddy rice farmers for increased production through seed, fertilizers and extension support
National Agriculture Policy, 2013
Agriculture Sector Development Strategy and Investment Plan 2010/11 – 2014/15
Conversion of wetlands for paddy rice ensures higher productivity for rice
Clearing of trees for upland rice production also leads to biodiversity loss
No compliance actions undertaken
Subsidies are a burden to national fiscal policy. Yet when these schemes are designed as economic incentives rewarding sustainable behaviour they may not be subsidies. For example the GETFIT programme design is financially and economically viable and ceases to be a subsidy.
Soft compliance support is also often a worthwhile subsidy to support regulatory processes.
Subsidies on use of public lands for infrastructure development and for boosting agriculture must set a high standard of feasibility and viability before they are supported. Therefore due diligence to meet all environmental, social and economic safeguards must continually be maintained as is the case under current regulation.
A governance system is needed that identifies and halts subsidy financing where perverse incentives that damage the environment (construction in wetland, waste discharge in river systems, poor inorganic fertilizer use) occur. Instead the financing should be passed to projects that generate positive externalities.
2. Soft compliance support, through trainings
Water Act Cap 152
National Environment Act Cap 153
Training of effluent discharging industries on proper effluent management and cleaner production practices. The aim is to reduce effluent discharge into water catchments, wetlands and on land.
3. Construction of roads and other infrastructure (roads and railways) through wetlands
The National Transport Master Plan, Uganda National Roads Authority Act, 2006, The Roads Act, 1964, Railways Corporation Act Cap 331
To reduce the cost of compensations, sections of road go through public lands of wetlands without compensation
Interferes with due diligence compliance actions under EIA and Environmental Audits, as well as Wetland Use Guidelines, and Catchment Management Guidelines
4. Provision of agricultural fertilizers to farmers under NAADS <spell out> to increase agricultural productivity
National Agriculture Policy, 2013
Agriculture Sector Development Strategy and Investment Plan 2015/16 – 2019/20
Increase agricultural productivity through supplying fertilizers. If the fertilizers are poorly used this could lead to leaching and washing away of nutrients with storm water in rivers, wetlands and lakes

33THE UGANDA GREEN GROWTH DEVELOPMENT STRATEGY, 2017/18 – 2030/31
Policy/ financing instrument
Legislation and/or policy
Sustainability Outcome Performance of instrument
Central Government
1. Central Government Transfers
Public Finance Management Act, 2015
Government transfers funds to local government for salaries for local government staff, to MDAs for salaries of their staff, and under the Poverty Action Fund (PAF) for environment management
The Government makes annual commitments to support local government financing including to environmental and natural resources management actions. The financing is pegged to the success of national tax collections.
Similarly, the Government has committed to use national revenue collections to support forest landscape restoration. The latter action is still under planning and design.
2. African Forest Landscape Restoration Initiative
National Forestry & Tree Planting Act 2003
National Climate Change Policy, 2013; UNFCCC
The Government of Uganda has promised to restore up to 2.5 million hectares of degraded and deforested landscapes by 2030.
Overseas Development Assistance
1. Farm Income Enhancement & Forest Conservation Project (FIEFOC)
National Forestry & Tree Planting Act, 2003
Forest restoration on private land and restoration of wetlands
There are several ODA investments in the country. However, the MERECEP - East African Community and FIEFOC - Government of Uganda/ European Union, represent some of the major natural capital investment projects. Others examples include the Lake Victoria Environment Management Programme (LVEMP). These funds are also part of international financing; however, they have a strong co-financing and public sector implementation role. The success of these interventions is based on ability to maintain a strong governance and M&E process to sustain high levels of environmental, social and economic benefits. The Government needs a threshold for viability of these projects and programmes.
2. Mt. Elgon Region Environment Conservation (MERECEP)
Lake Victoria Basin Commission Protocol
Treaty for establishment of the East African Community, 1999.
Restoration and sustainable management of the key water catchments for Lake Victoria
Private Sector
1. Corporate Social Responsibility (Coca Cola, Standard Bank Uganda, Standard Chartered Bank, MTN, Airtel, URA)
Private corporate social responsibility funds, corporate outreach
Giving back to consumer communities and contribution to poor communities’ welfare
Private sector financing has been observed in participation in sustainable value chains as well as supporting conservation funds that have strong community benefits.
The role of private sector in the green economy needs to be harnessed through strong awareness creation, and more importantly design of opportunities where the private sector can participate.
2. Catchment Management financing (Coca Cola, Bugoye Hydropower, KCCL, Hima Cement.
Investment pack in reducing operational costs
Catchment restoration activities to reduce siltation in the water, mudslides and ending of operations that lead to revenue losses
3. Certified organic agriculture and Sustainable Agricultural Commodities
National Agricultural Policy, 2013
Draft Organic Agriculture Policy
Producing food in a complete cycle with minimal external inputs and compliance with high organic standards
Source: UNDP and NEMA 2017.

34 THE CHALLENGE AND OPPORTUNITY OF GREEN GROWTH
2.4 Opportunities for Green Growth and Development in Uganda
2.4.1 Agriculture
Agriculture is the main source of livelihood in Uganda with 72 percent of the working population engaged in the sector in 2012/13 (UBOS 2014) and accounting for about 22 percent of the national GDP. There are over 5.2 million agricultural households in the country, over 97 percent of whom are engaged in generally smallholder subsistence farming. Commercialization in agriculture remains low, with only about 119,000 or 2.3 percent of the 5.2 million farming households being engaged in commercial farming (NEPAD 2015).
Productivity in the agriculture sector is still low, mainly driven by inadequate water for production, limited access to appropriate technologies, declining soil fertility, poor farming methods (i.e. limited use of high yielding seeds, manure or fertilizers), lack of required skills and poor farm to market infrastructure. Agriculture is also highly vulnerable to exogenous factors, including low prices and climate change. These challenges present three entry points for green growth interventions.
Enhancing availability and access to Water for agricultural production
Currently only 31,000 households practice irrigation, with shallow wells (44 percent) being the most frequently used source, followed by gravity flow (16 percent) and deep well systems (13.5 per cent ). The other sources of irrigation water are water harvesting (5.6 percent, pumping from surface water systems or ponds (3.5 percent ), municipal water supply (2.4 per cent ) and others (12 percent). The main source of irrigation therefore is ground water followed by surface water systems and very modest use of rainwater harvesting. It is estimated that only 15,150 ha of land are fully irrigated and only 8,656 ha are fully equipped for irrigation. Approximately, 36,000 ha of agricultural land are drained for agricultural production purposes.
The national target for irrigation potential is a modest 567,000 ha, based on two land types. Irrigation potential area Type A lies close to surface water resources where irrigation water can be drawn from, while Type B lies further from surface water systems and would require considerable investment in bulk storage and transfer from bulk storage.
Since 2010, rainfall variability in Uganda alone has caused crop yield losses worth an annual equivalent of US$6 billion/year (MWE 2015). These shortcomings present an opportunity to adopt a green growth approach. The next chapter on the strategic direction details appropriate green growth strategies and interventions for adoption over the UGGDS period.
i. Soil and Fertility Management
Fertilizer use in Uganda is estimate at a meagre 1.5kg/ha/year, which is way below the regional and Sub-Saharan Africa averages. Green growth agronomic practices can go a long way in complementing existing sustainable land management practices to enhance soil fertility.
ii. Value chain upgrading
The value chain describes the full range of activities that are required to bring a product from its conception to its end use and beyond. This includes activities such as design, production, marketing, distribution and support to the final consumer (Kaplinsky and Morris 2001). Upgrading refers to the acquisition of technological

35THE UGANDA GREEN GROWTH DEVELOPMENT STRATEGY, 2017/18 – 2030/31
capabilities and market linkages that enable firms to improve their competitiveness and move into higher-value activities (Kaplinksy and Morris 2001). Upgrading in firms can be through process upgrading, product upgrading and functional upgrading. Uganda’s agriculture sector has gaps at various segments of its value chain and the UGGDS presents an opportunity to address these loopholes in a sustainable way.
Numerous examples of formalized value chains including outgrower schemes and commodity production and processing export value chains in Uganda have pointed out that their success in enhancing the premium earned by farmers is often based on knowledge, learning and sustainability including commodity price stability (Gibbin 2006).
The strategic interventions have to be designed based on two clear steps. A first step is to spell out the rewards. These rewards include stable and higher market values because of the consistency of quality and quantity supplied. A second step is to outline the preconditions or mechanisms for achieving this; that is the actions required, including market diversification, excellence in manufacturing and effective use of knowledge acquired from within the value chain (Gibbon 2003).
Basis for upgrading the value chain
There is strong evidence of rewards through value addition in Uganda’s value chain. The USAID Feed the Future project has leveraged an additional US$3 million of new private investment for value addition actions. The investment resulted in US$7.5 million in income earned by Feed the Future farmers in FY2014 from agricultural product sales. Up to 213,000 producers are using new technology and practices on 91,300 ha, while 258,000 children under five years achieved standard nutrition with help from the project. (USAID n.d.).
By 2015, imports of agro-processed goods in the country were worth UGX 770 billion (Table 4). Many of the imported products can be processed within the country, which would save important foreign exchange and also build competitiveness to expand access to these products and to export within the region. Uganda would be able to produce raw materials for the domestic agro-industry and contribute to forward economic linkages by virtue of exports while also reducing imports of agricultural raw materials and building backward linkages in the economy.
Table 4: Million UGX of imports, between 2011 and 2015
Imports 2011 2012 2013 2014 2015
Live animals other than fish 2,254 2,494 1,907 3,714 3,737
Meat and meat preparations 3,241 2,861 2,547 2,591 2,753
Dairy products and birds eggs 5,578 5,794 5,805 6,514 5,047
Fish, crusteceans, molluscs and preparations there-of
2,768 3,762 2,410 3,616 2,256
Cereals and cereal preparations 231,112 306,732 247,365 273,862 198,016
Vegetables and fruits 16,685 16,434 14,812 20,915 20,192
Sugars, sugar preparations and honey 136,345 160,930 146,961 110,340 102,904

36 THE CHALLENGE AND OPPORTUNITY OF GREEN GROWTH
Imports 2011 2012 2013 2014 2015
Coffee, tea, cocoa, spices and manufactured thereof
8,352 8,020 7,742 25,191 22,049
Miscellaneous edible products and preparations 40,308 39,513 39,133 42,216 42,109
Feeding stuff for animals (not including un-milled cereals)
1,833 2,271 4,010 4,715 6,973
Beverages 37,367 40,674 44,185 48,528 43,307
Tobacco and tobacco manufactures 14,018 11,256 9,428 10,398 9,840
Hides, skins raw 796 1,450 2,433 4,391 5,663
Oil seeds and oleoaginous fruit 1,378 1,549 2,420 2,267 2,301
Crude animal and vegetable materials 6,201 7,097 6,091 6,929 11,401
Animal oils and fats 203 361 418 160 499
Organic chemicals 66,061 93,369 102,357 85,745 91,359
Fixed vegetable fats and oils, crude, refined, fractioned
228,959 236,060 217,041 253,077 198,399
Animal, vegetable fats and oils processed, waxes 27,699 26,544 2,880 4,885 2,050
Total 831,158 967,171 859,945 910,054 770,855
Source: UBOS 2016b.
The food processing and marketing sector has been an important driver of growth in Uganda. Whereas Uganda has been pushing for technologies affecting supply, the most important immediate step is to draw on technologies that will promote agricultural development from the demand side. These are a) processing, packaging, marketing and retailing; and (b) targeting domestic and regional markets.
Value development in agriculture requires supporting and promoting agro-processing (Bwire and others 2016). Agro-processing has strong linkages with the agriculture sector which employs more than 66 percent of Uganda’s workforce. Currently the inter-linkages in the economy are low especially between agricultural sector and the rest of the economy. A key driver for boostinb productivity in agriculture is by promoting agro-based demand-driven agriculture output. Revamping agriculture will require a holistic approach, including strengthening its linkages to other sectors especially focusing on import substitution of imported intermediate agricultural foods (Bwire and others 2016).
2.4.2 Natural Capital Management
a. Tourism and the Wildlife Sector: Tourism accounts for 9 percent of national GDP and 26 percent of earnings from exports of goods and services. The tourism sector still faces serious challenges. At a regional level, security threats and disease outbreaks such as Marburg, lead to negative media and adverse travel advisories. Other challenges include poor air transport and inadequate hospitality industry skills. Consequently the number of visitors to key tourism locations has declined. Despite the increase in visits to National Parks from about 203,000 visitors in 2014 to 216,000 visitors in 2015, there has been a 13 percent decline in the number of foreign non-resident visitors to the national parks over the same

37THE UGANDA GREEN GROWTH DEVELOPMENT STRATEGY, 2017/18 – 2030/31
period. In FY 2016/17, the Government allocated UGX 188.8 billion to the sector, up from UGX 158.5 billion in FY 2015/16. In Uganda, tourism is one of the sectors that automatically conserves biodiversity since it is its main attraction. There is empirical evidence that tourism has a very high rate of return in Uganda given the meagre budget allocations and high economic contribution through foreign exchange returns. Adopting a green growth approach towards tourism management will not only prolong the flow of these revenues but also ensure their equal distribution. To this end the UGGDS has proposed strategies and interventions outlined below.
b. Forestry: According to national statistics Uganda’s forest land cover declined to 2.6 million ha of forest land in 2010, and to 1.96 million ha in 2015 from a forest area of 4.9 million ha in 1990. This is a reduction of 57 percent in just 25 years (MWE 2016). As recently as 2005, Uganda had a total of 3.6 million ha of forest land compared to 4.9 million ha in 1990, a reduction of 30 percent over a period of 15 years. The rate of loss accelerated between 2005 and 2010 to, 6.4 percent per annum, from 3 percent between 2000 and 2005. The rate of forest loss seems to have declined to 2.2 percent per annum between 2010 and 2015, but most of the damage has been done. Through the green growth approach, direct investments into ecosystem restoration to reduce deforestation and degradation can be undertaken. However, the bulk of forestation needed is on private land and the converted forest land is now used for agriculture, settlements and grasslands, among others. While reforestation is required, the catalytic investment is seeking the appropriate incentive for forestry on private land. Agro-forestry investments have been identified as the entry point for forestry on private land.
c. Wetlands: Wetlands as measured in 2010 cover approximately 8 percent of the land surface area, down from 15.6 percent (37575) km2 in 1994 ( UNDP and NEMA 2017). Despite the presence of the wetland policy and the institutional framework, wetland degradation continues at a relatively high rate. For instance, the wetland catchment area around Lake Victoria alone shrank by more than half, from 7,167.6 km2 in 1994 to 3, 310.km2 in 2008. The wetland catchment of Lake Kyoga has also fallen from 15,008.3 km2 in 1994 to 11,028.5 km2 in 2008 (Aryamanya- Mugisha 2011).
Wetlands in Uganda provide a wide range of tangible and non-tangible benefits. The tangible benefits include water for domestic use and watering livestock, support to dry season agriculture, provision of handicrafts, building materials, food and medicines. The non-tangible benefits include flood control, purification of water, maintenance of the water table, micro climate moderation, storm protection (Kakuru and others 2013). The total economic contribution of wetlands in three agro-ecological zones of Uganda is estimated at US$10,948; US$10,388 and US$11,358/ha/year.
Uganda has 12 sites designated as wetlands of international importance (Ramsar sites)within a surface area of 454,303 ha. The Ramsar sites are also important bird areas and attract hundreds of birders from across the world and from within the country. Uganda’s Ramsar sites are located along the Lake Victoria Crescent, in Southwestern farmlands and rangelands, in the Albertine rift of the East African Rift valley along Uganda’s border with the Democratic Republic of Congo (DRC), and the Lake Kyoga Basin (Byaruhanga, Opige, and Mafabi 2008). The Ramsar sites include: Lake Victoria crescent: Sango Bay; Lutembe Bay; Mabamba Bay; Nabajjuzi and Lake Mburo wetlands; Southwestern farmlands and rangelands; the Lake Mburo Nakivali wetland system joining Rivers Katonga and Rwizi which drain into the north-western part of Lake Victoria; the Albertine Rift landscape; Lake George and Murchison-Albert delta wetlands; Lake Kyoga basin; Lake Nakuw; Lake Bisina and Lake Opeta wetlands.

38 THE CHALLENGE AND OPPORTUNITY OF GREEN GROWTH
d. Water resources:
Surface water resources: The internal renewable water resources in Uganda, that is, the average annual river flow generated from precipitation over the country but excluding the impact of the major lakes, amount to 15.6 km3/yr. The sum of the external and internal renewable water resources in Uganda is 43.3 km3/year while the dependency ratio, i.e. the proportion that originates outside the country, is about 69 percent. Therefore, management of trans-boundary water resources flowing from Kenya, Tanzania, and Rwanda under the Nile basin and Lake Victoria basin are critical.
Groundwater: The estimated quantity of renewable groundwater generally exceeds the projected demand for domestic water supply in non-National Water and Sewerage Corporation (NWSC) areas by a considerable margin and the sustainable utilization rate projected to the year 2030 is below 15 percent in most districts. It is recognized, however, that local shortages may arise, particularly in areas with a high population density. Local shortages may also arise as a result of water quality considerations. Given that the average annual recharge ranges from 19.1 to 39.9 mm, the use of groundwater in Uganda for supplementary irrigation is limited to localized projects on a relatively small scale. Groundwater can safely provide a substantial part of the water needed for livestock (based on the 2008 estimate of livestock numbers) but caution is required in the Kaabong and Kotido districts.
Water Quality: The most important water quality problem is bacterial contamination of both groundwater and surface water resulting from inadequate sanitation facilities, and this highlights the importance of improving sanitation. Problems associated with groundwater, usually localized, include corrosiveness, turbidity, and high concentrations of iron, chloride and fluoride. In many places the concentrations of bacteria are so high that even bathing is not recommended and could even be dangerous. Eutrophication resulting from excessive quantities of nutrients reaching water bodies can cause algal blooms that may lead to oxygen deficits and fish kills, or promote the excessive growth of weeds such as water hyacinth. Contamination by hazardous chemicals from industries and agriculture is still at low levels in Uganda, but they could damage health locally. Soil erosion is mostly a localized problem in Uganda, being concentrated in the Mt Elgon, Rwenzori, and southwestern regions.
Climate Change: Climate change is expected to increase climatic variability by shifting and intensifying extremes, which could lead to more severe drought and flood events. Climate change adaptation requires a multi-sectoral approach using the integrated water resources management IWRM guiding principles. Interventions to improve adaptations to climate change particularly need to consider no regret actions (i.e. actions likely to lead to net benefit whether or not impacts of climate change occur), and non-structural actions (i.e. actions that do not involve infrastructure or major asset investments) to avoid large and perhaps risky investments, along with demand management.
Hydropower: The hydropower potential along the Victoria and Kyoga Nile amounts to 2,400 MW, of which 630 MW is operational. Power generation at the Kiira-Nalubaale facilities has been below installed capacity because of low lake levels in recent years and the subsequent reduction in the volume of water released from Lake Victoria. This emphasizes the importance of maintaining high water levels in the lake in order to maximise hydropower production. Lake Victoria serves as the principal reservoir for the cascade of hydropower projects along the Nile. As the potential sites downstream of Lake Victoria have a limited storage capacity they are operated on a run-of-river basis. The same applies to facilities that might be developed on the Kyoga Nile.

39THE UGANDA GREEN GROWTH DEVELOPMENT STRATEGY, 2017/18 – 2030/31
Domestic Water Demand: The national urban water coverage was estimated to be 66 percent in 2008 while the coverage in rural districts (2009) ranged from 24 percent to 100 percent . The corresponding domestic water demand amounts to 191 million cubic metres/year in rural areas and 73 MCM/year in urban areas. The expectation that coverage will have reached 100 percent in both urban and rural areas by 2030 means that the annual domestic water demand will be 326 and 342 million cubic metres/year for rural and urban areas, respectively. Consequently, the total consumption of potable water is estimated to be 668 million cubic metres/year in 2030.
Industrial Water Demand: The present and expected future industrial consumption of water in Uganda is relatively small compared to other uses like domestic water supply or (potential) irrigation. Of greater concern than the actual volume consumed is the potential impact of wastewater, especially if untreated, on the environment and water quality in lakes and rivers.
2.4.3 Planned Green Cities
Whereas the current growth rate in urban population is 5.6 percent per year, only around 14-16 percent of the population in Uganda live in urban areas (UBOS 2014; Hashemi and Cruikshank 2015). Africa is experiencing the highest rate of urban growth in the world. All African countries, (excepting East African ones), have an urban population of 40 per cent or more (Hashemi and Cruickshank, 2015).
Table 5: Urban and rural populations and rates of annual change
Area/ country
Urban Rural Proportion urban
1990 2014 2050 1990 2014 2050 1990 2014 2050
Population millions (%)
World 2,285 3,880 6,339 3,036 3,364 3,212 43 54 66
Africa 197 455 1,339 433 683 1,055 31 40 56
East Africa 36 97 378 163 287 490 18 25 44
Uganda 1.9 6.1 33.4 15.6 32.7 70.7 11 16 32
Source: Hashemi and Cruikshank 2015.
In March 2016, there were 289 urban centres3 in Uganda as shown in Table 6. These include one Capital City, 33 Municipalities, 163 Town Councils and 62 Town Boards.4 The urban population has been increasing over time from about 1.7 million in 1991 to nearly 7.4 million in 2014 (UBOS 2016). The 27 leading urban centres, with a population of more than 50,000 persons, collectively host 62 percent of the urban population of Uganda. On the other hand, 229 gazetted urban centres with a population of 25,000 persons or fewer constitute only 38 percent of the total urban population.
3 In Uganda, the definition of urban areas has been changing over time. The 2002 and 2014 Censuses defined urban areas to include only the gazetted urban centres. However, the 1991 Population and Housing Census defined urban areas to include gazetted urban centres and ungazetted Trading Centres with a population exceeding 1,000 persons.
4 This report will count cities as referring to both the capital city and municipalities, unless otherwise indicated.

40 THE CHALLENGE AND OPPORTUNITY OF GREEN GROWTH
Table 6: Number of urban centres by type and urban population, 1991 - 2016
Type of urban centre 1991 2002 2014
Number Population Number Population Number Population
Cities 13 774,241 1 1189142 34 1507080
Municipalities 13 480,922 13 745,036 33 3,249,609
Town Council 33 338,901 61 1,065,209 163 2,361,033
Town Board/Township 20 75,589 20 na 62 308,142
Total 67 1,669,653 75 2,921,981 289 7,425,864
* urban population for 2002 excludes population enumerated for town boards, urban centres are 2016 while the population is as 2014.
Source: UBOS 2016.
The Uganda Vision 2040 proposes four regional cities and five strategic cities in the course of Uganda’s urbanization. They include the capital city Kampala, the regional cities of Gulu, Mbale, Mbarara, and Arua, and the strategic cities of: Hoima (oil); Nakasongola (industry); Fort Portal (tourism); Moroto (mining); and Jinja (industry) (GoU 2013). The major concern for cities in Uganda are:
i. Insufficient competitiveness to produce internationally tradable goods and sufficient productive jobs. The cities tend to produce more non-tradable goods, such as electricity, water supply, public services, hotel accommodation, real estate, construction, local transport, and goods with high transport costs such as gravel and country-specific goods, especially food items (World Bank 2015; Gollin, Mugyenyi and Sen 2016).
ii. Naturally produced tradable goods such as agricultural commodities and processed products, processed metal and raw materials, produced products such as shoes and textiles, and other products such as cement, and sugar etc, are modest in value and enjoy a limited market share compared to imported goods.
iii. The skewed balance means that the formal sector is unable to grow sufficiently to create jobs and invoke economic multipliers.
iv. The limited growth in the tradable sectors also leads to limited labour mobility from the rural agricultural economy to industries.
v. Ugandan cities have not kept pace with needs for new infrastructure and housing and this has led to high rates of spatial expansion and unplanned growth due to lack of integration of spatial and sectoral planning.
vi. Often the problems arising in spatial planning are associated with fiscal constraints and low capacity among city authorities.
vii. The poor spatial planning affects access to basic services of water and sanitation, housing, and causes poor mobility/transportation within the city, among other problems.
2.4.4 Sustainable Transport
Uganda’s transport system is not diversified in terms of options and currently relies on high-emission vehicles for road transport, marked by the majority 14-passenger commuter taxis. Options such as railway and water transport are still underdeveloped though with enormous potential. All these shortcomings foster

41THE UGANDA GREEN GROWTH DEVELOPMENT STRATEGY, 2017/18 – 2030/31
inefficiencies in economic transformation with negative consequences for the social and environment aspects of development. Transport prices on international roads from Mombasa to Kampala average US$0.08 per km, twice as much as Brazil, China, France and the United States. Average transport prices on tarmac are about US$0.12-US$0.15 ton/km while on feeder roads they reach US$0.3-US$0.4 per ton/km. The high transport prices inflate input prices and depress output prices at the same time, discouraging farmers from adopting input-intensive technologies. Transport prices are less of a constraint for high value crops such cotton, coffee, fruits and vegetables, but they are a major constraint for producing and marketing bulk commodities, especially staple food crops (World Bank 2010). Overall, Ugandan farm to market transportation costs were estimated to be four to seven times those in the United States (Gollin and Rogerson 2010), reflecting high levels of inefficiency, something the green growth model seeks to address.
Therefore, sustainable transport solutions are needed. Sustainable transport refers to the capacity to support the mobility needs of people, freight and information in a manner that is competitive in price and least damaging to the environment. There are two sides to transport – managing transport demand and improving transport supply. Transport systems can adapt to cope with transport demand and reach a better level of sustainability (Rodrigue, Comtois and Slack 2016) by devising means/ strategies to manage (reduce) transport demand for passengers and freight as well as to redistribute this demand in space and time when possible. On the other hand, when transport is profitable, inexpensive and unsubsidized, that us a good indicator of sustainability.
According to Gollin and Rogerson (2010), regional evidence in Uganda shows that agricultural price dispersion associated with transportation costs is high. High transportation costs represent an important force in shaping the allocation of labour. High transport costs also create an incentive for individuals to locate so as to minimize transportation costs for those goods that are most important to them. Since agricultural goods are relatively important in poor economies, this leads to a greater share of the population remaining in agriculture (Gollin and Rogerson 2010). The predominance of subsistence agriculture can also be explained by this, since people who locate in remote areas in order to be close to their source of food will necessarily engage in little trade for other goods precisely because of the high transport costs. The clear implication is a need for sustained investments in transport infrastructure, especially railway and road transport, providing for increased multi-modal transport systems.
The main transport challenges for urban areas are expanding and improving transportation supply in such a way that private vehicles have alternatives, increasing public transit infrastructure by improving existing public transit services, and by making cities friendly to pedestrians and non-motorized vehicles. (Rodrigue, Comtois and Slack 2016). The sustainable transport alternatives will contribute by reducing the energy intensity of vehicles and carbon intensity of fuels, reducing high density and agglomeration, providing context appropriate transport and options for non-motorized transport modes. The opportunities for Ugandan cities include Bus Rapid transport (BRT), Light Rail Transport (LRT) and multimodal transport systems.
2.4.5 Energy for Sustainable Livelihoods and Development
Uganda’s current energy balance comprises biomass, 88.9 percent (firewood 78.6 percent, charcoal 5.6 percent and agricultural residues 4.7 percent), petroleum products 9.7 percent, and electricity at only 1.4 percent of the total national energy balance (MEMD 2015). Most of the fuel wood is used for cooking, utilizing the highly inefficient three stone cook stoves in the rural areas where most of the population lives.

42 THE CHALLENGE AND OPPORTUNITY OF GREEN GROWTH
Uganda has a heavy reliance on renewable energy sources for electricity. By 2015, the installed capacity for electricity was 695 MW for hydro power, 64.5 MW for baggase, and 136 MW for thermal electricity, the only non-renewable source. Installed capacity of electricity power plants increased by 1.2 percent in 2015 from 885 MW in 2014 to 895.5 MW in 2015. This was due to a 19.4 percent increase in the installed capacity of bagasse electricity from 54 MW in 2014 to 64.5 MW in 2015 (UBOS 2016b). In December 2016, the Government announced the start of operation of a 10 MW solar plant in Soroti District (ERA 2016b). The plant is made up of 32,680 photovoltaic panels and is country’s first grid-connected solar plant and will generate clean, low-carbon, sustainable electricity for 40,000 homes, schools and businesses. Like all other small renewable electricity generation projects, the Soroti Solar Energy project was developed under the Global Energy Transfer Feed in Tariff (GET FiT). The power plant has the potential to increase its net output capacity by a further 20MW of solar energy.
Uganda’s renewable energy electricity base was estimated at 5,300MW and it comprises large hydro of over 2000MW, mini-hydro at 200MW, solar energy at 200MW, biomass at 1,650MW, geothermal at 450MW and peats at 800 MW. The country’s targets under Vision 2040 and NDP are indicated in Table 7 below.
Table 7: NDP and Vision 2040 electricity targets
Year 2010 2015 2020 2025 2030 2035 2040
Consumption (KWh/capita) 75 674 1,273 1,872 2,470 3,069 3,668
Capacity (MW) 425 3,885 8,601 14,670 22,222 31,252 41,738
Source: GOU 2010 NDPI.
Under the Electricity Regulatory Authority (ERA) Strategic Plan 2014/15– 023/24, ERA is working with other Government agencies and development partners under the GETFIT initiative to accelerate renewable energy development including hydropower, solar, wind and biomass technologies. The initiative provides a top-up premium in the range of UScents 0.5-2.0 cents/kilowatt hour on the Renewable Energy Feed-in-Tariff (REFIT). It also provides a guarantee scheme to enhance the bankability of the projects. The first tranche of projects with a cumulative generation capacity of 150MW is being targeted to be brought into production within the next three years (ERA 2014).
Whereas Uganda has potential for expanding renewable energy, thermal and peat, the electricity energy demand highlighted in the Vision 2040 and NDP will exceed this potential. The Government therefore, in April 2015, approved the Nuclear Power Roadmap Development Strategy. It comprises five scenarios, which in terms of cost-effectiveness suggest that a high scenario targeting 2,300MW to be commissioned in 2028 is most cost-effective even though the Vision 2040 target would be 30,000 MW by 2026. Given the large capital outlay required, of US$205 billion, before 2026, it is evident that the plan for Vision 2040 may have to be achievedby some other means. The Grid Development Plan case, although less cost-effective than the high case scenario, is a worthwhile compromise and the target for Vision 2040 can be met either through alternatives to nuclear energy and/or through scaling up the GDevP case.

43THE UGANDA GREEN GROWTH DEVELOPMENT STRATEGY, 2017/18 – 2030/31
Table 8: Proposed nuclear generation plan
Scenario Number of Units
Installed Capacity
(MW)
First unit Year of
commissioning
Total expenditure needs (US$
million)
Cost effectiveness million US$/
MW
Base case 2 2,000 2031 12,031 6.0
High case 2 2,300 2028 6,007 2.6
Low case 1 1,000 2034 14,190 14.2
Grid Development Plan (GDevP) 2013 - 2029 Case
2 3,030 2027 18,614 6.1
Vision 2040 20 30,000 2026 205,238 6.8
Source: MEMD 2015.
UgandaVision 2040 proposed an electricity energy mix comprising hydro (4,500MW); geothermal (1500MW); nuclear (24,000MW); solar (5,000MW); biomass (1,700MW); peat (800MW) and thermal (4300MW) (GoU 2013).

44 GREEN GROWTH DEVELOPMENT STRATEGIC FRAMEWORK
3 GREEN GROWTH DEVELOPMENT STRATEGIC FRAMEWORK
3.1 UGGDS Strategic Direction
The UGGDS strategic direction is defined by five priority areas which are aligned with ongoing development initiatives proposed by the Uganda Vision 2040 and NDPII(2015/16-2019/20). The focus areas are envisaged to support the intended transition to a greener economy.
a. Vision
The UGGDS adopted the national vision statement (Vision 2040), which is for “a transformed Ugandan society from a peasant to a modern prosperous country within 30 years”. The strategy will be implemented as an integral part of Vision 2040, NDP II and specifically the 10- year long-term national development plan for 2020/21-2030/31.
b. Purpose:
The UGGDS serves as a framework and/or guidance tool that aims at catalyzing economic growth through the efficient use of the country’s natural, human, and physical capital in an inclusive manner along a low emissions development pathway.
c. Goal:
An inclusive low emissions economic growth process that emphasizes effective and efficient use of the country’s natural, human, and physical capital while ensuring that natural assets continue to provide for present and future generations.

45THE UGANDA GREEN GROWTH DEVELOPMENT STRATEGY, 2017/18 – 2030/31
Objectives
1. Accelerate economic growth and raise per capita income through targeted investments in priority sectors with the highest green growth multiplier effects;
2. Achieve an inclusive economic growth with poverty reduction, improved human welfare and employment creation;
3. Ensure that the social and economic transition is achieved through a low carbon development pathway that safeguards the integrity of the environment and natural resources.
Conceptualization of the five Priority Areas
The UGGDS was designed to provide cohesion between the targeted investments and the green growth development outcomes. On the demand side, industry and cities are expected to drive the demand for increased raw materials from agriculture and natural resources, the supply side of the economy. Policies to promote green and planned cities and stimulate industry will promote value-added tradable goods that will increase opportunities for waged employment, and provide a return for the private sector as well as raising average incomes. Cities and industry will be able to create sustainable market opportunities and innovation to serve markets for processed goods and value-added services. Physical planning for cities will optimize the efficiency of the cities (food, access to utilities, clean environment, planned infrastructure among others) and industry (efficiency, high productivity innovativeness) to spur a synergized green economy.
Supply side injections for the natural capital sectors will focus on increased production and productivity linked with opportunities pursued alongside the planned investments in infrastructure, industry and cities. The additional forward and backward linkages will increase the purchase of local raw materials, enhance the opportunities for domestic and international tourism, increase productivity and efficiency and minimize slack in production, distribution and consumption through the better performance of value chains
Figure 2: Flow process of the Green Growth framework in Uganda

46 GREEN GROWTH DEVELOPMENT STRATEGIC FRAMEWORK
3.2 Green Growth and Development Strategies
The goals and objectives of the Uganda Green Growth Development Strategy will be implemented through five prioritized areas whose selection was informed by studies that detailed the development areas with the highest green growth potential.
1. Sustainable agriculture production and value chains
The strategic interventions are:
i. Support increased access to irrigation facilities starting with 10 percent of smallholder farming areas in 2020 and cumulatively increasing to at least 60 percent of smallholder farmers by 2030.
ii. Integrated soil fertility management entailing the development and implementation of appropriate soil fertility techniques through soil mapping and land use planning and conservation agriculture (based on the judicious use of inorganic fertilizers, organic manure, agro-forestry, soil and water conservation, energy conservation) for all the farming systems in the country.
iii. Undertake actions to upgrade the value chain for strategic enterprises with a focus on product quality and quantity, market diversification, excellence in agro-processing and effective use of knowledge acquired from within the value chain. The value chain upgrade is built into the Agricultural Sector Strategic Plan with priority areas of: bananas; beans; rice; tea; coffee; cassava; fruits and vegetables; fish; cocoa; meat, Irish potatoes; and oil palm and oilseed crops.
2. Natural capital management and development
The planned strategic interventions are clustered around four areas: tourism; sustainable forestry management; sustainable wetlands; and optimal water resources management.
i. Tourism Development:
a. Invest in offering increased options among and values of tourism packages and in benefit sharing with communities surrounding Protected Areas (PAs).
b. Improve physical planning and quality enhancement for hospitality investments in nature-based tourism.
ii. Sustainable Forestry Management:
a. Undertake forest landscape restoration, especially on private land, through agro-forestry and afforestation actions.
b. Support incentive programmes oriented towards livelihoods enhancement, environmental stewardship and landscape management for climate change adaptation, mitigation, food security and sustainable energy.
iii. Sustainable wetlands:
a. Strengthening regulation of wetlands management, especially for District Local Governments and Urban Authorities;

47THE UGANDA GREEN GROWTH DEVELOPMENT STRATEGY, 2017/18 – 2030/31
b. Harnessing opportunities from sustainable use of wetlands including provisioning, regulating and aesthetic ecosystem services.
c. Restoration of degraded wetlands to maintain the regulating ecosystem such as hydrological services and effluent treatment.
iv. Sustainable and optimal water resources management:
a. Support the development and implementation of catchment management across the country.
b. Support development of sustainable financing, financing mechanisms and their governance.
c. Support sustainable, feasible and viable utilization of water resources through increased efficiency and optimal allocation
3. Planned green cities
The UGGDS interventions for planned green cities are:
i. Support comprehensive economic physical planning and efficient waste management (solid and wastewater) for at least five cities and 15 municipalities.
ii. Promote sustainable procurement and interlinkage between the rural raw material production base and industrial production in cities.
4. Sustainable Transport
i. The strategic interventions for sustainable transport development are:
ii. Support planned multi-modal and mass transport systems for urban areas comprising of the Bus Rapid Transport system (BRT) and the Light Railway Transport (LRT).
Support development, utilization and interconnectivity of the planned national, regional transport systems, and Standard Gauge Railway (SGR)for the country.
5. Energy for green growth
The planned strategic interventions are:
i. Support an increased focus on renewable energy investments including:
a. Biomass energy for electricity through cogeneration by sugar companies and other modern technology options by 2030;
b. Improved technology for enhanced efficiency in using biomass for domestic cooking and industrial uses by 2020;
c. Enhancing solar power potential especially for on-grid and local supply over the transitional period for the country from the current 10MW to 5,000MW by 2030;

48 GREEN GROWTH DEVELOPMENT STRATEGIC FRAMEWORK
d. Exploitation of geothermal energy based on current plans from base capacity of 450MW by 2030 to 1,500MW by 2040;
e. Support capacity utilization for large and mini-hydropower plants, and encourage efficiency in evacuation of generated power. The efficiency of capacity utilization can be increased from about 50-60 percent to 80 percent and evacuation to 95 percent by 2020.
iii. Support development and/or reinforcement of environmental, health and economic safeguards for energy generation in the country.
3.3 The Results Framework
3.3.1 Baselines and assumptions and targets outcomes proposed.
1. Agriculture
a. Water for Irrigation
Current plans under the National Irrigation Master Plan 2010–2035 are for irrigation support for Irrigation Area Type A covering 295,000 ha and Irrigation Area Type B, 272,000 ha.
The current government plan is expected to cover 567,000 ha even though at baseline irrigated area is only 31,000 ha.
At baseline, an average smallholder family needs 1 ha therefore, the 567,000 ha can represent 567,000 households, and this would be a modest coverage given the large number of farming households in the country.
Out of the 5.4 million farm households in the country, 4.833 million households would not have irrigation water. Since baseline irrigation is 31,000 households, then approximately 4.8 million households (89 percent of farm households) would be out of reach of irrigation. An alternative is required.
The target for the Uganda Vision 2040, on food and nutritional security suggests that one out of four households would be able to produce enough to feed four households. The long-term target would be to reach at least 60 percent of the 4.8 million households out of reach of current plans, using water harvesting, solar irrigation and other discrete type of interventions based on ground, surface and rainwater, over a 10-year period between 2020 and 2030. Therefore, the annual target is 144,000 households per year; that is 1,440,000 households plus the 576,000 ha (Area Type and Type B under the Irrigation Master Plan) by 2030.
b. Integrated Soil Fertility Management (ISFM) and Land Management
The targets for integrated soil and fertilisty management are aligned with Strategic Investment Framework for Sustainable Land Management (UNDP 2014).The target comprise; an overlap of integrated nutrient management; intercropping: mulching— 20,000 ha/year; agro-forestry for 20,000 ha/year; and terraces for 1,000 ha/year. The annual target is 41,000 ha/year engaging in ISFM and land

49THE UGANDA GREEN GROWTH DEVELOPMENT STRATEGY, 2017/18 – 2030/31
management. The baseline on current levels of ISFM and land management will be developed as part of the design of the component.
c. Upgrading the Agricultural Value Chain
At baseline in 2015, Uganda had a trade deficit of UGX 771 billion. The immediate target of the value chain upgrade is to achieve a trade balance based on increased value of agricultural products which act both as substitutes for imported products as well as products for export. The targeted straight-line increase in value averages UGX 77 billion per year. The target products based on the agricultural sector strategic plan are the 12 priority crops (bananas, beans, rice, tea, coffee, cassava, fruits and vegetables, fish, cocoa, meat, Irish potatoes, and oil palm and oilseed crops).
2. Natural Capital Management
a. Sustainable Forest Management (SFM): The SFM targets are based on forest cover losses in the National State of Forest Resources Report (MWE 2016b), and targets for Uganda Vision 2040 to restore the forest cover to the level of 1990 when forest cover was 24 percent of total land cover. This requires restoration of 3.05 million ha of forest cover over 22 years, based linear regression model, the required rate of restoration was estimated at 138,600 ha/year. Approximately 15 percent of restoration effort will occur in central forest reserves. At the same time, efforts to slow down the deforestation rate are needed, especially that associated with energy use. Additional interventions linked with the SFM strategy is the sustainable use of wood fuel. Therefore additional tree planting will be needed to cover for forest loss, at a 38 percent rate
b. Wetland areas: The wetland assessment was based on the National Wetlands Atlas Volume I and Volume II (GoU 2016a: 2016b) developed with support of UNEP and UNDP. The wetland indicators used are based on the proposals of Uganda Vision 2040. Additionally, the valuation aspects were based on work done in the Lake Victoria Crescent, the Southwestern farmlands and the Kyoga catchment (Kakuru, Turyahabwe and Mugisha 2014).
c. Water Resources Management: Catchment value was based on partial valuation conducted for Kasese District as a background study to the design of a PES project (WWF 2016). The focus area of the Nyamwamba-Mubuku sub-catchment and additional sections of the Semliki catchment was 2,333.4 km2. Therefore, a fairly modest partial value of UGX 414,820,176/km2 was estimated. The catchment area has a water resources value estimated at UGX 967.9 billion shillings after removing the value of forest and carbon stocks while when wetland values were removed, the value declined to UGX 198.96 billion, equivalent to 8.5million/km2.
d. Tourism: The country recorded a total of 1.73 million international arrivals and 1.71 million departures in 2015. The number of visitors to national parks increased from about 202,885 in 2014 to about 215,558 in 2015. Tourists visiting friends and relatives in Uganda increased from about 441,000 in 2014 to about 510,000 in 2015. The most popularly visited national park in 2015 was Murchison Falls (34 percent), followed by Queen Elizabeth (30 percent) and Lake Mburo National Park (12 percent). Of the visitors to national parks, 36 percent were foreigners who are non-residents. According to UBOS (2016b), only U$123.5 million of Uganda’s U$667 million from tourism (World Bank 2013) is attributed to foreign tourists visiting Uganda’s Protected Areas.

50 GREEN GROWTH DEVELOPMENT STRATEGIC FRAMEWORK
3. Planned Green Cities
The leading urban centres in the country had a population of nearly 7.4 million in 2014, a more than four-fold increase from the 1.7 million in 1991 (UBOS 2016a). The lowest population growth occurred in Jinja Municipality at just 2 percent annually while the high rate was 11.9 percent for Wakiso Town Council. Other urban centres that experienced rapid annual population growth were Hoima Municipality (10.7 percent), Mukono Municipality (10.4 percent), Masindi Municipality (10.1 percent), and Mbarara Municipality (8.6 percent). The most feasible cities, by population, based on the plans indicated in the Uganda Vision 2040 over the course of the UGGDS are: Gulu, Mbarara, Hoima and Mbale. An expanded Kampala city to cover areas of Greater Kampala Metropolitan Area including Nansana, Kira and Mukono Municipalities and Wakiso Town Council also seems feasible. Therefore, the UGGDS considered five cities, a Greater Kampala Metropolitan City (GKMC), Gulu, Mbarara, Hoima and Mbale cities. The base population of these cities was: GKMC – 2,136,408 people; Mbarara – 195,013 people; Gulu – 152,276 people; Hoima – 100,625 people; and Mbale – 96,189 people.
Currently, 76 percent of households earn some income from agricultural production. Whereas about 66 percent of the population is employed in agriculure (Bwire and others 2016), it is the most important source of income for only 42 percent of households, while 26 percent of households rely on agriculture exclusively. Only 11 percent of the labour force is primarily engaged in non-agricultural wage employment. The number of permanent non-agricultural wage jobs declined between 2009/10 and 2012/13 (MFPED 2014). The total employed population was estimated at 7.9 million people while the working population amounted to 13.9 million. The difference of about 6.0 million persons depicts the existence of a large mumber of subsistence farmers in the Ugandan economy (UBOS 2016a). The rural working population was 10.7 million; compared with 3.16 million people for urban areas. Whereas 49.8 percent of the working population in rural areas are engaged in subsistence agriculture, only 21 percent of the population in urban areas are engaged in subsistence agriculture (UBOS 2016a; Gollin and Sen 2016). The proposed green cities will be built on agro-processing and upgrading the value chain from agriculture. The productivity of industrial workers is expected to average US$7,871.35/worker by 2040 while the average agricultural worker productivity was projected at US$977.77, anticipated between 2020 and 2030 (NDP II) (GoU, 2015).
4. Transport
Agricultural productivity improvements have a relatively large impact on the economy. Because the non-agricultural sector is initially small, and because the economy faces a subsistence constraint that limits the expansion of the non-agricultural sector, improvements in non-agricultural total factor productivity (TFP) have relatively small positive impacts on the economy (Gollin and Rogerson 2010). Reductions in transportation costs generate sizeable benefits for the economy and trigger substantial reallocations of labour across sectors. When agricultural TFP improves at the same time that transportation costs are reduced, the welfare gains exceed those achieved from the two interventions separately, suggesting a kind of interaction effect (Gollin and Rogerson 2010).
By introducing reliable, safe, affordable and efficient railway transport systems, the SGR will occasion a drastic freight transportation model shift from road to rail. This shift will reduce the the cost of freight transportation from the seaport of Mombasa by 69 percent from the current average of US16 cents per tonne/km to an average of US5 cents per tonne/km (MoWT 2016).

51THE UGANDA GREEN GROWTH DEVELOPMENT STRATEGY, 2017/18 – 2030/31
5. Energy
The energy sector presents major challenges and opportunities. Uganda’s energy balance is dominated by biomass while fossil fuels and electricity are other important sources of energy. The total electricity supply was growing at rate of 7 percent (GoU 2015) while demand was actually growing at 11 to 12 percent (ERA 2015). The projections of Uganda Vision 2040 are that per capita electricity consumption will reach 3,668 kWh/capita (2040) from 75 kWh/capita (2010) if the country is to achieve its long-term development targets (GoU 2013).
Fuel wood is consumed at about 28 million tonnes/year of tree biomass and another 16 million tonnes of wood are annually are transformed into 1.8 million tonnes of charcoal using inefficient kilns. An additional 2.3 million tons of tree biomass is consumed in brick making and by educational institutions, among others (MEMD 2015). The evolution of biomass energy use has created opportunities for electricity cogeneration and thermal energy in use of bagasse by sugar factories, and use of agro-processing vegetal waste including maize cobs, rice husks, coffee husks for thermal energy in industry.
The main factors driving up energy demand is the high population growth rate of 3.2 percent a year and the low level of electricity access, currently estimates at 14 percent. Currently, demand is growing at a rate of 7-9 percent per year (ERA 2015). Therefore, even with the increased focus on the small renewable energy options under the GeTFIT initiative the 150MW target is modest given the country’s future energy demands projected at 41,738MW (2040). Large hydropower project development is pushing the country closer to the target of 4,500MW from hydropower and the country is also actively exploring geothermal energy, and the ERA strategy 2014/15–2023/24 has highlighted the prospects from natural gas and oil for thermal electricity generation (ERA 2015).
In planning for sustainable development, it is important to acknowledge the energy demands and the need to grow the country’s energy supply (generation), transmission and distribution. Therefore, the UGGDS seeks to support energy supply growth while ensuring that options for energy efficiency, renewable and clean energy are maximized, and environmental pollution, risks and hazards associated, particularly with non-renewable energy sources, and with misuse of renewable energy are minimized. From that perspective, the focus of the green growth strategy is to design instruments, regulatory, market-based mechanisms and environmental sustainability instruments to promote sustainable development. The core instruments are: market based mechanisms such GeTFIT; utility charges; electricity generation from wastewater and sewerage (National Water and Sewerage Corporation - NWSC); and subsidy options to urban authorities for waste energy generation,
3.3.2 Target Outcomes
The outcomes proposed for the UGGDS are summarized in Table 10. The outcomes are in the eight areas of income and livelihoods enhancement, decent green jobs, climate change mitigation and adaptation, environment and natural resources management, food and nutrition security, resource use efficiency, social inclusiveness, and economic transformation at national and sub-national level.
The summarized target results in Table 9 are shown in the matrix below; over 3.3 million jobs are envisaged and a cumulative economic outturn based on multipliers worth an estimated UGX 234 trillion projected expected over the 10 year period, ( an annual average of UGX 23.4 trillion).

52 GREEN GROWTH DEVELOPMENT STRATEGIC FRAMEWORK
Table 9: A summary of target outcomes
Sectors Decent jobs* GHG emission reduction
(Million tonnes CO2e)
Economic transformative impact with multipliers (UGX
trillion)
Target for gender density
(%)
2e
Agriculture 155,158 13.4 5.37 75% women
Natural capital Overall 1,516,419
(90 %temporary 10% permanent)
36.3 40.04 30% men
Green cities 1,250,000 1.1 163.88 50% women
Transport 389,830 1.9 11.2 30% women
Energy 54,609 18.5 13.67 30% women
Total 3,366,016 71.2 234.16
*Permanent jobs unless otherwise stated.

53THE UGANDA GREEN GROWTH DEVELOPMENT STRATEGY, 2017/18 – 2030/31
Tabl
e 10:
Res
ults
Fram
ewor
k - P
lann
ed O
utco
mes
of th
e UGG
DS
Are
aSt
rate
gy
Targ
eted
out
com
es
Inco
me
and
livel
ihoo
ds
enha
ncem
ent
Dec
ent g
reen
jo
bsCl
imat
e ch
ange
ad
apta
tion
&
miti
gatio
n
Envi
ronm
ent
and
natu
ral
reso
urce
s m
anag
emen
t
Food
and
nu
triti
on
secu
rity
Reso
urce
use
ef
ficie
ncy
Soci
al
incl
usiv
enes
sEc
onom
ic tr
ansf
orm
atio
n at
nat
iona
l and
loca
l lev
el
Agric
ultu
re
Incr
ease
d ac
cess
to
irrig
atio
n fa
cilit
ies
144,
000
hous
ehol
ds/ y
ear
Econ
omic
gro
ss
mar
gin/
ha: U
GX
500,
000/
ha
19,3
00/y
r –
build
ing
of
wat
er re
serv
oirs
30,0
00/y
ear
casu
al la
bour
ers
49,3
00/jo
bs
adde
d
tota
l Em
issio
n Re
duct
ions
=
13.4
mili
on(M
) tC
O2e
by
2030
from
im
prov
ed so
il m
anag
emen
t, liv
esto
ck m
ix a
nd
man
agem
ent
(see
Ann
ex 1
)
Adap
tatio
n be
nefit
s: In
clud
e in
crea
sed
adap
tive
capa
city
from
irr
igat
ion,
In
tegr
ated
Soi
l an
d Fe
rtili
ty
Man
agem
ent
Inte
grat
ed in
to
catc
hmen
t m
anag
emen
t pl
an (5
ca
tchm
ents
)
Assu
red
food
se
curit
y fo
r ad
ditio
nal
240,
000h
h/
year
Ratio
of w
ater
us
ed/w
ater
re
quire
men
ts
for t
arge
t cro
p =
1.25
:1 o
ptim
al
wat
er u
se
An a
dditi
onal
24
,000
ho
useh
olds
pe
r yea
r hav
e en
ough
wat
er
for p
rodu
ctio
n an
d do
mes
tic
use
Addi
tiona
l loca
l and
nat
iona
l ec
onom
ic m
ultip
lier (
1.56
)
= (1
.56x
500,
000x
144,
000)
= 4
6.8
billi
on/y
ear
Cum
ulat
ivel
y by
203
0
=U
GX
2.34
trill
ion
Inte
grat
ed
soil
fert
ility
m
anag
emen
t
41,0
00 h
a/ye
ar
Econ
omic
gro
ss
mar
gin/
ha: U
GX
250,
000/
ha
41,0
00 c
asua
l jo
bs a
dded
1 w
orke
r per
ha/
year
Inte
grat
ed in
to
catc
hmen
t m
anag
emen
t pl
an (5
ca
tchm
ents
)
Assu
red
food
se
curit
y fo
r ad
ditio
nal
240,
000h
h/
year
Ratio
of w
ater
us
ed/W
ater
re
quire
men
ts
for t
arge
t cro
p =
1.25
:1 o
ptim
al
wat
er u
se
Bene
ficia
ry
hous
ehol
ds,
are
fem
ale
farm
ers,
byla
ws o
n eq
ualit
y to
en
sure
equ
al
acce
ss to
re
venu
e
Addi
tiona
l loca
l and
nat
iona
l ec
onom
ic m
ultip
lier (
1.56
)
= (1
.56x
500,
000x
60,0
00)
= 2
3.4
billi
on/y
ear
Cum
ulat
ivel
y by
203
0
=U
GX
1.17
trill
ion
Upg
radi
ng th
e va
lue
chai
n fo
r str
ateg
ic
ente
rpris
es
Valu
e ad
ded
incr
ease
d of
UG
X 77
billi
on/y
ear b
y 20
30
At a
labo
ur
prod
uctiv
ity o
f U
S$7,
871.
35/
wor
ker (
ND
P II)
64,8
58 jo
bs
adde
d
Cont
ribut
ion
to
the
irrig
atio
n an
d IS
FM
and
land
m
anag
emen
t ta
rget
Cont
ribut
ion
to
the
irrig
atio
n an
d IS
FM
and
land
m
anag
emen
t ta
rget
Ratio
of w
ater
us
ed/W
ater
re
quire
men
ts
for t
arge
t cro
p =
1.25
:1 o
ptim
al
wat
er u
se
40%
of v
alue
ad
ditio
n jo
bs
crea
ted
for
wom
en, 1
0%
for o
ther
vu
lner
able
gr
oups
Addi
tiona
l loca
l and
nat
iona
l ec
onom
ic m
ultip
lier (
1.56
+ ba
ckw
ard
linka
ges 0
.86
+ fo
rwar
d lin
kage
s 0.3
5 =
2.42
)
Cum
ulat
ivel
y by
203
0
= (7
7x10
x2.4
2) =
UG
X 1.
863t
rillio
n
Nat
ural
ca
pita
l m
anag
emen
t an
d de
velo
pmen
t
Tour
ism
deve
lopm
ent
Incr
ease
val
ue fr
om
Fore
ign
tour
ism
from
US$
123.
5 m
illio
n to
US$
500
mill
ion
(202
0 to
20
30)
Incr
ease
val
ue
of o
ther
tour
ism
valu
e fro
m
US$
543.
5mill
ion
to
US$
1bill
ion
from
20
20 to
203
0
At a
labo
ur
prod
uctiv
ity o
f U
S$5,
217.
65/
wor
ker (
ND
P II)
359,
213
jobs
ad
ded
Adap
tatio
n be
nefit
s are
pl
enty
are
al
read
y co
vere
d in
the
ecos
yste
m
serv
ices
Tota
l incr
ease
in v
alue
(U
S$1.
5 bi
llion
less
US$
667
mill
ion)
= U
S$83
3mill
ion
Serv
ices
inco
me
mul
tiplie
rs
are
2.25
Tota
l eco
nom
ic b
enef
it ex
pect
ed to
be
= U
S$1.
874
billi
on
or U
GX
6.8
4 tr
illio
n

54 GREEN GROWTH DEVELOPMENT STRATEGIC FRAMEWORK
Are
aSt
rate
gy
Targ
eted
out
com
es
Inco
me
and
livel
ihoo
ds
enha
ncem
ent
Dec
ent g
reen
jo
bsCl
imat
e ch
ange
ad
apta
tion
&
miti
gatio
n
Envi
ronm
ent
and
natu
ral
reso
urce
s m
anag
emen
t
Food
and
nu
triti
on
secu
rity
Reso
urce
use
ef
ficie
ncy
Soci
al
incl
usiv
enes
sEc
onom
ic tr
ansf
orm
atio
n at
nat
iona
l and
loca
l lev
el
Sust
aina
ble
fore
stry
m
anag
emen
t
Fore
sts i
n U
gand
a co
ntrib
utio
n an
nual
eco
syst
em
serv
ice
flow
s of
UG
X 6,
092,
371/
ha
This
valu
e ex
clud
es
valu
e of
stoc
ks,
and
signi
fican
t bi
odiv
ersit
y hy
drol
ogic
al,
exist
ence
, opt
ion
valu
es
At a
labo
ur
prod
uctiv
ity o
f U
S$97
8/w
orke
r (N
DP
II)
344,
785
jobs
ad
ded
Affo
rest
atio
n an
d re
fore
stat
ion
has a
bate
men
t po
tent
ial o
f 35.
9 M
tCO
2e by
203
0,
this
incl
udes
ab
out 3
6%
from
avo
ided
de
fore
stat
ion
(coo
k st
oves
- En
ergy
)
Adap
tatio
n be
nefit
s are
pl
enty
are
al
read
y co
vere
d in
the
ecos
yste
m
serv
ices
Rest
orat
ion
of
160,
000h
a/ y
ear
mai
nten
ance
of
rem
aini
ng fo
rest
co
ver
The
136,
000h
a/
year
incr
ease
in
fore
st
cove
r and
m
aint
enan
ce
will
be
on
priv
ate
mos
tly
agric
ultu
ral
land
– n
eed
for f
orag
e,
soil
nutr
ient
en
hanc
emen
t, m
ulch
ing,
frui
t an
d fo
od c
rops
Fore
st
mai
nten
ance
w
here
net
fore
st
incr
ease
is
prop
ortio
nal t
o na
tiona
l tar
get.
Th
eref
ore
annu
al w
ood
use
at d
omes
tic
leve
l sho
uld
be th
e ex
cess
pl
antin
g be
yond
nat
iona
l ta
rget
.
At le
ast 5
0%
of fo
rest
land
re
stor
atio
n on
pr
ivat
e la
nd
will
be
done
by
wom
en.
Econ
omic
flow
s co
ntrib
utio
n sim
ilar t
o ag
ricul
ture
(mul
tiplie
r 1.5
6)
cum
ulat
ive
cont
ribut
ion
2020
-203
0 =
(1.5
6x10
x 12
9,50
0x6,
092,
371)
= U
GX
12.3
trill
ion
(202
0 –
2030
)
Sust
aina
ble
wet
land
sAn
nual
val
ue o
f flo
ws o
f eco
syst
em
serv
ices
from
w
etla
nd ra
nges
av
erag
e U
S$2,
718.
8/
ha/ y
ear
At a
labo
ur
prod
uctiv
ity o
f U
S$97
8/w
orke
r (N
DP
II)
585,
854
jobs
Abat
emen
t of
0.4
MtC
O2e
by
2030
,
Adap
tatio
n be
nefit
s are
pl
enty
are
al
read
y co
vere
d in
the
ecos
yste
m
serv
ices
Area
of w
etla
nds
rest
ored
thro
ugh
Econ
omic
In
stru
men
ts
(270
,000
ha
by 2
040)
25%
bi
odiv
ersit
y of
fset
s, an
d ot
her e
cono
mic
in
stru
men
ts
The
ecos
yste
m
serv
ices
from
w
etla
nds e
.g.
wat
er, m
ulch
, th
atch
, gra
ss
fora
ge fo
r liv
esto
ck,
amon
g ot
hers
w
ill b
oost
ag
ricul
tura
l pr
oduc
tion
Wet
land
m
aint
enan
ce
whe
re n
et
wet
land
in
crea
se is
pr
opor
tiona
l to
natio
nal t
arge
t.
Ther
efor
e an
nual
incr
ease
sh
ould
cat
er
for d
eclin
e in
w
etla
nd a
rea
At le
ast 5
0%
of w
etla
nd
rest
orat
ion
on
priv
ate
land
w
ill b
e do
ne
by w
omen
Econ
omic
flow
s co
ntrib
utio
n sim
ilar t
o ag
ricul
ture
(mul
tiplie
r 1.5
6)
cum
ulat
ive
cont
ribut
ion
2020
-203
0 =
(1.5
6x10
x 13
5,00
0 ha
9,9
23,4
37.5
)
= U
GX
12.3
trill
ion
(202
0 –
2030
)
=UG
X 20
.9tr
illio
n
Sust
aina
ble
and
optim
al
wat
er re
sour
ces
man
agem
ent
Estim
ated
eco
nom
ic
valu
e of
flow
s fro
m
a ca
tchm
ent w
as
estim
ated
at U
GX
8.5m
illio
n/km
2
At a
labo
ur
prod
uctiv
ity o
f U
S$97
8/w
orke
r (N
DP
II)
824,
146
jobs
Miti
gatio
n ov
erla
p w
ith
fore
stry
and
w
etla
nds
ecos
yste
ms
Adap
tatio
n be
nefit
s are
pl
enty
are
al
read
y co
vere
d in
the
ecos
yste
m
serv
ices
Estim
ated
tota
l ec
onom
ic v
alue
of
flow
s fro
m
a ca
tchm
ent
was
est
imat
ed
at U
GX
434,
560,
000/
km2
The
catc
hmen
ts
are
a pr
inci
ple
sour
ce o
f wat
er
for i
rrig
atio
n an
d do
mes
tic
use,
alre
ady
cove
red
in
othe
r val
ues
Ratio
of w
ater
us
ed/W
ater
re
quire
men
ts
for t
arge
t cro
p =
1.25
:1 o
ptim
al
wat
er u
se
At le
ast 5
0%
of fo
rest
land
re
stor
atio
n on
pr
ivat
e la
nd
will
be
done
by
wom
en
Econ
omic
flow
s co
ntrib
utio
n sim
ilar t
o ag
ricul
ture
(mul
tiplie
r 1.5
6)
cum
ulat
ive
cont
ribut
ion
2020
-203
0 =
(1.5
6x10
x 22
1,17
1km
2 x
8,52
6,74
2)
= U
GX
29.4
trill
ion
(202
0–20
30)

55THE UGANDA GREEN GROWTH DEVELOPMENT STRATEGY, 2017/18 – 2030/31
Are
aSt
rate
gy
Targ
eted
out
com
es
Inco
me
and
livel
ihoo
ds
enha
ncem
ent
Dec
ent g
reen
jo
bsCl
imat
e ch
ange
ad
apta
tion
&
miti
gatio
n
Envi
ronm
ent
and
natu
ral
reso
urce
s m
anag
emen
t
Food
and
nu
triti
on
secu
rity
Reso
urce
use
ef
ficie
ncy
Soci
al
incl
usiv
enes
sEc
onom
ic tr
ansf
orm
atio
n at
nat
iona
l and
loca
l lev
el
Plan
ned
gree
n ci
ties
Supp
ort
com
preh
ensiv
e ph
ysic
al
plan
ning
and
ef
ficie
nt w
aste
m
anag
emen
t (s
olid
and
w
aste
wat
er)
for a
t lea
st fi
ve
citie
s and
15
mun
icip
aliti
es
Indu
stria
l citi
es w
ill
incr
ease
wor
ker
prod
uctiv
ity
from
US$
977.
8 to
at l
east
50%
at
US$
5,21
7.65
for
new
wor
kers
. For
a
new
pop
ulat
ion
of
wor
kers
incr
easin
g fro
m 0
.74
to 1
.25
mill
ion.
(rura
l urb
an
mig
ratio
n no
t co
nsid
ered
)
1.25
mill
ion
new
jo
bs a
dded
Wat
er
man
agem
ent
miti
gatio
n 1.
1MtC
O2e
by
2030
The
adap
tatio
n be
nefit
s inc
lude
a
clea
n he
alth
ier
air t
o br
eath
e in
the
citie
s, cl
eane
r wat
er
for d
omes
tic
cons
umpt
ion
and
econ
omic
us
e, a
mon
g ot
hers
.
Effo
rts t
o pr
otec
t ur
ban
fore
sts,
wet
land
s, an
ca
tchm
ents
al
read
y in
clud
ed in
the
othe
r UG
GD
S pr
ogra
mm
es.
Plus
sust
aina
ble
proc
ure
and
was
te
man
agem
ent i
n ur
ban
area
s
All 3
.33
mill
ion
(202
0) to
5.7
5 m
illio
n (2
030)
pe
ople
in th
e fiv
e ta
rget
ci
ties w
ill b
e fo
od se
cure
Redu
ced
trav
el ti
me
(by
75%
), sa
ving
th
e ec
onom
y ov
er U
GX
70
billi
on/ y
ear f
or
Kam
pala
LRT
al
one.
Soci
al sa
fety
ne
eds e
.g. f
ood
dist
ribut
ion
to th
e po
orer
ho
useh
olds
in
urba
n ar
eas
base
d on
th
e su
rplu
s pr
oduc
tion
Econ
omic
flow
s fro
m
indu
stria
l citi
es a
nd
incr
ease
d w
orke
r pr
oduc
tivity
from
su
bsist
ence
farm
er le
vel t
o at
leas
t ser
vice
pro
vide
rs
incr
ease
d fro
m U
S$3.
06
billi
on/y
ear i
n 20
20 to
U
S$5.
28bi
illio
n/ye
ar
Cum
ulat
ive
= U
S$44
.9
billi
on, e
quiv
alen
t to
UG
X 16
3.88
trill
ion
over
10
year
sPr
omot
e su
stai
nabl
e pr
ocur
emen
t an
d in
terli
nkag
e be
twee
n ru
ral
area
s and
citi
es.
Sust
aina
ble
tran
spor
t Su
ppor
t pla
nned
m
ulti-
mod
al a
nd
mas
s tra
nspo
rt
syst
ems f
or u
rban
ar
eas c
ompr
ising
of
BRT
and
LRT
Tran
spor
t mod
e sh
ift w
ill re
duce
co
st o
f fre
ight
tr
ansp
orta
tion
from
cu
rren
t ave
rage
of
US
cent
s 16/
tonn
e/km
to a
vera
ge U
S ce
nts 5
/ ton
ne/k
m.
At th
e hi
ghes
t la
bour
pr
oduc
tivity
of
US$
7,87
1.35
Capa
city
to
crea
te 3
89,8
30
addi
tiona
l job
s lin
ked
to sa
ving
s an
d ga
ins
from
savi
ngs
new
mod
es o
f tr
ansp
ort a
nd
back
war
d an
d fo
rwar
d lin
kage
s to
serv
ices
, in
dust
ry a
nd
agric
ultu
re
Bus R
apid
Tr
ansp
ort –
0.3
M
tCO
2e
Fuel
effi
cien
t ve
hicl
es –
1.6
M
tCO
2e
The
adap
tatio
n be
nefit
s inc
lude
a
clea
n he
alth
ier
air t
o br
eath
e in
th
e ci
ties,
The
LRT
will
save
Re
duce
d
fuel
co
nsum
ptio
n
(by
75%
) re
sulti
ng in
sa
ving
s of
arou
nd U
GX
56 b
illio
n/ye
ar
If th
e em
ploy
men
t is
achi
eved
th
en 3
89,8
30
hous
ehol
ds
will
be
able
to
att
ain
food
se
curit
y ba
sed
on th
e G
DP
savi
ngs a
nd
gain
s.
The
redu
ced
cost
of t
rans
port
pe
r ton
ne
of c
argo
will
co
nsid
erab
ly
redu
ce th
e sla
ck
in th
e va
lue
chai
n be
twee
n ru
ral a
nd u
rban
m
arke
ts a
nd
expo
rt. A
st
anda
rd fo
r go
od tr
ansp
ort
wou
ld in
crea
se
mar
ket
effic
ienc
y
Empl
oym
ent
crea
tion
(dire
ct a
nd
indi
rect
) lin
ked
to tr
ansp
ort
deve
lopm
ent
shou
ld
prov
ide
equa
l op
port
uniti
es
for b
oth
wom
en a
nd
men
, at a
pr
ofes
siona
l le
vel.
Savi
ngs o
f SG
R ex
pect
ed
at U
S$ 2
billi
on/ y
ear.
The
re
al e
cono
mic
ben
efit
is
max
imiz
ing
the
econ
omic
be
nefit
of b
ackw
ard
and
forw
ard
linka
ges a
ssoc
iate
d w
ith e
ffici
ent t
rans
port
Adde
d m
ultip
liers
(0.8
6 –
Agric
ultu
re, 1
.7 in
dust
ry,
1.75
– se
rvic
es)
prop
ortio
ns o
f GD
P us
ed (2
3.6%
, 19.
7% a
nd
56.7
%, r
espe
ctiv
ely
= U
S$3.
06bi
llion
/yea
r eq
uiva
lent
to U
GX
11.2
tr
illio
n/ye
ar o
f GD
P ga
ins
Supp
ort
deve
lopm
ent,
utili
zatio
n an
d in
terc
onne
ctiv
ity
of th
e pl
anne
d na
tiona
l, reg
iona
l tr
ansp
ort
conn
ectiv
ity,
Stan
dard
Gau
ge
Railw
ay fo
r the
co
untr
y

56 GREEN GROWTH DEVELOPMENT STRATEGIC FRAMEWORK
Are
aSt
rate
gy
Targ
eted
out
com
es
Inco
me
and
livel
ihoo
ds
enha
ncem
ent
Dec
ent g
reen
jo
bsCl
imat
e ch
ange
ad
apta
tion
&
miti
gatio
n
Envi
ronm
ent
and
natu
ral
reso
urce
s m
anag
emen
t
Food
and
nu
triti
on
secu
rity
Reso
urce
use
ef
ficie
ncy
Soci
al
incl
usiv
enes
sEc
onom
ic tr
ansf
orm
atio
n at
nat
iona
l and
loca
l lev
el
Supp
orts
the
prom
otio
n of
rene
wab
le
ener
gy
inve
stm
ents
an
d su
stai
nabl
e us
e ot
her
ener
gy
sour
ces
Rene
wab
le
ener
gy
inve
stm
ents
in
bio
mas
s fo
r ele
ctric
ity,
tech
nolo
gy
effic
ienc
y fo
r do
mes
tic c
ooki
ng
and
indu
stria
l bi
omas
s ene
rgy,
so
lar e
nerg
y po
tent
ial,
geot
herm
al, a
nd
min
i and
larg
e hy
drop
ower
ge
nera
tion
Gro
w e
nter
prise
s fo
r effi
cien
t cle
an
ener
gy st
oves
, im
prov
ed k
ilns,
sola
r sy
stem
s
The
outc
omes
is
incr
ease
d va
lue
of e
cosy
stem
se
rvic
e flo
ws o
f U
GX
6,09
2,37
1/ha
of f
ores
t sav
ed.
Savi
ngs w
ill b
e
UG
X 1.
04 tr
illio
n/ye
ar
Serv
ices
jo
bs c
reat
ed
at a
labo
ur
prod
uctiv
ity o
f U
S$5,
217.
65/
wor
ker (
ND
P II)
54,6
09 jo
bs
Effic
ient
co
ok st
oves
ab
atem
ent o
f 13
.0 M
tCO
2e by
20
30
Sola
r PV
abat
emen
t po
tent
ial –
1.1
M
tCO
2e by
203
0
Expa
nded
larg
e H
PPs –
3.8
M
tCO
2e by
203
0
Smal
l HPP
s – 0
.6
MtC
O2e
by 2
030
Adap
tatio
n be
nefit
s cov
ered
in
eco
nom
ic
bene
fits
Savi
ngs i
n fo
rest
are
a fro
m
cutt
ing
woo
d fu
el p
er c
apita
co
nsum
ptio
n an
d ef
ficie
ncy
of k
ilns i
s eq
uiva
lent
to
170,
952
ha/y
ear
(bio
mas
s den
sity
138t
onne
s/ha
)
Incr
ease
d en
ergy
opt
ions
w
ill in
crea
se
the
abili
ty to
pr
epar
e m
eals
fo
r all
56%
of
the
hous
ehol
ds
reac
hed.
Thi
s w
ill in
crea
se
the
food
and
nu
triti
onal
se
curit
y.
Biom
ass e
nerg
y ef
ficie
ncy
– do
mes
tic
per c
apita
co
nsum
ptio
n re
duce
d by
50
%, E
nerg
y ef
ficie
ncy
for
char
coal
and
br
ick
kiln
s in
crea
sed
by
200%
.
Savi
ngs i
n w
ood
supp
ly p
er
year
–
savi
ngs o
f 23.
6 m
illio
n to
nnes
of
woo
d pe
r ye
ar.
The
rene
wab
le
ener
gy o
ptio
ns
for d
omes
tic
use
will
re
ach
at le
ast
56%
of t
he
hous
ehol
ds in
th
e co
untr
y.
The
mai
n be
nefic
iarie
s of
dom
estic
el
ectr
icity
and
re
new
able
en
ergy
are
, w
omen
, ch
ildre
n an
d po
or
hous
ehol
ds.
The
over
all o
utco
me
of re
new
able
ene
rgy
inte
rven
tions
are
look
ed a
t as
inte
rven
tions
to a
chie
ve
an o
utco
me
of re
duce
d w
ood
fuel
con
sum
ptio
n (e
nerg
y su
bstit
utio
n).
The
outc
omes
incl
ude
an
ecos
yste
m se
rvic
es su
pply
of
UG
X1.0
4 tr
illio
n/ye
ar,
equi
vale
nt to
UG
X10.
4 tr
illio
n ov
er 1
0 ye
ars
Plus
stan
d st
ock
valu
e U
GX3
.265
trill
ion,
a fi
xed
valu
e.
Supp
ort
deve
lopm
ent
and/
or
rein
forc
emen
t of
envi
ronm
enta
l, he
alth
and
ec
onom
ic
safe
guar
ds
for e
nerg
y ge
nera
tion
in th
e co
untr
y.

57THE UGANDA GREEN GROWTH DEVELOPMENT STRATEGY, 2017/18 – 2030/31
4 ENABLING ARRANGEMENTS
4.1 Institutional Arrangements and Governance
The UGGDS adopted the governance arrangements proposed in the second National Development Plan. The governance arrangement consists of the National Planning Authority (NPA), Ministry of Finance Planning and Economic Development (MFPED), all Ministries, Departments and Agencies (MDAs), representation from civil society, the private sector, and District Local Governments and relevant Urban Authorities. The green growth strategy is seeking to build further synergies to accelerate growth prospects and minimize slack associated with repetitiveness, access unutilized capacity and willingness to learn and improve efficiency of performance.
Pillar 1: National Green Growth Governance and Coordination Framework
A national governance framework is proposed. The national governance framework will provide regulatory oversight and provide support in ensuring the macroeconomic drivers and sustainability drivers are able to translate into policies for the private sector and other actors. The national governance and coordination framework will comprise the NPA, MFPED as representatives of Government and representatives of lead agencies for the UGGDS focal areas. It will also have representation from civil society and development parties.
The framework committee will be responsible for overall implementation including the monitoring and evaluation framework and ensuring that the green growth strategy is kept on track. Whereas the specific data, outputs and results will be maintained at the multi-sectoral implementation level, the national coordination framework will be responsible for keeping the outcomes on track through engagement with the implementing agencies. The national coordination framework will not directly implement projects or programmes, except those linked to outcomes, monitoring and evaluation coordination and governance, including financial oversight.
Pillar 2: Multi-Sectoral Implementation (MDAs, DLGs, Urban Authorities, Civil Society, Development Partners)
The second pillar is the multi-sectoral implementation level that pools lead public sector MDAs, other MDAs, District Local Governments (DLGs), and Urban Authorities (UA). The UGGDS has five focus: agriculture; natural capital; cities; transport and energy. Multi-sector institutional arrangements are proposed covering the scope

58 ENABLING ARRANGEMENTS
of the eight outcome areas and the implementation strategies required to achieve the green economy targets. Linkages between MDAs, DLGs and UAs will allow for a single regulatory and policy implementation level. MDAs will share responsibility for outcomes with DLGs and UAs. Programmes for project design will describe specific roles at different levels.
Responsibility for the results, outcomes and annual reporting on the performance of the UGGDS will be held at the multi-sectoral implementation level. The focus agencies will be responsible for development of projects, securing financing, implementation and monitoring of outputs. The multi-sector level will report at regular intervals on the performance of outcomes set in the results framework. The annual planning and sector performance reports will be key in prioritizing sector- specific green growth interventions and reporting on performance.
Pillar 3: Community implementation level, landscapes and cooperative groups
The focus of actions for green growth will be in landscapes including urban and rural landscapes. Landscapes are defined as groups of actors implementing the different programmes proposed under the UGGDS. Clusters enhance cohesion for communities, regional institutions and other actors who own resources and inputs including land, labour, capital.
An agricultural cluster will farmer groups, traders, agricultural research bodies, marketing agencies, and public sector regulators. The landscape allows for actors to interact and share information that will improve productivity, quality assurance and appropriately attribute the value captured by the different actors for a specified economic or socially inclusive activity.
Cooperative groups are defined as industry interactions that support production, savings and lending and marketing actions. At farmer level farmer cooperatives can engage in production of similar produce, quality assurance, storage, savings and credit, joint sale or marketing, processing, among others. All five areas of the UGGDS are expected to work with cooperative groups as the smallest reporting unit.
Figure 3: Proposed institutional framework for Uganda’s Green Growth Development Strategy
National UGGDS Governance and Coordination
Multi-Sectoral Implementation (MDAs, DLGs, Urban Authorities)
Implementation Level Cooperatives (Agriculture,
Cities, Energy, Transport, Natural Capital)

59THE UGANDA GREEN GROWTH DEVELOPMENT STRATEGY, 2017/18 – 2030/31
4.2 Resource Mobilization
Six major sources for financing the UGGDS are proposed. They include: mobilization from public sector allocations; environmental fiscal reforms and subsidy reforms; sustainable procurement; certification of sustainable production and trade and inclusive green social enterprises; green energy investments and incentives; green innovation and payments for ecosystem services; and international funding. The funding target is US$1.8 billion/year (GoU and NCE 2016).
Public Sector Allocation and Environmental Fiscal Reform
Public sector allocations and environmental fiscal reforms (EFRs) are expected to be a major source of funding. The funds will be through allocations to the natural capital sector, and infrastructure sectors, among others, as priorities in the UGGDS. Green growth interventions aim for catalytic effects that accelerate growth through efficiency improvements, resource maintenance and cost-effectiveness. Social inclusiveness will entail, among others, increased work opportunities and an improved quality of labour and labour productivity. The target of the UGGDs is to draw 30 percentof its financing from public sector allocations and EFRs, equivalent to US$540 million/year
It is envisaged that 30 percent of the funds needed for the green growth strategy will be obtained from public sector allocation and EFR reforms. The EFR reforms will extend to instruments for regulating environmental compliance among others.
Green Public Procurement
Another major source of funds for the green growth strategy will be sustainable procurements. To achieve strategy, the government will support sub-national sustainable procurement ordinances as well as develop regulations and guidelines on sustainable procurements at national level. Public procurements will involve finance from government and private sector engaged in public contracts.
Certification of Sustainable Production and Trade and Inclusive Green Social Enterprises
One of the key interventions for green growth is enhancing and/or ensuring the competitivness of sustainable value chains. Sustainable value chains may fail to compete against conventional production of timber, wood fuel, agriculture because the latter chains do not invest in resource maintenance and efficient resource use. Through certification of value chains, consumers will be able to understand premiums associated with sustainably produced products. This would also allow regulators to monitor the value chains of producers in the economy. The target is to draw 5 percent of the budget from sustainable trade and green enterprises equivalent to US$90 million/year.
Green Energy Investments and Incentives
Green energy investments and incentives are considered to be a major source of financing. There will be considerable investment in the biomass energy strategy and its implementation. The target financing for energy initiatives in the UGGD is is US$180 million/year.
Green Innovation and Payments for Ecosystem Services (PES)
Innovation funds and payments for environmental services will draw funds from the private sector, international innovations, research in biodiversity, climate change, health and other sectors. Whereas there are opportunities for acquiring patent rights where the profits from innovation can be substantial, there will

60 ENABLING ARRANGEMENTS
be a need to consider regulation for reinvesting some of the earnings from green innovations into the green growth sectors to minimize excessive fund outflows. The financing target from green innovation and PES is 5 percent return on investment per annum, approximately US$90 million/year.
International funding
International funding is expected to be an important source of finance in the piloting and scaling up phases of green growth strategies. Between 2018 and 2030, Uganda will access grants, sustainable financing schemes and private sector financing from international sources to secure at least US$ 480 million for the UGGDS annually.
4.3 Macroeconomic conditions
i. A GDP growth rate ranging between 5 percent and 10 percent per annum sustained in the long-term.
ii. A decline in the current account deficit from the current levels of 9.75 percent. The reduction in the current account deficit decline will be associated with an improvement in export of goods and services and hence price stability and sustained export growth
iii. An increase in net portfolio inflows through Foreign Direct Investment including into green growth development strategies.
iv. Stable and low inflation maintained close to the Bank of Uganda inflation target of 5 percent (MPFD 2016).
v. A stable banking sector able to offer credit to the private sector at affordable interest rates.
4.4 Shift in government expenditure
i. Shifting public procurements from value chains that encourage unsustainable production using natural capital, inefficient use of industrial resources, polluting industry and high waste generation towards more sustainable production, efficiency, minimal pollution and waste generating products and value chains– through green procurements.
ii. Shifting government expenditure from sectors and industries that undertake pollution generation, natural capital destruction and inefficient production towards sectors with higher efficiency
iii. Requirement for use of efficiency and sustainability standards and certification in service and goods production.
4.5 More effective enforcement of legislation
i. The green growth strategy requires the enhanced enforcement and implementation of legislation on the environment and natural resource management, natural capital management and economic and socially inclusive development. Investment in implementation of policy and legislation will require enforcement of compliance.
ii. Economic measures such as environmental fiscal reforms, and other incentives and disincentives can be used to reinforce the effective enforcement of legislation.
iii. Fiscal reforms covering old motor vehicles and encouraging new vehicles to reduce environmental damage.

61THE UGANDA GREEN GROWTH DEVELOPMENT STRATEGY, 2017/18 – 2030/31
4.6 Education and Training
i. The structural changes associated with the green growth strategy may require new knowledge and skills for government, decision makers, professionals and workers, down to local levels. The structural employment and institutional changes required may also require financial backing to accelerate the transition to sustainabilty of organizations and their employees and support for training and skills development, technical and vocational training.
4.7 Resource and Land Rights Regimes
i. Resource and land rights have to be designed in a manner that increases access to producers who will contribute to the economic, environmental and social targets of the green growth strategy. For example, the availability of land rights for women, the consolidation of land through agricultural cooperative to increase output and productivity.
ii. Resource right regimes have to be designed in a manner that allows for regulation for social and environmental safeguards while also attaining optimal but sustainable levels of production particularly for the use of natural capital (minerals, water etc.)
iii. Refugees in Uganda are either self-settled or live in organized settlements that cover approximately 350 square metres of land set aside by the government (World Bank Group 2016). Recent assessments suggest the country is beginning to buckle under pressure from regular influx especially from South Sudan and the Democratic Republic of Congo. A deliberate resource and land light alignment for refugees is required to manage impacts on society, environment and natural resources and the local and national economy.
4.8 Creating Enabling Conditions for Psychological and Behaviour Change
i. Framing green growth as a social goal, encouraging the choice of greener approaches, “nudge” techniques to help people make better decisions on those choices, and tailoring information to match with stakeholder incentives and approaches to learning are among the changes needed.
ii. Inclusive growth will be achieved by enhancing the attitude of marginal groups, especially women and the poor. There is a need to establish a means of mobilizing as many actors as possible to participate in green growth
4.9 Facilitating Businesses to Integrate Sustainability and Equity Concerns
i. There is a need for provision of information and for coordinating research on potential opportunities, especially about how to adopt the best available technologies and meet standards. Trade barriers should be adjusted reduced where necessary to enable access to technology, and financial subsidies should be provided to promote sustainable development.
ii. Public Private Partnerships will be fostered to share risk and cover upfront costs. Accountablity will be enhanced by widening reporting requirements
iii. Enhance accessibility to credit, including public sector incentives, and encourage innovative financing instruments

62 ENABLING ARRANGEMENTS
4.10 Generate Appropriate Data, Statistics and Policy Support Information.
i. The government needs to fast track a road map for integrating the system for environmental economic accounts to address the concerns of appropriate attribution of economic activities in terms of depletion and appreciation across all sectors of government.
ii. Undertake comprehensive environmental economic accounts across all sectors. Develop appropriate interfaces through input-output table analysis.
iii. The assessments generated should be used to describe and attribute responsibilities for resource maintenance, efficiency and effectiveness enhancement in production, consumption and distribution
iv. The scope of the Natural Capital Accounting (NCA) accounts should be wide, to capture socioeconomic activity and to support future policy and economic activity.

63THE UGANDA GREEN GROWTH DEVELOPMENT STRATEGY, 2017/18 – 2030/31
5 ROAD MAP FOR IMPLEMENTATION
5.1 Getting started
5.1.1 Mobilizing for Action (2017/18-2020/21)
The initial actions of the UGGDS implementation process comprise developing a communication strategy, and disseminating the strategy to stakeholders, development partners and the private sector. The NPA will engage in a process of getting policy-makers, and potential implementation partners to buy into the strategy.
Mobilizing stakeholders may also involve identifying changes in implementation arrangements, and technical and financial capacity for the institutions to participate in the UGGDS. For financing institutions, this may require realigning the outcomes within existing programmes and/or integrating the UGGDS into new programmes.
Figure 4: Implementation Path for Uganda’s Green Growth Development Strategy
• Communication strategy
• Disseminate UGGDS • Get buy-in
• Design programmes
• Resource mobilization
• Consolidate best practices
• Align institutional arrangements
• Agriculture • Natural Capital • Cities • Transport • Energy
• Evaluating outcome indicators
• Backward and forward linkages
Initate
Design
Establish enablingframework
Implement GG strategies
Evaluation & continuation

64 ROADMAP FOR IMPLEMENTATION
5.1.2 Consolidated Best Practices for Green Growth Interventions (2017/18-2020/21)
The UGGDS was developed through a diagnostic process that examined the status of implementation of the green economy. The strategy highlights several best practices that need to be scaled up and/or integrated within existing practices. Many practices also have to be eliminated as they perpetuate inefficiency. Examples of best practices include the GETFIT initiative, energy efficient cook stoves and efficient kilns while inefficient practices that may be eliminated are soil mining in agriculture, low value chains with gross losses for smallholder farmers, expensive transport systems for farmers and individual actions by smallholder farmers that lead to high costs of production.
This stage will be used to realign these practices with the green growth strategy outcomes. Consolidation needs to be undertaken in a systematic manner so that subsequent design of UGGDS programmes is in alignment with the goals and outcomes targeted by the strategy.
5.1.3 Programme Design and Resource Mobilization Arrangements (2017/18-2020/21)
The initial phase of the UGGDS implementation will be completed through a process of project design and resource mobilization. The strategy has clarified the areas and the strategies where the focus of green growth lies. The purpose of programme design is to align technical, human, financial resources in a feasible and viable manner. Establishing the technical feasibility of the proposed actions is important because it will allow for use of available capacity and also propose how additional capacity can be acquired. Effectiveness can be increased because benchmarks for performance will be reviewed.
Achievement of efficiency will be assessed ex ante through an evaluation process the results of which will be presented in the programme and project designs.
5.2 Implementing Strategies of UGGDS (2020/21-2030/31)
A detailed action plan/national green growth implementation roadmap sequences the interventions as short term for those to be implemented under the NDPII (2015/16-2019/20), medium term over the NDPIII period (2020/21-2024/25) and long term over the NDPIV period (2025/26-2029/30). It is important to note that the implementation of some strategies and interventions will spread over ten years and will therefore feature prominently in the ten-year long term National Development Plan (2021/21-2030/31).
The full implementation of the UGGDs programmes is expected to take place between 2020/21 and 2030/31. Whereas the initial actions are also part of implementation of the strategy, there is an allowance for refinement of outcomes, goals, actions in the initial phase. While in the implementation phase adjustments, will be based on evaluation and feedback. The monitoring and evaluation (M&E) framework is presented in Table 10. It shows the initial actions phase and the subsequent implementation as well as the operationalization of the M&E framework itself. An early assessment conducted by the Government of Uganda and New Climate Economy (2016) indicated that the UGGDS would cost US$1.8 billion/year. The National Planning Authority and MFPED take the lead on governance and coordination actions as well as the coordination of backward and forward linkages. support is envisaged from all stakeholders to the UGGDS.

65THE UGANDA GREEN GROWTH DEVELOPMENT STRATEGY, 2017/18 – 2030/31
Table 11: Matrix of monitoring and evaluation framework
Strategies/interventions
Indicator Means of measure
Data sources Implementation Timelines
Lead Agency
Mobilizing For Action
Landscape and catchment approaches, and leadership
Functional Landscape Stakeholders
Field surveys District Local Governments (DLGs)
2017/18 – 2019/20 MoLG/DLGs
Strengthening community cooperative groups
Village and sub-county/ Division cooperative groups
Field surveys Landscape s/holder forums
MDAs/DLGs
Sustainable production and private sector, research and technology linkages
Multi-stakeholder landscape forms include private sector, civil society
Field surveys Landscape stakeholder forums, MTIC, DLGs
MTIC
National Green Growth Governance Framework
An endorsement from cabinet
Field surveys NPA, MFPED NPA
Develop and implement a resource mobilization strategy
Implementation of new financing instruments for green growth
Field surveys, discussions with economic actors
Landscape stakeholder forums, NPA, MFPED
MFPED
Baseline Satellite System of Environmental Economic Accounts, Genuine Savings and Inclusiveness Analysis
Status of genuine savings and inclusiveness
Report from UBOS
NEMA, UBOS
NPA, MFPED
NEMA/UBOS
Consolidating Green Growth Interventions
Consolidating sustainable agriculture implemented and reforms to national extension system undertaken
Agricultural area under climate smart agriculture
No. of new extension staff
Field observations and MAAIF records
NPA, MAAIF, District Local Governments
2017/18 – 2019/20 MAAIF
Aggregating best case off-grid and on-grid energy projects led by private investment
Number of new off-grid energy investments
Field observations and
ERA records
ERA/MEMD MEMD
Scaling up clean cook-stoves
No. of new clean cook-stoves being used at household and institutional level
Field observations Surveys
records MEMD, CCD
MEMD
Consolidating industrial resource efficiency programmes
Percentage improvement in sector energy, water and other resource efficiency
Records on industry production performance
MEMD, NWSC, Industries
MTIC
MTIC
Aggregating best practice and integrated urban planning capacity
New urban integrated land use plans for all cities and municipalities
Cities and municipalities
MlHUD
5 planned Cities, NPA
5 planned Cities

66 ROADMAP FOR IMPLEMENTATION
Strategies/interventions
Indicator Means of measure
Data sources Implementation Timelines
Lead Agency
Development of communication strategy and attitude change strategy
Documents for communication and attitude change
Status of perceptions of communities towards green growth
Review reports on attitudes and perceptions
Communication strategy document
NPA
All MDAs, DLGs
NEMA
Landscape Forums
NEMA
Continual review and reinforcement communication strategy and attitude change strategy
Perceptions of communities towards green growth
Implementation Of Green Growth Development Strategies
Enabling Actions
Shift government expenditure from value chains that encourage unsustainable and/or inefficient production, and pollution
Redesigned value chains, market structure policies and guidance
Field observations
document review
MTIC, MFPED, MAAIF,
MFPED/NPA
Supporting more effective enforcement of legislation
New regulations, revision of ordinances and bylaws
Review of records
surveys
JLOS, District Local Governments
MFPED
NPA
JLOS
Education and training for economic actors engaged in implementation of the UGGDS.
Newly trained landscape extension, technical and MDA staff
Survey of workers
reports
MGLSD
NPA
District Local Governments
NPA
MGLSD
Support reforms in resource and land rights regimes
New national guidelines on land use for production
new land use patterns
Document review
reports
field observation
MLHUD
MoLG
District Local Governments
MLHUD
Facilitating businesses to fully integrate sustainability and equity concerns
Amendments to National Finance Act
Percentage of financing incentives for green growth in private sector
Field surveys
document reviews
MFPED
UIA
NPA
Private sector
UIA

67THE UGANDA GREEN GROWTH DEVELOPMENT STRATEGY, 2017/18 – 2030/31
Area Strategy Indicator Means of measure
Data sources/ Lead Agency
implementation Timelines
Lead Agency
Core Strategic Investments
Agriculture Increased access to irrigation facilities
Refer to results framework
Document review
Reports
Field observations Field surveys
Document reviews
MAAIF,
UBOS, DLGs
2020/21 – 2030/31
MAAIF,
Integrated soil fertility management
MAAIF,
UBOS, DLGs, NARO
MAAIF,
Upgrading the value chain for strategic enterprises
MAAIF,
UBOS, DLGs, MTIC
MTIC/UEPB
Natural capital management and development
Tourism development
MTWA, NFA
UWA, UWEC
MTWA
Sustainable forestry management
NFA, UWA, DLGs
MWE
Sustainable wetlands
MWE, NEMA, MHLUD,
Sustainable and optimal water resources management
MWE, DWRM, NWSC,
DWRM
Planned green cities
Support comprehensive physical planning and efficient waste management (solid and wastewater) for at least five cities and 15 municipalities
GKMC – Greater Kampala Metropolitan City,
MLHUD
MFPED
MoLG
4 Additional planned cities
GKMA and the 4 planned cities
Promote sustainable procurement and inter-linkage between rural areas and cities.
Sustainable transport
Support planned multi-modal and mass transport systems for urban areas comprising of BRT and LRT
MOWT, MFPED, GKMA and the 4 planned cities, All DLGs
MOWT

68 ROADMAP FOR IMPLEMENTATION
Area Strategy Indicator Means of measure
Data sources/ Lead Agency
implementation Timelines
Lead Agency
Support development, utilisation and interconnectivity of the planned national, regional transport connectivity, SGR
Support the promotion of renewable energy investments and sustainable use of other energy sources
Renewable energy investments in biomass for electricity, technology efficiency for domestic cooking and industrial biomass energy, solar energy potential, geothermal, and mini and large hydropower generation
All DLGs,
5 Planned Cities
MEMD
MoLG
MFED
MEMD
Support development and/or reinforcement of environmental, health and economic safeguards for energy generation in the country.
Monitoring and Evaluation Framework
Undertake baseline assessment through MDA reviews, local government, civil society and private sector reviews. Include field assessments.
Baseline survey report
baseline indicators
Observations, Records
NPA
Landscape Forums
MDAs, District Local Governments
2017/18 – 2030/31
NPA
Under annual evaluation include quarterly financial and technical reports
Annual technical and financial reports
Records

69THE UGANDA GREEN GROWTH DEVELOPMENT STRATEGY, 2017/18 – 2030/31
Area Strategy Indicator Means of measure
Data sources/ Lead Agency
implementation Timelines
Lead Agency
Undertake 5-year evaluations and redesign of green growth strategy based on progress made
Evaluation reports Records
Undertake terminal evaluation of UGGDS in 2040
Terminal evaluation report
Records

70 REFERENCES
REFERENCESAryamanya-Mugisha, H. (2011) Twenty Years of Wetland Conservation in Uganda – Have Uganda’s Wetlands become Wastelands Again? Public Talk, 2 February. Kampala: NEMA. Available from: http://www.uwasnet.org/Elgg/file/download/7019.
Berg, A and J. D. Ostry (2011). Inequality and Unsustainable Growth: Two sides of the same coin? IMF Staff Discussion Note, April 8, 2011, SDN/11/08. Washington D.C.: International Monetary Fund. Available from: https://www.imf.org/external/pubs/ft/sdn/2011/sdn1108.pdf.
Bwire, T. and others (2016). Private and Public Investments and Economic Growth in Uganda: A Multiplier Model Analysis. Bank of Uganda, Working Paper No. 01/2016, Kampala. Available from: https://www.bou.or.ug/bou/bou-downloads/research/BouWorkingPapers/2016/All/Investment-and-economic-growth-in-Uganda_revised.pdf.
Byaruhanga, A., M. Opige and P.Mafabi (2008). The Role of International Conventions in Protection of Species: A Case of Ramsar sites in Uganda. Kampala: NatureUganda. Available from: http://www.natureuganda.org/downloads/Posters/Ramsar%20Poster.pdf.
Christie, I. and others (2014). Tourism in Africa: Harnessing Tourism for Growth and Improved Livelihood. Africa Development Forum Report No: 88656, World Bank and Agence Française de Deéveloppement, available from: http://documents.worldbank.org/curated/en/738471468299123752/pdf/886560PUB0978100Box385230B00PUBLIC0.pdf.
ERA (2014) Developments and Investment Opportunities in Renewable Energy Resources in Uganda. Kampala. Available from: http://www.era.or.ug
ERA (2015). Grid Analysis for Integration of Wind/Solar Generation Plants. Kampala. Available from: http://www.era.or.ug/index.
ERA (2016a), Get Fit Uganda: Annual Report 2015, Kampala. Available from: http://www.era.or.ug/index.php/component/mijosearch/search?query=Get%20Fit%20Uganda.
ERA (2016b). Press Briefing: Uganda Commissions Largest Solar Plant in East Africa, 14 December. Kampala. Available from: http://www.era.or.ug.
Fajnzylber, P., D. Lederman and N. Loayza (2002). Inequality and violent crime. The Journal of Law and Economics, vol. 45, No.1.
Felipe, J. and R. Hasan (2006). The Challenge of Job Creation in Asia. Manila: Asian Development Bank. Available from: https://think-asia.org/bitstream/handle/11540/2137/pb044.pdf?sequence=1.
Fromm, I. (2007). Upgrading in Agricultural Value Chains: The Case of Small Producers in Honduras. German Institute of Global and Area Studies (GIGA), Working Papers, No 64. Available from: https://www.giga-hamburg.de/de/system/files/publications/wp64_fromm.pdf.

71THE UGANDA GREEN GROWTH DEVELOPMENT STRATEGY, 2017/18 – 2030/31
Gibbon, P. (2003). Commodities, Donors and Value-Chain Analysis and Upgrading. Paper prepared for UNCTAD. Copenhagen: Danish Institute for International Studies (DIIS). Available from: https://rmportal.net/framelib/commodities-donors-value-chain.pdf.
Gibbon, P. (2006) An Overview of the Certified Organic Export Sector in Uganda, Danish Institute for International Studies (DIIS) Working Paper no. 2006/13. Available from https://www.files.ethz.ch/isn/16879/Certified_Organic_Uganda.pdf.
Gibbon, P., and Bolwig, S. (2007) The Economics of Certified Organic Farming in Tropical Africa: A preliminary Assessment. DIIS Working Paper no. 2007/3, Sub-series on Standards and Agro-Food Exports (SAFE) no. 7. Available from: https://www.diis.dk/files/media/publications/import/extra/wp2007-320til20web.pdf.
Gollin, Douglas and Richard Rogerson (2010). Agriculture, Roads, and Economic Development in Uganda. National Bureau of Economic Research (NBER) Working Paper No. 15863. Available from: http://www.nber.org/papers/w15863.
Gollin, D., A. Mugyenyi and R. Sen (2016). Agricultural Transformation and Urbanization in Uganda. Bank of Uganda and International Growth Centre Policy note. Available from: https://www.theigc.org/wp-content/uploads/2016/10/Gollin-et-al-2016.pdf.
Government of Uganda 2017: Uganda Green Growth Implementation Roadmap: From Strategy to Action.
Government of Uganda 2017: The Uganda Green Growth Development Strategy, 2017/18 – 2030/31. Kampala.
Government of Uganda and the New Climate Economy Partnership (2016). Achieving Uganda’s Development Ambition. The Economic Impact of Green Growth: an Agenda for Action. Kampala: Ministry of Finance, Planning and Economic Development. Available from: https://newclimateeconomy.report/workingpapers/wp-content/uploads/sites/5/2016/11/Ugandas-development-ambition.pdf.
GoU (2013). Vision 2040: A Transformed Ugandan Society from a Peasant to a Modern and Prosperous Country within 30 Years. Kampala: NPA. Available from: http://www.npa.org. http://npa.ug/wp-content/themes/npatheme/documents/vision2040.pdf.
GoU (2015). Second National Development Plan (NDP II) 2015/16 – 2019/20. Kampala: NPA. Available from: http://npa.ug/wp-content/uploads/NDPII-Final.pdf
GoU (2016a). Uganda Wetlands Atlas, Volume 1. Kampala: United Nations and the Government of Uganda. Available from: http: http://www.ug.undp.org/content/dam/uganda/docs/UNDPUg17%20-%20Uganda%20Wetlands%20Atlas%20Volume%20I%20_Popular%20Version.compressed.pdf?download.
GoU (2016b). Uganda Wetland Atlas Volume II. Kampala: United Nations and the Government of Uganda Available from: http://www.ug.undp.org/content/uganda/en/home/library/SustainableInclusiveEconomicDevelopmentProgramme/UgandaWetlandsAtlas-VolumeII.html.
GoU (n.d). Briefing on the SGR Project for Uganda, Standard Gauge Railway Project. Kampala: MoWT Available from: http://www.sgr.go.ug.

72 REFERENCES
GoU and NCE (2016). Achieving Uganda’s Development Ambition, The Economic Impact of Green Growth: An Agenda for Action. Kampala: Ministry of Finance, Planning and Economic Development. Available from:http://newclimateeconomy.report/workingpapers/wp-content/uploads/sites/5/2016/11/Ugandas-development-ambition.pdf.
Hashemi A. and H. Cruickshank (2015). Delivering Sustainable Low-Income Housing in Uganda, Challenges and Opportunities. OIDA International Journal of Sustainable Development, vol. 08:10. Available from: https://papers.ssrn.com/sol3/papers.cfm?abstract_id=2705280.
Hillocks, J.R. (2014). Addressing the Yield Gap in Sub-Saharan Africa, Outlook on Agriculture, vol. 43. no. 2. pp. 85–90.
Industrial Economics, Incorporated (2016). The Contribution of Water Resources Development and Environmental Management to Uganda’s Economy, Final Report, prepared for Ministry of Water and Environment. Available from: https://www.mwe.go.ug/sites/default/files/library/Economic%20Study%202016-Contribution%20of%20Water%20Dev%27t.pdf.
Kakuru, W., N. Turyahabwe, and J. Mugisha, (2013) Total Economic Value of Wetlands Products and Services in Uganda. The Scientific World Journal, vol 2013, art. 192656. Available from: https://www.hindawi.com/journals/tswj/2013/192656/.
Kaizzi Kayuki 2014 Global Yield Gap Atlas: Uganda Results, National Agricultural Research Laboratories (NARL), Kawanda, Kampala. Also available at http://www.yieldgap.org/uganda
Kaplinsky, R. and Morris, M. (2001). A Handbook for Value Chain Research. Ottowa: International Development Research Centre. Available from: https://www.ids.ac.uk/ids/global/pdfs/VchNov01.pdf.
MAAIF (2011b). A National Irrigation Master Plan for Uganda (2010-2035). Kampala. Available from: http://www.fao.org/nr/water/AQUASTAT/countries_regions/Profile_segments/UGA-Sourc_eng.stm.
MEMD (2015). 2014 Statistical Abstract. Kampala. Available from: http://www.energyandminerals.go.ug/downloads/2014StatisticalAbstract.pdf.
MEMD (n.d). Promotion and Development of Nuclear Energy: Nuclear Power Infrastructure Development. Kampala. Available from: http://www.energyandminerals.go.ug.
MEMD-GoU (2015). National Biomass Energy Strategy (NBEST). Kampala: MEMD with support from UNDP, Kampala. Available from: http://www.undp.org/content/dam/uganda/docs/UNDPUg2014.
MFPED (2014). Uganda’s Employment Challenge: An Evaluation of Government’s Strategy. Available from: https://ecduganda.files.wordpress.com/2014/05/mofped_lily_employment-challenge.pdf.
MFPED (2016). Budget Speech 2016/17, Ministry of Finance Planning and Economic Development, Kampala. Available from: http://www.finance.go.ug.
MWE (2015). Economic Assessment of the Impacts of Climate Change in Uganda, Final Study Report. Available from: http://cdkn.org/wp-content/uploads/2015/12/Uganda_CC-economics_Final-Report2.pdf.
MWE (2016) National State of Forestry Resources Report Draft, Forestry Sector Support Department and National Forestry Authority, Ministry of Water and Environment, Kampala.
73THE UGANDA GREEN GROWTH DEVELOPMENT STRATEGY, 2017/18 – 2030/31
MoWT (2016). Annual Sector Performance Report 2015/16. Kampala. http://www.works.go.ug/wp-content/uploads/2016/10/Final-MoWT-ASPR-Report-2015-16.pdf.
NEPAD (2015). Uganda Agricultural Investment Opportunities Brief. CAADP Investment Facilitation Programme, NEPAD Planning and Coordination Agency (NPCA), Midrand, South Africa. Available from: http://abghq.com/downloads/Uganda_Agriculture_Investment_Opportunities_Brief.pdf.
Nkonya, E., and others (2008). Linkages between Land Management, Land Degradation, and Poverty in Sub-Saharan Africa: The Case of Uganda. International Food Policy Research Institute (IFPRI), Research Report No. 159, Washington, D.C. Available from: https://www.scribd.com/document/347175208/10-Linkages-between-Land-Management-Land-Degradation-and-Poverty-in-Sub-Saharan-Africa-pdf.
Ortiz I., and M. Cummins (2011). Global Inequality: Beyond the Bottom Billion. UNICEF Social and Economic Policy Working Paper. Available from: https://www.unicef.org/socialpolicy/files/Global_Inequality.pdf.
Oxfam (2013). The Cost of Inequality. Oxfam Media Briefing. Available from: https://www.oxfam.org/sites/www.oxfam.org/files/cost-of-inequality-oxfam-mb180113.pdf.
Parliament of the Republic of Uganda (2016). A Report of the Parliamentary Sectoral Committee on Natural Resources on the Ministerial Policy Statements and Budget Estimates for the FY2016/17. Kampala. Available from: http://csbag.org/wp-content/uploads/2016/11/Natural-Resources-Committee-Report-FY-2016-17.pdf.
Ravallion M. (2013). How Long will it Take to Lift One Billion People Out of Poverty? Policy Research Working Paper 6325. Washington DC: World Bank https://openknowledge.worldbank.org/bitstream/handle/10986/12166/wps6325.pdf?sequence=1&isAllowed=y.
Republic of Uganda, Ministry of Water and Environment (2012). Uganda National Climate Change Policy, Uganda national climate change draft costed implementation strategy. Annex C to the national climate change policy. Kampala: Ministry of Water and Environment.
Republic of Uganda (2015). National Budget Framework Paper. FY 2016/17 – FY20/21. Kampala: Ministry of Finance, Planning and Economic Development. Available from: http://budget.go.ug/budget/sites/default/files/National%20Budget%20docs/National%20Budget%20Framework%20Paper%20%28NBFP%29%20FY%202016-17.pdf.
Republic of Uganda (2015). Second National Development Plan (NDP II), 2015/16 – 2019/20. Kampala. Available from: http://library.health.go.ug/publications/leadership-and-governance/second-national-development-plan-ii-201516-201920.
Republic of Uganda (2016). Ministerial Policy Statement. Kampala: Various Ministries. Available from: http://budget.go.ug/budget/sites/default/files/Sector%20Spending%20Agency%20Budgets%20and%20Performance/Ministry%20of%20Ministry%20and%20Treasury%20Operations.pdf.
Republic of Uganda (2016). Report on Public Debt (Domestic and External Loans), Guarantees and Other Financial Liabilities and Grants for Financial Year 2015/16. Kampala: Ministry of Finance, Planning and Economic Development. Available from: http://mambosms.ug/Data/atha/finance/dmdocuments/Report%20on%20Public%20Debt,%20Guarantees%20and%20Grants%20FY%202015%20-16.pdf.

74 REFERENCES
Republic of Uganda (2017). Approved Estimates of Revenue and Expenditure (Recurrent and Development).,FY 2016/17. Volume I: Central Government Votes. Kampala: Ministry of Finance, Planning and Economic Development. Available from: http://csbag.org/wp-content/uploads/2016/07/APPROVED-ESTIMATES-OF-REVENUE-AND-EXPENDITURE-RECURRENT-AND-DEVELOPMENT-FY-2016-17.pdf.
Rodrigue, J., C. Comtois, and B. Slack (2016). The geography of transport systems. New York: Fourth Edition, Routledge.
Uganda Bureau of Statistics (UBOS) (2006). 2002 Uganda Population and Housing Census, Analytical Report, Kampala, Uganda. Available from:http://www.ubos.org/onlinefiles/uploads/ubos/pdf%20documents/2002%20CensusPopnSizeGrowthAnalyticalReport.pdf.
UBOS (2012). Uganda Demographic and Health Survey 2011. Kampala, Uganda. Available from: https://dhsprogram.com/pubs/pdf/FR264/FR264.pdf.
UBOS (2014). Statistical Abstract. Kampala Available from: http://www.ubos.org/onlinefiles/uploads/ubos/statistical_abstracts/Statistical_Abstract_2014pdf.
UBOS (2016a). Uganda Bureau of Statistics 2016, The National Population and Housing Census 2014 – Main Report. Kampala, Uganda. Available from: http://www.ubos.org/onlinefiles/uploads/ubos/NPHC/NPHC%202014%20FINAL%20RESULTS%20REPORT.pdf.
UBOS (2016b). Statistical Abstract 2016. Kampala. Available from: http://www.ubos.org/onlinefiles/uploads/ubos/statistical_abstracts/2016%20Statistical%20Abstract.pdf.
UNDP (2014). Uganda Strategic Investment Framework for Sustainable Land Management 2010 – 2020. Kampala. Available from: http://www.undp.org/content/undp/en/home/librarypage/environment-energy/sustainable_land_management/country-specific-evidence/uganda-strategic-investment-framework-for-sustainable-land-manag.html.
UNDP and NEMA (2017). Biodiversity Financing in Uganda: Policy and Institutional Review. Kampala: Available from: http://www.biodiversityfinance.net/sites/default/files/content/knowledge_products/Policy%20and%20Institutional%20Reveiw%20%20Report%20-%20May%202017.pdf.
USAID (2016). Power Africa in Uganda. Available from: https://www.usaid.gov/sites/default/files/documents/1860/UgandaCountryFactSheet.2016.09_FINAL.pdf.
USAID (2017). Draft Report Participatory Valuation of Bugoma Central Forest Reserve, USAID/EMOS, Kampala.
USAID (n.d.). Feed the Future. Available from: https://www.feedthefuture.gov/printpdf/23.
World Bank (2006). World Development Report 2006: Equity and Development. Washington DC. Available from: http://documents.worldbank.org/curated/en/435331468127174418/pdf/322040World0Development0Report02006.pdf.

75THE UGANDA GREEN GROWTH DEVELOPMENT STRATEGY, 2017/18 – 2030/31
World Bank (2010). Project Appraisal Document: Agricultural Technology and Agribusiness Advisory Services Project. Agriculture and Rural Development, Africa Region, Washington DC. Available from: http://projects.worldbank.org/P109224/agricultural-technology-agribusiness-advisory-services?lang=en.
World Bank (2013). Economic and Statistical Analysis of Tourism in Uganda. Washington DC. Available from: http://documents.worldbank.org/curated/en/117851468108862384/pdf/797680WP0Touri0Box0379789B00PUBLIC0.pdf.
World Bank (2015). Promoting Green Urban Development of African Cities: Kampala, Uganda. Washington D.C. Available from: http://documents.worldbank.org/curated/en/172411468190763021/Promoting-green-urban-development-in-African-cities-Kampala-Uganda-urban-environmental-profile.
World Bank Group (2016). An Assessment of Uganda’s Progressive Approach to Refugee Management, Washinton D.C. Available from: https://openknowledge.worldbank.org/bitstream/handle/10986/24736/An0assessment00o0refugee0management.pdf?sequence=1&isAllowed=y.
The World Bank (2016). Uganda Economic Update: from smart budgets to smart returns: Unleashing the power of public investment management. Washington DC, Uganda Economic Update, seventh edition. Available from: http://documents.worldbank.org/curated/en/859951467989540438/pdf/106178-REPLACEMENT-Uganda-Economic-Update.pdf.
WWF (2016) Sustainable Financing of the Rwenzori Mountains National Park: A Business Case and Opportunities for the Private Sector in Uganda (with partial valuation Study of the Rwenzori landscape and its contribution to the local and national economy), World Wide Fund for Nature, Uganda Country Office, Kampala
WWF and Fonds Français pour L’Environment Mondial (FFEM) (2016). Sustainable Financing of the Rwenzori Mountains National Park. Availavble from: https://europa.eu/capacity4dev/file/28289/download?token=ZNNtiDSC.
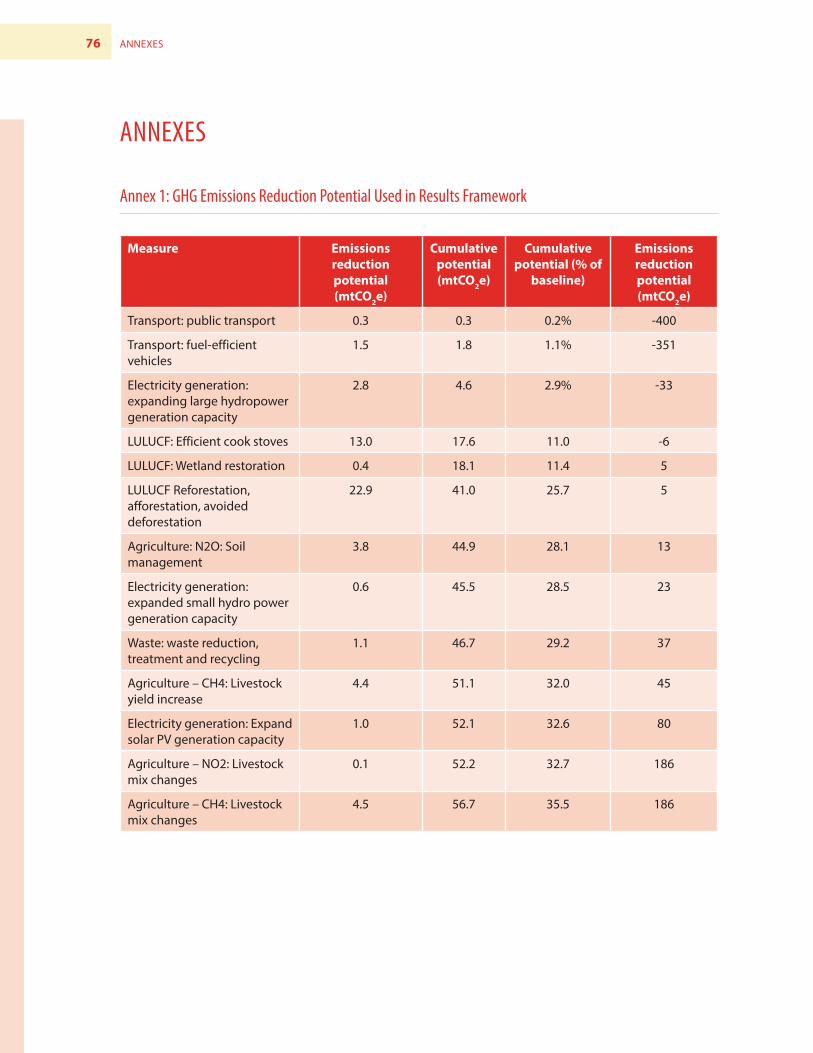
76 ANNEXES
ANNEXES
Annex 1: GHG Emissions Reduction Potential Used in Results Framework
Measure Emissions reduction potential (mtCO2e)
Cumulative potential (mtCO2e)
Cumulative potential (% of
baseline)
Emissions reduction potential (mtCO2e)
Transport: public transport 0.3 0.3 0.2% -400
Transport: fuel-efficient vehicles
1.5 1.8 1.1% -351
Electricity generation: expanding large hydropower generation capacity
2.8 4.6 2.9% -33
LULUCF: Efficient cook stoves 13.0 17.6 11.0 -6
LULUCF: Wetland restoration 0.4 18.1 11.4 5
LULUCF Reforestation, afforestation, avoided deforestation
22.9 41.0 25.7 5
Agriculture: N2O: Soil management
3.8 44.9 28.1 13
Electricity generation: expanded small hydro power generation capacity
0.6 45.5 28.5 23
Waste: waste reduction, treatment and recycling
1.1 46.7 29.2 37
Agriculture – CH4: Livestock yield increase
4.4 51.1 32.0 45
Electricity generation: Expand solar PV generation capacity
1.0 52.1 32.6 80
Agriculture – NO2: Livestock mix changes
0.1 52.2 32.7 186
Agriculture – CH4: Livestock mix changes
4.5 56.7 35.5 186

77THE UGANDA GREEN GROWTH DEVELOPMENT STRATEGY, 2017/18 – 2030/31
Annex 2: Agriculture
Water stress on crops: select example of maize, millet, sorghum and rice
Crop production systems in Uganda are mainly rain-fed. Water stress for rain-fed systems is estimated by comparing water limited yields (Yw) to yields under a standard moisture content. The Yw values per crop type were simulated for different crop types and controlled for sowing date, crop rotation, soil type combination, and agro-ecological zones. The results in Figures a to c show the percentage yield gap in the agro-ecological zone, based on the reference research simulation and data collected between 1998 and 2012. The target research stations were: 6501 (Kabale); 7401 (Mbarara); 7501 (Namulonge, Jinja); 7601 (Arua, Tororo and Bulindi); 8401 (Kitgum); and 8501 (Lira and Soroti). The agro-ecological zones represented by the stations are: (i) 6501 - Southwestern highlands; (ii) 7401 - Southwestern grass farmlands; (iii) 7501 - Lake Victoria Crescent; (iv) 7601 -West Nile Farmlands and Northwestern Farmlands, Central Wooden Savannah; (v) 8401 - Northeast Central Grass Bush Fallow; and (vi) 8501 - Northern Moist Farmlands.
The yield gap associated with water stress was lowest in the Southwestern Grass Farmlands followed by West Nile Farmlands and North Western Farmlands and the Northern Moist Farmlands, with an average yield gap ranging between 40 percent and 49 percent (Figure b). The average impact, a 51 percent yield gap, was for the Lake Victoria crescent. The highest impact of water stress resulted in a yield gap of 75 percent for Northeast Central Grass Bush Fallow and a 60 percent yield gap for the Southwestern Highlands.
In all major regions of the country water stress has a significant impact by reducing yield potential for maize and additional water supply to meet the moisture requirements of the maize crop would reduce the yield gap. Such an intervention could be achieved through solar irrigation.
Figure 5: Maize yield gap percentage to yield realised with optimal water content
Source: adapted from Kaizzi et al. 2013
0%
10%
20%
30%
40%
50%
60%
70%
80%
90%
100% 1999
2000
2001
2002
2003
2004
2005 2006
2007
2008
2009
2010
2011
6501 ((YP-YW)/YP)%
7401 ((YP-YW)/YP)%
7501 ((YP-YW)/YP)%
7601 ((YP-YW)/YP)%
8401 ((YP-YW)/YP)%
8501 ((YP-YW)/YP)%

78 ANNEXES
Large scale rice production mainly occurs in the Lake Victoria Crescent, West Nile Farmlands and North Western Farmlands and Northern Moist Farmlands (Figure c). In all three agro-ecological zones water stress limits crop yield by between 61 percent and 68 percent; the highest stress occurs in the Northern Moist Farmlands and the lowest in the West Nile Farmlands and North Western Farmlands, while rice production in the Lake Victoria Crescent suffers yield gap losses of 64 percent.
Figure 6: Rice yield gap percentage to yield realised with optimal water content
Of all four crops included in the case study, millet showed the lowest yield impact due to water stress ranging, on average, between 3 percent and 26 percent. The highest stress was in the Lake Victoria Crescent where average loss was 26 percent but particularly high, in excess of 40 percent in 2002, between 2004 and 2009, and in 2010.
0%
10%
20%
30%
40%
50%
60%
70%
80%
90%
100% 1998
1999
2000
2001
2002
2003
2004
2005
2006
2007
2008
2009
2010
2011
7501 ((YP-YW)/YP)%
7601 ((YP-YW)/YP)%
8501 ((YP-YW)/YP)%

79THE UGANDA GREEN GROWTH DEVELOPMENT STRATEGY, 2017/18 – 2030/31
Figure 7: Millet yield gap percentage to yield realised with optimal water content
The other water stress related yield gap for West Nile Farmlands and North Western Farmlands, Central Wooden Savannah, North East Central Grass bush fallow and Northern Moist Farmlands was quite low. Irigation would not be recommended for millet production as it is unlikely to be the major limiting factor, although significant in Lake Victoria crescent where millet is not a major staple crop.
-5%
0%
5%
10%
15%
20%
25%
30%
35%
40%
45% 1998
1999
2000
2001
2002
2003
2004
2005 2006
2007
2008
2009
2010
2011
2012
7501 ((YP-YW)/YP)%
7601 ((YP-YW)/YP)%
8401 ((YP-YW)/YP)%
8501 ((YP-YW)/YP)%

80 ANNEXES
Annex 3: Indicative Costing of the Uganda Green Growth Development Strategy
1. Introduction
The UGGDS has been developed as the country’s blueprint to the achievement of national goals and targets in a sustainable manner. It has been informed by the 2030 Transformative Agenda on Sustainable Development, the Uganda Vision 2040 and the second National Development Plan (NDP II 2015/16-2019/20). The UGGDS is expected to be financed by the public and private sector, supplemented with financial support from development partners. This presents a succinct estimate of the financial resources required to implement the UGGDS in the short, medium and long term.
This costing is an activity-based costing and is built up from the list of key actions contained in the Uganda Green Growth Implementation Roadmap that sequences interventions for the short, medium and long term. The Roadmap aims to operationalize the draft Uganda Green Growth Development Strategy (UGGDS), which identifies 13 strategies within the five core areas of agriculture, natural capital management and development, planned green cities, sustainable transport and energy for a green economy.
This costing provides a first estimate of the costs associated with implementing the UGGDS over the remaining three years of the NDP II, covering the years FY2017/18 to FY2019/20. In addition, first approximations of UGGDS costs are given for the two subsequent five-year planning periods (FY20/21 to FY2024/25 and FY2025/26 to FY2029/30). The remaining ten years through to the Vision 2040 horizon are not attempted because of the inherent uncertainty of costs associated with such a long-term planning period.
2. Indicative Costing of the UGGDS
Implementation of the UGGDS will cost the public finances in the region of US$ 11 billion. Table 1 breaks this figure down for each NDP planning period and provides an average annualized estimate.
Table 11. Public investment costs required to implement the UGGDS
Short term interventions
Medium term interventions
Long term interventions
FY17/18 - FY19/20 (NDP II)
US$ millions
FY 20/21 - FY 24/25 (NDP III)
US$ millions
FY 25/26 - FY 29/30 (NDP IV)
US$ millions
Totals by period 2,607 4,972 3,443
Annualised by period 869 994 689
The annual costs of the UGGDS rise into the NDP III period and subsequently decline as early public investments are completed.
3. Elements of the costing
Table 2 lists the public investment costs for each of the Core Areas of the UGGDS. The significant investment costs associated with promoting sustainable transport actions (e.g. the implementation of the Standard Gauge Railway lines) are very evident.

81THE UGANDA GREEN GROWTH DEVELOPMENT STRATEGY, 2017/18 – 2030/31
Table 12. Public investment costs for each of the Core Areas of the UGGDS
Core Area of UGGDS
FY17/18 - FY19/20 (NDP II)
FY 20/21 - FY 24/25 (NDP III)
FY 25/26 - FY 29/30 (NDP IV)
US$ millions % US$ millions % US$ millions %
Agriculture 176 7% 496 10% 677 20%
Natural capital management 104 4% 266 5% 366 11%
Planned green cities 360 14% 670 13% 906 26%
Sustainable Transport 1,842 71% 3,194 64% 1,051 31%
Energy for a green economy 100 4% 164 3% 161 5%
Cross-cutting actions 24 1% 182 4% 281 8%
Totals 2,607 100% 4,972 100% 3,443 100%
Note: columns may not add up to column totals due to rounding.
The indicative costing consists of 50 targeted interventions that are built up from the key actions identified in the UGGDS Roadmap. All these interventions are listed in Table 3, sorted by the five core areas of the UGGDS (with the addition of a cross-cutting theme to cover those actions that spread over more than one of the core areas of the UGGDS). Table 4 then goes on to provide a first estimate for each intervention.
Table 13. List of interventions by the Core Areas of the UGGDS
Core Area of the UGGDS
Development Area Title of Intervention
1 Agriculture Agriculture Development of solar irrigation for the most vulnerable
2 Agriculture Agriculture Improved agricultural knowledge and cultivation techniques
3 Agriculture Agriculture Increased access to sustainable agricultural inputs
4 Agriculture Agriculture Climate resilient, adaptive and productive crops widely used
5 Cross-cutting Increasing resilience & reducing risk
Community-based climate resilient agricultural systems implemented
6 Agriculture Agriculture Innovative insurance to protect farmers against crop failure due to extreme weather
7 Natural capital management
Tourism Tourism industry revenue is used to improve the livelihoods of local populations
8 Natural capital management
Tourism Tourism industry is made more climate resilient through diversification
9 Natural capital management
Forestry National Biodiversity Section Plan

82 ANNEXES
Core Area of the UGGDS
Development Area Title of Intervention
10 Natural capital management
Forestry Strengthened national forestry policy to reduce forest loss
11 Natural capital management
Forestry Sustainable forest management practices strengthened
12 Natural capital management
Forestry Introduction of agroforestry practices
13 Natural capital management
Forestry Payment for Environmental Services system functioning
14 Natural capital management
Forestry Efficient biomass energy production & consumption technologies & practices expanded
15 Natural capital management
Fisheries Climate change resilient fishing practices promoted
16 Natural capital management
Fisheries Sustainable fish farming practices promoted
17 Natural capital management
Fisheries Improved trans-boundary cooperation in fisheries and aquatic ecosystem management
18 Natural capital management
Water resources Integrated Water Resource Management systems in place
19 Natural capital management
Water resources Conservation and protection of watersheds against degradation
20 Natural capital management
Water resources Institutional and human resources in water resource use developed
21 Natural capital management
Minerals, oil and gas Regulated oil and gas sector to reduce GHG emissions
22 Planned green cities Urbanization/cities Integrated urban planning achieved
23 Planned green cities Urbanization/cities Flood risk management made effective
24 Planned green cities Urbanization/cities Biomethane production from landfill sites
25 Planned green cities Urbanization/cities Climate proofed transport and infrastructure development strategies
26 Planned green cities Urbanization/cities Climate proofed structural building codes enacted
27 Planned green cities Water supply and sanitation
Safe water facilities provided
28 Planned green cities Waste management Increased water harvesting and efficient water utilization
29 Planned green cities Urbanization/cities Housing development policies support low-income communities
30 Planned green cities Urbanization/cities New and enhanced green spaces in urban centres
31 Planned green cities Urbanization/cities Improved building energy efficiency

83THE UGANDA GREEN GROWTH DEVELOPMENT STRATEGY, 2017/18 – 2030/31
Core Area of the UGGDS
Development Area Title of Intervention
32 Sustainable transport
Transport Introduction of bus rapid transport system
33 Sustainable transport
Transport Implementation of light rail transit system
34 Cross-cutting Education, training & skills
Strengthened public transport system
35 Sustainable transport
Transport Implementation of all Standard Gauge Railway lines
36 Sustainable transport
Transport Introduction of vehicle emission standards
37 Sustainable transport
Transport Promote reduction of GHG emissions from transport sector
38 Energy for a green economy
Energy Increase household energy efficiency
39 Energy for a green economy
Energy Improved cookstoves
40 Energy for a green economy
Energy Enhanced focus on off-grid renewables
41 Energy for a green economy
Energy Reduction in GHG emissions from energy generation
42 Energy for a green economy
Energy Diversification of energy generation sources
43 Energy for a green economy
Energy Increased private sector involvement in clean energy generation
44 Energy for a green economy
Energy Developed domestic hydroelectric and geothermal power resources
45 Cross-cutting Increasing resilience & reducing risk
Gender considerations mainstreamed in climate change issues
46 Cross-cutting Increasing resilience & reducing risk
Climate change education, public awareness & knowledge management promoted
47 Cross-cutting Health and improved livelihoods
Climate smart population policies and programs put in place
48 Cross-cutting Health and improved livelihoods
Health workforce uses climate change information to improve health practices
49 Cross-cutting Health and improved livelihoods
Contingency plans in place for climate resilient health systems
50 Cross-cutting Health and improved livelihoods
Strengthen public health systems to respond to impacts of climate change

84 ANNEXES
Table 14. Estimated public investment costs for each intervention
Title of Intervention
FY17/18 - FY19/20 (NDP II)
US$ millions
FY 20/21 - FY 24/25 (NDP III)
US$ millions
FY 25/26 - FY 29/30 (NDP IV)
US$ millions
1 Development of solar irrigation for the most vulnerable
3.2 5.3 10.5
2 Improved agricultural knowledge and cultivation techniques
84.1 252.6 372.3
3 Increased access to sustainable agricultural inputs
51.5 171.6 278.8
4 Climate resilient, adaptive and productive crops widely used
5.5 7.1 11.8
5 Community-based climate resilient agricultural systems implemented
2.8 2.9 3.9
6 Innovative insurance to protect farmers against crop failure due to extreme weather
29.4 56.4 -
Agriculture 176.5 495.9 677.3
7 Tourism industry revenue is used to improve the livelihoods of local populations
0.7 2.0 -
8 Tourism industry is made more climate resilient through diversification
1.4 2.0 3.6
9 Estimated implementation cost of $10.6 million / year
31.8 53.0 53.0
10 Strengthened national forestry policy to reduce forest loss
0.4 2.3 -
11 Sustainable forest management practices strengthened
0.4 1.1 -
12 Introduction of agroforestry practices
55.1 146.8 201.9
13 PES system functioning 0.4 1.1 -
14 Efficient biomass energy production & consumption technologies & practices expanded
0.7 2.3 -
15 Climate change resilient fishing practices promoted
3.7 20.9 44.8
16 Sustainable fish farming practices promoted
- - -

85THE UGANDA GREEN GROWTH DEVELOPMENT STRATEGY, 2017/18 – 2030/31
Title of Intervention
FY17/18 - FY19/20 (NDP II)
US$ millions
FY 20/21 - FY 24/25 (NDP III)
US$ millions
FY 25/26 - FY 29/30 (NDP IV)
US$ millions
17 Improved trans-boundary cooperation in fisheries and aquatic ecosystem management
- - -
18 Integrated Water Resource Management systems in place
8.3 30.5 61.5
19 Conservation and protection of watersheds against degradation
- - -
20 Institutional and human resources in water resource use developed
0.9 2.7 -
21 Regulated oil and gas sector to reduce GHG emissions
- 1.8 1.5
Natural capital management 103.8 266.5 366.3
22 Integrated urban planning achieved
51.0 85.0 75.0
23 Flood risk management made effective
81.3 135.5 135.5
24 Biomethane production from landfill sites
- - -
25 Climate proofed transport and infrastructure development strategies
84.6 144.8 336.8
26 Climate proofed structural building codes enacted
1.1 1.0 -
27 Safe water facilities provided 11.4 28.4 -
28 Increased water harvesting and efficient water utilization
0.7
4.2
6.1
29 Housing development policies support low-income communities
- - -
30 New and enhanced green spaces in urban centres
- - -
31 Improved building energy efficiency
130.4
271.4
352.9
Planned green cities 360.5 670.3 906.3
32 Introduction of bus rapid transport system
30.7 92.0 -
33 Implementation of light rail transit system
- 193.1 965.6

86 ANNEXES
Title of Intervention
FY17/18 - FY19/20 (NDP II)
US$ millions
FY 20/21 - FY 24/25 (NDP III)
US$ millions
FY 25/26 - FY 29/30 (NDP IV)
US$ millions
34 Strengthened public transport system
76.3 - -
35 Implementation of all standard gauge railway lines
1,684.4 2,807.3 -
36 Introduction of vehicle emission standards
3.0 1.0 -
37 Promote reduction of GHG emissions from transport sector
47.6 100.4 85.3
Planned green cities 1,842.0 3,193.8 1,050.9
38 Increase household energy efficiency
10.6 17.6 17.6
39 Improved cookstoves - - -
40 Enhanced focus on off-grid renewables
84.5 140.8 140.8
41 Reduction in GHG emissions from energy generation
- 3.1 1.1
42 Diversification of energy generation sources
5.2 - -
43 Increased private sector involvement in clean energy generation
- 0.6 0.4
44 Developed domestic hydroelectric and geothermal power resources
- 1.8 1.5
Energy for a green economy 100.3 163.9 161.4
45 Gender considerations mainstreamed in climate change issues
1.4 2.9 4.5
46 Climate change education, public awareness & knowledge management promoted
1.2 3.2 3.7
47 Climate smart population policies and programs put in place
3.9 10.2 9.9
48 Health workforce uses climate change information to improve health practices
17.1 - -

87THE UGANDA GREEN GROWTH DEVELOPMENT STRATEGY, 2017/18 – 2030/31
Title of Intervention
FY17/18 - FY19/20 (NDP II)
US$ millions
FY 20/21 - FY 24/25 (NDP III)
US$ millions
FY 25/26 - FY 29/30 (NDP IV)
US$ millions
49 Contingency plans in place for climate resilient health systems
- 23.7 23.7
50 Strengthen public health systems to respond to impacts of climate change
- 141.8 239.3
Cross-cutting 23.6 181.8 281.1
4. Estimate of current Government spending that contributes to the UGGDS
An exploratory analysis was undertaken to try to distinguish between costs already budgeted for and new, additional costs that would be required to implement the UGGDS. This was only attempted for the first-time period (FY17/18 – FY 19/20) based on the current Medium Term Expenditure Framework 2017/18 – 2021/22, as no public expenditure has been committed for the two following time periods.
There are several existing sources of possible funding for the first three years of the UGGDS:
■ Domestic resources raised through the national budget
■ External finance channelled through the national budget
■ Bilateral donor support (off-budget project expenditure)
An estimate of the first two sources was made through an analysis of the Approved Estimates of Revenue and Expenditure (Recurrent and Development) for the Financial Year 2016/17 (the ‘Approved Estimates’) to provide an indicative net (additional) cost estimate for the implementation of the UGGDS over the first time period (for short-term interventions).
This analysis reduced the initial cost estimate of US$ 869 million per year for the short-term interventions of the UGGDS to US$ 840 million per year. This 3 percent reduction suggests that many of the UGGDS investment costs have yet to be incorporated into the budgeting process of the implementing ministries. However, there are some areas of the UGGDS where Government spending already exceeds the indicative UGGDS cost estimates, due to methodological and definitional differences. Overall, a total of US$ 521 million of relevant spending was identified in the Approved Estimates for 2016/17. Major capital spending projects (such as the Isimba and Karuma hydroelectricity projects) made up a large percentage of this total.

88 ANNEXES
5. Contribution of external finance
The planned scale up in total public investment is expected to contribute to a temporary increase in the overall fiscal deficit, as forecast in the FY2016/17 – FY2020/21 National Budget Framework Paper. External financing will therefore remain an important source of financing for Government’s public investment projects. A review of relevant external project financing in the Approved Estimates of Revenue and Expenditure, FY 2016/17, indicates that the implementation of the UGGDS will be enhanced by continuing external support (Table 5).
Table 15. List of external project financing relevant to the UGGDS for FY2016/17
No. ECT Code Project
Name External Financing (USD millions)
4 1139 ATAAS (Grant) EU, WB and DANIDA funded 5.0
4 1139 ATAAS (Grant) EU, WB and DANIDA funded 18.5
4 1316 Enhancing national food security 5.6
5 1363 Regional Pastoral Livelihood Improvement Project 8.8
10 1102 Climate change project 0.5
10 1301 The national REDD+ project 0.4
10 1417 Farm income enhancement and forestry conservation phase II 14.3
14 137 Lake Victoria Environmental Management Project 6.2
18 165 Support to Water Resource Management 0.9
18 1074 Water and sanitation development facility - North 4.4
18 1075 Water and sanitation development facility - East 2.1
18 1130 Water and sanitation development facility - Central 11.1
18 1359 Piped water in Rural Areas 11.1
40 1023 Promotion of renewable energy and energy efficiency 4.2
44 1026 Mputa Interconnection project 24.6
44 1143 Isimba hydroelectricity power plant 130.6
44 1183 Karuma hydroelectricity power project 226.2
44 1350 Muzizi hydro power project 3.8
Total 478.4

89THE UGANDA GREEN GROWTH DEVELOPMENT STRATEGY, 2017/18 – 2030/31
6. Methodology
This indicative costing has had to rely on secondary literature to derive a first approximation of the costs of the UGGDS. The results of the costing need to be considered in this light.
Two previous reports supplied the cost estimates that have been used. The first of these, the 2016 report by the Government of Uganda and the New Climate Economy Partnership ‘Achieving Uganda’s Development Ambition’ (AUDA) was developed to support the preparation of the UGGDS. This document includes annual investment costs for a series of green growth interventions. A second, earlier costing of the National Climate Change Policy (the draft Costed Implementation Strategy, (CIS )also provides detailed, activity-based investment costs over the short, medium and long term. Both reports were extensively peer-reviewed and validated through national consultations to provide assurance over the precision of the cost estimates.
For the indicative costing, each UGGDS Implementation Roadmap action was examined to see whether it corresponded to the costed actions of the two reports and where a thematic match was found the appropriate cost category was added. (It was found that more than one Roadmap action could contribute towards a single costed intervention.) The only additional costing source used was for the ‘Implement the National Biodiversity Action Plan’, where the investment cost was taken from the Action Plan itself.
For the AUDA , annual costs were available for each intervention and so could be summed to provide the three time period estimates. The data also indicated the split between public and private investment costs, with only the former being included. The CIS data were recorded for three five-year periods, so for the short-term actions only three-fifths of the first CIS period cost was included in the costing. (The CIS report did not distinguish between public and private investment costs, so it was assumed that the reported costs were all public costs.)
The implementing Ministries for all the interventions in the UGGDS were then determined, with a total of nine ministries being identified (Ministry of Agriculture, Animal Industry and Fisheries, Ministry of Lands, Housing and Urban Development, Ministry of Education and Sports, Ministry of Health, Ministry of Works and Transport, Ministry of Energy and Mineral Development, Ministry of Gender, Labour and Social Development, Ministry of Water and Environment, and Ministry of Tourism, Wildlife and Antiquities
To identify existing spending for the NDP II period, the UGGDS Implementation Roadmap actions were used to identify relevant budget line items in the Approved Estimates, using keyword analysis to search the FY 2016/17 Ministerial Policy Statements (MPSs) for each of the nine ministries to identify relevant budget lines across both the recurrent (programmes) and development (projects) budgets. For the development budget, Government and external financing sources were distinguished. With the potential programmes and projects identified in the MPSs, the 2016/17 Approved Estimates costs of expenditure were then extracted from the Approved Estimates. The Ugandan shilling 2016/17 Approved Estimates were then converted into US dollar amounts, using the exchange rate of UGX 1,000 to US$ 0.27322 on the reference date of 1 January 2017.
One final methodological step associated with the current spending estimates was to categorize the relevance of the budget spending to achieving the goals of the UGGDS interventions. Each budget line was assessed and put into one of three relevance categories: low, medium and high relevance, according to the perceived overlap between the budget line spending and the UGGDS actions. Weights of 10 percent, 50 percent and

90 ANNEXES
100 percent were then applied to the financial data to derive an indicative contribution to the green growth objective. All estimates were rounded to the nearest one million dollars to derive an indicative net costing of the UGGDS for short-term interventions on an annualized basis. It is acknowledged that this estimate may be conservative, in that only one year of budgeted spending has been accounted for, and it was not possible to assess external off-budget sources of funding.

Empowered lives. Resilient nations.
This Green Growth Development Strategy was prepared under the UNDP Low Emission Capacity Building (LECB) Programme, with funding from the European Commission, the German Federal Ministry for the Environment Nature Conservation, Building and Nuclear Safety, and the Australian Government. The LECB Programme is a country-driven initiative that promotes essential cooperation between relevant institutions, engaging the public sector and industry in a concerted effort to design and implement approaches to low emission development that are consistent with national development priorities. Uganda is one of the 38 countries participating in the programme.

SECTION TITLE
Empowered lives. Resilient nations.