the uks productivity puzzle · the uks productivity puzzle alex bryson john forth niesr (london)...
TRANSCRIPT

The UK’s Productivity Puzzle
Alex Bryson
John Forth NIESR (London)
23rd January 2014
Ecole Normale Supérieure, Paris

Nature of the Puzzle(s) in the UK • Big drop in GDP followed by slow rate of
recovery which has been unprecedented
• Labour market holding up: relatively high employment
• Low productivity growth relative to competitors
• Two puzzles
– Why has growth taken so long to return?
– Why has labour market responded differently this time compared to earlier recessions?

GDP Change from Peak Relative to Previous Recessions

Employment Change in Recent Recessions
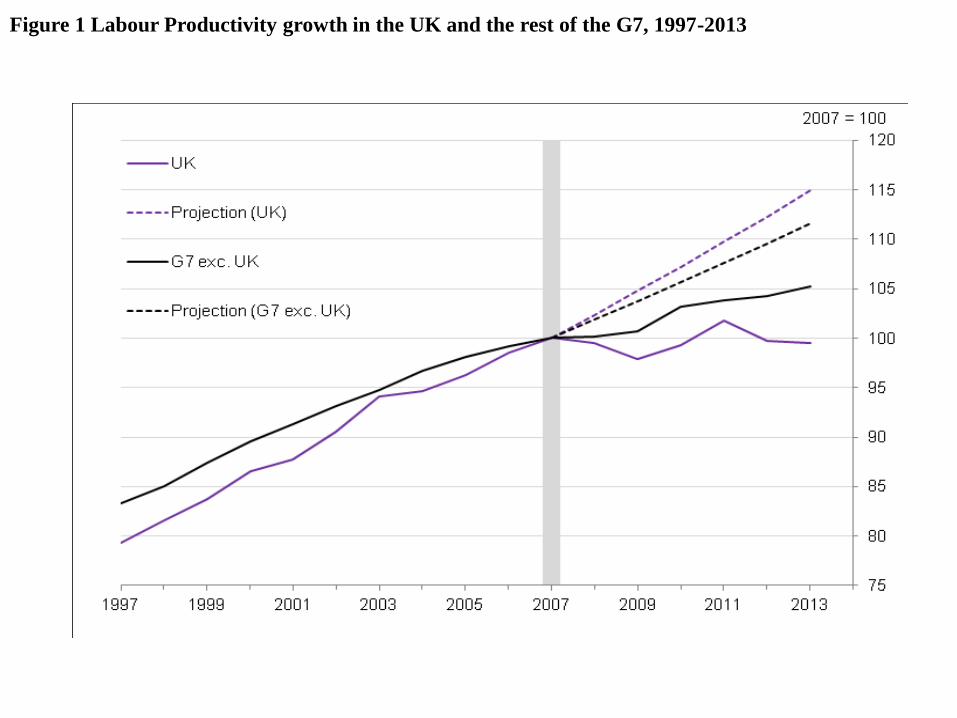
Figure 1 Labour Productivity growth in the UK and the rest of the G7, 1997-2013
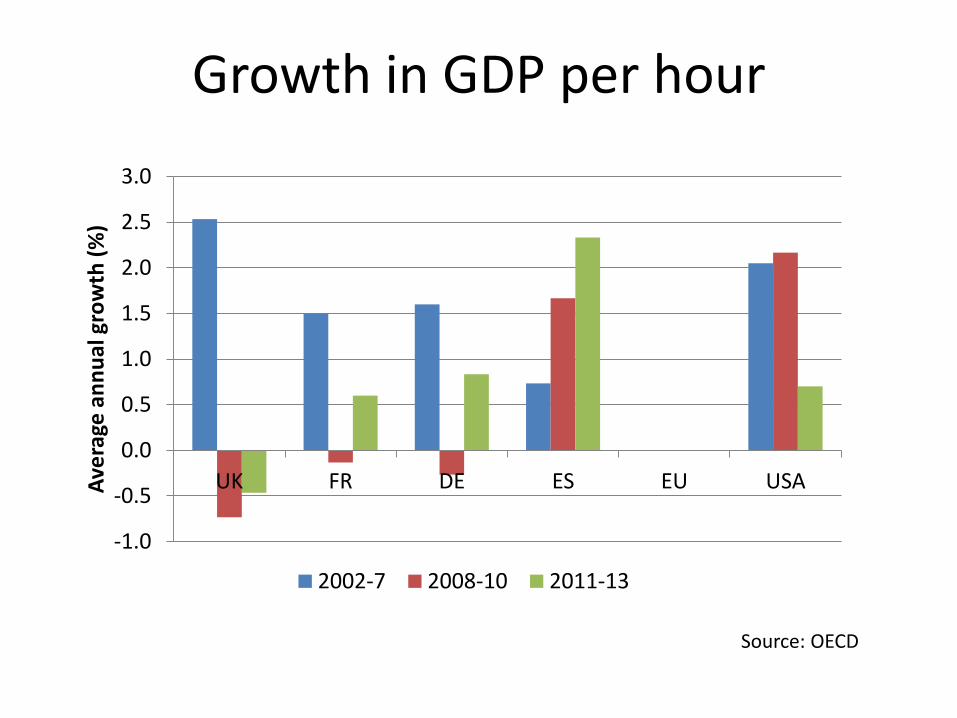
Growth in GDP per hour
Source: OECD
-1.0
-0.5
0.0
0.5
1.0
1.5
2.0
2.5
3.0
UK FR DE ES EU USA Ave
rage
an
nu
al g
row
th (
%)
2002-7 2008-10 2011-13

Structure of the Chapter
• Describe nature of UK productivity puzzle
• Review others’ take on what’s happening
• Provide some (partial) insights from micro analysis of workplaces
– WERS 2004-2011
– Some 1998-2004 analysis
• Speculate about the future

The Workplace Employment Relations Survey
• National survey mapping employment relations in workplaces across Britain.
• Unique and comprehensive: data collected from managers, worker representatives and employees in 2,700 workplaces with 5+ employees.
• Well-established: 1980, 1984, 1990, 1998, 2004, 2011
• Linked employer-employee:
• 2004 and 2011 cross-sections
• 2004-2011 Panel

Potential Explanations

Discussions have been about..... • The role of the Banking Sector (direct, indirect)
• Any ‘cleansing’ effect
• Incentives to innovate (conflicting hypotheses)
• Labour Hoarding
– If so why and to what end?
• The Flexible labour market
– Strong labour supply, falling real wages
• Capital shallowing
• Measurement error
– Output, capital stock; intangibles; estimating counterfactual

Hypothesis 1: A Banking Crisis
• Direct impact on UK’s large Finance Sector
• Expensive in taxpayer money and govt time
• Potential for credit constraints
• Evidence: – Many firms cash rich, interest rates low
– Lending fell more sharply than in previous recessions but had little impact on aggregate productivity (Riley et al)
– Concerns about forbearance (‘zombie’ firms), but not found to be substantial (Arrowsmith et al; Riley et al)

Hypothesis 2: No Cleansing Effect?
• Was the cleansing effect of the recession limited?
Evidence:
– Spike in liquidations, but rates of workplace closure no different to benign 1998-2004 (WERS)
– Low productivity not a strong predictor of exit (Harris and Moffatt; WERS)
– Variance in output and productivity rose (Barnett et al; Pessoa & Van Reenen; Field and Franklin)
– Chief contributor to falling productivity is within sector and within firm (Riley et al; Barnett et al)
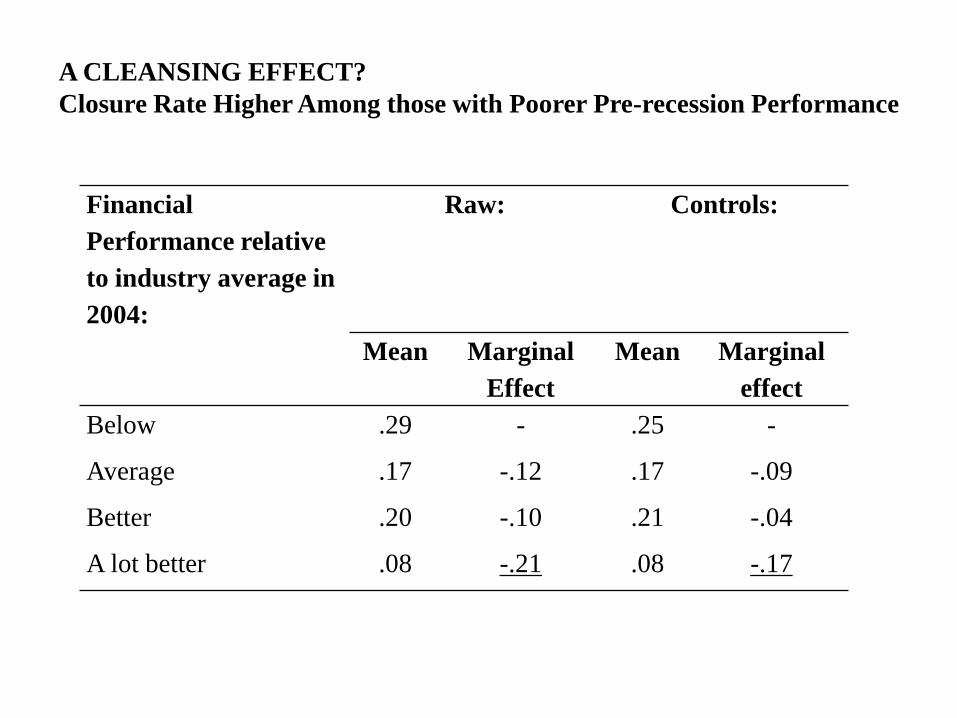
A CLEANSING EFFECT?
Closure Rate Higher Among those with Poorer Pre-recession Performance
Financial
Performance relative
to industry average in
2004:
Raw: Controls:
Mean Marginal
Effect
Mean Marginal
effect
Below .29 - .25 -
Average .17 -.12 .17 -.09
Better .20 -.10 .21 -.04
A lot better .08 -.21 .08 -.17

Decomposition of labour productivity growth into within and between firm

Hypothesis 3: Incentives to Innovate?
• Opportunity costs v uncertainty
Evidence:
– Decline in product and process innovation in firms though real R&D expenditure constant (ONS; Barnett et al)
– BoE estimated fall in product innovators accounted for 1pp of productivity shortfall between 2008 and 2012 (Barnett et al)
– Moderate degree of work reorganization and not linked to being hit by Crisis (van Wanrooy et al)
– Similar to early 90s (Geroski and Gregg)
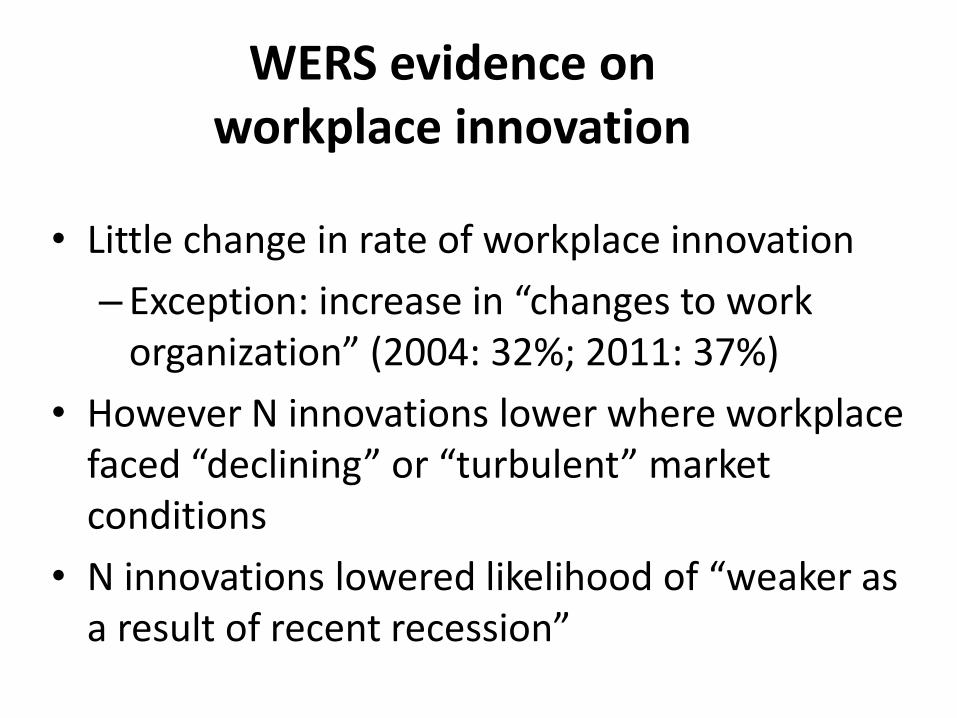
WERS evidence on workplace innovation
• Little change in rate of workplace innovation
– Exception: increase in “changes to work organization” (2004: 32%; 2011: 37%)
• However N innovations lower where workplace faced “declining” or “turbulent” market conditions
• N innovations lowered likelihood of “weaker as a result of recent recession”

Hypothesis 4: Labour Hoarding
• Labour retention in the face of declining demand – induced by uncertainty
Evidence:
– % firms with falling output but constant employment doubled in recession (Barnett et al)
– WERS shows healthy rates of employment growth at workplace level – see next slide
– WERS also suggests link between performance and employment change broken

Employment Change as a Percentage of Base Year Employment Level
Private Sector Panel – consistent with labour hoarding?
Shrunk by
at least 20%
No Change Grew by at
least 20%
2004-11, at least 10
employees:
25 40 34
1998-2004, at least 10
employees:
24 42 34
Source: WERS

Other evidence on labour hoarding
• Retention of high value-added workers creating intangible capital – not hoarding (Goodridge et al)
• WERS: growth in % skilled workers negatively correlated with workplace employment growth – In workplaces that had shrunk by at least 20%, the increase in the
percentage of employees who were skilled was 9 percentage points, whereas it was only 2 percentage points in workplaces that had grown by at least 20%
– Consistent with hoarding of skilled workers
• Hiring rates high relative to pre-recession – not hoarding (Barnett et al)

Hypothesis 5: Flexible Labour Market
• Are firms taking advantage of the UK’s flexible labour market?
Evidence:
– The UK economy supports more jobs now than it did prior to the recession
– Growth in non-standard jobs (part-time, temporary, self-employment; often involuntary -> underemployment)
– Now growth in full-time/permanent jobs
– Aided by growth in the labour force and declining real wages?

Rise of under-employment, 2008-13
Source: Bell and Blanchflower (2014)
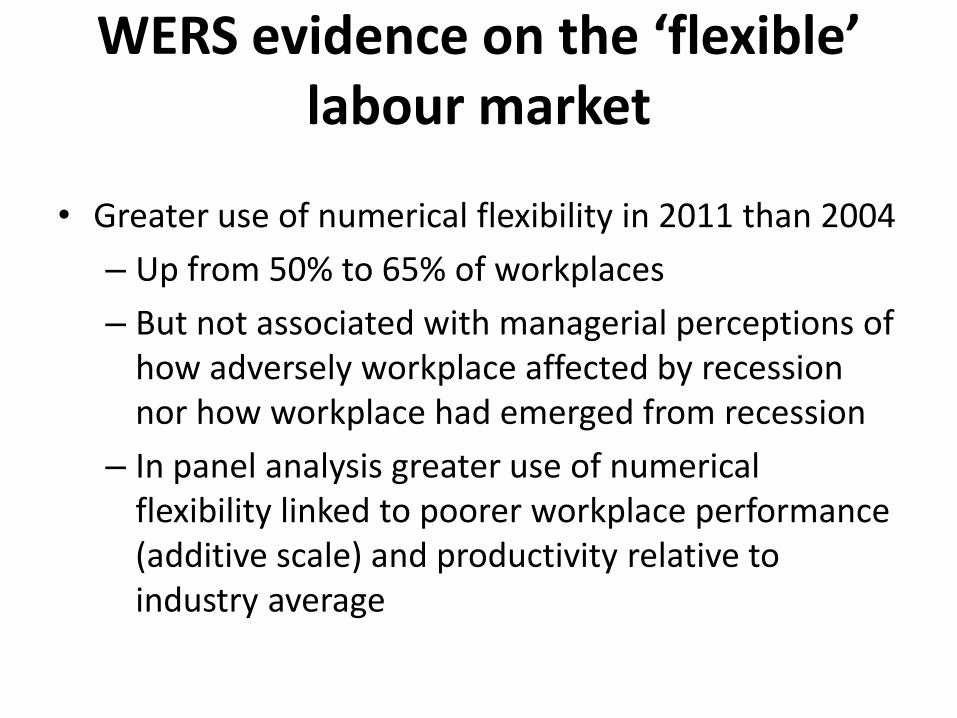
WERS evidence on the ‘flexible’ labour market
• Greater use of numerical flexibility in 2011 than 2004
– Up from 50% to 65% of workplaces
– But not associated with managerial perceptions of how adversely workplace affected by recession nor how workplace had emerged from recession
– In panel analysis greater use of numerical flexibility linked to poorer workplace performance (additive scale) and productivity relative to industry average
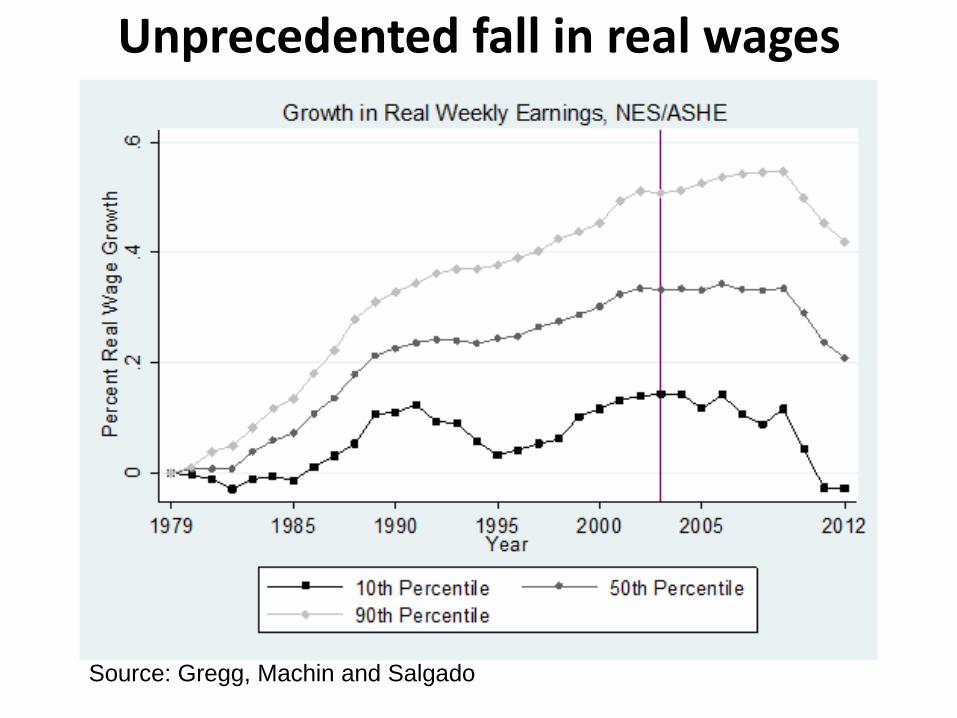
Unprecedented fall in real wages
Source: Gregg, Machin and Salgado
Falling Real Wages
• Which, if any, of these actions were taken by your workplace in response to the recent recession?
– 38% wage freeze/cut = most common response to recession
– Accompanied by other cost cutting actions in 4/5 cases
• % reporting pay freeze in last settlement doubled
– 12% in 2004, 26% 2011
– 36% where manager said affected “a great deal” by recession

WERS Evidence on What Lies Behind Falling Real Wages
• Union bargaining power? – No correlation between freezes/cuts and unionisation
– No correlation between pay freeze in last settlement and unionisation
– Little change in union wage premium (some counter-cyclicality)
– Hard to identify break point in union power • May have been some time ago?
• Welfare reform – Those using public job placement service and those drawing on
unemployed for recruits no more likely to freeze/cut pay
• Immigration – 1 percentage point in the number of non-EEA nationals employed at a
workplace raised the probability of a wage freeze or cut by roughly 0.4 of a percentage point
– % non-UK EEA nationals was not significant
Hypothesis 6: Capital Shallowing
• Fall in capital-labour ratio?
Evidence - heavily contested: – Pessoa and Van Reenen say accounts for 2/3 decline in labour
productivity, with hours decline also important but TFP minor
– By end 2013 8% lower than counterfactual in absence of recession, accounting for 2.5pp of productivity shortfall (Bennett et al)
– Field and Franklin disagree saying TFP is more important
– Harris and Moffat: no capital shallowing in manufacturing – instead LP decline in manufacturing attributed to decline in intermediary inputs. In services LP decline due to decline in TFP
Hypothesis 7: Slowdown in HRM investments
• Possibly part of the story in France – what about the UK?
Evidence:
– A progressive shift away from formal, collective approaches (i.e. problem-solving groups, group-based incentive pay and engagement with unions) towards a more individualistic focus (up-skilling, the direct management of quality and performance).
– However, no obvious change in trajectory between 1998-2004 and 2004-2011.

A SLOWDOWN IN HRM INVESTMENTS?
Share of employment in private sector workplaces with specific HR practices, 1998-2011
1998 2004 2011 2004 v
1998
2011 v
2004
2011 v
1998
% % % Signif. Signif. Signif.
Semi-autonomous team-working+ 44 35 48 *** ***
Functional flexibility+ 79 78 82 **
Training for 80%+ experienced
employees+
21 41 49 *** *** ***
Problem-solving groups 49 34 30 *** * ***
Quality targets 55 58 63
Appraisals for 80%+ non-
managerial employees
53 69 78 *** *** ***
Profit-related pay 53 44 43 *** ***
Share-ownership scheme 32 33 28 **
Voice:
Representative + Direct 26 31 33 ** ***
Representative only 43 28 24 *** * ***
Direct only 11 21 23 *** ***
Neither 20 20 19

Ordered probit regression of labour productivity on count of HR practices
private sector, 1998-2011
1998 2004 2011 1998 2004 2011
Controls? No No No Yes Yes Yes
Count of HR practices 0.11*** 0.10*** 0.05 0.11*** 0.09** 0.06
[2.77] [2.75] [1.53] [2.92] [2.32] [1.60]
N 1259 1210 1337 1258 1210 1337
Hypothesis 8: Measurement issues • Measurement issues and output revision may explain
4pp of productivity shortfall (Barnett et al)
• Difficulties measuring output – not huge contributor (Grice)
• North Sea output falling pre-recession
– Not fully accounted for in estimating trend
• Don’t capture intangibles where there has been big growth (Goodridge et al)
– From 2014 R&D has counted as part of gross fixed capital formation and thus part of GDP
• Big debate over TFP growth – better than 70s recession, similar to ‘80s (Pessoa and JVR)

Summary
• The Great Recession in the UK notable for the size of the output shock and the muted employment response – Employment/output recently reached pre-recession peak
– Real wage growth remains elusive
• Key point; Most of the decline in productivity was within-sector and within-firm
• Some limited evidence of capital shallowing, aided perhaps by falling real wages and flexible labour market
• But debates continue about the importance of changes in TFP
– Pessoa and Van Reenen: no structural break
– But Barnett et al. and Harris and Moffatt accord falls in TFP a more central role

Future
• Permanent loss?
– Barnett et al argue reduced investment in capital and impaired resource reallocation account for 6-9pp of 16pp shortfall in labour productivity
– UK productive capacity 2/3 its pre-recession rate (Ball) • Similar to France, smaller than Spain, larger than Germany
• Long tail of poorly-performing firms remains
• But reforms suggest long-term prospects good (Aghion et al) – Deregulation of capital flows; Higher Education; Welfare system; Labour law