the use and effectiveness of macroprudential … use and effectiveness of macroprudential policies:...
TRANSCRIPT

WP/15/61
The Use and Effectiveness of Macroprudential Policies: New Evidence
Eugenio Cerutti, Stijn Claessens, and Luc Laeven

© 2015 International Monetary Fund WP/15/61
IMF Working Paper
Research Department
The Use and Effectiveness of Macroprudential Policies: New Evidence
Prepared by Eugenio Cerutti, Stijn Claessens, and Luc Laeven1
March 2015
Abstract
Using a recent IMF survey and expanding on previous studies, we document the use of macroprudential policies for 119 countries over the 2000-13 period, covering many instruments. Emerging economies use macroprudential policies most frequently, especially foreign exchange related ones, while advanced countries use borrower-based policies more. Usage is generally associated with lower growth in credit, notably in household credit. Effects are less in financially more developed and open economies, however, and usage comes with greater cross-border borrowing, suggesting some avoidance. And while macroprudential policies can help manage financial cycles, they work less well in busts.
JEL Classification Numbers: E43, E58, G18, G28
Keywords: Macroprudential policies, Effectiveness, Procyclicality, Financial cycles
Author’s E-Mail Address: [email protected]; [email protected]; [email protected].
1 We would like to thank our discussant, Richhild Moessner, and other participants in the conference “Macroprudential regulation: from theory to implementation,” organized by De Nederlandsche Bank and the European Banking Center, Amsterdam, 29-30 January 2015, Claudia Jadrijevic and other IMF colleagues for very useful comments. Joshua Bosshardt provided excellent research assistance.
This Working Paper should not be reported as representing the views of the IMF. The views expressed in this Working Paper are those of the author(s) and do not necessarily represent those of the IMF or IMF policy. Working Papers describe research in progress by the author(s) and are published to elicit comments and to further debate.

2
Contents Page
I. Introduction ................................................................................................................................ 3
II. Data ........................................................................................................................................... 6
III. Empirical Analysis ................................................................................................................... 8 A. Main Regression Results ............................................................................................... 9 B. Extensions and Robustness ......................................................................................... 13
IV. Conclusions............................................................................................................................ 16 Tables: 1. Variables Definitions and Sources ........................................................................................... 20 1b. Regression Variables .............................................................................................................21 1c. Country Subgroup Classification ...........................................................................................22 2. Macroprudential Policy Variables ...........................................................................................24 3. Descriptive Statistics of Main Regression Variables ...............................................................25 4. Macroprudential Policies and Credit Growth: Main Regression Results ................................26 5. Effects of Instrument by Subgroups ........................................................................................27 6. Effects of Individual Instruments on Several Variables ..........................................................28 7. Effects on Cross-Border Credit Ratio ......................................................................................29 8. Interactions with Country Control Variables ...........................................................................30 9. Interactions with the Financial Cycle ......................................................................................31 Figures: 1. The Macroprudential Policy Index by Income Level ..............................................................32 2. The Relative use of Macroprudential Policies over Time, by Income Group .........................33 Annex: 1. Macro-Prudential Dataset ........................................................................................................34
3
I. INTRODUCTION
Macroprudential policies ̶ such as caps on loan to value and debt to income ratios, limits on credit growth and other balance sheet restrictions, (countercyclical) capital and reserve requirements and surcharges, and Pigouvian levies ̶ have become part of the policy paradigm in emerging markets and advanced countries alike. While macroprudential policies are being increasingly used, notably so since the global financial crisis, information on what policies are actually used across a large set of countries is still quite limited. And related, relatively few analyses exist on what policies are most effective in reducing procyclicality in financial markets and associated systemic risks.2 This paper aims to fill these two gaps. It first describes the usage of a large number of macroprudential policies, 12 to be precise, for a large, diverse sample of 119 countries over the 2000-13 period. And second, it studies the relationships between the use of these policies and developments in credit and housing markets, with a view to analyzing the effectiveness of these policies in managing credit and financial cycles. This database and related research are made possible by a recent survey of country authorities conducted by the International Monetary Fund. The survey includes detailed information on the timing and use of different macroprudential policies and to the best of our knowledge, is the most comprehensive database on macroprudential policies to date. This is the first paper to analyze this new survey. We document that macroprudential policies are used more frequently in emerging economies, with foreign exchange related policies especially used more intensively in these economies. Borrower-based policies (such as caps on loan to value (LTV) and debt to income (DTI) ratios) are used relatively more in advanced countries, especially recently. And almost all countries use some policies to reduce systemic risks arising from intra-financial system vulnerabilities, including from dominant banks and interconnections among banks. Some of these macroprudential policies are associated with reductions in the growth rates in (real) credit and house prices. Borrower-based policies, such as limits on LTVs and DTIs, and financial institutions-based policies, such as limits on leverage and dynamic provisioning, appear to be especially effective. And policies seem more effective when growth rates of credit are very high, but they provide less supportive impact in busts. We find evidence of weaker associations between macroprudential policies and credit developments in financially more open economies and those economies that have deeper and presumably more sophisticated financial systems, suggestive some evasion. We also show that usage of macroprudential policies is associated with relatively greater cross-border borrowing, again suggesting countries face issues of avoidance, which they may be able to limit through adapting their financial sector regulations and adopting capital flow management tools.
2 Related, the analytical foundations of macroprudential policies are still to be defined more precisely (see Hanson, Kayshap, and Stein, 2011; De Nicolò, Favara, and Ratnovski, 2012; and Freixas, Laeven, and Peydró, forthcoming, for further analyses and discussions).

4
Our work builds on the growing literature on the links between macroprudential policies and financial stability. This literature falls into two groups.3 The first group includes cross-country studies that consider the link between macroprudential policies and credit growth and other financial indicators, albeit generally in smaller samples than we do. One of the first such studies was Lim et al. (2011). They analyze the links between macroprudential policies and developments in credit and leverage. They find evidence suggesting that the presence of policies such as LTV and DTI limits, ceilings on credit growth, reserve requirements (RR), and dynamic provisioning rules are associated with reductions in the procyclicality of credit and leverage. IMF (2013b) investigates, also in a cross-country context, how (changes in) policies affect financial vulnerabilities (credit growth, house prices, and portfolio capital inflows) and the real economy (output growth and sectoral allocation), considering also whether effects are symmetric between tightening and loosening. It finds that both (time-varying) capital requirements and RRs are significantly negatively associated with credit growth and LTV limits and capital requirements are strongly associated with lower house price appreciation rates, and reserve requirements are associated with a reduction in portfolio inflows in emerging markets with floating exchange rates. It finds that LTVs appear to impact overall output growth, but no other policies do so. Other cross-country studies focus on the relationships between macroprudential policies and risks of a financial crisis and developments in banks and international financing. Dell'Ariccia et al. (2012) find that macroprudential policies can reduce the incidence of general credit booms and decrease the probability that booms end up badly. Macroprudential policies reduce the risk of a bust, while simultaneously reducing how the rest of the economy is affected by troubles in the financial system. Claessens et al. (2013) investigate how changes in balance sheets of individual banks in 48 countries over 2000-2010 respond to specific policies. They find that measures aimed at borrowers ̶ LTV and DTI caps, and credit growth and foreign currency lending limits ̶ are effective in reducing the growth in bank’s leverage, asset and noncore to core liabilities growth. While countercyclical buffers also help mitigate increases in bank leverage and assets, few policies help stop declines in adverse times. Zhang and Zoli (2014) review the use of key macroprudential instruments and capital flow measures in 13 Asian economies and 33 other economies since 2000 and study their effects. Their analysis suggests that measures helped curb housing price growth, equity flows, credit growth, and bank leverage, with loan-to-value ratio caps, housing tax measures, and foreign currency-related measures having the most effect. And Bruno, Shim and Shin (2014) investigate, also for 12 Asia-Pacific countries, the relationship between macroprudential policies and capital flow management policies. They find that banking sector and bond market capital flow management policies are effective in slowing down bank and bond inflows respectively. They also find some evidence suggesting that macroprudential policies are more successful when they complement monetary policy by reinforcing monetary tightening than when they act in opposite directions.
3 For other reviews, see Bank of England, 2009; ECB, 2012, IMF, 2013; ESCB, 2014; Galati and Moessner, 2011 and 2014; and Claessens, 2014.

5
Some cross-country studies focus specifically on developments in real estate markets. Crowe et al. (2011) and Cerutti et al. (2015) find that policies such as maximum LTV have the best chance to curb a real estate boom. Similarly, IMF (2011a) finds LTV tools to be effective in reducing price shocks and containing feedback between asset prices and credit. Kuttner and Shim (2013), using data from 57 countries spanning more than three decades, investigate whether nine non-interest rate policy tools, including macroprudential instruments, help in stabilizing house prices and housing credit. Using panel regressions, they find that housing credit growth is significantly affected by changes in the maximum debt-service-to-income (DSTI) ratio, maximum LTVs, limits on exposure to the housing sector, and housing-related taxes. But the DSTI ratio limit only significantly affects housing credit growth when they use mean group and panel event study methods. And, of the policies considered, only a change in housing-related taxes impacts house price appreciation (see also Vandenbussche et al. 2012). These and other cross-country studies are complemented by a second group of papers using micro-level evidence, mostly based on the use of only one or a few macroprudential policies. Jiménez et al. (2012), using micro-level data, find for Spain that dynamic provisioning can be useful in taming credit supply cycles, even though it did not suffice to stop the boom (see also Saurina, 2009). More importantly, during bad times, dynamic provisioning helps smooth the downturn, upholding firm credit availability and performance during recessions. Using sectoral data, Igan and Kang (2012) find LTV and DTI limits to moderate mortgage credit growth in Korea. And macroprudential policies targeted at real estate borrowing appear to reduce real estate cycles in Hong Kong (Wong, Fong, Li and Choi, 2011). Camors and Peydro (2014) investigate the effects of a large and unexpected increase in RR in Uruguay in 2008 using detailed, bank-firm matched data. Their evidence suggests some ambiguous results. On the one hand, credit growth declines on aggregate, but on the other hand more risky firms get more credit. They also document that larger and possibly more systemic banks are less affected.4 Aiyar, Calomiris and Wieladek (2013), using bank-level information in the UK over the period 1998-2007, show that bank-specific higher capital requirements dampened lending by banks in the UK, with strong aggregate effects. A case study analyzing house prices for Israel (IMF, 2014b) suggests that macroprudential measures have effects, but only over the six-month period following adoption, with LTVs more effective than DP and CTC. And while policies reduce somewhat transactions, evidence is limited that they contribute to curb house price inflation. For another case study, Sweden, see IMF (2014b). Taken together, the empirical evidence on the effectiveness of macroprudential policies in managing credit flows and asset prices is still preliminary. This may be partly driven by differences in sample coverage and underlying policies studies. We contribute to this existing literature by studying the impact of a broad set of macroprudential policies in a large set of 119 countries – also classifying policies between borrowers and lender based policies – and by distinguishing the effects on different segments of credit markets (household versus corporate credit) as well as house prices. The fact that our paper covers a much larger set of countries and policies, which we see as a clear benefit of our study, could explain some of the differences in our results and those obtained in some of this earlier work.
4 Note that reserve requirements can also fulfill monetary policy functions (see further Cordella et al., 2014 on the role of reserve requirements for macroprudential objectives)

6
The rest of the paper is organized as follows. Section 2 describes the way the data were collected. It documents the (relative) use of the various macroprudential policies over time, also differentiating by groups of countries, both by income levels and degree of de-facto capital account openness. Section 3 includes our empirical analysis, including a description of the methodology and data sources used for our dependent and control variables, and a review of the various robustness tests conducted. Section 4 concludes.
II. DATA
This section describes the data we use and reviews the use of macroprudential policies over time and across countries. Macroprudential policies covered. Information on the actual use of macroprudential policies has been limited, in part because (the use of) tools are not always clearly identified (some countries have adopted more explicit frameworks, but most have not yet). Some data have been collected earlier for a smaller set of 42 countries by the IMF (see Lim et al., 2011). The macroprudential data used in this paper come from a more recent and more comprehensive IMF survey, called Global Macroprudential Policy Instruments (GMPI) ̶ carried out by the IMF’s Monetary and Capital Department during 2013-2014 (see Annex 1 and online Appendix for further details on the data and corresponding questionnaire). The survey was conducted by IMF staff and responses were received directly from country authorities. Using this database, we cross-check responses with the earlier 2011 survey, for which responses were cross-checked for quality with IMF country economists and, if needed, were clarified further with country authorities. In addition, we cross-checked responses in this database with other surveys (e.g., Kuttner and Shim, 2013 and Crowe et al 2011) to further ensure a high quality dataset. The GMPI survey is very detailed and covers 18 different instruments, of which we focus on 12 specific instruments: General Countercyclical Capital Buffer/Requirement (CTC); Leverage Ratio for banks (LEV); Time-Varying/Dynamic Loan-Loss Provisioning (DP); Loan-to-Value Ratio (LTV); Debt-to-Income Ratio (DTI); Limits on Domestic Currency Loans (CG); Limits on Foreign Currency Loans (FC); Reserve Requirement Ratios (RR); and Levy/Tax on Financial Institutions (TAX); Capital Surcharges on SIFIs (SIFI); Limits on Interbank Exposures (INTER); and Concentration Limits (CONC).5 In addition to using these, we define LTV_CAP as the subset of LTV measures used as a strict cap on new loans, as opposed to a loose guideline or merely an announcement of risk weights; and RR_REV as the subset of RR measures that impose a specific wedge on foreign currency deposits or are adjusted countercyclically. We aggregate these measures along the following two categories (for somewhat similar classifications, see Bank of England, 2011; Schoenmaker and Wierts, 2011; CGFS, 2010,
5 Due to lack of data and cross-sectional, we do not cover instruments related to questions on Sector Specific Capital Buffer/Requirement, Liquidity Requirements/Buffers, Loan-to-Deposit ratio, Margins/Haircuts on Collateralized Financial Market Transactions, Limits on Open FX Positions or Currency Mismatches, and Other policies (the category Rest).

7
IMF 2011b, and ESRB, 2014): those aimed at borrowers’ leverage and financial positions (LTV_CAP and DTI ratios); and those aimed at financial institutions’ assets or liabilities (DP, CTC, LEV, SIFI, INTER, CONC, FC, RR_REV, CG, and TAX). To consider the possible complementarity of, or substitution between, using the two borrower-oriented measures we also create a borrower union index, which is 1 if LTV_CAP or DTI is used and 0 otherwise, and a borrower intersection index which is 1 if LTV_CAP and DTI is used and 0 otherwise. We create an overall macroprudential index (MPI) which is just the simple sum of the scores on all 12 policies. Instruments are each coded for the period they were actually in place, i.e., from the date that they were introduced until the day that they were discontinued (if this occurred during our sample period). Given our objective of analyzing as broad a set of countries and instruments as possible in this paper, we do not attempt to capture the intensity of the measures and any changes in intensity over time. Moreover, attaching a value to the degree of intensity of a particular measure unavoidably involves a certain degree of subjectivity that we want to avoid at this point. The survey data also does not allow for constructing objective measures across various countries and over time denoting whether and when instruments are actually binding. While the level/thresholds of each instrument may change over time, these may not capture the degree to which the instruments are actually binding, again especially hard to measure consistently across a large set of countries. Similarly, it is difficult to code the variations in the use of instruments objectively as a tightening or a loosening. We therefore construct simple binary measures of whether or not the instruments were in place. Arguably, because of differences in independence from political and financial services industry pressures, variations in access to necessary information, and levels of institutional capacity to undertake analyses, the central bank is often considered better than other supervisory agencies or some other authority in conducting macroprudential policies. We do know which agency decided on the use of the specific macroprudential tool, but only for the last year of our sample, 2013. We use this information to create an index which is the fraction of macroprudential instruments used that were decided by the central bank in 2013. This can allow one to consider if policies are more effective when determined by the central bank. We create this index also separately for borrower- and bank-based instruments. Table 1a provides a detailed definition of each macroprudential variable and the groupings we use. Usage of policies in general. In the sample, 119 countries – of which 31 are advanced, 64 emerging, and 24 developing – are analyzed over the period 2000-2013.6 As depicted in Figure 1, countries generally increased their usage of macroprudential measures over time, starting with an average overall index (MPI) of just above 1 in 2000 and ending at almost 2½ in 2013. Most countries use concentration limits (CONC): in about 75 percent of the country-year combinations across the 119 countries and 14 years under study is there use of CONC,
6 The GMPI survey covers 131 countries, but only 119 countries provided enough comprehensive submissions for our purposes. In addition, due to lack of some control variables we included only 106 countries in the regression analysis. Countries not included in the regressions belong to different country samples: Argentina, Bosnia, Brunei, Curacao, Kosovo, Timor-Leste, Tonga, United Arab Emirates (all emerging countries), and Bhutan, Cambodia, Dem. Rep. Congo, Haiti, and Sudan (all low-income developing countries).

8
with an even distribution across country groups (see Table 2). This is followed by INTER (29 percent), RR_REV (21 percent), LTV_CAP (21 percent), DTI (15 percent), LEV (15 percent), TAX (14 percent), FC (14 percent), CG (12 percent), DP (9 percent), CTC (2 percent), and SIFI (1 percent). These averages do hide some differences across countries. Usage of policies by country groupings. Usage of macroprudential policy has been most frequent among emerging markets (see Figure 1), consistent with their higher exposure to external shocks, including from volatile capital flows, and having more “imperfect” and generally less liberalized financial systems with more “market failures.” Developing countries come in second in terms of usage, with advanced countries last, despite their recent increase in usage of macroprudential instruments. Among instruments and over the whole time period, CONC, INTER, and LEV, however, have been consistently used by advanced, emerging and developing countries alike (Figure 2). With LTV being relatively more used by advanced countries (maybe due to their concerns about housing sector related vulnerabilities, which are typically larger as mortgage markets are more developed), RR_REV and FC by emerging countries (maybe due to their concerns with large and volatile capital flows and related systemic risks), and DP and CG by developing countries (which also rely relatively more on RR_REV and FC).
III. EMPIRICAL ANALYSIS
We now analyze how the documented usage of the various macroprudential instruments relates to developments in credit markets and house prices. Specifically, we estimate how the MPI and its various sub-indexes relate to the growth in countries’ credit and house prices using the following, base regression model: Y , Y , α , β , γ , δ , θ μ ε , (1)
where Yi,t captures our dependent variable, (aggregate or sectoral) real credit growth or real house prices credit growth in country i at time t. Our independent variables, all one period lagged and additional to the lagged dependent variable, are: Macroprui,t-1, a vector with the aggregate index, MPI, or the presence of groups or individual macroprudential instruments; GDPi,t-1, a vector with real GDP growth in the previous year; Bank Crisisi,t-1, a vector capturing the presence of a banking crisis during the previous years as defined by Laeven and Valencia (2013); Policyi,t-1, a vector with the central bank policy rate in the previous period; µi, a country fixed effect to capture any non-time varying country specific conditions, including much of its level of economic and financial development, the relative mix of bank vs. market based financial intermediation, the concentration of its financial system, and various other (institutional) characteristics; and εi,t, the error term. Throughout we report White-Huber robust standard errors clustered by country. Regression results are reported both for the full sample as well as for subgroups of countries, classified by income level and financial openness. In extensions, we also include other country control and interactions between these variables and MPI to analyze how the effects vary by countries’ circumstances. And we also consider how the effects of macroprudential policies vary by the intensity and phases of the financial cycle.

9
We could estimate equation (1) using OLS with country fixed effects. However, this specification would lead to biased results due to the presence of a lagged dependent variable and country fixed effects. We therefore use the Arellano-Bond (1991) GMM estimator (using the “xtdpd” command in STATA, with one lag needed in the dependent variable so that we maximize sample size). We do report OLS results for the base regression, but in the remainder of the paper only report GMM estimates. Using lagged values for the macroprudential policy variables and the GMM regression techniques, which are a good fit given our small T and large N sample, also mitigate important endogeneity concerns between credit expansion, house prices changes and the adoption of macroprudential policies. For instance, countries may adopt macroprudential policies precisely at the time when the credit cycle is already peaking and any negative relationship found between the contemporaneous level of the macroprudential policy and credit growth may then reflect reverse causality. Another possibility particularly relevant in recent years is that many countries adopted macroprudential policies in the wake of financial stability concerns and at the same time credit growth slowed as a result of weak demand and supply constraints at banks. Lacking valid instruments for macroprudential policy we cannot claim to have fully resolved these and other endogeneity issues, but using GMM regressions mitigates some of them. Table 3 presents the descriptive statistics for the main regression variables. A large variation is found for our various outcome variables. For instance, overall real credit growth ranges from -7.9 to 42.6 percentage points, with a standard deviation of 13.1 and a mean of 10 percentage points. There are country group differences here though, with the variability greater in emerging markets than in advanced countries. The Table also shows ample variation in the macroprudential policy index, which ranges from 0 to 7 with a mean of 1.8 and a standard deviation of 1.5. In the great majority of cases, 71%, it was the central bank that decided on the use of the macroprudential tools in 2013. In terms of other policy and control variables, the variation is also large. For example, the policy interest rate varies between 0.25% and 20%. And there is much variation also in terms of control variables; for example credit/GDP, our proxy for financial development, varies from 8% to 175%.
A. Main Regression Results
Table 4 provides the base regression results. Column 1 has the GMM regression results and Column 2 the OLS results for all the countries in our sample for which we have all the variables, 106 altogether. The remaining columns provide the GMM regression results for various sample splits, specifically by income level and degree of capital account openness. The baseline regression results shows that the (lagged) overall index of the usage of macroprudential policies, MPI, is negatively, and statistically significant so, associated with the growth in (real) credit. This suggests that macroprudential policies have significant mitigating effects on credit developments. The OLS results, which are likely biased, are qualitatively still similar to the GMM results, although the magnitude of the estimated effect is smaller than when estimated using GMM. In terms of control variables, lagged credit growth is positive, 0.245, indicating some persistence in credit developments at the country level. Economic growth has a positive

10
coefficient, as expected, and a relatively high elasticity. The effect of a country experiencing a banking crisis on credit growth is negative and amounts to a reduction in credit of some 14 percentage points. There are some dampening effects of higher interest rates as the coefficient on the (lagged) policy rate is negative. In economic terms, however, this effect is relatively small, also compared to that of MPI. This suggests that macroprudential policies, as implemented on average, have been relatively more powerful compared to monetary policy. However, three important caveats to the interpretation of this result are in order. First, endogeneity concerns may not have been fully addressed. Second, the policy rate can be an imperfect proxy for the monetary policy stance.7 Third, importantly, monetary policy serves other objectives than just managing credit flows (such as exchange rate or inflation stabilization), making monetary policy less relevant by design in this dimension. Differentiating by level of income, in columns 3-5, we find that the statistically significant negative relation of MPI with credit growth is strongest for developing and emerging markets, and much less so for advanced economies. This may reflect a number of factors. First, emerging markets have relied more on macroprudential policies than advanced economies have done. Second, advanced economies tend to have more developed financial systems which offer various alternative sources of finance and scope for avoidance, making it possibly harder for macroprudential policies to be effective. The economic effect of macroprudential policies in the base regressions is substantial. Based on the estimates in column 3 for advanced economies, a one standard deviation change in the MPI index, reduces credit growth by some 2.2 percentage points. This is a large effect, equivalent to about 1/4th the standard deviation in credit growth (9.04) for advanced economies. The economic effect is even larger for emerging markets. Based on the estimates in column 4, a one standard deviation change in the MPI index reduces credit growth by some 8.3 percentage points. This is a large effect, equivalent to about 2/3rd the standard deviation in credit growth in emerging markets. Differentiating next by the level of capital account openness, in columns 6-7, we find that macroprudential policies are more effective for relatively closed economies and less effective for relatively open economies, although the result remains significant in open economies, and the coefficient is more than twice as large in closed economies. This may reflect several factors. For one, relatively open economies may see more circumvention of macroprudential policies, including by borrowers substituting to nonbank sources of finance and obtaining funds through cross-border banking activities. This interpretation does indicate the need to consider macroprudential policies together with capital flow management policies. It may also be that more closed economies have less liberalized financial systems and may therefore find it easier to apply macroprudential policies more effectively. This suggests again the need to consider country-specific circumstances when designing and applying policies (see further
7The policy rate is not the only measure of the monetary policy stance in a country. Furthermore, especially recently in a number of advanced countries, unconventional policy measures have provided important monetary stimulus. Our ability, however, to capture these measures in a comparable way across a large set of countries and long time period is limited by data availability. Note that time-invariant monetary policy characteristics, such as whether the country pursues inflation targeting, are already controlled for using country fixed effects.

11
Acharya 2013 and Shin 2013 on the adaptation of macroprudential, and microprudential, policies). In terms of control variables, all are of the same sign as in the base regression and many are at similar levels of statistically significance. Some interesting differences are that the coefficients for lagged credit growth are the highest for advanced countries, followed by emerging markets and developing countries. This suggests more stability in credit developments in higher income countries. Some of this is confirmed in the higher coefficient for lagged credit growth in more open economies, which tend to be the more advanced countries. At the same time, the coefficient on GDP growth is smallest in size and not statistically significant for the sample of advanced countries. This suggests that credit developments in these countries are less related to economic developments, maybe as other parts of the financial system in these countries are more developed and more important to support economic activity. Conversely, as the coefficient is (just) statistically significant, credit may be more crucially related to economic activity for developing countries. In terms of the interest rate variable, monetary policy appears less important for advanced countries and emerging markets in affecting credit growth, but more so in developing countries. Also, the policy rate seems to have less impact on credit growth in open economies, perhaps due to their more sophisticated and advanced financial systems offering alternative sources of finance to bank credit. Finally, banking crises’ coefficients are larger in emerging markets and financially closed countries, but only statistically significant so in the case of advanced countries. This again could denote that emerging and developing economies offer fewer alternatives to bank finance as well face greater difficulties in overcoming crises using fiscal or monetary policies. We next perform a number of regressions where we investigate various groups of individual macroprudential policies for overall credit growth. As we have 12 macroprudential policies, many groupings are possible. We focus on the two main ones, as also used in the descriptive section: borrower-based and financial institutions-based measures. Regressions in Table 5 shows that borrower-based measures are generally negatively related to credit growth, with coefficients the highest in emerging markets (columns 1-6). Financial institutions-based macroprudential policies are also associated with lower credit growth, especially in emerging and closed economies (columns 7-11). These results are consistent with the general finding reported earlier that macroprudential policies are more effective in emerging markets and relatively closed capital account countries than in advanced and relatively open countries. We next analyze the relationships between groups of, and individual, macroprudential policies and growth in overall credit, as well as in credit to particular type of beneficiaries, namely households and corporations, and developments in (real) house prices, also differentiating by income group. We also consider here the possible complementarity of or substitution between using the two borrower-oriented measures, for which we use the borrower union index and the borrower intersection index, which indicate respectively whether LTV_CAP or DTI or both LTV_CAP and DTI are used. Table 6 reports these regression results in summary form ̶ it just reports the coefficients for the respective (group of) macroprudential variable, omitting the coefficients for the other right hand side variables

12
as well as the R-squared. Note that the number of countries covered and observations included for the sectoral types of credit and house prices is much smaller than in the base regression results given the more limited coverage of sectoral credit breakdowns and house prices. The results for overall credit are in Columns 1-4, with those in the top rows for overall MPI and the general borrower-based and financial institutions-based measures already reported in Tables 4 and 5. The additional results for overall credit growth are regarding the borrower union, i.e., if both LTV_CAP and DTI are used, and intersection, i.e., if either LTV_CAP or DTI is used, indexes. These results suggest no clear complementarities between the two borrower-based measures in that the coefficients for the intersection are not statistically significant for any country groupings, whereas the coefficients for the union are similar to those for the general borrower-based index (note that, since the general borrower-index is the sum of LTV_CAP and DTI and runs from 0 to 2, not 0 or 1, it has a generally smaller coefficient) and again significant for all country groupings (except now not for advanced countries). Columns 5-6 report the results for household credit growth. We find that in general borrower-based measures are associated with lower growth in credit to households, especially in emerging market economies, but also significantly so for advanced countries. There is again little indication of complementarities between the two borrower-based measures as the coefficients for the union index are similar. The coefficients of the various borrower-based measures on house prices have negative signs, but are not statistically significant (columns 7-8). This is consistent with other findings that growth in house prices is more difficult to moderate using macroprudential policies. While not necessarily sufficient to reduce the adverse effects of housing booms and subsequent busts ̶ Crowe et al (2011) show that house price booms associated with increased leverage are the most destructive ̶ these findings do nevertheless suggest that borrower-based macroprudential policies can play a useful role in dampening household indebtedness, especially in advanced countries.8 In terms of corporate sector credit growth, we find negative relationships with general macroprudential policies as well, but weaker than for household credit growth (columns 9-10). The smaller and statistically non-significant coefficients are not surprising as macroprudential policies, including the borrower-based measures, are typically not directly targeted at corporations, but rather at financial institutions or households. Moreover, corporations especially in advanced countries tend to have better access to sources of finance alternative to banks, such as capital markets, which are typically not subject to macroprudential policies. Of course, borrower-based measures could still affect businesses to the extent that firm owners use personal loans to finance their business, which may explain why the borrower-based union index is significantly negative in case of advanced countries. Turning to the individual macroprudential policies, we find that caps on loan-to-value ratios (LTV_CAP), a borrower-based measure, are strongly associated in developing countries with
8 IMF (2014b) and accompanying paper argue that borrower-based measures are more effective in advanced countries since, among others, bank funding costs are more likely low and credit supply particularly elastic.

13
lower overall credit growth, but also with less household credit in all countries. Debt to income (DTI) limits are important as well, especially for curtailing growth in household credit in both advanced and emerging markets, and corporate credit in emerging markets. Overall and confirming earlier results, these findings indicate that direct limits on borrowers can be very effective, especially through their effect on household credit given the large share of mortgages in aggregate credit (see Cerutti et al., 2015, for cross-country evidence). A second set of macroprudential policies that enters strongly are foreign currency limits (FC) which are negatively related to credit growth in all countries, but especially in emerging markets and developing countries, to corporate credit growth, again especially in emerging market, and to household credit in advanced countries. And usage of reserve requirements enters strongly in the subsample of emerging markets for any type of credit, but especially for corporate credit growth (its association with house price growth is positive, which is a finding we cannot easily explain, except for residual endogeneity, e.g., countries adopting macroprudential policies in face of rising house prices). Since reserve requirements in our sample are exclusively used in emerging economies, we cannot analyze their effectiveness in advanced economies. In terms of the other macroprudential policies, dynamic provisioning, used almost exclusively in emerging markets, has a negative relation with overall credit growth. Leverage and counter-cyclical requirements have negative effects in developing countries. SIFI-related measures have a perverse, positive relation with overall credit growth in developing countries (but this is largely capturing the high credit growth in Mongolia at the end of the sample), but are otherwise not statistically significant for other income groups. Interconnection and concentration limits are negatively related to credit growth in all markets, with the effects for interconnection driven by emerging markets and developing countries. Interconnection limits also appear to reduce house price growth in emerging markets. Tax measures appear to have a dampening effect on growth in overall credit in developing countries and house prices in emerging markets. Otherwise, most other individual macroprudential policies used are statistically not significant negatively related to our credit and house prices growth variables. Taken together, these results suggest that borrower-based measures have some impact for most type of countries, while foreign currency related measures are more effective for emerging markets. On the whole, this suggests that there appears to be scope for targeted macroprudential policies such as LTV and DTI ratios in advanced economies and foreign currency related policies in emerging markets. These are important findings especially given the at times adverse effects for overall financial and economic stability of real estate developments in advanced countries and of international capital flows for emerging markets.
B. Extensions and Robustness
We next conduct a number of extensions and robustness tests to our main analyses. The results so far have not explicitly considered the possibility of circumvention of policies. In advanced and open countries in particular, there are legitimate concerns that macroprudential policies are being circumvented through cross-border banking and other forms of external financing. We therefore study how the relative reliance on cross-border credit (the share of cross-border claims to total claims to the non-financial sector) relates to the overall use of

14
macroprudential policies. We do this by replacing the dependent variable by this cross-border credit ratio, and including its lag on the right hand side. Regression specifications are otherwise unaltered compared to Table 4 and results are reported in Table 7. We find that the greater use of macroprudential policies is indeed associated with more reliance on cross-border claims, statistically significant so for open economies. The economic importance is considerable. Based on the estimates for the open economies’ sample in column 2, a one standard deviation increase in the MPI index increases the cross-border ratio by 6 percentage points, which is about 1/3rd the standard deviation of the cross-border ratio. These findings, while perhaps not surprising, do again point to the need to consider macroprudential and capital flow management policies simultaneously and in an integrated manner (see further Ostry et al 2012). Since the regression results so far suggest that the effectsof macroprudential policies can vary by type of country ̶ advanced, emerging or developing, we next include a number of additional country characteristics directly, which we also interact with MPI. Specifically, we include the country’s (lagged) GDP per capita (in logs), ICRG index of institutional quality, level of credit relative to GDP, exchange rate regime, and de jure financial openness, with all these variables included directly as well interacted with the MPI.9 Table 8 reports in summary form the one-by-one regression results. Specifically, there are columns for all countries included altogether, followed by the various splits by income level and degree of capital account openness, and rows for the specific country characteristics. In each cell, the coefficient for the respective interaction of the country variable with MPI is then reported. The interaction with the level of economic development (as proxied by the log of per capita income) does not enter significantly for any group. The same largely holds when interacting MPI with a measure of the quality of institutions (i.e., the ICRG index of institutional development), since it is in all countries, except for closed economies, not significant. In other words, there is limited support for the view that (institutionally) more developed countries have greater ability to enforce macroprudential policies and make them more effective. There is some evidence that countries with deeper financial systems have more difficulty enforcing policies in that for the sample of developing and closed countries the coefficients for the interaction of the credit to GDP variable with MPI are positive. The interaction of MPI with the exchange rate regime enters positive for open economies, suggesting that when having more flexible exchange rates these countries have greater difficulty to control overall credit. This could be because exchange rate appreciations (depreciations) related to capital inflows (outflows) further exacerbate domestic boom and bust financial cycles. There is limited support for this view though from the regressions using
9 Obviously, we cannot correct for all time-varying factors at the individual country level (the fixed effects already control for time-invariant differences). For example, developments in credit growth in the US after the global financial crisis have varied from those in many EU-countries in part due to differences in restructuring approaches. There are no obvious reasons, however, to expect regression results to be biased because of these and other country-specific factors.

15
the interactions with de jure financial openness in that the coefficient for openness is only statistically significant positive for developing countries. It can be expected that the effects of macroprudential policies vary by the intensity and phase of the financial cycle. For one, macroprudential policies may be more effective when the financial cycle is more intense, i.e., if credit (or house prices) increases (or decreases) are greater. And, importantly, macroprudential policies are meant to be mostly ex-ante tools, that is, they should help reduce the boom part of the financial cycle. To the extent that they are operative in the downward part of the financial cycle, they are meant to limit declines in credit and asset prices. If correct, this would mean that their presence should be associated with positive coefficients in this phase, not negative ones. To investigate these issues, we first interact MPI with the growth rate in credit. We next analyze whether the effects of macroprudential policies depend on the phase of the credit cycle, considering whether there may be additional effects of macroprudential policies in case of exceptionally high or low credit growth. We therefore create two dummies, for if the growth rate falls into either the top 10% or bottom 10% of the country specific observations. We then run this regression two ways, including the two dummies one at a time and both simultaneously, including every time MPI as well. Regression specifications are otherwise unaltered and results are reported in Table 9, again in summary form, i.e., without providing the coefficients for the other right hand side variables and R2s. We find some support that macroprudential policies are more effective if the financial cycle is intense in that the coefficients for the interaction term between the MPI and credit growth variables are negative for all groups of countries and statistically significant so in case of advanced countries and open economies. This suggests that macroprudential policies have additional effects when credit growth is higher, especially in more developed and financially open economies. The next results, rows 2-3, provide support for asymmetry in the effects of macroprudential policies during boom vs. bust phases. Specifically, the two dummies have the predicted opposite signs, negative if the growth rate falls into the top 10% for the country specific observations and positive if the growth rate falls into the bottom 10%. These patterns exist for all groups of countries (the exception is for developing countries where the coefficient for the dummy for bottom 10% growth rates is negative, but not statistically significant) with coefficients statistically significant in the majority of cases. The next results, rows 4-6, should be read together as they refer to regression results when the two dummies (and the MPI) are included at the same time. It confirms the finding that macroprudential policies work differently for large positive vs. large negative credit growth. The additional dampening effect of macroprudential policies when credit growth displays an exceptionally high positive growth rate is there again for all groups of countries, with only the coefficients for the advanced and developing countries not statistically significant. The interaction of MPI with the dummy if growth is very low is mostly positive, but never statistically significant. The difference, however, is statistically significant in all cases but for the developing countries. Altogether, these finding suggest that the effects of macroprudential policies depend both on the intensity and phase of the financial cycle.

16
Lastly, we also consider whether there was some obvious sample selection in that some countries may, for a variety of reasons, have chosen not to use any macroprudential policy. We therefore exclude from the sample all those countries that did not use any macroprudential policy in 2013. This reduces the sample by 11 countries and the number of observations by 100. The regression results, reported in Table 9, row 7, show that this does not alter any of the main regression results, with MPI again statistically significant negative and of similar size for all groups of countries as in the base regression (Table 4).10
IV. CONCLUSIONS
We have documented the use of various macroprudential policies in a large sample of countries over the 2000-13 period using a novel dataset and studied the relationships between the use of these policies and developments in credit and housing markets to analyze the effectiveness of macroprudential policies in dampening financial cycles. We find that macroprudential policies are used more frequently in emerging economies, with especially foreign exchange related policies used more intensively. Borrower-based policies are used more in advanced countries. We find that policies are generally associated with reductions in the growth rate in credit, with a weaker association in more developed and more financially open economies, and can have some impact on growth in house prices. We also show that using policies can be associated with relatively greater cross-border borrowing, suggesting countries face issues of avoidance. We do find evidence of some asymmetric impacts in that policies work better in the boom than in the bust phase of a financial cycle. Taken together, the results suggest that macroprudential policies can have a significant effect on credit developments. We also find that the effectiveness of policies is both instrument and country specific, and that circumvention of policies is a real challenge. An interesting question for future research is the extent to which countries can limit circumvention by adapting their forms of bank regulations and adopting certain capital flow management tools.
10 We also did some further checks: (i) We added time fixed effects in addition to the systemic crisis dummies. Regression results (not reported) changed for crisis dummies but the message remains the same for the impact of the use of macroprudential policies; (ii) We also considered whether the effects of macroprudential policies varied depending on which agency was in charge. We used the index of the fraction of macroprudential instruments used that were decided by the central bank in 2013 as an additional explanatory variable, also interacted with MPI and (groups) of individual macroprudential policies. Regression results (not reported) did not reveal any clear evidence that the impacts of macroprudential policies vary by which agency is in charge.

17
References
Acharya, Viral V., 2013. “Adapting Microprudential Regulation for Emerging Markets”, in Otaviano Canuto and Swati R. Ghosh (eds.), Dealing with the Challenges of Macro Financial Linkages in Emerging Markets, World Bank, Washington, D.C., 57-89.
Aiyar, Shekhar, Charles W. Calomiris and Tomasz Wieladek, 2014, “Does Macro‐Prudential
Regulation Leak? Evidence from a UK Policy Experiment,” Journal of Money, Credit and Banking, 46(s1), 181-214, 02.
Arellano, Manuel, and Stephen Bond, 1991, “Some Tests of Specification for Panel Data:
Monte Carlo Evidence and an Application to Employment Equations,” Review of Economic Studies,58(2), 277-97.
. Bank of England, 2009, “The Role of Macroprudential Policy,” Discussion Paper,
November. ______, 2011, “Instruments of Macroprudential Policy,” Discussion Paper, December.
Bruno, Valentina, Ilhyock Shim, and Hyun Song Shin, 2014, “Comparative Assessment of Macroprudential Policies,” October, Bank for International Settlements
Cerutti, Eugenio, Jihad Dagher, and Giovanni Dell’Ariccia, 2015, “Housing Finance and
Real-estate booms: A Cross-Country Perspective,” forthcoming IMF Staff Discussion Note.
Claessens, Stijn, 2014, “An Overview of Macroprudential Policy Tools,” IMF WP 14/214. Claessens, Stijn, Swati Ghosh, and Roxana Mihet, 2013, “Macroprudential Policies to
Mitigate Financial System Vulnerabilities,” Journal of International Money and Finance, 39:153–185.
Committee on the Global Financial System (CGFS), 2010, “Macroprudential Instruments and
Frameworks: A Stocktaking of Issues and Experiences,” CGFS Papers 38 (Basel: Bank for International Settlement).
______, 2012, “Operationalising the Selection and Application of Macroprudential
Instruments,” CGFS Papers 48 (Basel: Bank for International Settlement). Cordella, Tito, Pablo Federico, Carlos Vegh, and Guillermo Vuletin, 2014, “Reserve
Requirements in the Brave New Macroprudential World.” World Bank Policy Research Working Paper No. 6793.
Crowe, Christopher W., Deniz Igan, Giovanni Dell’Ariccia, and Pau Rabanal, 2011, “How to
Deal with Real Estate Booms,” IMF Staff Discussion Note 11/02.

18
Camors, Cecilia Dassatti and Jose-Luis Peydro, 2014, “Macroprudential and Monetary Policy: Loan-Level Evidence from Reserve Requirements,” mimeo, Universitat Pompeu Fabra, Spain.
De Nicolò, Gianni, Giovanni Favara, and Lev Ratnovski, 2012, “Externalities and
Macroprudential Policy”. IMF Staff Discussion Notes, No.12/05. Dell’Ariccia, Giovanni, Deniz Igan, Luc Laeven, and Hui Tong, with Bas Bakker and Jerome
Vandenbussche, 2012, “Policies for Macrofinancial Stability: How to Deal with Credit Booms,” IMF Staff Discussion Note 12/06.
European Central Bank, 2012, “Report on the first two years of the macroprudential research
network,” October, www.ecb.europa.eu/pub/ European Systemic Risk Board, Heads of Research, 2014, “Report on the Macroprudential
Research Network (MARS),” June, at https://www.ecb.europa.eu/home/html/researcher_mars.en.html
Freixas, Xavier, Luc Laeven, and José-Luis Peydró, forthcoming, Systemic Risk, Crises, and
Macroprudential Regulation, MIT Press. Galati, Gabriele and Richhild Moessner, 2011, “Macroprudential policy - a literature
review,” BIS Working Papers 337, Bank for International Settlements. ______, 2014, “What do we know about the effects financial macroprudential policy?,” De
Nederlandsche Bank Working Papers 440. Hanson, Samuel, Anil Kayshap, and Jeremy Stein, 2011, “A Macroprudential Approach to
Financial Regulation,” Journal of Economic Perspective, 25(1), 3–28. Igan, Deniz, and Heedon Kang, 2011, “Do Loan-to-Value and Debt-to-Income Limits Work?
Evidence from Korea,” IMF Working paper 11/297. Ilzetzki, Ethan O, Carmen M Reinhart, and Kenneth Rogoff, 2004, "Exchange Rate
Arrangements into the 21st Century: Will the Anchor Currency Hold?.” Unpublished. International Monetary Fund, 2011, “Macroprudential Policy: An Organizing Framework,”
https://www.imf.org/external/np/pp/eng/2011/031411.pdf ———, 2013a, “Key Aspects of Macroprudential Policy,” IMF Policy Paper, June.
http://www.imf.org/external/np/pp/eng/2013/061013b.pdf ———, 2013b, “Key Aspects of Macroprudential Policy—Background Paper,” IMF Policy
Paper, June. http://www.imf.org/external/np/pp/eng/2013/061013c.pdf ______, 2014a, “Selected Issues Paper on Israel,” February. IMF Country Report 14/48.

19
______, 2014b, “Selected Issues Paper on Sweden,” August. IMF Country Report 14/262. Jiménez, Gabriel, Steven R. G. Ongena, Jose-Luis Peydro, and Jesus Saurina Salas, 2012,
“Macroprudential Policy, Countercyclical Bank Capital Buffers and Credit Supply: Evidence from the Spanish Dynamic Provisioning Experiments,” European Banking Center Discussion Paper 2012-011.
Kuttner, Kenneth N. and Ilhyock Shim, 2013, “Can non-interest rate policies stabilise
housing markets? Evidence from a panel of 57 economies,” BIS Working Papers No 433.
Laeven, Luc, and Fabian Valencia, 2013, "Systemic Banking Crises Database." IMF
Economic Review, Vol. 61, 225-270. Lim, Cheng H., Francesco Columba, Alejo Costa, Piyabha Kongsamut, Akira Otani, Mustafa
Saiyid, Torsten Wezel, Xiaoyong Wu, 2011, “Macroprudential Policy: What Instruments and How Are They Used? Lessons from Country Experiences”, IMF Working Paper 11/238.
Ostry, Jonathan, Atish Ghosh, Marcos Chamon, and Mahvash Qureshi, 2012, “Tools for
Managing Financial-Stability Risks from Capital Inflows,” Journal of International Economics, 88(2): 407-421.
Quinn, Dennis, Martin Schindler, and A Maria Toyoda, 2011, “Assessing Measures of
Financial Openness and Integration,” IMF Economic Review, vol. 59(3), pp. 488-522. Saurina, Jesus, 2009, “Dynamic Provisioning. The Experience of Spain,” Crisis Response,
Note Number 7 (Washington: The World Bank). Schoenmaker, Dirk, and Peter J. Wierts, 2011, “Macroprudential Policy: The Need for a
Coherent Policy Framework,” DSF Policy Paper 13 (Amsterdam, The Netherlands: Duisenberg School of Finance).
Shin, Hyun Song, 2013,“Adapting Macroprudential Approaches to Emerging and
Developing Economies,” in Otaviano Canuto and Swati R. Ghosh (eds.), Dealing with the Challenges of Macro Financial Linkages in Emerging Markets, World Bank, Washington, D.C., 17-55.
Vandenbussche, Jérôme, Ursula Vogel, and Enrica Detragiache, 2015, “Macroprudential
Policies and Housing Prices - A New Database and Empirical Evidence for Central, Eastern and Southeastern Europe”, Journal of Money, Credit and Banking, forthcoming.
Zhang, Longmei and Edda Zoli, 2014, “Leaning Against the Wind: Macroprudential Policy
in Asia,” IMF Working Paper 14/22.

20
Table 1. Variable Definitions and Sources
Instrument/Group Abbreviation Defini tion
Survey Instruments (0-1)
Loan-to-Va lue Ratio LTV Constra ins highly levered mortgage downpayments by enforcing or
encouraging a l imit or by determining regulatory ri sk weights .
Debt-to-Income Ratio DTI Constra ins household indebtedness by enforcing or encouraging a
l imit.
Time-Varying/Dynamic Loan-
Loss Provis ioning
DP Requires banks to hold more loan-loss provis ions during upturns .
Genera l Countercycl i ca l
Capita l Buffer/Requirement
CTC Requires banks to hold more capi ta l during upturns .
Leverage Ratio LEV Limits banks from exceeding a fixed minimum leverage ratio.
Capita l Surcharges on SIFIs SIFI Requires Systemica l ly Important Financia l Insti tutions to hold a
higher capita l level than other financia l ins ti tutions .
Limits on Interbank Exposures INTER Limits the fraction of l iabi l i ties held by the banking s ector or by
Concentration Limits CONC Limits the fraction of assets held by a l imited number of borrowers .
Limits on Foreign Currency Loans FC Reduces vulnerabi l i ty to foreign-currency ri sks .
Reserve Requirement Ratios RR Limits credi t growth; can a lso be targeted to l imit foreign-currency
credi t growth.
mits on Domestic Currency Loan CG Limits credi t growth di rectly.
evy/Tax on Financia l Insti tution TAX Taxes revenues of financia l ins ti tutions .
Derived Instruments (0-1)
Loan-to-Va lue Ratio Caps LTV_CAP Restricts to LTV used as a s trictly enforced cap on new loans , as
opposed to a supervis ory guidel ine or merely a determinant of ri sk
weights .
FX and/or Countercycl i ca l
Reserve Requirements
RR_REV Restricts to RR which i ) imposes a wedge of on foreign currency
depos i ts (as determined by the answer to question 9.1.4.2 "Please
s peci fy the level of reserve requirements appl ied to speci fi c bases
identi fied in the question above on the las t day of the year
preceding the submis s ion of this survey"), or i i ) i s adjusted
countercycl ica l ly (as determined by the answer to the question 9.1.8
"Please speci fy whether this tool i s intended to be adjus ted
Groups
Macroprudentia l Index (0-12) MPI LTV_CAP + DTI + DP + CTC + LEV + SIFI + INTER + CONC + FC + RR_REV +
CG + TAX
Borrower-Targeted
Ins truments (0-2)
BORROWER LTV_CAP + DTI
Borrower-Union (0-1) BORROWER_U =1 i f LTV_CAP or DTI us ed, otherwise 0
Borrower-Intersection (0-1) BORROWER_I =1 i f LTV_CAP and DTI used, otherwise 0
Financia l Ins ti tution-Targeted
Instruments (0-10)
FINANCIAL DP + CTC + LEV + SIFI + INTER + CONC + FC + RR_REV + CG + TAX
Central Bank Oversight
Centra l Bank Overs ight of
Macroprudentia l Pol i cies
CB_MPI The fraction of macroprudentia l ins truments that are control led by
the centra l bank as of 2013, which i s determined by whether a
country includes the centra l bank in the answer to the question:
"Please indicate which insti tutions decide on the use of this tool ."
Set to mis s ing i f no instruments used.
Centra l Bank Overs ight of
Borrower Instruments
CB_BORROWER The fraction of borrower-targeted macroprudentia l ins truments that
are supervised by the centra l bank as of 2013. Set to miss ing i f no
instruments used.
Centra l Bank Overs ight of
Financia l Instruments
CB_FINANCIAL The fraction of financia l insti tution-targeted macroprudentia l
ins truments that are s upervised by the centra l bank as of 2013. Set
to miss ing i f no ins truments used.
Table 1a: 2013 Global Macroprudential Policy Instruments Survey

21
Variable Definition Source
Dependent Variables
Credit Growth Year on Year Real Credit Growth (%) Adjusted BIS Domestic Bank Credit to
Private non-financial sector where
available, otherwise IMF IFS:
Depository Corporations Domestic
Claims on Private Sector; deflated by
yearly CPI growth from World Bank
WDIHH Credit Growth Year on Year Real Credit Growth to Households (%) Adjusted BIS Credit to Households
and NPISHs; deflated by yearly CPI
growth from World Bank WDI
Corp Credit Growth Year on Year Real Credit Growth to Corporations (%) Adjusted BIS Credit to Non-financial
corporations; deflated by yearly CPI
growth from World Bank WDI
House Price Growth Year on Year Real House Price Growth (%) IMF Global Housing Watch
Cross-Border Ratio Cross-Border Ratio (%) Calculated using BIS External
Positions of Reporting Banks vis-à-vis
the Non-bank Sector and IFS Domestic
Nonfinancial Claims
Independent Variables
GDP Growth Year on Year Real GDP Growth (%) World Bank WDI
Exchange Rate Regime Exchange Rate Regime Fine Classification (1-15) Updated database associated with
Ilzetzki, Ethan O, Carmen M Reinhart,
and Kenneth Rogoff (2004). Higher
values correspond to greater
exchange rate flexibility
Crisis Financial Crisis Indicator (0-1) Indicates Systemic Banking Crisis per
Laeven and Fabiàn Valencia (2013).
Policy Rate Monetary Policy Rate (%) IFS Central Bank Policy Rate when
available, otherwise Discount Rate or
Repurchase Agreement Rate. ECB
deposit facility rate for Eurozone
countries.GDP/Capita GDP Per Capita (constant 2005 USD) World Bank WDI
Credit/GDP Domestic Credit to GDP (%) World Bank WDI
ICRG ICRG Institutional Quality Rating (0-22) International Country Risk Guide
(ICRG) maintained by The PRS Group;
the index (0-22) is a sum of
subindices: Political stabil ity (0-12) +
contract viability (0-4) + corruption (0-
6). Higher values indicate more
stability and less corruption.
De Jure Openness IndexDe Jure Openness Index (0-200) The sum of the financial current
account and capital account
openness measures in the updated
version of the dataset constructed by
Quinn, Schindler, and Toyoda (2011).
Higher values correspond to greater
openness.
Table 1b: Regression Variables

22
Income Group Classification: IMF WEO (April 2014)
Advanced Low-Income Developing
Australia Albania Morocco Bangladesh
Austria Algeria Pakistan Bhutan
Belgium Angola Paraguay Burundi
Canada Argentina Peru Cambodia
Cyprus Armenia Philippines Dem. Rep. Congo
Czech Republic Azerbaijan Poland Ethiopia
Estonia Bahamas Romania Ghana
Finland Bahrain Russian Federation Haiti
France Belarus Saudi Arabia Honduras
Germany Belize Serbia Kenya
Hong Kong Bosnia and Herzegovina South Africa Kyrgyz Republic
Iceland Botswana Sri Lanka Lao PDR
Ireland Brazil St. Kitts and Nevis Lesotho
Israel Brunei Thailand Malawi
Italy Bulgaria Timor-Leste Moldova
Japan Cape Verde Tonga Mongolia
Latvia Chile Trinidad and Tobago Mozambique
Malta China Tunisia Nepal
Netherlands Colombia Turkey Solomon Islands
New Zealand Costa Rica Ukraine Sudan
Norway Croatia United Arab Emirates Tajikistan
Portugal Curacao 64 countries The Gambia
Singapore Dominican Republic Uganda
Slovakia Ecuador Zambia
Slovenia El Salvador 24 countries
South Korea Fiji
Spain Georgia
Sweden Guyana
Switzerland Hungary
United Kingdom India
United States Indonesia
31 countries Jamaica
Jordan
Kazakhstan
Kosovo
Kuwait
Lebanon
Lithuania
Macedonia
Malaysia
Mauritius
Mexico
Montenegro
Table 1c: Country Subgroup Classification
Emerging

23
De Facto Financial Openness Classification
Australia Norway Albania Kyrgyz Republic
Austria Paraguay Algeria Lao PDR
Bahrain Portugal Angola Lesotho
Belgium Saudi Arabia Argentina Lithuania
Belize Singapore Armenia Macedonia
Brunei Slovakia Azerbaijan Malawi
Bulgaria Slovenia Bangladesh Mexico
Canada Spain Belarus Moldova
Cape Verde St. Kitts and Nevis Bhutan Mongolia
Chile Sweden Bosnia and Herzegovina Morocco
Cyprus Switzerland Botswana Mozambique
Estonia Trinidad and Tobago Brazil Nepal
Finland United Arab Emirates Burundi Pakistan
France United Kingdom Cambodia Peru
Germany United States China Philippines
Guyana 49 countries Colombia Poland
Hong Kong Costa Rica Romania
Hungary Croatia Russian Federation
Iceland Czech Republic Serbia
Ireland Dem. Rep. Congo Solomon Islands
Israel Dominican Republic South Africa
Italy Ecuador South Korea
Jamaica El Salvador Sri Lanka
Japan Ethiopia Sudan
Jordan Fiji Tajikistan
Kuwait Georgia Thailand
Latvia Ghana The Gambia
Lebanon Haiti Timor-Leste
Malaysia Honduras Tonga
Malta India Tunisia
Mauritius Indonesia Turkey
Montenegro Kazakhstan Uganda
Netherlands Kenya Ukraine
New Zealand Kosovo Zambia
68 countries
Financial openness is calculated using the updated version of the dataset constructed by Lane
and Milesi-Ferretti (2007). A country is categorized as financially open if its median openness
score over 2000-2011 is greater than the median of the median score for all countries in the
sample, otherwise it is categorized as financially closed. Low-income developing countries
were classified as closed economies due to the importance of official financing in the above
calculations.
Closed EconomiesOpen Economies
Table 1c (cont.): Country Subgroup Classification

24
Table 2. Macroprudential Policy Variables
Total Countries Advanced Emerging Markets Developing Open Closed
(1) (2) (3) (4) (5) (6)
LTV_CAP 21% 40% 20% 6% 29% 14%
DTI 15% 13% 21% 0% 19% 12%
DP 9% 5% 6% 19% 5% 11%
CTC 2% 1% 3% 1% 0% 3%
LEV 15% 13% 17% 12% 28% 8%
SIFI 1% 1% 1% 1% 1% 1%
INTER 29% 33% 32% 17% 34% 26%
CONC 75% 69% 76% 77% 72% 78%
FC 14% 9% 16% 13% 10% 16%
RR_REV 21% 0% 24% 33% 4% 32%
CG 12% 0% 11% 26% 9% 14%
TAX 14% 14% 14% 11% 17% 12%
For each subgroup of countries, the frequency of use is the ratio of country-years using a given
instrument to the total number of country-years using a macroprudential policy over the sample
period 2000-2013.
Variables

25
Table 3. Descriptive Statistics of Main Regression Variables
Mean Median Min Max
Standard
Deviation Observations
Number of
Countries
(1) (2) (3) (4) (5) (6) (7)
Dependent Variables
Credit Growth (%) 10.40 7.32 -7.87 42.63 13.12 1248 114
HH Credit Growth (%) 6.74 4.95 -4.34 26.64 7.82 351 31
Corp Credit Growth (%) 4.47 2.99 -5.81 19.32 6.86 351 31
House Price Growth (%) 2.18 1.43 -10.87 17.24 7.28 499 49
Cross-Border Ratio (%) 17.91 12.46 0.46 76.94 18.86 1415 118
Independent Variables
LTV_CAP 0.18 0.00 0.00 1.00 0.38 1428 119
DTI 0.13 0.00 0.00 1.00 0.34 1428 119
DP 0.07 0.00 0.00 1.00 0.26 1428 119
CTC 0.02 0.00 0.00 1.00 0.13 1428 119
LEV 0.12 0.00 0.00 1.00 0.33 1428 119
SIFI 0.01 0.00 0.00 1.00 0.10 1428 119
INTER 0.23 0.00 0.00 1.00 0.42 1428 119
CONC 0.60 1.00 0.00 1.00 0.49 1428 119
FC 0.11 0.00 0.00 1.00 0.32 1428 119
RR_REV 0.17 0.00 0.00 1.00 0.37 1428 119
CG 0.10 0.00 0.00 1.00 0.30 1428 119
TAX 0.11 0.00 0.00 1.00 0.32 1428 119
MPI (index 0-12) 1.85 2.00 0.00 8.00 1.57 1428 119
BORROWER (0-2) 0.31 0.00 0.00 2.00 0.61 1428 119
BORROWER_U (0-1) 0.23 0.00 0.00 1.00 0.42 1428 119
BORROWER_I (0-1) 0.08 0.00 0.00 1.00 0.27 1428 119
FINANCIAL (0-10) 1.54 1.00 0.00 6.00 1.32 1428 119
CB_MPI 0.71 1.00 0.00 1.00 0.39 1284 107
CB_BORROWER 0.66 1.00 0.00 1.00 0.47 492 492
CB_FINANCIAL 0.70 1.00 0.00 1.00 0.41 1236 1236
GDP Growth (%) 4.12 4.04 -2.32 10.26 3.31 1401 118
Exchange Rate Regime (index 1-15) 6.79 7.00 1.00 13.00 3.95 1371 116
Crisis (dummy 0-1) 0.09 0.00 0.00 1.00 0.29 1428 119
Policy Rate (%) 6.33 5.00 0.25 20.00 5.26 1202 108
GDP/Capita (2005 USD, in logs) 8.40 8.33 5.80 10.64 1.51 1388 118
Credit/GDP (%) 60.79 44.37 8.06 175.42 48.00 1376 118
ICRG Index (index 0-22) 14.06 14.00 8.00 20.00 2.43 1160 97
De Jure Openness (index 0-200) 162.6 187.5 37.5 200 43.9903 816 94
The table presents summary statistics for all observations in 2002-2013. All variables except the categorical
ones are winsorized at the 5 percent level.

26
Table 4. Macroprudential Policies and Credit Growth: Main Regression Results
Advanced Emerging Developing Open Closed
(1) - GMM (2) - OLS (3) - GMM (4) - GMM (5) - GMM (6) - GMM (7) - GMM
MPI -7.637*** -2.112*** -1.376* -5.327*** -6.743** -2.910** -6.605***
[1.876] [0.651] [0.781] [1.619] [3.076] [1.251] [2.073]
Credit Growth 0.245*** 0.324*** 0.485*** 0.264*** 0.157* 0.351*** 0.231***
[0.0715] [0.0512] [0.134] [0.0897] [0.0872] [0.0869] [0.0798]
GDP Growth 0.399 0.649*** 0.123 0.427 0.902* 0.343 0.586**
[0.243] [0.144] [0.215] [0.288] [0.517] [0.226] [0.291]
Crisis -14.24** -5.967*** -5.781*** -17.07 4.385 -3.147 -16.47
[6.669] [1.706] [1.984] [11.17] [2.702] [2.904] [11.55]
Policy Rate -1.071*** -0.697*** -0.952** -0.645 -1.389*** -0.544 -0.958***
[0.340] [0.196] [0.417] [0.394] [0.284] [0.346] [0.358]
Countries 106 106 31 56 19 47 58
Observations 972 972 318 525 129 452 509
AB AR(1) Test 0.00 - 0.00 0.00 0.01 0.00 0.00
AB AR(2) Test 0.11 - 0.18 0.13 0.38 0.11 0.26
Sargan Test 1.00 - 1.00 1.00 1.00 1.00 1.00
AllVariables
Notes: The estimates are determined using Arellano-Bond GMM treating the instrument and the control variables of credit growth, GDP
growth, the crisis dummy, and the policy rate as endogeneous. Column 2 is estimated through OLS. The dependent variable is real credit
growth. All variables except the categorical ones are winsorized at the 5 percent level. Country fixed effects control for individual trends.
The regressions are performed over the period 2001-2013. The Sargan tests' null hypothesis of over-identifying restrictions are not
rejected. Arellano-Bond (AB) test for AR(1) in first differences are rejected, but not for the AR(2) test. Robust standard errors clustered by
country are in brackets. ***, **, and * indicate significance at the 1, 5, and 10 percent levels, respectively.

27
Table 5: Effects of Instrument by Subgroups
All Advanced Emerging Open Closed All Advanced Emerging Open Closed
(1) (2) (4) (5) (6) (7) (8) (9) (10) (11)
BORROWER -11.06** -2.16 -8.389** -5.288* -7.712*
[4.496] [2.288] [3.637] [3.128] [4.517]
FINANCIAL -8.838*** -0.983 -6.625*** -4.591*** -8.282***
[2.523] [0.935] [2.213] [1.650] [2.851]
Credit Growth 0.277*** 0.487*** 0.291*** 0.343*** 0.261*** 0.284*** 0.487*** 0.292*** 0.380*** 0.249***
[0.0707] [0.125] [0.0868] [0.0807] [0.0835] [0.0693] [0.143] [0.0868] [0.0947] [0.0751]
GDP Growth 0.428* 0.136 0.600** 0.318 0.635** 0.26 0.0521 0.351 0.192 0.473*
[0.241] [0.210] [0.302] [0.232] [0.306] [0.232] [0.234] [0.287] [0.225] [0.279]
Crisis -21.15** -5.991*** -19.68 -5.127* -21.6 -13.87** -7.390*** -15.8 -4.506* -15.34
[9.170] [2.094] [13.21] [2.960] [14.83] [6.146] [2.198] [9.912] [2.622] [10.36]
Policy Rate -0.833** -0.937** -0.498 -0.558 -0.796** -0.873*** -0.998** -0.555 -0.602* -0.870***
[0.391] [0.428] [0.396] [0.380] [0.367] [0.311] [0.435] [0.342] [0.341] [0.323]
Countries 106 31 56 47 58 106 31 56 47 58
Observations 972 318 525 452 509 972 318 525 452 509
AB AR(1) Test 0.00 0.00 0.00 0.00 0.00 0.00 0.00 0.00 0.00 0.00
AB AR(2) Test 0.10 0.19 0.12 0.13 0.22 0.10 0.19 0.13 0.12 0.24
Sargan Test 1.00 1.00 1.00 1.00 1.00 1.00 1.00 1.00 1.00 1.00
BORROWER FINANCIAL
Notes: The estimates are determined using Arellano-Bond GMM treating the instrument and the control variables of credit
growth, GDP growth, the crisis dummy, and the policy rate as endogeneous. The dependent variable is real credit growth. All
variables except the categorical ones are winsorized at the 5 percent level. Country fixed effects control for individual trends.
The regressions are performed over the period 2001-2013. Robust standard errors clustered by country are in brackets. ***, **,
and * indicate significance at the 1, 5, and 10 percent levels, respectively.
Variables

28
Table 6. Effects of Individual Instruments on Several Variables
Al l Advanced Emerging Developing Advanced Emerging Advanced Emerging Advanced Emerging
(1) (2) (3) (4) (5) (6) (7) (8) (9) (10)
MPI -7.637*** -1.376* -5.327*** -6.743** -0.763*** -1.942 -0.0449 -0.907 0.678 -1.022
BORROWER -11.06** -2.16 -8.389** -14.45*** -1.047* -7.636** -1.039 -1.156 -0.982 -3.068
BORROWER_U -20.56*** -5.298 -15.42*** -14.45*** -1.447 -11.98*** -1.145 -2.198 -3.287*** -2.592
BORROWER_I -7.1 -0.499 -4.21 -1.780* -6.819 -0.477 -0.854 0.584 -9.057*
FINANCIAL -8.838*** -0.983 -6.625*** -7.007 -0.487 -0.0857 0.174 -1.159 1.552 -0.584
LTV_CAP -12.35* -5.298 -6.861 -14.45*** -1.447 -7.956** -1.145 0.362 -3.287*** -5.307
DTI -24.16** -0.499 -15.56** -1.780* -11.72*** -0.477 -3.322 0.584 -3.561*
DP -16.39*** -12.73*** 1.233 -3.297 6.182***
CTC -8.629 -12.75 -5.731***
LEV -2.716 1.426 -3.963** 5.714* 1.332 1.538 1.796 13.12* 4.073***
SIFI 9.853 -1.242 29.63*** 1.332 0.885 1.796 4.073***
INTER -35.46** -0.462 -39.37** -10.53*** -1.228 0.72 -16.91*** 3.899
CONC -29.84* -2.028 -9.287 2.861 -4.044 6.218 3.503* 7.481 4.333**
FC -9.489* -3.132 -12.23*** -17.46*** -2.644*** -1.146 -3.627 1.565*** 0.0281 -8.596***
RR_REV -42.84* -22.74* -8.661*** 9.732*** -14.68***
CG -46.16 -14.35 -12.99
TAX -5.196 -1.356 -5.533 -1.701*** -0.637 6.413 0.426 -2.616** 0.0129 1.187
Countries 106 31 56 19 22 9 31 18 22 9
Observations 972 318 525 129 241 79 307 142 241 79
Notes : The es timates are determined us ing Arel lano-Bond GMM treating the ins trument and the control variables
of credi t growth, GDP growth, the cri s i s dummy, and the pol icy rate as endogeneous. Each ins trument i s added
separately to the basel ine regress ion, but their coefficients are represented in the same column for compactness .
Al l variables except the categorica l ones are winsorized at the 5 percent level . Country fixed effects control for
individual trends . The regress ions are performed over the period 2001-2013. Robust s tandard errors are in brackets .
***, **, and * indicate s igni ficance at the 1, 5, and 10 percent levels , respectively. "" indicates that the coefficient
does not exis t due to col ineari ty or, in one case, s ingulari ty of the variance matrix.
Variables
Corp Credit GrowthHH Credit GrowthCredit Growth House Price Growth

29
Table 7. Effects on Cross-Border Credit Ratio
All Open Closed
(1) (2) (3)
MPI 1.277 4.181* -0.175
[0.983] [2.301] [0.773]
Cross-Border Ratio 0.418*** 0.486*** 0.393***
[0.109] [0.105] [0.125]
GDP Growth -0.0383 -0.123 -0.0489
[0.123] [0.102] [0.158]
Crisis 3.873 -4.771** 3.762
[5.303] [2.156] [3.108]
Policy Rate -0.0579 0.0772 -0.0432
[0.234] [0.230] [0.293]
Countries 108 47 60
Observations 1094 508 575
AB AR(1) Test 0.02 0.04 0.12
AB AR(2) Test 0.47 0.36 0.81
Sargan Test 1.00 1.00 1.00
Notes: The estimates are determined using Arellano-Bond GMM treating the instrument and the
control variables of cross-border ratio, GDP growth, the crisis dummy, and the policy rate as
endogeneous. The dependent variable is the ratio of cross-border claims to total nonfinancial
claims. All variables except the categorical ones are winsorized at the 5 percent level. Country
fixed effects control for individual trends. The regressions are performed over the period 2001-
2013. Arellano-Bond robust standard errors clustered by countries are in brackets. ***, **, and *
indicate significance at the 1, 5, and 10 percent levels, respectively.
Variables

30
Table 8. Interactions with Country Control Variables
All Advanced Emerging Developing Open Closed
(1) (2) (3) (4) (5) (6)
GDP/Capita (log) *
MPI 0.394 4.569 -1.611 11.29 2.193 1.699
ICRG index * MPI -0.0586 0.0888 -0.132 0.13 0.198 -0.512**
Credit/GDP * MPI 0.0116 0.0288 0.0281 0.414** 0.024 0.0548**
Exchange Rate
Regime * MPI -0.165 0.0681 0.0893 0.237 0.426** -0.363
De Jure Openness
Index * MPI -0.0267 -0.0908 -0.0118 0.140** -0.0956 -0.0392
Notes: The estimates are determined using Arellano-Bond GMM treating the instrument and the control variables
as endogeneous. The dependent variable is real credit growth. MPI, credit growth, GDP growth, crisis, and the
policy rate are included in each regression (omitted in the table). The other regressors are added separately to
the baseline regression (except the interaction terms, which always enter with the associated independent
variable), but their coefficients are represented in the same column for compactness. All variables except the
categorical ones are winsorized at the 5 percent level. Country fixed effects control for individual trends. The
regressions are performed over the period 2001-2013. Arellano-Bond robust standard errors are in brackets. ***,
**, and * indicate significance at the 1, 5, and 10 percent levels, respectively.
Variables
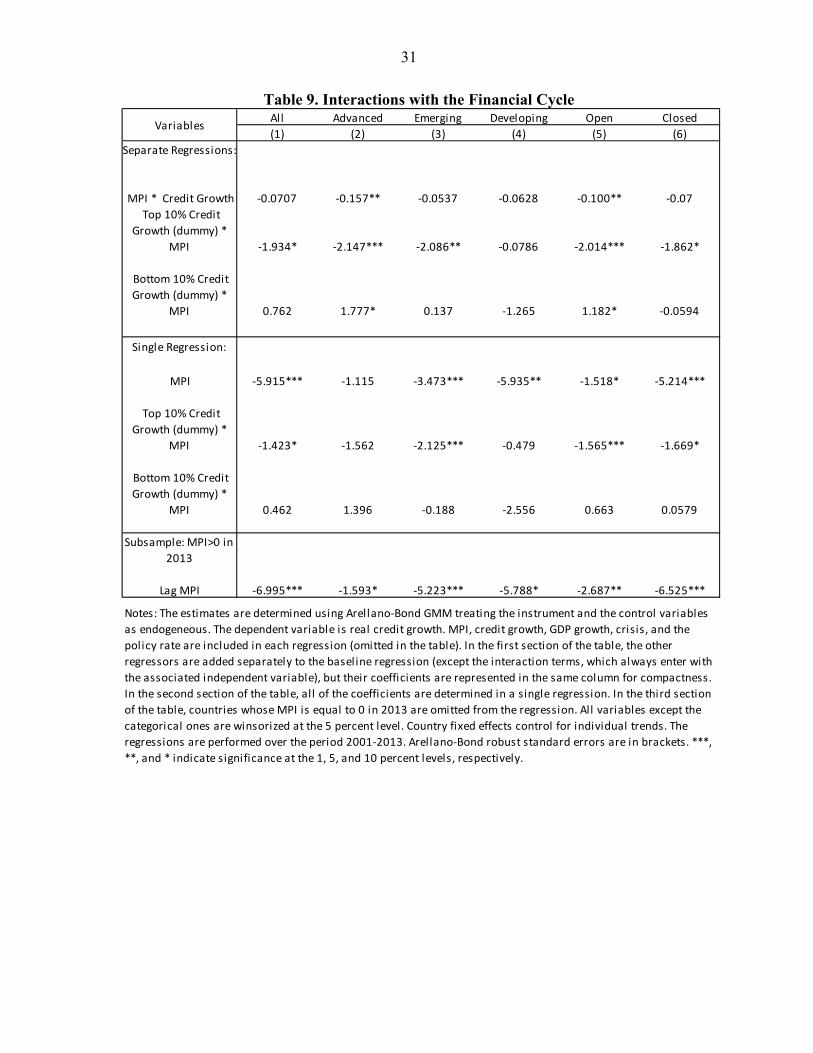
31
Table 9. Interactions with the Financial Cycle
All Advanced Emerging Developing Open Closed
(1) (2) (3) (4) (5) (6)
Separate Regressions:
MPI * Credit Growth -0.0707 -0.157** -0.0537 -0.0628 -0.100** -0.07
Top 10% Credit
Growth (dummy) *
MPI -1.934* -2.147*** -2.086** -0.0786 -2.014*** -1.862*
Bottom 10% Credit
Growth (dummy) *
MPI 0.762 1.777* 0.137 -1.265 1.182* -0.0594
Single Regression:
MPI -5.915*** -1.115 -3.473*** -5.935** -1.518* -5.214***
Top 10% Credit
Growth (dummy) *
MPI -1.423* -1.562 -2.125*** -0.479 -1.565*** -1.669*
Bottom 10% Credit
Growth (dummy) *
MPI 0.462 1.396 -0.188 -2.556 0.663 0.0579
Subsample: MPI>0 in
2013
Lag MPI -6.995*** -1.593* -5.223*** -5.788* -2.687** -6.525***
Variables
Notes: The estimates are determined using Arellano-Bond GMM treating the instrument and the control variables
as endogeneous. The dependent variable is real credit growth. MPI, credit growth, GDP growth, crisis, and the
policy rate are included in each regression (omitted in the table). In the first section of the table, the other
regressors are added separately to the baseline regression (except the interaction terms, which always enter with
the associated independent variable), but their coefficients are represented in the same column for compactness.
In the second section of the table, all of the coefficients are determined in a single regression. In the third section
of the table, countries whose MPI is equal to 0 in 2013 are omitted from the regression. All variables except the
categorical ones are winsorized at the 5 percent level. Country fixed effects control for individual trends. The
regressions are performed over the period 2001-2013. Arellano-Bond robust standard errors are in brackets. ***,
**, and * indicate significance at the 1, 5, and 10 percent levels, respectively.

32
Figure 1. The Macroprudential Policy Index by Income Level
11.
52
2.5
3
2000 2002 2004 2006 2008 2010 2012Year
All Countries Advanced CountriesEmerging Markets Developing Countries
Mean MPI: By Income Group

33
Figure 2. The Relative Use of Macroprudential Policies over Time, by Income Group

34
ANNEX 1: Macro-Prudential Dataset
The main source of the aggregated dataset put together for our analysis of the use and effectiveness of macroprudential policies is the IMF survey on Global Macroprudential Policy Instruments (GMPI), which was carried out by Luis Jacome, Yitae Kim and Claudia Jadrijevic (all IMF staff) during 2013-2014.11 The central banks/national authorities of 125 member countries and the Central Bank of West African States (BCEAO) provided responses to more than 100 detailed questions on about 17 key macroprudential policy tools. In addition to these responses, we also used several of the more than 350 attachment files that countries included in the survey to complement the responses. We also cross-checked GMPI-responses with those in other surveys (e.g., Kuttner and Shim, 2013 and Crowe et al, 2011) as well as our own web-based and other searches, all to further ensure a high quality dataset.
We focus on 12 macroprudential instruments included in the GMPI Survey and compute time series dummy indicators on the usage of each instrument for each of the 120 countries included in our sample during the period 2000-2013. The instruments covered and the main questions used from the GMPI Survey are detailed below (following the survey’s original numbering of sections and questions): 12 1. General Countercyclical Capital Buffer/Requirement
1.1.9 Please specify the date when this instrument was introduced. 1.1.9.1 Please specify whether any changes have been made to the countercyclical capital buffer/requirement since 2000. Yes or no
1.1.9.1.1 Please describe the changes (level and design of the instrument) made to the countercyclical capital requirement, together with the dates of such changes, since 2000.
2. Leverage Ratio
2.1.10 Please specify when this instrument was introduced. 2.1.10.1 Please specify whether any changes have been made to the leverage ratio since 2000. Yes or no 2.1.10.1.1 Please describe the changes (level and design of the instrument) made to the leverage ratio, together with the dates of such changes, since 2000.
3. Time-Varying/Dynamic Loan-Loss Provisioning
3.1.9 Please specify the date when this instrument was introduced. 3.1.9.1 Please specify whether any changes have been made to the time-varying provisioning scheme since 2000. Yes or No 3.1.9.1.1 Please describe the changes (level and design of the instrument) made to the provisioning, together with the dates of such changes, since 2000.
11 The full details of the survey are currently not open to the public, but country officials that have participated in the survey have access to the entire database. 12 The IMF GMPI survey covers 18 sections/instruments, due to lack of enough data and cross-sectional coverage, we have not included in the analysis Sector Specific Capital Buffer/Requirement (section 4 of the survey), Liquidity Requirements/Buffers (section 14), Loan-to-Deposit ratio (section 15), Margins/Haircuts on Collateralized Financial Market Transactions (section 16), Limits on Open FX Positions or Currency Mismatches (section 17), and Other policies (section 18, the rest category).

35
5. Loan-to-Value (LTV) Ratio 5.1.8 Please specify the date when this instrument was introduced. 5.1.8.1 Please specify whether changes have been made to the ratios or other elements of this instrument since 2000. Yes or no 5.1.8.1.1 Please describe the changes (level and design of the instrument) made in the LTV ratio, together with the dates of such changes, since 2000.
6. Debt-to-Income (DTI) Ratio
6.1.7 Please specify the date when this instrument was introduced. 6.1.7.1 Please specify whether any changes have been made to this instrument since 2000. Yes or No 6.1.7.1.1 Please describe the changes (level and design of the instrument) the DTI ratio, together with the dates of such changes since 2000.
7. Limits on Domestic Currency Loans
7.1.8 Please specify the date when this instrument was introduced. 7.1.8.1 Please specify whether any changes have been made to the limit on domestic currency loans since 2000. Yes or no 7.1.8.1.1 Please describe the changes (level and design of the instrument) made to the limits together with the dates of such change since 2000.
8. Limits on Foreign Currency Loans
8.1.9 Please specify when this instrument was introduced. 8.1.9.1 Please specify whether any changes have been made to the limits since 2000. Yes or No 8.1.9.1.1 Please describe the changes (level and design of the instrument) made to the limits, together with the dates of such changes, since 2000.
9. Reserve Requirement Ratios
9.1.9 Please specify the date when this instrument was introduced. 9.1.9.1 Please specify if any changes have been made to the reserve requirements since 2000. Yes or no 9.1.9.1.1 Please describe the changes (level and design of the instrument) made to the reserve requirements, together with the dates of such changes, since 2000.
10. Levy/Tax on Financial Institutions
10.1.8 Please specify when this instrument was introduced. 10.1.8.1 Please specify whether any changes have been made to the levy/tax ratios or other elements of this instrument since 2000. Yes or No 10.1.8.1.1 Please describe the changes (level and design of the instrument) the levy/tax on banks, together with the dates of such changes since 2000.
11. Capital Surcharges on SIFIs
11.1.7.2 Please specify when this instrument was introduced. 11.1.8 Please specify whether any changes have been made to the surcharges on SIFIs since 2000. Yes or no 11.1.8.1.1 Please describe the changes (level and design of the instrument) made to the capital surcharges on SIFIs, together with the dates of such changes, since 2000.
12. Limits on Interbank Exposures 12.1.4 Please specify when this instrument was introduced.

36
12.1.5 Please specify whether any changes have been made to this instrument since 2000. Yes or No 12.1.5.1 Please describe the changes (level and design of the instrument) the limits on interbank exposures, together with the dates of such changes since 2000.
13. Concentration Limits
13.1.5 Please specify when this instrument was introduced. 13.1.6 Please specify whether any changes have been made to this instrument since 2000. Yes or No 13.1.6.1 Please describe the changes (level and design of the instrument) concentration limits, together with the dates of such changes since 2000.
Instruments are each coded for the period they were actually in place, i.e., from the date that they were introduced until the day that they were discontinued (if this occurred during our sample period). Given our objective of analyzing as broad a set of countries and instruments as possible in this paper, we do not attempt to capture the intensity of the measures and any changes in intensity over time. Moreover, attaching a number to the degree of intensity of a particular measure unavoidably involves a certain degree subjectivity that we want to avoid at this point. The survey data also does not allow for constructing objective measures across various countries and over time denoting when instruments are binding. While the level/thresholds of each instrument may change over time, these may not capture the degree to which the instruments are actually binding, again especially hard to measure consistently across a large set of countries. Similarly, it is difficult to code the variations in the use of instruments objectively as tightening and loosening. We therefore construct simple binary measures of whether or not the instruments were part of the policy choices. The tables included in this annex show the overall aggregated index (Macroprudential Index-MPI), the two main sub-aggregates (Borrower-Targeted Instruments and Financial Institution-Targeted Instruments), as well as variables capturing the Central Banks’ Oversight of Macroprudential Policies. These tables as well as the individual ones for each of the 12 instruments covered are available in Excel, together with the paper, on the IMF website at http://www.imf.org/external/pubind.htm

37
Country 2000 2001 2002 2003 2004 2005 2006 2007 2008 2009 2010 2011 2012 2013MPI_CB_
fractionAlbania 0 0 0 0 0 0 0 0 0 0 0 1 1 1 1Algeria 1 1 1 1 1 1 1 2 3 3 3 3 3 3 1
Angola 0 0 0 0 0 0 0 1 1 1 1 3 3 3 1Argentina 3 4 4 5 5 5 5 5 5 5 5 5 5 5 1
Armenia 3 3 3 3 3 3 3 3 3 3 3 3 3 3 1Austra l ia 1 1 1 1 1 1 1 1 1 1 1 1 1 1 0
Austria 0 0 0 0 0 0 0 0 0 0 1 2 2 2 0Azerba i jan 0 1 1 1 1 2 2 2 2 2 3 3 3 3 1
Bahamas 1 1 1 1 2 3 3 3 3 3 3 3 3 3 1Bahra in 3 3 3 3 3 3 3 3 3 3 3 3 3 3 1
Bangladesh 2 2 2 2 4 4 4 4 4 4 4 4 4 4 0.8Belarus 1 1 1 1 1 1 1 1 1 1 1 1 1 1 1
Belgium 2 2 2 2 2 2 2 2 2 2 2 2 2 2 0.5Bel i ze 1 1 1 1 1 1 1 1 1 1 1 1 1 1 1
Bhutan 1 1 1 1 1 1 1 1 1 1 1 1 1 1 1Bosnia and Herzegovina 1 1 1 1 1 1 1 1 1 1 1 1 1 1 0
Botswana 1 1 1 1 1 1 1 1 1 1 1 1 1 1 1Brazi l 2 2 2 2 2 2 2 2 2 2 2 2 2 2 1
Brunei 0 0 0 0 0 1 1 1 1 1 1 1 3 3 1Bulgaria 1 1 1 1 1 3 4 5 4 4 4 4 4 4 0.5
Burundi 3 3 3 3 3 3 3 3 3 3 3 3 3 3 1Cambodia 2 2 2 2 2 2 2 2 2 2 2 2 2 2 1
Canada 3 3 3 3 3 3 3 3 5 5 5 5 5 5 0.4Cape Verde 0 0 0 0 0 0 0 0 0 0 0 0 0 0 -
Chi le 6 6 6 6 6 6 6 6 6 6 6 6 6 6 0.3China 1 1 1 2 4 4 4 4 5 5 5 7 7 8 0.3
Colombia 6 6 6 6 6 6 6 7 7 7 7 7 7 7 0.1Costa Rica 2 2 2 2 2 3 3 3 3 3 3 3 3 3 0Croatia 1 1 1 1 1 1 1 1 1 1 2 2 2 2 1
Curacao 2 2 2 2 2 2 2 2 2 2 2 2 2 2 1Cyprus 0 0 0 1 1 1 1 1 1 1 1 1 1 1 1
Czech Republ ic 1 1 1 1 1 1 1 1 1 1 1 1 1 1 1Dem. Rep. Congo 0 0 0 2 2 2 2 2 2 2 2 2 2 2 1
Dominican Republ ic 0 0 1 1 1 1 1 1 1 2 2 2 2 2 1Ecuador 2 4 5 5 5 5 5 5 5 5 5 5 6 6 0
El Sa lvador 1 1 1 1 1 1 1 1 1 1 1 1 1 1 1Estonia 0 0 0 0 0 0 0 0 0 0 0 0 0 0 -
Ethiopia 0 0 0 0 0 0 0 0 0 0 0 0 0 0 -Fi ji 1 1 1 1 1 1 1 1 1 1 1 1 1 1 1
Finland 0 0 0 0 0 0 0 0 0 0 0 0 0 1 0France 2 2 2 2 2 2 2 2 2 2 2 3 3 3 0
Georgia 1 1 2 3 3 3 3 3 3 3 3 3 3 3 1Germany 0 0 0 0 0 0 0 0 0 0 2 2 2 2 0.5
Ghana 2 2 2 2 3 3 3 3 3 3 3 3 3 3 0.7Guyana 0 0 0 0 0 0 0 0 0 0 0 0 0 0 -
Ha iti 1 2 2 2 2 2 2 2 3 3 3 3 3 3 1Honduras 0 0 0 0 0 1 1 1 1 1 1 1 2 2 0.5
Hong Kong 3 3 3 3 3 3 3 3 3 3 3 3 3 3 1Hungary 0 0 0 0 0 0 0 0 0 0 3 4 4 4 0.5
Iceland 1 2 2 2 2 2 2 2 2 2 2 2 2 2 0India 1 1 1 1 1 1 1 2 2 2 2 2 2 2 0
Indones ia 0 0 0 0 0 1 1 1 1 1 1 1 2 2 0.5Ireland 0 0 0 0 0 0 0 0 0 0 0 0 0 0 -
Is rael 1 1 1 1 1 1 1 1 1 1 2 3 4 5 1Ita ly 2 2 2 2 2 2 2 2 2 2 2 2 2 2 1
Jamaica 0 0 1 1 2 2 2 2 2 2 2 2 2 2 0.5Japan 1 1 1 1 1 1 1 1 1 1 1 1 1 1 0
Jordan 1 2 2 3 3 3 3 3 3 3 3 3 3 3 1
Table A1: Macroprudential Index - MPI

38
Country 2000 2001 2002 2003 2004 2005 2006 2007 2008 2009 2010 2011 2012 2013MPI_CB_
fraction
Kazakhstan 1 1 1 1 1 1 1 1 1 1 1 1 1 2 1
Kenya 0 0 0 0 0 0 0 0 0 0 0 0 0 0 -
Kosovo 0 0 0 0 0 0 0 0 0 0 0 0 2 2 1
Kuwai t 2 2 2 2 3 3 3 3 3 3 3 3 3 3 1
Kyrgyz Republ ic 0 1 1 2 3 3 3 3 3 3 3 3 3 3 1Lao PDR 2 2 2 2 2 2 2 2 2 2 2 2 2 2 1
Latvia 0 0 0 0 0 0 0 1 1 1 1 2 2 2 0
Lebanon 2 2 2 2 2 2 2 2 3 3 3 3 4 4 1
Les otho 1 1 1 1 1 1 1 1 1 1 1 1 2 2 1
Lithuania 0 0 0 0 0 0 0 0 0 0 0 2 2 2 1
Macedonia 1 1 1 1 1 1 1 1 1 1 1 1 1 1 1
Malawi 0 0 0 0 0 0 0 0 0 0 0 0 0 0 -
Malays ia 2 2 2 2 2 2 2 2 2 2 2 2 2 2 1
Malta 0 0 0 0 0 0 0 0 0 0 0 0 0 0 -
Mauri tius 1 1 1 1 1 1 1 1 1 1 1 1 1 1 1
Mexico 0 2 2 2 2 2 2 2 2 2 2 2 2 2 0
Moldova 2 2 2 2 2 2 2 2 3 3 3 3 3 3 1
Mongol ia 3 3 3 3 3 3 3 3 3 3 3 3 4 7 0.9
Montenegro 0 0 0 0 0 0 0 0 0 0 0 1 1 1 1
Morocco 3 3 3 3 3 3 3 3 3 3 3 3 3 3 1
Mozambique 2 3 3 3 3 3 3 3 3 3 3 3 3 3 1
Nepal 2 2 2 2 2 2 2 2 2 3 3 3 4 4 1
Netherlands 0 0 0 0 0 0 0 0 0 0 0 0 1 3 0
New Zea land 0 0 0 0 0 0 0 0 0 0 0 0 0 1 1
Norway 1 1 1 1 1 1 1 1 1 1 3 3 3 4 0
Pakis tan 4 4 5 5 5 6 6 6 8 8 8 8 8 8 0.9
Paraguay 5 5 5 5 5 5 5 5 5 5 5 5 5 5 1
Peru 3 3 3 3 3 3 3 3 4 4 4 4 5 5 0.3
Phi l ippines 1 1 2 2 2 2 2 2 2 2 2 2 2 2 0.5
Poland 1 1 1 1 1 1 1 1 1 1 2 2 2 2 0
Portuga l 0 0 0 0 0 0 0 0 0 1 1 1 2 2 0.5
Romania 0 0 0 2 4 4 4 4 4 4 4 5 5 5 1
Russ ian Federation 1 1 1 1 1 1 1 1 1 1 1 1 1 1 1
Saudi Arabia 1 1 1 1 1 1 2 2 2 2 2 2 2 2 1
Serbia 0 0 0 0 1 2 3 3 4 4 4 5 5 4 1
Singapore 1 1 2 2 2 2 2 2 2 2 2 2 2 5 0.8
Slovakia 1 1 1 1 1 1 1 1 1 1 1 2 2 2 0
Slovenia 0 0 0 0 0 0 0 0 0 0 0 0 0 0 -
Solomon Is lands 1 1 1 1 1 1 1 1 1 4 4 4 4 4 1
South Africa 0 0 0 0 0 0 0 0 0 0 0 0 0 1 0
South Korea 0 0 1 1 1 2 2 3 3 3 3 4 4 4 0.5
Spain 3 3 3 3 3 3 3 3 3 3 3 3 3 3 0.3
Sri Lanka 1 1 1 1 1 1 1 1 1 1 1 1 1 1 1
St. Ki tts and Nevis 1 1 1 1 1 2 2 2 2 2 2 2 2 2 1
Sudan 1 1 1 1 2 2 2 2 2 2 2 2 2 2 1
Sweden 0 0 0 0 0 0 0 0 0 0 1 1 1 1 0
Switzerland 0 0 0 0 0 0 0 2 3 3 3 3 3 5 0.4Ta jiki s tan 2 2 2 2 2 2 2 2 2 2 2 2 4 4 1
Thai land 0 0 0 1 1 1 1 1 1 1 1 2 2 2 1
The Gambia 1 1 1 1 1 1 1 1 2 2 2 2 2 2 1
Timor-Leste 1 1 1 1 1 1 1 1 1 1 1 1 1 1 1
Tonga 0 0 0 0 0 0 0 0 0 0 0 0 0 0 -
Trinidad and Tobago 2 2 2 2 2 2 2 2 4 4 4 4 4 4 0.8
Tunis ia 0 0 0 0 0 0 0 0 0 0 0 0 0 0 -
Turkey 1 1 1 1 1 1 1 2 2 3 4 5 5 5 0.2
Uganda 0 0 0 0 1 1 1 1 1 1 2 2 2 2 1
Ukraine 1 3 3 3 4 4 4 4 4 5 5 6 6 6 0.8
Uni ted Arab Emirates 2 2 2 2 2 2 2 2 2 2 2 3 3 3 1
United Kingdom 0 0 0 0 0 0 0 0 0 0 0 0 0 0 -
Uni ted States 2 3 3 3 3 3 3 3 3 3 3 3 3 3 0.3
Zambia 1 1 1 1 1 1 1 1 1 1 1 1 1 1 1
Source: Authors ' es timations based on IMF GMPI Survey and other sources .
Table A1: Macroprudential Index - MPI (cont.)
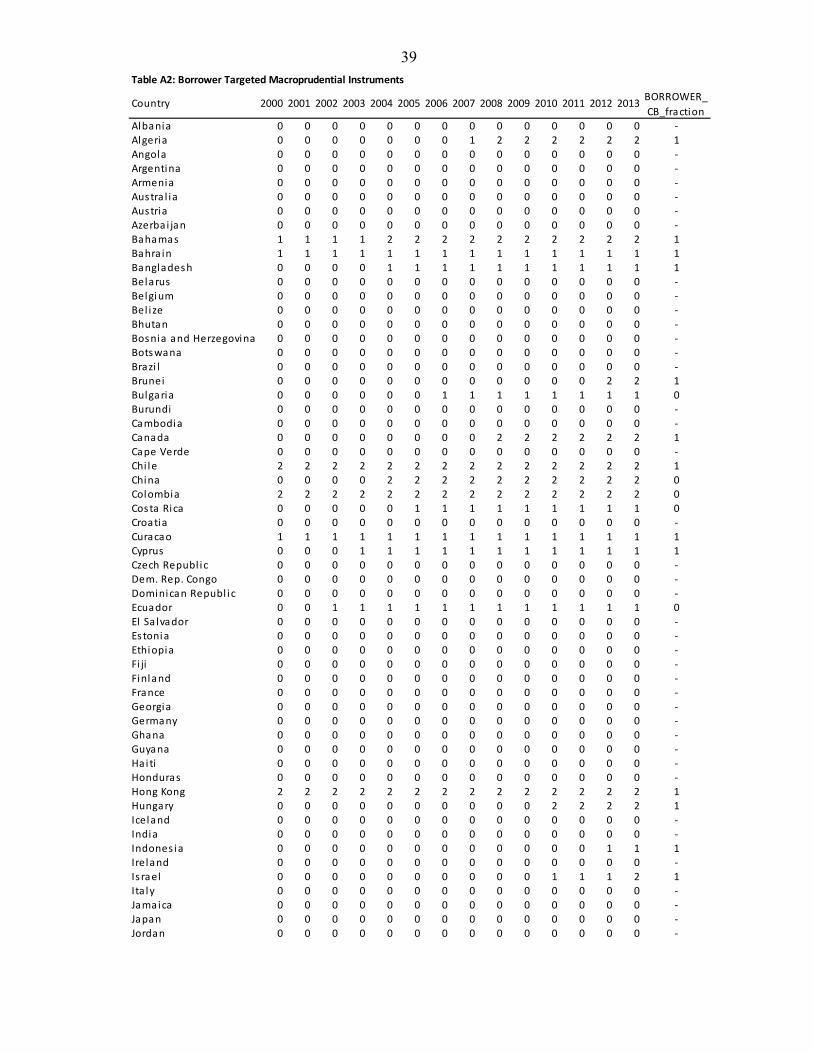
39
Country 2000 2001 2002 2003 2004 2005 2006 2007 2008 2009 2010 2011 2012 2013BORROWER_
CB_fraction
Albania 0 0 0 0 0 0 0 0 0 0 0 0 0 0 -Algeria 0 0 0 0 0 0 0 1 2 2 2 2 2 2 1
Angola 0 0 0 0 0 0 0 0 0 0 0 0 0 0 -Argentina 0 0 0 0 0 0 0 0 0 0 0 0 0 0 -
Armenia 0 0 0 0 0 0 0 0 0 0 0 0 0 0 -Austra l ia 0 0 0 0 0 0 0 0 0 0 0 0 0 0 -
Austria 0 0 0 0 0 0 0 0 0 0 0 0 0 0 -Azerbai jan 0 0 0 0 0 0 0 0 0 0 0 0 0 0 -
Bahamas 1 1 1 1 2 2 2 2 2 2 2 2 2 2 1Bahra in 1 1 1 1 1 1 1 1 1 1 1 1 1 1 1
Bangladesh 0 0 0 0 1 1 1 1 1 1 1 1 1 1 1Belarus 0 0 0 0 0 0 0 0 0 0 0 0 0 0 -
Belgium 0 0 0 0 0 0 0 0 0 0 0 0 0 0 -Bel ize 0 0 0 0 0 0 0 0 0 0 0 0 0 0 -
Bhutan 0 0 0 0 0 0 0 0 0 0 0 0 0 0 -Bosnia and Herzegovina 0 0 0 0 0 0 0 0 0 0 0 0 0 0 -Botswana 0 0 0 0 0 0 0 0 0 0 0 0 0 0 -
Brazi l 0 0 0 0 0 0 0 0 0 0 0 0 0 0 -Brunei 0 0 0 0 0 0 0 0 0 0 0 0 2 2 1
Bulgaria 0 0 0 0 0 0 1 1 1 1 1 1 1 1 0Burundi 0 0 0 0 0 0 0 0 0 0 0 0 0 0 -
Cambodia 0 0 0 0 0 0 0 0 0 0 0 0 0 0 -Canada 0 0 0 0 0 0 0 0 2 2 2 2 2 2 1
Cape Verde 0 0 0 0 0 0 0 0 0 0 0 0 0 0 -Chi le 2 2 2 2 2 2 2 2 2 2 2 2 2 2 1
China 0 0 0 0 2 2 2 2 2 2 2 2 2 2 0Colombia 2 2 2 2 2 2 2 2 2 2 2 2 2 2 0
Costa Rica 0 0 0 0 0 1 1 1 1 1 1 1 1 1 0Croatia 0 0 0 0 0 0 0 0 0 0 0 0 0 0 -
Curacao 1 1 1 1 1 1 1 1 1 1 1 1 1 1 1Cyprus 0 0 0 1 1 1 1 1 1 1 1 1 1 1 1
Czech Republ ic 0 0 0 0 0 0 0 0 0 0 0 0 0 0 -Dem. Rep. Congo 0 0 0 0 0 0 0 0 0 0 0 0 0 0 -
Dominican Republ ic 0 0 0 0 0 0 0 0 0 0 0 0 0 0 -Ecuador 0 0 1 1 1 1 1 1 1 1 1 1 1 1 0
El Sa lvador 0 0 0 0 0 0 0 0 0 0 0 0 0 0 -Estonia 0 0 0 0 0 0 0 0 0 0 0 0 0 0 -
Ethiopia 0 0 0 0 0 0 0 0 0 0 0 0 0 0 -Fi ji 0 0 0 0 0 0 0 0 0 0 0 0 0 0 -
Finland 0 0 0 0 0 0 0 0 0 0 0 0 0 0 -France 0 0 0 0 0 0 0 0 0 0 0 0 0 0 -
Georgia 0 0 0 0 0 0 0 0 0 0 0 0 0 0 -Germany 0 0 0 0 0 0 0 0 0 0 0 0 0 0 -
Ghana 0 0 0 0 0 0 0 0 0 0 0 0 0 0 -Guyana 0 0 0 0 0 0 0 0 0 0 0 0 0 0 -
Hai ti 0 0 0 0 0 0 0 0 0 0 0 0 0 0 -Honduras 0 0 0 0 0 0 0 0 0 0 0 0 0 0 -
Hong Kong 2 2 2 2 2 2 2 2 2 2 2 2 2 2 1Hungary 0 0 0 0 0 0 0 0 0 0 2 2 2 2 1
Iceland 0 0 0 0 0 0 0 0 0 0 0 0 0 0 -India 0 0 0 0 0 0 0 0 0 0 0 0 0 0 -
Indones ia 0 0 0 0 0 0 0 0 0 0 0 0 1 1 1Ireland 0 0 0 0 0 0 0 0 0 0 0 0 0 0 -
Is rael 0 0 0 0 0 0 0 0 0 0 1 1 1 2 1Ita ly 0 0 0 0 0 0 0 0 0 0 0 0 0 0 -
Jamaica 0 0 0 0 0 0 0 0 0 0 0 0 0 0 -Japan 0 0 0 0 0 0 0 0 0 0 0 0 0 0 -
Jordan 0 0 0 0 0 0 0 0 0 0 0 0 0 0 -
Table A2: Borrower Targeted Macroprudential Instruments

40
Country 2000 2001 2002 2003 2004 2005 2006 2007 2008 2009 2010 2011 2012 2013BORROWER_
CB_fraction
Kazakhstan 0 0 0 0 0 0 0 0 0 0 0 0 0 0 -
Kenya 0 0 0 0 0 0 0 0 0 0 0 0 0 0 -
Kosovo 0 0 0 0 0 0 0 0 0 0 0 0 0 0 -
Kuwai t 0 0 0 0 1 1 1 1 1 1 1 1 1 1 1
Kyrgyz Republ ic 0 0 0 0 0 0 0 0 0 0 0 0 0 0 -
Lao PDR 0 0 0 0 0 0 0 0 0 0 0 0 0 0 -
Latvia 0 0 0 0 0 0 0 1 1 1 1 1 1 1 0
Lebanon 0 0 0 0 0 0 0 0 1 1 1 1 1 1 1
Les otho 0 0 0 0 0 0 0 0 0 0 0 0 0 0 -
Li thuania 0 0 0 0 0 0 0 0 0 0 0 2 2 2 1
Macedonia 0 0 0 0 0 0 0 0 0 0 0 0 0 0 -
Malawi 0 0 0 0 0 0 0 0 0 0 0 0 0 0 -
Malays ia 1 1 1 1 1 1 1 1 1 1 1 1 1 1 1
Malta 0 0 0 0 0 0 0 0 0 0 0 0 0 0 -
Mauri tius 0 0 0 0 0 0 0 0 0 0 0 0 0 0 -
Mexico 0 0 0 0 0 0 0 0 0 0 0 0 0 0 -
Moldova 0 0 0 0 0 0 0 0 0 0 0 0 0 0 -
Mongol ia 0 0 0 0 0 0 0 0 0 0 0 0 0 2 1
Montenegro 0 0 0 0 0 0 0 0 0 0 0 0 0 0 -
Morocco 0 0 0 0 0 0 0 0 0 0 0 0 0 0 -
Mozambique 0 0 0 0 0 0 0 0 0 0 0 0 0 0 -
Nepal 0 0 0 0 0 0 0 0 0 1 1 1 1 1 1
Netherlands 0 0 0 0 0 0 0 0 0 0 0 0 0 2 0
New Zea land 0 0 0 0 0 0 0 0 0 0 0 0 0 1 1
Norway 0 0 0 0 0 0 0 0 0 0 2 2 2 2 0
Pakis tan 1 1 1 1 1 2 2 2 2 2 2 2 2 2 1
Paraguay 0 0 0 0 0 0 0 0 0 0 0 0 0 0 -
Peru 0 0 0 0 0 0 0 0 0 0 0 0 0 0 -
Phi l ippines 0 0 0 0 0 0 0 0 0 0 0 0 0 0 -
Poland 0 0 0 0 0 0 0 0 0 0 1 1 1 1 0
Portuga l 0 0 0 0 0 0 0 0 0 0 0 0 0 0 -
Romania 0 0 0 0 2 2 2 2 1 1 1 2 2 2 1
Russ ian Federation 0 0 0 0 0 0 0 0 0 0 0 0 0 0 -
Saudi Arabia 0 0 0 0 0 0 1 1 1 1 1 1 1 1 1
Serbia 0 0 0 0 1 1 1 1 1 1 1 2 2 1 1
Singapore 1 1 1 1 1 1 1 1 1 1 1 1 1 2 1
Slovakia 1 1 1 1 1 1 1 1 1 1 1 1 1 1 0
Slovenia 0 0 0 0 0 0 0 0 0 0 0 0 0 0 -
Solomon Is lands 0 0 0 0 0 0 0 0 0 0 0 0 0 0 -
South Africa 0 0 0 0 0 0 0 0 0 0 0 0 0 0 -
South Korea 0 0 1 1 1 2 2 2 2 2 2 2 2 2 0Spain 1 1 1 1 1 1 1 1 1 1 1 1 1 1 0
Sri Lanka 0 0 0 0 0 0 0 0 0 0 0 0 0 0 -
St. Ki tts and Nevis 0 0 0 0 0 0 0 0 0 0 0 0 0 0 -
Sudan 0 0 0 0 0 0 0 0 0 0 0 0 0 0 -
Sweden 0 0 0 0 0 0 0 0 0 0 1 1 1 1 0
Switzerland 0 0 0 0 0 0 0 0 0 0 0 0 0 0 -
Ta jiki s tan 0 0 0 0 0 0 0 0 0 0 0 0 0 0 -
Thai land 0 0 0 1 1 1 1 1 1 1 1 1 1 1 1
The Gambia 0 0 0 0 0 0 0 0 0 0 0 0 0 0 -
Timor-Leste 0 0 0 0 0 0 0 0 0 0 0 0 0 0 -
Tonga 0 0 0 0 0 0 0 0 0 0 0 0 0 0 -
Trinidad and Tobago 0 0 0 0 0 0 0 0 0 0 0 0 0 0 -
Tunis ia 0 0 0 0 0 0 0 0 0 0 0 0 0 0 -
Turkey 0 0 0 0 0 0 0 1 1 1 1 2 2 2 0
Uganda 0 0 0 0 0 0 0 0 0 0 0 0 0 0 -
Ukraine 0 0 0 0 0 0 0 0 0 0 0 0 0 0 -
Uni ted Arab Emirates 0 0 0 0 0 0 0 0 0 0 0 1 1 1 1
United Kingdom 0 0 0 0 0 0 0 0 0 0 0 0 0 0 -
Uni ted States 0 0 0 0 0 0 0 0 0 0 0 0 0 0 -
Zambia 0 0 0 0 0 0 0 0 0 0 0 0 0 0 -
Source: Authors ' es timations based on IMF GMPI Survey and other sources .
Table A2: Borrower Targeted Macroprudential Instruments (cont.)

41
Country 2000 2001 2002 2003 2004 2005 2006 2007 2008 2009 2010 2011 2012 2013FINANCIAL_
CB_fraction
Albania 0 0 0 0 0 0 0 0 0 0 0 1 1 1 1
Algeria 1 1 1 1 1 1 1 1 1 1 1 1 1 1 1
Angola 0 0 0 0 0 0 0 1 1 1 1 3 3 3 1
Argentina 3 4 4 5 5 5 5 5 5 5 5 5 5 5 1
Armenia 3 3 3 3 3 3 3 3 3 3 3 3 3 3 1
Aus tra l ia 1 1 1 1 1 1 1 1 1 1 1 1 1 1 0
Aus tria 0 0 0 0 0 0 0 0 0 0 1 2 2 2 0
Azerbai jan 0 1 1 1 1 2 2 2 2 2 3 3 3 3 1
Bahamas 0 0 0 0 0 1 1 1 1 1 1 1 1 1 1
Bahra in 2 2 2 2 2 2 2 2 2 2 2 2 2 2 1
Banglades h 2 2 2 2 3 3 3 3 3 3 3 3 3 3 0.7
Belarus 1 1 1 1 1 1 1 1 1 1 1 1 1 1 1
Belgium 2 2 2 2 2 2 2 2 2 2 2 2 2 2 0.5
Bel i ze 1 1 1 1 1 1 1 1 1 1 1 1 1 1 1
Bhutan 1 1 1 1 1 1 1 1 1 1 1 1 1 1 1
Bos nia and Herzegovina 1 1 1 1 1 1 1 1 1 1 1 1 1 1 0
Botswana 1 1 1 1 1 1 1 1 1 1 1 1 1 1 1
Brazi l 2 2 2 2 2 2 2 2 2 2 2 2 2 2 1
Brunei 0 0 0 0 0 1 1 1 1 1 1 1 1 1 1
Bulgaria 1 1 1 1 1 3 3 4 3 3 3 3 3 3 0.7
Burundi 3 3 3 3 3 3 3 3 3 3 3 3 3 3 1
Cambodia 2 2 2 2 2 2 2 2 2 2 2 2 2 2 1
Canada 3 3 3 3 3 3 3 3 3 3 3 3 3 3 0
Cape Verde 0 0 0 0 0 0 0 0 0 0 0 0 0 0 -
Chi le 4 4 4 4 4 4 4 4 4 4 4 4 4 4 0
China 1 1 1 2 2 2 2 2 3 3 3 5 5 6 0.3
Colombia 4 4 4 4 4 4 4 5 5 5 5 5 5 5 0.2
Cos ta Rica 2 2 2 2 2 2 2 2 2 2 2 2 2 2 0
Croatia 1 1 1 1 1 1 1 1 1 1 2 2 2 2 1
Curacao 1 1 1 1 1 1 1 1 1 1 1 1 1 1 1
Cyprus 0 0 0 0 0 0 0 0 0 0 0 0 0 0 -
Czech Republ ic 1 1 1 1 1 1 1 1 1 1 1 1 1 1 1
Dem. Rep. Congo 0 0 0 2 2 2 2 2 2 2 2 2 2 2 1Dominican Republ ic 0 0 1 1 1 1 1 1 1 2 2 2 2 2 1
Ecuador 2 4 4 4 4 4 4 4 4 4 4 4 5 5 0
El Sa lvador 1 1 1 1 1 1 1 1 1 1 1 1 1 1 1
Estonia 0 0 0 0 0 0 0 0 0 0 0 0 0 0 -
Ethiopia 0 0 0 0 0 0 0 0 0 0 0 0 0 0 -
Fi ji 1 1 1 1 1 1 1 1 1 1 1 1 1 1 1
Finland 0 0 0 0 0 0 0 0 0 0 0 0 0 1 0
France 2 2 2 2 2 2 2 2 2 2 2 3 3 3 0
Georgia 1 1 2 3 3 3 3 3 3 3 3 3 3 3 1
Germany 0 0 0 0 0 0 0 0 0 0 2 2 2 2 0.5
Ghana 2 2 2 2 3 3 3 3 3 3 3 3 3 3 0.7
Guyana 0 0 0 0 0 0 0 0 0 0 0 0 0 0 -
Hai ti 1 2 2 2 2 2 2 2 3 3 3 3 3 3 1
Honduras 0 0 0 0 0 1 1 1 1 1 1 1 2 2 0.5
Hong Kong 1 1 1 1 1 1 1 1 1 1 1 1 1 1 1
Hungary 0 0 0 0 0 0 0 0 0 0 1 2 2 2 0
Iceland 1 2 2 2 2 2 2 2 2 2 2 2 2 2 0
India 1 1 1 1 1 1 1 2 2 2 2 2 2 2 0
Indones ia 0 0 0 0 0 1 1 1 1 1 1 1 1 1 0
Ireland 0 0 0 0 0 0 0 0 0 0 0 0 0 0 -
Is rael 1 1 1 1 1 1 1 1 1 1 1 2 3 3 1
Ita ly 2 2 2 2 2 2 2 2 2 2 2 2 2 2 1
Jamaica 0 0 1 1 2 2 2 2 2 2 2 2 2 2 0.5
Japan 1 1 1 1 1 1 1 1 1 1 1 1 1 1 0
Jordan 1 2 2 3 3 3 3 3 3 3 3 3 3 3 1
Table A3: Financial Institution-Targeted Macroprudential Instruments

42
Country 2000 2001 2002 2003 2004 2005 2006 2007 2008 2009 2010 2011 2012 2013FINANCIAL_
CB_fraction
Kazakhstan 1 1 1 1 1 1 1 1 1 1 1 1 1 2 1
Kenya 0 0 0 0 0 0 0 0 0 0 0 0 0 0 -
Kosovo 0 0 0 0 0 0 0 0 0 0 0 0 2 2 1
Kuwai t 2 2 2 2 2 2 2 2 2 2 2 2 2 2 1
Kyrgyz Republ ic 0 1 1 2 3 3 3 3 3 3 3 3 3 3 1
Lao PDR 2 2 2 2 2 2 2 2 2 2 2 2 2 2 1
Latvia 0 0 0 0 0 0 0 0 0 0 0 1 1 1 0
Lebanon 2 2 2 2 2 2 2 2 2 2 2 2 3 3 1
Les otho 1 1 1 1 1 1 1 1 1 1 1 1 2 2 1
Lithuania 0 0 0 0 0 0 0 0 0 0 0 0 0 0 -
Macedonia 1 1 1 1 1 1 1 1 1 1 1 1 1 1 1
Malawi 0 0 0 0 0 0 0 0 0 0 0 0 0 0 -
Malays ia 1 1 1 1 1 1 1 1 1 1 1 1 1 1 1
Malta 0 0 0 0 0 0 0 0 0 0 0 0 0 0 -Mauri tius 1 1 1 1 1 1 1 1 1 1 1 1 1 1 1
Mexico 0 2 2 2 2 2 2 2 2 2 2 2 2 2 0
Moldova 2 2 2 2 2 2 2 2 3 3 3 3 3 3 1
Mongol ia 3 3 3 3 3 3 3 3 3 3 3 3 4 5 0.8
Montenegro 0 0 0 0 0 0 0 0 0 0 0 1 1 1 1
Morocco 3 3 3 3 3 3 3 3 3 3 3 3 3 3 1
Mozambique 2 3 3 3 3 3 3 3 3 3 3 3 3 3 1
Nepal 2 2 2 2 2 2 2 2 2 2 2 2 3 3 1
Netherlands 0 0 0 0 0 0 0 0 0 0 0 0 1 1 0
New Zea land 0 0 0 0 0 0 0 0 0 0 0 0 0 0 -
Norway 1 1 1 1 1 1 1 1 1 1 1 1 1 2 0
Pakis tan 3 3 4 4 4 4 4 4 6 6 6 6 6 6 0.8
Paraguay 5 5 5 5 5 5 5 5 5 5 5 5 5 5 1
Peru 3 3 3 3 3 3 3 3 4 4 4 4 5 5 0.3
Phi l ippines 1 1 2 2 2 2 2 2 2 2 2 2 2 2 0.5
Poland 1 1 1 1 1 1 1 1 1 1 1 1 1 1 0
Portuga l 0 0 0 0 0 0 0 0 0 1 1 1 2 2 0.5
Romania 0 0 0 2 2 2 2 2 3 3 3 3 3 3 1
Russ ian Federation 1 1 1 1 1 1 1 1 1 1 1 1 1 1 1
Saudi Arabia 1 1 1 1 1 1 1 1 1 1 1 1 1 1 1
Serbia 0 0 0 0 0 1 2 2 3 3 3 3 3 3 1
Singapore 0 0 1 1 1 1 1 1 1 1 1 1 1 3 0.7
Slovakia 0 0 0 0 0 0 0 0 0 0 0 1 1 1 0
Slovenia 0 0 0 0 0 0 0 0 0 0 0 0 0 0 -
Solomon Is lands 1 1 1 1 1 1 1 1 1 4 4 4 4 4 1
South Africa 0 0 0 0 0 0 0 0 0 0 0 0 0 1 0
South Korea 0 0 0 0 0 0 0 1 1 1 1 2 2 2 1
Spain 2 2 2 2 2 2 2 2 2 2 2 2 2 2 0.5
Sri Lanka 1 1 1 1 1 1 1 1 1 1 1 1 1 1 1
St. Ki tts and Nevis 1 1 1 1 1 2 2 2 2 2 2 2 2 2 1
Sudan 1 1 1 1 2 2 2 2 2 2 2 2 2 2 1
Sweden 0 0 0 0 0 0 0 0 0 0 0 0 0 0 -Switzerland 0 0 0 0 0 0 0 2 3 3 3 3 3 5 0.4
Ta jiki s tan 2 2 2 2 2 2 2 2 2 2 2 2 4 4 1
Thai land 0 0 0 0 0 0 0 0 0 0 0 1 1 1 1
The Gambia 1 1 1 1 1 1 1 1 2 2 2 2 2 2 1
Timor-Leste 1 1 1 1 1 1 1 1 1 1 1 1 1 1 1
Tonga 0 0 0 0 0 0 0 0 0 0 0 0 0 0 -
Trinidad and Tobago 2 2 2 2 2 2 2 2 4 4 4 4 4 4 0.8
Tunis ia 0 0 0 0 0 0 0 0 0 0 0 0 0 0 -
Turkey 1 1 1 1 1 1 1 1 1 2 3 3 3 3 0.3
Uganda 0 0 0 0 1 1 1 1 1 1 2 2 2 2 1
Ukraine 1 3 3 3 4 4 4 4 4 5 5 6 6 6 0.8
Uni ted Arab Emirates 2 2 2 2 2 2 2 2 2 2 2 2 2 2 1
United Kingdom 0 0 0 0 0 0 0 0 0 0 0 0 0 0 -
Uni ted States 2 3 3 3 3 3 3 3 3 3 3 3 3 3 0.3
Zambia 1 1 1 1 1 1 1 1 1 1 1 1 1 1 1
Source: Authors ' es timations based on IMF GMPI Survey and other sources .
Table A3: Financial Institution-Targeted Macroprudential Instruments (cont.)